01.02 impervious soil coverage (sealing of soil surface ... · the results of the experts’ group...
TRANSCRIPT
Senate Department for Urban Development and the Environment
1
01.02 Impervious Soil Coverage (Sealing of Soil Surface) (Edition 2012) Overview Data on impervious soil coverage are regularly used in the offices of the Berlin administration responsible for environmental protection and for urban and landscape planning. One main area of application is the use and processing in various models, such as urban climate and water balance, or in various evaluation methods, such as soil protection. But the documentation of the condition of the impairment of nature and the landscape due to impervious soil coverage is also of great significance. Finally, policy-makers increasingly require data on impervious coverage in high time-resolution, in order to monitor and measure the success of environmental or urban-planning strategies.
Definition The impervious coverage of natural soils has a number of negative effects on the ecosystem and on the human habitat. Impervious coverage means the paving of the soil with non-porous materials. The categories of impervious areas are: built-up impervious areas, i.e., buildings of all kinds; and non-built-up impervious areas, i.e., roads, parking lots, paved walkways, etc.
In addition to building complexes and surfaces completely imperviously paved with asphalt or concrete, more porous paving types are also considered impervious, although these often have very different ecological qualities. Such coverings as honeycomb brick or paving stones with wide seams still permit reduced plant growth, are partially permeable to water, and provide for a considerably more favourable microclimate.
The existing types of pavement were grouped into four pavement classes, with different effects on the ecosystem (cf. Table 1).
Tab. 1: Overview of Pavement Classes
Pavement Class
Estimated effects on ecosystem Types of pavement
1 extreme Asphalt, concrete, paving stones with joint sealer or concrete substructure, synthetic surface materials
2 high Artificial stone and plates (edge length > 8 cm), concrete-stone composites, clinker, medium and large-sized paving stones
3 medium Small-stone and mosaic paving (edge length < 8 cm)
4 low Grass trellis stones, water-bound pavement (i.e. ash, gravel or tamped ground), gravel lawn
Tab. 1: Overview of impervious pavement classes
The Effects of Impervious Coverage on the Natural Balance The effects of impervious coverage are felt primarily in cities and metropolitan areas, where a high proportion of the total area is impervious.
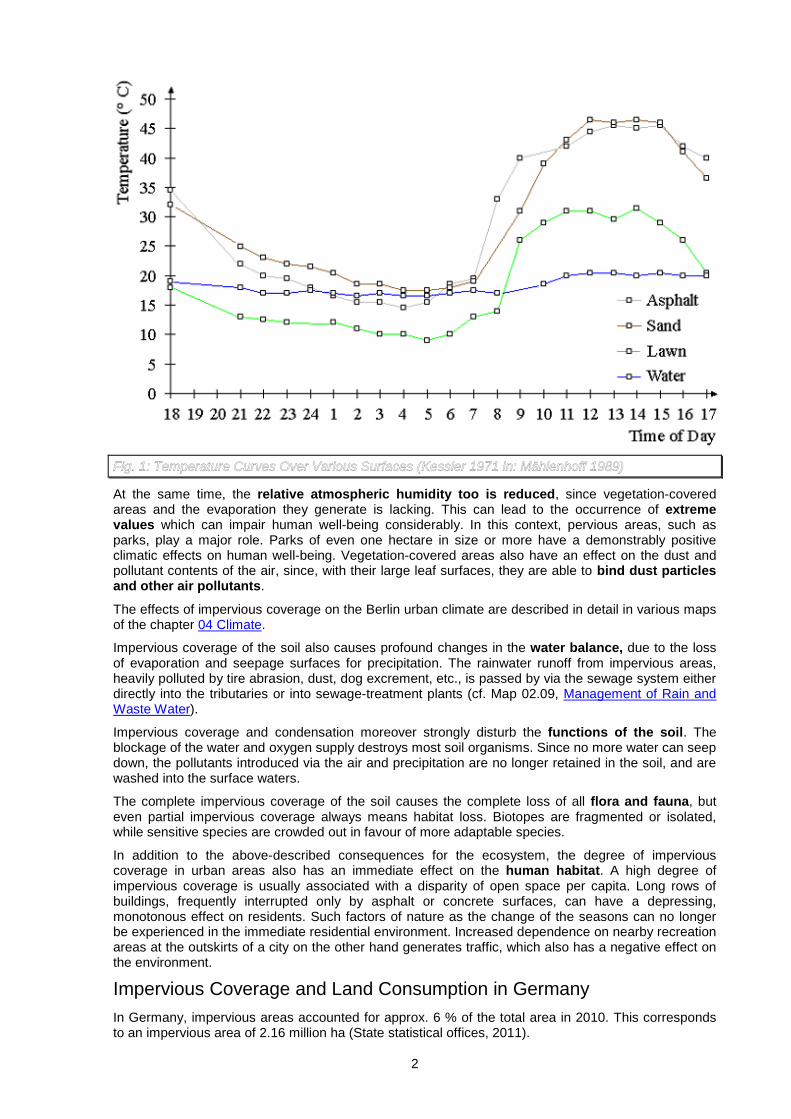
Among the various effects on the ecosystem is first of all the fact the impervious coverage contributes to the development of a specific urban climate. The air is heated by the high heat-storage capacity of buildings and asphalt streets. Especially in summertime, night-time cooling is reduced (cf. Fig. 1).
2
Fig. 1: Temperature Curves Over Various Surfaces (Kessler 1971 in: Mählenhoff 1989)
At the same time, the relative atmospheric humidity too is reduced, since vegetation-covered areas and the evaporation they generate is lacking. This can lead to the occurrence of extreme values which can impair human well-being considerably. In this context, pervious areas, such as parks, play a major role. Parks of even one hectare in size or more have a demonstrably positive climatic effects on human well-being. Vegetation-covered areas also have an effect on the dust and pollutant contents of the air, since, with their large leaf surfaces, they are able to bind dust particles and other air pollutants.
The effects of impervious coverage on the Berlin urban climate are described in detail in various maps of the chapter 04 Climate.
Impervious coverage of the soil also causes profound changes in the water balance, due to the loss of evaporation and seepage surfaces for precipitation. The rainwater runoff from impervious areas, heavily polluted by tire abrasion, dust, dog excrement, etc., is passed by via the sewage system either directly into the tributaries or into sewage-treatment plants (cf. Map 02.09, Management of Rain and Waste Water).
Impervious coverage and condensation moreover strongly disturb the functions of the soil. The blockage of the water and oxygen supply destroys most soil organisms. Since no more water can seep down, the pollutants introduced via the air and precipitation are no longer retained in the soil, and are washed into the surface waters.
The complete impervious coverage of the soil causes the complete loss of all flora and fauna, but even partial impervious coverage always means habitat loss. Biotopes are fragmented or isolated, while sensitive species are crowded out in favour of more adaptable species.
In addition to the above-described consequences for the ecosystem, the degree of impervious coverage in urban areas also has an immediate effect on the human habitat. A high degree of impervious coverage is usually associated with a disparity of open space per capita. Long rows of buildings, frequently interrupted only by asphalt or concrete surfaces, can have a depressing, monotonous effect on residents. Such factors of nature as the change of the seasons can no longer be experienced in the immediate residential environment. Increased dependence on nearby recreation areas at the outskirts of a city on the other hand generates traffic, which also has a negative effect on the environment.
Impervious Coverage and Land Consumption in Germany In Germany, impervious areas accounted for approx. 6 % of the total area in 2010. This corresponds to an impervious area of 2.16 million ha (State statistical offices, 2011).
3
In the political debate, the environmental indicator “land consumption” is primarily cited, and has also found its way into the national sustainability strategy.
There, since 2002, the goal of reducing land consumption to 30 ha per day by 2020 has been formulated. Daily land-consumption demand in Germany for residential/commercial and traffic use was 78 ha in 2009 (UBA 2011). Nationwide, the increase in areas used for buildings and open spaces is clearly on the decline. The increase in land areas used for traffic purposes, while it is lower than the increase in areas used for residential/commercial purposes, is still approx. 23 ha/day, and has thus not changed over the course of the past 20 years. Land consumption has been reduced in recent years, due to the economic situation, the drop in new road building, and the impervious coverage regulations for new buildings; however, it is still a long way from the target for 2020.
Land consumption is calculated from the daily increase in built-up and traffic areas. This is not equal to the impervious area, since it also includes areas which are only slightly impervious, such as gardens in residential areas or green median strips on roads, etc.
The Federal-State Cooperative Association for Soil Protection (LABO) in 2005 appointed a group of federal and state experts to develop a suitable assessment procedure for ascertaining soil impervious coverage at the state level, in order to expand the sustainability indicator “land consumption for residential/commercial and traffic areas” to include the component impervious coverage.
The results of the experts’ group are incorporated into the System of Integrated Environmental and Economic Accounting (SEEA) by the Working Group on Environmental-Economic Accounting of the German States (EEAL), and have been documented in the report Indikator Versiegelung, (the indicator “Impervious Coverage”/ Frie & Hensel 2007). See too the Excursus Versiegelungsdaten [impervious coverage data] 2011 and 2005, below, which compares the present results with those of the Indikator Versiegelung, by the EEAL.
The reduction of land consumption, which is a goal of the Sustainability Strategy, is to be achieved by space-reduced construction of buildings, densification of urban areas, concentration of infrastructure, provision of compensation areas, and the removal of impervious surfaces no longer used (space recycling). With the increase of the quality of the living environment in residential areas, concentrated housing in the city is to be reestablished as an alternative to the “home in the green suburbs” once again. (Bundesregierung 2007). Germany’s states and municipalities are to realize these targets in the context of their spatial and construction planning.
Legally mandatory stipulations are also being used to reduce impervious coverage. The impervious-coverage removal requirement under §5 of the Federal Soil Protection Law (BBodSchG) of 1998 is designed to provide compensation for land consumption, by causing areas no longer used to be made pervious again, and thus regain their natural soil functions, as per §2 Sect. 2 BBodSchG. The law makes allowance for reasonable expense and burden (Oerder 1999, .pp. 90 ff.). However, since costs and reasonableness of the imposition are taking into account, this regulation has not proven itself in practice.
A further possible instrument for reducing impervious coverage is financial incentives at the individual level. For example, Berlin has since January 1, 2000, invoiced the charge for precipitate-water sewage separately. The introduction of this so-called fee-splitting is based on a ruling by the Federal Administrative Court (ruling of June 12, 1972) and the Superior Administrative Court of Lüneburg (rulings of June 14, 1968 and of April 10, 1980). These rulings stated that in municipalities in which the cost of precipitate-water sewage disposal accounts for more than 15% of the total costs of sewage disposal, the fees must be invoiced separately, so that the fee for precipitate-water sewage disposal is no longer linked proportionally to the general sewage fee, but is rather charged according to the impervious share of the property from which waste water is fed into the sewage system (BWB 1998). Therefore, owners have since 2000 endeavoured to keep the impervious area of their property as low as possible, in order to save on sewage fees. Since the new Precipitate-Water Exemption Ordinance of August 2001 came into effect (the Ordinance on Exemption from Requirement for Permission for Harmless Percolation of Precipitate Water – NWFreiV, August 24, 2001), it is possible to obtain proportionate or full exemption from the precipitate-water sewage disposal fee (SenStadt 2001) via measures for relieving the rainwater sewage system via-water percolation on one's own property, without permission.
Statistical Base Data on impervious soil coverage for Berlin have been available in the Environmental Atlas since the beginning of the ‘80s. At first, this was true only for the western part of the city; since the political change in the East, a full-coverage data stock has been built up and maintained over the course of a
4
number of shifts of emphasis and updates. However, this data base was no longer up-to-date, and was moreover based on non-uniform surveying methods.
In cooperation with the Berlin University of Technology, the Humboldt University and the company Digitale Dienste Berlin, a new procedure for ascertaining impervious coverage was developed for the 2007 Edition. It is now been partially re-adapted and used for the 2012 Edition. The databases for impervious coverage which had existed previously had been based on non-uniform ascertainment methods, for which reason a direct comparison was not possible. The present reuse of this ascertainment method now permits an overall comparison of degrees of impervious coverage between 2005 in 2011.
The following specialized information and geo-data, as well as satellite-image data, have been used:
The Urban and Environmental Information System, Block Map 1: 5,000 (ISU 5) and Land Use Data The spatial reference of the City and Environment Information System (ISU) is oriented toward the structure of the statistical blocks of the Regional Reference System (RBS) of the Berlin-Brandenburg Bureau of Statistics. However, each block may be further subdivided into homogeneous-use block segments. For each of the approx. 25,000 sections of the ISU 5 structure, a 16-digit key is stored in a database, in which information on both section size and use is stored.
A total of 52 section types with homogeneous use and spatial structures are distinguished. The ISU 5 was used for the impervious coverage maps current as of Dec. 31, 2005. The ISU data were used as follows in the evaluation process:
• The geometric data served to delimit blocks and distinguish streets and bodies of water. Sections outside the statistical blocks were not analyzed.
• The degrees of impervious coverage were calculated at the ISU block and block segment levels.
• The ISU utilization data were used for the stratification of the municipal area, and were fed into the rule-based classification system.
In the course of the updating of the database in 2010, not only were the block geometries further developed, but the categories and the information on land use and urban structure were also revised. In this process, changes in the mapping methodology, e.g., the definition of section types, were undertaken, which had implications for the impervious coverage mapping methodology developed for the Database 2005. For the impervious coverage investigation in 2011, it was therefore necessary to undertake certain procedural modifications.
Automated Map of Properties (ALK) In Berlin, the lot-referenced factual and geometric data of the Register of Land Properties is maintained in the form of the Automated Book of Properties (ALB) and Automated Map of Properties (ALK). The data stock of the Berlin ALK covers the entire area of the State of Berlin and consists of approx. 1.5 million properties, largely fields and buildings.
The vector data of the ALK, current as of December 2010, were used for the delimitation of buildings within the ISU blocks, and for the specification of remaining areas as non-built-up block space, and hence as analysis areas for satellite-image evaluation.
With regard to the integration of the ALK data into the evaluation process, it was ascertained that facilities on railyards and urban-rail stations, and also buildings in industrial and commercial areas, were frequently missed. Due to a change in the definition of buildings, summer cottages in allotment-garden areas are no longer included in the current ALK.
Map of Berlin 1:5,000 - K5 The map of Berlin by the State Mapping Agency at a scale of 1:5,000 (K5) is drafted by the Berlin boroughs on the basis the Berlin ALK. The above-ground railway lines shown in the K5 Map were used for the impervious-coverage maps current as of January 2006, to the extent that these were provided by the boroughs. The lot-precise recording of track beds was used primarily for the mapping of the shaded railway lines in forests, such as that north of Müggel Lake.
5
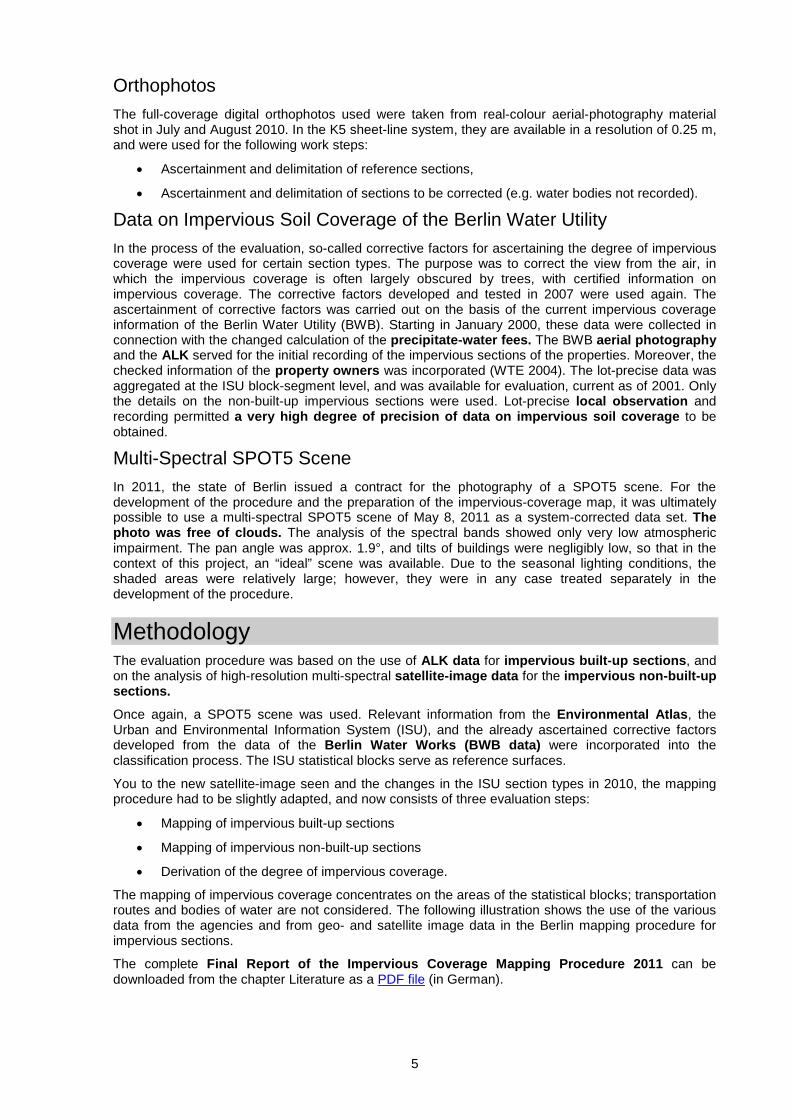
Orthophotos The full-coverage digital orthophotos used were taken from real-colour aerial-photography material shot in July and August 2010. In the K5 sheet-line system, they are available in a resolution of 0.25 m, and were used for the following work steps:
• Ascertainment and delimitation of reference sections,
• Ascertainment and delimitation of sections to be corrected (e.g. water bodies not recorded).
Data on Impervious Soil Coverage of the Berlin Water Utility In the process of the evaluation, so-called corrective factors for ascertaining the degree of impervious coverage were used for certain section types. The purpose was to correct the view from the air, in which the impervious coverage is often largely obscured by trees, with certified information on impervious coverage. The corrective factors developed and tested in 2007 were used again. The ascertainment of corrective factors was carried out on the basis of the current impervious coverage information of the Berlin Water Utility (BWB). Starting in January 2000, these data were collected in connection with the changed calculation of the precipitate-water fees. The BWB aerial photography and the ALK served for the initial recording of the impervious sections of the properties. Moreover, the checked information of the property owners was incorporated (WTE 2004). The lot-precise data was aggregated at the ISU block-segment level, and was available for evaluation, current as of 2001. Only the details on the non-built-up impervious sections were used. Lot-precise local observation and recording permitted a very high degree of precision of data on impervious soil coverage to be obtained.
Multi-Spectral SPOT5 Scene In 2011, the state of Berlin issued a contract for the photography of a SPOT5 scene. For the development of the procedure and the preparation of the impervious-coverage map, it was ultimately possible to use a multi-spectral SPOT5 scene of May 8, 2011 as a system-corrected data set. The photo was free of clouds. The analysis of the spectral bands showed only very low atmospheric impairment. The pan angle was approx. 1.9°, and tilts of buildings were negligibly low, so that in the context of this project, an “ideal” scene was available. Due to the seasonal lighting conditions, the shaded areas were relatively large; however, they were in any case treated separately in the development of the procedure.
Methodology The evaluation procedure was based on the use of ALK data for impervious built-up sections, and on the analysis of high-resolution multi-spectral satellite-image data for the impervious non-built-up sections.
Once again, a SPOT5 scene was used. Relevant information from the Environmental Atlas, the Urban and Environmental Information System (ISU), and the already ascertained corrective factors developed from the data of the Berlin Water Works (BWB data) were incorporated into the classification process. The ISU statistical blocks serve as reference surfaces.
You to the new satellite-image seen and the changes in the ISU section types in 2010, the mapping procedure had to be slightly adapted, and now consists of three evaluation steps:
• Mapping of impervious built-up sections
• Mapping of impervious non-built-up sections
• Derivation of the degree of impervious coverage.
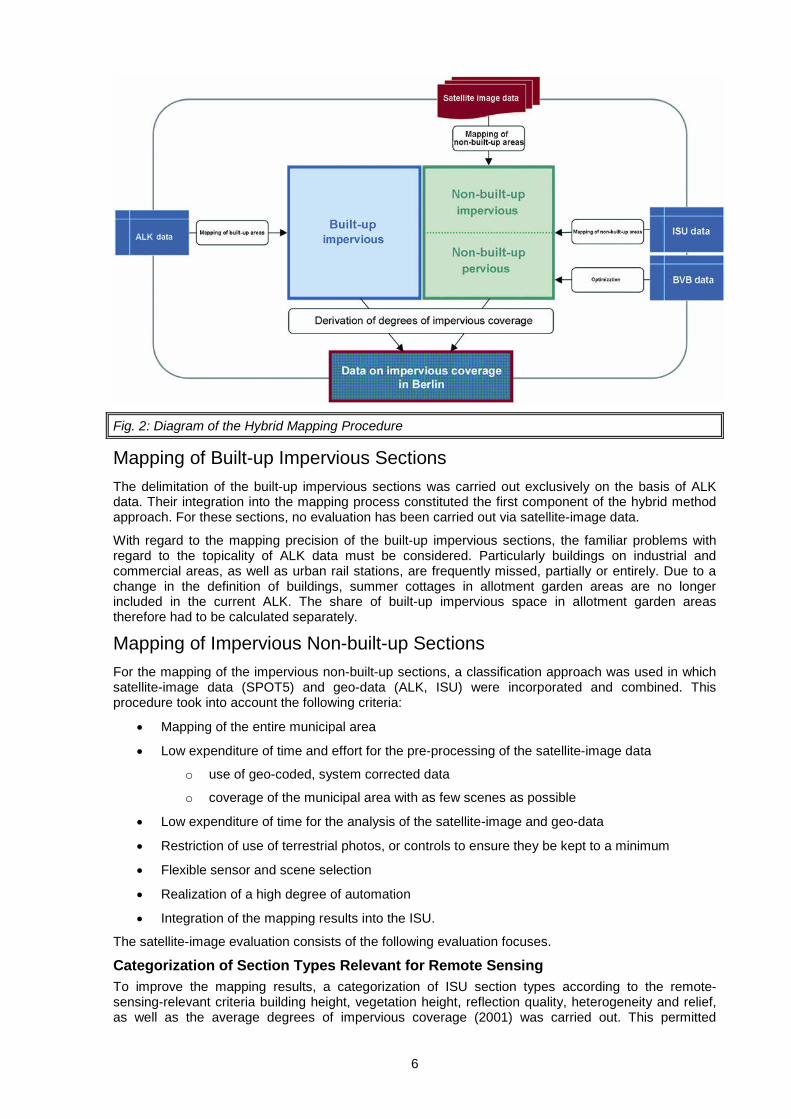
The mapping of impervious coverage concentrates on the areas of the statistical blocks; transportation routes and bodies of water are not considered. The following illustration shows the use of the various data from the agencies and from geo- and satellite image data in the Berlin mapping procedure for impervious sections.
The complete Final Report of the Impervious Coverage Mapping Procedure 2011 can be downloaded from the chapter Literature as a PDF file (in German).
6
Fig. 2: Diagram of the Hybrid Mapping Procedure
Mapping of Built-up Impervious Sections The delimitation of the built-up impervious sections was carried out exclusively on the basis of ALK data. Their integration into the mapping process constituted the first component of the hybrid method approach. For these sections, no evaluation has been carried out via satellite-image data.
With regard to the mapping precision of the built-up impervious sections, the familiar problems with regard to the topicality of ALK data must be considered. Particularly buildings on industrial and commercial areas, as well as urban rail stations, are frequently missed, partially or entirely. Due to a change in the definition of buildings, summer cottages in allotment garden areas are no longer included in the current ALK. The share of built-up impervious space in allotment garden areas therefore had to be calculated separately.
Mapping of Impervious Non-built-up Sections For the mapping of the impervious non-built-up sections, a classification approach was used in which satellite-image data (SPOT5) and geo-data (ALK, ISU) were incorporated and combined. This procedure took into account the following criteria:
• Mapping of the entire municipal area
• Low expenditure of time and effort for the pre-processing of the satellite-image data
o use of geo-coded, system corrected data
o coverage of the municipal area with as few scenes as possible
• Low expenditure of time for the analysis of the satellite-image and geo-data
• Restriction of use of terrestrial photos, or controls to ensure they be kept to a minimum
• Flexible sensor and scene selection
• Realization of a high degree of automation
• Integration of the mapping results into the ISU.
The satellite-image evaluation consists of the following evaluation focuses.
Categorization of Section Types Relevant for Remote Sensing To improve the mapping results, a categorization of ISU section types according to the remote-sensing-relevant criteria building height, vegetation height, reflection quality, heterogeneity and relief, as well as the average degrees of impervious coverage (2001) was carried out. This permitted
7
spatially separate segment classification, and optimized choice of methodology. Eighteen categories were defined (Table 2), which had to be adapted to the new ISU section types of adopted in 2010.
Some adaptations have also affected the ascertainment of changes between 2005 and 2011, and required special consideration. In the course of the updating of ISU section types in 2010, uses were not only updated, but also corrected. In the course of the automated evaluation process, unchanged block sections were thus assigned to different impervious coverage categories (pseudo-changes). This involved 718 block sections. Major changes in ISU block geometry affected 244 block sections between 2005 and 2010, i.e., the section sizes had changed by more than 10 %. Here too, pseudo-changes in impervious coverage mapping could result.
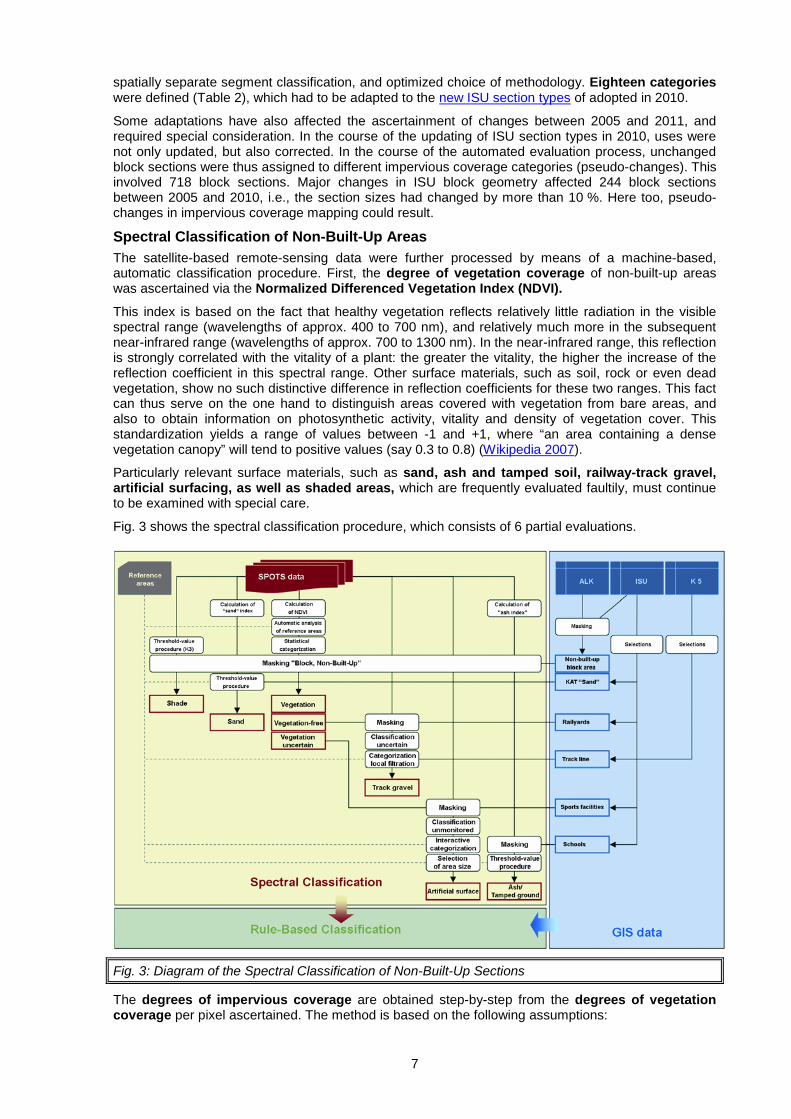
Spectral Classification of Non-Built-Up Areas The satellite-based remote-sensing data were further processed by means of a machine-based, automatic classification procedure. First, the degree of vegetation coverage of non-built-up areas was ascertained via the Normalized Differenced Vegetation Index (NDVI).
This index is based on the fact that healthy vegetation reflects relatively little radiation in the visible spectral range (wavelengths of approx. 400 to 700 nm), and relatively much more in the subsequent near-infrared range (wavelengths of approx. 700 to 1300 nm). In the near-infrared range, this reflection is strongly correlated with the vitality of a plant: the greater the vitality, the higher the increase of the reflection coefficient in this spectral range. Other surface materials, such as soil, rock or even dead vegetation, show no such distinctive difference in reflection coefficients for these two ranges. This fact can thus serve on the one hand to distinguish areas covered with vegetation from bare areas, and also to obtain information on photosynthetic activity, vitality and density of vegetation cover. This standardization yields a range of values between -1 and +1, where “an area containing a dense vegetation canopy” will tend to positive values (say 0.3 to 0.8) (Wikipedia 2007).
Particularly relevant surface materials, such as sand, ash and tamped soil, railway-track gravel, artificial surfacing, as well as shaded areas, which are frequently evaluated faultily, must continue to be examined with special care.
Fig. 3 shows the spectral classification procedure, which consists of 6 partial evaluations.
Fig. 3: Diagram of the Spectral Classification of Non-Built-Up Sections
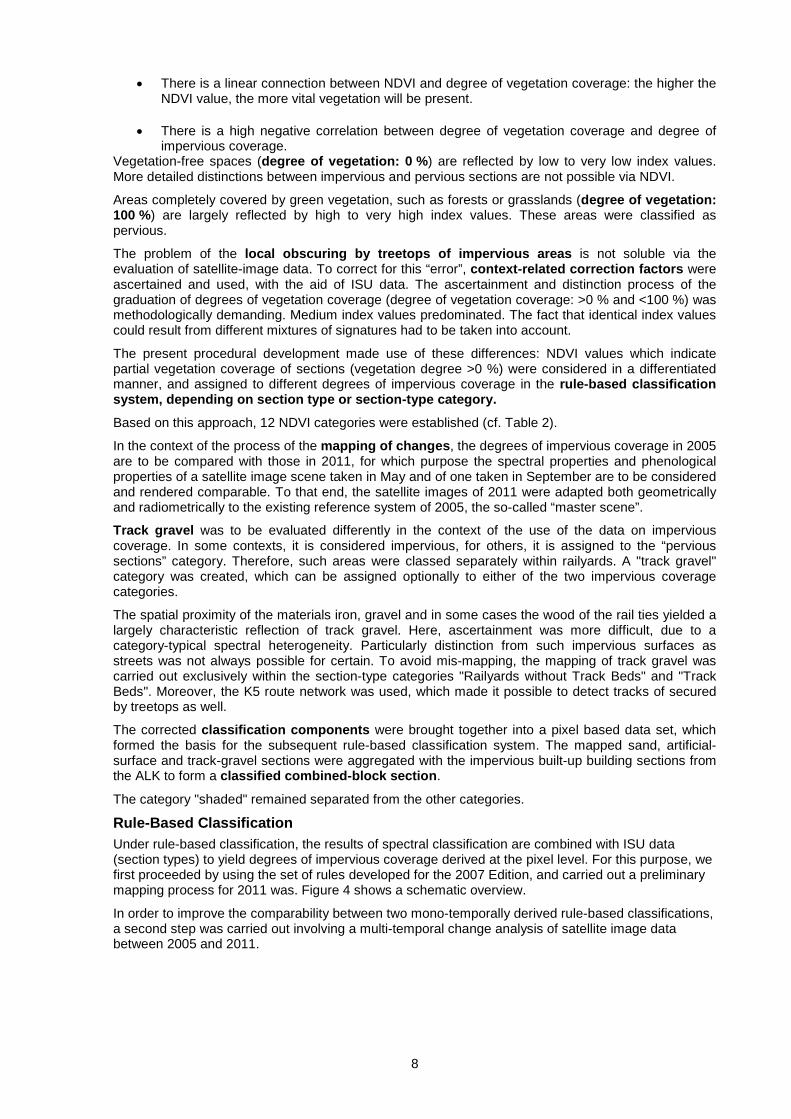
The degrees of impervious coverage are obtained step-by-step from the degrees of vegetation coverage per pixel ascertained. The method is based on the following assumptions:
8
• There is a linear connection between NDVI and degree of vegetation coverage: the higher the NDVI value, the more vital vegetation will be present.
• There is a high negative correlation between degree of vegetation coverage and degree of impervious coverage.
Vegetation-free spaces (degree of vegetation: 0 %) are reflected by low to very low index values. More detailed distinctions between impervious and pervious sections are not possible via NDVI.
Areas completely covered by green vegetation, such as forests or grasslands (degree of vegetation: 100 %) are largely reflected by high to very high index values. These areas were classified as pervious.
The problem of the local obscuring by treetops of impervious areas is not soluble via the evaluation of satellite-image data. To correct for this “error”, context-related correction factors were ascertained and used, with the aid of ISU data. The ascertainment and distinction process of the graduation of degrees of vegetation coverage (degree of vegetation coverage: >0 % and <100 %) was methodologically demanding. Medium index values predominated. The fact that identical index values could result from different mixtures of signatures had to be taken into account.
The present procedural development made use of these differences: NDVI values which indicate partial vegetation coverage of sections (vegetation degree >0 %) were considered in a differentiated manner, and assigned to different degrees of impervious coverage in the rule-based classification system, depending on section type or section-type category.
Based on this approach, 12 NDVI categories were established (cf. Table 2).
In the context of the process of the mapping of changes, the degrees of impervious coverage in 2005 are to be compared with those in 2011, for which purpose the spectral properties and phenological properties of a satellite image scene taken in May and of one taken in September are to be considered and rendered comparable. To that end, the satellite images of 2011 were adapted both geometrically and radiometrically to the existing reference system of 2005, the so-called “master scene”.
Track gravel was to be evaluated differently in the context of the use of the data on impervious coverage. In some contexts, it is considered impervious, for others, it is assigned to the “pervious sections” category. Therefore, such areas were classed separately within railyards. A "track gravel" category was created, which can be assigned optionally to either of the two impervious coverage categories.
The spatial proximity of the materials iron, gravel and in some cases the wood of the rail ties yielded a largely characteristic reflection of track gravel. Here, ascertainment was more difficult, due to a category-typical spectral heterogeneity. Particularly distinction from such impervious surfaces as streets was not always possible for certain. To avoid mis-mapping, the mapping of track gravel was carried out exclusively within the section-type categories "Railyards without Track Beds" and "Track Beds". Moreover, the K5 route network was used, which made it possible to detect tracks of secured by treetops as well.
The corrected classification components were brought together into a pixel based data set, which formed the basis for the subsequent rule-based classification system. The mapped sand, artificial-surface and track-gravel sections were aggregated with the impervious built-up building sections from the ALK to form a classified combined-block section.
The category "shaded" remained separated from the other categories.
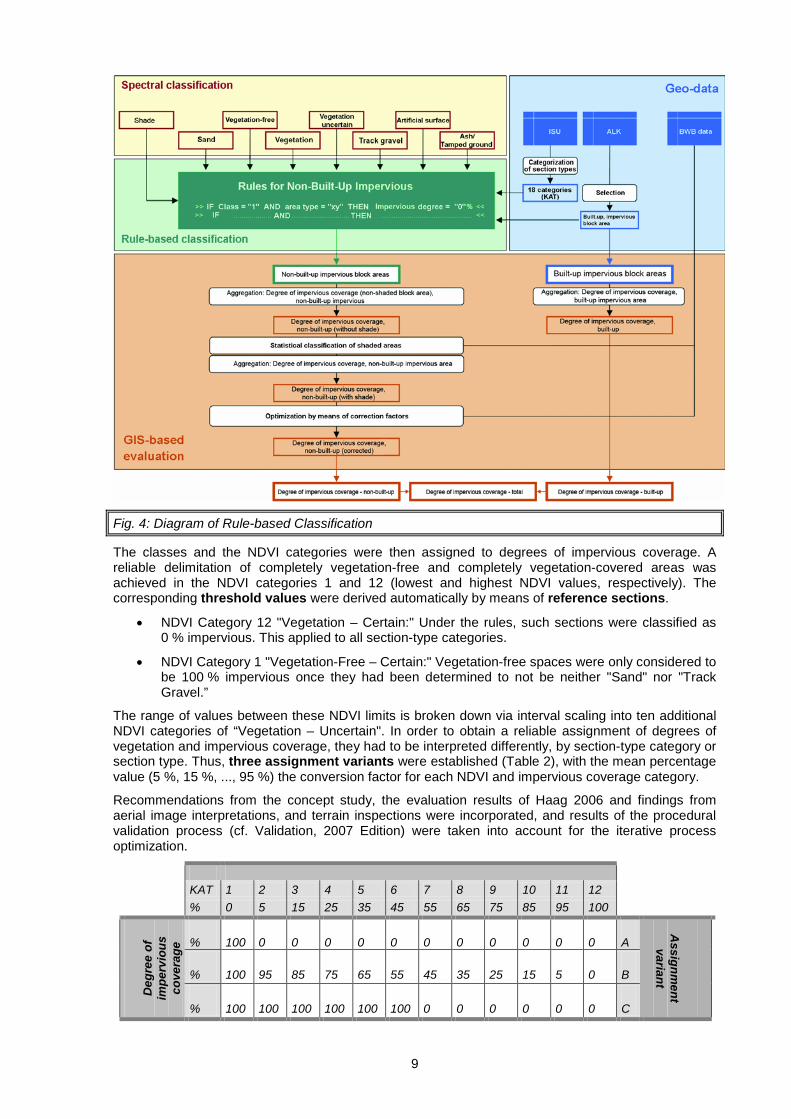
Rule-Based Classification Under rule-based classification, the results of spectral classification are combined with ISU data (section types) to yield degrees of impervious coverage derived at the pixel level. For this purpose, we first proceeded by using the set of rules developed for the 2007 Edition, and carried out a preliminary mapping process for 2011 was. Figure 4 shows a schematic overview.
In order to improve the comparability between two mono-temporally derived rule-based classifications, a second step was carried out involving a multi-temporal change analysis of satellite image data between 2005 and 2011.
9
Fig. 4: Diagram of Rule-based Classification
The classes and the NDVI categories were then assigned to degrees of impervious coverage. A reliable delimitation of completely vegetation-free and completely vegetation-covered areas was achieved in the NDVI categories 1 and 12 (lowest and highest NDVI values, respectively). The corresponding threshold values were derived automatically by means of reference sections.
• NDVI Category 12 "Vegetation – Certain:" Under the rules, such sections were classified as 0 % impervious. This applied to all section-type categories.
• NDVI Category 1 "Vegetation-Free – Certain:" Vegetation-free spaces were only considered to be 100 % impervious once they had been determined to not be neither "Sand" nor "Track Gravel.”
The range of values between these NDVI limits is broken down via interval scaling into ten additional NDVI categories of “Vegetation – Uncertain". In order to obtain a reliable assignment of degrees of vegetation and impervious coverage, they had to be interpreted differently, by section-type category or section type. Thus, three assignment variants were established (Table 2), with the mean percentage value (5 %, 15 %, ..., 95 %) the conversion factor for each NDVI and impervious coverage category.
Recommendations from the concept study, the evaluation results of Haag 2006 and findings from aerial image interpretations, and terrain inspections were incorporated, and results of the procedural validation process (cf. Validation, 2007 Edition) were taken into account for the iterative process optimization.
KAT 1 2 3 4 5 6 7 8 9 10 11 12 % 0 5 15 25 35 45 55 65 75 85 95 100
Deg
ree
of
impe
rvio
us
cove
rage
% 100 0 0 0 0 0 0 0 0 0 0 0 A
Assignm
ent variant
% 100 95 85 75 65 55 45 35 25 15 5 0 B
% 100 100 100 100 100 100 0 0 0 0 0 0 C

10
Conversion factors for the calculation of pixel values: Degree of impervious coverage 100% = 1.00; 95 % = 0.95 etc.
Tab. 2: Assignment Variants: Degree of Vegetation – Degree of Impervious Coverage
The assignment variants were oriented toward certain section types, which are characterized by the spatial interconnection and proximity of certain surface materials and types of buildings.
• Assignment Variant A: Vegetation and pervious vegetation-free sections. The intermediate stages of the degrees of vegetation coverage (5% - 95%) were interpreted as mixed signatures of vegetation and other pervious surface types. The corresponding sections were therefore classified as pervious. Examples: Fallow areas, Forest, Farmland.
• Assignment Variant B: Vegetation and impervious vegetation-free sections. The characteristic surface materials suggest a low share of vegetation-free pervious sections. Intermediate stages of the degrees of vegetation were therefore interpreted as mixed signatures of vegetation and impervious surfaces. The gradual increase in degree of vegetation per category thus corresponded to an adequate drop in degree of impervious coverage. Examples: Allotment gardens, traffic areas, block-edge buildings.
• Assignment Variant C: Vegetation and impervious vegetation-free sections – block type "Airports". A variety of impervious surfaces characterized this block type. Some materials, such as concrete, showed strong spectral coincidences with sand and open soil. Such blocks indicate runways, parking areas etc. Within the airport area; green spaces were largely delimited as separate blocks. To achieve certain separation, it has proved useful to classify sections with low degrees of vegetation as completely impervious (NDVI categories 2 through 6).
The new rule-based classification for 2011 and that of 2005 were thus available as intermediate results. These sets of map data were interlinked, and also linked to the current ISU block map, in order to obtain reliable information on changes of degree of impervious coverage at block level.
Methodologically, the following aspects had to be taken into account in this process:
• Ascertainment of changed sectors and elimination of pseudo-changes by means of multi-temporal change mapping
• Comparability of the blocks in terms of geometry and sector type category.
For the reliable ascertainment of suspected sectors, the satellite image data of 2005 and 2011 for the non-built-up sectors were first of all evaluated, and secondly, the ALK data on possible changes in the built-up impervious sectors were examined.
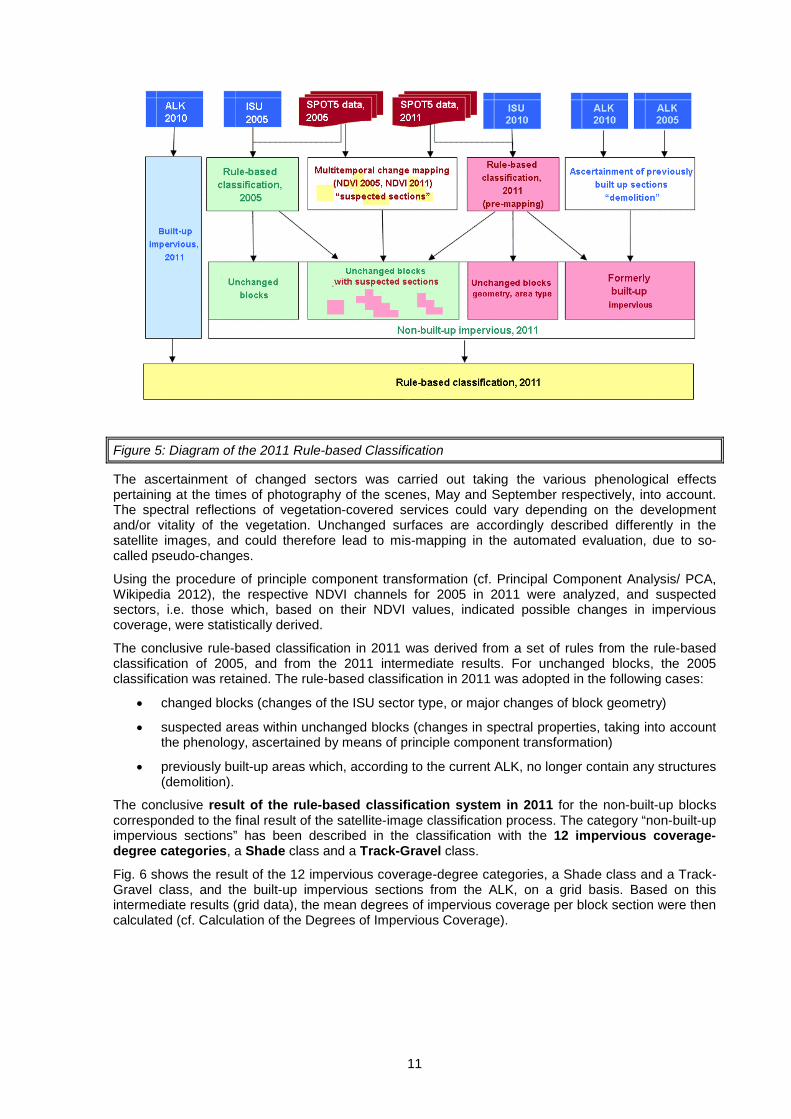
Figure 5 provides an overview of the derivation of the results of the 2011 rule-based classification:
11
Figure 5: Diagram of the 2011 Rule-based Classification
The ascertainment of changed sectors was carried out taking the various phenological effects pertaining at the times of photography of the scenes, May and September respectively, into account. The spectral reflections of vegetation-covered services could vary depending on the development and/or vitality of the vegetation. Unchanged surfaces are accordingly described differently in the satellite images, and could therefore lead to mis-mapping in the automated evaluation, due to so-called pseudo-changes.
Using the procedure of principle component transformation (cf. Principal Component Analysis/ PCA, Wikipedia 2012), the respective NDVI channels for 2005 in 2011 were analyzed, and suspected sectors, i.e. those which, based on their NDVI values, indicated possible changes in impervious coverage, were statistically derived.
The conclusive rule-based classification in 2011 was derived from a set of rules from the rule-based classification of 2005, and from the 2011 intermediate results. For unchanged blocks, the 2005 classification was retained. The rule-based classification in 2011 was adopted in the following cases:
• changed blocks (changes of the ISU sector type, or major changes of block geometry)
• suspected areas within unchanged blocks (changes in spectral properties, taking into account the phenology, ascertained by means of principle component transformation)
• previously built-up areas which, according to the current ALK, no longer contain any structures (demolition).
The conclusive result of the rule-based classification system in 2011 for the non-built-up blocks corresponded to the final result of the satellite-image classification process. The category “non-built-up impervious sections” has been described in the classification with the 12 impervious coverage-degree categories, a Shade class and a Track-Gravel class.
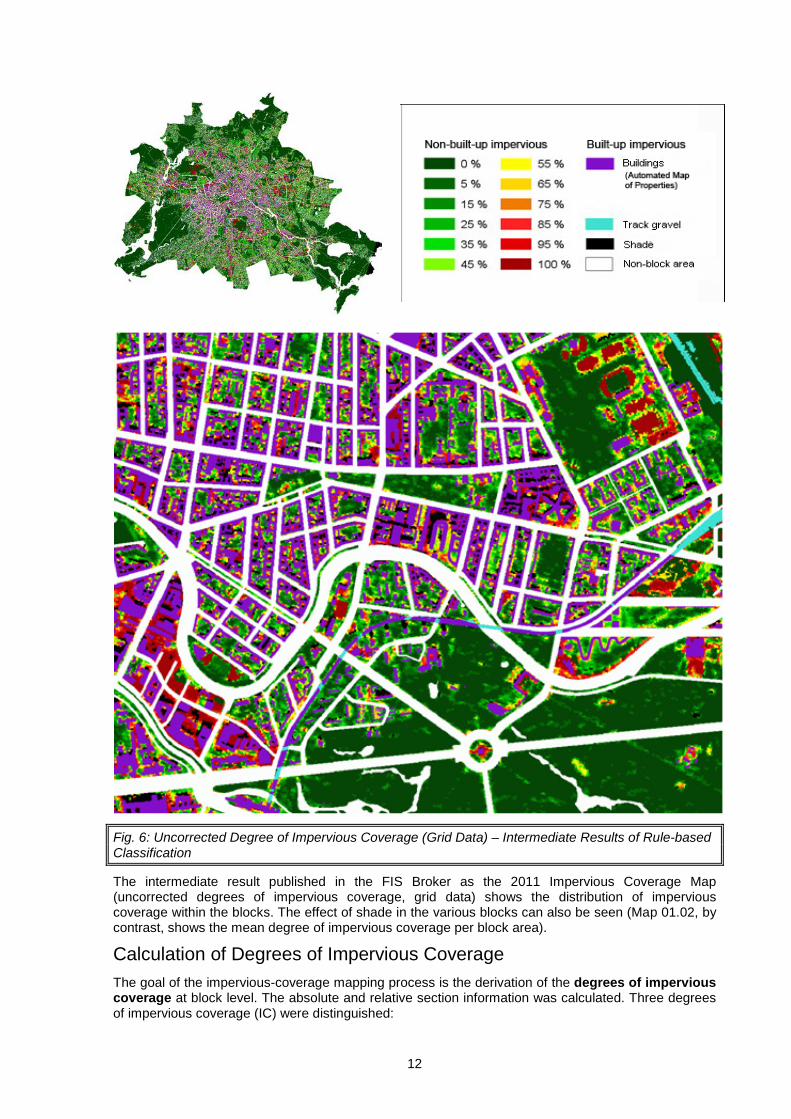
Fig. 6 shows the result of the 12 impervious coverage-degree categories, a Shade class and a Track-Gravel class, and the built-up impervious sections from the ALK, on a grid basis. Based on this intermediate results (grid data), the mean degrees of impervious coverage per block section were then calculated (cf. Calculation of the Degrees of Impervious Coverage).
12
Fig. 6: Uncorrected Degree of Impervious Coverage (Grid Data) – Intermediate Results of Rule-based Classification
The intermediate result published in the FIS Broker as the 2011 Impervious Coverage Map (uncorrected degrees of impervious coverage, grid data) shows the distribution of impervious coverage within the blocks. The effect of shade in the various blocks can also be seen (Map 01.02, by contrast, shows the mean degree of impervious coverage per block area).
Calculation of Degrees of Impervious Coverage The goal of the impervious-coverage mapping process is the derivation of the degrees of impervious coverage at block level. The absolute and relative section information was calculated. Three degrees of impervious coverage (IC) were distinguished:

13
• IC “Built-up impervious sections” (calculated from the Automated Map of Properties/ ALK data),
• IC “Non-built-up impervious sections (calculated from satellite data),
• IC Total (sum of the above).
For the calculations, the results of the pixel-based satellite-image classification were collated with the areas from the block map ISU 5.
First, a summation by category of degree of impervious and block area was carried out. Thus, the grid data of the classification system was no longer necessary for further analyses.
There were thus 15 section-referenced statements in sq. m. for each block and block segment:
• Built-up areas (from the ALK)
• 12 categories of degrees of impervious coverage – for non-built-up areas (corresponding to the NDVI categories)
• Track-gravel areas (optionally either 0 % or 100 % impervious), and
• Shaded area (unclassified).
For the further improvement in the mapping results, the following additional calculations were carried out.
Optional Assignment of an Impervious-Coverage Value to Track-Gravel Areas The class "Track Gravel" has been maintained as a data field of its own, and can optionally be included in the calculations either as an impervious non-built-up (100 %) or pervious built-up area (0 %). This ensures the different evaluation of gravel according to the respective question at issue. In the map shown, track gravel is considered 100% impervious.
Classification of Shaded Areas Shaded areas have been assigned impervious-coverage values at block level in a follow-up classification procedure using ISU data or BWB data. The shaded areas were evaluated depending on section type. For section types with predominantly residential use and adequate BWB data, the latter were used for the classification of the shaded areas. For all other section types, shaded areas were classified in accordance with their block-specific surroundings.
Evaluation of Built-Up and Non-Built-Up Impervious Sections in the Category "Allotment Gardens" For the category "Allotment Gardens," the data on impervious soil coverage usually showed only the overall degree of impervious coverage. Since the ALK mapped no summer cottages and hardly any functional buildings, the non-built-up impervious areas could only rarely be distinguished from the built-up impervious areas. Therefore, the degree of impervious coverage was ascertained almost entirely via satellite-image evaluation.
For this impervious-coverage map, the differentiation between built-up and non-built-up areas was carried out with the help of average values from the Department of Urban Development and the Environment, Section I C, Allotment Gardens. A degree of impervious coverage for built-up areas of 9.6 % for West Berlin and 8.6 % for East Berlin was assumed.
Application of Correction Factors For the further improvement in the mapping results, so-called correction factors were used. The BWB data on impervious soil coverage was used for this purpose. The principle of section-type-referenced corrections is based on the following well-founded assumptions:
• the BWB data were still largely up-to-date at the time of processing,
• the BWB data were adequately precise, due to the ascertainment methods (terrestrial inspection, aerial-image interpretation, building-owner information),
• the one-time calculation of correction factors makes them transferable to future evaluations, since they describe systematic trends in a city-wide comparison.
Due to topicality, overlap problems, differing definitions of impervious coverage, and gaps in impervious coverage ascertainment of some types by the BWB, correction factors could be calculated only for 5 section types (cf. Table 3).

14
Correction factors were only used on the non-built-up areas.
Section type (TYPE)
BWB data impervious
non-built-up area [sq. m]
Classification result impervious
non-built-up area [sq. m]
Correction-factor
21 Mixed village type 447,806 598,469 0.75
22 Row houses and duplexes with gardens 830,718 1,315,616 0.63
23 Single-family homes with gardens 4,129,760 6,349,315 0.65
24 Villas and townhouses with park-like gardens 1,353,980 1,411,935 0.96
25 Densification in single-family home areas Gardens, semi-private green space 1,133,823 1,367,805 0.83
Tab. 3: Correction Factor by Section Type
Adoption of the Surface Types from 2001 The surface types of the non-built-up impervious block segments (walkways, courtyard areas etc.) were grouped into four surface-type classes, from concrete to grass pavers. Their respective distribution was investigated via selected test areas, and the results transferred to all areas of the same section type. The type-specific surface type distribution was not updated for the current map, but is based on a survey from 1988 (AGU Arbeitsgemeinschaft Umweltplanung 1988). The surface types are not shown on the map; however, they can be shown via the factual data display by block area.
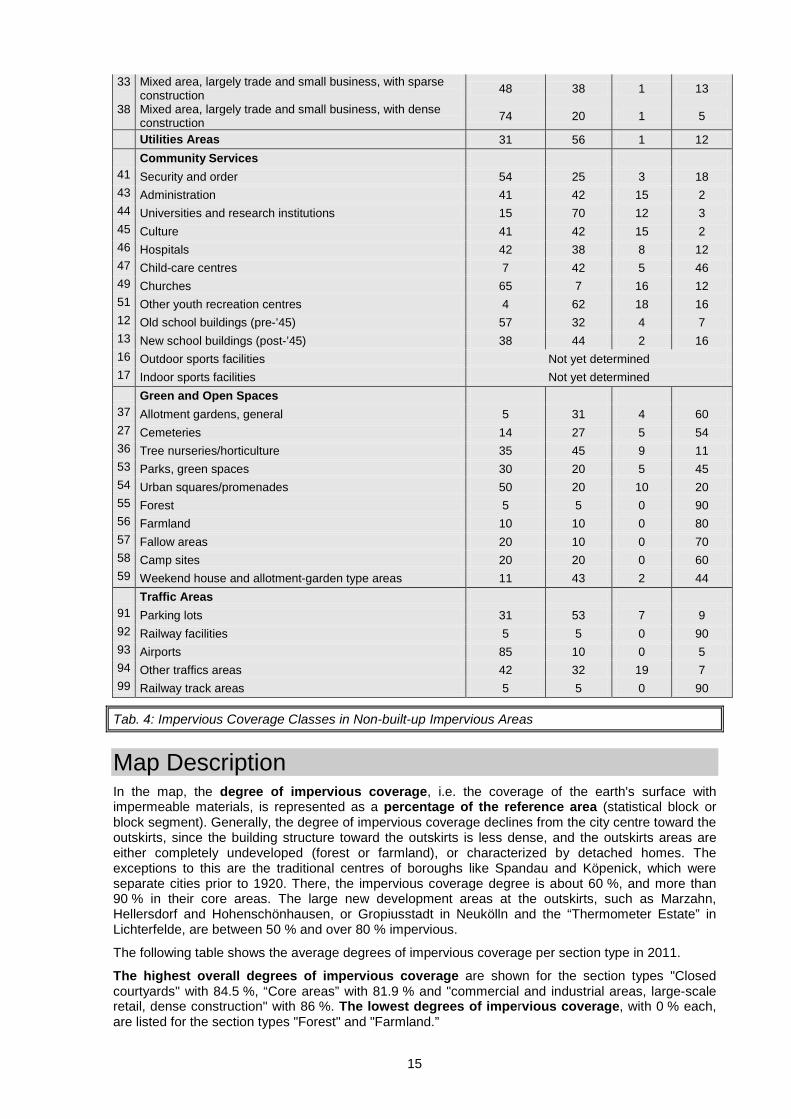
Tab. 4: Surface Classes of Non-Built-Up Impervious Areas
Share of Surface Classes of Non-Built-Up Impervious Areas
Section type 1 2 3 4 % Residential areas 1 Dense block construction, closed rear courts, 5-6 storey 64 17 4 15 2 Closed block construction, rear courts, 5 storey 56 22 3 19 3 Closed or semi-open block construction, decorative &
garden courts, 4- storey 62 27 10 1
6 Mixed structures, semi-open or open shed courts, 2-4 storeys 46 29 13 12
7 Closed or semi-open de-cored block-edge buildings; post-war gap-closures 41 27 4 28
8 Heterogeneous inner-city mixed construction; post-war gap-closures 45 28 13 14
9 Large high-rise residential estates, tower flats, 4-11 storey 15 67 7 11 10 Block-edge construction with large courts, 3-5 storey 20 37 32 11 11 Linear buildings with landscaped greenery, 3-6 storey 49 46 3 2 21 Mixed village type 21 39 22 18 22 Row houses and duplexes with gardens 25 65 3 7 23 Single-family homes with gardens 18 74 2 6 24 Villas and townhouses with park-like gardens 15 60 12 13 25 Densification in single-family home areas
Gardens, semi-private green space 20 64 4 12
60 Other and heterogeneous public use and special areas 36 42 5 17 72 Row houses with architectural greenery, 3-5 storey 20 37 32 11 73 Post-1990 residential area 20 60 10 18 Core area 50 34 9 7 Industrial/ commercial districts 30 Commercial/industrial areas, large-scale retail with sparse
construction 48 38 1 13
31 Commercial/industrial areas, large-scale retail with dense construction 74 20 1 5
15
33 Mixed area, largely trade and small business, with sparse construction 48 38 1 13
38 Mixed area, largely trade and small business, with dense construction 74 20 1 5
Utilities Areas 31 56 1 12 Community Services 41 Security and order 54 25 3 18 43 Administration 41 42 15 2 44 Universities and research institutions 15 70 12 3 45 Culture 41 42 15 2 46 Hospitals 42 38 8 12 47 Child-care centres 7 42 5 46 49 Churches 65 7 16 12 51 Other youth recreation centres 4 62 18 16 12 Old school buildings (pre-’45) 57 32 4 7 13 New school buildings (post-’45) 38 44 2 16 16 Outdoor sports facilities Not yet determined 17 Indoor sports facilities Not yet determined Green and Open Spaces 37 Allotment gardens, general 5 31 4 60 27 Cemeteries 14 27 5 54 36 Tree nurseries/horticulture 35 45 9 11 53 Parks, green spaces 30 20 5 45 54 Urban squares/promenades 50 20 10 20 55 Forest 5 5 0 90 56 Farmland 10 10 0 80 57 Fallow areas 20 10 0 70 58 Camp sites 20 20 0 60 59 Weekend house and allotment-garden type areas 11 43 2 44 Traffic Areas 91 Parking lots 31 53 7 9 92 Railway facilities 5 5 0 90 93 Airports 85 10 0 5 94 Other traffics areas 42 32 19 7 99 Railway track areas 5 5 0 90
Tab. 4: Impervious Coverage Classes in Non-built-up Impervious Areas
Map Description In the map, the degree of impervious coverage, i.e. the coverage of the earth's surface with impermeable materials, is represented as a percentage of the reference area (statistical block or block segment). Generally, the degree of impervious coverage declines from the city centre toward the outskirts, since the building structure toward the outskirts is less dense, and the outskirts areas are either completely undeveloped (forest or farmland), or characterized by detached homes. The exceptions to this are the traditional centres of boroughs like Spandau and Köpenick, which were separate cities prior to 1920. There, the impervious coverage degree is about 60 %, and more than 90 % in their core areas. The large new development areas at the outskirts, such as Marzahn, Hellersdorf and Hohenschönhausen, or Gropiusstadt in Neukölln and the “Thermometer Estate” in Lichterfelde, are between 50 % and over 80 % impervious.
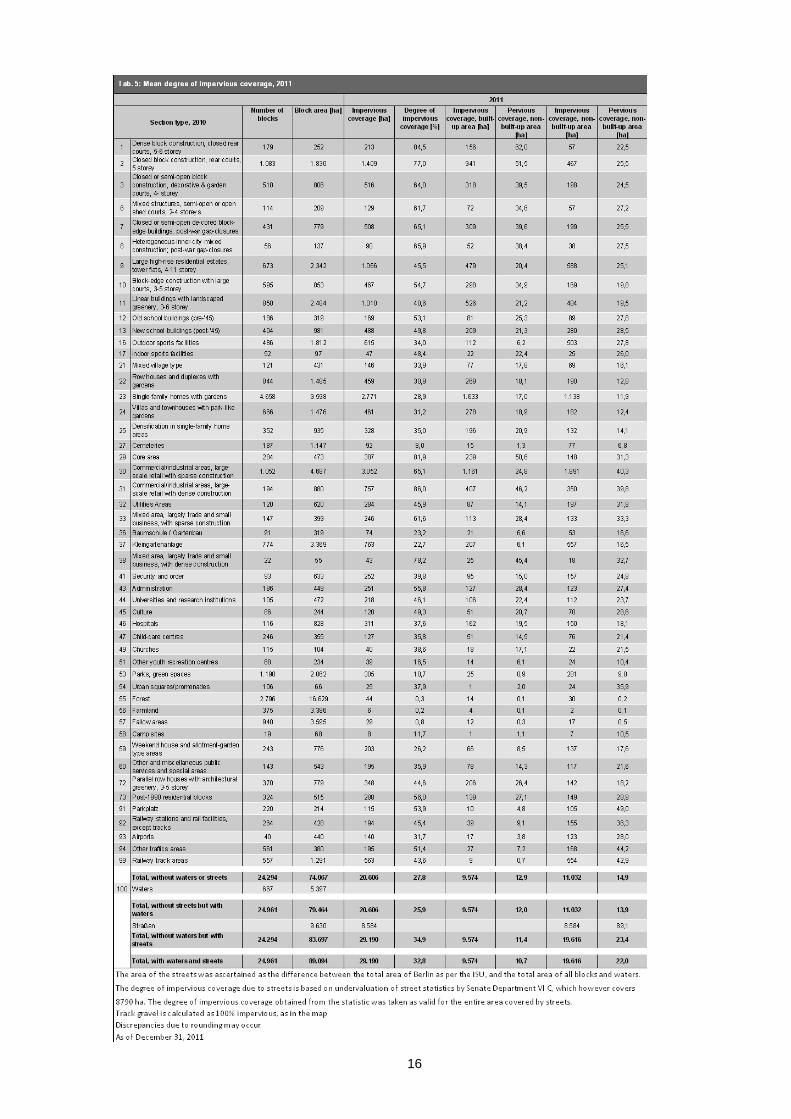
The following table shows the average degrees of impervious coverage per section type in 2011.
The highest overall degrees of impervious coverage are shown for the section types "Closed courtyards" with 84.5 %, “Core areas” with 81.9 % and "commercial and industrial areas, large-scale retail, dense construction" with 86 %. The lowest degrees of impervious coverage, with 0 % each, are listed for the section types "Forest" and "Farmland.”
16
17
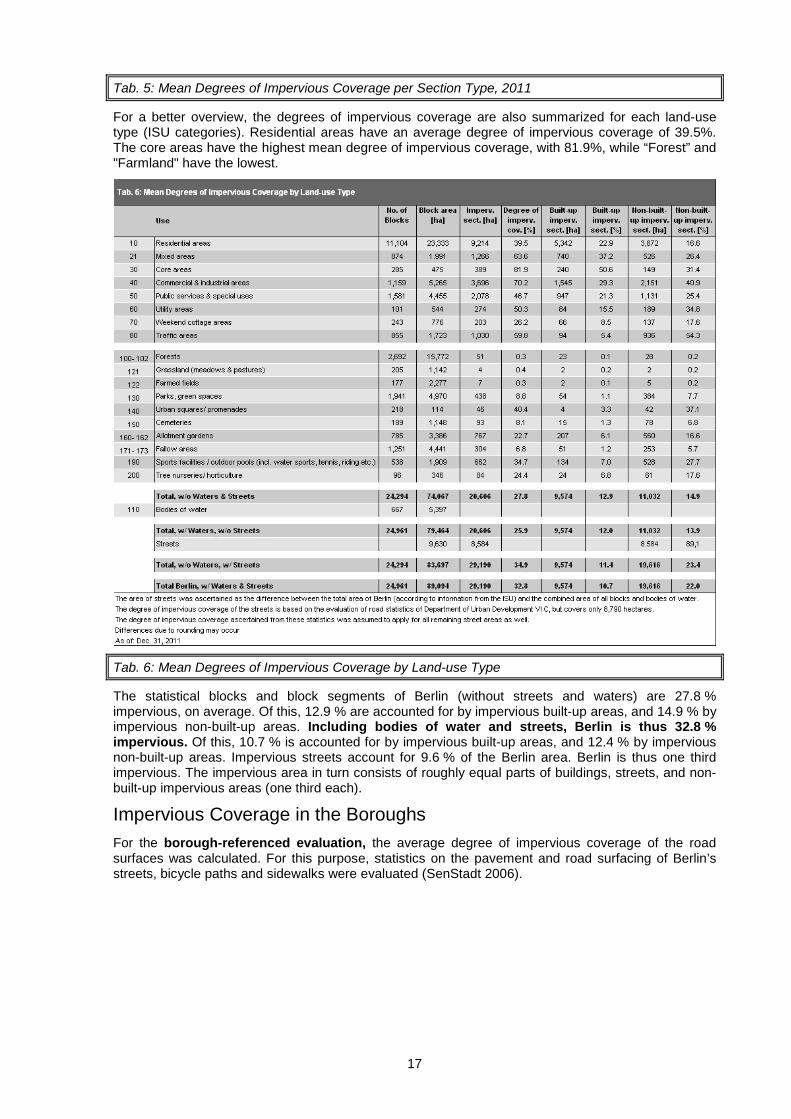
Tab. 5: Mean Degrees of Impervious Coverage per Section Type, 2011
For a better overview, the degrees of impervious coverage are also summarized for each land-use type (ISU categories). Residential areas have an average degree of impervious coverage of 39.5%. The core areas have the highest mean degree of impervious coverage, with 81.9%, while “Forest” and "Farmland" have the lowest.
Tab. 6: Mean Degrees of Impervious Coverage by Land-use Type
The statistical blocks and block segments of Berlin (without streets and waters) are 27.8 % impervious, on average. Of this, 12.9 % are accounted for by impervious built-up areas, and 14.9 % by impervious non-built-up areas. Including bodies of water and streets, Berlin is thus 32.8 % impervious. Of this, 10.7 % is accounted for by impervious built-up areas, and 12.4 % by impervious non-built-up areas. Impervious streets account for 9.6 % of the Berlin area. Berlin is thus one third impervious. The impervious area in turn consists of roughly equal parts of buildings, streets, and non-built-up impervious areas (one third each).
Impervious Coverage in the Boroughs For the borough-referenced evaluation, the average degree of impervious coverage of the road surfaces was calculated. For this purpose, statistics on the pavement and road surfacing of Berlin’s streets, bicycle paths and sidewalks were evaluated (SenStadt 2006).

18
Fig. 7: Degree of Impervious Coverage by Borough (in Percentage of Total Area without Bodies of Water)
The borough with the lowest degree of impervious coverage is Treptow-Köpenick, with 21.3 %, while Kreuzberg-Friedrichshain and Mitte have the highest degrees, with 68.7 and 62.7 %, respectively. These two boroughs also have the highest shares of built-up areas, as a proportion of their total areas.
Data on Impervious Soil Coverage in 2011 Compared with 1990, 2001 and 2005 Due to different ascertainment methods, a direct comparison between the impervious coverage values of 1990 or 2001 with 2005 or 2011 is possible only to a limited degree. No change in the impervious area over the course of this period of time can be ascertained from these figures.
In 2001, the degree of impervious coverage in Berlin amounted to 34.7 %, incl. streets and bodies of water. These data are to some extent based on evaluations of satellite images and other sources from the ‘80s (only in West Berlin). This mapping material was expanded to include East Berlin in 1990, and partially updated, in 2001 by means of aerial photography and topographical maps of the area. Here, use-specific flat values were assumed in some cases. Overall, the ascertainment methodology was non-uniform.
The mapping projects of 2005 in 2011 now provide a data set gain from a uniform, completely automated and considerably improved procedure. The result is that the degree of impervious coverage in 2011 amounts to 32.8 %, and is thus approx. 0.9 % higher than the value for 2005. The major share of this increase in impervious coverage is accounted for by the non-built-up impervious areas.
Tab. 7: Results of mapping of impervious coverage in Berlin, 1990 to 2011
Impervious coverage
Built-up impervious areas
Non-built-up impervious areas
Streets Total area
evaluated
Number of
blocks ha % ha % ha % ha % ha
1990 31,173 35.3 9680 11.0 13,283 15.0 8210 9.3 88,358 23,202 2001 31,021 34.7 9629 10.8 13,058 14.6 8334 9.3 89,317 24,505 2005 28,408 31.9 9423 10.6 10,526 11.8 8459 9.5 89,090 24,669 2011 29,190 32.8 9574 10.7 11,032 12.4 8584 9.6 89,095 24,961 Discrepancies may occur, due to rounding
19
Tab. 7: Results of mapping of impervious coverage in Berlin, 1990 to 2011. (all information refers to the total area of Berlin, incl. streets and bodies of water). Due to changed evaluation methods, no change can be concluded for the entire period of time. The values for 1990 and 2001 are based on different evaluation methods, which do not permit any comparison with the values for 2005 and 2011. However, a comparison between 2005 in 2011 is possible.
It is notable that the values ascertained for the impervious built-up area over the years are almost identical. This indicates that the old ascertainment methods yielded values that were quite good on the average, since the surveys of 2005 and 2011 using the ALK can be considered very precise.
For the non-built-up impervious areas, the picture is somewhat different. Here, the values ascertained for 2005 decreased by 2.8 percentage points compared with 2001, and increased by 0.9% between 2005 in 2011. The decrease between 2001 and 2005 may on the one hand be due to the fact that on the old maps, some green and open-space categories (e.g. Forest and Farmland) were assigned estimated values for their non-built-up impervious portions, values which we today recognize as having been too high. Since these areas constitute a major share of the municipal area, the degree of impervious coverage was overestimated for the non-built-up impervious areas overall. On the other hand, due to the problems mentioned above regarding the interpretation of the satellite data, the non-built-up impervious areas were more likely to be underestimated under the new method. These assumptions are rather more plausible than the supposition that any reduction in impervious areas actually took place in the municipal area.
With regard to the ascertainment of impervious roadways, the roughly estimated values available in 1990 could not be replaced by values from the Road-Building Authority until 1997. These were used for the evaluations in 2001. For the impervious coverage mapping projects in in 2005 and 2011, degrees of impervious coverage for streets, recorded by borough based on 2006 data, were obtained for the entire city (Gerstenberg & Goedecke 2011). A slight increase in the degree of impervious coverage attributable to the streets category and caused by road-building measures, primarily in East Berlin, certainly seems plausible.
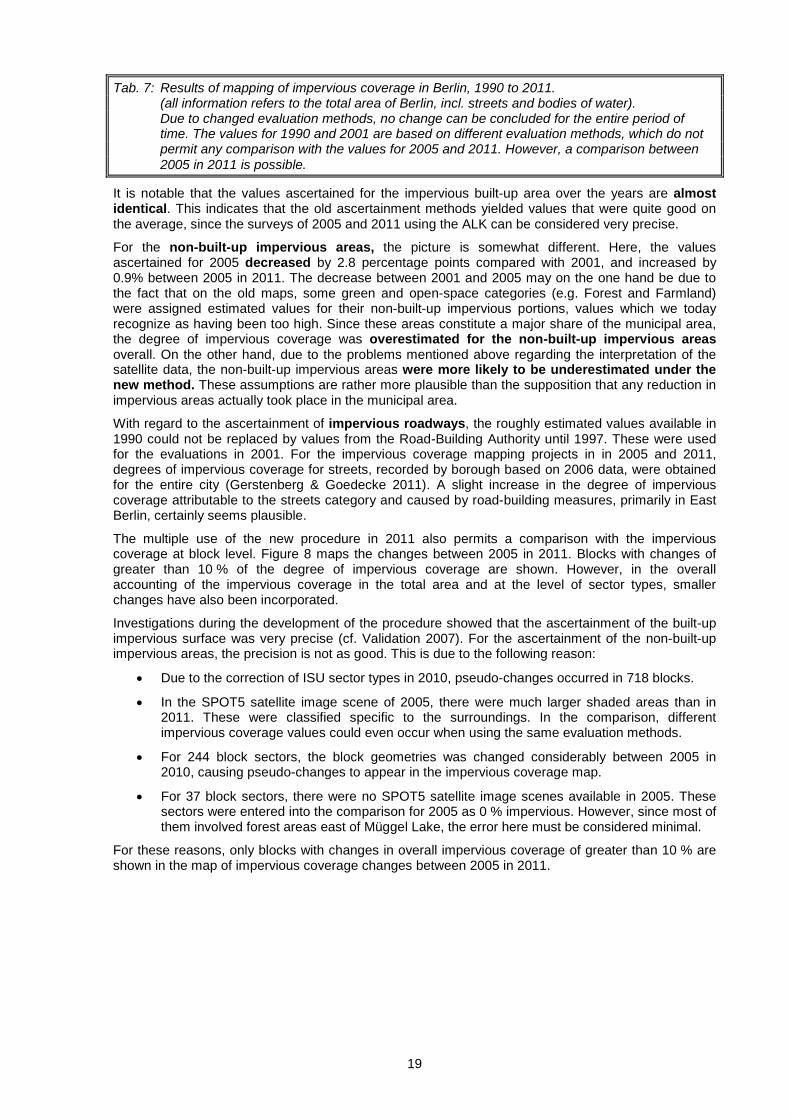
The multiple use of the new procedure in 2011 also permits a comparison with the impervious coverage at block level. Figure 8 maps the changes between 2005 in 2011. Blocks with changes of greater than 10 % of the degree of impervious coverage are shown. However, in the overall accounting of the impervious coverage in the total area and at the level of sector types, smaller changes have also been incorporated.
Investigations during the development of the procedure showed that the ascertainment of the built-up impervious surface was very precise (cf. Validation 2007). For the ascertainment of the non-built-up impervious areas, the precision is not as good. This is due to the following reason:
• Due to the correction of ISU sector types in 2010, pseudo-changes occurred in 718 blocks.
• In the SPOT5 satellite image scene of 2005, there were much larger shaded areas than in 2011. These were classified specific to the surroundings. In the comparison, different impervious coverage values could even occur when using the same evaluation methods.
• For 244 block sectors, the block geometries was changed considerably between 2005 in 2010, causing pseudo-changes to appear in the impervious coverage map.
• For 37 block sectors, there were no SPOT5 satellite image scenes available in 2005. These sectors were entered into the comparison for 2005 as 0 % impervious. However, since most of them involved forest areas east of Müggel Lake, the error here must be considered minimal.
For these reasons, only blocks with changes in overall impervious coverage of greater than 10 % are shown in the map of impervious coverage changes between 2005 in 2011.

20
Figure 8: Map of Changes in Impervious Coverage between 2005 in 2011
Excursus Comparison of the impervious coverage data for 2011 and 2005 with the Impervious Coverage Indicator of the Working Group on Integrated Environmental and Economic Accounting of the German States (EEAL; Ger.: UGRdL)
The impervious coverage value for Berlin of the Working Group on Integrated Environmental and Economic Accounting of the German States (EEAL), developed by the Federal-State Commission on Soil Protection (LABO) on the bases of the sustainability indicator “land consumption for residential/ commercial and traffic areas”, is now juxtaposed to the results of the Environmental Atlas.
The data survey of degrees of impervious coverage by state is based on official land statistics, in which estimated degrees of impervious coverage are assigned to various use categories of residential/ commercial and traffic areas, modified in accordance with residential density of the areas, and then used as a factor in calculation. In this way, impervious coverage data can be generated on an annual basis. The data on development of impervious coverage in the states are updated annually (EEAL 2010).
Accordingly, the proportion of impervious coverage in the total area of Berlin rose from 34.24 % in 2000 to 35.10 % in 2010, and thus increased by 0.86 % in 10 years, which comes to an annual rate of

21
increase of 0.09 %. The absolute increase in impervious coverage was thus 770 ha during that ten-year period.
Figure 9 shows the rate of impervious coverage of the Environmental Atlas in 2005 and 2011, compared with the annually generated data of the EEAL.
Neither approach ascertains impervious coverage precisely; both work with different methods and different goals, and, to a certain extent, with estimates and assumptions, and are thus ultimately estimation methods.
While the EEAL approach gives the current (2010) overall impervious coverage of Berlin as 35.1 %, the Environmental Atlas mapped only 32.8 % of the city as impervious in 2011.
Under the procedure of the Environmental Atlas, the built-up impervious coverage area was derived directly from the ALK, and hence has a very high degree of precision, while the non-built-up impervious coverage area, as described above, is determined from satellite imagery. Hence, the above-mentioned error sources must be methodologically taken into account.
By contrast, the EEAL approach operates from the outset with estimates for certain use classes, which are moreover nationally uniform, and hence do not take regional particularities into account. For instance, the elimination of the area of Tempelhof Airport for the category of traffic areas at the time of its closure led to a change in the statistical situation, in spite of the fact that nothing changed in real life.
Figure 9: Degrees of impervious coverage shown in the Environmental Atlas, 2005 in 2011 Editions, compared with the annually generated data of the EEAL.
For political decision-making, other impervious coverage data can also be used. The impervious coverage data of the EEAL is collected annually according to a fixed, nationally uniform comparison method, and is thus best suited for monitoring, and ultimately, too, has been developed precisely for that purpose. Due to the ability to differentiate between built-up impervious areas, non-built-up impervious areas, and impervious street surfaces, the Environmental Atlas figures complement and modify the figures of the EEAL data. For built-up impervious surfaces, a very high degree of precision can be assumed.
Literature [1] AGU Arbeitsgemeinschaft Umweltplanung 1988:
Extrapolation and incorporation of the impervious-coverage map of the Environmental Atlas into the spatial reference system of the Berlin Ecological Planning Instrument (ÖPB), by order of the Berlin Senate Department for Urban Development and the Environment, not published.
22
[2] AGU Arbeitsgemeinschaft Umweltplanung 1991: Fortschreibung der ökologischen Planungsgrundlagen Berlin: Erstellung der Umweltatlaskarten 06.01 Reale Nutzung der bebauten Flächen, 06.02 Grün- und Freiflächenbestand, 01.02 Versiegelung (einschließlich Bebauungsgrad) für das Stadtgebiet der östlichen Bezirke und Integration in das Umweltinformationssystem (UIS) [Updating of the ecological planning basis for Berlin: Publication of Environmental Atlas Maps 06.01 Real Use of Built-Up Surfaces, 06.02 Inventory of Green and Open Spaces, 01.02 Impervious Coverage, including proportion of built-up areas) for the area oft he eastern boroughs, and integration into the Environmental Information System (UIS)], assigned by the Berlin Senate Department for Urban Development and the Environment, unpublished.
[3] BBodSchG,1998: Bundes-Bodenschutzgesetz (Federal Soil Protection Law).
[4] Berliner Wasserbetriebe (BWB) 1998: Getrenntes Entgelt für Schmutz- und Niederschlagswasser ab dem Jahr 2000. Anschreiben an die Eigentümer im September 1998. Berlin (Water-utility notice to customers in 1998: Separate invoicing of waste and precipitation water as from 2000)
[5] Coenradie, B.; Haag, L., Damm, A.; Kleinschmit, B.; Hostert, P. 2007: Hauptstudie „Entwicklung und Umsetzung eines hybriden Verfahrensansatzes zur Versiegelungskartierung in Berlin“. (Final report of a study by the Berlin Department of Urban Development: “Development and implementation of a pilot hybrid method for mapping of impervious soil coverage in Berlin”). (ed.). Download (pdf; 6,6 MB)�
[6] Coenradie, B.; Haag, L. 2012: Versiegelungskartierung Berlin – Anwendung und Weiterentwicklung des hybriden Auswertungsverfahrens für das Jahr 2011 sowie Kartierung von Veränderungen. Abschlussbericht. (Mapping of impervious coverage in Berlin: application and further development of the hybrid evaluation procedure for 2011, and the mapping of changes , final report) Berlin Senate Department for Urban Development (ed.). Download (pdf; 5,6 MB)�
[7] Die Bundesregierung 2007: Nachhaltige Entwicklung. (Federal Government Sustainable Development paper) Internet: http://www.bundesregierung.de (accessed July 30, 2007).
[8] Frie, B; Hensel, R. 2007: Schätzverfahren zur Bodenversiegelung: UGRdL-Ansatz (The estimation procedure for impervious soil: The EEAL approach). In: Statistische Analysen und Studien NRW, Vol 44, pp. 19 ff.: Internet: http://www.ioer-monitor.de/fileadmin/user_upload/monitor/DFNS/2009_1_DFNS/Buchbeitraege/IOER_DFNS_I_2009_S_17-45_PDFA.pdf (accessed February 04, 2019)
[9] Geiger, W.F. 1992: Regenwasserbehandlungskonzept für Neuplanungen im nördlichen Einzugsgebiet von Panke, Nordgraben, Gutachten im Auftrag der Berliner Wasser-Betriebe, (Rainwater treatment concept for new planning in the northern catchment area of the Panke and the North Ditch, report by order of the Berlin Water Utility), not published.
[10] Gerstenberg, J.H.; Goedecke, M. 2011: Datengrundlagen aus dem Informationssystem Stadt und Umwelt für das Niederschlags - Abflussmodell ABIMO der Bundesanstalt für Gewässerkunde (Database from the city and environment information system for the ABIMO precipitation and run off model of the German Federal Institute of Hydrology (BfG) Berlin Senate Department for Urban Development), 2008, as of March 31, 2011.
[11] Haag, L. 2006: Wie hoch sind die Versiegelungsgrade in Berlin wirklich? - Ein Methodenvergleich (How high is the degree of impervious coverage in Berlin really?, Univ. thesis, Berlin Univ. of Tech.), Internet: https://www.geoinformation.tu-berlin.de/fileadmin/fg242/Diplomarbeiten/Diplomarbeit_Haag.pdf
23
[12] Haag, L.; Coenradie, B.; Kleinschmit, B.; Damm, A.; Hostert, P.; Goedecke, M.; Schneider, T. 2008: Hybrides Kartierungsverfahren der Bodenversiegelung im urbanen Raum – das Ergebnis für Berlin (Hybrid Mapping Method of Impervious Soil Coverage in Urban Areas - the Result for Berlin) Bodenschutz. Ausgabe 3/2008. S. 82-87. Internet: https://www.bodenschutzdigital.de/ce/hybrides-kartierungsverfahren-der-bodenversiegelung-im-urbanen-raum-das-ergebnis-fuer-berlin/detail.html
[12] Mählenhoff, S. 1989: Ökologische Folgen der Bodenversiegelung, in: Mitteilungen der Niedersächsischen Naturschutzakademie (Ecological impacts of impervious coverage) Apr. 1991, pp. 6-16.
[13] Niederschlagswasserfreistellungsverordnung 2001: Verordnung über die Erlaubnisfreiheit für das schadlose Versickern von Niederschlagswasser (NWFreiV) (Berlin state ordinance on exemption from precipitation-water requirements) August 24, 2001. Internet: http://www.stadtentwicklung.berlin.de/service/gesetzestexte/de/umwelt/wasser.shtml)
[14] Oerder, M. 1999: Bundes-Bodenschutzgesetz. Gesetz zum Schutz vor schädlichen Bodenveränderungen und zur Sanierung von Altlasten. Kommentar von Oerder, M.; Numberger, U.; Schönfeld, T.. Boorberg. Stuttgart. (Commentary on above fed. Soil-protection law).
[15] Senatsverwaltung für Stadtentwicklung (SenStadt) 2001: Neuer Umgang mit Niederschlagswasser in Berlin. (Berlin brochure by Department for Urban Development: A new way of handling precipitation water)
[16] Senatsverwaltung für Stadtentwicklung (SenStadt) 2006: Statistik zu Befestigung und Fahrbahnbelägen Berliner Straßen, Rad- und Gehwege VI C 12 (As of Jan. 1, 2006; Department for Urban Development statistics on pavements types for walkways and bike paths).
[17] Statistical Offices of the German States 2011: Umweltökonomische Gesamtrechnungen der Länder (UGRdL/ EEAL): Inanspruchnahme der Umwelt durch Produktion und Konsum in den Bundesländern - Ausgewählte Indikatoren und Kennzahlen. Indikator Versiegelung: (Consumption of the environment through production and consumption in the German states – selected indicators and key figures. The indicator “impervious coverage”) source of information: http://www.ugrdl.de/veroeffentlichungen.htm
[18] Umweltbundesamt (Federal Environment Agency/ UBA) 2011: Flächeninanspruchnahme. September 2011. Internet: http://www.umweltbundesamt-daten-zur-umwelt.de/ umweltdaten/public/theme.do?nodeIdent=2898 (accessed Jan. 22, 2012).
[19] Wikipedia 2007: Internet: http://en.wikipedia.org/wiki/Normalized_Difference_Vegetation_Index (accessed Aug. 1, 2012).
[20] Wikipedia, 2012: Principle Component Analysis. http://en.wikipedia.org/wiki/Principal_component_analysis
[21] WTE 2012: WTE Group: http://www.wteb.info/english/home/index.html (accessed Aug. 1, 2012;).