00 - relazione 1 trimestre 2008 - copertina ing · operating performance 1st quarter 2008 5...
TRANSCRIPT

Quarterly Report First Quarter 2008

This Report has been translated into English from the original version in Italian. In case of doubt, the Italian version shall prevail. ________________________________________________________________________________________________ Date of issue: 24 April 2008 This Report is available on the Internet at the address: www.fiatgroup.com FIAT S.P.A. Registered Office at 250 via Nizza, Turin, Italy Share Capital €6,377,262,975 Registered in the Turin Companies Register – Tax Code 00469580013
Contents
1 Board of Directors and Auditors 2 Operating Performance 2 - Group Highlights
3 - Group Results for the First Quarter of 2008
5 - Operating Performance by Business
12 - Consolidated Statement of Cash Flows
13 - Consolidated Balance Sheet at 31 March 2008
15 - Industrial Activities and Financial Services
23 - Significant Events Occurring in the First Quarter of 2008
24 - Significant Events Occurring since the End of the Quarter and Business Outlook 25 Fiat Group - Interim Consolidated Financial Statements and Notes at March 31, 2008 26 - Consolidated Income Statement
27 - Consolidated Balance Sheet
28 - Consolidated Statement of Cash Flows
29 - Statement of Changes in Stockholders’ Equity
30 - Consolidated Statement of Recognised Income and Expense
31 - Notes

Operating Performance 1st Quarter 2008
1
Board of Directors and Auditors
Board of Directors
Chairman Luca Cordero di Montezemolo (4)
Vice Chairman John Elkann (1) (4)
Chief Executive Officer Sergio Marchionne (4)
Directors Andrea Agnelli Roland Berger (3) (4) Tiberto Brandolini d’Adda René Carron Luca Garavoglia (1) (3) Gian Maria Gros-Pietro (1) (2) Virgilio Marrone Vittorio Mincato (2) Pasquale Pistorio (4) Carlo Sant’Albano Ratan Tata Mario Zibetti (2) (3)
Secretary of the Board Franzo Grande Stevens
Board of Statutory Auditors
Statutory Auditors Carlo Pasteris – Chairman Giuseppe Camosci Cesare Ferrero
Alternate Auditors Giorgio Giorgi Piero Locatelli Roberto Lonzar
Independent Auditors Deloitte & Touche S.p.A.
(1) Member of the Nominating and Corporate Governance Committee
(2) Member of the Internal Control Committee
(3) Member of the Compensation Committee
(4) Member of the Strategic Committee

Operating Performance 1st Quarter 2008
2
Operating Performance Group Highlights
(€ millions) 1st Quarter
2008 1st Quarter
2007
Net revenues 15,025 13.676
Trading profit 766 595
Operating profit 783 595
Profit before taxes 636 574
Profit for the period 427 376
Profit attributable to equity holders of the Parent Company 405 358
(figures in €)
Basic earnings per ordinary share (1) 0.316 0.268
Basic earnings per preference share (1) 0.316 0.310
Basic earnings per savings share (1) 0.471 0.423
Diluted earnings per ordinary share (1) 0.314 0.267
Diluted earnings per preference share (1) 0.314 0.310
Diluted earnings per savings share (1) 0.469 0.422(1) See Note 12 of this Report for additional information on the calculation of basic and diluted earnings per share.
(€ millions) At
31.03.2008 At
31.12.2007
Total assets 58,540 60,136
Net (debt)/cash (11,975) (10,423)
- of which: Net industrial (debt)/cash (1,107) 355
Shareholders’ equity before minority interests 10,593 11,279
- of which: attributable to shareholders of the Parent Company 9,948 10,606 Number of employees at period end 190,208 185,227

Operating Performance 1st Quarter 2008
3
Note This report for the quarter ended 31 March 2008 has been prepared in accordance with Article 154-ter of Legislative Decree no. 58/1998 (Interim Management Statements) and the Issuers Regulation issued by Consob.
It also conforms with the requirements of the International Financial Reporting Standards (IFRS) issued by the International Accounting Standards Board (“IASB”) adopted by the European Union and has been prepared in accordance with IAS 34 - Interim Financial Reporting.
Group Results for the First Quarter of 2008 1st Quarter
(€ millions) 2008 2007
Net revenues 15,025 13,676Trading profit 766 595Operating profit 783 595Profit before taxes 636 574Profit for the period 427 376
Net revenues 1st Quarter
(€ millions) 2008 2007 % change
Automobiles (Fiat Group Automobiles, Maserati, Ferrari) 7,422 6,824 8.8
Agricultural and Construction Equipment (CNH - Case New Holland) 2,963 2,691 10.1Trucks and Commercial Vehicles (Iveco) 2,931 2,487 17.9
Components and Production Systems (FPT, Magneti Marelli, Teksid, Comau) 3,634 3,244 12.0Other Businesses (Publishing and Communications, Holding Companies and Other) 326 333 -2.1Eliminations (2,251) (1,903) -Total 15,025 13,676 9.9
Group revenues for the first quarter of 2008 totalled €15 billion, up 9.9% over the same period in 2007, with all industrial businesses contributing to the increase.
Continued success of new and existing models enabled Fiat Group Automobiles (FGA) to achieve growth, with a total of 563,600 units delivered during the quarter (+4.1% over the first quarter of 2007). Although overall demand in Western Europe was down, FGA reported notable year-over-year increases in Germany (+15%) and France (+27%), in addition to experiencing a record quarter in Brazil (+35%).
Agricultural and Construction Equipment (CNH) revenues were up 10.1% (25.9% in US dollar terms). The Sector’s global presence enabled it to capitalise on growth opportunities in international markets, offsetting declines in Construction Equipment in North America.
Trucks and Commercial Vehicles (Iveco) had record first quarter revenues, with the number of vehicles delivered up 21% over the prior year. 2007 new product launches ensured that the Sector could meet increased demand in the heavy vehicle range.
Components and Production Systems reported revenues of €3.6 billion for the quarter, representing a 12% increase over the first quarter of 2007. All Sectors experienced revenue growth, with FPT Powertrain Technologies up 16.4%, Magneti Marelli up 8.5% (+5.6% on a like-for-like basis), Teksid up 5.2% (+9.2% on a like-for-like basis) and Comau up 10%.

Operating Performance 1st Quarter 2008
4
Trading profit 1st Quarter
(€ millions) 2008 2007 Change
Automobiles (Fiat Group Automobiles, Maserati, Ferrari) 262 222 40
Agricultural and Construction Equipment (CNH - Case New Holland) 198 189 9
Trucks and Commercial Vehicles (Iveco) 222 150 72
Components and Production Systems (FPT, Magneti Marelli, Teksid, Comau) 108 83 25
Other Businesses (Publishing and Communications, Holding Companies and Other) and Eliminations (24) (49) 25
Total 766 595 171Trading margin (%) 5.1 4.4
Trading profit of €766 million (5.1% of revenues) rose nearly 29% over the €595 million reported for the first quarter of 2007 (4.4% of revenues).
FGA contributed trading profit of €193 million (2.8% of revenues), slightly higher than 2007 reported levels but up €81 million or 53% excluding one-off items.
CNH reported an increase of €9 million to €198 million (up 19.4% in US dollar terms). Margins were down 0.3 percentage points to 6.7% as a result of industrial inefficiencies caused by the rapid increase in demand for agricultural products.
Iveco posted another record first quarter trading profit, up 48% year-over-year to €222 million, representing a significant improvement in trading margin to 7.6% (from 6% for the first quarter of 2007).
Trading profit for the Components and Production Systems businesses totalled €108 million, for a trading margin of 3% (2.6% in the first quarter of 2007). The €25 million increase over the first three months of 2007 is due to improvements at Comau, which reported marginally positive trading profit compared with the trading loss of €26 million posted in the first quarter of 2007, and FPT Powertrain Technologies (+€3 million). Trading profit was flat at Magneti Marelli and down €5 million at Teksid (up €3 million on a like-for-like basis).
Operating profit Operating profit came in at €783 million for the quarter, and included net unusual income of €17 million, primarily arising from the release of provisions for risks and restructuring costs which are no longer required.
Profit for the period Net financial expense for the quarter totalled €210 million and included a €63 million charge for the marking to market of two stock-option related equity swaps. The equivalent item yielded income of €91 million in the first quarter of 2007, resulting in a year-over-year difference of €154 million. Excluding the impact of the equity swaps, net financial expense for the quarter was flat compared with the first quarter of 2007. The aggregate fair value for these equity swaps continues to be positive at quarter end.
Profit before taxes totalled €636 million, an increase of €62 million over the first quarter of 2007. Higher operating profit (+€188 million) and an increase in investment income (+€27 million) more than offset higher net financial expense.
Income taxes amounted to €209 million (€198 million in the first quarter of 2007), representing an effective tax rate of 32.9% (34.5% in the first quarter of 2007).
Net profit (before minority interests) for the first quarter of 2008 totalled €427 million, compared to €376 million for the same period in 2007.
Operating Performance 1st Quarter 2008
5
Operating Performance by Business
Automobiles
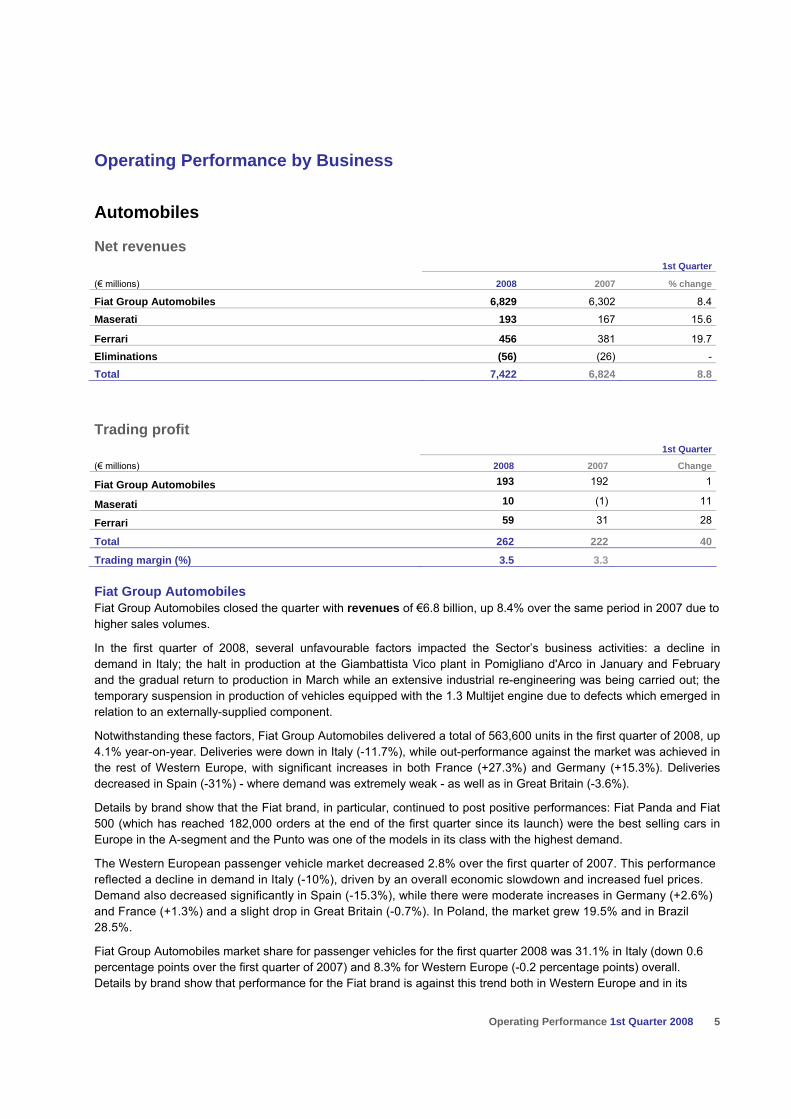
Net revenues 1st Quarter
(€ millions) 2008 2007 % change
Fiat Group Automobiles 6,829 6,302 8.4
Maserati 193 167 15.6
Ferrari 456 381 19.7Eliminations (56) (26) -Total 7,422 6,824 8.8
Trading profit 1st Quarter
(€ millions) 2008 2007 Change
Fiat Group Automobiles 193 192 1
Maserati 10 (1) 11
Ferrari 59 31 28
Total 262 222 40
Trading margin (%) 3.5 3.3
Fiat Group Automobiles Fiat Group Automobiles closed the quarter with revenues of €6.8 billion, up 8.4% over the same period in 2007 due to higher sales volumes.
In the first quarter of 2008, several unfavourable factors impacted the Sector’s business activities: a decline in demand in Italy; the halt in production at the Giambattista Vico plant in Pomigliano d'Arco in January and February and the gradual return to production in March while an extensive industrial re-engineering was being carried out; the temporary suspension in production of vehicles equipped with the 1.3 Multijet engine due to defects which emerged in relation to an externally-supplied component.
Notwithstanding these factors, Fiat Group Automobiles delivered a total of 563,600 units in the first quarter of 2008, up 4.1% year-on-year. Deliveries were down in Italy (-11.7%), while out-performance against the market was achieved in the rest of Western Europe, with significant increases in both France (+27.3%) and Germany (+15.3%). Deliveries decreased in Spain (-31%) - where demand was extremely weak - as well as in Great Britain (-3.6%).
Details by brand show that the Fiat brand, in particular, continued to post positive performances: Fiat Panda and Fiat 500 (which has reached 182,000 orders at the end of the first quarter since its launch) were the best selling cars in Europe in the A-segment and the Punto was one of the models in its class with the highest demand.
The Western European passenger vehicle market decreased 2.8% over the first quarter of 2007. This performance reflected a decline in demand in Italy (-10%), driven by an overall economic slowdown and increased fuel prices. Demand also decreased significantly in Spain (-15.3%), while there were moderate increases in Germany (+2.6%) and France (+1.3%) and a slight drop in Great Britain (-0.7%). In Poland, the market grew 19.5% and in Brazil 28.5%.
Fiat Group Automobiles market share for passenger vehicles for the first quarter 2008 was 31.1% in Italy (down 0.6 percentage points over the first quarter of 2007) and 8.3% for Western Europe (-0.2 percentage points) overall. Details by brand show that performance for the Fiat brand is against this trend both in Western Europe and in its

Operating Performance 1st Quarter 2008
6
home market, Italy, where its share increased 1.2 percentage points to 25.4%. Market share for the Lancia brand was substantially flat, while Alfa Romeo was heavily impacted by the closure of the Giambattista Vico plant.
In Brazil, the Sector continued to achieve outstanding levels of performance: deliveries for the quarter increased 34.7% over the first quarter of 2007 and its share of the passenger vehicle market rose 0.6 percentage points to 25.5%.
Light commercial vehicles also performed positively: a total of 105,300 units were delivered in the first quarter of 2008, an increase of 11.8% over the first quarter of 2007. In Western Europe, where the market contracted 1.7%, deliveries increased 9.9% to 65,300 units. New models such as the new Ducato, the new Scudo and the new Doblò contributed significantly to the performance of Fiat Professional. In addition, the new Fiorino Cargo was launched at the end of 2007. Fiat Professional’s market share was 11.5% for Western Europe overall (up 0.9 percentage points over the first quarter of 2007) and 42.4% in Italy (up 0.5% percentage points).
Fiat Group Automobiles achieved €193 million in trading profit (€192 million in the first quarter of 2007), while trading margin went from 3% to 2.8%. The first quarter of 2007 included a one-off gain of €40 million and the first quarter of 2008 included €40 million in lost absorption of fixed costs resulting from the temporary closure of the Giambattista Vico plant. Excluding these one-off items, trading profit in the first quarter 2008 would have been €233 million compared to €152 million, with margins improving to 3.4% from 2.4%. This improvement was principally attributable to an increase in volumes – especially from the Brazilian market - and an improved product mix – benefiting from the introduction of new models in 2007.
On the product side, the year started off with the world preview of four new models presented by Fiat Group Automobiles’ various brands at the Geneva Motor Show. First, a new car bearing an historic name, Delta, designed to begin the process of rebuilding the product portfolio for the Lancia brand. Then the limited production Alfa 8C Spider and the small but powerful 500 Abarth, equipped with 135 b.h.p., representing the second vehicle in the newly re-launched brand. Finally, the functional and versatile people mover, the Fiorino.
There were other new developments following the show in Geneva. Fiat Professional completed the Fiorino range with the Combi version, designed to transport both people and goods. Alfa Romeo previewed photos of the MiTo, the brand’s much awaited “junior” model - the “sportiest compact ever" - which will be officially presented in June and available for sale beginning in July.
The existing range of models on offer was further enhanced with the 2008 versions of the Sedici, Ulysse and Idea (Fiat) and the Ypsilon and Phedra (Lancia).
Maserati Maserati reported revenues of €193 million for the first quarter of 2008, up 15.6% over the corresponding period in 2007. This significant increase is mainly attributable to the excellent performance of the GranTurismo, which is selling well in all markets.
A total of 2,234 cars were delivered to the network during the quarter, up 21% year-on-year.
Trading profit for the quarter totalled €10 million, a sharp reversal over the €1 million loss reported for the corresponding period in 2007. Despite the significant impact of adverse currency movements, higher volumes and major cost efficiency gains enabled Maserati to repeat the positive results achieved in the second half of 2007.
One year after unveiling the GranTurismo, Maserati presented the GranTurismo S at the Geneva Motor Show in March. Equipped with a 440 b.h.p. 4.7 litre V-8 engine, this car is a captivating interpretation of Maserati’s sportiness.
Ferrari Ferrari reported revenues of €456 million for the first quarter of 2008, up 19.7% over the same period in 2007. The increase is mainly attributable to higher sales of the 612 Scaglietti and 599 GTB Fiorano models.
A total of 1,654 cars were delivered to the network during the quarter, a 4% increase over the first quarter of 2007, while sales to end-customers totalled 1,645 units (+1%).
Operating Performance 1st Quarter 2008
7
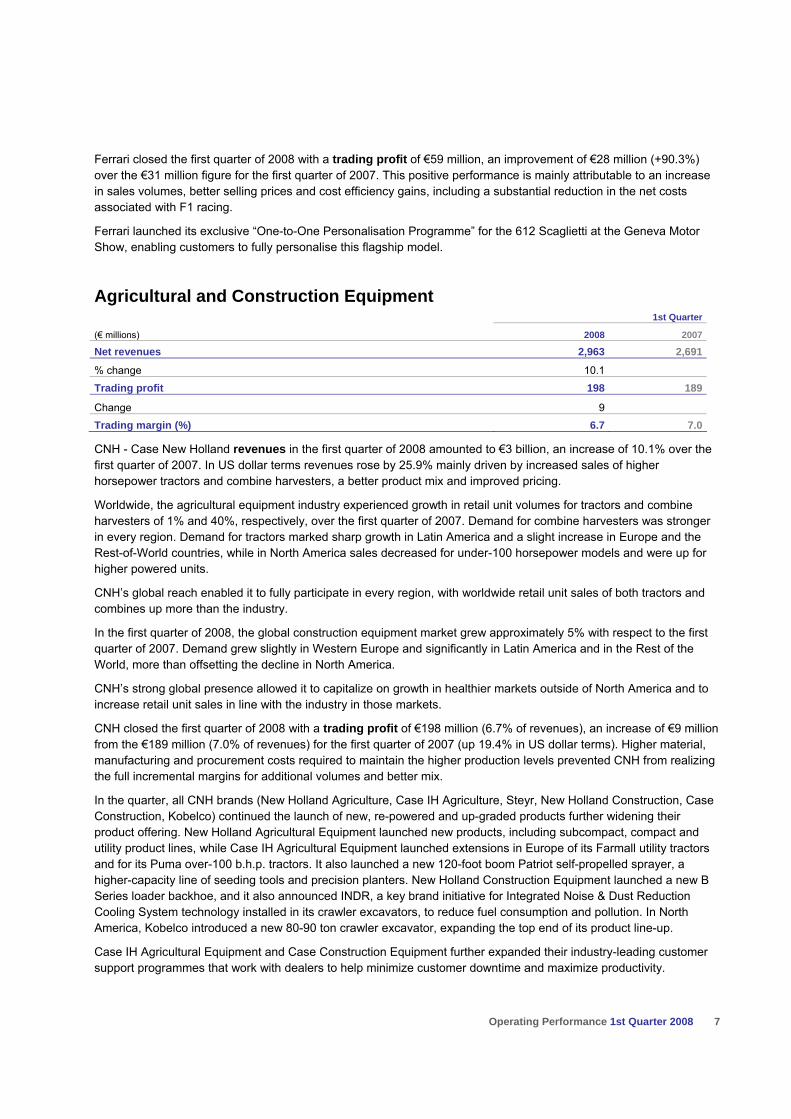
Ferrari closed the first quarter of 2008 with a trading profit of €59 million, an improvement of €28 million (+90.3%) over the €31 million figure for the first quarter of 2007. This positive performance is mainly attributable to an increase in sales volumes, better selling prices and cost efficiency gains, including a substantial reduction in the net costs associated with F1 racing.
Ferrari launched its exclusive “One-to-One Personalisation Programme” for the 612 Scaglietti at the Geneva Motor Show, enabling customers to fully personalise this flagship model.
Agricultural and Construction Equipment 1st Quarter
(€ millions) 2008 2007
Net revenues 2,963 2,691
% change 10.1 Trading profit 198 189
Change 9 Trading margin (%) 6.7 7.0
CNH - Case New Holland revenues in the first quarter of 2008 amounted to €3 billion, an increase of 10.1% over the first quarter of 2007. In US dollar terms revenues rose by 25.9% mainly driven by increased sales of higher horsepower tractors and combine harvesters, a better product mix and improved pricing.
Worldwide, the agricultural equipment industry experienced growth in retail unit volumes for tractors and combine harvesters of 1% and 40%, respectively, over the first quarter of 2007. Demand for combine harvesters was stronger in every region. Demand for tractors marked sharp growth in Latin America and a slight increase in Europe and the Rest-of-World countries, while in North America sales decreased for under-100 horsepower models and were up for higher powered units.
CNH’s global reach enabled it to fully participate in every region, with worldwide retail unit sales of both tractors and combines up more than the industry.
In the first quarter of 2008, the global construction equipment market grew approximately 5% with respect to the first quarter of 2007. Demand grew slightly in Western Europe and significantly in Latin America and in the Rest of the World, more than offsetting the decline in North America.
CNH’s strong global presence allowed it to capitalize on growth in healthier markets outside of North America and to increase retail unit sales in line with the industry in those markets.
CNH closed the first quarter of 2008 with a trading profit of €198 million (6.7% of revenues), an increase of €9 million from the €189 million (7.0% of revenues) for the first quarter of 2007 (up 19.4% in US dollar terms). Higher material, manufacturing and procurement costs required to maintain the higher production levels prevented CNH from realizing the full incremental margins for additional volumes and better mix.
In the quarter, all CNH brands (New Holland Agriculture, Case IH Agriculture, Steyr, New Holland Construction, Case Construction, Kobelco) continued the launch of new, re-powered and up-graded products further widening their product offering. New Holland Agricultural Equipment launched new products, including subcompact, compact and utility product lines, while Case IH Agricultural Equipment launched extensions in Europe of its Farmall utility tractors and for its Puma over-100 b.h.p. tractors. It also launched a new 120-foot boom Patriot self-propelled sprayer, a higher-capacity line of seeding tools and precision planters. New Holland Construction Equipment launched a new B Series loader backhoe, and it also announced INDR, a key brand initiative for Integrated Noise & Dust Reduction Cooling System technology installed in its crawler excavators, to reduce fuel consumption and pollution. In North America, Kobelco introduced a new 80-90 ton crawler excavator, expanding the top end of its product line-up.
Case IH Agricultural Equipment and Case Construction Equipment further expanded their industry-leading customer support programmes that work with dealers to help minimize customer downtime and maximize productivity.

Operating Performance 1st Quarter 2008
8
Trucks and Commercial Vehicles 1st Quarter
(€ millions) 2008 2007
Net revenues 2,931 2,487
% change 17.9
Trading profit 222 150
Change 72
Trading margin (%) 7.6 6.0
Iveco reported revenues of €2.9 billion for the quarter, a sharp increase (+17.9%) over 2007, resulting from higher sales volumes and increased prices.
58,050 vehicles were delivered during the period (up 21% year-on-year) of which 38,000 units were delivered in Western Europe (+10.3%). Significant increases were posted in Italy (+9.6%) and France (+19.2%) as a result of higher volumes in the light and heavy ranges. The increase in Great Britain (+50.6%) reflected higher volumes in all product categories. However, the volume of deliveries decreased in Germany (-9.2%), principally in the medium and heavy ranges, and in Spain (-5.3%) reflecting a general weakness in demand. For the Rest of the World, volumes continued to rise sharply in Eastern Europe (+39%) and Latin America (+30.5%).
In the first quarter of 2008, the Western European market for commercial vehicles (weight ≥ 2.8 tons) increased 3.3% over the first quarter of 2007. Demand in the light vehicle category was in line with the previous year, the medium range saw a modest 2.2% decrease and the heavy vehicle range experienced a healthy increase of 15.5% on the back of large order intakes for all manufacturers during 2007. Demand rose in all major European markets, except Spain (-18.4%) and Germany (where medium and heavy ranges declined by 12.2% and 5.5%, respectively), with significant increases in Great Britain (+15.7%) and France (+10.9%) which suffered large decreases in 2007.
Iveco's market share in Western Europe was 9.7% for the quarter (weight ≥ 2.8 tons), slightly down over the first quarter of 2007 (-0.5 percentage points) driven by a decision to protect margins. Light vehicles decreased by 0.5 percentage points; heavy vehicles were down by 0.4 percentage points, but significant performances were posted in Italy and in Germany. The medium vehicle range decreased by 0.9 percentage points overall, but there were increases in Germany. Significant increases were achieved in Eastern Europe and Brazil.
Trading profit for Iveco was €222 million (7.6% of revenues), a sharp improvement (up €72 million; +48%) over the €150 million level (6% of revenues) reported for the first quarter of 2007. The increase was mainly due to a sharp rise in sales volumes, better selling prices following the competitive repositioning of products and positive results in the heavy vehicle range in Eastern Europe and Latin America.
At the Samoter trade show in Verona in March, Iveco presented the Massif, which represents the Sector’s debut in the light off-road segment. Designed by Giugiaro and offered in short and long wheel base versions with different configurations, the Massif is a “4x4” based on a traditional off-road sport design intended for professional use.
Renewal of the Iveco range followed with the preview of the new Eurocargo, which retains the heritage of the vehicle launched in 1991 of which more than 400,000 units have been sold. It is expected that the 2008 Eurocargo will surpass this number following the complete redesign of the interior and exterior, transmission and the fact that it comes fully equipped with electronic controls. The outstanding range of Tector engines has been installed in the new Eurocargo, offering power, reliability and low operating costs. These engines are also compliant with the new Euro 5 environmental regulations (which come into effect in 2009).

Operating Performance 1st Quarter 2008
9
Components and Production Systems
Net revenues 1st Quarter
(€ millions) 2008 2007 % change
FPT Powertrain Technologies 1,988 1,708 16.4Components (Magneti Marelli) 1,332 1,228 8.5
Metallurgical Products (Teksid) 223 212 5.2
Production Systems (Comau) 252 229 10.0Eliminations (161) (133) -Total 3,634 3,244 12.0
Trading profit 1st Quarter
(€ millions) 2008 2007 Change
FPT Powertrain Technologies 47 44 3Components (Magneti Marelli) 45 45 -Metallurgical Products (Teksid) 15 20 -5Production Systems (Comau) 1 (26) 27Total 108 83 25Trading margin (%) 3.0 2.6
FPT Powertrain Technologies FPT Powertrain Technologies reported revenues of €2 billion for the first quarter of 2008, up 16.4% over the first quarter of 2007. Sales to customers outside the Group and to joint ventures accounted for 23% of revenues for the quarter (27% for the first quarter of 2007).
The Passenger & Commercial Vehicles product line closed the quarter with revenues of €998 million (+6.8%), 80% of which represented intra-group sales. A total of 688,000 engines (+8.6%) and 575,000 transmissions (+14.9%) were sold during the quarter.
Industrial & Marine reported revenues of €991 million, up 29.1% over the first quarter of 2007, which came primarily from sales to Group companies. A total of 160,000 engines were sold - up 27.5% - mainly to Iveco (44%), CNH (22%) and Sevel (23%), a joint venture for the production of light commercial vehicles. In addition, 38,000 transmissions (+17.3%) and 90,000 axles (+16.7%) were sold.
Trading profit totalled €47 million for the quarter, against €44 million for the first quarter of 2007. Trading profit benefited from higher volumes and increased efficiencies in both purchasing and manufacturing, but was negatively impacted by costs associated with the faulty production of 1.3 Multijet engines as a result of a defective externally provided component.
During the quarter, FPT continued development of the new gasoline-powered engines which are to be offered in the coming months (principally the 1.8 direct injection engine with double various valve timing). The new development in diesel engines, on the other hand, is the launch of production of the F1C 3-litre 146 and 176 b.h.p. engines to be mounted on Iveco’s new off-road, the Massif. For CNH Off Road vehicles, production of the new NEF Tier 3 motors for application on dozers (4- & 6-cylinder Common Rail engines ranging from 60 to 74 kW) and the first Common Rail Tier 3 application for wheel loaders (a 101 kW, 4-cylinder engine) was launched. In the automotive area, the first application of the new 1.6 litre 105 b.h.p. and 120 b.h.p. engine, which complies with the new Euro 5 emission standards (effective in 2009) was offered beginning January (on the Fiat Bravo). Finally, in Japan the Fiat 500 with the C514 – a 5-speed automated manual transmission - was launched.

Operating Performance 1st Quarter 2008
10
Magneti Marelli Magneti Marelli reported €1.3 billion in revenues for the first quarter of 2008, up 8.5% over the same period in 2007. Excluding the After Market Parts and Services business – consolidated as of May 2007 – revenues increased 5.6% on the back of strong results in Brazil, Poland and Germany.
For the Lighting business, increased sales to external customers in Germany, Fiat in Brazil, and overall increases in sales in Turkey and China compensated for the effects of the temporary closure of the Giambattista Vico plant and the negative trend in NAFTA markets. Engine Control reported an increase in revenues driven by positive results in Europe and Brazil, while there was a contraction in the US market. Revenues were stable for the Suspension Systems business: the negative impact of the production shutdown at Pomigliano was offset by higher sales of products for Fiat models in Poland and Italy, in addition to the significant growth in the Brazilian market. An increase in revenues for the Exhaust Systems and Shock Absorbers businesses was primarily driven by sales to Fiat in Poland and Brazil. The Electronic Systems business closed the first quarter of 2008 with revenues substantially in line with the first quarter of 2007: there were increases in sales of the Blue&Me system for the main Fiat models and instrument panels to external customers, while revenues from high-tech telematics experienced a decrease due to a change in product mix.
Magneti Marelli reported €45 million in trading profit for the first quarter, in line with the figure for the first quarter of 2007. The effect of higher sales volumes was offset by the negative impact of the production shutdown at the Pomigliano plant, the launch of a new range of in-car communication and information products and additional costs, for the Lighting business, related to production start-up for a number of new products at the end of 2007. Optimisation of overheads and efficiency gains compensated for continued competitive pressure on selling prices and increases in raw material costs.
During the quarter, production commenced on 23 new products involving all business lines. The main products were: headlamps and rearlamps for Audi, the CAD 241 Euro 5 manifold for the 1.9 JTD engine, the new Power-shock shock absorbers and exhaust systems for the 1.6 MDE (Medium Diesel Engine).
Teksid Teksid reported revenues of €223 million for the first quarter of 2008, up 5.2% over the first quarter of 2007. Excluding revenues from the Aluminium business unit – consolidated as of September 2007 – and the impact of the sale of the Magnesium business at the beginning of March 2007, the percentage increase jumps to 9.2%. Volumes increased for the Cast Iron business unit (+3.6%) with higher sales in Brazil and Europe, which were partially offset by the negative sales trend in North America.
Teksid closed the quarter with trading profit of €15 million (vs. €20 million for the first quarter of 2007), including the €6 million trading loss reported by Teksid Aluminum. Excluding the impact of changes in the scope of operations, there was a €3 million improvement in trading profit.
Comau Comau had revenues of €252 million in the first quarter of 2008, up 10% compared with the first quarter of 2007. The increase is principally attributable to body-welding operations in Europe, with adverse currency movements having a moderately negative impact.
Order intake for the period totalled €376 million, slightly lower than in the first quarter of 2007. At 31 March 2008, the order backlog totalled €613 million, a 5% increase over the figure reported at the end of 2007.
First quarter trading profit totalled €1 million, in contrast to the €26 million trading loss reported for the corresponding period in 2007. The improvement is mainly attributable to body-welding operations in Europe and South Africa and the effects of the reorganization and restructuring process initiated in the second half of 2006.

Operating Performance 1st Quarter 2008
11
Other Businesses
Net revenues 1st Quarter
(€ millions) 2008 2007 % changePublishing and Communications (Itedi) 84 100 -16.0Holding Companies and Other 242 233 3.9Total 326 333 -2.1
Trading profit 1st Quarter
(€ millions) 2008 2007 Change
Publishing and Communications (Itedi) - -
Holding Companies, Other and Eliminations (24) (49) 25Total (24) (49) 25
Itedi First quarter revenues of €84 million for Itedi, represented a 16% decrease over the first quarter of 2007. Revenues were down at both Publikompass, as a result of lower revenues from newspaper advertising, and Editrice La Stampa, mainly due to reduced sales of optional add-on products.
Trading profit was at break even, in line with the result for the first quarter of 2007. The decrease in revenues was compensated by cost containment measures in production and marketing at Editrice La Stampa and a reduction in structural overheads for Publikompass.
Holding Companies and Other For the first quarter of 2008, the trading loss for the remaining businesses, together with eliminations and consolidation adjustments, was €25 million lower than the first quarter of 2007, primarily due to a reduction in the non-cash cost of stock option plans.

Operating Performance 1st Quarter 2008 12
Consolidated Statement of Cash Flows The consolidated statement of cash flows forms part of the Interim Consolidated Financial Statements. A condensed version and comments are provided below.
(€ millions) 1st Quarter 2008 1st Quarter 2007
A) Cash and cash equivalents at beginning of period (reported) 6,639 7,736
Cash and cash equivalents included under Assets held for sale 2 5
B) Cash and cash equivalents at beginning of period (adjusted) 6,641 7,741
C) Net cash from/(used in) operating activities (488) 712
D) Net cash from/(used in) investing activities (1,373) (652)
E) Net cash from/(used in) financing activities (103) (530)
Currency translation differences (146) 3
F) Net change in cash and cash equivalents (2,110) (467)
G) Cash and cash equivalents at end of period 4,531 7,274
of which: Cash and cash equivalents included under Assets held for sale 1 2
H) Cash and cash equivalents at end of period (reported) 4,530 7,272
In the first quarter of 2008, operating activities absorbed €488 million in cash, due to a seasonal increase in working capital of €1,319 million (calculated on a comparable scope of operations and at the same exchange rates), net of income related cash inflows of €831 million (calculated as net profit plus amortisation and depreciation, dividends, changes in provisions and items related to sales with buy-back commitments, net of gains/losses on disposals and other non-cash items).
Cash used in investing activities totalled €1,373 million. Excluding the decrease in other current securities (€42 million), cash used in investing activities totalled €1,415 million.
Investments in tangible assets (including investments in vehicles for long-term rental of €56 million) and intangible assets (including capitalised development costs for €198 million) totalled €672 million.
Investments (€177 million) principally refer to the purchase of an engine production facility in Brazil and the recapitalisation of certain other investments.
In the first quarter of 2008, proceeds from the sale of non-current assets totalled €66 million and mainly relate to the sale of tangible and intangible assets, including vehicles for long-term rental activities.
The increase in receivables from financing activities (€596 million) is principally attributable to growth in financing extended by the financial services companies of CNH - Case New Holland (driven by higher business volumes and seasonality), Iveco (mainly related to increased financing of sales in Eastern Europe) and, to a lesser extent, Fiat Group Automobiles.
Cash used in financing activities totalled €103 million, mostly attributable to share buy-backs of €177 million, offset only in part by new medium- to long-term bank loans.
Operating Performance 1st Quarter 2008 13
Consolidated Balance Sheet at 31 March 2008 At 31 March 2008, Total Assets amounted to €58,540 million, a decrease of €1,596 million from €60,136 million at 31 December 2007.
Assets held for sale (€55 million) relate primarily to the Fiat Group Automobiles, CNH – Case New Holland, Iveco and Production Systems businesses.
In the first three months of 2008, Non-current assets decreased by €251 million. Property, plant and equipment decreased by €186 million, approximately €100 million of which is due to currency translation differences and the remainder being the net difference between investments, depreciation and disposals (mainly vehicles with buy-back commitments sold by Iveco). Intangible assets decreased by €195 million, and €160 million of that decrease is due to currency translation differences (mainly relating to CNH goodwill). Investments and other financial assets increased by €121 million, mainly relating to the acquisition of an engine production activity which has not yet been consolidated.
At 31 March 2008, receivables from financing activities totalled €12,316 million, an increase of €48 million over 31 December 2007. Net of currency translation differences and impairment losses, the increase amounted to €596 million.
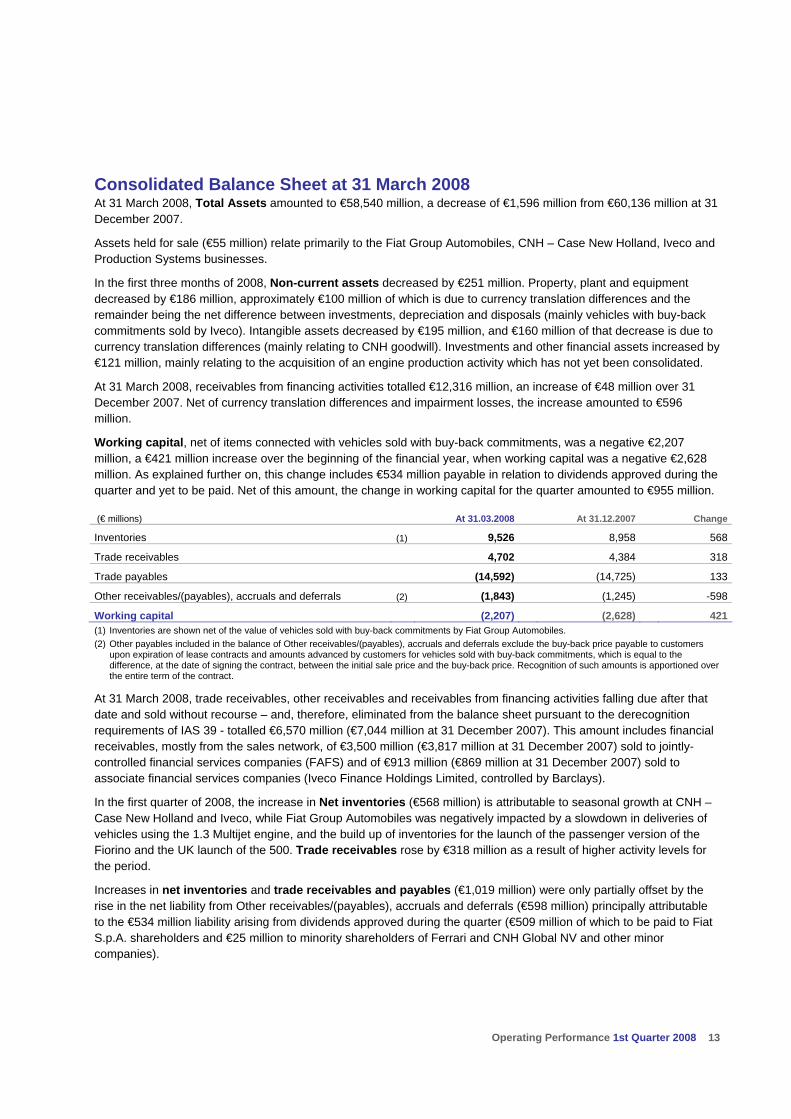
Working capital, net of items connected with vehicles sold with buy-back commitments, was a negative €2,207 million, a €421 million increase over the beginning of the financial year, when working capital was a negative €2,628 million. As explained further on, this change includes €534 million payable in relation to dividends approved during the quarter and yet to be paid. Net of this amount, the change in working capital for the quarter amounted to €955 million.
(€ millions) At 31.03.2008 At 31.12.2007 Change
Inventories (1) 9,526 8,958 568
Trade receivables 4,702 4,384 318
Trade payables (14,592) (14,725) 133
Other receivables/(payables), accruals and deferrals (2) (1,843) (1,245) -598
Working capital (2,207) (2,628) 421(1) Inventories are shown net of the value of vehicles sold with buy-back commitments by Fiat Group Automobiles. (2) Other payables included in the balance of Other receivables/(payables), accruals and deferrals exclude the buy-back price payable to customers
upon expiration of lease contracts and amounts advanced by customers for vehicles sold with buy-back commitments, which is equal to the difference, at the date of signing the contract, between the initial sale price and the buy-back price. Recognition of such amounts is apportioned over the entire term of the contract.
At 31 March 2008, trade receivables, other receivables and receivables from financing activities falling due after that date and sold without recourse – and, therefore, eliminated from the balance sheet pursuant to the derecognition requirements of IAS 39 - totalled €6,570 million (€7,044 million at 31 December 2007). This amount includes financial receivables, mostly from the sales network, of €3,500 million (€3,817 million at 31 December 2007) sold to jointly-controlled financial services companies (FAFS) and of €913 million (€869 million at 31 December 2007) sold to associate financial services companies (Iveco Finance Holdings Limited, controlled by Barclays).
In the first quarter of 2008, the increase in Net inventories (€568 million) is attributable to seasonal growth at CNH – Case New Holland and Iveco, while Fiat Group Automobiles was negatively impacted by a slowdown in deliveries of vehicles using the 1.3 Multijet engine, and the build up of inventories for the launch of the passenger version of the Fiorino and the UK launch of the 500. Trade receivables rose by €318 million as a result of higher activity levels for the period.
Increases in net inventories and trade receivables and payables (€1,019 million) were only partially offset by the rise in the net liability from Other receivables/(payables), accruals and deferrals (€598 million) principally attributable to the €534 million liability arising from dividends approved during the quarter (€509 million of which to be paid to Fiat S.p.A. shareholders and €25 million to minority shareholders of Ferrari and CNH Global NV and other minor companies).

Operating Performance 1st Quarter 2008 14
At 31 March 2008, consolidated net debt (including debt reclassified under Assets/Liabilities held for sale) totalled €11,975 million, an increase of €1,552 million over the €10,423 million figure at 31 December 2007, principally attributable to seasonal growth in working capital for industrial activities as well as share buy-backs and investments.
(€ millions) At 31.03.2008 At 31.12.2007
Financial payables: (17,362) (17,951)
- Asset-backed financing (6,160) (6,820)
- Other (11,202) (11,131)Current financial receivables from jointly controlled financial services entities (a) 54 81
Financial payables net of intersegment balances and current financial receivables from jointly controlled financial services entities (17,308) (17,870)
Other financial assets (b) 845 703
Other financial liabilities (b) (291) (188)
Other current securities 248 291
Cash and cash equivalents 4,530 6,639
Cash and cash equivalents included under Assets held for sale 1 2
Net (debt)/Cash (11,975) (10,423)
- Industrial Activities (1,107) 355
- Financial Services (10,868) (10,778)(a) Includes current financial receivables from the joint-venture Fiat Group Automobiles Financial Services (FAFS). (b) Includes assets and liabilities related to recognition of derivative financial instruments at fair value.
As at 31 March 2008, debt had decreased by €589 million. Net of currency translation differences (resulting in a decrease of approximately €720 million), the increase of approximately €130 million is attributable to higher bank loans and other debt, which were only partially offset by lower levels of asset-backed financing (approximately €250 million net of currency translation differences).
Liquidity (cash, cash equivalents and current securities - including €1 million reclassified under Assets held for sale) totalled €4,779 million at 31 March 2008, a €2,153 million decrease over the €6,932 million figure at 31 December 2007.
At 31 March 2008, cash and cash equivalents included €734 million (€530 million at 31 December 2007) specifically allocated to debt servicing for securitisation vehicles, mainly recognised under Asset-backed financing.
Headcount At 31 March 2008, the Group had 190,208 employees, 4,981 more than the 185,227 figure at 31 December 2007. The increase is attributable to new hires, principally blue-collar workers to meet increased production volumes. The most significant increases were in Latin America and Poland.

Operating Performance 1st Quarter 2008 15
Industrial Activities and Financial Services The following is a breakdown of the consolidated income statement, balance sheet and statement of cash flows between the Group’s Industrial Activities and Financial Services. Financial Services include the retail financing, leasing and rental companies of CNH-Case New Holland, Iveco, Fiat Group Automobiles and Ferrari. It should be noted that Financial Services activities also includes FAFS (the joint venture between Fiat Group Automobiles and Crédit Agricole) and Iveco Finance Holdings Limited (the joint venture between Iveco and Barclays) which are accounted for under the equity method.
Basis of analysis The separation between Industrial Activities and Financial Services is made by preparing specific sub-consolidated financial statements on the basis of the normal business performed by each Group company.
Investments held by companies belonging to one activity segment in companies included in another segment are accounted for using the equity method.
To avoid a misleading presentation of net profit, investments accounted for in this manner are classified in the income statement under Result from intersegment investments.
The Holding companies (Fiat S.p.A., FGI – Fiat Group International SA, Fiat Partecipazioni S.p.A., Fiat Netherlands Holding N.V.) are classified under Industrial Activities.
The sub-consolidated financial statements of Industrial Activities also include companies that perform centralised treasury activities (i.e., securing financial resources in the market and financing Group companies). These activities do not include provision of financing to third parties.

Operating Performance 1st Quarter 2008 16
Operating Performance by Activity Segment 1st Quarter 2008 1st Quarter 2007
(€ millions) Consolidated Industrial Activities
Financial Services Consolidated
Industrial Activities
Financial Services
Net revenues 15,025 14,800 347 13,676 13,431 328Cost of sales 12,617 12,510 229 11,479 11,352 210Selling, general and administrative 1,300 1,254 46 1,255 1,215 40Research and development 383 383 - 374 374 -Other income/(expense) 41 36 5 27 29 (2)Trading profit 766 689 77 595 519 76Gains/(losses) on disposal of investments 2 2 - 44 44 -Restructuring costs (4) (4) - 15 15 -Other unusual income/(expense) 11 11 - (29) (29) -Operating Profit 783 706 77 595 519 76Financial income/(expense) (210) (210) - (57) (57) -Result from investments (*) 63 44 19 36 20 16Profit before taxes 636 540 96 574 482 92Income taxes 209 183 26 198 172 26Profit for the period 427 357 70 376 310 66Income/(loss) from intersegment investments - 70 3 - 66 -Profit for the period 427 427 73 376 376 66 (*) This item includes income from investments as well as writedowns and upward adjustments on non-intersegment investments accounted for using
the equity method.
Industrial Activities In the first quarter of 2008, net revenues for Industrial Activities totalled €14,800 million, an increase of 10.2% over the corresponding period of the previous year. This change is principally due to higher volumes at Fiat Group Automobiles (8.5%), Iveco (19%) and CNH – Case New Holland (10.7%; 26.5% in US dollar terms) as well as at the Components and Production Systems businesses (12%), which all posted increases.
In the first quarter of 2008, Industrial Activities had a trading profit of €689 million, an improvement of €170 million with respect to the €519 million recorded in the first quarter of 2007. A significant portion of the improvement is attributable to Iveco (+48%), the Automobiles businesses (+17.8%) and Comau, which reported a marginally positive trading profit as compared with a trading loss of €26 million in the first quarter of 2007. CNH – Case New Holland trading profit rose 8.9% (+24.8% in US dollar terms).
Industrial Activities had operating profit of €706 million, compared with €519 million for the corresponding period of 2007. The €187 million increase mainly reflects higher trading profit.
Financial Services In the first quarter of 2008, net revenues of Financial Services totalled €347 million, an increase of approximately 6% over the corresponding period of 2007. The increase at Iveco (+14.8%) and CNH – Case New Holland (+6.4%) was partially offset by a 9.1% decrease in revenues for the Financial Services activities of Fiat Group Automobiles.

Operating Performance 1st Quarter 2008 17
In the first quarter of 2008, Fiat Group Automobiles Financial Services had revenues of €30 million, compared with €33 million for the first quarter of 2007, due to a contraction in supplier financing.
The Financial Services activities of the Agricultural and Construction Equipment Sector had revenues of €284 million. The 6.4% increase was due to growth in the managed portfolio, partially offset by currency translation differences. In US dollar terms, the increase was 21.7%.
Iveco’s Financial Services activities had revenues of €31 million, compared with €27 million in the first quarter of 2007. The increase was due to the positive performance of financial services in Eastern Europe, offset only in part by a contraction in rental activities. In the first quarter of 2008, trading profit totalled €77 million, virtually flat over the first quarter of 2007.
The Financial Services activities of Fiat Group Automobiles and Iveco reported trading profit of €10 million and €3 million, respectively, in line with the first quarter of 2007.
Trading profit for the Financial Services activities of CNH – Case New Holland (€64 million) decreased €2 million over the €66 million figure for the first quarter of 2007. In US dollar terms, trading profit rose 9.2% as a result of higher business levels.
1st Quarter
(€ millions) 2008 2007 % change
Fiat Group Automobiles 30 33 -9.1Ferrari 2 1 n.s.Agricultural and Construction Equipment (CNH - Case New Holland) 284 267 6.4Trucks and Commercial Vehicles (Iveco) 31 27 14.8Total 347 328 5.8
1st Quarter
(€ millions) 2008 2007 Change
Fiat Group Automobiles 10 9 1Ferrari - (1) 1Agricultural and Construction Equipment (CNH - Case New Holland) 64 66 -2Trucks and Commercial Vehicles (Iveco) 3 2 1Total 77 76 1

Operating Performance 1st Quarter 2008 18
Balance Sheet by Activity Segment At 31.03.2008 At 31.12.2007
(€ millions) ConsolidatedIndustrial Activities
Financial Services Consolidated
Industrial Activities
Financial Services
Intangible assets 6,328 6,231 97 6,523 6,420 103Property, plant and equipment 11,060 11,054 6 11,246 11,239 7Investment property 6 6 - 10 10 -Investments and other financial assets 2,335 3,799 1,004 2,214 4,339 918Leased assets 386 9 377 396 8 388Defined benefit plan assets 31 29 2 31 29 2Deferred tax assets 1,915 1,727 188 1,892 1,708 184Total Non-current Assets 22,061 22,855 1,674 22,312 23,753 1,602Inventories 10,570 10,490 80 9,990 9,929 61Trade receivables 4,702 4,718 272 4,384 4,444 324Receivables from financing activities 12,316 5,932 12,098 12,268 4,606 12,211Other receivables: 2,881 2,769 140 3,203 3,052 177- Current taxes receivable 902 893 13 1,153 1,141 14- Other 1,979 1,876 127 2,050 1,911 163Accrued income and prepaid expenses 309 294 15 241 224 17Current financial assets 1,116 968 148 1,016 845 171- Current investments 23 23 - 22 22 -- Current other securities 248 110 138 291 136 155- Other financial assets 845 835 10 703 687 16Cash and cash equivalents 4,530 3,385 1,145 6,639 5,546 1,093Total Current Assets 36,424 28,556 13,898 37,741 28,646 14,054Assets held for sale 55 51 4 83 83 -TOTAL ASSETS 58,540 51,462 15,576 60,136 52,482 15,656Total Assets adjusted for asset-backed financing transactions 52,380 50,800 10,063 53,316 51,799 9,507Shareholders’ Equity 10,593 10,593 2,399 11,279 11,279 2,486Provisions: 7,978 7,792 186 8,562 8,369 193- Employee benefits 3,338 3,325 13 3,597 3,581 16- Other provisions 4,640 4,467 173 4,965 4,788 177Financial payables 17,362 10,747 12,398 17,951 10,706 12,351- Asset-backed financing 6,160 662 5,513 6,820 683 6,149- Other debt 11,202 10,085 6,885 11,131 10,023 6,202Other financial liabilities 291 219 72 188 153 35Trade payables 14,592 14,551 331 14,725 14,751 361Other payables: 6,440 6,353 113 6,120 5,990 153- Current taxes payable 459 434 29 631 571 62- Other 5,981 5,919 84 5,489 5,419 91Deferred tax liabilities 194 191 3 193 193 -Accrued expenses and deferred income 1,082 1,008 74 1,083 1,006 77Liabilities held for sale 8 8 - 35 35 -TOTAL SHAREHOLDERS' EQUITY AND LIABILITIES 58,540 51,462 15,576 60,136 52,482 15,656Total Liabilities adjusted for asset-backed financing transactions 52,380 50,800 10,063 53,316 51,799 9,507

Operating Performance 1st Quarter 2008 19
Net Debt by Activity Segment At 31.03.2008 At 31.12.2007
(€ millions) ConsolidatedIndustrial Activities
Financial Services Consolidated
Industrial Activities
Financial Services
Financial payables: (17,362) (10,747) (12,398) (17,951) (10,706) (12,351)
- Asset-backed financing (6,160) (662) (5,513) (6,820) (683) (6,149)
- Other (11,202) (10,085) (6,885) (11,131) (10,023) (6,202)
Current financial payables from jointly controlled financial services entities (a) 54 54 - 81 81 -
Intersegment financial receivables - 5,474 309 - 4,762 344Financial payables net of intersegment balances and current financial receivables from jointly controlled financial services entities (17,308) (5,219) (12,089) (17,870) (5,863) (12,007)
Other financial assets (b) 845 835 10 703 687 16
Other financial liabilities (b) (291) (219) (72) (188) (153) (35)
Other current securities 248 110 138 291 136 155
Cash and cash equivalents 4,530 3,385 1,145 6,639 5,546 1,093
Cash and cash equivalents included under Assets held for sale 1 1 - 2 2 -
Net (debt)/Cash (11,975) (1,107) (10,868) (10,423) 355 (10,778)(a) This item includes current financial receivables payable to Fiat Group companies by the FAFS Group. (b) Includes assets and liabilities related to recognition of derivative financial instruments at fair value.
“Financial payables” for Industrial Activities consists partially of funding raised by the central treasury management and transferred to financial services companies in support of their activity (shown under the item “Intersegment financial receivables”).
“Intersegment financial receivables” under Financial Services represent loans or advances to industrial companies, resulting from the sale of receivables by industrial companies to financial services companies – where such transactions do not meet the requirements of IAS 39 for recognition of those sales – as well as any temporary cash deposits with the central treasury management.
At 31 March 2008, “Cash and cash equivalents” include €734 million (€530 million at 31 December 2007) mainly attributable to financial services companies, allocated to debt servicing for securitisation vehicles included under “Asset-backed financing”.
At 31 March 2008, net debt for the financial services companies showed an increase of €90 million over 31 December 2007, principally from the approximate €600 million increase in the portfolios of CNH-Case New Holland and Iveco and €56 million in investments for the period (mainly in vehicles leased out under operating leases), offset only in part by positive operating performance (approximately €18 million) and currency translation differences (approximately €600 million).
Operating Performance 1st Quarter 2008 20
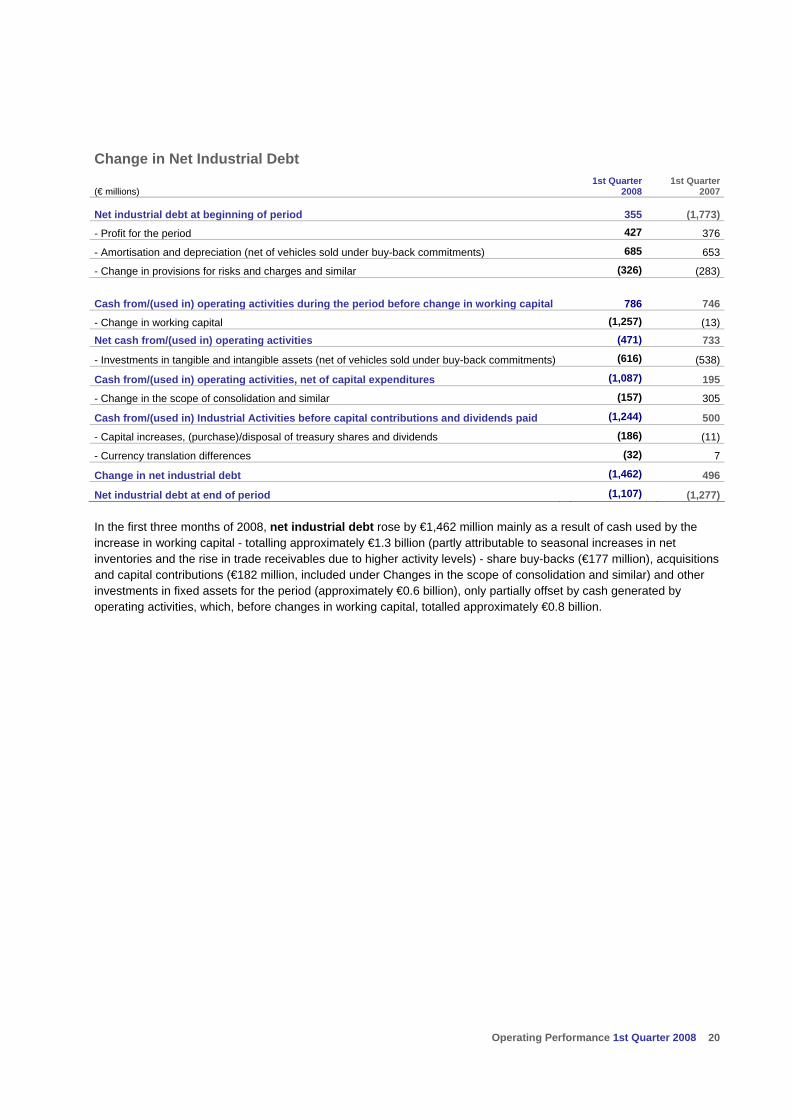
Change in Net Industrial Debt
(€ millions) 1st Quarter
2008 1st Quarter
2007
Net industrial debt at beginning of period 355 (1,773)
- Profit for the period 427 376
- Amortisation and depreciation (net of vehicles sold under buy-back commitments) 685 653
- Change in provisions for risks and charges and similar (326) (283)
Cash from/(used in) operating activities during the period before change in working capital 786
746
- Change in working capital (1,257) (13)
Net cash from/(used in) operating activities (471) 733
- Investments in tangible and intangible assets (net of vehicles sold under buy-back commitments) (616) (538)
Cash from/(used in) operating activities, net of capital expenditures (1,087) 195
- Change in the scope of consolidation and similar (157) 305
Cash from/(used in) Industrial Activities before capital contributions and dividends paid (1,244) 500
- Capital increases, (purchase)/disposal of treasury shares and dividends (186) (11)
- Currency translation differences (32) 7
Change in net industrial debt (1,462) 496
Net industrial debt at end of period (1,107) (1,277)
In the first three months of 2008, net industrial debt rose by €1,462 million mainly as a result of cash used by the increase in working capital - totalling approximately €1.3 billion (partly attributable to seasonal increases in net inventories and the rise in trade receivables due to higher activity levels) - share buy-backs (€177 million), acquisitions and capital contributions (€182 million, included under Changes in the scope of consolidation and similar) and other investments in fixed assets for the period (approximately €0.6 billion), only partially offset by cash generated by operating activities, which, before changes in working capital, totalled approximately €0.8 billion.
Operating Performance 1st Quarter 2008 21
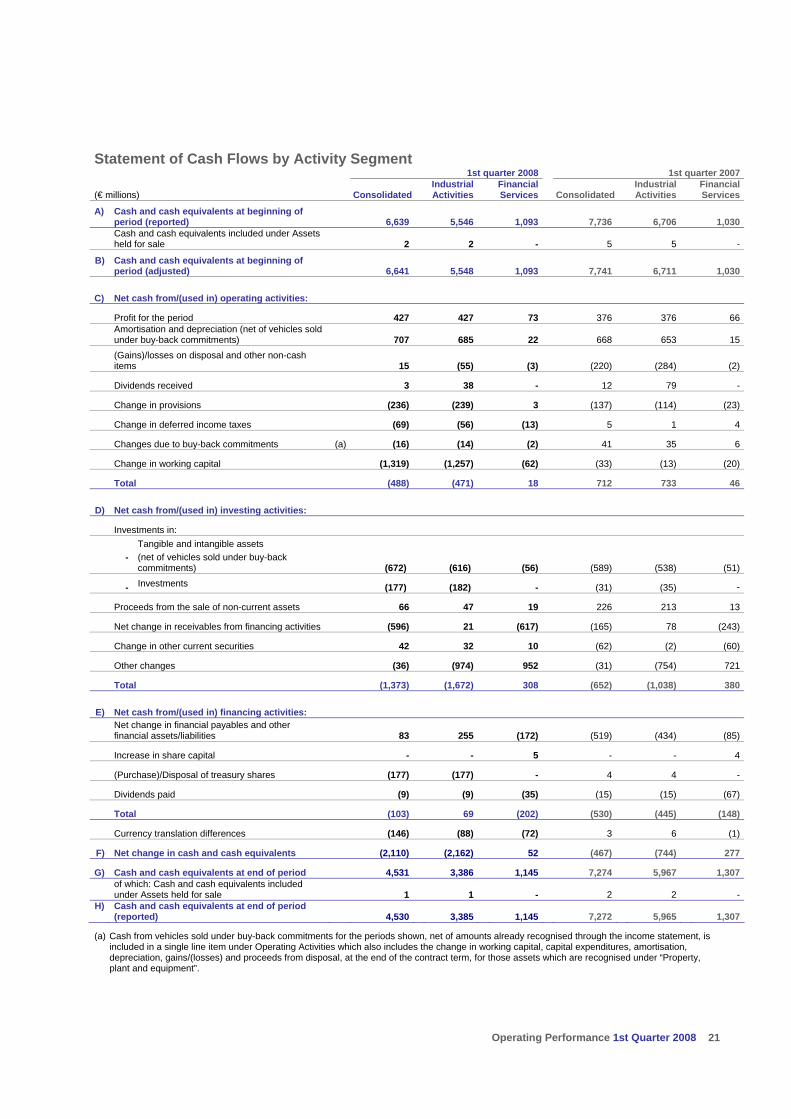
Statement of Cash Flows by Activity Segment 1st quarter 2008 1st quarter 2007
(€ millions) Consolidated Industrial Activities
Financial Services Consolidated
Industrial Activities
Financial Services
A)
Cash and cash equivalents at beginning of period (reported) 6,639 5,546 1,093 7,736 6,706 1,030
Cash and cash equivalents included under Assets held for sale 2 2 - 5 5 -
B)
Cash and cash equivalents at beginning of period (adjusted) 6,641 5,548 1,093 7,741 6,711 1,030
C) Net cash from/(used in) operating activities:
Profit for the period 427 427 73 376 376 66
Amortisation and depreciation (net of vehicles sold under buy-back commitments) 707 685 22 668 653 15
(Gains)/losses on disposal and other non-cash items 15 (55) (3) (220) (284) (2)
Dividends received 3 38 - 12 79 -
Change in provisions (236) (239) 3 (137) (114) (23)
Change in deferred income taxes (69) (56) (13) 5 1 4
Changes due to buy-back commitments (a) (16) (14) (2) 41 35 6
Change in working capital (1,319) (1,257) (62) (33) (13) (20)
Total (488) (471) 18 712 733 46
D) Net cash from/(used in) investing activities:
Investments in:
-
Tangible and intangible assets (net of vehicles sold under buy-back commitments) (672) (616) (56) (589) (538) (51)
- Investments (177) (182) - (31) (35) -
Proceeds from the sale of non-current assets 66 47 19 226 213 13
Net change in receivables from financing activities (596) 21 (617) (165) 78 (243)
Change in other current securities 42 32 10 (62) (2) (60)
Other changes (36) (974) 952 (31) (754) 721
Total (1,373) (1,672) 308 (652) (1,038) 380
E) Net cash from/(used in) financing activities:
Net change in financial payables and other financial assets/liabilities 83 255 (172) (519) (434) (85)
Increase in share capital - - 5 - - 4
(Purchase)/Disposal of treasury shares (177) (177) - 4 4 -
Dividends paid (9) (9) (35) (15) (15) (67)
Total (103) 69 (202) (530) (445) (148)
Currency translation differences (146) (88) (72) 3 6 (1)
F) Net change in cash and cash equivalents (2,110) (2,162) 52 (467) (744) 277
G) Cash and cash equivalents at end of period 4,531 3,386 1,145 7,274 5,967 1,307
of which: Cash and cash equivalents included under Assets held for sale 1 1 - 2 2 -
H)
Cash and cash equivalents at end of period (reported) 4,530 3,385 1,145 7,272 5,965 1,307
(a) Cash from vehicles sold under buy-back commitments for the periods shown, net of amounts already recognised through the income statement, is included in a single line item under Operating Activities which also includes the change in working capital, capital expenditures, amortisation, depreciation, gains/(losses) and proceeds from disposal, at the end of the contract term, for those assets which are recognised under “Property, plant and equipment”.

Operating Performance 1st Quarter 2008 22
Industrial Activities In the first three months of 2008, Industrial Activities absorbed cash and cash equivalents totalling €2,162 million and in particular:
Operating activities generated a net cash outflow of €471 million. The increase in working capital which, on a comparable scope of consolidation and at constant exchange rates, amounted to €1,257 million was offset only in part by income related cash inflow (net profit plus amortisation and depreciation), net of gains/(losses) on disposal and other non-cash items, changes in provisions, deferred taxes and items relating to the sale of vehicles with buy-back commitments, of €748 million – in addition to dividends received of €38 million.
Investing activities absorbed a total of €1,672 million in cash. €47 million generated by the sale of non-current assets only partly offset the funding requirement for investments made during the period (€798 million including equity investments) and the increase in funding provided to the Group’s financial services companies by central treasury management companies (including under Other changes).
Financing activities provided cash inflows of €69 million. The financing requirement related to share buy-backs were largely offset by an increase in borrowing from banks.
Financial Services Cash and cash equivalents for Financial Services activities at 31 March 2008 totalled €1,145 million, up €52 million over 31 December 2007.
Changes in cash during the first three months of 2008 derive from:
Operating activities which generated €18 million in cash, principally from income related cash inflow (net income plus amortisation and depreciation).
Investing activities (including changes in financial receivables from/payables to Group industrial companies) which generated €308 million in cash. In particular, the item Other changes includes funding provided by central treasury management companies (included among industrial companies), in support of their activity which more than offset requirements resulting from net growth in the receivables portfolio (€617 million) and investments (€56 million), mainly related to vehicles leased out under operating leases.
Financing activities which absorbed a total of €202 million in cash, €172 million of which mainly due to the decrease in asset-backed financing.
Operating Performance 1st Quarter 2008 23
Significant Events Occurring in the First Quarter of 2008 In January, Magneti Marelli and Sumi Motherson Group signed an agreement to establish a joint venture in India for the production of lighting and engine control systems for automotive applications. These products will be distributed in the Indian market and to domestic and international automakers operating in India.
On 28 January, FPT Powertrain Technologies, the Region of Piedmont, Province of Biella and City of Verrone (in Biella) signed a Memorandum of Understanding relating to expansion of the plant in Verrone, where a new transmission - the C635 - designed for use in mid-size autos will be produced. There will be three versions: Manual, Dual Dry Clutch and robotized. The amount to be invested by FPT Powertrain Technologies is estimated at around €500 million, including fixed assets and R&D costs and should enable production capacity of approximately 800,000 transmissions annually to be reached by 2012. Once fully operational, employment at the plant could reach 1,100, representing an increase of 600 employees over the current level.
In February, Fiat Group Automobiles announced its decision to produce a new model - to replace the current Lancia Ypsilon - at the Termini Imerese plant beginning in the second half of 2009.
Magneti Marelli consolidated its presence in India with the signing of two 50/50 joint venture agreements with SKH Metals Limited and SKH Sheet Metal Components Limited (both part of the Krishna Group) for the production of automotive exhaust systems. The plant to be established jointly with SKH Metals Limited will be located in Mannesar (40 km south-west of New Delhi). It will design and produce components for automotive exhaust systems for Suzuki Maruti India Limited and other companies in the Suzuki Motor Corporation Group. The plant established jointly with SKH Sheet Metal Components Limited will be located at Pune in the western Indian region of Maharashtra, where it will be strategically located for the design, production, testing and supply of exhaust systems to Fiat and Tata and to other automotive manufacturers operating in the south-west of India.
In March, FPT Powertrain Technologies acquired 100% of the Tritec Motors plant located in Campo Largo (Paraná, Brazil) from Chrysler L.L.C. This acquisition - which includes the land, industrial facilities, production lines and license to build existing products – represents a total investment, including additional development costs, of 250 million Brazilian reais (approximately €83 million). At this plant, one of the most modern engine production facilities in the world, FPT will produce a new range of mid-size engines in both gasoline and flex-fuel versions. As a result of the acquisition by FPT Powertrain Technologies, approximately 500 direct new jobs and 1,500 indirect jobs will be created.
On March 3, 2008, the plant in Pomigliano d'Arco (renamed Giambattista Vico), was reopened, concluding the intensive extraordinary re-engineering of the site, where €70 million was invested in providing a significant technological update. This investment was accompanied by large-scale training for employees and an additional €40 million in costs related to the shutdown in production (from 7 January to 2 March 2008) necessary for implementation of the project.
During the Annual Meeting of Shareholders held on 31 March, in which the 2007 Financial Statements were approved, the authorisation for the purchase (for the next 18 months) and sale of own shares was renewed. Under the new authorisation, an aggregate total of shares, for all three classes combined, representing a maximum of 10% of share capital or a purchase value of €1.8 billion - including the €0.6 billion in Fiat shares already held by the Company - may be purchased.

Operating Performance 1st Quarter 2008 24
Significant Events Occurring since the End of the Quarter and Business Outlook
No significant events have occurred since the balance sheet date.
* * * * * * *
The sound results for the first quarter provide a solid foundation for the Group’s commitment to growth and margin expansion over the 2008-10 period.
Current trading conditions in some product markets and some geographies have weakened during the quarter, especially in terms of passenger car demand in Western Europe and construction equipment in the North American market. The Group is also beginning to experience weakness in the truck market in some European geographies, notably Spain. Notwithstanding these slowdowns, we believe that our portfolio of activities will enable us to offset the associated negative impact on profits, and we are therefore confirming our 2008 Group objectives:
Group sales well in excess of €60 billion:
Group trading profit between €3.4 and €3.6 billion;
Net profit between €2.4 and €2.6 billion;
Earnings per share between €1.90 and €2.00.
In addition, notwithstanding seasonal working capital usage which may impact quarterly reported net indebtedness data, the Group is confirming a minimum cash generation of €1.1 billion for the year, yielding an expected Net Industrial Cash position of €1.5 billion by year end (excluding the impact of additional share buy-backs).
While working on the achievement of these objectives, the Fiat Group will continue to implement its strategy of targeted alliances, in order to optimise capital commitments and reduce risks.

Fiat Group Interim Consolidated Financial Statements and Notes at March 31, 2008 25
Fiat Group
Interim Consolidated Financial Statements and Notes at March 31, 2008
Fiat Group Interim Consolidated Financial Statements and Notes at March 31, 2008 26
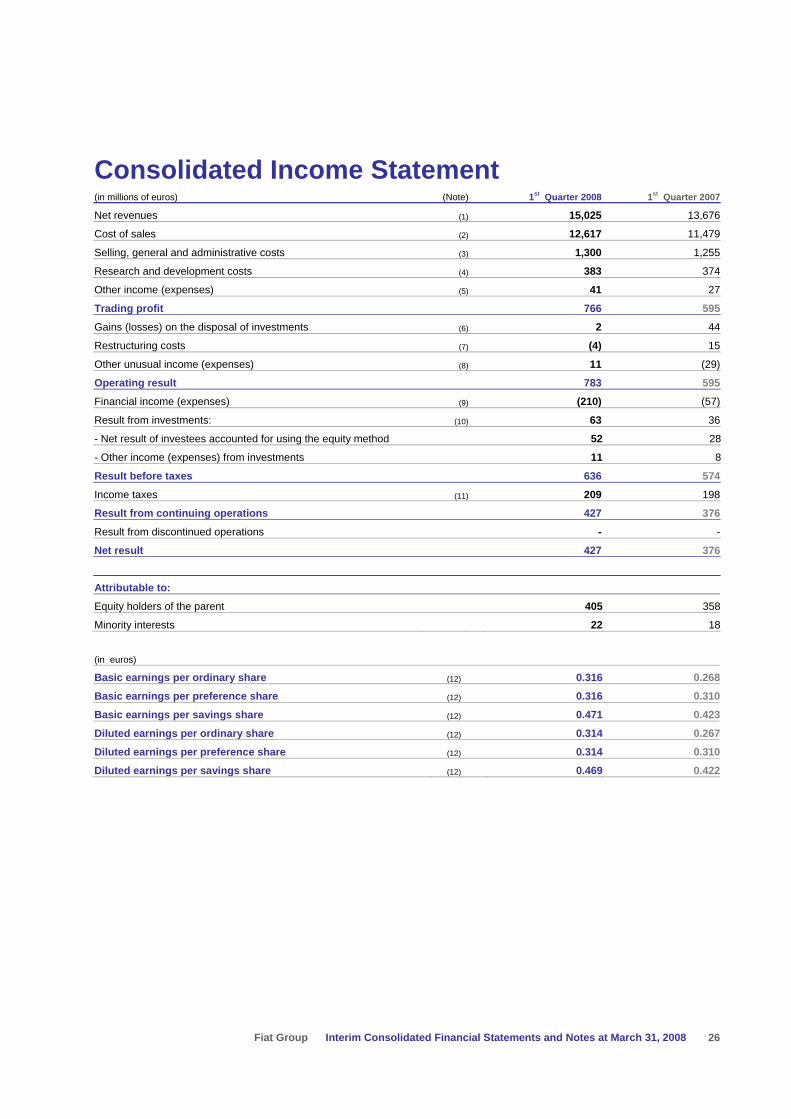
Consolidated Income Statement (in millions of euros) (Note) 1st Quarter 2008 1st Quarter 2007
Net revenues (1) 15,025 13,676
Cost of sales (2) 12,617 11,479
Selling, general and administrative costs (3) 1,300 1,255
Research and development costs (4) 383 374
Other income (expenses) (5) 41 27
Trading profit 766 595
Gains (losses) on the disposal of investments (6) 2 44
Restructuring costs (7) (4) 15
Other unusual income (expenses) (8) 11 (29)
Operating result 783 595
Financial income (expenses) (9) (210) (57)
Result from investments: (10) 63 36
- Net result of investees accounted for using the equity method 52 28
- Other income (expenses) from investments 11 8
Result before taxes 636 574
Income taxes (11) 209 198
Result from continuing operations 427 376
Result from discontinued operations - -
Net result 427 376
Attributable to:
Equity holders of the parent 405 358
Minority interests 22 18 (in euros)
Basic earnings per ordinary share (12) 0.316 0.268
Basic earnings per preference share (12) 0.316 0.310
Basic earnings per savings share (12) 0.471 0.423
Diluted earnings per ordinary share (12) 0.314 0.267
Diluted earnings per preference share (12) 0.314 0.310
Diluted earnings per savings share (12) 0.469 0.422

Fiat Group Interim Consolidated Financial Statements and Notes at March 31, 2008 27
Consolidated Balance Sheet (in millions of euros) (Note) At March 31, 2008 At December 31, 2007
ASSETS
Intangible assets (13) 6,328 6,523
Property, plant and equipment (14) 11,060 11,246
Investment property 6 10
Investments and other financial assets: (15) 2,335 2,214
- Investments accounted for using the equity method 1,901 1,930
- Other investments and financial assets 434 284
Leased assets (16) 386 396
Defined benefit plan assets 31 31
Deferred tax assets (11) 1,915 1,892
Total Non-current assets 22,061 22,312
Inventories (17) 10,570 9,990
Trade receivables (18) 4,702 4,384
Receivables from financing activities (18) 12,316 12,268
Other receivables (18) 2,881 3,203
Accrued income and prepaid expenses 309 241
Current financial assets: 1,116 1,016
- Current investments 23 22
- Other current securities (19) 248 291
- Other financial assets (20) 845 703
Cash and cash equivalents (21) 4,530 6,639
Total Current assets 36,424 37,741
Assets held for sale (22) 55 83
TOTAL ASSETS 58,540 60,136
Total assets adjusted for asset-backed financing transactions 52,380 53,316
LIABILITIES
Stockholders' equity: (23) 10,593 11,279
- Stockholders' equity of the Group 9,948 10,606
- Minority interest 645 673
Provisions: (24) 7,978 8,562
- Employee benefits 3,338 3,597
- Other provisions 4,640 4,965
Debt: (25) 17,362 17,951
- Asset-backed financing 6,160 6,820
- Other debt 11,202 11,131
Other financial liabilities (20) 291 188
Trade payables (26) 14,592 14,725
Other payables (27) 6,440 6,120
Deferred tax liabilities (11) 194 193
Accrued expenses and deferred income (28) 1,082 1,083
Liabilities held for sale (22) 8 35
TOTAL STOCKHOLDERS' EQUITY AND LIABILITIES 58,540 60,136
Total liabilities adjusted for asset-backed financing transactions 52,380 53,316

Fiat Group Interim Consolidated Financial Statements and Notes at March 31, 2008 28
Consolidated Statement of Cash Flows (in millions of euros)
1st Quarter 2008
1st Quarter 2007
A) Cash and cash equivalents at beginning of period as reported 6,639 7,736 Cash and cash equivalents included as Assets held for sale 2 5
B) Cash and cash equivalents at beginning of period 6,641 7,741C) Cash flows from (used in) operating activities during the period: Net result 427 376 Amortisation and depreciation (net of vehicles sold under buy-back commitments) 707 668 (Gains) losses and other non-cash items 15 (220) Dividends received 3 12 Change in provisions (236) (137) Change in deferred income taxes (69) 5 Change in items due to buy-back commitments (a) (16) 41 Change in working capital (1,319) (33) Total (488) 712
D) Cash flows from (used in) investment activities:
Investments in:
- Tangible and intangible assets (net of vehicles sold under buy-back commitments) (672) (589) - Investments in consolidated subsidiaries and other investments (177) (31) Proceeds from the sale of non-current assets (net of vehicles sold under buy-back commitments) 66 226 Net change in receivables from financing activities (596) (165) Change in other current securities 42 (62) Other changes (36) (31) Total (1,373) (652)
E) Cash flows from (used in) financing activities:
Repayment of bonds - (21) Issuance of other medium-term borrowings 231 17 Repayment of other medium-term borrowings (82) (233) Net change in other financial payables and other financial assets/liabilities (66) (282) Treasury stock sales (buy-back) (177) 4 Dividends paid (9) (15) Total (103) (530) Translation exchange differences (146) 3F) Total change in cash and cash equivalents (2,110) (467)G) Cash and cash equivalents at end of period 4,531 7,274
of which: Cash and cash equivalents included as Assets held for sale 1 2H) Cash and cash equivalents at end of period as reported 4,530 7,272(a) The cash flows for the two periods generated by the sale of vehicles with a buy-back commitment net of the amount already included in the net
result, are included in operating activities for the period, in a single item which includes the change in working capital, capital expenditures, depreciation, gains and losses and proceeds form sales at the end of the contract term, relating to assets included in Property, plant and equipment.

Fiat Group Interim Consolidated Financial Statements and Notes at March 31, 2008 29
Statement of Changes in Stockholders’ Equity
(in millions of euros) Capital
stock
Treasury stock capital
reserves, earning
reserves
Income (expense)
recogniseddirectly
in equityMinorityinterest Total
Balance at December 31, 2006 6,377 2,459 526 674 10,036
Dividends - - - (15) (15)
Increase in reserve for share based payments - 19 - - 19
Net changes in Income (expenses) recognised directly in equity - - (26) 1 (25)
Other changes - 2 - (52) (50)
Net result - 358 - 18 376
Balance at March 31, 2007 6,377 2,838 500 626 10,341
(in millions of euros) Capital
stock
Treasury stock capital
reserves, earning reserves
Income (expense)
recognised directly in equity
Minority interest Total
Balance at December 31, 2007 6,377 3,848 381 673 11,279
Dividends distributed or to be distributed - (509) - (34) (543)
Increase in reserve for share based payments - 9 - - 9
Net changes in Income (expenses) recognised directly in equity - - (382) (23) (405)
Other changes - (181) - 7 (174)
Net result - 405 - 22 427
Balance at March 31, 2008 6,377 3,572 (1) 645 10,593
Fiat Group Interim Consolidated Financial Statements and Notes at March 31, 2008 30
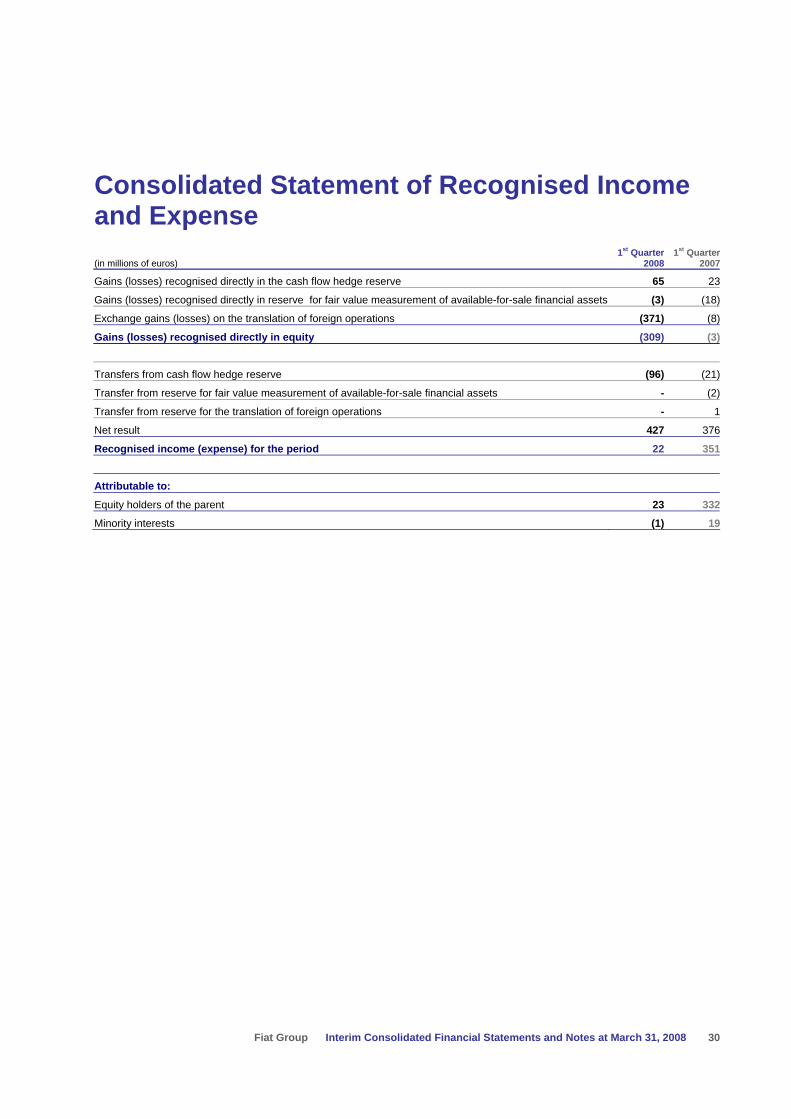
Consolidated Statement of Recognised Income and Expense
(in millions of euros) 1st Quarter
20081st Quarter
2007
Gains (losses) recognised directly in the cash flow hedge reserve 65 23
Gains (losses) recognised directly in reserve for fair value measurement of available-for-sale financial assets (3) (18)
Exchange gains (losses) on the translation of foreign operations (371) (8)
Gains (losses) recognised directly in equity (309) (3)
Transfers from cash flow hedge reserve (96) (21)
Transfer from reserve for fair value measurement of available-for-sale financial assets - (2)
Transfer from reserve for the translation of foreign operations - 1
Net result 427 376
Recognised income (expense) for the period 22 351
Attributable to:
Equity holders of the parent 23 332
Minority interests (1) 19

Fiat Group Interim Consolidated Financial Statements and Notes at March 31, 2008 31
Notes
Significant accounting policies
Accounting policies This quarterly report has been prepared in accordance with the International Financial Reporting Standards (IFRS) issued by the International Accounting Standards Board (IASB) endorsed by the European Union. The designation “IFRS” also includes all valid International Accounting Standards (IAS), as well as all interpretations of the International Financial Reporting Interpretations Committee (IFRIC), formerly the Standing Interpretations Committee (SIC).
This quarterly report has been prepared in accordance with IAS 34 - Interim Financial Reporting applying the same accounting principles and policies used in the preparation of the consolidated financial statements at December 31, 2007.
The preparation of the interim financial statements requires management to make estimates and assumptions that affect the reported amounts of revenues, expenses, assets, liabilities and disclosure of contingent assets and liabilities at the date of the interim financial statements. If in the future such estimates and assumptions, which are based on management’s best judgment at the date of the interim financial statements, deviate from the actual circumstances, the original estimates and assumptions will be modified as appropriate in the period in which the circumstances change. Moreover, these valuation procedures, in particular those of a more complex nature such as any loss in value of fixed assets, are only carried out in full during the preparation of the annual financial statements, when all the information required is available, other than in the event that there are indications of impairment, when an immediate assessment of any loss in value is necessary.
Income taxes are recognised based upon the best estimate of the weighted average income tax rate expected for the full financial year.
Accounting principles, amendments and interpretations not applicable and not early adopted by the Group On November 30, 2006, the IASB issued the IFRS 8 – Operating Segments that will become effective for the Group on January 1, 2009 and which will replace IAS 14 – Segment Reporting from that date. The new standard requires the information provided in segment reporting to be based upon the components of the entity that management uses to make decisions about operational matters. The standard requires these operating segments to be identified on the basis of internal reports that are regularly reviewed by an entity’s management in order to allocate resources to the segment and assess its performance. Adopting this standard will have no effect on the measurement of items in the financial statements.
On March 29, 2007 the IASB issued a revised IAS 23 – Borrowing costs. The standard shall be applied for annual period beginning after 1 January, 2009. The main change from the previous version is the removal of the option of immediately recognizing as an expense borrowing costs that relate to assets that take a substantial period of time to get ready for use or sale. The standard shall be applied to borrowing costs relating to qualifying assets for which the commencement date for capitalisation is on or after the 1 January 2009. At the date of this report this document has not yet been endorsed by the European Union.
On July 5, 2007 IFRIC issued the interpretation IFRIC 14 – IAS 19 – The Limit on a Defined Benefit Asset, Minimum Funding Requirements and their Interaction. The interpretation is mandatory from January 1, 2008. The interpretation provides general guidance on how to assess the limit in IAS 19 on the amount of the surplus that can be recognised as an asset. It also explains how the pension asset or liability may be affected when there is a statutory or contractual

Fiat Group Interim Consolidated Financial Statements and Notes at March 31, 2008 32
minimum funding requirement. At date of this report, this interpretation had not yet been endorsed by the European Union.
On September 6, 2007 the IASB issued a revised version of IAS 1 - Presentation of Financial Statements that is effective for annual periods beginning on or after 1 January 2009. The revised standard requires an entity to present changes in its equity resulting from transactions with owners in a statement of changes in equity. All non-owner changes (meaning changes in comprehensive income) are required to be presented either in a single statement of comprehensive income or in two statements (a separate income statement and a statement of comprehensive income). Transactions with non-owners may not be presented in the statement of changes in equity. This standard had not yet been endorsed by the European Union at the date of this report.
On January 10, 2008 the IASB issued a revised version of IFRS 3 – Business Combination and an amended version of IAS 27 - Consolidated and Separate Financial Statements. The main changes that revised IFRS 3 will make to existing requirements are the elimination of the need to measure at fair value every asset and liability at each step in a step acquisition for the purpose of calculating a portion of goodwill. Instead, goodwill will be measured as the difference at acquisition date between the value of any investment in the business held before the acquisition, the consideration transferred and the net assets acquired. Moreover, for a business combination in which the acquirer achieves control without purchasing all of the acquiree, the remaining (non-controlling) equity interests are measured either at fair value or by using the method already provided in IFRS 3. The revised IFRS 3 also requires acquisition related costs to be recognised as expenses and the acquirer to recognise the obligation to make an additional payment (contingent consideration) as part of the business combination. In the amended version of IAS 27, the IASB has added a requirement specifying that changes in a parent’s interest in a subsidiary that do not result in the loss of control must be accounted for as equity transactions and recognised within equity. Moreover when a parent loses control of a subsidiary but retains an ownership interest it must initially measure any retained investment at fair value. At the date when control is lost, the difference between the fair value and the carrying amount of the retained interest must be recognised in profit or loss. Finally, the amendment to IAS 27 requires losses pertaining to non-controlling interests to be allocated to non-controlling interest equity, even if this result in the non-controlling interest having a deficit balance. The new rules will apply prospectively from January 1, 2010. The amendment and the principle had not yet been endorsed by the European Union at the date of this report.
On January 17, 2008 the IASB issued an amendment to IFRS 2 - Vesting Conditions and Cancellations which clarifies that for the purpose of share based payments measurement, vesting conditions are service conditions and performance conditions only. It also specifies that all cancellations, whether by the entity or by other parties, should receive the same accounting treatment. This amendment had not yet been endorsed by the European Union at the date of this report.
On February 14, 2008 the IASB issued an amendment to IAS 32 – Financial Instruments: Presentation and to IAS 1 - Presentation of Financial Statements - Puttable Financial Instruments and Obligations Arising on Liquidation. These amendments requires puttable financial instruments and instruments, or components of instruments, that impose on an entity an obligation to deliver to another party a pro rata share of the net assets of the entity only on liquidation, to be classified as equity instruments. This amendment, applicable from January 1, 2009, had not yet been endorsed by the European Union at the date of this report.
The following interpretations have also been issued but are not applicable to the Fiat Group:
IFRIC 12 – Service Concession Arrangements (effective from January 1, 2008 but not yet endorsed by European Union).
IFRIC 13 – Customer Loyalty Programmes (effective from January 1, 2009 but not yet endorsed by European Union).

Fiat Group Interim Consolidated Financial Statements and Notes at March 31, 2008 33
Scope of consolidation With respect to the annual consolidated financial statements at December 31, 2007, no significant changes in the scope of consolidation took place during the first quarter of 2008.
On March 20, 2008, as part of an agreement for the purchase of a factory in Campo Largo (Brazil), FPT Powertrain Technologies fully acquired Tritec Motors Limitada from Chrysler L.L.C. The Group currently has a process in course having the aim of purchase accounting for this acquisition, which includes the conversion of the consolidated financial statements of the entity acquired to IFRS. This investment has been recognised at cost in the financial statements included in this Report and will be consolidated during the second quarter of 2008 once the purchase accounting process has been completed.
In addition, the assets and liabilities of certain business of the Comau Sector previously classified as assets and liabilities held for sale have been reclassified to their ordinary lines during the first quarter of 2008; the corresponding amounts for 2007 have not been restated as the figures are immaterial.
Other information Other sections of this Report provide information on significant events occurred since the end of the quarter and business outlook.

Fiat Group Interim Consolidated Financial Statements and Notes at March 31, 2008 34
Composition and principal changes
Income Statement
1. Net revenues An analysis of Net revenues (net of intra-Group transactions) by business Sector is as follows:
(in millions of euros) 1st Quarter 2008 1st Quarter 2007
Fiat Group Automobiles 6,768 6,247Maserati 176 164Ferrari 434 354Agricultural and Construction Equipment 2,957 2,690Trucks and Commercial Vehicles 2,905 2,465FPT Powertrain Technologies 457 454Components 855 788Metallurgical Products 143 153Production Systems 166 165
Publishing and Communications 83 98
Other and holdings 81 98Total Net revenues 15,025 13,676
2. Cost of sales Cost of sales comprises the following:
(in millions of euros) 1st Quarter 2008 1st Quarter 2007
Interest cost and other financial charges from financial services companies 188 177
Other cost of sales 12,429 11,302
Cost of sales 12,617 11,479
3. Selling, general and administrative costs Selling costs amount to 752 million euros in the first quarter of 2008 (720 million euros in the first quarter of 2007) and comprise mainly marketing, advertising and sales personnel costs.
General and administrative costs amount to 548 million euros in the first quarter of 2008 (535 million euros in the first quarter of 2007) and comprise mainly expenses for administration which are not attributable to sales, production and research and development functions.
4. Research and development costs In the first quarter of 2008 research and development costs amount to 383 million euros (374 million euros in the first quarter of 2007) comprise all research and development costs not recognised as assets amounting to 198 million euros (203 million euros in the first quarter of 2007) and the amortisation of capitalised development costs of
Fiat Group Interim Consolidated Financial Statements and Notes at March 31, 2008 35
185 million euros (171 million euros in the first quarter of 2007). During the period the Group incurred new expenditure for capitalised development costs of 198 million euros (169 million euros in the first quarter of 2007).
5. Other income (expenses) Other income for the quarter amounts to 41 million euros (other income of 27 million euros for the first quarter of 2007) and consists of trading income which is not attributable to the typical sales and services operations of the Group, such as income from the sale of licenses and know-how, net of miscellaneous operating costs not ascribable to specific functional areas, such as post retirement benefits (health service costs), indirect taxes and duties, and accruals to miscellaneous provisions.
In the first quarter of 2007 this item included non-recurring income of 60 million euros arising from the reinstatement of the carrying amount of a piece of land which was fully written down in a prior period, in the progress of being sold at March 31, 2007 and sold at the end of 2007; the amount also includes miscellaneous non-recurring expenses of 20 million euros.
6. Gains (losses) on the disposal of investments In the first quarter of 2008 this item amounts to income of 2 million euros consisting of gains on the sale of minor investments.
In the first quarter of 2007 this item resulted in a net gain of 44 million euros, consisting principally of the gain of 42 million euros recognised on the finalisation of the disposal of the subsidiary Ingest Facility S.p.A.
7. Restructuring costs The net balance on this item for the first quarter of 2008 amounts to income of 4 million euros (costs of 15 million euros in the first quarter of 2007, mainly related to Comau), relating mainly to the release of partly excessive restructuring provisions, partially offset by additional costs incurred in connection with the restructuring plan for the Pomigliano d’Arco factory.
8. Other unusual income (expenses) In the first quarter of 2008, this item resulted in a net gain of 11 million euros, mainly relating to the release to income of provisions no longer required.
In the first quarter of 2007 this item results in a net loss of 29 million euros, including expenses of 24 million euros incurred in connection with the process of reorganisation and streamlining of relationships with Group suppliers.
9. Financial income (expenses) In addition to the items included in the specific line of the income statement, Net financial income (expenses) also includes the income from financial services companies included in Net revenues for 237 million euros (236 million euros in the first quarter of 2007) and the costs incurred by financial services companies included in Interest cost and other financial charges from financial services companies included in Cost of sales for 188 million euros (177 million euros in the first quarter of 2007). Reconciliation to the income statement is provided at the foot of each column of the following table.
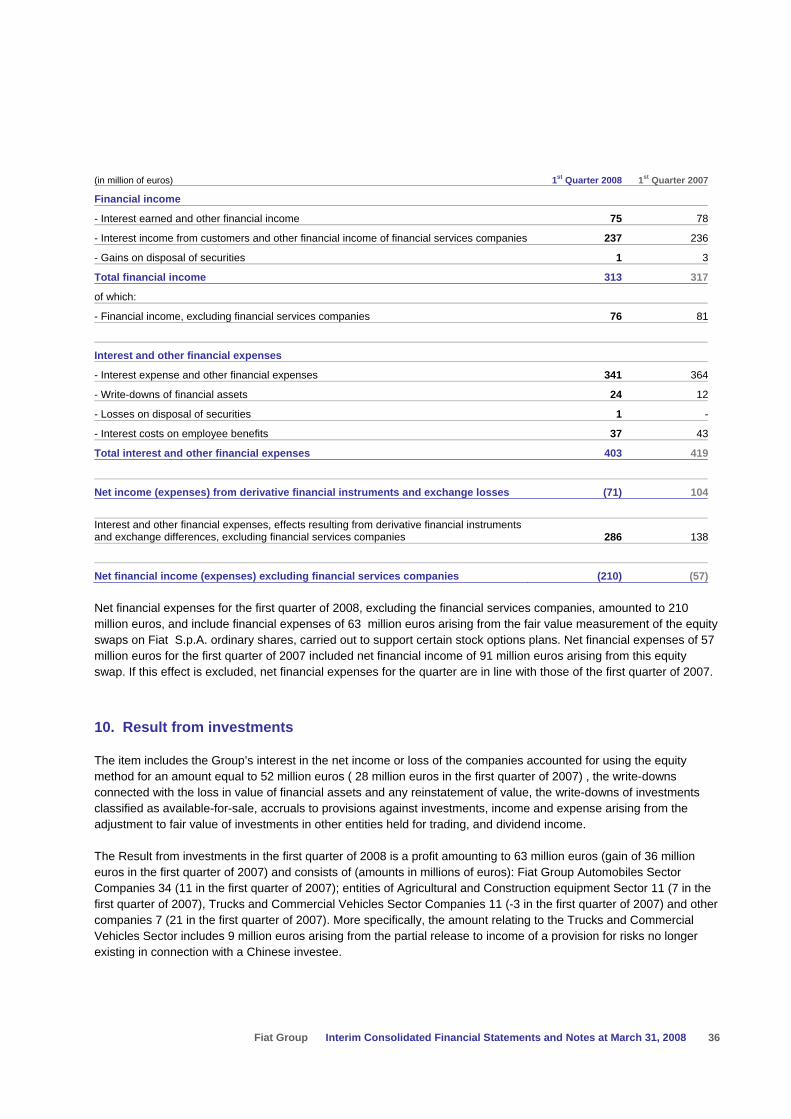
Fiat Group Interim Consolidated Financial Statements and Notes at March 31, 2008 36
(in million of euros) 1st Quarter 2008 1st Quarter 2007
Financial income
- Interest earned and other financial income 75 78
- Interest income from customers and other financial income of financial services companies 237 236
- Gains on disposal of securities 1 3
Total financial income 313 317
of which:
- Financial income, excluding financial services companies 76 81
Interest and other financial expenses
- Interest expense and other financial expenses 341 364
- Write-downs of financial assets 24 12
- Losses on disposal of securities 1 -
- Interest costs on employee benefits 37 43
Total interest and other financial expenses 403 419
Net income (expenses) from derivative financial instruments and exchange losses (71) 104
Interest and other financial expenses, effects resulting from derivative financial instruments and exchange differences, excluding financial services companies 286 138
Net financial income (expenses) excluding financial services companies (210) (57)
Net financial expenses for the first quarter of 2008, excluding the financial services companies, amounted to 210 million euros, and include financial expenses of 63 million euros arising from the fair value measurement of the equity swaps on Fiat S.p.A. ordinary shares, carried out to support certain stock options plans. Net financial expenses of 57 million euros for the first quarter of 2007 included net financial income of 91 million euros arising from this equity swap. If this effect is excluded, net financial expenses for the quarter are in line with those of the first quarter of 2007.
10. Result from investments
The item includes the Group’s interest in the net income or loss of the companies accounted for using the equity method for an amount equal to 52 million euros ( 28 million euros in the first quarter of 2007) , the write-downs connected with the loss in value of financial assets and any reinstatement of value, the write-downs of investments classified as available-for-sale, accruals to provisions against investments, income and expense arising from the adjustment to fair value of investments in other entities held for trading, and dividend income.
The Result from investments in the first quarter of 2008 is a profit amounting to 63 million euros (gain of 36 million euros in the first quarter of 2007) and consists of (amounts in millions of euros): Fiat Group Automobiles Sector Companies 34 (11 in the first quarter of 2007); entities of Agricultural and Construction equipment Sector 11 (7 in the first quarter of 2007), Trucks and Commercial Vehicles Sector Companies 11 (-3 in the first quarter of 2007) and other companies 7 (21 in the first quarter of 2007). More specifically, the amount relating to the Trucks and Commercial Vehicles Sector includes 9 million euros arising from the partial release to income of a provision for risks no longer existing in connection with a Chinese investee.

Fiat Group Interim Consolidated Financial Statements and Notes at March 31, 2008 37
11. Income taxes
Income taxes consist of the following:
(in millions of euros) 1st Quarter 2008 1st Quarter 2007
Current taxes:
- IRAP 42 44
- Other taxes 229 144
Total current taxes 271 188
Deferred taxes for the period (55) 7
Taxes relating to prior periods (7) 3
Total Income taxes 209 198
The increase in the charge for current taxes in the first quarter of 2008 with respect to the same period of 2007 mainly arises from improvements in results, including those of the Group’s foreign companies, where moreover specific events occurred which led to the recognition of deferred tax assets.
Net deferred tax assets at March 31, 2008 consist of deferred tax assets, net of deferred tax liabilities that have been offset where permissible by the individual companies. The net balance of Deferred tax assets and Deferred tax liabilities may be analyzed as follows:
(in millions of euros) At March 31, 2008 At December 31, 2007
Deferred tax assets 1,915 1.892Deferred tax liabilities (194) (193)Net deferred tax assets 1,721 1.699
12. Earnings per share
As explained in Note 25 to Consolidated financial statements at December 31, 2007, Fiat S.p.A. capital stock is represented by three different classes of shares (ordinary shares, preference shares and saving shares) that participate in dividends with different rights. Profit or loss of the period attributable to each class of share is determined in accordance with the share’s contractual dividend rights. For this purpose, the net result attributable to the ordinary equity holders of the parent company has been adjusted by the amount of the dividends that would be contractually due to each class of shares in the theoretical event of a total distribution of profits. The total profit allocated to each class of share has then been divided by the weighted average number of outstanding shares in the period to determine earnings per share.
The following table shows for the first quarter of 2008 and the first quarter of 2007 the reconciliation between the net result attributable to equity holders of the parent and the profit attributable to each class of shares, as well as, the weighted average number of shares outstanding during the period:
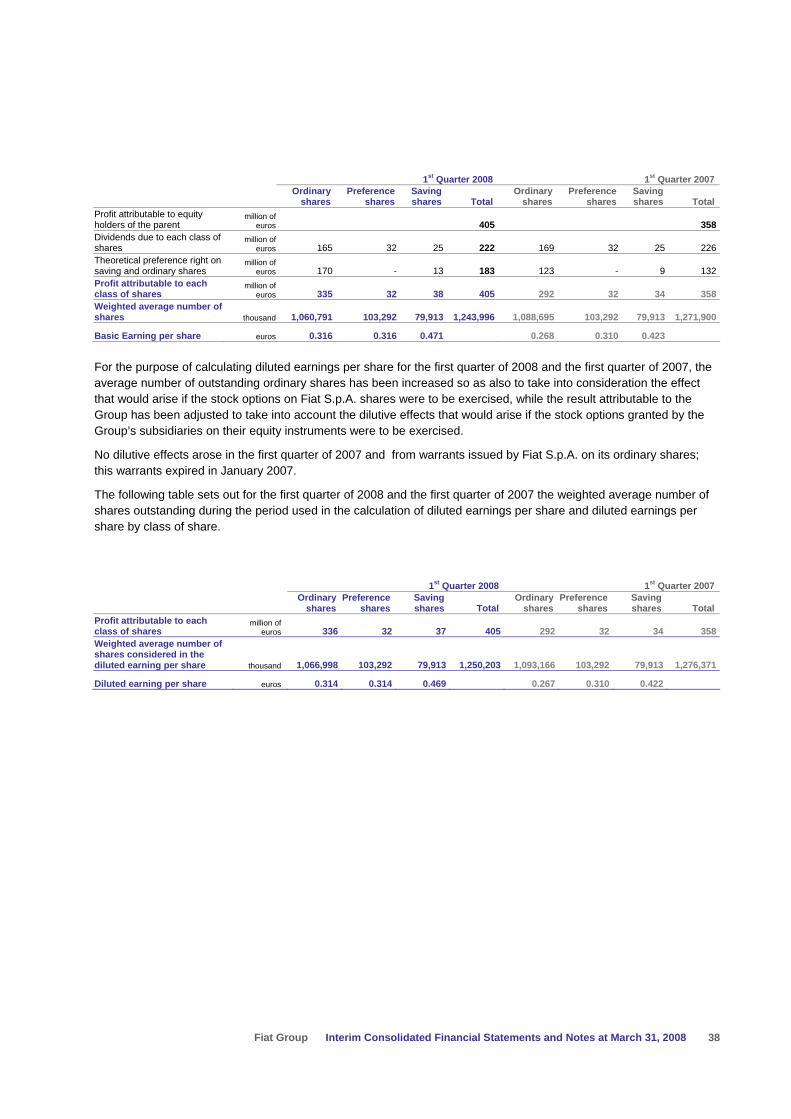
Fiat Group Interim Consolidated Financial Statements and Notes at March 31, 2008 38
1st Quarter 2008 1st Quarter 2007
Ordinary
shares Preference
shares Saving shares Total
Ordinary shares
Preference shares
Saving shares Total
Profit attributable to equity holders of the parent
million of euros 405 358
Dividends due to each class of shares
million of euros 165 32 25 222 169 32 25 226
Theoretical preference right on saving and ordinary shares
million of euros 170 - 13 183 123 - 9 132
Profit attributable to each class of shares
million of euros 335 32 38 405 292 32 34 358
Weighted average number of shares thousand 1,060,791 103,292 79,913 1,243,996 1,088,695 103,292 79,913 1,271,900
Basic Earning per share euros 0.316 0.316 0.471 0.268 0.310 0.423
For the purpose of calculating diluted earnings per share for the first quarter of 2008 and the first quarter of 2007, the average number of outstanding ordinary shares has been increased so as also to take into consideration the effect that would arise if the stock options on Fiat S.p.A. shares were to be exercised, while the result attributable to the Group has been adjusted to take into account the dilutive effects that would arise if the stock options granted by the Group’s subsidiaries on their equity instruments were to be exercised.
No dilutive effects arose in the first quarter of 2007 and from warrants issued by Fiat S.p.A. on its ordinary shares; this warrants expired in January 2007.
The following table sets out for the first quarter of 2008 and the first quarter of 2007 the weighted average number of shares outstanding during the period used in the calculation of diluted earnings per share and diluted earnings per share by class of share.
1st Quarter 2008 1st Quarter 2007
Ordinary
shares Preference
shares Saving shares Total
Ordinary shares
Preference shares
Saving shares Total
Profit attributable to each class of shares
million of euros 336 32 37 405 292 32 34 358
Weighted average number of shares considered in the diluted earning per share thousand 1,066,998 103,292 79,913 1,250,203 1,093,166 103,292 79,913 1,276,371
Diluted earning per share euros 0.314 0.314 0.469 0.267 0.310 0.422

Fiat Group Interim Consolidated Financial Statements and Notes at March 31, 2008 39
Balance Sheet
13. Intangible assets
(in millions of euros)
Net ofamortisation at
December 31, 2007 Additions Amortisation
Foreign exchange
effects and other
changes
Net ofamortisationat March 31,
2008
Goodwill 2,724 - - (117) 2,607
Development costs 2,962 198 (185) (44) 2,931
Other 837 30 (46) (31) 790
Total Intangible assets 6,523 228 (231) (192) 6,328
Goodwill consists principally of net goodwill resulting from the purchase of the Case group and other companies of the Agricultural and Construction Equipment Sector for 1,519 million euros, the Ferrari Sector for 786 million euros, the Pico group and other companies in the Production Systems Sector for 129 million euros, companies in the Components Sector for 85 million euros, companies in the Trucks and Commercial Vehicles Sector for 56 million euros, and companies in the Metallurgical Products Sector for 18 million euros.
The addition to Other intangible assets of 30 million euros in the first quarter of 2008 relates mainly to software.
Foreign exchange losses of 167 million euros in the first quarter of 2008 principally reflect changes in the Euro/U.S. dollar rate.
14. Property, plant and equipment
(in millions of euros)
Net of depreciationat December 31,
2007 Additions Depreciation
Foreign exchange
effects
Disposals and other changes
Net of depreciation at March 31, 2008
Property, plant and equipment 10,116 388 (455) (93) (7) 9,949Assets sold with a buy-back commitment 1,130 77 (35) (9) (52) 1,111Total Property plant and equipment 11,246 465 (490) (102) (59) 11,060
Additions of 465 million euros in the first quarter of 2008 mainly refer to the Automotive Sectors (Fiat Group Automobiles, Trucks and Commercial vehicles and CNH - Case New Holland) and Components. Foreign exchange losses of 102 million euros in the first three months of 2008 principally reflect changes in the Euro/US Dollar and Euro/Brazilian Real rates.
15. Investments and other financial assets
(in millions of euros) At March 31, 2008 At December 31, 2007
Investments 2,087 2,032Non-current financial receivables 146 78Other securities 102 104Total Investments and other financial assets 2,335 2,214
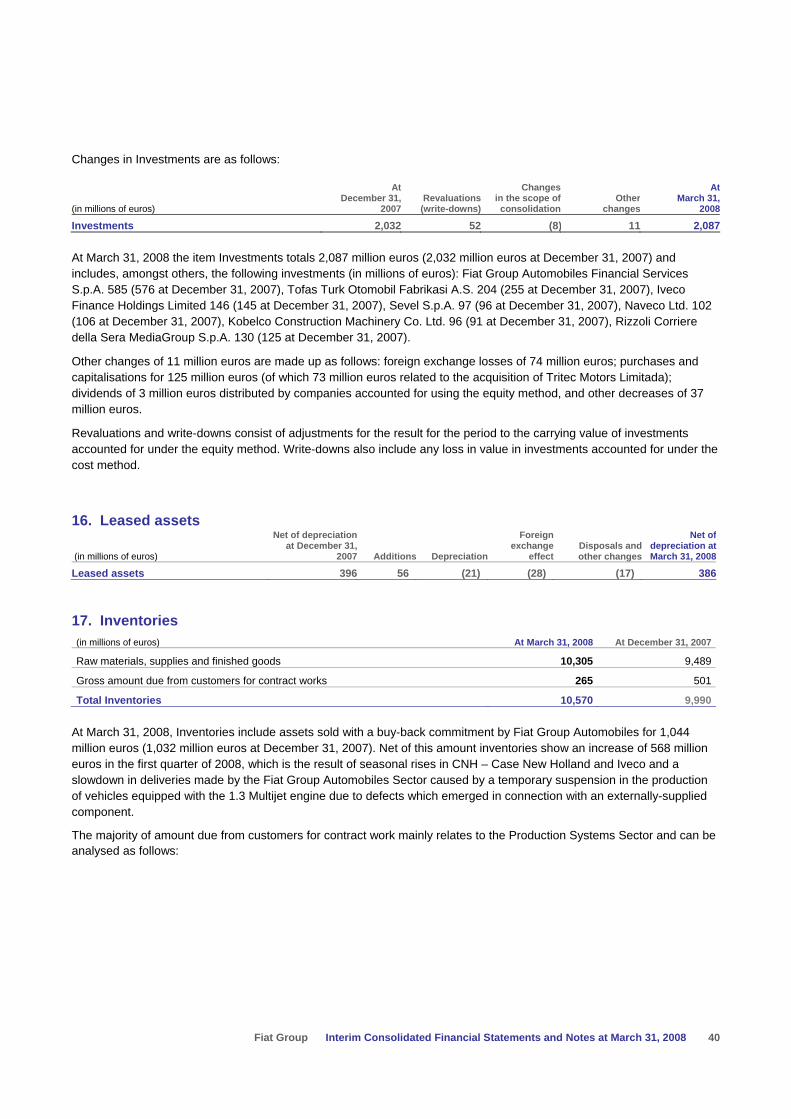
Fiat Group Interim Consolidated Financial Statements and Notes at March 31, 2008 40
Changes in Investments are as follows:
(in millions of euros)
At December 31,
2007Revaluations
(write-downs)
Changes in the scope of
consolidationOther
changes
At March 31,
2008
Investments 2,032 52 (8) 11 2,087
At March 31, 2008 the item Investments totals 2,087 million euros (2,032 million euros at December 31, 2007) and includes, amongst others, the following investments (in millions of euros): Fiat Group Automobiles Financial Services S.p.A. 585 (576 at December 31, 2007), Tofas Turk Otomobil Fabrikasi A.S. 204 (255 at December 31, 2007), Iveco Finance Holdings Limited 146 (145 at December 31, 2007), Sevel S.p.A. 97 (96 at December 31, 2007), Naveco Ltd. 102 (106 at December 31, 2007), Kobelco Construction Machinery Co. Ltd. 96 (91 at December 31, 2007), Rizzoli Corriere della Sera MediaGroup S.p.A. 130 (125 at December 31, 2007).
Other changes of 11 million euros are made up as follows: foreign exchange losses of 74 million euros; purchases and capitalisations for 125 million euros (of which 73 million euros related to the acquisition of Tritec Motors Limitada); dividends of 3 million euros distributed by companies accounted for using the equity method, and other decreases of 37 million euros.
Revaluations and write-downs consist of adjustments for the result for the period to the carrying value of investments accounted for under the equity method. Write-downs also include any loss in value in investments accounted for under the cost method.
16. Leased assets
(in millions of euros)
Net of depreciationat December 31,
2007 Additions Depreciation
Foreign exchange
effectDisposals and other changes
Net of depreciation at March 31, 2008
Leased assets 396 56 (21) (28) (17) 386
17. Inventories (in millions of euros) At March 31, 2008 At December 31, 2007
Raw materials, supplies and finished goods 10,305 9,489
Gross amount due from customers for contract works 265 501
Total Inventories 10,570 9,990
At March 31, 2008, Inventories include assets sold with a buy-back commitment by Fiat Group Automobiles for 1,044 million euros (1,032 million euros at December 31, 2007). Net of this amount inventories show an increase of 568 million euros in the first quarter of 2008, which is the result of seasonal rises in CNH – Case New Holland and Iveco and a slowdown in deliveries made by the Fiat Group Automobiles Sector caused by a temporary suspension in the production of vehicles equipped with the 1.3 Multijet engine due to defects which emerged in connection with an externally-supplied component.
The majority of amount due from customers for contract work mainly relates to the Production Systems Sector and can be analysed as follows:
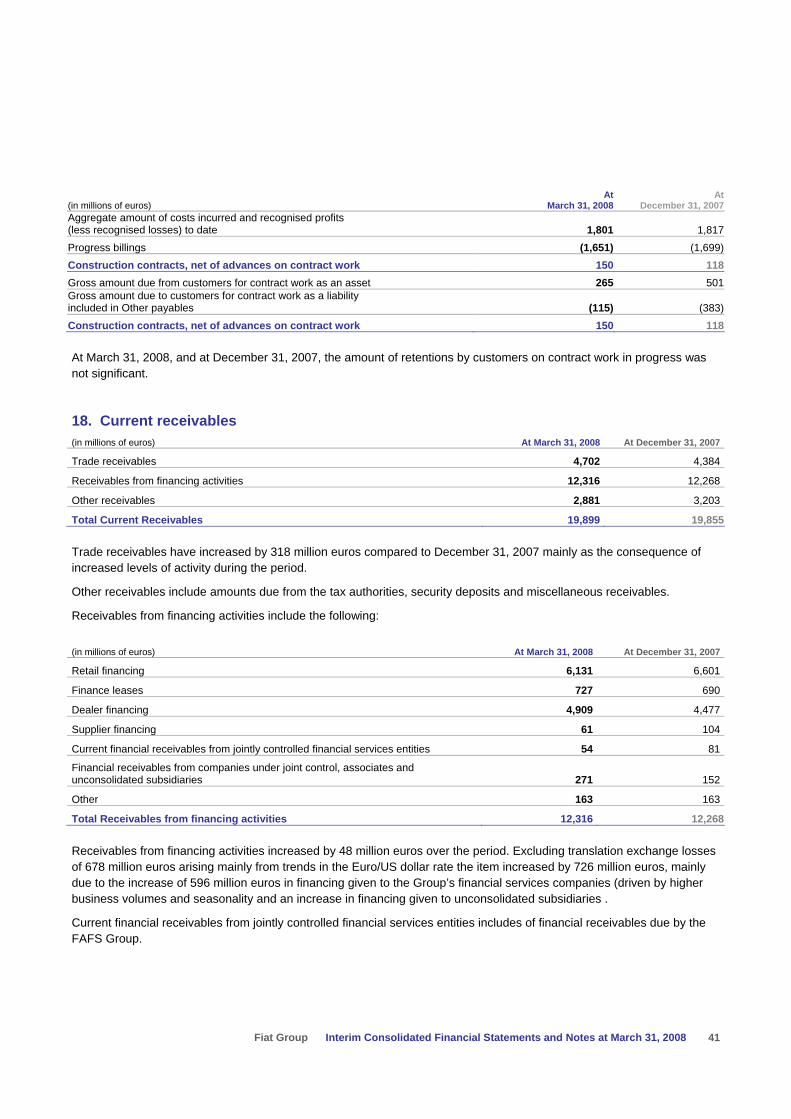
Fiat Group Interim Consolidated Financial Statements and Notes at March 31, 2008 41
(in millions of euros) At
March 31, 2008 At
December 31, 2007Aggregate amount of costs incurred and recognised profits (less recognised losses) to date 1,801 1,817Progress billings (1,651) (1,699)Construction contracts, net of advances on contract work 150 118Gross amount due from customers for contract work as an asset 265 501Gross amount due to customers for contract work as a liability included in Other payables (115) (383)Construction contracts, net of advances on contract work 150 118
At March 31, 2008, and at December 31, 2007, the amount of retentions by customers on contract work in progress was not significant.
18. Current receivables (in millions of euros) At March 31, 2008 At December 31, 2007
Trade receivables 4,702 4,384
Receivables from financing activities 12,316 12,268
Other receivables 2,881 3,203
Total Current Receivables 19,899 19,855
Trade receivables have increased by 318 million euros compared to December 31, 2007 mainly as the consequence of increased levels of activity during the period.
Other receivables include amounts due from the tax authorities, security deposits and miscellaneous receivables.
Receivables from financing activities include the following:
(in millions of euros) At March 31, 2008 At December 31, 2007
Retail financing 6,131 6,601
Finance leases 727 690
Dealer financing 4,909 4,477
Supplier financing 61 104
Current financial receivables from jointly controlled financial services entities 54 81
Financial receivables from companies under joint control, associates and unconsolidated subsidiaries 271 152
Other 163 163
Total Receivables from financing activities 12,316 12,268
Receivables from financing activities increased by 48 million euros over the period. Excluding translation exchange losses of 678 million euros arising mainly from trends in the Euro/US dollar rate the item increased by 726 million euros, mainly due to the increase of 596 million euros in financing given to the Group’s financial services companies (driven by higher business volumes and seasonality and an increase in financing given to unconsolidated subsidiaries .
Current financial receivables from jointly controlled financial services entities includes of financial receivables due by the FAFS Group.

Fiat Group Interim Consolidated Financial Statements and Notes at March 31, 2008 42
19. Other current securities At March 31, 2008 Other current securities include mainly short-term or marketable securities which represent temporary investments, but which do not satisfy the requirements for being classified as cash equivalents.
20. Other financial assets and Other financial liabilities These items include, respectively, the positive and the negative measurement at fair value of derivative financial instruments at March 31, 2008.
In particular, the overall change in other financial assets (from 703 million euros at December 31, 2007 to 845 million euros at March 31, 2008), and the increase in other financial liabilities (from 188 million euros at December 31, 2007 to 291 million euros at March 31, 2008), is mainly due to the changes in exchange rates and interest rates over the period, as well as to the as well as to the rise in the negative fair value of the equity swaps on Fiat S.p.A. ordinary shares (63 million euros at March 31, 2008).
As this item consists principally of hedging instruments, the change in their value is compensated by the change in the value of the hedged item.
21. Cash and cash equivalents Cash and cash equivalents include cash at bank, units in liquidity funds and other money market securities that are readily convertible into cash and are subject to an insignificant risk of changes in value.
At March 31, 2008, this item includes approximately 734 million euros (530 million euros at December 31, 2007) of cash whose use is restricted to the repayment of the debt related to securitisations mainly classified in the item Asset-backed financing.
22. Assets and liabilities held for sale At March 31, 2008 Assets and liabilities held for sale mainly include certain properties and buildings held by Fiat Group Automobiles, CNH – Case New Holland and Trucks and Commercial Vehicles and Comau, and the investment in Teksid Aluminum Getti Speciali S.r.l., a subsidiary of Teksid Aluminum S.r.l.
At December 31, 2007 this item also included the assets and liabilities of certain business of the Comau Sector, which have been reclassified to their ordinary lines during the first quarter of 2008.
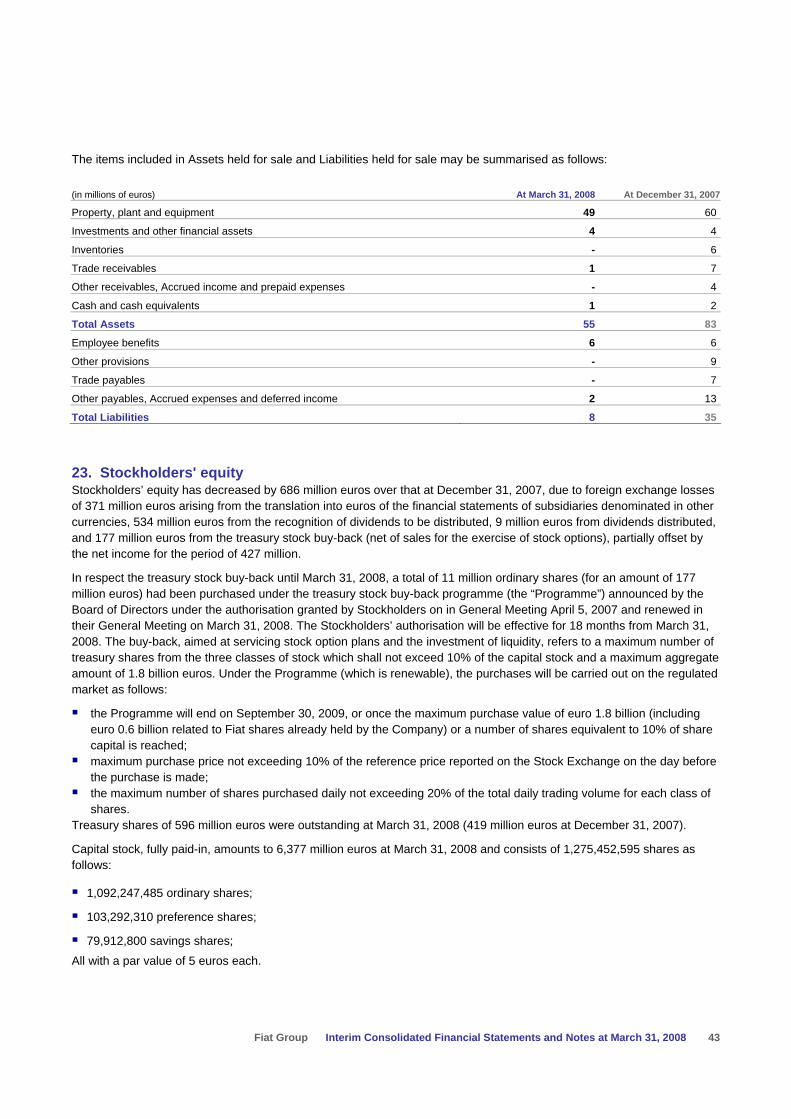
Fiat Group Interim Consolidated Financial Statements and Notes at March 31, 2008 43
The items included in Assets held for sale and Liabilities held for sale may be summarised as follows:
(in millions of euros) At March 31, 2008 At December 31, 2007
Property, plant and equipment 49 60
Investments and other financial assets 4 4
Inventories - 6
Trade receivables 1 7
Other receivables, Accrued income and prepaid expenses - 4
Cash and cash equivalents 1 2
Total Assets 55 83
Employee benefits 6 6
Other provisions - 9
Trade payables - 7
Other payables, Accrued expenses and deferred income 2 13
Total Liabilities 8 35
23. Stockholders' equity Stockholders’ equity has decreased by 686 million euros over that at December 31, 2007, due to foreign exchange losses of 371 million euros arising from the translation into euros of the financial statements of subsidiaries denominated in other currencies, 534 million euros from the recognition of dividends to be distributed, 9 million euros from dividends distributed, and 177 million euros from the treasury stock buy-back (net of sales for the exercise of stock options), partially offset by the net income for the period of 427 million.
In respect the treasury stock buy-back until March 31, 2008, a total of 11 million ordinary shares (for an amount of 177 million euros) had been purchased under the treasury stock buy-back programme (the “Programme”) announced by the Board of Directors under the authorisation granted by Stockholders on in General Meeting April 5, 2007 and renewed in their General Meeting on March 31, 2008. The Stockholders’ authorisation will be effective for 18 months from March 31, 2008. The buy-back, aimed at servicing stock option plans and the investment of liquidity, refers to a maximum number of treasury shares from the three classes of stock which shall not exceed 10% of the capital stock and a maximum aggregate amount of 1.8 billion euros. Under the Programme (which is renewable), the purchases will be carried out on the regulated market as follows:
the Programme will end on September 30, 2009, or once the maximum purchase value of euro 1.8 billion (including euro 0.6 billion related to Fiat shares already held by the Company) or a number of shares equivalent to 10% of share capital is reached;
maximum purchase price not exceeding 10% of the reference price reported on the Stock Exchange on the day before the purchase is made;
the maximum number of shares purchased daily not exceeding 20% of the total daily trading volume for each class of shares.
Treasury shares of 596 million euros were outstanding at March 31, 2008 (419 million euros at December 31, 2007).
Capital stock, fully paid-in, amounts to 6,377 million euros at March 31, 2008 and consists of 1,275,452,595 shares as follows:
1,092,247,485 ordinary shares;
103,292,310 preference shares;
79,912,800 savings shares;
All with a par value of 5 euros each.
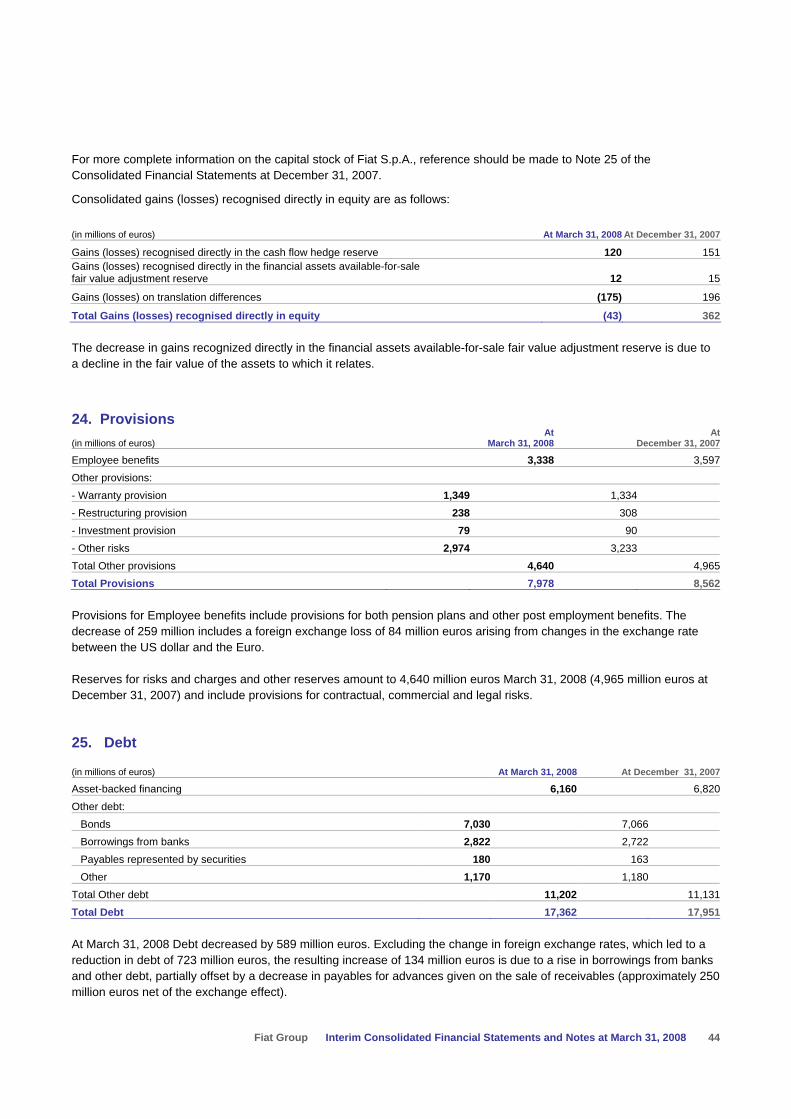
Fiat Group Interim Consolidated Financial Statements and Notes at March 31, 2008 44
For more complete information on the capital stock of Fiat S.p.A., reference should be made to Note 25 of the Consolidated Financial Statements at December 31, 2007.
Consolidated gains (losses) recognised directly in equity are as follows:
(in millions of euros) At March 31, 2008 At December 31, 2007
Gains (losses) recognised directly in the cash flow hedge reserve 120 151Gains (losses) recognised directly in the financial assets available-for-sale fair value adjustment reserve 12 15
Gains (losses) on translation differences (175) 196
Total Gains (losses) recognised directly in equity (43) 362
The decrease in gains recognized directly in the financial assets available-for-sale fair value adjustment reserve is due to a decline in the fair value of the assets to which it relates.
24. Provisions (in millions of euros)
At March 31, 2008
At December 31, 2007
Employee benefits 3,338 3,597Other provisions: - Warranty provision 1,349 1,334- Restructuring provision 238 308- Investment provision 79 90- Other risks 2,974 3,233Total Other provisions 4,640 4,965Total Provisions 7,978 8,562
Provisions for Employee benefits include provisions for both pension plans and other post employment benefits. The decrease of 259 million includes a foreign exchange loss of 84 million euros arising from changes in the exchange rate between the US dollar and the Euro.
Reserves for risks and charges and other reserves amount to 4,640 million euros March 31, 2008 (4,965 million euros at December 31, 2007) and include provisions for contractual, commercial and legal risks.
25. Debt
(in millions of euros) At March 31, 2008 At December 31, 2007
Asset-backed financing 6,160 6,820Other debt: Bonds 7,030 7,066 Borrowings from banks 2,822 2,722 Payables represented by securities 180 163 Other 1,170 1,180Total Other debt 11,202 11,131Total Debt 17,362 17,951
At March 31, 2008 Debt decreased by 589 million euros. Excluding the change in foreign exchange rates, which led to a reduction in debt of 723 million euros, the resulting increase of 134 million euros is due to a rise in borrowings from banks and other debt, partially offset by a decrease in payables for advances given on the sale of receivables (approximately 250 million euros net of the exchange effect).
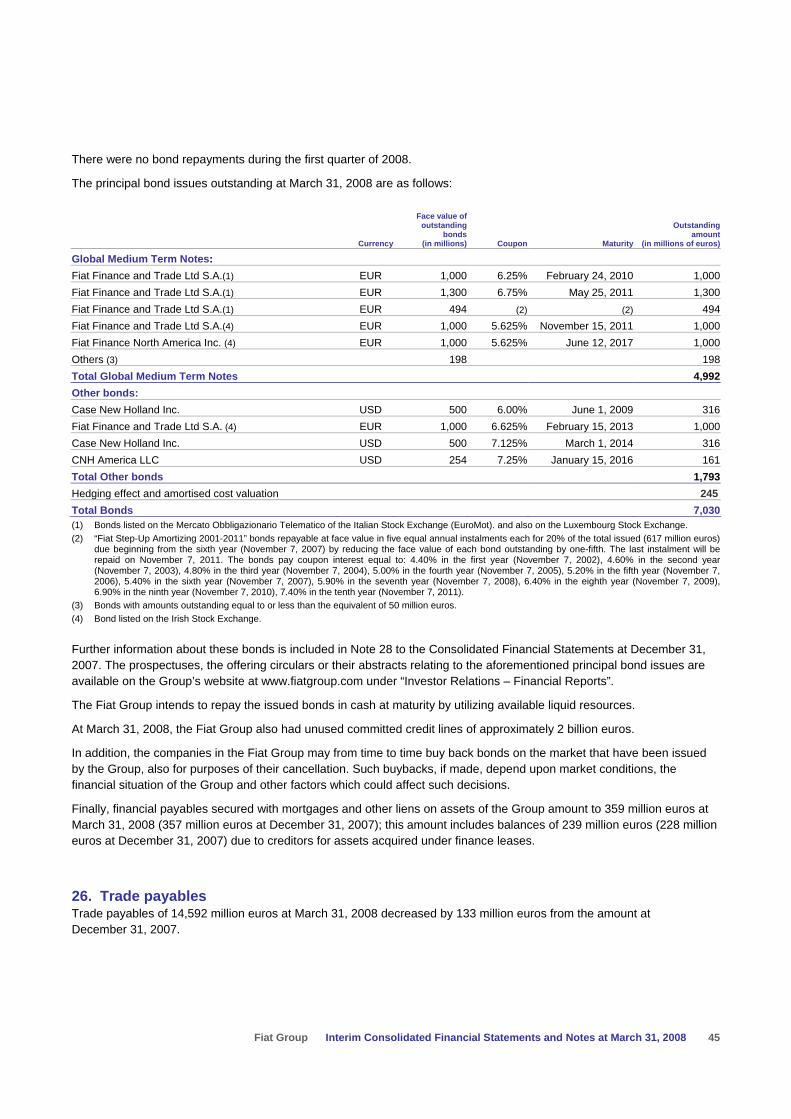
Fiat Group Interim Consolidated Financial Statements and Notes at March 31, 2008 45
There were no bond repayments during the first quarter of 2008.
The principal bond issues outstanding at March 31, 2008 are as follows:
Currency
Face value of outstanding
bonds (in millions) Coupon Maturity
Outstanding amount
(in millions of euros)
Global Medium Term Notes: Fiat Finance and Trade Ltd S.A.(1) EUR 1,000 6.25% February 24, 2010 1,000Fiat Finance and Trade Ltd S.A.(1) EUR 1,300 6.75% May 25, 2011 1,300Fiat Finance and Trade Ltd S.A.(1) EUR 494 (2) (2) 494Fiat Finance and Trade Ltd S.A.(4) EUR 1,000 5.625% November 15, 2011 1,000Fiat Finance North America Inc. (4) EUR 1,000 5.625% June 12, 2017 1,000Others (3) 198 198Total Global Medium Term Notes 4,992Other bonds: Case New Holland Inc. USD 500 6.00% June 1, 2009 316Fiat Finance and Trade Ltd S.A. (4) EUR 1,000 6.625% February 15, 2013 1,000Case New Holland Inc. USD 500 7.125% March 1, 2014 316CNH America LLC USD 254 7.25% January 15, 2016 161Total Other bonds 1,793Hedging effect and amortised cost valuation 245Total Bonds 7,030(1) Bonds listed on the Mercato Obbligazionario Telematico of the Italian Stock Exchange (EuroMot). and also on the Luxembourg Stock Exchange. (2) “Fiat Step-Up Amortizing 2001-2011” bonds repayable at face value in five equal annual instalments each for 20% of the total issued (617 million euros)
due beginning from the sixth year (November 7, 2007) by reducing the face value of each bond outstanding by one-fifth. The last instalment will be repaid on November 7, 2011. The bonds pay coupon interest equal to: 4.40% in the first year (November 7, 2002), 4.60% in the second year (November 7, 2003), 4.80% in the third year (November 7, 2004), 5.00% in the fourth year (November 7, 2005), 5.20% in the fifth year (November 7, 2006), 5.40% in the sixth year (November 7, 2007), 5.90% in the seventh year (November 7, 2008), 6.40% in the eighth year (November 7, 2009), 6.90% in the ninth year (November 7, 2010), 7.40% in the tenth year (November 7, 2011).
(3) Bonds with amounts outstanding equal to or less than the equivalent of 50 million euros. (4) Bond listed on the Irish Stock Exchange.
Further information about these bonds is included in Note 28 to the Consolidated Financial Statements at December 31, 2007. The prospectuses, the offering circulars or their abstracts relating to the aforementioned principal bond issues are available on the Group’s website at www.fiatgroup.com under “Investor Relations – Financial Reports”.
The Fiat Group intends to repay the issued bonds in cash at maturity by utilizing available liquid resources.
At March 31, 2008, the Fiat Group also had unused committed credit lines of approximately 2 billion euros.
In addition, the companies in the Fiat Group may from time to time buy back bonds on the market that have been issued by the Group, also for purposes of their cancellation. Such buybacks, if made, depend upon market conditions, the financial situation of the Group and other factors which could affect such decisions.
Finally, financial payables secured with mortgages and other liens on assets of the Group amount to 359 million euros at March 31, 2008 (357 million euros at December 31, 2007); this amount includes balances of 239 million euros (228 million euros at December 31, 2007) due to creditors for assets acquired under finance leases.
26. Trade payables Trade payables of 14,592 million euros at March 31, 2008 decreased by 133 million euros from the amount at December 31, 2007.

Fiat Group Interim Consolidated Financial Statements and Notes at March 31, 2008 46
27. Other payables Other payables include 2,489 million euros of amounts payable to customers relating to buy-back agreements (2,513 million euros at December 31, 2007), dividends of 509 million euros payable to Fiat S.p.A. Stockholders as resolved in their General Meeting on March 31, 2008 and an amount of 25 million euros arising from the adoption of resolutions by CNH Global N.V., Ferrari S.p.A. and more minor companies to distribute dividends.
28. Accrued expenses and deferred income The item Accrued liabilities and deferred income includes public investment grants recognised as income over the useful lives of the assets to which they relate. Furthermore, the item comprises deferred income relating to service contracts, as well as accrued liabilities for costs that will be settled in the following year.
29. Guarantees granted, commitments and contingent liabilities
Guarantees granted At March 31, 2008 the Group had outstanding guarantees granted on the debt or commitments of third parties or unconsolidated subsidiaries jointly controlled and associated entities totalling 700 million euros, in line with the December 31, 2007 balance of 725 million euros.
Other commitments and important contractual rights The Fiat Group has important commitments and rights deriving from outstanding agreements. These commitments and rights are described in Note 32 of the Consolidated Financial Statements at December 31, 2007, to which reference should be made, insofar as no changes occurred in the first quarter of 2008. In particular, these involve commitments and rights regarding:
relations of Fiat with the Arab fund Mubadala Development Company concerning its holding in the subsidiary Ferrari S.p.A.;
relations of Fiat with Renault concerning the subsidiary Teksid.
Lawsuits and controversies The Parent Company and certain subsidiaries are party to various lawsuits and controversies. Nevertheless, it is believed that the resolution of these controversies will not cause significant liabilities for which specific risk provisions have not already been set aside.
Sales of receivables The Group has discounted receivables and bills without recourse having due dates beyond March 31, 2008 amounting to 6,570 million euros (7,044 million euros at December 31, 2007, with due dates beyond that date), which refer to trade receivables and other receivables for 5,067 million euros (5,524 million euros at December 31, 2007) and receivables from financing for 1,503 million euros (1,520 million euros at December 31, 2007). The amount includes receivables, mostly due from the sales network, of 3,500 million euros (3,817 million euros at 31 December 2007) sold to jointly controlled financial services companies (FAFS) and of 913 million euros (869 million euros at 31 December 2007) sold to associate financial services companies (Iveco Finance Holdings Limited, controlled by Barclays).

Fiat Group Interim Consolidated Financial Statements and Notes at March 31, 2008 47
30. Income statement by business sector
(in millions of euros)
Fiat Group Automobiles Maserati Ferrari CNH Iveco FPT
Magneti Marelli Teksid Comau Itedi
Other Holdings
and elimina-
tionsFIAT
Group1st Quarter 2008 Total net revenues 6,829 193 456 2,963 2,931 1,988 1,332 223 252 84 (2,226) 15,025Net revenues intersegment (*) (61) (17) (22) (6) (26) (1,531) (477) (80) (86) (1) 2,307 -Net revenues from third parties 6,768 176 434 2,957 2,905 457 855 143 166 83 81 15,025Trading profit 193 10 59 198 222 47 45 15 1 - (24) 766Unusual income (expenses) (9) - - 20 1 1 - 5 - - (1) 17Operating result 184 10 59 218 223 48 45 20 1 - (25) 783Financial income (expenses) (210)Result from investments 63Result before taxes 636Income taxes 209Result from continuing operations 427
(in millions of euros)
Fiat Group Automobiles Maserati Ferrari CNH Iveco FPT
Magneti Marelli Teksid Comau Itedi
Other Holdings
and elimina-
tionsFIAT
Group1st Quarter 2006 Total net revenues 6,302 167 381 2,691 2,487 1,708 1,228 212 229 100 (1,829) 13,676Net revenues intersegment (*) (55) (3) (27) (1) (22) (1,254) (440) (59) (64) (2) 1,927 -Net revenues from third parties 6,247 164 354 2,690 2,465 454 788 153 165 98 98 13,676Trading profit 192 (1) 31 189 150 44 45 20 (26) - (49) 595Unusual income (expenses) (23) - - - - - - (6) (14) - 43 -Operating result 169 (1) 31 189 150 44 45 14 (40) - (6) 595Financial income (expenses) (57)Result from investments 36Result before taxes 574Income taxes 198Result from continuing operations 376(*) Intersegment net sales and revenues include revenues between consolidated Group companies relating to different Sectors. Intersegment sales are
accounted for at transfer prices that are substantially in line with market.

Fiat Group Interim Consolidated Financial Statements and Notes at March 31, 2008 48
31. Translation of financial statements denominated in a currency other than the euros The principal exchange rates used to translate into Euros the financial statements prepared in currencies other than the Euro were as follows:
1st Quarter 2008 At December 31, 2007 1st Quarter 2006
Average At March 31 Average At March 31
US dollar 1.498 1.581 1.472 1.311 1.332 Pound sterling 0.757 0.796 0.733 0.671 0.680 Swiss franc 1.601 1.574 1.655 1.616 1.625 Polish zloty 3.576 3.522 3.594 3.886 3.867 Brazilian real 2.601 2.755 2.607 2.763 2.730 Argentine peso 4.755 5.032 4.667 4.078 4.162
32. Other information During the first quarter of 2008, the Group had an average number of employees of 187,600, compared to an average of 173,998 during the first quarter of 2007.
********
The managers responsible for preparing the Company's financial reports, Alessandro Baldi and Maurizio Francescatti, declare, pursuant to paragraph 2 of Article 154-bis of the Consolidated Law on Finance, that the accounting information contained in this document corresponds to the results documented in the books, accounting and other records of the company.