0 leo denault sustainability in everything we do
TRANSCRIPT

LEO DENAULT – CHAIRMAN AND CHIEF EXECUTIVE OFFICERAN
ALY
ST
DA
Y 2
02
0
Sustainability
in Everything
We Do
September 24, 2020
Caution Regarding Forward-looking Statements and Regulation G Compliance
In this presentation, and from time to time, Entergy Corporation makes certain “forward-looking statements” within the meaning of the Private Securities Litigation Reform Act of
1995. Such forward-looking statements include, among other things, statements regarding Entergy’s 2020 earnings guidance, current financial and operational outlooks, and
capital plan; statements regarding its environmental plans, goals, beliefs and expectations, including statements regarding its greenhouse gas reduction goals and strategies
and statements regarding the planned addition of renewable generation, potential technological advances, legacy asset retirements, nuclear license extensions, offsets and
other potential means of achieving its environmental goals; statements regarding opportunities to partner with customers and others to advance technology development or
reduce societal emissions; and other statements of Entergy’s plans, beliefs, or expectations included in this presentation. Readers are cautioned not to place undue reliance on
these forward-looking statements, which apply only as of the date of this presentation. Except to the extent required by the federal securities laws, Entergy undertakes no
obligation to publicly update or revise any forward-looking statements, whether as a result of new information, future events, or otherwise.
Forward-looking statements are subject to a number of risks, uncertainties, and other factors that could cause actual results to differ materially from those expressed or implied
in such forward-looking statements, including (a) those factors discussed elsewhere in this presentation and in Entergy’s most recent Annual Report on Form 10-K, any
subsequent Quarterly Reports on Form 10-Q, and Entergy’s other reports and filings made under the Securities Exchange Act of 1934; (b) uncertainties associated with (1) rate
proceedings, formula rate plans, and other cost recovery mechanisms, including the risk that costs may not be recoverable to the extent anticipated by the utilities and (2)
implementation of the ratemaking effects of changes in law; (c) uncertainties associated with efforts to remediate the effects of major storms and recover related restoration
costs; (d) risks associated with operating nuclear facilities, including plant relicensing, operating, and regulatory costs and risks; (e) changes in decommissioning trust fund
values or earnings or in the timing or cost of decommissioning Entergy’s nuclear plant sites; (f) legislative and regulatory actions and risks and uncertainties associated with
claims or litigation by or against Entergy and its subsidiaries; (g) risks and uncertainties associated with execution on our business strategies, including strategic transactions
that Entergy or its subsidiaries may undertake and the risk that any such transaction may not be completed as and when expected and the risk that the anticipated benefits of
the transaction may not be realized; (h) effects of changes in federal, state, or local laws and regulations and other governmental actions or policies, including changes in
monetary, fiscal, tax, environmental, or energy policies; (i) the effects of changes in commodity markets, capital markets, or economic conditions; (j) impacts from a terrorist
attack, cybersecurity threats, data security breaches, or other attempts to disrupt Entergy’s business or operations, and/or other catastrophic events; (k) the direct and indirect
impacts of the COVID-19 pandemic on Entergy and its customers; and (l) the effects of technological change, including the costs, pace of development and commercialization
of new and emerging technologies.
This presentation includes the non-GAAP financial measures of adjusted EPS; adjusted ROE; parent debt to total debt, excluding securitization debt; FFO to debt, excluding
securitization debt; FFO to debt, excluding securitization debt, return of unprotected excess ADIT, and severance and retention payments associated with exit of EWC; and net
liquidity, including storm escrows when describing Entergy’s results of operations and financial performance. We have prepared reconciliations of these financial measures to
the most directly comparable GAAP measure, which can be found in this presentation. This presentation should be considered together with the Entergy earnings release to
which this teleconference relates, which is posted on the company’s website at www.entergy.com and which contains further information on non-GAAP financial measures.
1

We exist to grow a world-class energy
business that creates sustainable
value for our four stakeholders
Higher level of
service while
maintaining low rates
More engaged,
diverse, and better
trained workforce
Greener and more
prosperous
communities
Steady predictable
growth in earnings
and dividends
EMPLOYEES COMMUNITIES OWNERSCUSTOMERS
2

3
Our Communities, Our Responsibilities
Entergy Powers Relief Efforts
Entergy has been awarded the
EEI storm response and/or assistance
awards for 22 consecutive years
Entergy powers COVID-19 relief efforts
with grants of $3+ million, 2+ million meals,
5,000+ crisis grants, and more
3

4
Strongest Hurricane to Make Landfall in Louisiana in 164 Years
Hurricane Laura
Robust storm response
• >25,000 resources
• >230 companies, including 24 other
utilities, representing 31 states

5
Laura Wreaked Devastation Along Its Path
~1,450 structures destroyed
~450 structures damaged
>300 substations
~225 linesTra
ns
mis
sio
n
~14,000 poles
~4,800 transformers
~30,000 spans of wire
>30,000 crossarmsDis
trib
uti
on
5

6
Advanced-design Transmission Structures Held Up Well
Rhodes to Nelson
Transmission Line
In service: 1971
Lake Charles
Transmission Project
In service: 2018
6

7
Restoration Extended by Transmission Damage
8/25
Storm
workers ready
to respond
9/58/27 8/31
1:00 am: Hurricane
Laura makes landfall
in Cameron, LA with
sustained winds of
150 mph
Power
restored to
80% of
impacted
customers
9/6
Restored power to
most customers
outside of
Calcasieu and
Cameron parishes
9/9
Restored
second
transmission
line into Lake
Charles
9/11
Energized
transmission line
into Lake Charles
Calcasieu Plant
comes online
Energized
transmission line into
Calcasieu parish
Power restored to
>90% of impacted
customers
9/15
Power
restored to
95% of
impacted
customers
Power
restored to
99% of
impacted
customers
9/21
Lake Charles
Power
Station
comes online
9/14

8
Helping Our Communities
• With support from Entergy and others, the American Red
Cross:
− Deployed 1,800 volunteers and staff
− Helped provide shelter to 21,000
− Provided >111,000 meals
− Distributed 46,000 personal care items and disaster
supplies
− Provided counseling and mental health support for 4,000
individuals
• Entergy shareholders:
− Have committed $660,000 in charitable contributions to
support communities impacted by Hurricane Laura
− Are matching employee contributions to the Entergy
Employee Assistance Fund, helping employees
affected by the disaster
8

9
Strong Support for Our Storm Response
“It seems like every couple of
hours we get an update that a
new neighborhood or a new area
of town has some lights on. I can't
tell you how proud I am of our city
employees and Entergy… for moving
mountains to make these things happen.”
“If you would’ve told me two weeks ago that
we would be sitting here today talking about
power in Lake Charles over the next several
days, I would’ve said there’s no way. I think
the government can take a page out of
Entergy’s book sometimes.”
-- Lake Charles Mayor Nic Hunter
“We have someone in the building today who
is the president and CEO of Entergy Texas…
their team is in here in force and getting this
power and stuff restored as quickly as
possible so that our citizens that are on their
way home can have power as quickly as
possible to get back to repairing their homes.”
-- Orange County Judge John Gothia
“Everybody can take some sense of
satisfaction that Entergy is working very, very
hard to make progress to bring power back
on.” -- Governor John Bel Edwards
10
Environmental Social Governance
Published Comprehensive ESG Presentation

RO
D W
EST –
GR
OU
P P
RES
IDEN
T, U
TILI
TY O
PER
ATIO
NS
Creating
an Optimal
Customer
Experience
Continuous
Improvement
Creates
Value for All
Stakeholders
Our
Environmental
Leadership
for a Cleaner
World
PAU
L H
INN
ENK
AM
P –
EVP
AN
D C
HIE
F O
PER
ATIN
G O
FFIC
ER
On Track
to Achieve
Our Financial
Objectives
DR
EW M
AR
SH –
EVP
AN
D C
HIE
F FI
NA
NC
IAL
OFF
ICER
LEO
DEN
AU
LT –
CH
AIR
MA
N O
F TH
E B
OA
RD
AN
D C
EO
Our Vision
for Long-term
Sustainability
JULI
E H
AR
BER
T –
SVP,
CO
RP
OR
ATE
BU
SIN
ESS
SER
VIC
ES
Building the Premier Utility
11

12
Industry leader in critical measures of sustainability
Among the lowest retail rates in the U.S.
One of the cleanest large-scale generation fleets in
the U.S.
Robust capital plan ready for deployment
Constructive and progressive regulatory mechanisms
Strong 5% to 7% adjusted EPS growth
Clarity on dividend growth strategy
Commitment to continuous improvement
Uniquely
positioned to be

ROD WEST – GROUP PRESIDENT, UTILITY OPERATIONSAN
ALY
ST
DA
Y 2
02
0
Creating
an Optimal
Customer
Experience
September 24, 2020

Continuous
Improvement
Creates
Value for All
Stakeholders
Our
Environmental
Leadership
for a Cleaner
World
On Track
to Achieve
Our Financial
Objectives
Our Vision
for Long-term
Sustainability
Building the Premier UtilityRO
D W
EST
–G
ROU
P PR
ESID
ENT,
UTI
LITY
OPE
RATI
ON
S
PAU
L H
INN
ENKA
MP
–EV
P AN
D CH
IEF
OPE
RATI
NG
OFF
ICER
DREW
MAR
SH –
EVP
AND
CHIE
F FI
NAN
CIAL
OFF
ICER
LEO
DEN
AULT
–CH
AIRM
AN O
F TH
E BO
ARD
AND
CEO
JULI
E H
ARBE
RT –
SVP,
CO
RPO
RATE
BU
SIN
ESS
SERV
ICES
Creating
an Optimal
Customer
Experience
1

2
Our Utility Strategy Starts with the Customer

3
Positive Customer Outcomes Drive Value
Interactions
and offerings
Power quality, service,
reliability, and restoration
Corporate
reputation
Value and
affordability

4
Investing to Improve Customer Outcomes
TransmissionGenerationDistribution
Customer solutions drive our investment plan

5
$21B
$21 Billion Five-year Customer-centric Capital Plan
Generation – $9B
Transmission – $3B
Distribution and
Utility support – $9B
Five-year capital plan by function

6
Capital Plan Will Create Significant Customer Benefits
Improves reliability and power quality
Strengthens system resiliency
Creates platform for innovative products and
services
Facilitates integration of renewables
Provides customer solutions
Ensures optimal solutions when coupling
digital technology with analytics
Increases customer
satisfaction

7
Distribution: Creating a More Resilient Grid
9
20E–24E
Grid modernization
Utility support
Distribution baseline
Distribution and Utility support plan; $B

8
Distribution Plan Focused on Three Major Areas
Reliability improvementsHighest / quickest
customer impact
Asset renewal /
infrastructure modernization Sustainable long-term reliability
New technologies Foundation for new
customer solutions
Reduced frequency and
duration of outages
Improved net
promoter score
Positive customer outcomes

9
Generation: Modernizing Our Fleet for Cleaner Energy
Generation plan; $B
9
20E–24E
Renewables
New power generation
Nuclear
Non-nuclear baseline

10
Technology Advancements Will Provide More Clean Options
New Generation to Serve Customer Needs
1 Requires approval from APSC2 Requires approval from PUCT3 Pursuing option to fuel with hydrogen
• WPEC (2020)
• MCPS (2021)
• E-TX CCGT3 RFP (2025/26)
Power generationRenewables
• E-NO rooftop solar (2020)
• New Orleans Solar Station (2020)
• Sunflower Solar (2021)
• Searcy Solar (2021)
• Walnut Bend1 (2022)
• Liberty County Solar2 (2023)
• Umbriel Solar2 (2023)
• Renewable RFPs
• ~440 customer-sited back-up
generator installations
• A regional microgrid solution
in coastal area anchored by
generation on a floating
power barge
Customer solutions
Capital plan includes announced projects:

11
Transmission: Supporting Reliability and Growth
Transmission plan; $B
3
20E–24E
Reliability and growth
Asset management
12
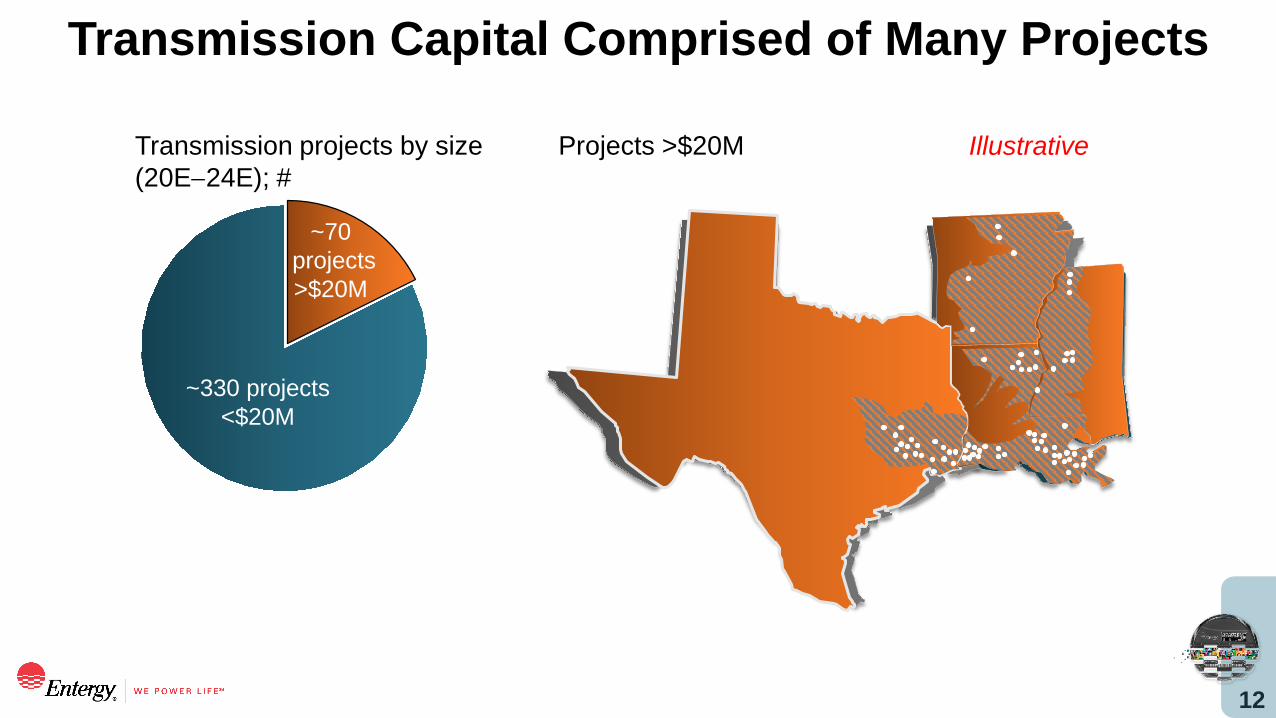
Transmission Capital Comprised of Many Projects
Transmission projects by size
(20E−24E); #
Projects >$20M Illustrative
~330 projects
<$20M
~70
projects
>$20M

13
Significant Certainty in Our Five-year Capital Plan
1 90% for the three-year capital plan (2020–2022)
Forward-looking FRPs •Traditional FRPs • Riders
~80%1
ready for
execution
from a regulatory
approval
standpoint
>90% recovered
through
timely
mechanisms
~90% driven by
modernization
(e.g., not load
growth)

14
Focused on Keeping Customer Bills Low
1 The weighted average Utility residential bill is derived from the weighted average of the projected OpCo average residential bills; average bill changes are expected to
vary by OpCo and from year to year
Note: Hurricane Laura recovery could add 30 basis points to the bill growth trajectory
Levers to help control bills
• Fuel efficiency
• Investment in new technology
• Continuous improvement
• Energy efficiency
• New products and services
• Expanding customer base
• Structured financing
19 20E 21E 22E 23E 24E
~2.5% CAGR
Non-
fuel
Fuel
Weighted average Utility residential bill1; $Illustrative
Without return of unprotected excess ADIT
Entergy bill outlook

15
Providing Access to Affordable, Clean Energy
Among the Lowest Rates in the Country
Note: Hurricane Laura recovery could add ~0.15₵ per kWh to the average retail price, which would move Entergy from second to third lowest
Emergency bill-payment
assistance to low-income
elderly and disabled customers
Advocacy to ensure funds
are allocated to help our
customers
2019 average retail price by parent company;
₵ per kWh
Entergy
2019
7.45
Based on S&P Global Market Intelligence Regulated Retail Price of Electricity (6/16/20)

16
Progressive Recovery Mechanisms Support Outlooks
Capital plan recovery by mechanism
Illustrative
Forward-looking FRPs
TraditionalFRPs
Riders
Rate cases

17
Regulatory Mechanisms Support Growth
1 Excluding the estimated impact of affiliate preferred; 11.5% as reported ROE, see calculation in appendix2 See calculation in appendix
9.0
10.7
9.5
9.5 10.1
0
4
8
12
E-AR E-LA E-MS E-NO E-TX
ROE by operating company; %
Book adjusted2, LTM 6/30/2020Regulatory allowed
1

18
Creating an Optimal Customer Experience
Regulatory
mechanisms that
support efficient
investment recovery
Significant certainty
in our capital plan
Customer
outcomes
at the forefront
of everything
we do

JULIE HARBERT– SVP, CORPORATE BUSINESS SERVICESAN
ALY
ST
DA
Y 2
02
0 Continuous
Improvement
Creates
Value for All
StakeholdersSeptember 24, 2020

Continuous
Improvement
Creates
Value for All
Stakeholders
Our
Environmental
Leadership
for a Cleaner
World
On Track
to Achieve
Our Financial
Objectives
Our Vision
for Long-term
Sustainability
Building the Premier UtilityRO
D W
EST
–G
ROU
P PR
ESID
ENT,
UTI
LITY
OPE
RATI
ON
S
PAU
L H
INN
ENKA
MP
–EV
P AN
D CH
IEF
OPE
RATI
NG
OFF
ICER
DREW
MAR
SH –
EVP
AND
CHIE
F FI
NAN
CIAL
OFF
ICER
LEO
DEN
AULT
–CH
AIRM
AN O
F TH
E BO
ARD
AND
CEO
JULI
E H
ARBE
RT –
SVP,
CO
RPO
RATE
BU
SIN
ESS
SERV
ICES
Creating
an Optimal
Customer
Experience
1

2
CI Creates Sustainable Value for Stakeholders
Customers Employees Communities Owners
Strong net promoter scores
Reduced risk
Increased investment in
reliability, sustainability
Operational excellence
Higher level of service while
maintaining low rates
Enhanced benefits
Skill development
Training
Leadership
development
Investment in
charitable foundation
Investment in
environmental
initiatives
Economic
development
Risk reduction
Operational excellence
Incremental rate base
Improved earnings and
dividend growth trajectory
Improved accuracy
and compliance
Create incremental value
for stakeholders without
increasing customer bills
Redeploy resourcesPermanently eliminate costs
out of the business

3
Realized Successes to Date, and More to Come
Continuous Improvement at Entergy Is Maturing
2016
Started program to
solicit and implement
employee-driven ideas
2017
Formed
innovation
group
Ramped up
robotic process
automation
2018
2019
Delivered permanent
cost savings, creating
incremental value for
our stakeholders
2020
Formalized CI organization
to facilitate continuous
improvement practices and CI
culture throughout
the company
4
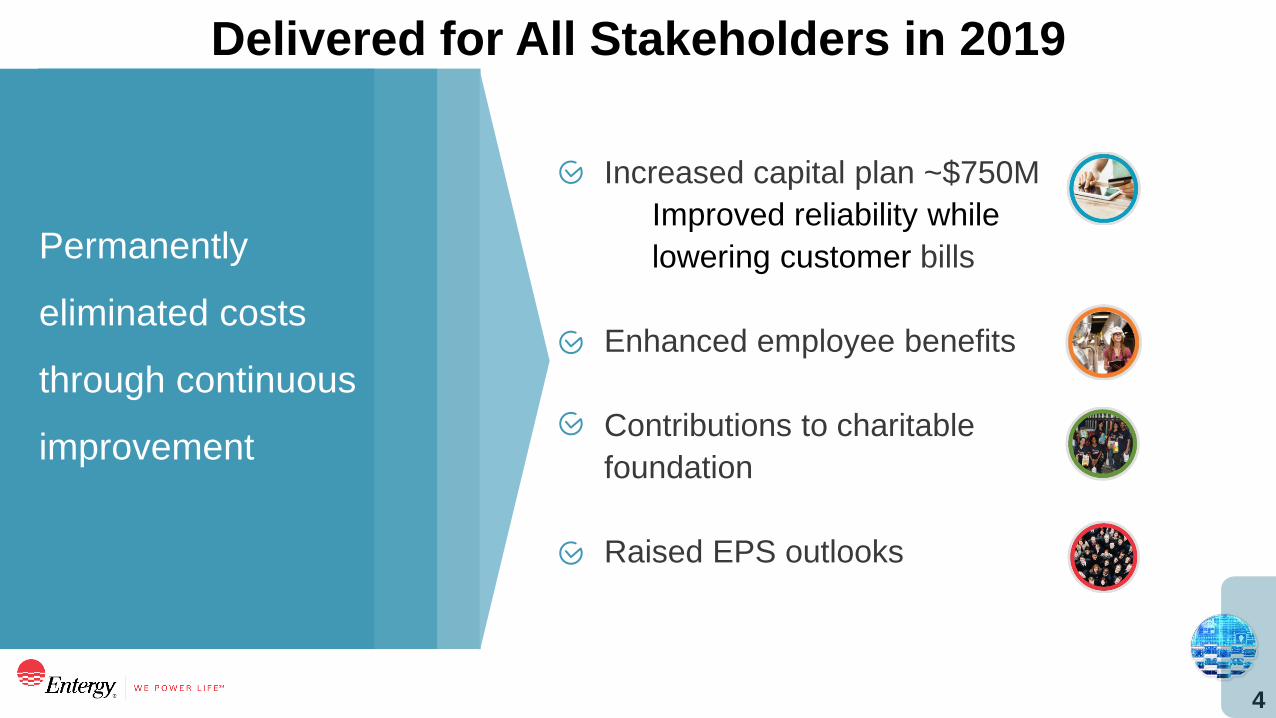
Delivered for All Stakeholders in 2019
Permanently
eliminated costs
through continuous
improvement
Increased capital plan ~$750M
Improved reliability while
lowering customer bills
Enhanced employee benefits
Contributions to charitable
foundation
Raised EPS outlooks
5
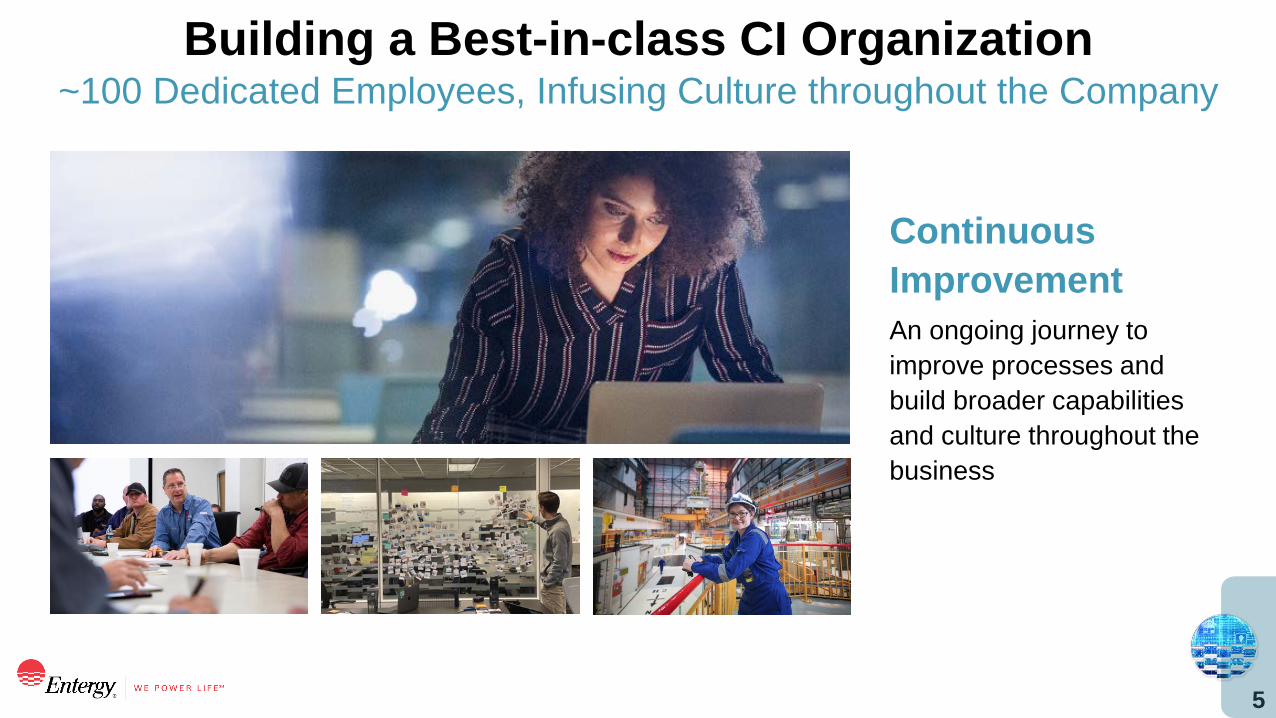
~100 Dedicated Employees, Infusing Culture throughout the Company
Building a Best-in-class CI Organization
Continuous
Improvement
An ongoing journey to
improve processes and
build broader capabilities
and culture throughout the
business
6
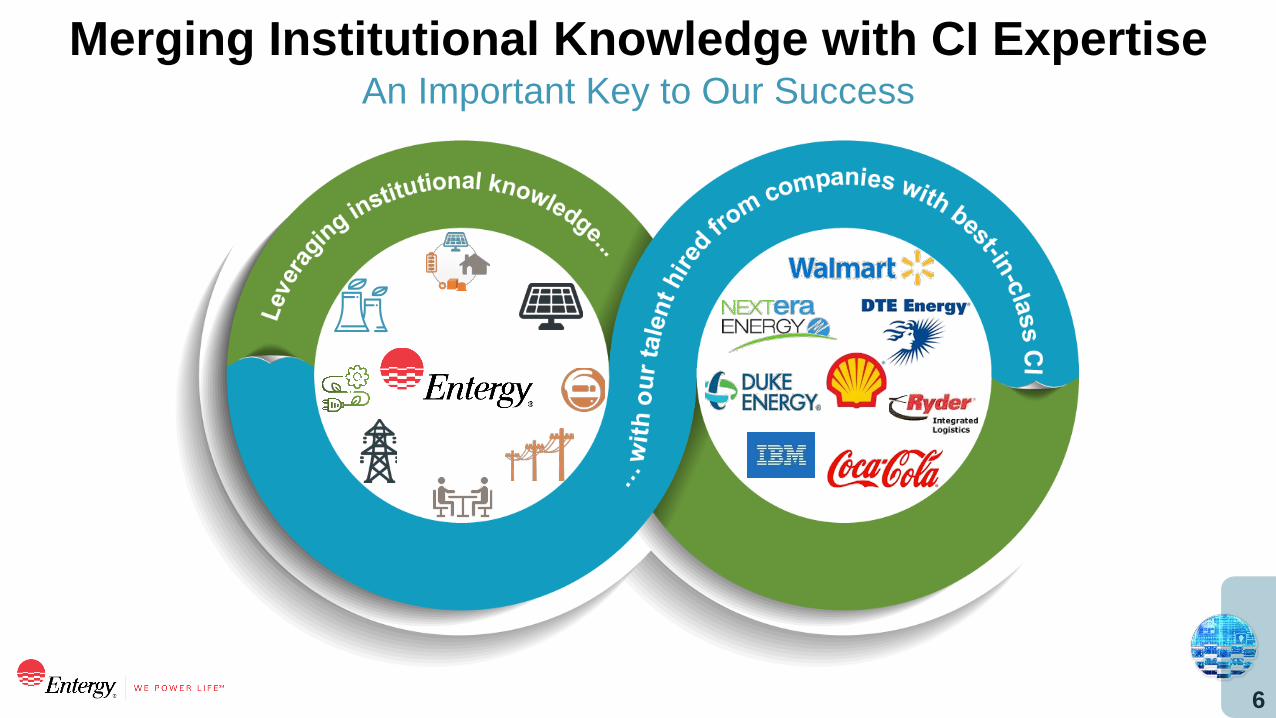
An Important Key to Our Success
Merging Institutional Knowledge with CI Expertise

7
Leading the Way for a Culture that Collaborates and Innovates
Leveraging CI to Drive Opportunity for Upside
I nc reas ing impac t
Classic
Quality-driven
improvements
Collaborative
Cross-functional
improvements
Tech-enabled
Technology
improvements

8
An Example: Building Efficiencies from AMI
AMI implementation
creates meter-reading
and service efficiencies and
provides real-time data
which gives us insights into
the customer experience
Layering on smart
automation
to the billing process
delivers seamless and
accurate bills and
creates permanent
cost savings
Which in turn
Improves billing quality
Improves the customer
outcome
Reduces exceptions in
processing
Reduces cost
Enhances value from AMI

9
An Example: Scaling Remote Monitoring
Installing remote sensors
and other smart devices throughout
the distribution network to prevent
truck rolls and to reduce customer
outages, which enables more efficient
restorations and reduces costs
Provides valuable
information
Improves the
customer outcome
Further improves
reliability and resiliencyReduces cost
Which in turn
Scaling this technology
to applications beyond distribution; pilots underway, with
plans to expand across operations

10
Our Opportunity Is Real
Source: BCG analysis; includes some adjustments for comparability
Includes vertically integrated utilities that have more than 1 million customers
Other O&M / total retail sales; ($/MWh)
0
10
20
30
0 50,000,000 100,000,000 150,000,000 200,000,000 250,000,000
Total retail sales (MWh)
Oth
er
O&
M (
$/M
Wh)
ETR
Top quartileTop decile
Illustrative

11
Continuous Improvement Creates Value for All Stakeholders
Our
opportunity
is real
Building a premier
CI organization and
infusing culture
throughout the
company
Successful
outcome in 2019
benefitting our
stakeholders
PAUL HINNENKAMP – EVP AND CHIEF OPERATING OFFICER
AN
AL
YS
T D
AY
2
02
0 Our
Environmental
Leadership
for a Cleaner
WorldSeptember 24, 2020

Continuous
Improvement
Creates
Value for All
Stakeholders
Our
Environmental
Leadership
for a Cleaner
World
On Track
to Achieve
Our Financial
Objectives
Our Vision
for Long-term
Sustainability
Building the Premier UtilityRO
D W
EST
–G
ROU
P PR
ESID
ENT,
UTI
LITY
OPE
RATI
ON
S
PAU
L H
INN
ENKA
MP
–EV
P AN
D CH
IEF
OPE
RATI
NG
OFF
ICER
DREW
MAR
SH –
EVP
AND
CHIE
F FI
NAN
CIAL
OFF
ICER
LEO
DEN
AULT
–CH
AIRM
AN O
F TH
E BO
ARD
AND
CEO
JULI
E H
ARBE
RT –
SVP,
CO
RPO
RATE
BU
SIN
ESS
SERV
ICES
Creating
an Optimal
Customer
Experience
1
2
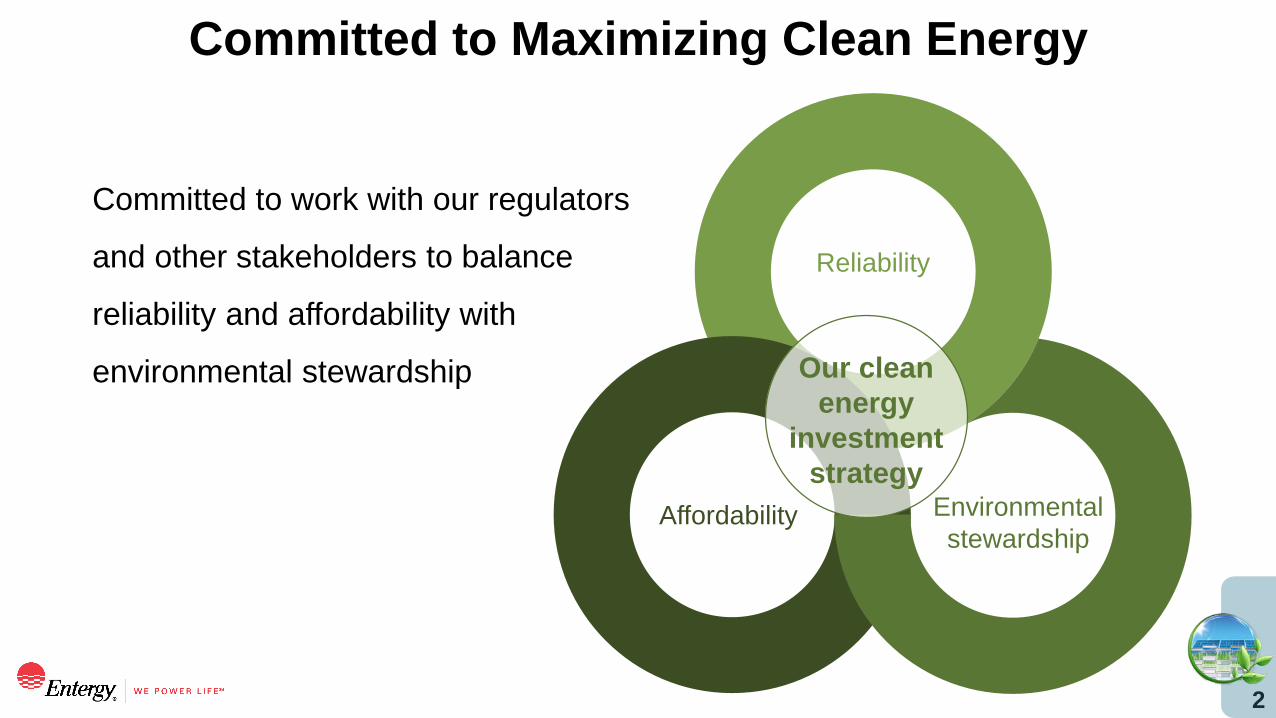
Committed to Maximizing Clean Energy
Committed to work with our regulators
and other stakeholders to balance
reliability and affordability with
environmental stewardship
Reliability
Environmental
stewardship
Our clean
energy
investment
strategy
Affordability
3
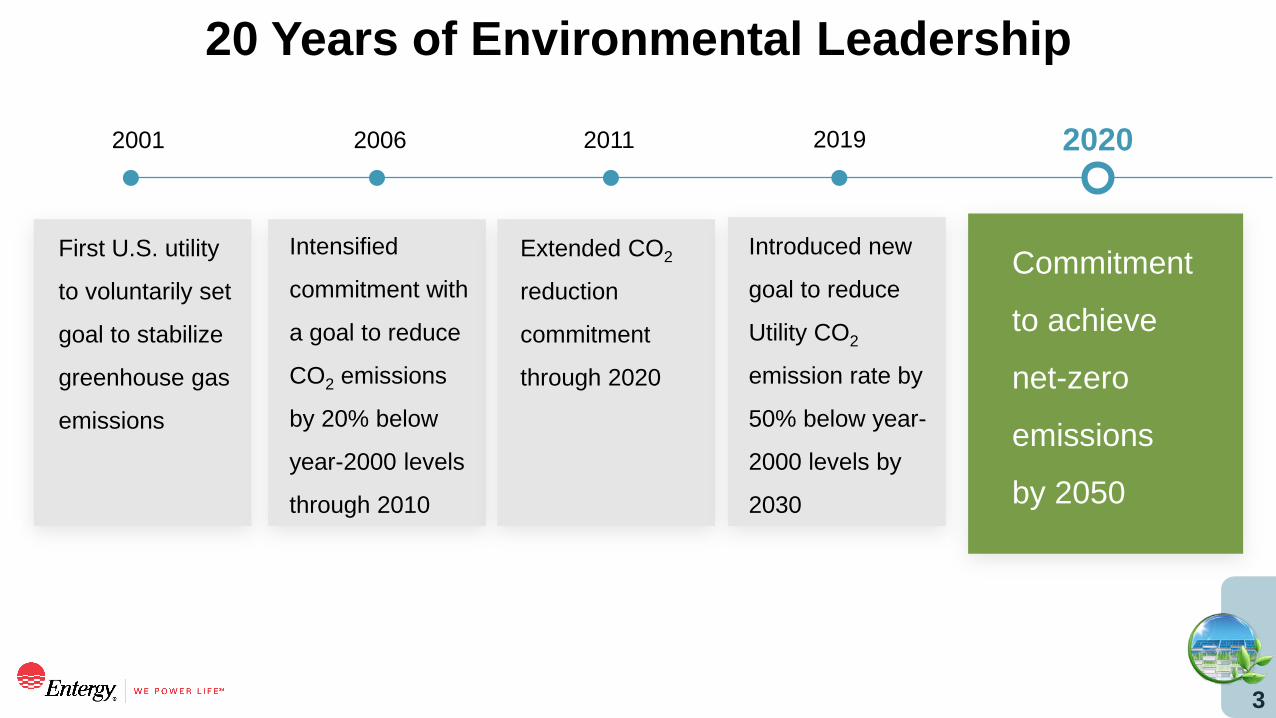
20 Years of Environmental Leadership
20202001 2006 2011 2019
First U.S. utility
to voluntarily set
goal to stabilize
greenhouse gas
emissions
Intensified
commitment with
a goal to reduce
CO2 emissions
by 20% below
year-2000 levels
through 2010
Extended CO2
reduction
commitment
through 2020
Introduced new
goal to reduce
Utility CO2
emission rate by
50% below year-
2000 levels by
2030
Commitment
to achieve
net-zero
emissions
by 2050

4
And a Commitment to Do Even More
A Track Record of Results
2000 2010 2019 2030goal
2050goal
Entergy Utility CO2 emission rates; lbs per MWh
U.S. power sector average
Net
zero
Reduction vs 2000 ~20% ~30% 50% 100%
Reduction vs 2019 ~30% 100%

5
Among the Cleanest Large-scale Fleets in the U.S.
Entergy Utility
CO2 emission rates of top 20 privately / investor-owned power producers; lbs/MWh
Based on MJ Bradley, Benchmarking Air Emissions of the 100 Largest Electric Power Producers in the United States, published July 2020 (2018 data)

6
• Less than 5% of 2019 revenue
was derived from coal assets
• Less than 2% of 2019 rate base
was comprised of coal assets
• Intend to retire all coal-fired
capacity by end of 2030
Minimal Coal Generation
Entergy Utility
Coal generation of top 20 privately / investor-owned
power producers; MWh
Based on MJ Bradley, Benchmarking Air Emissions of the 100 Largest Electric Power Producers in the United States, published July 2020 (2018 data)
6

7
In service, in progress, and
announced renewable portfolio
$1.4 Billion in Our Capital Plan
Growing Our Renewables Portfolio
~561 MW in service
~425 MW installations in progress
~350 MW announced
7

8
Transforming Our Generation Portfolio
1 Subject to integrated resource planning processes, economic evaluations, and regulatory approvals2 Potential 2030 and Potential 2050 portfolios assume technology advancements and/or declining costs of carbon-free technologies in order to balance environmental
stewardship with affordability and reliability; for Potential 2050, offsets utilized for remaining emissions
Owned generation capacity
As of 6/30/2020 IllustrativePotential 20301,2
Evaluating conventional
generation, storage, and
emerging technologies
Potential 20501,2
Coal
Legacy
gas
(pre-
2000)
Modern gas
(post-2000)
Nuclear Nuclear
Legacy
gas
Modern gas
Illustrative
Renewables
Nuclear
Legacy
gas
Modern gas
Renewables
TBD
Zero-carbon
technologies
Emerging
technologies
Includes modern gas
assets retrofitted to
incorporate emerging
technologies
Modern gas
Zero carbon
technologies
Emerging
Technol-
ogies

9
Technology Will Pave the Path to Net-zero by 2050
Path to net-zero
Legacy asset retirements
Renewables and storage
Nuclear license extensions
Hydrogen co-firing
Advanced hydrogen infrastructure
Carbon capture
Advanced nuclear
Offsets

10
Combining the Strengths of Industry Leaders to Move Towards Net-zero
Entergy / Mitsubishi Decarbonization Collaboration
Identified areas of collaboration
Demonstrate
hydrogen flex
concepts
CCGT
innovation
Includes storage,
new build, and
battery
New build
resource
Storage and
conversion
Storage
projects
Nuclear-supplied
electrolysis facility
with storage
Nuclear
hydrogen
Convert renewables
to green hydrogen,
with battery
CCGT
expansion
10

11
And Preserving Our Ability to Transition Existing and New Gas to Hydrogen
Pursuing the Deployment of Renewable Hydrogen
Fleet vehicle
Industrial coal processes
Ship1
We are well positioned
Entergy-owned storage facility
(Spindletop) with three caverns
Started initial evaluation to explore
converting a cavern to hydrogen
storage
Existing hydrogen infrastructure in
the gulf south
Spindletop storage facility
Beaumont, TX
Illustrative

12
Hydrogen pipeline infrastructure
Texas industrial corridor
Hydrogen Pipeline Infrastructure in Place
2
1 Large scale storage (Spindletop)
2 Entergy’s Sabine Power Plant
3 Hydrogen storage facility (third party)
2
Company A pipeline
Sabine Power Plant
(site for proposed
Orange County project)
Multiple hydrogen pipelines nearby
leveraging existing infrastructure
1
Hydrogen pipelines
3
Illustrative
13
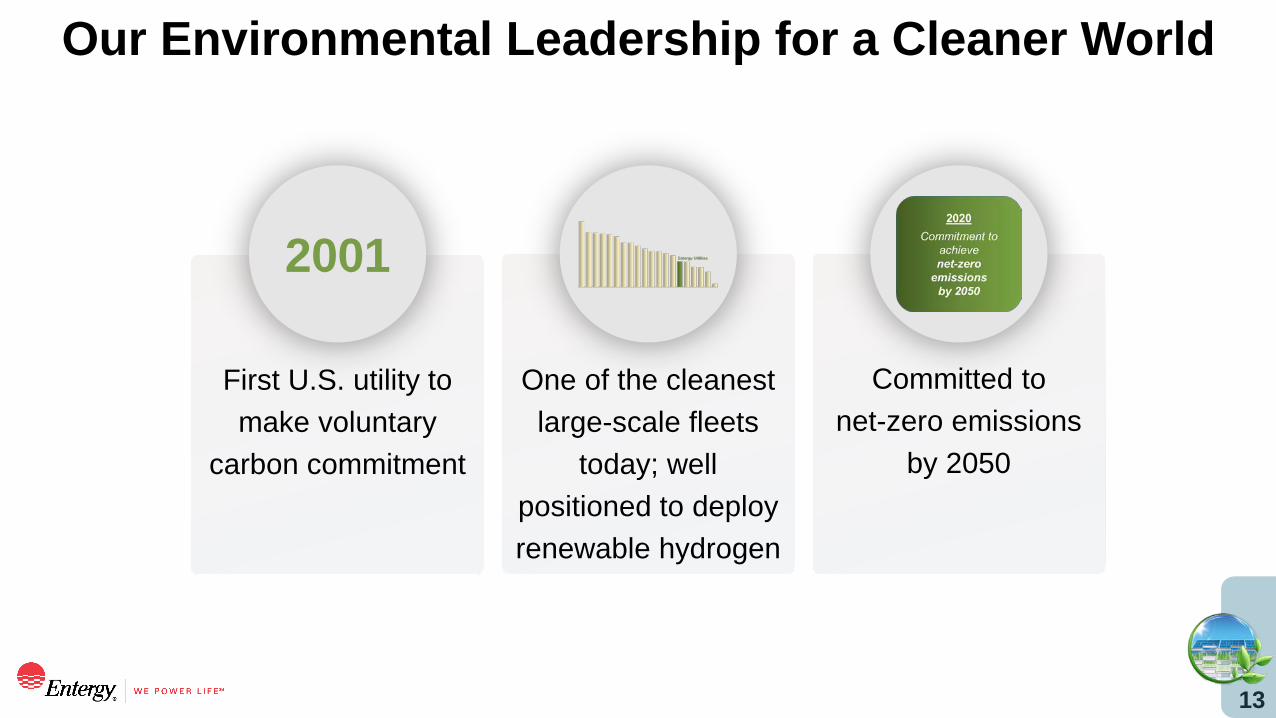
Our Environmental Leadership for a Cleaner World
2001
Committed to
net-zero emissions
by 2050
One of the cleanest
large-scale fleets
today; well
positioned to deploy
renewable hydrogen
First U.S. utility to
make voluntary
carbon commitment

DREW MARSH – EVP AND CHIEF FINANCIAL OFFICERAN
ALY
ST
DA
Y 2
02
0
On Track to
Achieve Our
Financial
Objectives
September 24, 2020

ROD
WES
T –
GRO
UP
PRES
IDEN
T, U
TILI
TY O
PERA
TIO
NS
Continuous
Improvement
Creates
Value for All
Stakeholders
Our
Environmental
Leadership
for a Cleaner
World
PAU
L H
INN
ENKA
MP
–EV
PAN
DCH
IEF
OPE
RATI
NG
OFF
ICER
On Track
to Achieve
Our Financial
Objectives
DREW
MAR
SH –
EVP
AND
CHIE
F FI
NAN
CIAL
OFF
ICER
LEO
DEN
AULT
–CH
AIRM
AN O
F TH
E BO
ARD
AND
CEO
Our Vision
for Long-term
Sustainability
JULI
E H
ARBE
RT –
SVP,
CO
RPO
RATE
BU
SIN
ESS
SERV
ICES
Building the Premier Utility
Creating
an Optimal
Customer
Experience
1

2
Clear Financial Objectives to Create Sustainable Value
Steady, predictable
earnings and
dividend growth
Customer-centric capital plan
Progressive regulatory mechanisms
Solid credit and liquidity
Disciplined cost management programs
New customer solutions revenue
Identified opportunities and risk mitigations
Grow the Utility... ...while managing risk

3
Hurricane Laura Preliminary Cost Estimate
1 As of 9/22/202 Hurricane Katrina costs escalated to 2020 dollars using Consumer Price Index
E-LA E-TX Other OpCos
1.25 – 1.40 0.23 – 0.26 <0.03
Preliminary estimates by OpCo; $B
Preliminary thoughts on recovery
for LA and TX
• Expect to request recovery through
securitization
• Potential for federal support
HurricaneLaura
HurricaneKatrina
Preliminary cost estimate1; $B
1.5–1.7
Transmission
Distribution
Support
GenerationOther
Gas
1.552

4
Federal Recognition of Gulf Coast Infrastructure
“It is important that we rebuild the grid – and I don’t know the number yet, but it’s going to be a multibillion-dollar event, it could be as high as $2 billion or might be more—it’s important that the cost not be borne by the Louisiana ratepayers.”
Given the critical nature of the energy infrastructure in southwest Louisiana, if the cost of the power grid infrastructure cannot be met from the disaster relief funds, “the Congress may choose to pass a catastrophic recovery bill, and if they do that then that’s a whole different conversation.” -- U.S. Secretary of Energy Dan Brouillette
“The transmission loss in Louisiana is significant, with more than 1,000 transmission structures damaged or destroyed by the storm. Rebuilding the transmission system is essential to the overall restoration effort and will take weeks given the massive scale and complexity of the work. We will continue to coordinate closely to ensure the full capabilities of the industry and government are marshaled to rebuild this critical infrastructure as quickly as possible.” -- U.S. Deputy Secretary of Energy Mark Menezes

5
Results in Steady Rate Base Growth
Customer-centric Utility Plan
1 Internal estimates based on last-approved rate base adjusted for assumed changes in the major rate base components and includes CWIP; deferred taxes are deducted
from rate base for all OpCos, including E-AR
4 8
12
16
21
20E 21E 22E 23E 24E
Utility five-year capital plan and
depreciation expense; cumulative $B
Depr.
exp.
28 31
33 35
38
20E 21E 22E 23E 24E
Projected rate base1; $B

6
Expect to Align Dividend Growth Rate with EPS Growth Rate in 4Q211
Steady, Predictable Earnings and Dividend Growth
1 Subject to board approval
16 17 18 19 20Eguidance
21Eoutlook
22Eoutlook
23Eoutlook
24Eoutlook
ETR adjusted EPS; $
5.45–
5.75
5.80–
6.10
6.15–
6.45
6.55–
6.85
5.40
4.39
6.95–
7.25
3.96
5.29
Last EWC nuclear plant
sold
EWC is no longer an
adjustment
(3.26) 2.28 4.63 6.30
As-reported
7
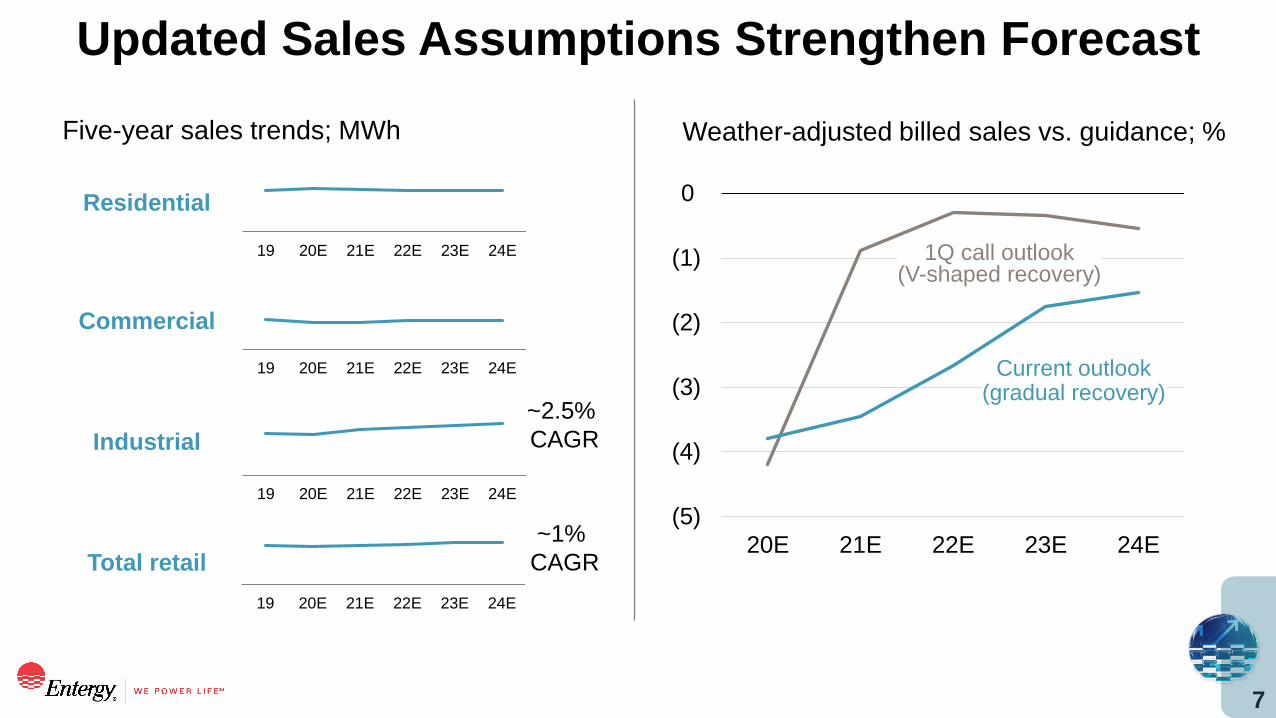
Updated Sales Assumptions Strengthen Forecast
Five-year sales trends; MWh
Residential
Commercial
Industrial
Total retail
19 20E 21E 22E 23E 24E
19 20E 21E 22E 23E 24E
19 20E 21E 22E 23E 24E
~1%
CAGR
~2.5%
CAGR
19 20E 21E 22E 23E 24E
Weather-adjusted billed sales vs. guidance; %
(5)
(4)
(3)
(2)
(1)
0
20E 21E 22E 23E 24E
Current outlook(gradual recovery)
1Q call outlook(V-shaped recovery)

8
Flattening the O&M Curve
2.552.70 2.70 2.70 2.70
20E 21E 22E 23E 24E
Utility Other O&M; $B
Planned $100M
spendingreduction
(2020 only)
Sources of O&M increases:
• Energy efficiency
(directly recovered)
• Benefit expense
• Distribution investment

9
O&M Flexibility and Continuous Improvement Benefit All Stakeholders
Disciplined Cost Management
Headwind flex
Supports steady, predictable
earnings
Creates headroom for incremental
investment, employee benefits,
and regulatory risk
Illustrative IllustrativeO&M flexibility – short-term Continuous improvement – permanent
O&
M
O&
M Planned O&M
Permanent
cost reductions
Tailwind flex
Planned
O&M
Time Time

10
Updated Pension Assumptions Strengthen Forecast
3.39 3.00
20E 21E
Discount rate assumption; %
Lower discount rate and return on asset assumptions
Return on assets assumption; %
7.00 6.75
20E 21E
$2.8Bpension
contributions
2014–2020E
Pension contributions and liability reduction initiatives
$925M+liability reduction
initiatives
2015–YTD 2020

11
Structured Financing Can Create Bill Headroom
1 Options include tax equity partnership
Illustrative
1.4
20E–24E plan
Structuredfinancing
Opportunity
to redeploy
Capital expenditures; $B
Normal revenue
requirement
Illustrative
Revenue r
equirem
ent
Customer bill
headroom
Structured
financing
Time
Customer bills; $
1
Renewable
investments

12
Tax Policy Could Generate Credit Capacity
1 Should the corporate tax rate increase, we will work with our regulators on the appropriate means to collect costs, consistent with our goal of keeping rates low
What happened
in 2018...
~$1.4B unprotected excess ADIT
owed to customers
(~$1.1B returned to date)
~$300M lower annual collection of
taxes from customers
Decreased cash flow
More equity needed to
fund capital plan
What could happen if tax
rates increase…1
Unprotected excess ADIT
returned to OpCos
(offsets rate base)
Higher collection of
taxes from customers
Increased cash flow
Less equity needed to
fund capital plan
Excess ADIT
Taxes
Cash flow
Equity

13
Five-year Sources and Uses1
Our Financing Plan Supports Our Objectives
1 Does not reflect impacts from Hurricane Laura; storm costs expected to be offset primarily by securitization recovery2 A variety of methods are being considered (e.g., ATM, block trades, preferred); tax reform could change amount and timing
Total sources; $B
18
5
2.5
21
4
1
20E–24E Sources 20E–24E Uses
Total uses; $B
• Supports capital plan
• Supports steady, predictable EPS
and dividend growth
• Strengthens credit position
• Structured financing and tax policy
could change amount and timing
Operating cash flow
Net debt issuances
Equity issuances2
Capital expenditures
Dividends
Nuclear fuel / other
14
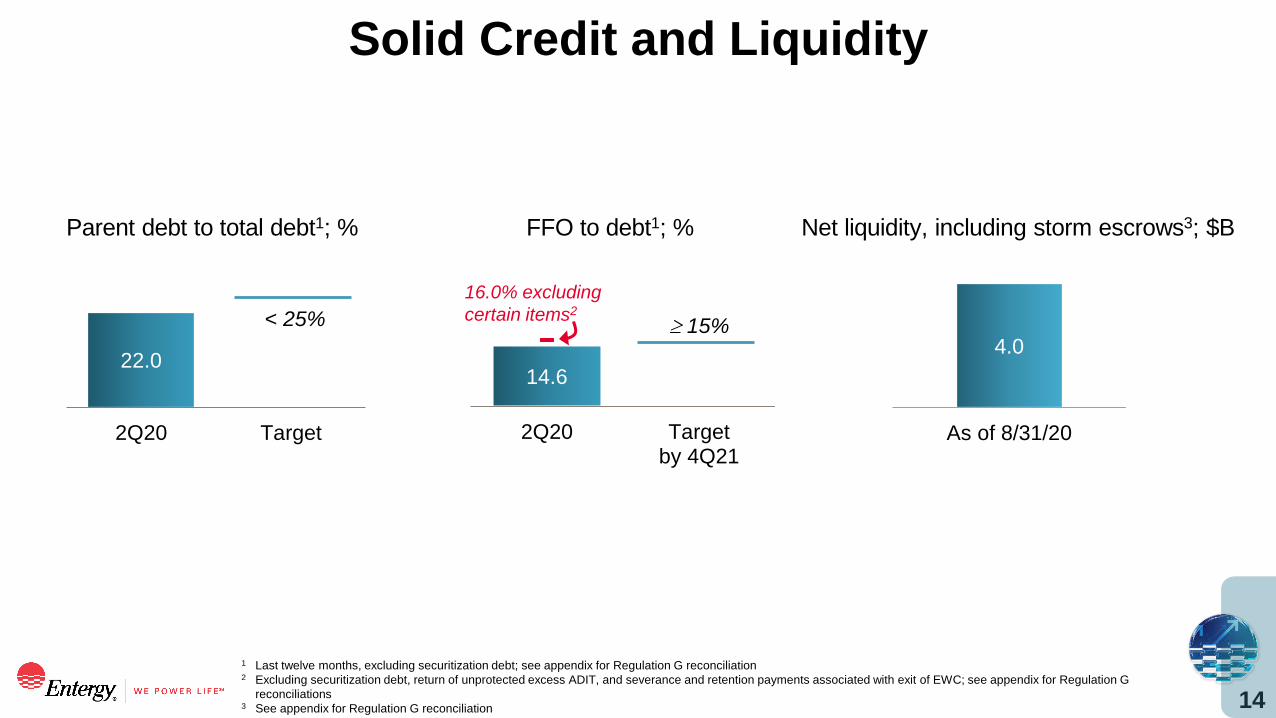
Solid Credit and Liquidity
1 Last twelve months, excluding securitization debt; see appendix for Regulation G reconciliation2 Excluding securitization debt, return of unprotected excess ADIT, and severance and retention payments associated with exit of EWC; see appendix for Regulation G
reconciliations3 See appendix for Regulation G reconciliation
22.0
2Q20 Target
Parent debt to total debt1; %
< 25%
14.6
2Q20 Targetby 4Q21
FFO to debt1; %
≥ 15%16.0% excluding certain items2
4.0
As of 8/31/20
Net liquidity, including storm escrows3; $B

15
5x
10x
15x
20x
25x
30x
35x
1% 2% 3% 4% 5% 6%
Well-positioned Opportunity
Focused on Building the Premier Utility
As of 9/22/20
Source: Capital IQ
Dividend yield (%)
20
21
P/E
mu
ltip
le
2021 P/E multiples and dividend yields for UTY companies
ETR

16
On Track to Achieve Our Financial Objectives
Focused on new
opportunities and
managing risks
Solid credit and
liquidity
Steady, predictable
5%−7% EPS and
dividend growth
LEO DENAULT – CHAIRMAN AND CHIEF EXECUTIVE OFFICERAN
ALY
ST
DA
Y 2
02
0
Our Vision
for Long-term
Sustainability
September 24, 2020

Continuous
Improvement
Creates
Value for All
Stakeholders
Our
Environmental
Leadership
for a Cleaner
World
On Track
to Achieve
Our Financial
Objectives
Our Vision
for Long-term
Sustainability
Building the Premier UtilityR
OD
WES
T –
GR
OU
P P
RES
IDEN
T, U
TILI
TY O
PER
ATIO
NS
PAU
L H
INN
ENK
AM
P –
EVP
AN
D C
HIE
F O
PER
ATIN
G O
FFIC
ER
DR
EW M
AR
SH –
EVP
AN
D C
HIE
F FI
NA
NC
IAL
OFF
ICER
LEO
DEN
AU
LT –
CH
AIR
MA
N O
F TH
E B
OA
RD
AN
D C
EO
JULI
E H
AR
BER
T –
SVP,
CO
RP
OR
ATE
BU
SIN
ESS
SER
VIC
ES
Creating
an Optimal
Customer
Experience
1

2
We’re on Track
Operationally
Financially
Strategically

3
Long-term opportunity:
A strong foundation
upon which we will
continue to grow
Solving traditional problems in a
different way
Looking for carbon reduction
opportunities beyond ourselves,
like beneficial electrification
Identifying opportunities to
continue to grow and benefit our
customers

4
To Unlock Opportunities We Otherwise Would Not Have
Solving Traditional Problems in a Different Way
By starting with
the customer…
… we identify new
opportunities
Understand
customer frictionsEvaluate
options
Deliver best customer
solutions

5
What We’re Working on Today
Customer-sited back-up generation
Power Through~440 units
in capital plan
Electrification of marine vessels
while at port
Beneficial electrification 2 installationsin 2020
A regional microgrid solution in a
coastal area anchored by generation on
a floating power barge
Microgrids
1 projectin capital plan

6
Creates a Unique Opportunity for Beneficial Electrification
Our Low Emission Rate
Sources: Car and fleet vehicle, The NorthBridge Group; all others, internal estimate
Entergy Utility 2030 (estimate)
Industrial natural gas process
Docked ship (diesel power)
Industrial coal process
Fleet vehicle
Car
ETR 2019 Utility average
IllustrativeCO2 emission rates, lbs per MWh
Opportunity to improve societal emissionsEntergy Utility 2030 (estimate)

7
As We Create Headroom in Customer Bills
No Shortage of Value-creation Opportunities
Customers Employees
Communities Owners
• Higher level of
service while
maintaining low rates
• Enhanced benefits
• Training and
development
programs
• Investment in
charitable foundation
• Economic
development
• Risk reduction
• Improved earnings
and dividend growth

8
As We Create Headroom in Customer Bills
Identified Incremental Customer-centric Investment
Grid infrastructure /
modernizationCustomer solutions /
distributed resources
Up to ~$2B over the next five years

9
To Support Continued 5%−7% Growth, While Managing Customer Bills
Strong Investment Opportunity Beyond 2024
~$19B estimated
2025 through 2030
~$18B estimated
2025 through 2030
~$5B estimated
2025 through 2030
~$7B estimated
2025 through 2030
Grid infrastructure /
modernization
Enabling
technologies
Customer solutions /
distributed resources
Baseline
investments
Illustrative

10
Industry leader in critical measures of sustainability
Among the lowest retail rates in the U.S.
One of the cleanest large-scale generation fleets in
the U.S.
Robust capital plan ready for deployment
Constructive and progressive regulatory mechanisms
Strong 5% to 7% adjusted EPS growth
Clarity on dividend growth strategy
Commitment to continuous improvement
Uniquely
positioned to be

AN
AL
YS
T D
AY
20
20
Appendix
September 24, 2020
1
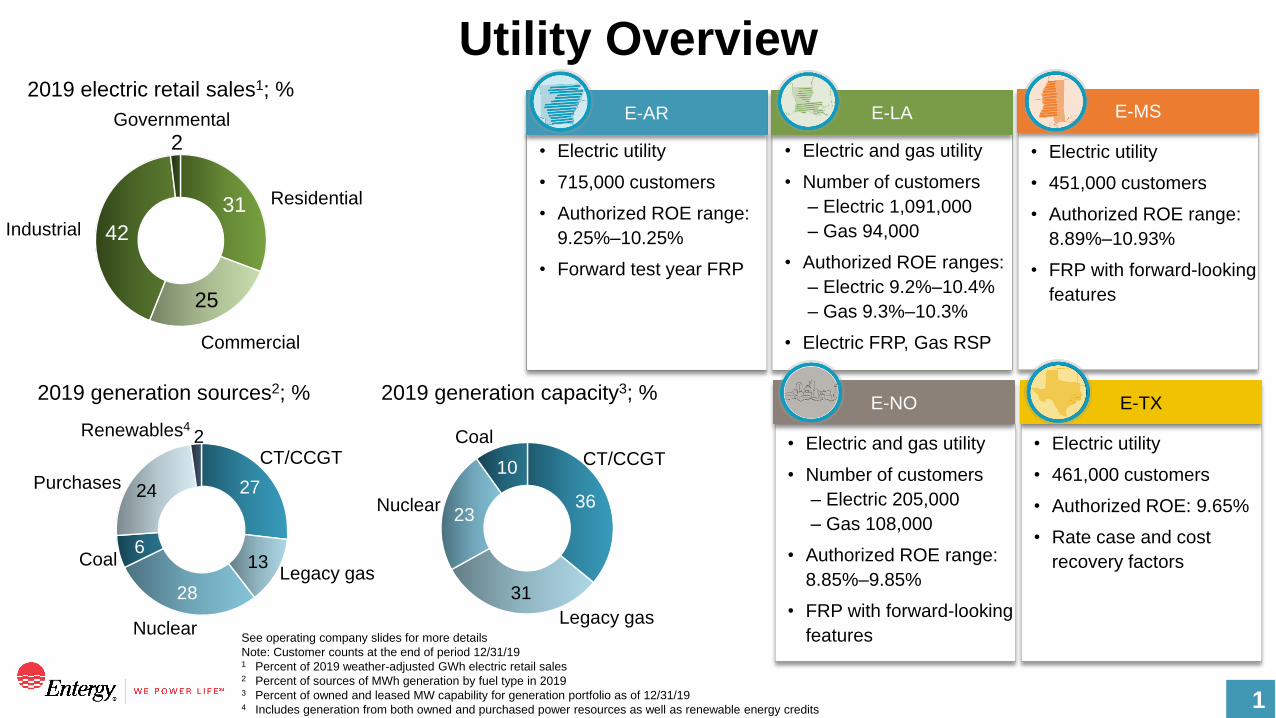
Utility Overview
See operating company slides for more details
Note: Customer counts at the end of period 12/31/191 Percent of 2019 weather-adjusted GWh electric retail sales2 Percent of sources of MWh generation by fuel type in 20193 Percent of owned and leased MW capability for generation portfolio as of 12/31/194 Includes generation from both owned and purchased power resources as well as renewable energy credits
• Electric utility
• 715,000 customers
• Authorized ROE range:
9.25%–10.25%
• Forward test year FRP
E-AR
• Electric and gas utility
• Number of customers
– Electric 1,091,000
– Gas 94,000
• Authorized ROE ranges:
– Electric 9.2%–10.4%
– Gas 9.3%–10.3%
• Electric FRP, Gas RSP
E-LA
• Electric utility
• 451,000 customers
• Authorized ROE range:
8.89%–10.93%
• FRP with forward-looking
features
E-MS
• Electric and gas utility
• Number of customers
– Electric 205,000
– Gas 108,000
• Authorized ROE range:
8.85%–9.85%
• FRP with forward-looking
features
E-NO
• Electric utility
• 461,000 customers
• Authorized ROE: 9.65%
• Rate case and cost
recovery factors
E-TX
31
25
42
2
2019 electric retail sales1; %
Commercial
Industrial
Governmental
Residential
36
31
23
10
2019 generation capacity3; %
27
13
28
6
24
2
2019 generation sources2; %
CT/CCGT
Legacy gas
Nuclear
Coal
Purchases
Renewables4
CT/CCGT
Legacy gas
Nuclear
Coal

2
Entergy Arkansas
E-AR (currently in rates)
Metric Detail
Authorized ROE 9.25%–10.25%
Rate base $8.0B retail rate base (2020 test year)
WACC (after-tax) 5.20%
Equity ratio 36.49% (47.76% excluding $1.9B ADIT at
0% cost rate)
Regulatory construct Forward test year FRP; result outside authorized
ROE range resets to midpoint; maximum rate
change 4% of filing year total retail revenue;
true-up of projection to actuals netted with future
projection
FRP rate change $10M increase effective 1/2/20 ($57M 2020 test
year less $(47M) previously reserved for 2018 test
year true-up)
Riders Fuel and purchased power, MISO, capacity,
Grand Gulf, tax adjustment, energy efficiency

3
Annual FRP Filing and Request to Extend FRP
Entergy Arkansas
Calculations may differ due to rounding
See discussion of Rate and Regulatory Matters in the most recent Form 10-K and/or any subsequent Form 10-Qs
2020 evaluation report – docket 16-036-FR
Filing highlights 2021 test year 2019 test year
Earned ROE 7.86% 9.07%
Rate base (ADIT incl. in WACC, not rate base) $8.4B $7.5B
WACC (after-tax) 5.34% 5.10%
Equity ratio (traditional equity ratio) 37.24% (46.90% excluding
$1.8B ADIT at 0% cost rate)
35.00% (46.49% excluding
$1.8B ADIT at 0% cost rate)
Revenue requirements to midpoint $79M $24M
Rate change requested $74M (cap)
Category 2021 test year 2019 test year
Cost of capital 11 12
Expense items (5) (10)
Rate base 28 25
Revenue / sales volume 45 (4)
Total revenue requirement 79 24
Rate change requested 74 (cap)
Major components of revenue requirement; $M
Date Annual FRP filing
10/28/20 Stipulation or settlement deadline
11/4/20 Hearing
12/14/20 Requested decision
1/2/21 Requested rate effective date
Date Request to extend FRP
12/15/20 Hearing
2/1/21 Requested decision
Key dates

4
Entergy Louisiana
1 Pending finalization of the 2019 test year filing (docket U-35581), 2018 test year filing (docket U-35205), and the 2017 test year filing (docket U-34951)2 Pending finalization of the 2019 test year filing (docket U-35488)3 50 bps dead band, 51 bps–200 bps 50% sharing, >200 bps adjust to 200 bps plus 75 bps sharing; for infrastructure costs, 100% sharing above the band4 Does not include MISO / other or tax reform adjustment mechanism (amount varies over time)
E-LA (currently in rates)
Metric Detail – electric1 Detail – gas2
Authorized ROE 9.2%–10.4% 9.3%–10.3%
Last filed rate base $11.9B (12/31/19 test year)
+ $0.4B for transmission
rider + $0.8B for capacity rider
$0.08B (9/30/19 test
year)
WACC (after-tax) 6.97% 6.96%
Equity ratio 48.63% 48.37%
Regulatory construct FRP; 60/40 customer / company
sharing outside bandwidth
RSP3
FRP and certain rider
rate changes4
No base rate change requested
from cost of service; $45M
increase for transmission rider;
$112M increase for LCPS included
in capacity rider (first year annual
revenue requirement)
$(0.2M) ADIT credit
$0.5M IIRR-G
Riders / specific
recovery
Fuel, capacity, MISO, transmission Gas infrastructure

5
Request for FRP Extension
Entergy Louisiana
See discussion of Rate and Regulatory Matters in the most recent Form 10-K and/or any subsequent Form 10-Qs
FRP extension filing highlights (docket U-35565)
• Extension period: three years (2021–2023 filing years)
• Allowed ROE unchanged (9.2% – 10.4%, 9.8% midpoint)
• Midpoint ROE reset in 2021 filing year
• Rate base: end-of-period measurement
• Sharing outside allowed ROE band unchanged (60 / 40 (customer / company) for 2022–2023 filing years)
• Distribution recovery mechanism: new mechanism for distribution annual investment above $100M
• Transmission recovery mechanism unchanged
• Capacity cost recovery mechanism unchanged
6
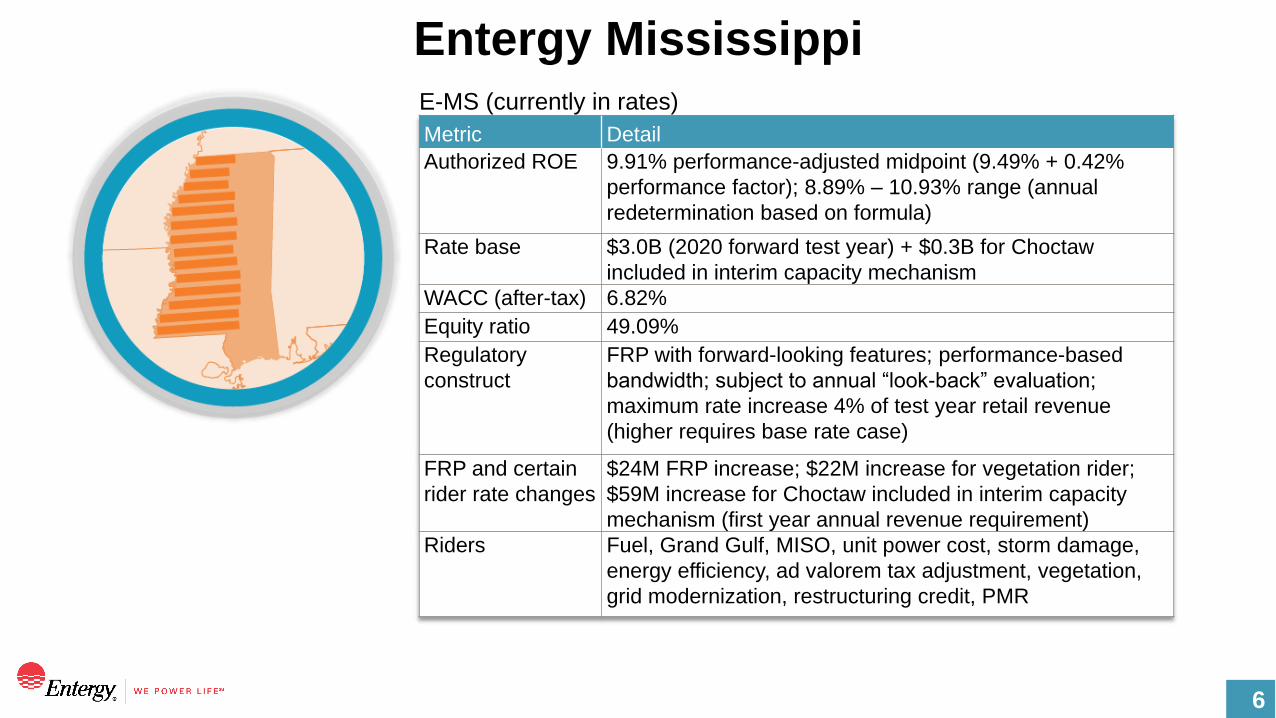
Entergy MississippiE-MS (currently in rates)
Metric Detail
Authorized ROE 9.91% performance-adjusted midpoint (9.49% + 0.42%
performance factor); 8.89% – 10.93% range (annual
redetermination based on formula)
Rate base $3.0B (2020 forward test year) + $0.3B for Choctaw
included in interim capacity mechanism
WACC (after-tax) 6.82%
Equity ratio 49.09%
Regulatory
construct
FRP with forward-looking features; performance-based
bandwidth; subject to annual “look-back” evaluation;
maximum rate increase 4% of test year retail revenue
(higher requires base rate case)
FRP and certain
rider rate changes
$24M FRP increase; $22M increase for vegetation rider;
$59M increase for Choctaw included in interim capacity
mechanism (first year annual revenue requirement)
Riders Fuel, Grand Gulf, MISO, unit power cost, storm damage,
energy efficiency, ad valorem tax adjustment, vegetation,
grid modernization, restructuring credit, PMR
7
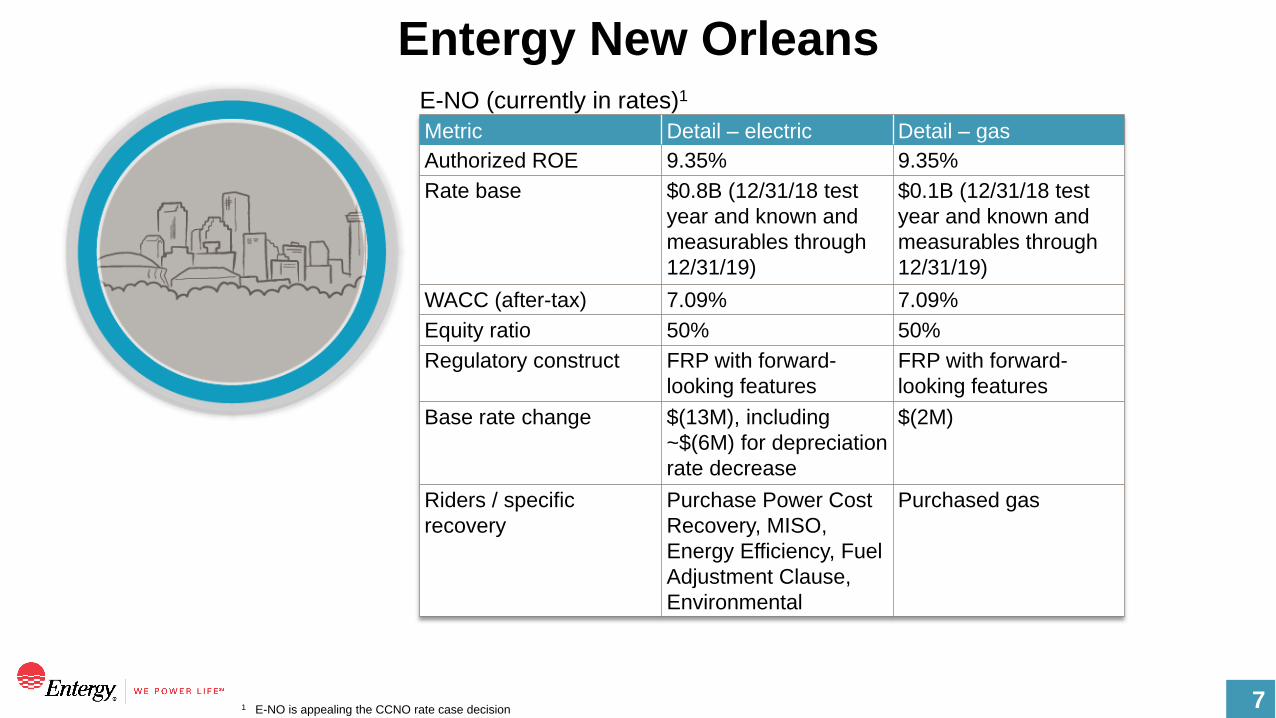
Entergy New Orleans
1 E-NO is appealing the CCNO rate case decision
Metric Detail – electric Detail – gas
Authorized ROE 9.35% 9.35%
Rate base $0.8B (12/31/18 test
year and known and
measurables through
12/31/19)
$0.1B (12/31/18 test
year and known and
measurables through
12/31/19)
WACC (after-tax) 7.09% 7.09%
Equity ratio 50% 50%
Regulatory construct FRP with forward-
looking features
FRP with forward-
looking features
Base rate change $(13M), including
~$(6M) for depreciation
rate decrease
$(2M)
Riders / specific
recovery
Purchase Power Cost
Recovery, MISO,
Energy Efficiency, Fuel
Adjustment Clause,
Environmental
Purchased gas
E-NO (currently in rates)1

8
Base Rate Case Filing
Entergy New Orleans
CCNO approval (docket UD-18-07)
• Base rate changes: $(13M) electric and $(2M) gas
• Allowed ROE: 9.35%
• Rate base: $0.8B electric and $0.1B gas (12/31/18 test year with known and measurable through 12/31/19)
• WACC (after-tax): 7.09%
• Equity ratio: 50%
• Approved FRP mechanism:
− Electric and gas (separate filings)
− Three years (2019–2021 test years) with known and measurable through filing year
− +/- 50 bps bandwidth; reset to midpoint
• Includes green pricing and new options for electrical vehicle charging infrastructure
• Implemented new rates with first billing cycle in April 2020, retroactive to August 2019 (retroactive portion
previously reserved)
Status
• E-NO filed an appeal with the district court on 12/6/19
• Settlement discussions in process
See discussion of Rate and Regulatory Matters in the most recent Form 10-K and/or any subsequent Form 10-Qs

9
Entergy Texas
1 Does not include the Tax Reduction rider
E-TX (currently in rates)
Metric Detail
Authorized ROE 9.65%
Rate base $2.4B (12/31/17 test year); plus $0.2B in cost
recovery factors
WACC (after-tax) 7.73%
Equity ratio 50.90%
Regulatory construct Rate case
Base and certain rider
rate changes
$53M increase1, plus amounts being recovered
via cost recovery factors ($19M in TCRF and
$3M in DCRF)
Riders Fuel, capacity, DCRF, TCRF, GCRR, rate case
expenses, AMI surcharge, tax reform, among
others
10
DCRF Filing
Entergy Texas
See discussion of Rate and Regulatory Matters in the most recent Form 10-K and/or any subsequent Form 10-Qs
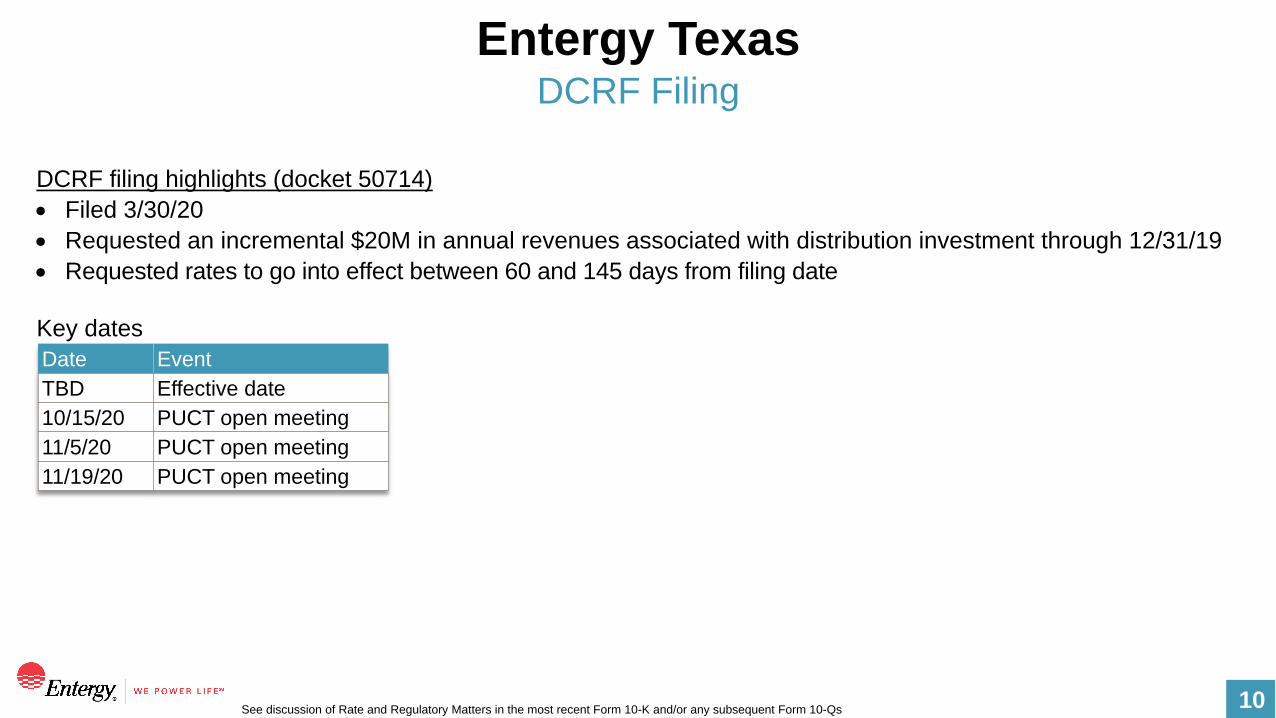
DCRF filing highlights (docket 50714)
• Filed 3/30/20
• Requested an incremental $20M in annual revenues associated with distribution investment through 12/31/19
• Requested rates to go into effect between 60 and 145 days from filing date
Key dates
Date Event
TBD Effective date
10/15/20 PUCT open meeting
11/5/20 PUCT open meeting
11/19/20 PUCT open meeting

11
System Energy Resources, Inc.
1 Ongoing proceeding at FERC challenging SERI’s authorized ROE and equity component (see next slide)2 For SERI ratemaking, the sale leaseback obligation is excluded from the capital structure and instead is treated as an operating lease and recovered as an O&M cost3 Percentages under SERI’s UPSA
Grand Gulf Nuclear Station
Metric Detail
Principal asset An ownership and leasehold interest in
Grand Gulf
Authorized ROE 10.94%1
Last calculated rate base $1.6B (6/30/20)
WACC (after-tax) 8.49%
Equity ratio 65%1,2
Regulatory construct Monthly cost of service
SERI – generation company
36
1433
17
E-NO E-AR
E-MS
E-LA
Energy and capacity allocation3; %
12
FERC Proceedings
System Energy Resources, Inc.
See discussion of Rate and Regulatory Matters in the most recent Form 10-K and/or any subsequent Form 10-Qs
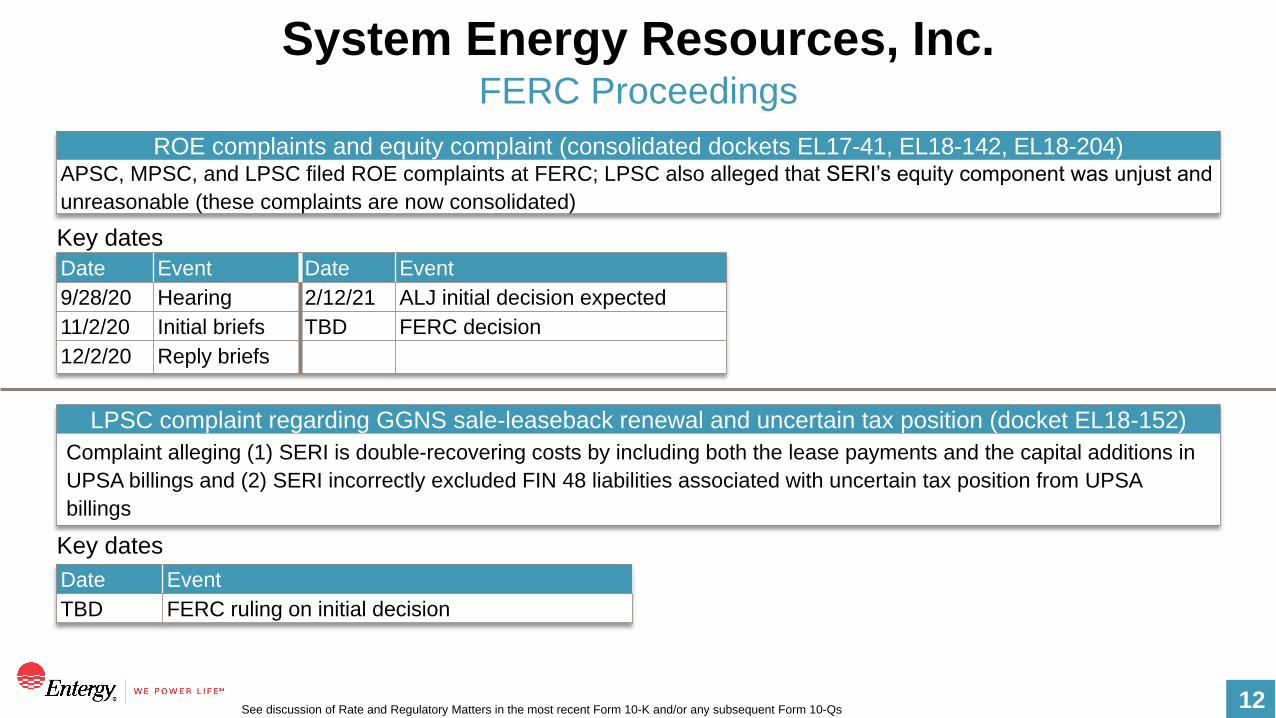
ROE complaints and equity complaint (consolidated dockets EL17-41, EL18-142, EL18-204)APSC, MPSC, and LPSC filed ROE complaints at FERC; LPSC also alleged that SERI’s equity component was unjust and
unreasonable (these complaints are now consolidated)
Key dates
Date Event Date Event
9/28/20 Hearing 2/12/21 ALJ initial decision expected
11/2/20 Initial briefs TBD FERC decision
12/2/20 Reply briefs
LPSC complaint regarding GGNS sale-leaseback renewal and uncertain tax position (docket EL18-152)
Complaint alleging (1) SERI is double-recovering costs by including both the lease payments and the capital additions in
UPSA billings and (2) SERI incorrectly excluded FIN 48 liabilities associated with uncertain tax position from UPSA
billings
Key dates
Date Event
TBD FERC ruling on initial decision

13
Announced Modern Gas Generation Projects
1 Includes transmission interconnection and other related costs2 Pursuing option to fuel with hydrogen
Project OpCo Location MW
Estimated
cost
Estimated
in service Status
Construction in progress / completed
Washington Parish
Energy Center
E-LA Bogalusa, LA ~361 CT $261M1 2020 Under construction
Montgomery County
Power Station
E-TX Willis, TX ~993 CCGT $937M1 2021 Under construction
RFPs
CCGT2 E-TX TBD 1,000–1,200
CCGT2
TBD 2025 / 2026 Evaluations in
progress

14
Growing Our Renewables Portfolio
1 Date of COD or entry of contract2 Includes the recently-announced 100MW Walnut Bend acquisition (noted under “Announced”)
Project MW Owned / PPA
Est.
in service
Installations in progress
New Orleans Commercial Rooftop
Solar
5 Owned 2020
Solar ~30 PPA 2020
Chicot Solar 100 PPA 2020
New Orleans Solar Station 20 Owned 2020
St. James Solar 20 PPA 2021
Iris Solar 50 PPA 2021
Sunflower County Solar 100 Owned 2021
Searcy Solar 100 Owned 2021
Announced / regulatory filings pending
Walnut Bend Solar 100 Owned 2022
Liberty County Solar 100 Owned 2023
Umbriel Solar 150 PPA 2023
RFPs
2019 E-AR Solar 2002 Owned 2022/2023
2020 E-LA Solar 300 Owned and
PPA
2023
Project MW
Owned /
PPA
In
service1
In service
Remmel Hydro ~11 Owned 1925
Carpenter Hydro ~62 Owned 1932
Toledo Bend Hydro ~41 PPA 1968
Vidalia Hydro ~114 PPA 1990
Agrilectric (bio-mass) ~9 PPA 2013
Rain CII (waste heat) ~27 PPA 2013
Montauk (bio-mass) ~3 PPA 2014
DeSoto Solar 0.5 Owned 2015
Blakely/Degray Hydro ~160 PPA 2016
Brookhaven Solar 0.5 Owned 2016
Hinds Solar 0.5 Owned 2016
Paterson Solar 1 Owned 2016
Stuttgart Solar 81 PPA 2017
Capital Region Solar 50 PPA 2020
New Orleans Residential
Rooftop Solar
0.5 Owned 2020

15
Integrated Resource Plans
Process Last filing Docket Next filing
E-AR Filed every
three years
10/31/18 07-016-U-Doc
Link to filing
2021
E-LA Filed every
four years
5/23/19 I-34694
Link to filing
2023
E-MS Filed every
three years
6/20/18 2014-AD-27Link to filing
2021
E-NO Filed every
three years
7/19/19 UD-17-03
Link to filing
2021
E-TX E-TX is not
required to file
an official IRP
N/A N/A N/A

16
Jurisdictional Base Rate Filing Frameworks
1 Not required to be filed per FERC order2 Parties in settlement discussions regarding the timing for filing E-NO’s 2020 test year FRP3 Requirement to file a base case filing every four years, requirement may be extended by PUCT if non-material change in rates would result; base rate case also required
18 months after generation recovery rider becomes effective4 May be suspended for an additional 150 days
E-AR E-LA E-MS E-NO E-TX SERI
Latest filing
date
FRP filed 7/7/20 FRP filed 5/29/20 FRP filed 3/2/20 Rate case filed
9/21/18
Rate case filed
5/15/18
Monthly cost of
service1
Next filing
date
FRP: TBD FRP: TBD FRP: by 3/1/21 FRP: TBD2 TBD3 Every month
Rate
effective
date
January
following filing
September
following filing
April
following filing
September
following filing2
35 days after
filing4
Immediate
Evaluation
period
Forward test year
ended 12/31
Historical test year
ended 12/31 plus
new generation
and transmission
closed to plant
above baseline
through 8/31 of
filing year
Historical test year
ended 12/31 plus
certain known and
measurable
changes through
12/31 of filing year
Historical test year
ended 12/31 plus
certain known and
measurable
changes through
12/31 of filing year
12-month
historical test
year with
available
updates
Actual current
month expense
and prior month-
end balance sheet
FRP term /
post FRP
framework
Five years
(2016–2020 filing
years); requested
extension (true-up
filing in 2021
regardless)
Three years
(2018−2020 filing
years); requested
three-year
extension
No specified
termination;
option to file rate
case as needed
Three years
(filing years TBD)2
n/a Monthly cost of
service continues
until terminated by
mutual agreement

17
Agency-published Credit Metrics
The information on this page has been calculated and published by Moody’s or S&P, as indicated, and was not generated by Entergy; such information is being reproduced
solely for informational purposes
Moody’sETR
LTM 9/30/19
E-ARLTM 3/31/20
E-LALTM 9/30/19
E-MSLTM 12/31/19
E-NOLTM 9/30/19
E-TXLTM 6/30/19
(CFO pre-W/C + interest) /
interest expense4.3x 4.6x 5.3x 5.9x 6.9x 4.7x
(CFO pre-W/C) / debt 13.5% 13.2% 18.1% 19.3% 24.9% 19.1%
(CFO pre-W/C – dividends) / debt 10.4% 11.3% 16.1% 18.5% 18.8% 19.1%
Debt / cap 57.3% 49.7% 46.9% 45.7% 41.7% 46.9%
Entergy Corp. and Utility operating company credit metrics
S&P (LTM 12/31/2019) ETR E-AR E-LA E-MS E-NO E-TX
FFO / debt 15.6% 18.9% 16.2% 19.3% 15.8% 5.9%
Debt / EBITDA 5.2x 4.6x 4.8x 4.5x 5.1x 8.3x
FFO cash interest coverage 5.0x 6.3x 4.8x 6.0x 4.2x 2.1x
EBITDA interest coverage 3.5x 4.1x 4.3x 6.0x 4.4x 2.7x
OCF / debt 12.1% 16.3% 14.6% 22.6% 17.1% 10.8%
Free OCF / debt (7.9)% (1.0)% (6.2)% (20.4)% (20.5%) (34.6)%

18
EWC Overview
EWC non-nuclear plants
EWC nuclear plants
ISES 2 Nelson 6 RS Cogen
COD 1983 1982 2002
Fuel / technology Coal Coal CCGT cogen
Net MW owned 121 60 213
Market MISO MISO MISO
Indian Point 1 Indian Point 2 Indian Point 3 Palisades
Planned closing date Shut down Shut down 4/30/21 5/31/22
Net MW n/a n/a 1,041 811
Energy market
(closest hubs)
n/a n/a NYISO
(Zone G)
MISO
(Indiana)
Net book value (6/30/20)1 $175M $55M
NDT balance (6/30/20) $565M $715M $945M $528M
ARO liability balance
(6/30/20)2
$245M $839M $839M $612M3
1 Entergy’s adjusted investment in the companies being sold, with Indian Point as a combined total2 ARO liability balances are based on estimates and are subject to change3 Includes $40M for Big Rock Point
Region breakdown;
% MW as of 6/30/20
Generation portfolio;
% MW as of 6/30/20
82
108
Nuclear
Gas
and oil
Other
4654
NYISOMISO

19
Exiting EWC
Indian Point Palisades
PilgrimVermont Yankee
Indian Point Palisades
FitzPatrick
RISEC
Portfolio in 2015 Portfolio Today
Agreements to sell
IP2 shutdown
4/30/20

20
Indian Point and Palisades Transactions
See Management’s Financial Discussion and Analysis in the most recent Form 10-K and/or any subsequent Form 10-Qs
Transaction highlights
Item Indian Point Palisades
Structure Equity sale of IPEC owners Equity sale of Palisades owner
Purchaser Nuclear Asset Management Co., LLC
(Holtec International subsidiary)
Nuclear Asset Management Co., LLC
(Holtec International subsidiary)
Conditions to
close include
• Permanent shutdown and reactor defuel
• NRC approval
• New York Public Service Commission action on the
ownership transfer
• New York State Department of Environmental
Conservation action on the decommissioning plan
• Permanent shutdown and reactor defuel
• NRC approval
NDT • No NDT minimum balance
• No NDT contribution
• Limitations on withdrawals
• Controls on investment management
• No NDT minimum balance
• $20M NDT contribution at closing
• Limitations on withdrawals
• Controls on investment management
Status Regulatory approval filings submitted Executed purchase and sale agreement
Event Indian Point Palisades
NRC filing November 2019 December 2020
PSC filing November 2019 n/a
Targeted close May 2021 By the end of 2022
Timeline

21
Estimated EWC Adjusted EBITDA
Estimated EWC adjusted EBITDA; $M
20E 21E 22E
Operating revenues, less fuel and fuel-related expenses, and
purchased power800 520 155
Other O&M and nuclear refueling outage expense (500) (360) (135)
Severance and retention (70) (45) (15)
Asset impairments (capital) (10) - -
Asset impairments (fuel, refuel, DOE proceeds, other) (30) (35) 95
Net gain / (loss) on sale of assets1 - (245) 135
Other (100) (90) (65)
Estimated adjusted EBITDA 90 (255) 170
Note: The table above reflects estimates for EWC operations and the costs associated with the strategic decision
to exit the EWC business. Other items may occur during the periods presented, the impact of which cannot
reasonably be estimated at this time.
1 Net gain / (loss) on sale of assets represents current estimates (subject to change). Primary variables in ultimate
gain / (loss) are values of NDTs and asset retirement obligations, financial results from plant operations, and the
level of any unrealized deferred tax balances at closing.
As of 6/30/20

22
EWC Capital Plan
EWC capital plan; $M
20E 21E 22E
Indian Point (to be impaired as incurred) 10 - -
Palisades / other 20 15 5
Total EWC capital 30 15 5
Estimated depreciation expense 110 70 30

23
Financial Outlooks

24
Key Forecast Assumptions
• Utility sales growth: total retail ~1% CAGR 2019–2024E
− Industrial sales growth, ~2.5% CAGR, partially offset by slightly declining residential
and commercial sales
• Utility book ROE: low- to mid-9% range through 2024E
• Parent & Other loss: ~$(1.40) for 2020E, decreasing over time to reflect higher share
count from assumed new equity
• Statutory tax rate: ~25.5%
• Pension discount rate: 3.39% in 2020E, decreasing to 3.0% for 2021E
• Share count: ~201M in 2020E, increasing over time from assumed new equity

25
Driven by New and Expansion Industrial Growth
Long-term Sales Growth
2020 2021 2022 2023 2024
Chlor-alkali Primary metals
Transportation Petrochemicals
Industrial gases All other
New and expansion industrial sales;
cumulative volume
Residential
Commercial
Industrial
Total retail
19 20E 21E 22E 23E 24E
19 20E 21E 22E 23E 24E
19 20E 21E 22E 23E 24E
~1%
CAGR
~2.5%
CAGR
19 20E 21E 22E 23E 24E
Five-year sales trends; MWh
26
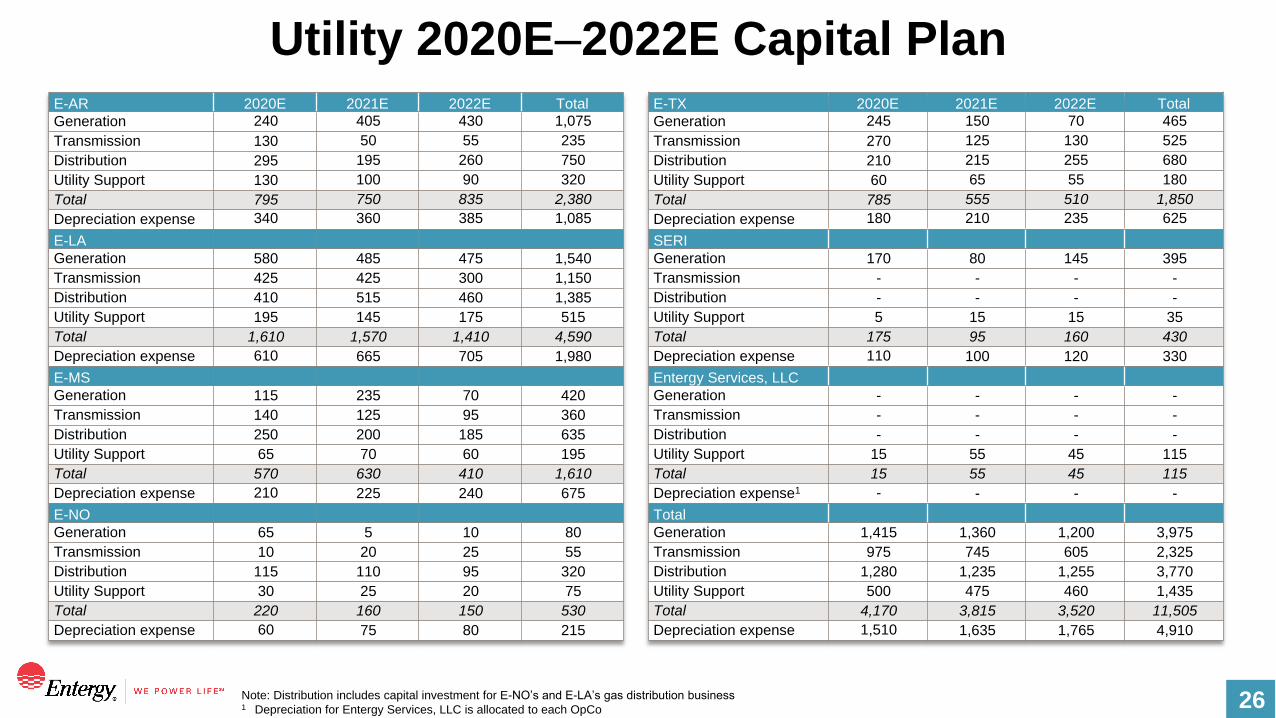
Utility 2020E–2022E Capital Plan
Note: Distribution includes capital investment for E-NO’s and E-LA’s gas distribution business1 Depreciation for Entergy Services, LLC is allocated to each OpCo
E-AR 2020E 2021E 2022E Total
Generation 240 405 430 1,075
Transmission 130 50 55 235
Distribution 295 195 260 750
Utility Support 130 100 90 320
Total 795 750 835 2,380
Depreciation expense 340 360 385 1,085
E-LA
Generation 580 485 475 1,540
Transmission 425 425 300 1,150
Distribution 410 515 460 1,385
Utility Support 195 145 175 515
Total 1,610 1,570 1,410 4,590
Depreciation expense 610 665 705 1,980
E-MS
Generation 115 235 70 420
Transmission 140 125 95 360
Distribution 250 200 185 635
Utility Support 65 70 60 195
Total 570 630 410 1,610
Depreciation expense 210 225 240 675
E-NO
Generation 65 5 10 80
Transmission 10 20 25 55
Distribution 115 110 95 320
Utility Support 30 25 20 75
Total 220 160 150 530
Depreciation expense 60 75 80 215
E-TX 2020E 2021E 2022E Total
Generation 245 150 70 465
Transmission 270 125 130 525
Distribution 210 215 255 680
Utility Support 60 65 55 180
Total 785 555 510 1,850
Depreciation expense 180 210 235 625
SERI
Generation 170 80 145 395
Transmission - - - -
Distribution - - - -
Utility Support 5 15 15 35
Total 175 95 160 430
Depreciation expense 110 100 120 330
Entergy Services, LLC
Generation - - - -
Transmission - - - -
Distribution - - - -
Utility Support 15 55 45 115
Total 15 55 45 115
Depreciation expense1 - - - -
Total
Generation 1,415 1,360 1,200 3,975
Transmission 975 745 605 2,325
Distribution 1,280 1,235 1,255 3,770
Utility Support 500 475 460 1,435
Total 4,170 3,815 3,520 11,505
Depreciation expense 1,510 1,635 1,765 4,910

27
Financial Summaries
and
Regulation G
Reconciliations

28
Regulation G Reconciliations
Calculations may differ due to rounding1 See pages 7-12 of each of the 2019 and 2018 Investor Guides for Regulation G reconciliations that include additional information on adjustments by item
Table 1: ETR adjusted earnings
Reconciliation of GAAP to Non-GAAP measures
2019 2018 2017 2016
($ in millions, except diluted average common shares outstanding)
Net income (loss) attributable to ETR Corp. 1,241 849 412 (584)
Less adjustments1:
Utility 41 222 (181) 127
Parent & Other (11) - 52 -
EWC 147 (343) (175) (1,495)
Total adjustments 177 (121) (304) (1,369)
ETR adjusted earnings (non-GAAP) 1,064 970 716 785
Diluted average common shares outstanding (in millions) 197 183 181 179
($ per share)
Net income (loss) attributable to ETR Corp. 6.30 4.63 2.28 (3.26)
Less adjustments1:
Utility 0.21 1.21 (1.00) 0.71
Parent & Other (0.05) - 0.29 -
EWC 0.74 (1.87) (0.97) (8.36)
Total adjustments 0.90 (0.66) (1.68) (7.65)
ETR adjusted earnings (non-GAAP) 5.40 5.29 3.96 4.39

29
Regulation G ReconciliationsTable 2: Utility book ROE summary
LTM ending June 30, 2020
($ in millions)
E-AR E-LA E-MS E-NO E-TX Utility1
As-reported earnings available to common stock (a) 278 741 139 47 177 1,514
Less adjustments:
Reversal of income tax valuation allowance (b) - - - - - 41
Adjusted earnings available to common stock (non-GAAP) (c) = (a)-(b) 278 741 139 47 177 1,472
Average common equity (d) 3,094 6,429 1,468 490 1,750 13,703
Adjustment for E-LA affiliate preferred (offset at P&O)
Earnings from affiliate preferred (e) 128 128
Preferred investment (f) 1,391 1,391
Equity ratio in last rate proceeding (g) 48.64%
Estimated equity financing for preferred investment (h) = (f) x (g) 676 676
As-reported ROE (a) / (d) 9.0% 11.5% 9.5% 9.5% 10.1% 11.0%
Adjusted ROE (non-GAAP) (c) / (d) 9.0% 11.5% 9.5% 9.5% 10.1% 10.7%
Adjusted ROE, excluding affiliate preferred (non-GAAP) (c-e) / (d-h) 10.7%
Calculations may differ due to rounding1 Utility earnings do not equal the sum of the operating companies due primarily to SERI (as-reported and adjusted earnings ~$109M and average common equity ~$704M) and
the reversal of an income tax valuation allowance at Entergy Utility Holding Co., as well as preferred dividend requirements

30
Regulation G Reconciliations
Calculations may differ due to rounding
Table 3: Parent debt to total debt, excluding securitization debt
Reconciliation of GAAP to Non-GAAP measures
($ in millions) 2Q20
Entergy Corporation notes:
Due July 2022 650
Due September 2026 750
Due June 2030 600
Due June 2050 600
Total parent long-term debt 2,600
Revolver draw 160
Commercial paper 1,946
Unamortized debt issuance costs and discounts (32)
Total parent debt (a) 4,675
Total debt 21,493
Less securitization debt 232
Total debt, excluding securitization debt (b) 21,261
Parent debt to total debt, excluding securitization debt (non-GAAP) (a)/(b) 22.0%

31
Regulation G Reconciliations
Calculations may differ due to rounding
Table 4: FFO to debt, excluding securitization debt; FFO to debt, excluding securitization debt, return of
unprotected excess ADIT, and severance and retention payments associated with exit of EWC
Reconciliation of GAAP to Non-GAAP measures
($ in millions) 2Q20
Total debt 21,493
Less securitization debt 232
Total debt, excluding securitization debt (a) 21,261
OCF (LTM) 3,212
AFUDC-borrowed funds (LTM) (58)
Less working capital in OCF (LTM):
Receivables (5)
Fuel inventory (35)
Accounts payable (92)
Taxes accrued 62
Interest accrued 5
Other working capital accounts (15)
Securitization regulatory charges 123
Total 43
FFO (LTM) (non-GAAP) (b) 3,110
FFO to debt, excluding securitization debt (non-GAAP) (b)/(a) 14.6%
Estimated return of unprotected excess ADIT (LTM) (c) 189
Severance and retention payments assoc. with exit of EWC (LTM pre-tax) (d) 102
FFO to debt, excluding securitization debt, return of unprotected excess ADIT, and
severance and retention payments assoc. with exit of EWC (non-GAAP)
(b+c+d)/(a) 16.0%

32
Regulation G Reconciliations
Calculations may differ due to rounding
Table 5: Net liquidity, including storm escrows
Reconciliation of GAAP to Non-GAAP measures
($ in billions) As of 8/31/20
Cash and cash equivalents 1.4
Storm escrows 0.4
Available revolver capacity 4.1
Less commercial paper 1.9
Net liquidity, including storm escrows (non-GAAP) 4.0

33
Abbreviations and Acronyms (1 of 2)ADIT Accumulated deferred income taxes EBITDA Earnings before interest, tax, depreciation, and amortization
AFUDC –
borrowed funds
Allowance for borrowed funds used during
construction
EEI Edison Electric Institute
ALJ Administrative law judge E-LA Entergy Louisiana, LLC
AMI Automated metering infrastructure E-MS Entergy Mississippi, LLC
APSC Arkansas Public Service Commission E-NO Entergy New Orleans, LLC
ATM At-the-market EPC Engineering, procurement, construction
BCG Boston Consulting Group EPS Earnings per share
bps Basis points ETEC East Texas Electric Cooperative
CAGR Compound annual growth rate ETR Entergy Corporation
CCGT Combined cycle gas turbine E-TX Entergy Texas, Inc.
CCNO City Council of New Orleans EVP Executive Vice President
CFO Cash from operations EWC Entergy Wholesale Commodities
Choctaw Choctaw County Generating Station (CCGT) FERC Federal Energy Regulatory Commission
CI Continuous improvement FFO Funds from operations
COD Commercial operation date FIN 48 FASB Interpretation No.48, “Accounting for Uncertainty in
Income Taxes”
COVID-19 Corona virus 2019 pandemic FitzPatrick James A. FitzPatrick Nuclear Power Plant (nuclear), sold
March 2017
CT Simple cycle combustion turbine FRP Formula rate plan
CWIP Construction work in progress GAAP U.S. generally accepted accounting principles
DCRF Distribution cost recovery factor GCRR Generation Cost Recovery Rider
DJSI Dow Jones Sustainability Index GHGGreenhouse gases
DOE Department of Energy Grand Gulf or GGNSUnit 1 of Grand Gulf Nuclear Station (nuclear), 90% owned
or leased by SERI
E-AR Entergy Arkansas, LLC IIRR-GInfrastructure investment recovery rider - gas

34
Abbreviations and Acronyms (2 of 2)
Indian Point Indian Point Energy Center (nuclear) Pilgrim Pilgrim Nuclear Power Station (nuclear)
Indian Point 2 or
IP2
Unit 2 of Indian Point Energy Center (nuclear) PMR Performance Management Rider
IRP Integrated Resource Plan PPA Power purchase agreement or purchase power agreement
lbs Pounds PUCT Public Utility Commission of Texas
LCPS Lake Charles Power Station (CCGT) RFP Request for proposals
LIHEAP Low Income Housing Energy Assistance Program RICE Reciprocating internal combustion engine
LPSC Louisiana Public Service Commission RISEC Rhode Island State Energy Center (CCGT), sold Dec. 2015
LTM Last twelve months ROE Return on equity
MCPS Montgomery County Power Station (CCGT) RSP Rate stabilization plan
MISO Midcontinent Independent System Operator, Inc. S&P Standard & Poor's
Moody's Moody's Investor Service SERC SERC Reliability Corporation
MPSC Mississippi Public Service Commission SERI System Energy Resources, Inc.
MTEP MISO Transmission Expansion Planning Spindletop Storage facility in Beaumont, TX
NDT Nuclear decommissioning trust SVP Senior Vice President
NERC North American Electric Reliability Corporation TCFD Task Force on Climate-related Financial Disclosures
NOPS New Orleans Power Station (RICE) TCRF Transmission cost recovery factor
NYISO New York Independent System Operator, Inc. UPSA Unit Power Sales Agreement
OCF Net cash flow provided by operating activities
Vermont Yankee or VY
Vermont Yankee Nuclear Power Station (nuclear), sold
January 2019
OpCo Operating company W/C Working capital
Other O&M Other non-fuel operation and maintenance expense WACC Weighted-average cost of capital
P/E Price-to-earnings WPEC Washington Parish Energy Center (CT)
Palisades Palisades Power Plant (nuclear)