© wiley 20071 chapter 2 - operations strategy and competitiveness operations management by r. dan...
TRANSCRIPT

© Wiley 2007 1
Chapter 2 - Operations Strategy and Competitiveness
Operations Managementby
R. Dan Reid & Nada R. Sanders3rd Edition © Wiley 2007

© Wiley 2007 2
Learning Objectives Define the role of Business Strategy Explain how a Business strategy is developed Explain the role of Operations Strategy Explain the relationship between Business and
Operations strategy Describe how an Operations strategy is developed Identify competitive priorities for Operations
function Explain the strategic role of technology Define and compute productivity measures

© Wiley 2007 3
The Role of Business Strategy
Provides a plan (business strategy) making the best use of resources that: Defines the long-range plan to compete in
the marketplace Helps to differentiate the firm from
competitors Provides a game plan upon which
functional strategies are developed Focuses on doing the “right tasks”

© Wiley 2007 4
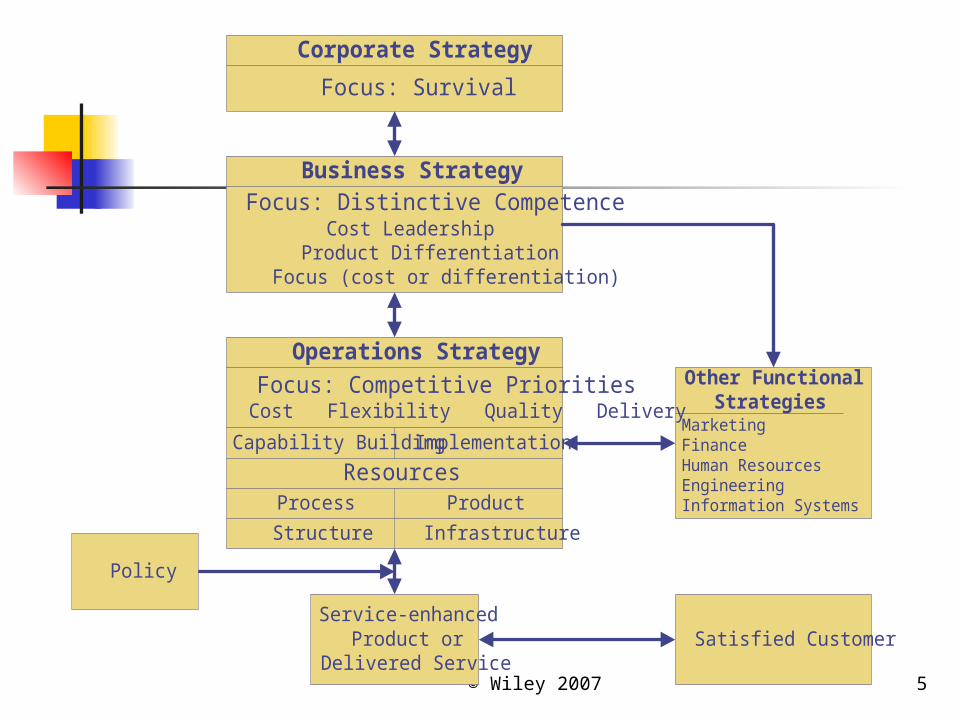
Business/Functional Strategy
© Wiley 2007 5
Service-enhancedProduct or
Delivered Service
Policy
Satisfied Customer
Corporate Strategy
Focus: Survival
Business StrategyFocus: Distinctive Competence
Cost LeadershipProduct Differentiation
Focus (cost or differentiation)
Operations Strategy
Focus: Competitive PrioritiesCost Flexibility Quality Delivery
ImplementationCapability Building
ResourcesProcess Product
Structure Infrastructure
Other FunctionalStrategies
MarketingFinanceHuman ResourcesEngineeringInformation Systems
© Wiley 2007 6
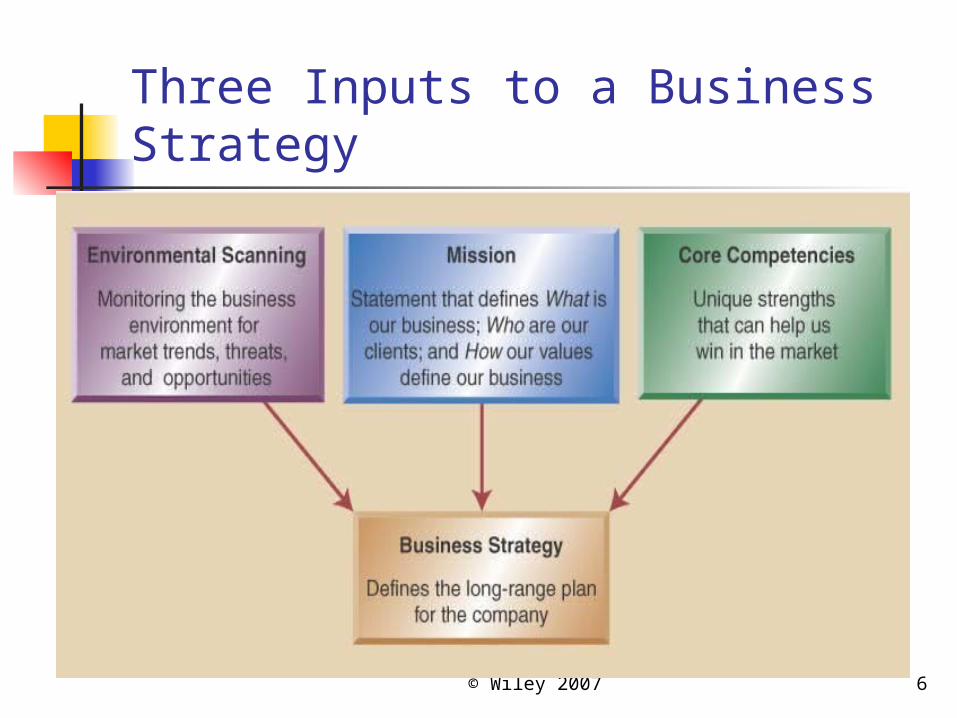
Three Inputs to a Business Strategy

© Wiley 2007 7
Operations Strategy – Designing the Operations Function

© Wiley 2007 8
Competitive Priorities- The Edge
Four Important Operations Questions: Will you compete on –
Cost? Quality? Time? Flexibility? All of the above? Some? Tradeoffs?
© Wiley 2007 9
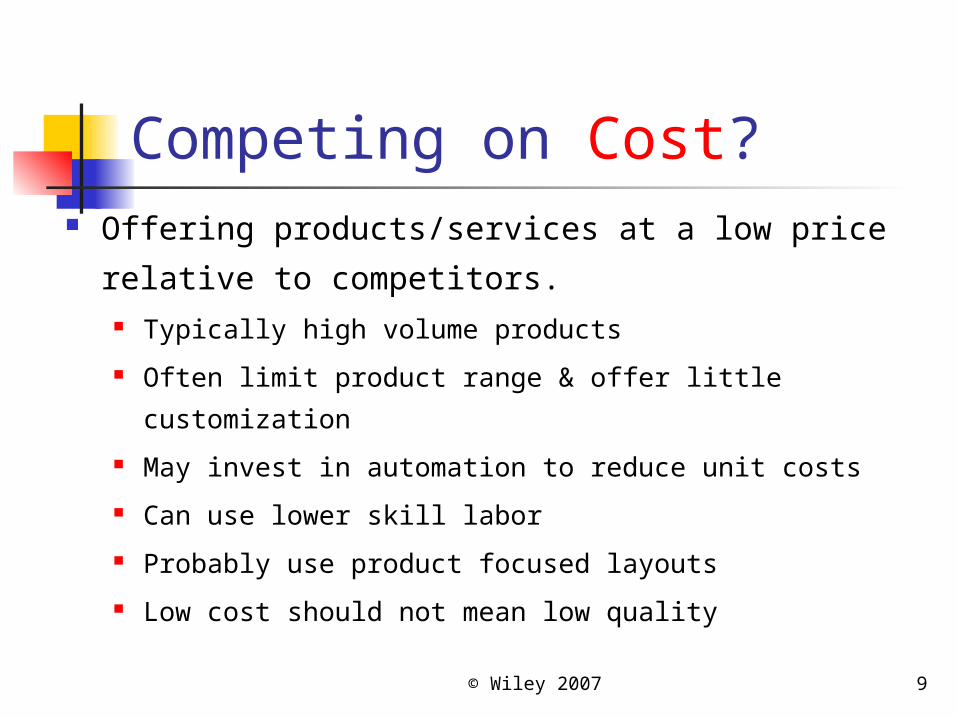
Competing on Cost? Offering products/services at a low price relative to
competitors. Typically high volume products
Often limit product range & offer little customization
May invest in automation to reduce unit costs
Can use lower skill labor
Probably use product focused layouts
Low cost should not mean low quality

© Wiley 2007 10
Competing on Quality? Quality is sometimes subjective Quality may be defined differently by
customers versus employees Quality dimensions:
High performance design: Superior features, high durability, & excellent customer
service Product & service consistency:
Meets design specifications Close tolerances Error free delivery
Quality issues to address: Product design quality – products/services must meet
requirements Process quality will produce error-free products/services

© Wiley 2007 11
Competing on Time? Time is one of the most important competitive priorities
Being first-to-deliver often wins the race
Time –related issues:
Fast delivery:
Focused on shorter time between order placement and
delivery
On-time delivery:
Deliver product exactly when needed every time
Rapid development speed
Using concurrent processes to shorten product development
time
© Wiley 2007 12
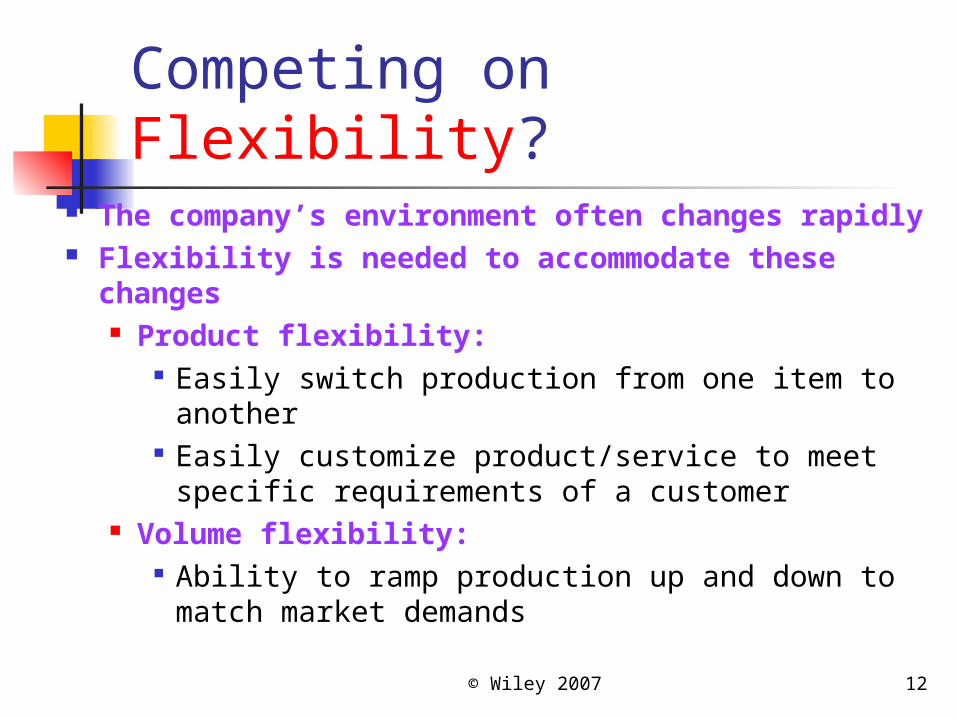
Competing on Flexibility? The company’s environment often changes
rapidly Flexibility is needed to accommodate these
changes Product flexibility:
Easily switch production from one item to another
Easily customize product/service to meet specific requirements of a customer
Volume flexibility: Ability to ramp production up and down to
match market demands
© Wiley 2007 13
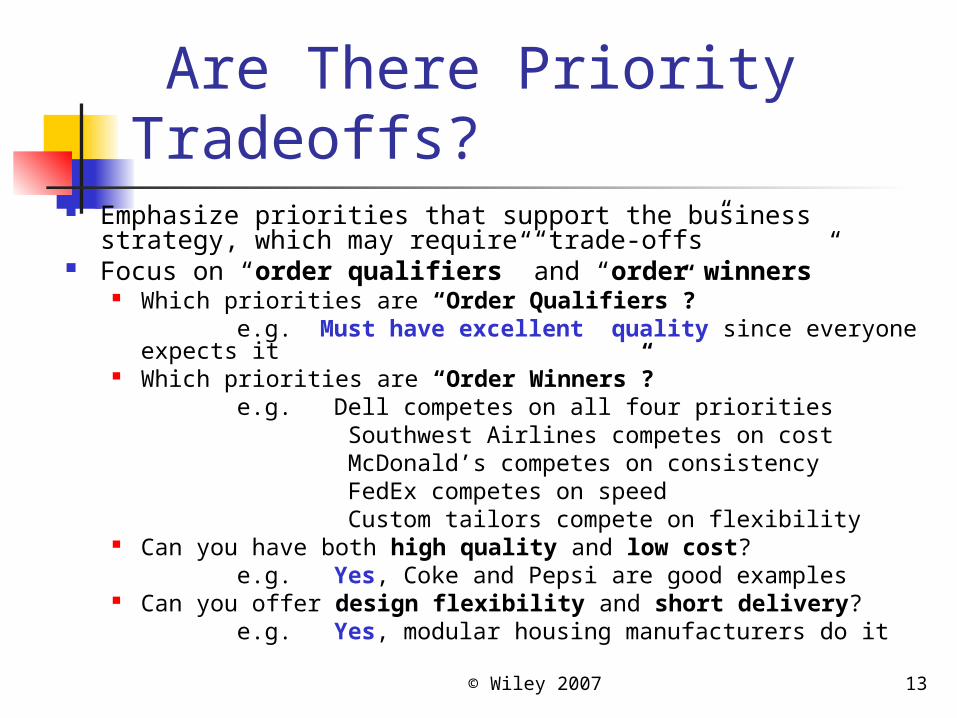
Are There Priority Tradeoffs?
Emphasize priorities that support the business strategy, which may require “trade-offs”
Focus on “order qualifiers” and “order winners” Which priorities are “Order Qualifiers”? e.g. Must have excellent quality since everyone expects
it Which priorities are “Order Winners”? e.g. Dell competes on all four priorities Southwest Airlines competes on cost McDonald’s competes on consistency FedEx competes on speed Custom tailors compete on flexibility Can you have both high quality and low cost? e.g. Yes, Coke and Pepsi are good examples Can you offer design flexibility and short delivery? e.g. Yes, modular housing manufacturers do it

© Wiley 2007 14
Translating to Production Requirements
Specific Operation requirements include two general categories Structure – decisions related to the
production process, such as characteristics of facilities used, selection of appropriate technology, and the flow of goods and services
Infrastructure – decisions related to planning and control systems of operations

© Wiley 2007 15
Strategic Role of Technology
Technology should support competitive
priorities
Three Applications: New product technology,
process technology, and information technology
Products - Teflon, CD’s, fiber optic cable
Processes – flexible automation, CAD
Information Technology – POS, EDI, ERP, B2B

© Wiley 2007 16
Technology for Competitive Advantage
Technology has positive and negative potentials Positive
Improve processes Maintain up-to-date standards Obtain competitive advantage
Negative Costly Risks such as overstating benefits
Technology should Support competitive priorities Can require change to strategic plans Can require change to operations strategy
Technology is an important strategic decision

© Wiley 2007 17
Productivity: DefinitionProductivity is the relationship between the Outputs generated from a system and the Inputs that are used to create those outputs. Mathematically
P OI

© Wiley 2007 18
Productivity Improvement
OIOIOIOIOI
Productivity Improvement (PI) is the result of Productivity Improvement (PI) is the result of managing and intervening in key managing and intervening in key transformation or work processes. transformation or work processes.
PI will occur if:PI will occur if:

© Wiley 2007 19
Measuring Productivity Productivity is a measure of how efficiently inputs
are converted to outputs Productivity = output/input
Total Productivity Measure Total Productivity = $sales/inputs
$
Partial Productivity Measure Partial Productivity = cars/employee
Multifactor Productivity Measure Multi-factor Productivity = sales/total $costs

© Wiley 2007 20
Measuring Productivity Static Measures: P=O/I in a given period of
time (t). Useful for cross-sectional (benchmarking?) purposes.
Dynamic measures:t(1)=O(1)/I(1); t(2)=O(2)/I(2);then t(2)/t(1) yields a dimensionless index that reflects change in productivity between periods and ((t(2)-t(1))/t(1))*100 yields the percentage change between periods.

© Wiley 2007 21
Measuring Productivity (cont..)
Partial-Factor: Uses a single “I” factor; e.g., output/labor-hour, sales/employee.
Multi-Factor: Uses more than one “I” factor; e.g. output/direct costs (labor, materials, and overhead).
Total-Factor: Uses all “I” factors.(Note: Total-Factor captures “trade-offs”
between input factors.).
© Wiley 2007 22
Interpreting Productivity Measures
Raw productivity calculations do not tell the complete story unless there are no major structure differences.
In the prior automobile business example, it is obvious that some major changes were taking place to yield 15.8% and 13.7% year-to-year cars/employee productivity improvements. What changes could improve car sales per employee? Automation? Out sourcing? Major re-design?
Is this partial productivity measurement enough to make an investment decision?
Is the Total Cost Productivity measure a better reflection of year to year productivity at 4.2% and 1.6%. Why?
Should you also look at productivity measures for the two major competitors for comparison?

© Wiley 2007 23
Productivity Growth Rate Can be used to compare a process’
productivity at a given time (P2) to the same process’ productivity at an earlier time (P1)
1
12
P
PPRateGrowth

© Wiley 2007 24
Productivity Growth RateExample:
Last week a company produced 150 units using 200 hours of labor
This week, the same company produced 180 units using 250 hours of labor
rategrowthnegativeaor
P
PPRateGrowth
hourunitshours
unitsP
hourunitshours
unitsP
%4
04.075.0
75.072.0
/72.0250
1802
/75.0200
150
1
12
1

© Wiley 2007 25
EFFECTIVENESS Measures what the system sets out to
accomplish (objective) with what was actually accomplished; budget vs. actual
Hence, effectiveness is an output measure. (Did the system output the “right” things--right quality, right quantity, on time, etc.)

© Wiley 2007 26
EFFICIENCY Measures the resources expected to
be consumed to the resources actually consumed.
Hence, it focuses on the input side of the system. (To what degree did the system utilize the “right” things.)

© Wiley 2007 27
Productivity, Competitiveness, and the Service Sector
A nation’s Productivity effects its standard of living
Productivity is a measure of how effectively resources are used
US productivity growth averaged 2.8% from
1948-1973 Productivity growth slowed
for the next 25 years to 1.1%
Productivity growth in service industries has been less than in manufacturing

© Wiley 2007 28
Competing on Productivity At the national level, growing
productivity leads to a higher standard of living holds inflation in check enhances international competitiveness.
The annual growth in GDP is due to growth in productivity growth in inflation
(Macroeconomic Theory)

© Wiley 2007 29
Productivity Portfolios Investments in facilities and
equipment Investments in programs and systems Investments in people.
(Note: these alternatives are not mutually exclusive; however, most organizations tend to choose one as their dominant orientation.)

© Wiley 2007 30
Chapter 2 Highlights Business Strategy is a
long range plan. Functions develop supporting plans
Strategy must address mission, environment, and core competencies
Business strategy provides a guide for designing operations strategy
Operations strategy must consider which competitive priorities are essential to meet business objectives
Competitive priorities are cost, quality, time, and flexibility
Companies must consider which product, process, and information technologies to use
Productivity measures how effectively a firm is using resources
Productivity is computed as a ratio of outputs divided by inputs
© Wiley 2007 31
Chapter 2 Homework Hints6. Output (minus defects); use per day
data; determine P1 and P2, then % change.
7. Output (minus defects); use per month data.a. Determine P1 and P2.b. Determine % change
8. a. Cost to patient=>revenue (output).b. Output = # patients; input = time