whsmrsb.weebly.com · web view58. describe causation, confounding, and common response with lurking...
TRANSCRIPT

Final Review MONSTER Packet ***MUST BE COMPLETED FOR YOU TO USE YOUR NOTES FOR THE FINAL***
Unit 1 - Intro to Statistics1. Statistics ______ A. Places an individual into one of several
groups/categories2. Individual _______ B. When someone observes something, but does not
influence or interrupt; only describes the behavior of a group or situation
3. Variable _______ C. The objects described by a set of data; it is the who or the what we are studying
4. Categorical Variable _______ D.A sample survey that attempts to include the entire population in the sample
5. Quantitative Variable _______ E. When someone deliberately imposes some treatment on individuals in order to record their responses
6. Population _______ F. The art and science of dealing with data
7. Sample _______ G.Entire group of individuals that are being studied
8. Census _______ H.Takes a numerical value where averaging makes sense
9. Experiment _______ I. Any characteristic of an individual
10. Treatment _______ J. Something that researchers give to experimental units/subjects
11. Observational Study _______ K. A part of the population that data is actually collected from; this is used to come up with conclusions about the population
12. What are the 4 steps of the Statistical Problem-Solving Process? What do you do in each step?a)
b)
c)
d)
13. Give 2 examples of categorical variables. a)b)
14. Give 2 examples of quantitative variables. a)

b)15.
StudentName Gender Favorite
SubjectHeight
(inches)Preferred
Communication Zip Code Number of Pets
Jessica Female Math 64 Text 30062 2Joel Male Lunch 72 Snapchat 30060 4
Tashana Female Culinary 65 Snapchat 30060 1Zach Male History 74 Text 30061 2
Daejia Female Math 65 Text 30082 0Bria Female English 63 Snapchat 30080 2
a) Identify the individuals.
b) Identify the categorical variables.
c) Identify the quantitative variables.
16. You want to know the effect of watching TV while studying and final exam scores for high school students. You asked 50 Statistical Reasoning students on Senior Skip Day whether they had the TV on while they were studying for their final. 42% of the students answered “yes”.
a. Is this an example of an observational study or experimental study?
b. Identify the population.
c. Identify the sample.
d. If a student answers “yes”, what kind of variable is that?
e. How many students answered “yes”?
g. If you asked a different sample of 50 students, would you expect your result to be 42% again? Why or why not?
h. Was the sample a good representation of the population? Why or why not?

17. Determine which brands of orange juice people prefer. The people are randomly chosen at the supermarket and are asked to taste BOTH brands without knowing which brand they are drinking. Is this an observational study or experiment? Why?
18. Compare the grades on a final math test of 25 students who use calculators and 25 students who do not use calculators. The students decide which group they are in. Is this an observational study or experiment? Why?
Unit 2 – Data Displays19. Roundoff Error ______ A. A quantitative display that uses bars that touch, uses a
number line, and consistent intervals to show the distribution of data.
20. Pie Chart ______ B. Minimum, first quartile, median, third quartile, and maximum
21. Bar Graph ______ C. A special categorical chart that uses “pie slices” to show relative size of the data.
22. Dot Plot ______ D. ALL of the different values the variable takes on and how often it takes these values
23. Stem and Leaf Plot ______ E. A display of quantitative data on a number line; shows each individual data point
24. Histogram ______ F. The point where about half of the observations are on either sides; sometimes it is better to use the median than the mean due to skewness.
25. Distribution ______ G. The difference between the calculated approximation of a number and its exact mathematical value due to rounding.
26. Center ______ H. The range between the lower quartile and third quartile.
27. Spread ______ I. A value in the data that is much larger or much smaller than the rest of the other data values.
28. Shape ______ J. A display that uses stems and leaves to show the distribution of the data.
29. 5-Number Summary ______
K. A graph made up of bars that don’t touch, uses categories, and frequencies to show the distribution of data

30. Box-and-Whisker Plot ______
L. Display used to show quantitative data in a 5-number summary; each section represents 25% of the data
31. Interquartile Range ______ M. Use to describe the variation or how “spread” out the data is displayed
32. Outliers ______ N. Data can be described by symmetric, skewed left, and skewed right
33. What are the 2 ways to display categorical data?a)b)
34. What are the 4 ways to display quantitative data?a)b)c)d)
35. List the measures of center. Star (*) the one that is affected by outliers.a)b)c)
36. List the measures of spread. Star (*) the ones that are affected by outliers.a)b)c)
37. Describe the shape and the mean in relation to the median (equal, higher, lower) for the following displays below.
38. If you created a pie chart, fill out the data below.

b. What other graph could you use to display the “Favorite Color” data?
39. The number of points scored on the last quiz are shown below. 1st Block: 83 50 79 80 83 55 71 42 94 81 75 69 73 85 1002nd Block: 99 87 33 67 100 25 75 38 96 67 83 83 79 88 70 79
a. Find the five number summary for both sets of data. 1 st Block 2 nd Block
b. Find the IQR for both sets of data.1 st Block 2 nd Block
c. What are the outlier formulas?
d. Prove any outliers in each class with the formulas. 1 st Block 2 nd Block
e. Calculate the mean for each class. 1 st Block 2 nd Block
f. Calculate the standard deviation for each class.
Favorite Color Percentage DegreeYellow 26Blue 14Red 20Purple 18Green 22

1 st Block 2 nd Block
g. If we added 5 points to every score, what would this do to the mean, median, and standard deviation? Calculate the new mean, median, and standard deviation.
1 st Block 2 nd Block
40.
a. The median grade on the quiz was around:
b. The minimum grade on the quiz was around:
c. What percentage of students made lower than a 70%?
d. What percentage of students made higher than 63%?
e. If 28 students took the quiz, how many scored lower than a 29%?
f. If 32 students took the quiz, how many scored higher than a 70%?
g. The IQR for the quiz results was around:
Unit 3 – Data Displays

41. Percentile ______ A. The normalized value of an observation; shows you how many standard deviations an observation is away from the mean.
42. Z-Score ______ B. Also known as the “68-95-99” Rule; this ‘rule’ shows how much percentage
43. Normal Distribution ______ C. The percentage that an observation is less than or equal to a certain value.
44. Empirical Rule ______ D. The chance of something happening
45. Probability ______ E. This helps show an overall trend when gathering data; it quickly shows if an observation or data point is an outlier or ‘abnormal’ by using the mean and standard deviation.
46. What percentile is a 5’8” player in? What does this mean?
47. Using the Normal Curve below about average weight of Middle School boys, answer the following questions:
a. What is the mean weight of a Middle School boy?
b. What is the standard deviation of a Middle School boy?
c. What percentage of Middle School boys have a weight lower than 180 lbs?d. What percentage of Middle School boys have a weight higher than 210 lbs?

e. What weight separates the lowest 16%?
f. What weight separates the highest 0.15%?
g. If 200 boys were surveyed, how many boys weight outside of 90 and 240 lbs?
48. How much percentage of data should be between the following standard deviations on a normal curve?a. ±1 standard deviations = b. ±2 standard deviations = c. ±3 standard deviations =
49. Your SAT score was a z-score of -1.5. What does that mean?
50. What is the z-score formula?
51. Bob made an 86 on his Stat test that had a mean of 88 and a standard deviation of 5. Sally scored a 78 on her Biology test that had a mean of 84 and a standard deviation of 4. Who did relatively better?
52. The next three questions use the normal standard table with the following information: The distribution of Statistic final grades is approximately normal with mean 72 and standard deviation 2.5.
a. What percentage of students’ final grade was a 62 or lower?
b. What percentage of students’ final grade was an 80 or higher?
c. What percentage of students’ final grade was between a 70 and 79?

d. What grade did a student get if they have a z-score of 2.1?
e. What grade separates the top 10%?
f. What grade is in the bottom 7.21%?
Unit 3.5 – Hypothesis Testing
53. If α=0.01 andp=0.04, what would you do with the null hypothesis? (reject or fail to reject)
54. If α=0.05 andp=0.04, what would you do with the null hypothesis? (reject or fail to reject)
55. Bjorn claims that his son can eat 4 cookies at once. His wife saw that his son ate only 1 cookie yesterday. What conclusion would you draw if the significance level is set at 0.03 and a standard deviation of 1.5?
Unit 4 – Linear Regression56. A study gathered data about ice cream sales (x) in hundreds and drownings (y). The regression line is y = 0.18x - 13.25. a. When ice cream sales is $500, about how many drownings will there be?
b. If the actual drownings when ice cream sales is $500 is 75, what is the residual?
c. Describe the slope in context.
d. If the ice cream sales and drownings numbers were switched, what would happen to the correlation?e. If the correlation between ice cream sales and drownings is r = 0.64. What does this mean in context?
57. Identify the explanatory and response variables. a. Time spent on electronics and Midterm test scores.
b. Water consumption and temperature outside.
c. A person takes a new weight-loss pill and the weight they lost.
58. Describe causation, confounding, and common response with lurking variables.
59. What happens to the correlation when you remove an outlier?
Unit 5 – Types of Sampling
60. probability sample ______ A. error which occurs when an individual chosen for the sample cannot be contacted or refuses to cooperate
61. bias ______ B. a number that describes the population62. convenience sample ______ C. error that occurs when a subject gives an incorrect
response63. population ______ D
.any sample which uses chance to select the sample
64. nonresponse error ______ E. sampling error not related to the act of selecting a sample from the population
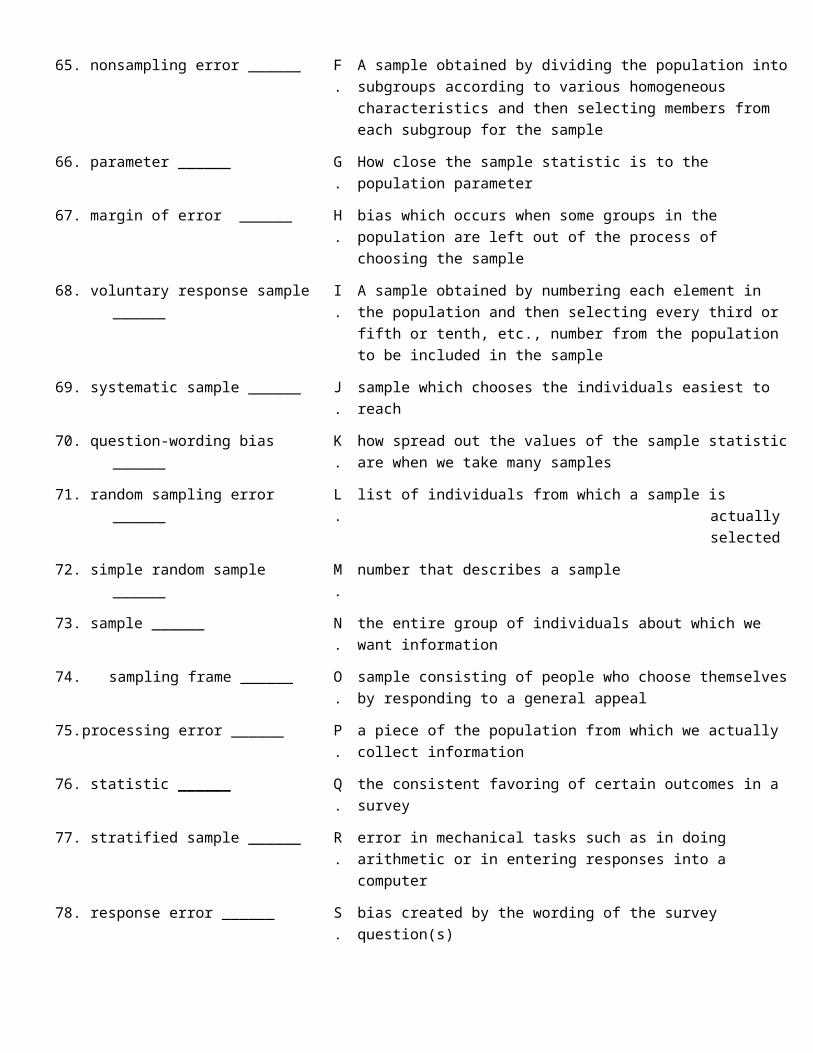
65. nonsampling error ______ F. A sample obtained by dividing the population into subgroups according to various homogeneous characteristics and then selecting members from each subgroup for the sample
66. parameter ______ G.
How close the sample statistic is to the population parameter

67. margin of error ______ H. bias which occurs when some groups in the population are left out of the process of choosing the sample
68. voluntary response sample ______
I. A sample obtained by numbering each element in the population and then selecting every third or fifth or tenth, etc., number from the population to be included in the sample
69. systematic sample ______ J. sample which chooses the individuals easiest to reach70. question-wording bias ______ K. how spread out the values of the sample statistic are
when we take many samples71. random sampling error ______ L. list of individuals from which a sample is actually selected72. simple random sample ______ M
.number that describes a sample
73. sample ______ N. the entire group of individuals about which we want information
74. sampling frame ______ O.
sample consisting of people who choose themselves by responding to a general appeal
75. processing error ______ P. a piece of the population from which we actually collect information
76. statistic ______ Q.
the consistent favoring of certain outcomes in a survey
77. stratified sample ______ R. error in mechanical tasks such as in doing arithmetic or in entering responses into a computer
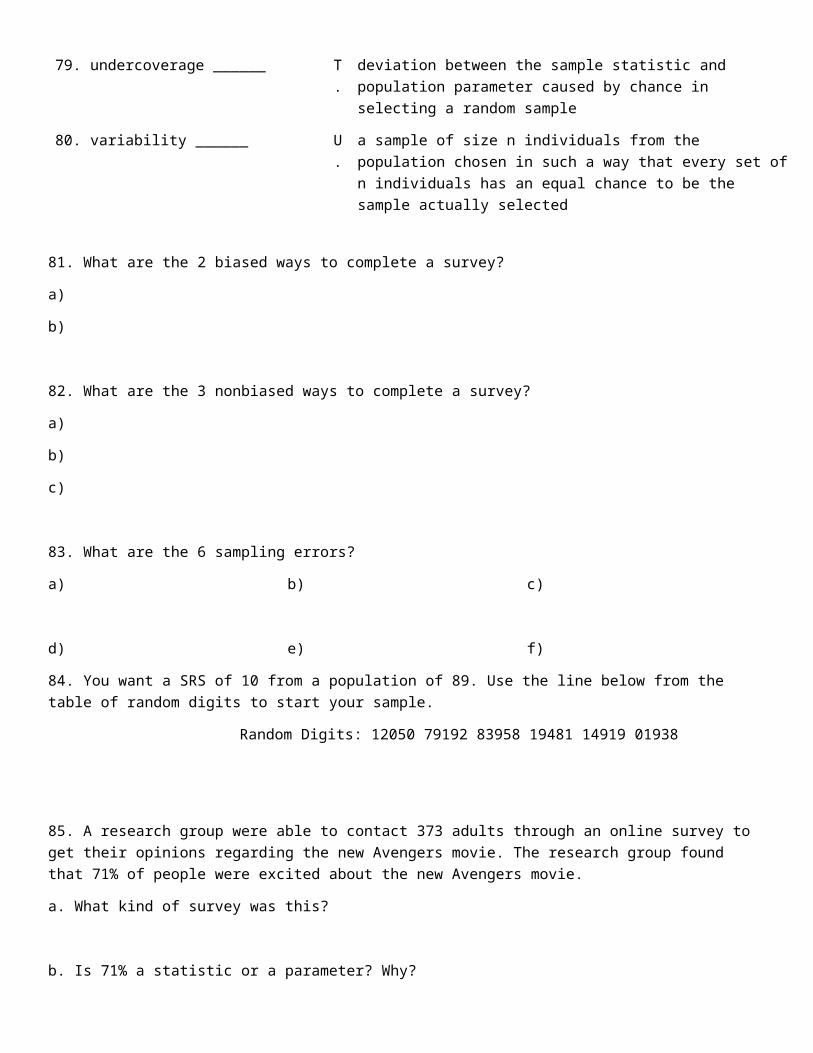
78. response error ______ S. bias created by the wording of the survey question(s)79. undercoverage ______ T. deviation between the sample statistic and population
parameter caused by chance in selecting a random sample
80. variability ______ U. a sample of size n individuals from the population chosen in such a way that every set of n individuals has an equal chance to be the sample actually selected
81. What are the 2 biased ways to complete a survey?a)b)
82. What are the 3 nonbiased ways to complete a survey?a)b)c)
83. What are the 6 sampling errors?a) b) c)
d) e) f)84. You want a SRS of 10 from a population of 89. Use the line below from the table of random digits to start your sample.
Random Digits: 12050 79192 83958 19481 14919 01938
85. A research group were able to contact 373 adults through an online survey to get their opinions regarding the new Avengers movie. The research group found that 71% of people were excited about the new Avengers movie.a. What kind of survey was this?
b. Is 71% a statistic or a parameter? Why?
c. Find the margin of error.
d. Write a confidence statement.
e. Several people did not send the survey back to the research group. What kind error occurred?
f. Was this a good representation of the population? Why or why not?
86. How do we decrease the margin of error?
Identify the method of sampling or error used in the following:
87. Dr. Giles wants to know if students approve of the senior project. He takes a sample on the day of senior Grad Bash. ____ A. Voluntary Response
88. Jay asks the first 50 people to arrive to school if they liked his role in the play. ____ B. Convenience
89. Ava completes a survey of 25 students by using a random number generator on her calculator. ____ C. Simple Random Sample
90. Mrs. Brown wants to find out how many high school students play Fortnite. She randomly selects every 5th person on the roster. ____ D. Systematic Random
91. Mr. Thornton calculates the total number of points on the unit 5 test. He takes the sum of 20 + 20 = 50 total points. ____ E. Stratified Random
Sample
92. David has 6 dogs. He is embarrassed that he has so many dogs, so he tells people he only has 2 dogs. ____ F. Undercoverage
93. Sandy chooses a sample of 50 people by randomly selecting her peers from each block. ____ G. Processing Error
94. Mr. Thornton asked his students, “How terrible is the Alabama football team?” ____ H. Non-Response Error
95. Chick-fil-a gives you a survey code on your receipt to go online and review your visit. If you go online, you can get a free chicken sandwich. ____
I. Response Error
96. Antonio is chosen to participate in a survey about soccer. He refuses to answer the questions. ____ J. Question Wording Bias
Unit 6 – Experimental DesignMatch each word or phrase with its definition.
97. Control Group______ A. Individuals studied in an experiment.
98. Clinical Trial ______ B. Subjects who are chosen for an experiment, but decline to participate.
99. Matched Pairs Design ______ C. A subject who begins the experiment, but does not finish.

100. Randomized Comparative Experiment ______
D. Subjects are first separated into groups of similar qualities. These qualities are suspected to affect the response variable.
101. Experiment ______ E. An experimental condition that is applied to the subjects.
102. Placebo ______ F. When subjects respond differently after they receive a treatment, even if it is a neutral treatment with no beneficial qualities.
103. Refusals ______ G. When neither the subjects nor the experimenters know who is receiving each treatment.
104. Treatment ______ H. A neutral treatment with no active ingredients or beneficial qualities.
105. Subjects ______ I. This allows for the control of the effects of lurking variables.
106. Nonadherers ______ J. Involves active data production where a treatment is imposed.
107. Dropout ______ K. This compares subjects that are the most alike as possible. This could be two similar subjects, or one subject who receives both treatments.
108. Statistical Significance ______
L. A type of experiment that studies the effectiveness of medical treatments on real patients.
109. Placebo Effect ______ M. Subjects are separated into groups and randomly assigned treatment(s).
110. Block Design ______ N. Subjects who do not follow the guidelines of the experiment
111. Double-Blind ______ O. An observed effect so large that is would rarely occur by chance.
112. List and describe the 3 principles of experimental design.
113. 90 students in a PE class were randomly divided into groups. One group had loud music playing when they ran a mile. Another group was allowed to listen to their own music through their headphones. Times were compared.a. What type of study was this?
b. What were the treatments?

c. Suppose a PE student in the ‘loud music’ group decides to put his headphones in instead. What type of bias occurred?
**114. On a scale of 1-10, how close were you to replicating the picture below when completing this review packet?