psdmath.pbworks.compsdmath.pbworks.com/w/file/fetch/86065738/pcsd... · web view2.oa.1 use addition...
TRANSCRIPT
Provo City School District
Mathematics Resources
Table of contents Page
Instructional pathways ……………………………………………………….…………………………………………… 1
Utah SAGE Elementary Blue Prints ………………………….………………………………………………………… 2
Utah SAGE Secondary Blue Prints……………………………………….……………………………………………… 3
Understanding the Standards ……………………………………………….…………………………………………… 4
Essential Skills Lists
PSD Mathematics Essential Skills List Kindergarten …….....................................................................……. 5
PSD Mathematics Essential Skills List 1st Grade .........…….....................................................................……. 6
PSD Mathematics Essential Skills List 2nd Grade ........…….....................................................................……. 8
PSD Mathematics Essential Skills List 3rd Grade ........…….....................................................................……. 10
PSD Mathematics Essential Skills List 4th Grade ........…….....................................................................……. 11
PSD Mathematics Essential Skills List 5th Grade ........…….....................................................................……. 13
PSD Mathematics Essential Skills List 6th Grade ........…….....................................................................……. 15
PSD Mathematics Essential Skills List Math 7 ............…….....................................................................……. 17
PSD Mathematics Essential Skills List Math 8 ............…….....................................................................……. 19
PSD Mathematics Essential Skills List Secondary Math 1 .................................................................……. 21
PSD Mathematics Essential Skills List Secondary Math 2 .................................................................……. 26
PSD Mathematics Essential Skills List Secondary Math 3 .................................................................……. 29
i
Elementary Sequence
PSD Mathematics Essential Skills Sequence Kindergarten ……........................................................……. 31
PSD Mathematics Essential Skills Sequence 1st Grade ............…….....................................................……. 32
PSD Mathematics Essential Skills Sequence 2nd Grade ............……....................................................……. 33
PSD Mathematics Essential Skills Sequence 3rd Grade ............…….....................................................……. 34
PSD Mathematics Essential Skills Sequence 4th Grade ............…….....................................................……. 35
PSD Mathematics Essential Skills Sequence 5th Grade ............…….....................................................……. 37
PSD Mathematics Essential Skills Sequence 6th Grade ............…….....................................................……. 39
Secondary Resources and sequence
PSD Mathematics Essential Skills Sequence Math 7 ...............…….....................................................……. 41
PSD Mathematics Essential Skills Sequence Math 8 ...............…….....................................................……. 62
PHS Mathematics Essential Skills Sequence Secondary Math 1 .....................................................……. 83
PHS Mathematics Essential Skills Sequence Secondary Math 2 .....................................................……. 96
PHS Mathematics Essential Skills Sequence Secondary Math 3 .....................................................……. 106
THS Mathematics Essential Skills Sequence Secondary Math 1 ....................................................…… 118
THS Mathematics Essential Skills Sequence Secondary Math 2 .......................................................…. 132
THS Mathematics Essential Skills Sequence Secondary Math 3 ....................................................……. 144
ii
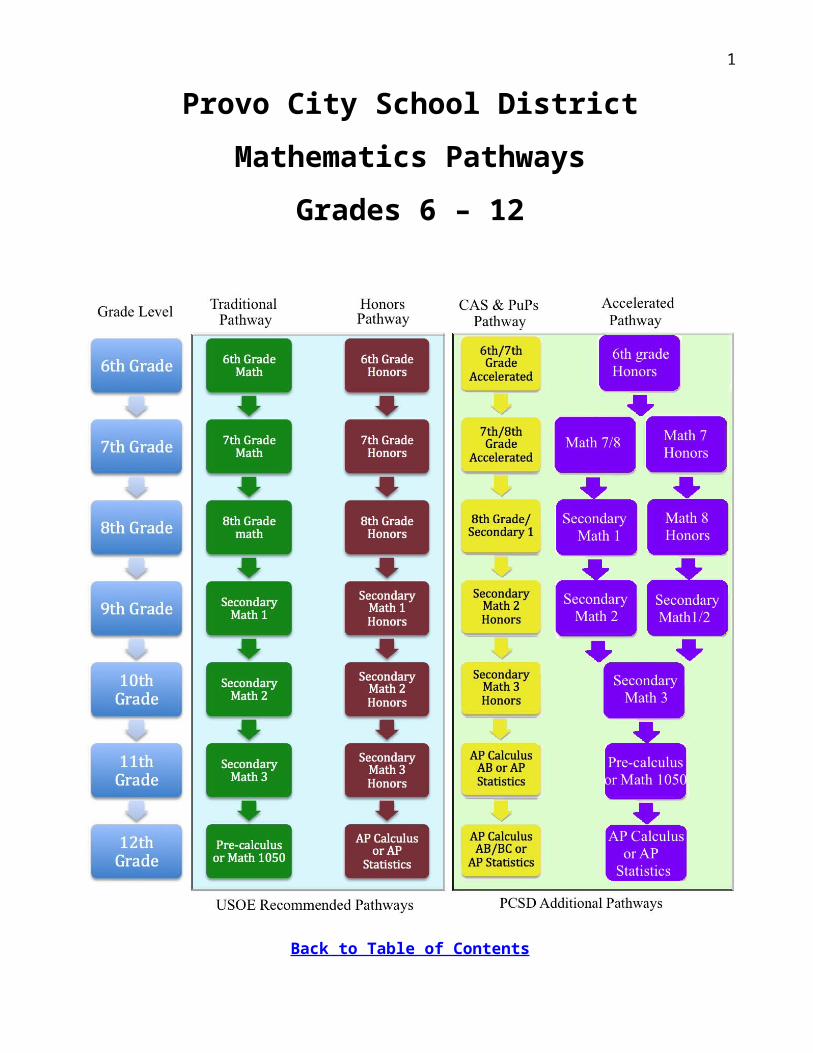
Provo City School District
Mathematics Pathways
Grades 6 – 12
Back to Table of Contents
1
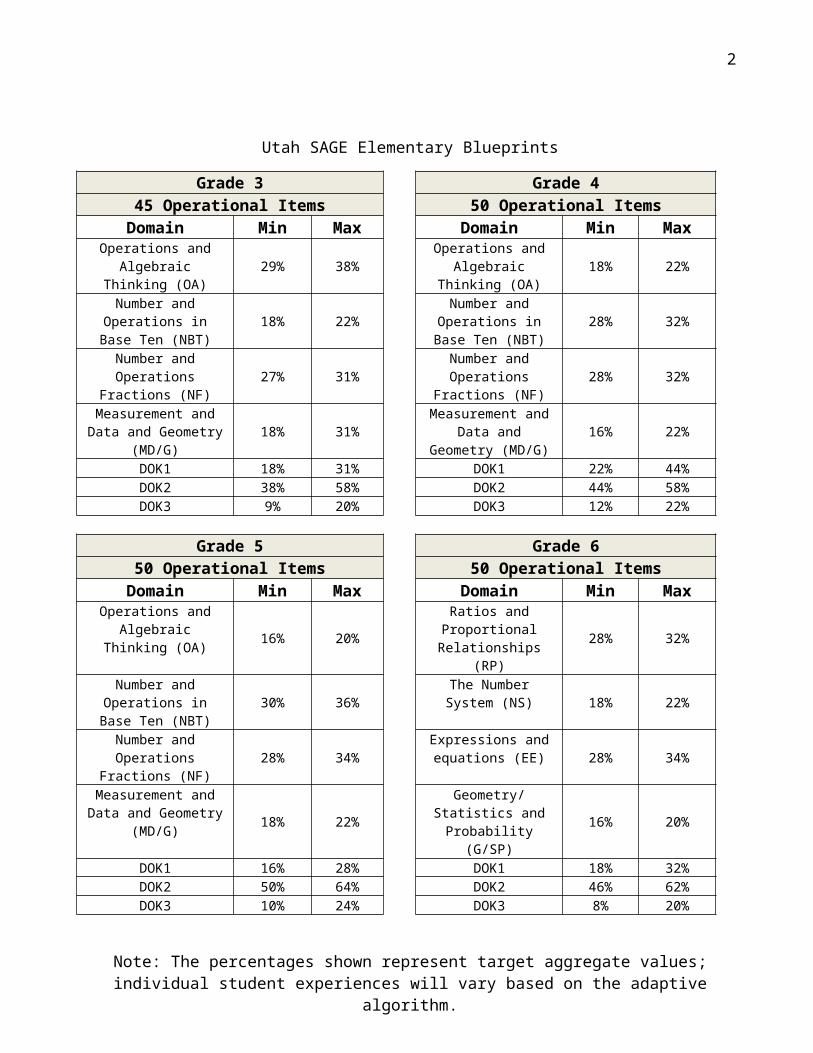
Utah SAGE Elementary Blueprints
Grade 3 Grade 445 Operational Items 50 Operational Items
Domain Min Max Domain Min Max Operations and
Algebraic Thinking (OA) 29% 38%Operations and
Algebraic Thinking (OA)
18% 22%
Number and Operations in Base Ten (NBT) 18% 22%
Number and Operations in Base Ten
(NBT)28% 32%
Number and Operations Fractions (NF) 27% 31%
Number and Operations Fractions
(NF)28% 32%
Measurement and Data and Geometry (MD/G)
18% 31%Measurement and Data and Geometry (MD/G)
16% 22%
DOK1 18% 31% DOK1 22% 44%DOK2 38% 58% DOK2 44% 58%DOK3 9% 20% DOK3 12% 22%
Grade 5 Grade 650 Operational Items 50 Operational Items
Domain Min Max Domain Min Max Operations and
Algebraic Thinking (OA) 16% 20%Ratios and
Proportional Relationships (RP)
28% 32%
Number and Operations in Base Ten (NBT)
30% 36%The Number System
(NS)18% 22%
Number and Operations Fractions (NF)
28% 34%Expressions and equations (EE)
28% 34%
Measurement and Data and Geometry (MD/G)
18% 22%Geometry/Statistics
and Probability (G/SP)16% 20%
DOK1 16% 28% DOK1 18% 32%DOK2 50% 64% DOK2 46% 62%DOK3 10% 24% DOK3 8% 20%
Note: The percentages shown represent target aggregate values; individual student experiences will vary based on the adaptive algorithm.
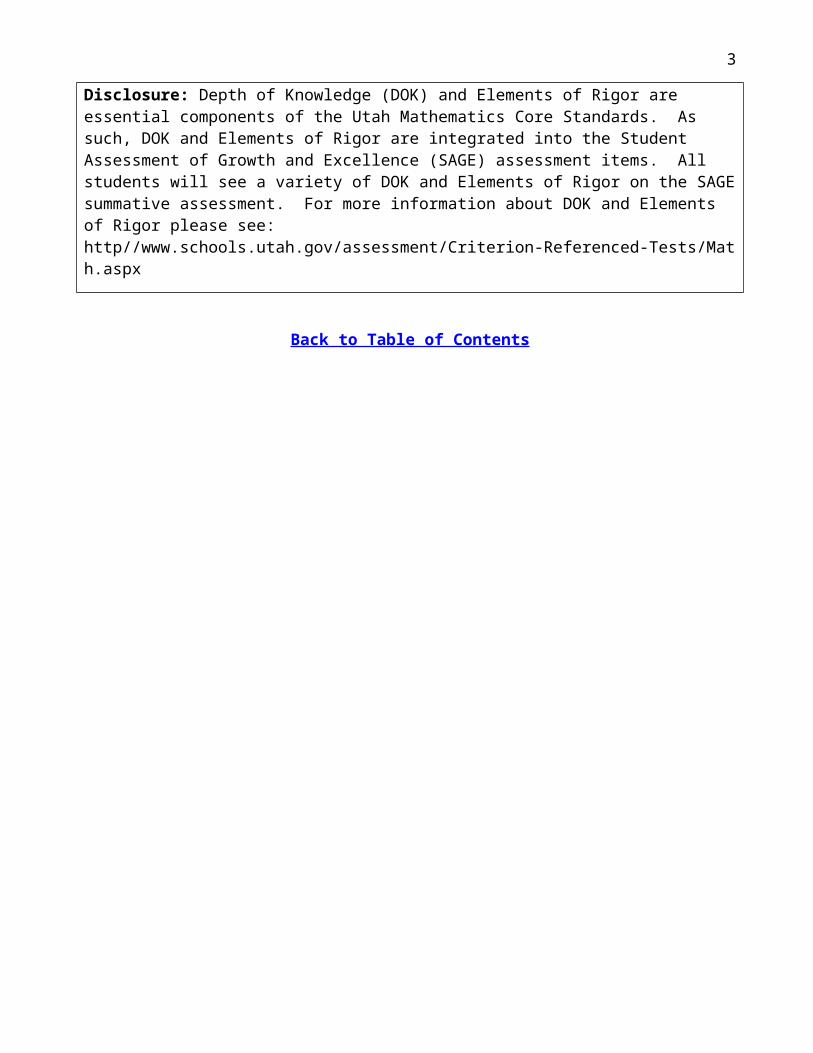
Disclosure: Depth of Knowledge (DOK) and Elements of Rigor are essential components of the Utah Mathematics Core Standards. As such, DOK and Elements of Rigor are integrated into the Student Assessment of Growth and Excellence (SAGE) assessment items. All students will see a variety of DOK and Elements of Rigor on the SAGE summative assessment. For more information about DOK and Elements of Rigor please see: http//www.schools.utah.gov/assessment/Criterion-Referenced-Tests/Math.aspx
Back to Table of Contents
2
Utah SAGE Secondary Blueprints
Math 7 Math 845 Operational Items 50 Operational Items
Domain Min Max Domain Min Max Ratios and Proportions 22% 26% Functions 20% 24%
Expressions and Equations 16% 20% Expressions and Equations 20% 24%The Number System 18% 22% Geometry/ Number System 34% 40%
Geometry 18% 22% Statistics and Probability 16% 20%Statistics and Probability 18% 22% DOK1 20% 30%
DOK1 12% 24% DOK2 40% 50%DOK2 48% 60% DOK3 20% 26%DOK3 20% 26%
Secondary Math 1 Secondary Math 250 Operational Items 50 Operational Items
Domain Min Max Domain Min Max Algebra 16% 20% Algebra 28% 32%
Number & Quantity/Functions 30% 36% Functions 18% 22%Geometry 28% 34% Geometry 28% 34%
Statistics and Probability 18% 22% Statistics and Probability 16% 20%DOK1 16% 28% DOK1 18% 32%DOK2 50% 64% DOK2 46% 62%DOK3 10% 24% DOK3 8% 20%
Secondary Math 3 The purpose of test blueprints is to make sure that the intended breadth and depth of the
curriculum is represented on the end of level test50 Operational Items
Domain Min Max Number & Quantity/Functions 28% 32%
Functions 28% 32% The percentages shown represent target aggregate values; individual student experiences
will vary based on the adaptive algorithm.Trig Functions/Geometry 18% 22%Statistics and Probability 18% 22%
DOK1 10% 20%DOK2 40% 50%DOK3 30% 36%
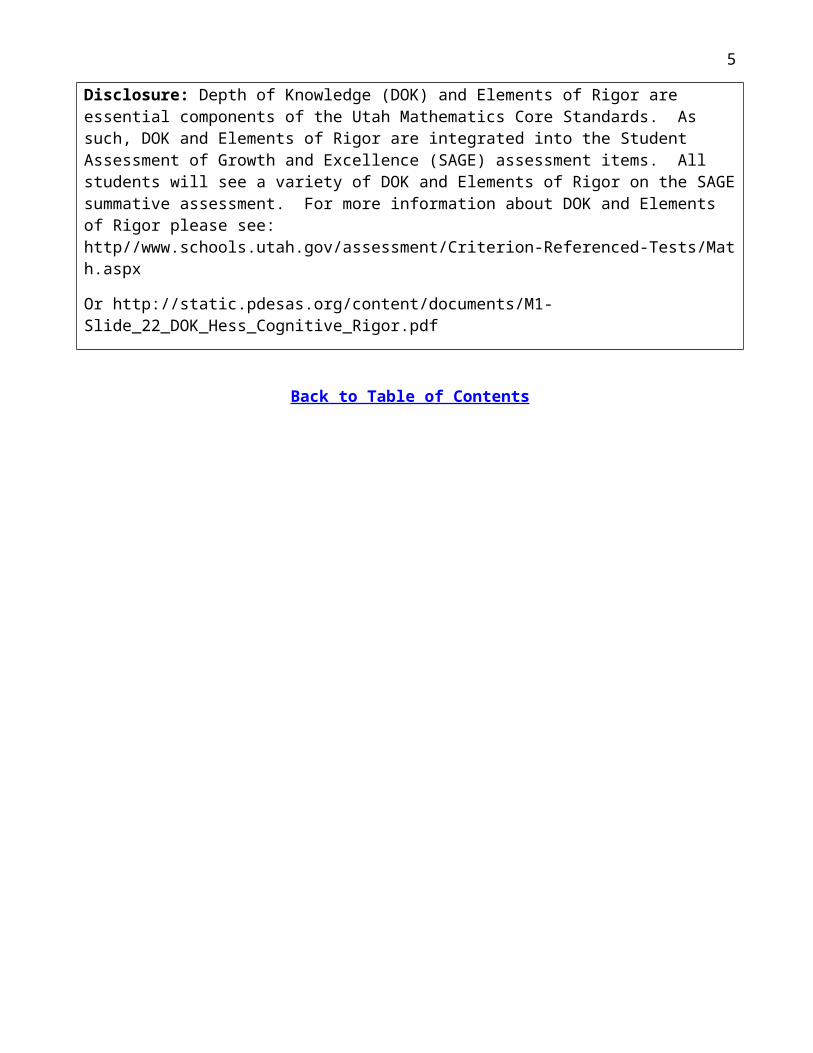
Disclosure: Depth of Knowledge (DOK) and Elements of Rigor are essential components of the Utah Mathematics Core Standards. As such, DOK and Elements of Rigor are integrated into the Student Assessment of Growth and Excellence (SAGE) assessment items. All students will see a variety of DOK and Elements of Rigor on the SAGE summative assessment. For more information about DOK and Elements of Rigor please see: http//www.schools.utah.gov/assessment/Criterion-Referenced-Tests/Math.aspx
Or http://static.pdesas.org/content/documents/M1-Slide_22_DOK_Hess_Cognitive_Rigor.pdf
Back to Table of Contents
3
The Standards
The teachers of Provo City School District (PCSD) with the anticipation that they will be modified with time and experience created these essential skills. They are current as of the spring of 2013. There are two parts of the core, the Standards for Mathematical Practice (practice standards) and the Standards for Mathematical Content (content standards). While the teachers of PCSD selected the essentials from the content standards, all practice standards are considered essential.
Standards for Mathematical Practice
1. Make sense of problems and persevere in solving them.2. Reason abstractly and quantitatively.3. Construct viable arguments and critique the reasoning of others.4. Model with mathematics.5. Use appropriate tools strategically.6. Attend to precision.7. Look for and make use of structure.8. Look for and express regularity in repeated reasoning.
The standards for Mathematical Practice describe ways in which developing student practitioners of the discipline of mathematics increasingly ought to engage with the subject matter as they grow in mathematical maturity and expertise throughout their education.
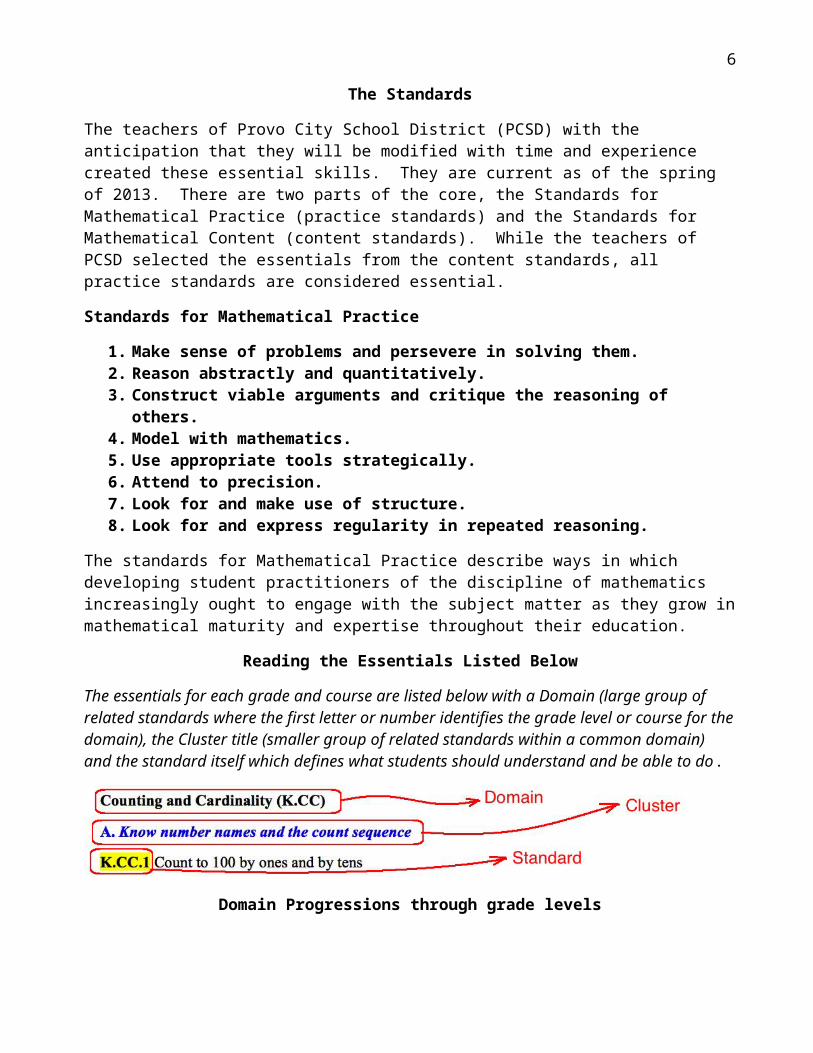
Reading the Essentials Listed Below
The essentials for each grade and course are listed below with a Domain (large group of related standards where the first letter or number identifies the grade level or course for the domain), the Cluster title (smaller group of related standards within a common domain) and the standard itself which defines what students should understand and be able to do.
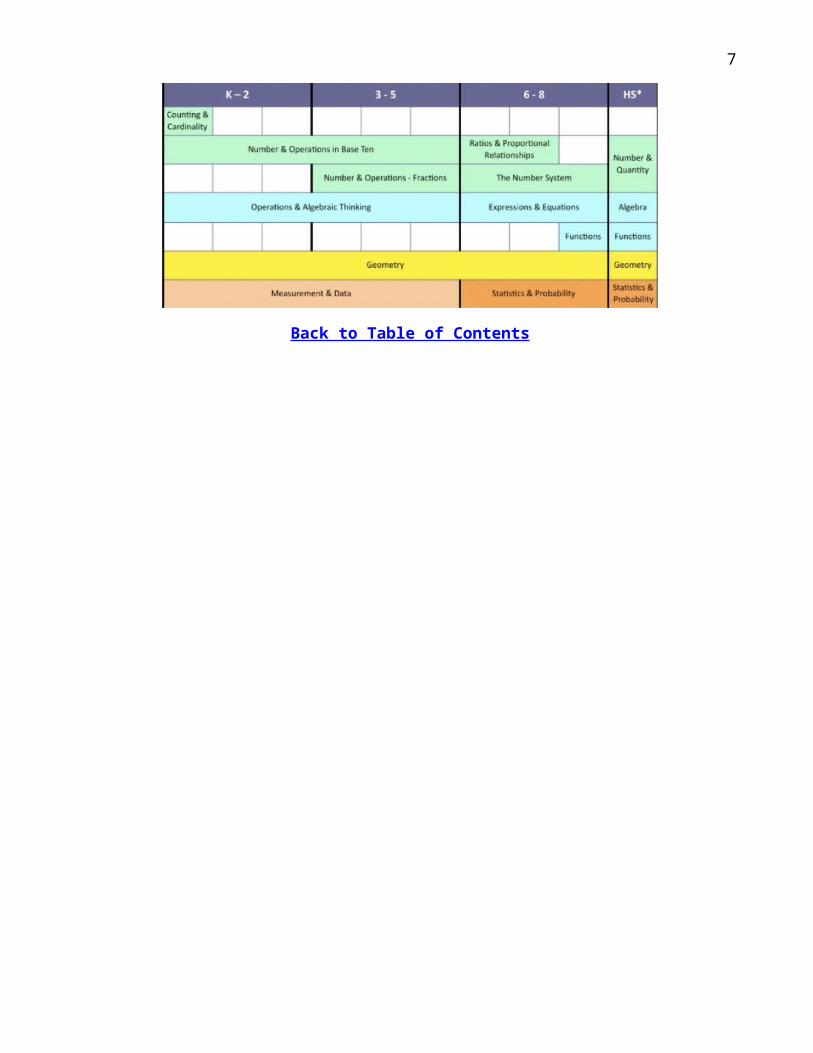
Domain Progressions through grade levels
Back to Table of Contents
4
Essential Skills from Standards for Mathematical ContentKindergarten
In Kindergarten, instructional time should focus on two critical areas: (1) representing, relating and operating on whole numbers, initially with sets of objects; (2) describing shapes and space. More learning time in Kindergarten should be devoted to number than to other topics.Counting and Cardinality (K.CC)A. Know number names and the count sequence
K.CC.1 Count to 100 by ones and by tens
K.CC.2 Count forward beginning from a given number within the known sequence (instead of having to begin at 1) within 20
K.CC.3 Write numbers from 0 to 10.
B. Count to tell the number of objects
K.CC.4a Understand the relationship between numbers and quantities; connect counting to cardinality. When counting objects, say the number names in the standard order, pairing each object with one and only one number name and each number name with one and only one object.
K.CC.5 Count to answer “how many” questions about as many as 20 things arranged in a line, a rectangular array, or a circle, or as many as 10 things in a scattered configuration; given a number from 1-20, count out that many objects
Operations and Algebraic Thinking (K.OA)
A. Understand addition as putting together and adding to, and understand subtraction as taking apart and taking from.
K.OA.1 Represent addition and subtraction with objects, fingers, mental images, drawings, sounds (e.g. claps), acting out situations, verbal explanations, expressions, or equations.
K.OA.2 Solve addition and subtraction word problems, and add and subtract within 10, e.g., by using objects or drawings to represent the problem
Number and Operations in Base Ten (K.NBT)
A. Work with numbers 11 – 19 to gain foundations for place value.
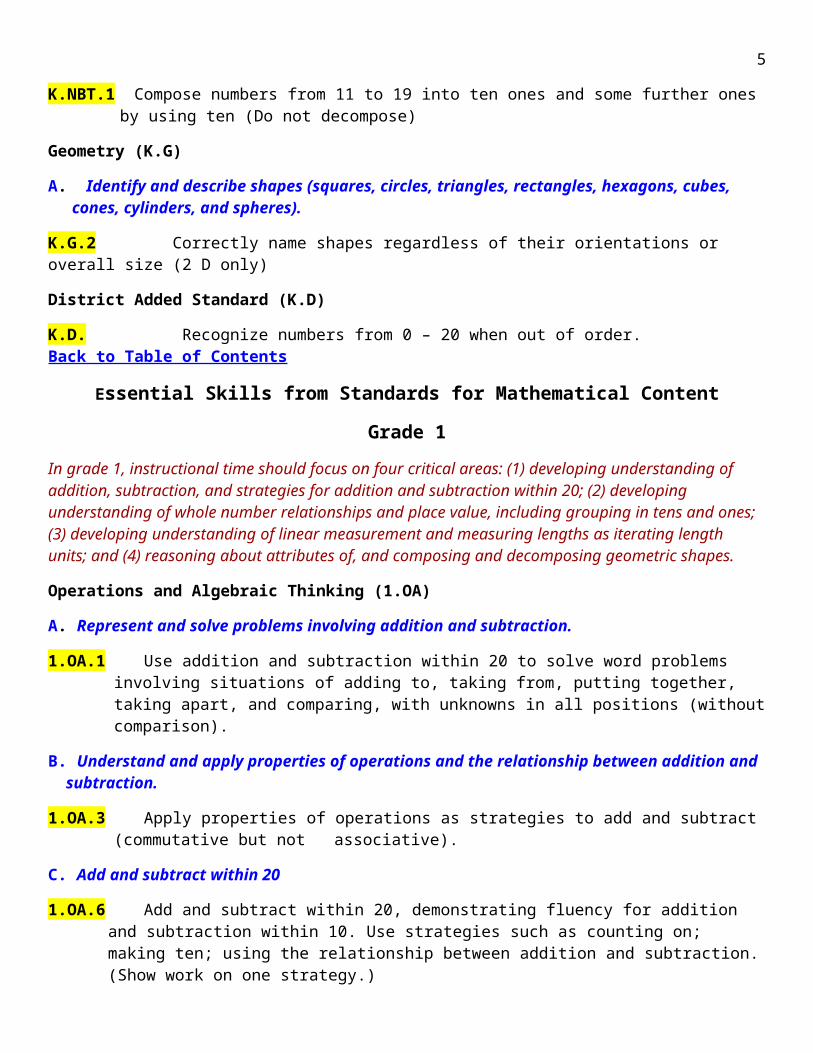
K.NBT.1 Compose numbers from 11 to 19 into ten ones and some further ones by using ten (Do not decompose)
Geometry (K.G)
A. Identify and describe shapes (squares, circles, triangles, rectangles, hexagons, cubes, cones, cylinders, and spheres).
K.G.2 Correctly name shapes regardless of their orientations or overall size (2 D only)
District Added Standard (K.D)
K.D. Recognize numbers from 0 – 20 when out of order. Back to Table of Contents
4
Essential Skills from Standards for Mathematical Content
Grade 1In grade 1, instructional time should focus on four critical areas: (1) developing understanding of addition, subtraction, and strategies for addition and subtraction within 20; (2) developing understanding of whole number relationships and place value, including grouping in tens and ones; (3) developing understanding of linear measurement and measuring lengths as iterating length units; and (4) reasoning about attributes of, and composing and decomposing geometric shapes.
Operations and Algebraic Thinking (1.OA)
A. Represent and solve problems involving addition and subtraction.
1.OA.1 Use addition and subtraction within 20 to solve word problems involving situations of adding to, taking from, putting together, taking apart, and comparing, with unknowns in all positions (without comparison).
B. Understand and apply properties of operations and the relationship between addition and subtraction.
1.OA.3 Apply properties of operations as strategies to add and subtract (commutative but not associative).
C. Add and subtract within 20
1.OA.6 Add and subtract within 20, demonstrating fluency for addition and subtraction within 10. Use strategies such as counting on; making ten; using the relationship between addition and subtraction. (Show work on one strategy.)
D. Work with addition and subtraction equations.
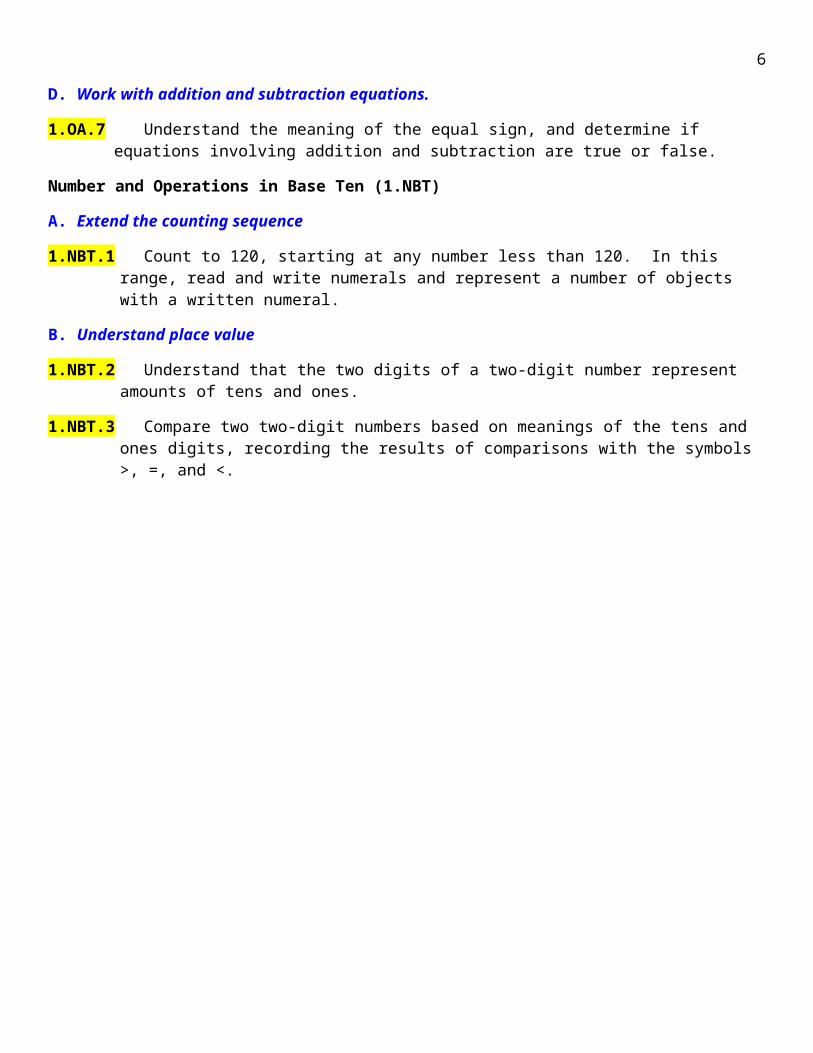
1.OA.7 Understand the meaning of the equal sign, and determine if equations involving addition and subtraction are true or false.
Number and Operations in Base Ten (1.NBT)
A. Extend the counting sequence
1.NBT.1 Count to 120, starting at any number less than 120. In this range, read and write numerals and represent a number of objects with a written numeral.
B. Understand place value
1.NBT.2 Understand that the two digits of a two-digit number represent amounts of tens and ones.
1.NBT.3 Compare two two-digit numbers based on meanings of the tens and ones digits, recording the results of comparisons with the symbols >, =, and <.
5

C. Use place value understanding and properties of operations to add and subtract.
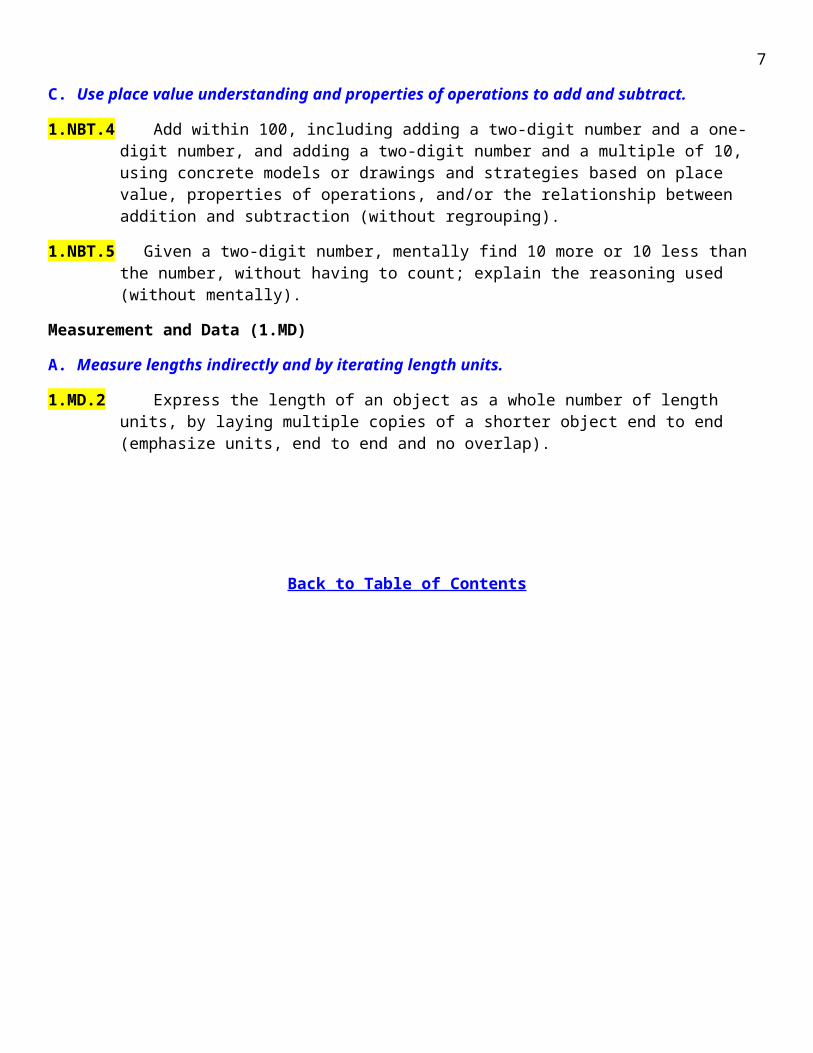
1.NBT.4 Add within 100, including adding a two-digit number and a one-digit number, and adding a two-digit number and a multiple of 10, using concrete models or drawings and strategies based on place value, properties of operations, and/or the relationship between addition and subtraction (without regrouping).
1.NBT.5 Given a two-digit number, mentally find 10 more or 10 less than the number, without having to count; explain the reasoning used (without mentally).
Measurement and Data (1.MD)
A. Measure lengths indirectly and by iterating length units.
1.MD.2 Express the length of an object as a whole number of length units, by laying multiple copies of a shorter object end to end (emphasize units, end to end and no overlap).
Back to Table of Contents
6
Essential Skills from Standards for Mathematical Content
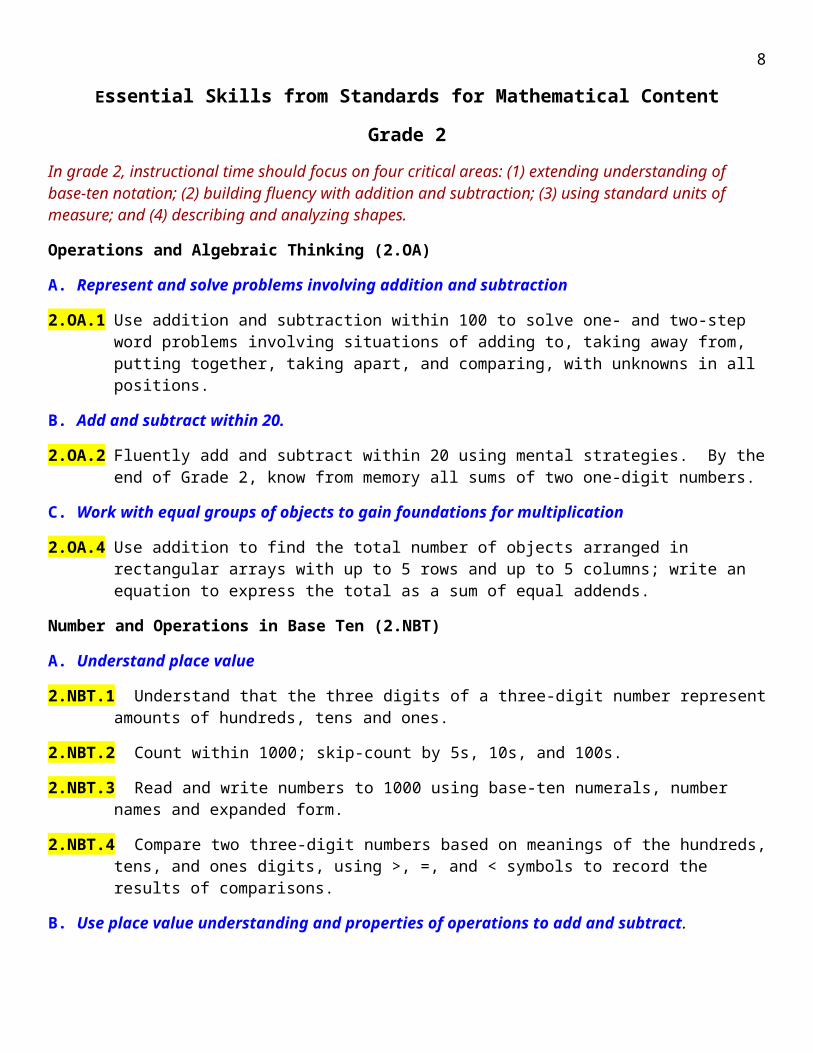
Grade 2In grade 2, instructional time should focus on four critical areas: (1) extending understanding of base-ten notation; (2) building fluency with addition and subtraction; (3) using standard units of measure; and (4) describing and analyzing shapes.
Operations and Algebraic Thinking (2.OA)
A. Represent and solve problems involving addition and subtraction
2.OA.1 Use addition and subtraction within 100 to solve one- and two-step word problems involving situations of adding to, taking away from, putting together, taking apart, and comparing, with unknowns in all positions.
B. Add and subtract within 20.
2.OA.2 Fluently add and subtract within 20 using mental strategies. By the end of Grade 2, know from memory all sums of two one-digit numbers.
C. Work with equal groups of objects to gain foundations for multiplication
2.OA.4 Use addition to find the total number of objects arranged in rectangular arrays with up to 5 rows and up to 5 columns; write an equation to express the total as a sum of equal addends.
Number and Operations in Base Ten (2.NBT)
A. Understand place value
2.NBT.1 Understand that the three digits of a three-digit number represent amounts of hundreds, tens and ones.
2.NBT.2 Count within 1000; skip-count by 5s, 10s, and 100s.
2.NBT.3 Read and write numbers to 1000 using base-ten numerals, number names and expanded form.
2.NBT.4 Compare two three-digit numbers based on meanings of the hundreds, tens, and ones digits, using >, =, and < symbols to record the results of comparisons.
B. Use place value understanding and properties of operations to add and subtract.
2.NBT.5 Fluently add and subtract within 100 using a strategies based on place value, properties of operations, and/or the relationship between addition and subtraction.
2.NBT.7 Add and subtract within 1000 using concrete models or drawings and strategies based on place value, properties of operations and/or the relationship between addition and subtraction.
7
Measurement and Data (2.MD)
A. Measure and estimate lengths in standard units.
2.MD.1 Measure the length of an object by selecting and using appropriate tools such as rulers, yardsticks, meter sticks and measuring tapes.
Geometry (2.G)
A. Reason with shapes and their attributes.
2.G.1 Recognize and draw shapes having specified attributes, such as a given number of angles or a given number of equal faces. Identify triangles, quadrilaterals, pentagons, hexagons, and cubes.
2.G.3 Partition circles and rectangles into two, three, or four equal shares, describing the shares using the words halves, thirds, half of, a third of, etc.
Back to Table of Contents
8
Essential Skills from Standards for Mathematical Content
Grade 3In grade 3 instructional time should focus on four critical areas: (1) developing understanding of multiplication and division and strategies for multiplication and division within 100; (2) developing understanding of fractions, especially unit fractions (fractions with numerator 1); (3) develop understanding of the structure of rectangular arrays and of area; and (4) describing and analyzing two-dimensional shapes.
Operations and algebraic thinking (3.OA)
A. Represent and solve problems involving multiplication and division.
3.OA.1 Interpret products of whole numbers, e.g., interpret 5 • 7 as the total number of objects in 5 groups of 7 objects each.
3.OA.2 Interpret whole-number quotients of whole numbers, e.g., interpret 56 ÷8 as the number of objects in each share when 56 objects are portioned equally into 8 shares, or as a number of shares when 56 objects are portioned into equal shares of 8 objects each.
3.OA.3 Use multiplication and division within 100 to solve word problems in situations involving equal groups, arrays, and measurement quantities.
C. Multiply and divide within 100.
3.OA.7 Fluently multiply and divide within 100, using strategies such as the relationship between multiplication and division.
Number and operations in base ten (3.NBT)
A. Use place value understanding and properties of operations to perform multi-digit arithmetic
3.NBT.2 Fluently add and subtract within 1000 using strategies and algorithms based on place value, properties of operations and/or the relationship between addition and subtraction.
Number and operations – fractions (3.NF)
A. Develop understanding of fractions as numbers
3.NF.1 Understand a fraction 1/b as the quantity formed by 1 part when a whole is portioned into b equal parts; understand a fraction a/b as the quantity formed by a parts of size 1/b.
3.NF.3 Explain equivalence of fractions in special cases, and compare fractions by reasoning about their size.
9

Measurement and data (3.MD)
C. Geometric measurement: understand concepts of area and relate area to multiplication and to addition.
3.MD.5 Recognize area as an attribute of plane figures and understand concepts of area measurement.
3.MD.6 Measure areas by counting unit squares (square cm, square m, square in, square ft, and improvised units).
3.MD.7 Relate area to the operations of multiplication and addition.
Back to Table of Contents
10
Essential Skills from Standards for Mathematical Content
Grade 4In grade 4 instructional time should focus on three critical areas: (1) developing understanding and fluency with multi-digit multiplication, and developing understanding of dividing to find quotients involving multi-digit dividends; (2) develop an understanding of fraction equivalence, addition and subtraction of fractions with like denominators, and multiplication of fraction by whole numbers; and (3) understanding that geometric figures can be analyzed and classified based on their properties, such as having parallel sides, perpendicular sides, particular angle measures, and symmetry.
Operations and Algebraic Thinking (4.OA)
A. Use the four operations with whole numbers to solve problems.
4.OA.3 Solve multistep word problems posed with whole numbers having whole-number answers using the four operations, including problems in which remainders must be interpreted. Represent these problems using equations with a letter standing or the unknown quantity. Assess the reasonableness of answers using mental computation and estimation strategies including rounding.
Number and Operations in Base Ten (4.NBT)
A. Generalize place value understanding for multi-digit whole numbers.
4.NBT.1 Recognize that in a multi-digit whole number, a digit in one place represents ten times what it represents in the place to its right.
4.NBT.2 Read and write multi-digit whole numbers using base-ten numerals, number names, and expanded form. Compare two multi-digit numbers based on meanings of the digits in each place using >, =, < symbols to record the results of comparisons.
4.NBT.3 Use place value understanding to round multi-digit whole numbers to any place.
B. Use place value understanding and properties of operations to perform multi-digit arithmetic.
4.NBT.4 Fluently add and subtract multi-digit whole numbers using the standard algorithm
4.NBT.5 Multiply a whole number of up to four digits by a one-digit whole number, and multiply two two-digit numbers using strategies based on place value and the properties of operations. Illustrate and explain the calculation by using equations, rectangular arrays, and/or area models.
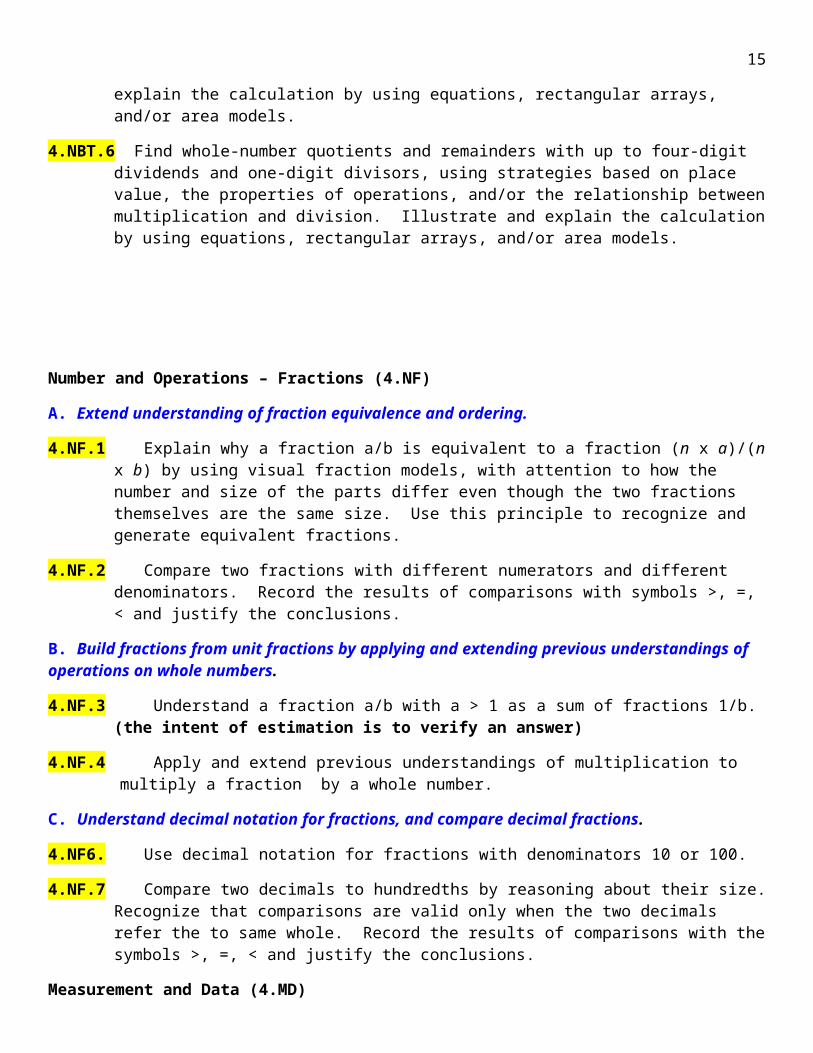
4.NBT.6 Find whole-number quotients and remainders with up to four-digit dividends and one-digit divisors, using strategies based on place value, the properties of operations, and/or the relationship between multiplication and division. Illustrate and explain the calculation by using equations, rectangular arrays, and/or area models.
11
Number and Operations – Fractions (4.NF)
A. Extend understanding of fraction equivalence and ordering.
4.NF.1 Explain why a fraction a/b is equivalent to a fraction (n x a)/(n x b) by using visual fraction models, with attention to how the number and size of the parts differ even though the two fractions themselves are the same size. Use this principle to recognize and generate equivalent fractions.
4.NF.2 Compare two fractions with different numerators and different denominators. Record the results of comparisons with symbols >, =, < and justify the conclusions.
B. Build fractions from unit fractions by applying and extending previous understandings of operations on whole numbers.
4.NF.3 Understand a fraction a/b with a > 1 as a sum of fractions 1/b. (the intent of estimation is to verify an answer)
4.NF.4 Apply and extend previous understandings of multiplication to multiply a fraction by a whole number.
C. Understand decimal notation for fractions, and compare decimal fractions.
4.NF6. Use decimal notation for fractions with denominators 10 or 100.
4.NF.7 Compare two decimals to hundredths by reasoning about their size. Recognize that comparisons are valid only when the two decimals refer the to same whole. Record the results of comparisons with the symbols >, =, < and justify the conclusions.
Measurement and Data (4.MD)
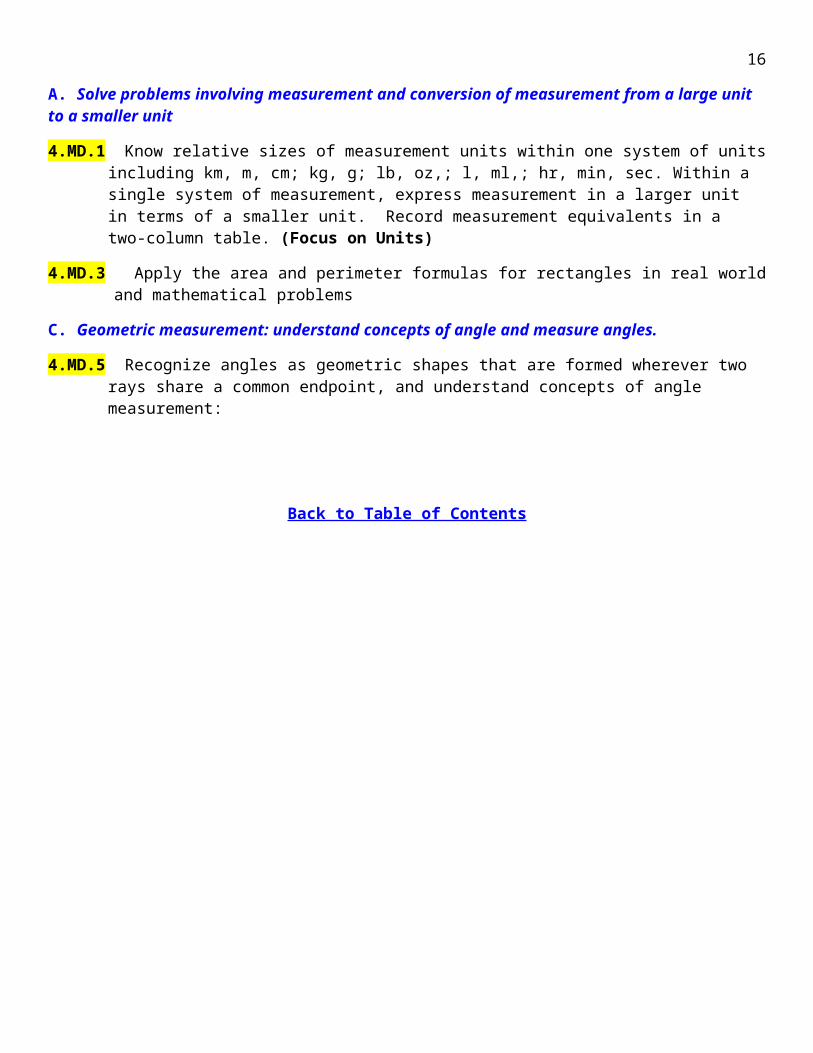
A. Solve problems involving measurement and conversion of measurement from a large unit to a smaller unit
4.MD.1 Know relative sizes of measurement units within one system of units including km, m, cm; kg, g; lb, oz,; l, ml,; hr, min, sec. Within a single system of measurement, express measurement in a larger unit in terms of a smaller unit. Record measurement equivalents in a two-column table. (Focus on Units)
4.MD.3 Apply the area and perimeter formulas for rectangles in real world and mathematical problems
C. Geometric measurement: understand concepts of angle and measure angles.
4.MD.5 Recognize angles as geometric shapes that are formed wherever two rays share a common endpoint, and understand concepts of angle measurement:
Back to Table of Contents
12
Essential Skills from Standards for Mathematical Content
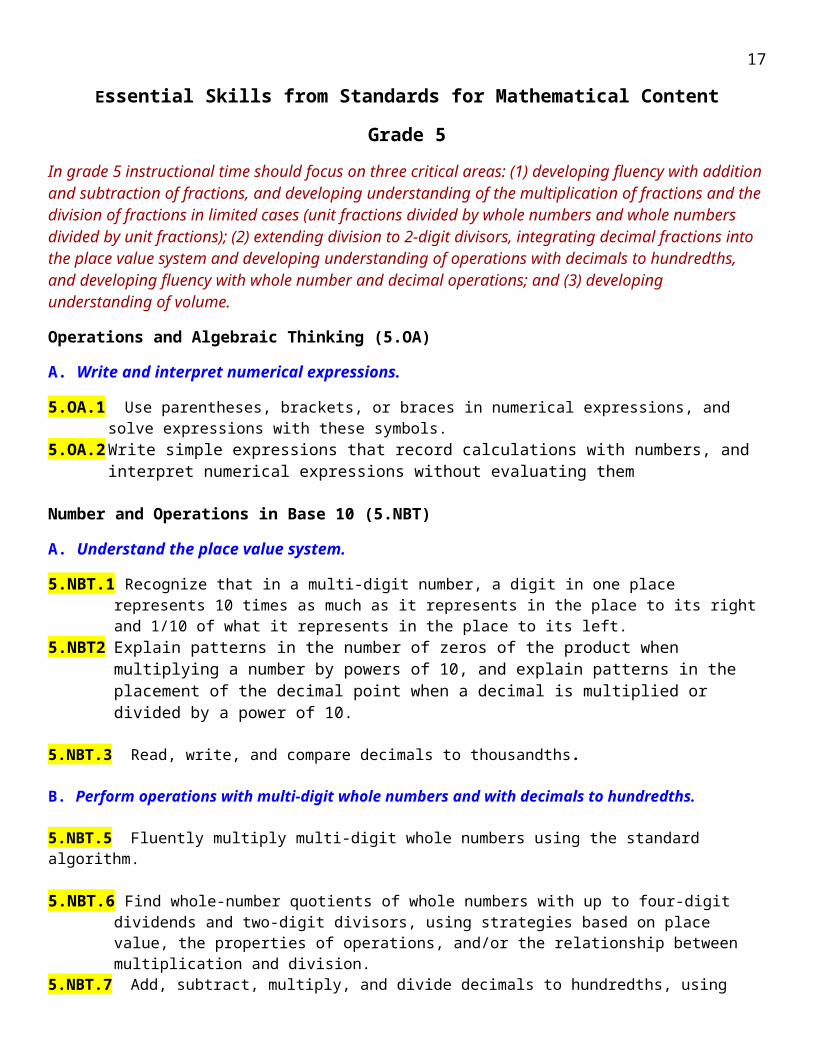
Grade 5In grade 5 instructional time should focus on three critical areas: (1) developing fluency with addition and subtraction of fractions, and developing understanding of the multiplication of fractions and the division of fractions in limited cases (unit fractions divided by whole numbers and whole numbers divided by unit fractions); (2) extending division to 2-digit divisors, integrating decimal fractions into the place value system and developing understanding of operations with decimals to hundredths, and developing fluency with whole number and decimal operations; and (3) developing understanding of volume.
Operations and Algebraic Thinking (5.OA)
A. Write and interpret numerical expressions.
5.OA.1 Use parentheses, brackets, or braces in numerical expressions, and solve expressions with these symbols.
5.OA.2 Write simple expressions that record calculations with numbers, and interpret numerical expressions without evaluating them
Number and Operations in Base 10 (5.NBT)
A. Understand the place value system.
5.NBT.1 Recognize that in a multi-digit number, a digit in one place represents 10 times as much as it represents in the place to its right and 1/10 of what it represents in the place to its left.
5.NBT2Explain patterns in the number of zeros of the product when multiplying a number by powers of 10, and explain patterns in the placement of the decimal point when a decimal is multiplied or divided by a power of 10.
5.NBT.3 Read, write, and compare decimals to thousandths.
B. Perform operations with multi-digit whole numbers and with decimals to hundredths.
5.NBT.5 Fluently multiply multi-digit whole numbers using the standard algorithm.
5.NBT.6 Find whole-number quotients of whole numbers with up to four-digit dividends and two-digit divisors, using strategies based on place value, the properties of operations, and/or the relationship between multiplication and division.
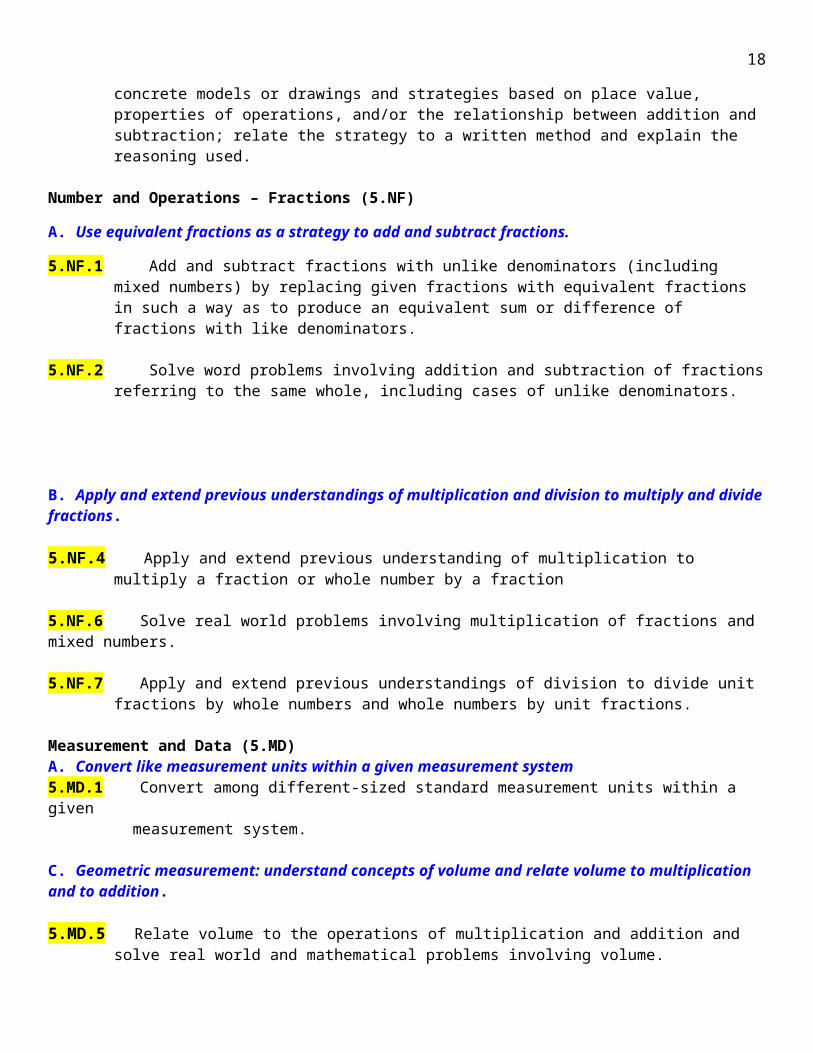
5.NBT.7 Add, subtract, multiply, and divide decimals to hundredths, using concrete models or drawings and strategies based on place value, properties of operations, and/or the relationship between addition and subtraction; relate the strategy to a written method and explain the reasoning used.
Number and Operations – Fractions (5.NF)
A. Use equivalent fractions as a strategy to add and subtract fractions.
5.NF.1 Add and subtract fractions with unlike denominators (including mixed numbers) by replacing given fractions with equivalent fractions in such a way as to produce an
13
equivalent sum or difference of fractions with like denominators.
5.NF.2 Solve word problems involving addition and subtraction of fractions referring to the same whole, including cases of unlike denominators.
B. Apply and extend previous understandings of multiplication and division to multiply and divide fractions.
5.NF.4 Apply and extend previous understanding of multiplication to multiply a fraction or whole number by a fraction
5.NF.6 Solve real world problems involving multiplication of fractions and mixed numbers.
5.NF.7 Apply and extend previous understandings of division to divide unit fractions by whole numbers and whole numbers by unit fractions.
Measurement and Data (5.MD)A. Convert like measurement units within a given measurement system5.MD.1 Convert among different-sized standard measurement units within a given
measurement system.
C. Geometric measurement: understand concepts of volume and relate volume to multiplication and to addition.
5.MD.5 Relate volume to the operations of multiplication and addition and solve real world and mathematical problems involving volume.
Geometry (5.G)
A. Graph points on the coordinate plane to solve real-world and mathematical problems.
5.G.1 Use a pair of perpendicular number lines, called axes, to define a coordinate system, with the intersection of the lines (the origin) arranged to coincide with the 0 on each line and a given point in the plane located by using an ordered pair of numbers, called its coordinates.
5.G.2 Represent real world and mathematical problems by graphing points in the first quadrant of the coordinate plane, and interpret coordinate values of points in the context of the situation
Back to Table of Contents
14

Essential Skills from Standards for Mathematical Content
Grade 6In grade 6 instructional time should focus on four critical areas: (1) connecting ratio and rate to whole number multiplication and division and using concepts of ratio and rate to solve problems; (2) completing understanding of division of fractions and extending the notion of number to the system of rational numbers, which includes negative numbers; (3) writing, interpreting, and using expressions and equations; and (4) developing understanding of statistical thinking.
Ratios and Proportional Relationships (6.RP)
A. Understand ratio concepts and use ratio reasoning to solve problems.
6.RP.1 Understand the concept of a ratio and use ratio language to describe a ratio relationship between two quantities.
6.RP.2 Understand the concept of a unit rate a/b associated with a ratio a:b with b≠0 and use rate language in the context of a ratio relationship.
6.RP.3 Use ratio and rate reasoning to solve real-world and mathematical problems, e.g., by reasoning about tables of equivalent ratios, tape diagrams, double number line diagrams, or equations
The Number System (6.NS)
A. Apply and extend previous understandings of multiplication and division to divide fractions by fractions.
6.NS.1 Interpret and compute quotients of fractions, and solve word problems involving division of fractions by fractions, e.g., by using visual fraction models and equations to represent the problem
B. Compute fluently with multi-digit numbers and find common factors and multiples.
6.NS.2 Fluently divide multi-digit numbers using the standard algorithm.
6.NS.3 Fluently add, subtract, multiply and divide multi-digit decimals using the standard algorithm for each operation.
6.NS.4 Find the greatest common factor of two whole numbers less than or equal to 100 and the least common multiple of two whole numbers less than or equal to 12. Use the distributive property to express a sum of two whole numbers 1-100 with a common factor as a multiple of a sum of two whole numbers with no common factor.
C. Apply and extend previous understandings of numbers to the system of rational numbers.
6.NS.5 Understand that positive and negative numbers are used together to describe quantities having opposite directions or values (e.g., temperature above/below zero, elevation above/below sea level, credits/debits, positive/negative electric charge); use positive and negative numbers to represent quantities in real-world contexts, explaining the meaning of 0 in each situation.
15
6.NS.6 Understand a rational number as a point on the number line, Extend number line diagrams and coordinate axes familiar from previous grades to represent points on the line and in the plane with negative number coordinates.
Expressions and equations (6.EE)
A. Apply and extend previous understandings of arithmetic to algebraic expressions
6.EE.2 Write, read, and evaluate expressions in which letters stand for numbers
6.EE.3 Apply the properties of operations to generate equivalent expressions
6.EE.4 Identify when two expressions are equivalent (i.e., when the two expressions name the same number regardless of which value is substituted into them.)
B. Reason about and solve one-variable equations and inequalities.
6.EE.5 Understand solving an equation or inequality as a process of answering a question: which values from a specified set, if any, make the equation or inequality true?
6.EE.7 Solve real-world and mathematical problems by writing and solving equations of the form x + p = q and px = q for cases in which p, q, and x are all nonnegative rational numbers.
Geometry (6.G)
A. Solve real-world and mathematical problems involving area, surface area, and volume.
6.G.1 Find the area of right triangles, other triangles, special quadrilaterals, and polygons by composing into rectangles or decomposing into triangles and other shapes; apply these techniques in the context of solving real-world and mathematical problems.
6.G.2 Find the volume of a right rectangular prism with appropriate unit fraction edge lengths by packing it with cubes of the appropriate unit fraction edge lengths (e.g., 3½ x 2 x 6) and show that the volume is the same as would be found by multiplying the edge lengths of the prism. Apply the formulas and to find the volumes of right rectangular prisms with fractional edge lengths in the context of solving real –world and mathematical problems.
Statistics and Probability (6.SP)
B. Summarize and describe distributions
6.SP.4 Display numerical data in plots on a number line, including dot plots, historgrams, and box plots.
6.SP.5 Summarize numerical data sets in relation to their context
Back to Table of Contents
16

Essential Skills from Standards for Mathematical Content
Grade 7In grade 7 instructional time should focus on four critical areas: (1) developing understanding of and applying proportional relationships; (2) developing understanding of operations with rational numbers and working with expressions and linear equations; (3) solving problems involving scale drawings and informal geometric constructions, and working with two- and three-dimensional shapes to solve problems involving area, surface area, and volume; and (4) drawing inferences about populations based on samples.
Ratios and Proportional Relationships (7.RP)
A. Analyze proportional relationships and use them to solve real-world and mathematical problems.
7.RP.1 Compute unit rates associated with ratios of fractions, including ratios of lengths, areas and other quantities measured in like or different units.
7.RP.2 Recognize and represent proportional relationships between quantities
7.RP.3 Use proportional relationships to solve multistep ratio and percent problems.
The Number System (7.NS)
A. Apply and extend previous understandings of operations with fractions to add, subtract, multiply, and divide rational numbers.
7.NS.1 Apply and extend previous understandings of addition and subtraction to add and subtract rational numbers; represent addition and subtraction on a horizontal or vertical number line diagram.
7.NS.2 Apply and extend previous understandings of multiplication and division and of fractions to multiply and divide rational numbers.
Expressions and Equations (7.EE)
A. Use properties of operations to generate equivalent expressions
7.EE.1 Apply properties of operations as strategies to add, subtract, factor, and expand linear expressions with rational coefficients.
B. Solve real-life and mathematical problems using numerical and algebraic expressions and equations.
7.EE.3 Solve multi-step real-life and mathematical problems posed with positive and negative rational numbers in any form (whole numbers, fractions, and decimals), using tools strategically. Apply properties of operations to calculate with numbers in any form; convert between forms as appropriate; and assess the reasonableness of answers using mental computation and estimation strategies.
17
7.EE.4 Use variables to represent quantities in a real-world or mathematical problem, and construct simple equations and inequalities to solve problems by reasoning about the quantities.
a. Solve word problems leading to equations of the form px + q = r and p(x + q) = r, where p, q, and r are specific rational numbers. Solve equations of these forms fluently.
Geometry (7.G)
A. Draw, construct, and describe geometrical figures and describe the relationships between them.
7.G.1 Solve problems involving scale drawings of geometric figures, including computing actual lengths and areas from a scale drawing and reproducing a scale drawing at a different scale.
B. Solve real-life and mathematical problems involving angle measure, area, surface area, and volume.
7.G.4 Know the formulas for the area and circumference of a circle and use them to solve problems; give an informal derivation of the relationship between the circumference and area of a circle.
7.G.5 Use facts about supplementary, complementary, vertical, and adjacent angles in a multi-step problem to write and solve simple equations for an unknown angle in a figure.
7.G.6 Solve real-world and mathematical problems involving area, volume and surface area of two- and three-dimensional objects composed of triangles, quadrilaterals, polygons, cubes, and right prisms.
Statistics and Probability (7.SP)
A. Use random sampling to draw inferences about a population.
7.SP.1 Understand that statistics can be used to gain information about a population by examining a sample of the population; generalizations about a population from a sample are valid only if the sample is representative of that population. Understand that random sampling tends to produce representative samples and support valid inferences.
C. Investigate chance processes and develop, use, and evaluate probability models.
7.SP.5 Understand that the probability of a chance event is a number between 0 and 1 that expresses the likelihood of the event occurring. Larger numbers indicate greater likelihood. A probability near 0 indicates an unlikely event, a probability around 1/2 indicates an event that is neither unlikely nor likely, and a probability near 1 indicates a likely event.
Back to Table of Contents
18
Essential Skills from Standards for Mathematical Content
Grade 8In grade 8 instructional time should focus on three critical areas: (1) formulating and reasoning about expressions and equations, including modeling an association in bivariate data with a linear equation, and solving linear equations and systems of linear equations; (2) grasping the concept of a function and using functions to describe quantitative relationships; and (3) analyzing two- and three-dimensional space and figures using distance, angle, similarity, and congruence, and understanding and applying the Pythagorean Theorem.
The Number System (8.NS)
A. Know that there are numbers that are not rational, and approximate them by rational numbers.
8.NS.1 Know that numbers that are not rational are called irrational. Understand informally that every number has a decimal expansion; for rational numbers show that the decimal expansion repeats eventually, and convert a decimal expansion which repeats eventually into a rational number.
Expressions and Equations (8.EE)
A. Work with radicals and integer exponents
8.EE.1 Know and apply the properties of integer exponents to generate equivalent numerical expressions
B. Understand the connections between proportional relationships, lines, and linear equations.
8.EE.5 Graph proportional relationships, interpreting the unit rate as the slope of the graph. Compare two different proportional relationships represented in different ways
8.EE. 6 Use similar triangles to explain why the slope m is the same between any two distinct points on a non-vertical line in the coordinate plane; derive the equation
y = mx for a line through the origin and the equation y = mx + b for a line intercepting the vertical axis at b.
C. Analyze and solve linear equations and pairs of simultaneous linear equations
8.EE.7 Solve linear equations in one variable
8.EE.8 Analyze and solve pairs of simultaneous linear equations
Functions (8.F)
A. Define, evaluate, and compare functions
8.F.1 Understand that a function is a rule that assigns to each input exactly one output. The graph of a function is the set of ordered pairs consisting of an input and the corresponding output
19
B. Use functions to model relationships between quantities
8.F.4 Construct a function to model a linear relationship between two quantities. Determine the rate of change and initial value of the function from a description of a relationship or from two (x, y) values, including reading these from a table or from a graph. Interpret the rate of change and initial value of a linear function in terms of the situation it models, and in terms of its graph or a table of values
Geometry (8.G)
A. Understand congruence and similarity using physical models, transparencies, or geometric software.
8.G.3 Describe the effect of dilations, translations, rotations, and reflections on two-dimensional figures using coordinates.
8.G.4 Understand that a two-dimensional figure is similar to another if the second can be obtained from the first by a sequence of rotations, reflections, translations, and dilations; given two similar two-dimensional figures, describe a sequence that exhibits the similarity between them.
8.G.5 Use informal arguments to establish facts about the angle sum and exterior angle of triangles, about the angles created when parallel lines are cut by a transversal, and the angle-angle criterion for similarity of triangles.
B. Understand and apply the Pythagorean Theorem8.G.7 Apply the Pythagorean Theorem to determine unknown side lengths in right triangles in real-
world and mathematical problems in two and three dimensions. (not angle sums)
C. Solve real-world and mathematical problems involving volume of cylinders, cones, and spheres.
8.G.9 Know the formulas for the volumes of cones, cylinders, and spheres and use them to solve real-world and mathematical problems.
Statistics and Probability (8.SP)
A. Investigate patterns of association in bivariate data.
8.SP.1 Construct and interpret scatter plots for bivariate measurement data to investigate patterns of association between two quantities. Describe patterns such as clustering, outliers, positive or negative association, linear association, and nonlinear association.
Back to Table of Contents
20
The essential skills listed here for SM1 – SM3 are draft forms. They have not been set by the high schools.
Essential Skills from Standards for Mathematical Content
Secondary Math IThe fundamental purpose of Secondary Math I is to formalize and extend the mathematics that students learned in the middle grades. The Mathematical Practice Standards apply throughout the course and together with the content standards, prescribe that students experience mathematics as a coherent, useful, and logical subject that makes use of their ability to make sense of problem situations.
In Secondary Math I, instructional time should focus on six critical areas: (1) interpret the structure of expressions to reason about relationships between quantities; (2) study functions through linear and exponential relationships; (3) solving equations, inequalities and systems of equations in order to reason with equations; (4) work with descriptive statistics to summarize, represent, and interpret data with an emphasis on linear models; (5) explore congruence criteria, proof and constructions in order to solve problems about triangles, quadrilaterals, and other polygons; and (6) connecting algebra and geometry through coordinates.
Unit 1 Relationships between quantitiesA. Reason quantitatively and use units to solve problems.
N.Q.1. Use units as a way to understand problems and to guide the solution of multi-step problems; choose and interpret units consistently in formulas; choose and interpret the scale and the origin in graphs and data displays
N.Q.3 Choose a level of accuracy appropriate to limitations on measurement when reporting quantities
B. Interpret the structure of expressions.
A.SSE.1.Interpret expressions that represent a quantity in terms of its context.
a. Interpret parts of an expression, such as terms, factors, and coefficients.
C. Create equations that describe numbers or relationships.
A.CED.1 Create equations (linear and exponential) and inequalities in one variable and use them to solve problems.
A.CED.2 Create equations (linear and exponential) in two or more variables to represent relationships between quantities; graph equations on coordinate axes with labels and scales
A.CED.4 Rearrange formulas to highlight a quantity of interest, using the same reasoning as in solving equations
21
Unit 2 Linear and exponential relationshipsA. Represent and solve equations and inequalities graphically.
A.REI.10 Understand that a graph of an equation in two variables is the set of all its solutions plotted in the coordinate plane, often forming a curve (which could be a line)
A.REI.11 Explain why the x-coordinates of the points where the graphs of the equations y = f(x) and y = g(x) intersect are the solutions of the equation f(x) = g(x); find the solutions approximately, e.g., using technology to graph the functions, make tables of values, or find successive approximations. Include cases where f(x) and/or g(x) are linear and exponential functions.
B. Understand the concept of a function and use function notation.
F.IF.2 Use function notation, evaluate functions for inputs in their domains, and interpret statements that use function notation in terms of a context
C. Interpret functions that arise in applications in terms of a context.
F.IF.6 Calculate and interpret the average rate of change of a function (presented symbolically or as a table) over a specified interval. Estimate the rate of change from a graph
D. Analyze functions using different representations.
F.IF.7 Graph functions (linear and exponential) expressed symbolically and show key features of the graph, by hand in simple cases and using technology for more complicated cases
a. Graph linear functions an show intercepts
e. Graph exponential functions, showing intercepts and end behavior
F.IF.9 Compare properties of two functions (linear and exponential) each represented in a different way (algebraically, graphically, numerically in tables, or by verbal descriptions)
F. Build new functions from existing functions
F.BF.3 Identify the effect on the graph of replacing f(x) by f(x) + k, k f(x), f(k x), and f(x + k) for specific values of k (both positive and negative); find the value of k given the graphs. Experiment with cases and illustrate an explanation of the effects on the graph using technology
G. Construct and compare linear and exponential models and solve problems
F.LE.1 Distinguish between situations that can be modeled with linear functions and with exponential functions
a. Prove that linear functions grow by equal differences over equal intervals; exponential functions grow by equal factors over equal intervals
F.LE.3 Observe using graphs and tables that a quantity increasing exponentially eventually exceeds a quantity increasing linearly
Unit 3 Reasoning with equationsA. Understand solving equations as a process of reasoning and explain the reasoning
22
A.REI.1 Explain each step in solving a simple equation as following from the equality of numbers asserted at the previous step, starting from the assumption that the original equation has a solution. Construct a viable argument to justify a solution method
B. Solve equations and inequalities in one variable.
A.REI.3 Solve linear equations and inequalities in one variable, including equations with coefficients represented by letters
C. Solve systems of equations.
A.REI.6 Solve systems of linear equations exactly and approximately (e.g., with graphs) focusing on pairs of linear equations in two variables
Back to Table of Contents
23
Unit 4 Descriptive StatisticsA. Summarize, represent, and interpret data on a single count or measurement variable.
S.ID.1 Represent data with plots on the real number line (dot plots, histograms, and box plots).
S.ID.2 Use statistics appropriate to the shape of the data distribution to compare center (median, mean) and spread (interquartile range, standard deviation) of two or more different data sets
S.ID.3 Interpret differences in shape, center, and spread in the context of the data sets, accounting for possible effects of extreme data point (outliers)
B. Summarize, represent, and interpret data on two categorical and quantitative variables.
S.ID.5 Summarize categorical data for two categories in two-way frequency tables. Interpret relative frequencies in the context of the data (including joint, marginal, and conditional relative frequencies). Recognize possible associations and trends in the data
6.SP.6 Represent data on two quantitative variables on a scatter plot, and describe how the variables are related
C. Interpret linear models.
S.ID.7 Interpret the slope (rate of change) and the intercept (constant term) of a linear model in the context of the data
S.ID.9 Distinguish between correlation and causation
Unit 5 Congruence, proof, and constructionsA. Experiment with transformations in the plane.
G.CO.1 Know precise definitions of angle, circle, perpendicular line, parallel line, and line segment, based on the undefined notions of point, line, distance along a line, and distance around a circular arc
G.CO.3 Given a rectangle, parallelogram, trapezoid, or regular polygon, describe the rotations and reflections that carry it onto itself
G.CO.5 Given a geometric figure and a rotation, reflection, or translation, draw the transformed figure using e.g., graph paper, tracing paper, or geometry software. Specify a sequence of transformations that will carry a given figure onto another
B. Understand congruence in terms of rigid motions
G.CO.7 Use the definition of congruence in terms of rigid motion to show that two triangles are congruent if and only if corresponding pairs of sides and corresponding pairs of angels are congruent
G.CO.8 Explain how the criteria for triangle congruence (ASA, SAS, and SSS) follow from the definition of congruence in terms of rigid motions
C. Make geometric constructions
24
G.CO.12 Make formal geometric constructions with a variety of tools and methods (compass and straightedge, string, reflexive devices, paper folding, dynamic geometric software, etc.)
Unit 6 Connecting algebra and geometry through coordinatesA. Use coordinates to prove simple geometric theorems algebraically.
G.GPE.1 Use coordinates to prove simple geometric theorems algebraic
Back to Table of Contents
25
Essential Skills from Standards for Mathematical Content
Secondary Math IIThe focus of Secondary Math II is on quadratic expressions, equations, and functions; comparing their characteristics and behavior to those of linear and exponential relationships from Secondary Math I as organized into 6 critical areas.
In Secondary Math II, instructional time should focus on six critical areas: (1) extending the number system with rational exponents, using properties of rational and irrational numbers and performing arithmetic operations with complex numbers and on polynomials; (2) understanding quadratic functions and modeling; (3) working with expressions and equations involving equivalent forms, complex numbers in polynomial identities and solving systems of equations; (4) applications of probability; (5) similarity, right triangle trigonometry and proof; and (6) circles with and without coordinates.
Unit 1 Extending the number systemA. Extend the properties of exponents to rational exponents.
N.RN.2 Rewrite expressions involving radicals and rational exponents using the properties of exponents
C. Perform arithmetic operations with complex numbers.
N.CN.1 Know there is a complex number I such that i2 = -1, and every complex number has the form a + bi with a and b real.
N.CN.2 Use the relation i2 = -1 and the commutative, associative, and distributive properties to add, subtract, and multiply complex numbers
Unit 2 Quadratic functions and modelingA. Interpret functions that arise in applications in terms of a context.
F.IF.4 For a function that models a relationship between two quantities, interpret key features of graphs and tables in terms of the quantities, and sketch graphs showing key features given a verbal description of the relationship
F.IF.6 Calculate and interpret the average rate of change of a function (presented symbolically or as a table) over a specified interval. Estimate the rate of change from a graph
B. Analyze functions using different representations.
F.IF.7 Graph functions (linear, exponential and quadratic) expressed symbolically and show key features of the graph, by hand in simple cases and using technology for more complicated cases
a. Graph linear functions and show intercepts
b. Graph square root, cube root, and piecewise-defined functions, including step functions and absolute value functions
26
D. Build new functions from existing functions.
F.BF.3 Identify the effect on the graph of replacing f(x) by f(x) + k, k f(x), f(k x), and f(x + k) for specific values of k (both positive and negative); find the value of k given the graphs. Experiment with cases and illustrate an explanation of the effects on the graph using technology
F.BF.4 Find inverse functions
a. Solve an equation of the form f(x) = c for a simple function f that has an inverse and write an expression for the inverse
Unit 3 Expressions and equationsA. Interpret the structure of expressions.
A.SSE.3 Choose and produce an equivalent form of an expression to reveal and explain properties of the quantity represented by the expression
B. Write expressions in equivalent forms to solve problems.
A.REI.3 Solve linear equations and inequalities in one variable, including equations with coefficients represented by letters
C. Create equations that describe numbers or relationships.
A.CED.1 Create equations and inequalities in one variable and use them to solve problems.
A.CED.2 Create equations in two or more variables to represent relationships between quantities; graph equations on coordinate axes with labels and scales
A.CED.4 Rearrange formulas to highlight a quantity of interest, using the same reasoning as in solving equations
D. Solve equations and inequalities in one variable.
A.REI.4 Solve quadratic equations in one variable
E. Use complex numbers in polynomial identities and equations.
N.CN.7 Solve quadratic equations with real coefficients that have complex solutions
Unit 4 Applications of probabilityA. Understand independence and conditional probability and use them to interpret data.
S.CP.1 Describe events as subsets of a sample space (the set of outcomes) using characteristics (or categories) of the outcomes, or as unions, intersections, or complements of other events (“or”, “and”, “not”)
S.CP.5 Recognize and explain the concepts of conditional probability and independence in everyday language and everyday situations
27
B. Use Rules of probability to compute probabilities of compound events in a uniform probability model.
S.CP.7 Represent data on two quantitative variables on a scatter plot, and describe how the variables are related
Unit 5 Similarity, right triangle trigonometry, and proof.E. Define trigonometric ratios and solve problems involving right triangles.
G.SRT.6 Understand that by similarity, side ratios in right triangles are properties of the angles in the triangle, leading to definitions of trigonometric ratios for acute angles
G.SRT.7 Explain and use the relationship between the sine and cosine of complementary angels
G.SRT.8 Use trigonometric ratios and the Pythagorean Theorem to solve right triangles in applied problems
Unit 6 Circle with and without coordinates.A. Understand and apply theorems about circles.
G.C.1 Prove that all circles are similar
G.C.2 Identify and describe relationships among inscribed angles, radii and chords.
E. Explain volume formulas and use them to solve problems.
G.GMD.3 Use volume formulas for cylinders, pyramids, cones, and spheres to solve problems.
Back to Table of Contents
28
Essential Skills from Standards for Mathematical Content
Secondary Math IIIThe focus of Secondary Math III is on polynomial, rational, and radical functions; general triangles; and the use of functions and geometry to create models and solve contextual problems.
In Secondary Math III, instructional time should focus on Four critical areas: (1) summarize, represent, and interpret data to make inferences and conclusions from data; (2) use complex numbers in polynomial identities and equations when working with polynomial, rational, and radical relationships; (3) apply trigonometry of general triangles and trigonometric functions; and (4) mathematical modeling.
Unit 1 Inferences and conclusions from dataB. Understand and evaluate random processes underlying statistical experiments.
S.IC.1 Understand that statistics allows inferences to be made about population parameters based on a random sample from that population
C. Make inferences and justify conclusions from sample surveys, experiments, and observational studies.
S.IC.3 Recognize the purposes of and differences among sample surveys, experiments, and observational studies; explain how randomization relates to each
S.IC.4 Use data from a sample survey to estimate a population mean or proportion; develop a margin of error through the use of simulation models for random sampling
S.IC.6 Evaluate reports based on data
Unit 2 Polynomials, rational, and radical relationshipsE. Understand the relationship between zeros and factors of polynomials
A.APR.2 Know and apply the remainder theorem: for a polynomial p(x) and a number a, the remainder on division by x – a is p(a), so p(a) = 0 if and only if (x-a) is a factor of p(x)
A.APR.3 Identify zeros of polynomials when suitable factorizations are available, and use the zeros to construct a rough graph of the function defined by the polynomial
G. Rewrite rational expressions.
A.APR.6 Rewrite simple rational expressions in different forms; write a(x)/b(x) in the form q(x) + r(x)/b(x), where a(x), b(x),q(x), and r(x) are polynomials with the degree of r(x) less than the degree of b(x), using inspection, long division, or, for the more complicated examples, a computer algebra system
H. Understand solving equations as a process of reasoning and explain the reasoning.
A.REI.2 Solve simple rational radical equations in one variable, and give examples showing how extraneous solutions may arise
29
I. Represent and solve equations and inequalities graphically.
A.REI.11Explain why the x-coordinates of the points where the graphs of the equations y = f(x) and y = g(x) intersect are the solutions of the equation f(x) = g(x); find the solutions approximately, e.g., using technology to graph the function, make tables of values, or find successive approximations, include cases where f(x) and/or g(x) are linear, polynomial, rational, absolute value, exponential, and logarithmic functions
Unit 3 Trigonometry of general triangles and trigonometric functionsB. Extend the domain of trigonometric functions using the unit circle.
F.TF.1 Understand radian measure of an angle as the length of the arc on the unit circle subtended by the angle
F.TF.2 Explain how the unit circle in the coordinate plane enables the extension of trigonometric functions to all real numbers, interpreted as radian measures of angles traversed counterclockwise around the unit circle.
C. Model periodic phenomena with trigonometric functions.
F.TF.5 Choose trigonometric functions to model periodic phenomena with specified amplitude, frequency, and midline
Unit 4 Mathematical modelingA. Create equations that describe numbers or relationships.
A.CED.1 Create equations and inequalities in one variable and use them to solve problems
A.CED.2 Create equations in two or more variables to represent relationships between quantities; graph equations on coordinate axes with labels and scales
A.CED.4 Rearrange formulas to highlight a quantity of interest, using the same reasoning as in solving equations
B. Interpret functions that arise in applications in terms of a context.
F.IF.4 For a function that models a relationship between two quantities, interpret key features of graphs and tables in terms of the quantities, and sketch graphs showing key features given a verbal description of the relationship
F.IF.5 Relate the domain of a function to its graph and, where applicable, to the quantitative relationship it describes
E. Build new functions from existing functions.
F.BF.3 Identify the effect on the graph of replacing f(x) by f(x) + k, kf(x), f(kx), and f(x + k) for specific values of k (both positive and negative); find the value of k given the graphs. Experiment with cases and illustrate an explanation of the effects on the graph using technology. Include recognizing even and odd functions from their graphs and algebraic expressions for them
F.BF.4 Find inverse functions (parts a and c) Back to Table of Contents
30
Sequence of Instruction for Essential SkillsFor District Interim Assessment practices
Sequence for Kindergarten Mathematics Essential Skills by QuarterQuarter 1K.CC.1 Count to10 by ones
K.CC.4a When counting up to 10 objects, say the number names in the standard order
Quarter 2K.CC.1 Count to 20 by ones
K.CC.3 Write numbers from 0 to 10. Represent a number of up to 10 objects with a written numeral with zero representing a count of no objects
K.G.2 Correctly name 2 dimensional shapes regardless of their orientation or overall Size
K.D. Recognize numbers 0 - 10 randomly
Quarter 3K.CC.1 Count to 50 by ones and to 100 by tens
K.CC.3 Write numbers from 0 to 20. Represent a number of up to 20 objects with a written numeral with zero representing a count of no objects
K.CC.4a When counting up to 20 objects, say the number names in the standard order
K.CC.5 Count to answer “how many” questions about as many as 20 things arranged in a line, a rectangular array, or as many as 10 things in a scattered configuration
K.CC.2 Count forward beginning from a given number within the known sequence
K.PCSD Recognize numbers up to 0 - 20 randomly
Quarter 4K.CC.1 Count to 100 by ones
K.OA.1 Represent addition and subtraction with objects, fingers, mental images, drawings, sounds, acting out situations, verbal explanations, expressions or
equations
K.OA.2 Solve addition and subtraction word problems, and add and subtract within 10
K.NBT.1 Compose numbers from 11 to 19 into ten ones and some further ones by using ten frames (Do not decompose)
Back to Table of Contents
31
Sequence for First Grade Mathematics Essential Skills by Quarter
Quarter 11NBT1 Count and write to 50
Quarter 21NBT1 Count and write to 100
1MD2 Express length of an object as a whole number of length units by laying multiple copies of a shorter object end to end
1OA6 Add and subtract within 10
Quarter 31OA1 Use addition and subtraction within 20 to solve word problems involving
situations of adding to, taking from, putting together, taking apart and comparing (without comparison)
1OA3 Apply properties of operations as strategies to add and subtract (commutative but not associative)
1OA6 Add and subtract within 20, demonstrating fluency for addition and subtraction within 10.
1NBT2 Understand that the two digits of a two-digit number represent amounts of tens and ones
1NBT3 Compare two two-digit numbers based on meanings of the tens and ones digits recording the results of comparison with the symbols >, =, and <.
Quarter 41OA7 Understand the meaning of the equal sign, and determine if equations involving
addition and subtraction are true or false.
1NBT 1 Count to 120, starting at any number less than 120. In this range, read and write numerals and represent a number of objects with a written numeral.
1NBT4 Add within 100, including adding a two-digit number and a one-digit number, and adding a two-digit number and a multiple of 10, using concrete models or drawings and strategies based on place value, properties of operations, and/or the relationship between addition and subtraction (without regrouping)
1NBT5 Given a two-digit number, mentally find 10 more or 10 less than the number without having to count; explain the reasoning used (without mentally).
Back to Table of Contents
32
Sequence for Second Grade Mathematics Essential Skills by Quarter
Quarter 12NBT1 Three-digit numbers represent amounts of hundreds, tens and ones
2NBT2 Skip count by 5’s, 10’s, and 100’s within 1000
2NBT3 Read and write numbers to 1000
Quarter 22NBT4 Compare three-digit numbers using <, >, and =
2NBT5 Fluently add with regrouping and subtract w/o regrouping within 100
2NBT7 Add w/ regrouping & Simple subtraction w/o regrouping within 1000 Quarter 3 2OA1 One-step addition and subtraction story problems,
2NBT7 Addition w/regrouping & subtraction with regrouping within 1000
2G1 Recognize and draw shapes with specific attributes
2G3 Partition circles and rectangles into two, three, or four equal shares,
Quarter 42OA1 Two-step addition and subtraction story problems
2OA4 Addition of objects in rectangular arrays (up tot 5 by 5)
2MD1 Measure lengths of objects
2OA2 Fluently add and subtract within 20
Back to Table of Contents
33
Sequence for Third Grade Mathematics Essential Skills by Quarter
Quarter 1 3NBT2 Fluently add and subtract within 1000 using strategies and algorithms based on place
value, properties of operations and/or the relationship between addition and subtraction
Quarter 23OA1 Interpret products of whole numbers, e.g., interpret 5•7 as the total number of
objects in 5 groups of 7 objects each.
3MD5 Recognize area as an attribute of plane figures and understand concepts of area measurement
3MD6 Measure areas by counting unit squares
3MD7 Relate area to the operations of multiplication and addition
Quarter 33OA2 Interpret whole-number quotients of whole numbers, e.g., interpret 56÷8 as the
number of objects in each share when 56 objects are portioned equally into 8 shares, or as a number of shares when 56 objects are portioned into equal shares of 8 objects each.
3NF1 Understand a fraction 1/b as the quantity formed by 1 part when a whole is portioned into b equal parts; understand a fraction a/b as the quantity formed by a parts of size 1/b
3NF3 Explain equivalence of fractions in special cases and compare fraction by reasoning about their size
Quarter 43OA7 Fluently add and subtract within 1000 using strategies and algorithms based on
place value, properties of operations and/or the relationship between addition and subtraction
3OA3 Use multiplication and division within 100 to solve word problems in situations involving equal groups, arrays, and measurement quantities
Back to Table of Contents
34
Sequence for Fourth Grade Mathematics Essential Skills by Quarter
Quarter 14NBT1 Recognize that in a multi-digit whole number, a digit in one place represents ten times what it represents in the place to the right
4NBT2 Read and write multi-digit whole numbers using base-ten numerals, number names, and expanded form. Compare two multi-digit numbers based on meanings of the digits in each place using >, =, < symbols to record the results of comparisons
4NBT3 Use place value understanding to round multi-digit whole numbers to any place
4NBT4 Fluently add and subtract multi-digit whole numbers using the standard algorithm
Quarter 24NBT5 Multiply a whole number of up to four digits by a one-digit whole number and
multiply two two-digit numbers using strategies based on place value and the properties of operations. Illustrate and explain the calculation by using equations, rectangular arrays, and/or area models
4MD3 Apply the area and perimeter formulas for rectangles in real world and mathematical problems
Quarter 34NF1 Explain why a fraction a/b is equivalent to a fractoin (n x a)/(n x b) by using
visual fraction models, with attention to how the number and size of the parts differ even though the two fractions themselves are the same size. Use this principle to recognize and generate equivalent fractions
4NF2 Compare two fractions with different numerators and different denominators. Record the results of comparisons with symbols >, =, < and justify the conclusions
4NF3 Understand a fraction a/b with a>1 as a sum of fractions 1/b. (The intent of estimation is to verify an answer)
4NF6 Use decimal notation for fractions with denominators 10 or 100
4NF7 Compare two decimals to hundredths by reasoning about their size. Recognize that comparisons are valid only when the two decimals refer to the same whole. Record the results of comparisons with the symbols >, =, < and justify the Conclusions
4OA3 Solve multistep word problems posed with whole numbers having whol-number answers using the four operations, including problems in which remainders must be interpreted. Represent these problems using equations with a letter standing for the unknown quantity. Assess the reasonableness of answers using mental computation and estimation strategies including rounding
35
4NBT6 Find whole number quotients and remainders with up to four digit dividends and one digit divisors, using strategies based on place value, the properties of operations, and/or the relationship between multiplication and division. Illustrate and explain the calculation by using equations, rectangular arrays, and/or area models
Quarter 44MD1 Know relative sizes of measurement units within one system of units including
km, m, cm’ kg, g; lb, oz; l, ml; hr, min, sec. Within a single system of measurement, express measurement in a larger unit in terms of a smaller unit. Record measurement equivalents in a two column table (focus on units)
4MD5 Recognize angles as geometric shapes that are formed whenever two arrays share a common endpoint, and understand concepts of angle measurement
4NF4 Apply and extend previous understandings of multiplication to multiply a fractoin by a whole number
Back to Table of Contents
36
Sequence for Fifth Grade Mathematics Essential Skills by Quarter
Quarter 1 5NBT1 Recognize that in a multi-digit number, a digit in one place represents 10 times as
much as it represents in the place to its right and 1/10 of what it represents in the place to its left
5NBT2 Explain patterns in the number of zeros of the product when multiplying a number by powers of 10, and explain patterns in the placement of the decimal point when a decimal is multiplied or divided by a power of 10.
5NBT3 Read, write, and compare decimals to thousandths
5NBT5 Fluently multiply multi-digit whole numbers using the standard algorithm
Quarter 25NBT6 Find whole-number quotients of whole numbers with up to four-digit dividends
and two-digit divisors, using strategies based on place value, the properties of operations, and/or the relationship between multiplication and division
5NBT7 Add, subtract, multiply, and divide decimals to hundredths, using concrete models or drawings and strategies based on place value, properties of operations, and/or the relationship between addition and subtraction; relate the strategy to a written method and explain the reasoning used.
Quarter 35NF1 Add and subtract fractions with unlike denominators (including mixed numbers)
by replacing given fractions with equivalent fractions in such a way as to produce an equivalent sum or difference of fractions with like denominators
5NF2 Solve word problems involving addition and subtraction of fractions referring to the same whole, including cases of unlike denominators
5NF4 Apply and extend previous understanding of multiplication to multiply a fraction or whole number by a fraction
5NF6 Solve real world problems involving multiplication of fractions and mixed numbers.
5NF7 Apply and extend previous understandings of division to divide unit fractions by whole numbers and whole numbers by unit fractions.
37
Quarter 45OA1 Use parentheses, brackets, or braces in numerical expressions, and solve
expressions with these symbols
5OA2 Write simple expressions that record calculations with numbers, and interpret numerical expressions without evaluating them
5G1 Use a pair of perpendicular number lines, called axes, to define a coordinate system, with the intersection of the lines (the origin) arranged to coincide with the 0 on each line and a given point in the plane located by using an ordered pair of numbers, called its coordinates.
5G2 Represent real world and mathematical problems by graphing points in the first quadrant of the coordinate plane, and interpret coordinate values of points in the context of the situation
5MD1 Convert among different-sized standard measurement units within a given measurement system
5MD5 Relate volume to the operations of multiplication and addition and solve real world and mathematical problems involving volume
Back to Table of Contents
38
Sequence for Sixth Grade Mathematics Essential Skills by Quarter
Quarter 16NS2 Fluently divide multi-digit numbers using the standard algorithm
6NS3 Fluently add, subtract, multiply and divide multi-digit decimals using the standard algorithm for each operation
6EE2 Write, read, and evaluate expressions in which letters stand for numbers
6EE3 Apply the properties of operations to generate equivalent expressions
6EE4 Identify when two expressions are equivalent (i.e., when the two expressions name the same number regardless of which value is substituted into them.)
Quarter 26NS3 Fluently add, subtract, multiply and divide multi-digit decimals using the
standard algorithm for each operation
6NS4 Find the greatest common factor of two whole numbers less than or equal to 100 and the least common multiple of two whole numbers less than or equal to 12. Use the distributive property to express a sum of two whole numbers 1-100 with a common factor as a multiple of a sum of two whole numbers with no common factor
6EE5 Understand solving an equation or inequality as a process of answering a question: which values from a specified set, if any, make the equation or inequality true?
6Ee7 Solve real-world and mathematical problems by writing and solving equations of the form x + p = q and px = q for cases in which p, q, and x are all nonnegative rational numbers
Quarter 36NS1 Interpret and compute quotients of fractions, and solve word problems involving
division of fractions by fractions, e.g., by using visual fraction models and equations to represent the problem
6RP1 Understand the concept of a ratio and use ratio language to describe a ratio relationship between two quantities
6Rp2 Understand the concept of a unit rate a/b associated with a ratio a:b with b≠0 and use rate language in the context of a ratio relationship
6NS5 Understand that positive and negative numbers are used together to describe quantities having opposite directions or values (e.g., temperature above/below zero, elevation above/below sea level, credits/debits, positive/negative electric charge); use positive and negative numbers to represent quantities in real-world contexts, explaining the meaning of 0 in each situation
39
6NS6 Understand a rational number as a point on the number line, Extend number line diagrams and coordinate axes familiar from previous grades to represent points on the line and in the plane with negative number coordinates
Quarter 46G1 Find the area of right triangles, other triangles, special quadrilaterals, and
polygons by composing into rectangles or decomposing into triangles and other shapes; apply these techniques in the context of solving real-world and mathematical problems
6G2 Find the volume of a right rectangular prism with appropriate unit fraction edge lengths by packing it with cubes of the appropriate unit fraction edge lengths (e.g., 3½ x 2 x 6) and show that the volume is the same as would be found by multiplying the edge lengths of the prism. Apply the formulas and to find the volumes of right rectangular prisms with fractional edge lengths in the context of solving real –world and mathematical problems
6SP4 Display numerical data in plots on a number line, including dot plots, historgrams, and box plots
6Sp5 Summarize numerical data sets in relation to their context
Back to Table of Contents
40
Math 7 Resource Guide for Provo City School District’s Essentials
41
Summary of Practice Standards Prompts to develop mathematical thinking1. Make sense of problems and persevere in solving them.Interpret and make meaning of the problem to find a starting point.
Analyze what is given in order to explain to themselves the meaning of a problem.
Plan a solution pathway instead of jumping to a solution.
Monitor their progress and change the approach if necessary.
See relationships between various representations.
Relate current situations to concepts or skills previously learned and connect mathematical ideas to one another.
Continually ask themselves, “Does this make sense?”
Can understand various approaches to solutions
How would you describe the problem in your own words?
How would you describe what you are trying to find?
What do you notice about . . .?
Describe the relationship between quantities.
Describe what you have already tried. What might you change?
Talk me through the steps in the steps you’ve used to this point.
What steps in the process are you most confident about?
What are some other strategies you might try?
What are some other problems that are similar to this one?
How might you use one of your previous problems to help you begin?
How else might you organize . . . represent . . . show . . .?
2. Reason abstractly and quantitatively.Make sense of quantities and their relationships.
Decontextualize (represent a situation symbolically and manipulate the symbols) and contextualize (make meaning of the symbols in a problem) quantitative relationships.
Understand the meaning of quantities and are flexible in the use of operations and their properties
Create a logical representation of the problem.
Attend to the meaning of quantities, not just how to compute them.
What do the numbers used in the problem represent?
What is the relationship of the quantities?
How is __________ related to ___________?
What is the relationship between ____________ and ____________?
What does ___________ mean to you? (e.g., symbol, quantity, diagram)
What properties might we use to find a solution?
How did you decide in this task that you needed to use . . .?
Could we have used another operation or property to solve this task? Why or why not?
3. Construct viable arguments and critique the reasoning of others.Analyze problems and use stated mathematical assumptions, definitions, and established results in constructing arguments.
Justify conclusions with mathematical ideas.
Listen to the arguments of others and ask useful questions to determine if an argument makes sense.
Ask clarifying questions or suggest ideas to improve/revise the argument.
Compare two arguments and determine correct or flawed logic.
What mathematical evidence would support your solution?
How can we be sure that . . .? How could you prove that . . .?
Will it still work if . . .?
What were you considering when . . .?
How did you decide to try that strategy?
How did you test whether your approach worked?
How did you decide what the problem was asking you to find? (What was unknown?)
Did you try a method that did not work? Why didn’t it work? Would it ever work? Why or why not?
What is the same and what is different about . . .?
How could you demonstrate a counter-example?
42
4. Model with mathematics.Understand this is a way to reason quantitatively and abstractly (able to decontextualize and contextualize, see standard 2 above).
Apply the mathematics they know to solve everyday problems.
Are able to simplify a complex problem and identify important quantities to look at relationships.
Represent mathematics to describe a situation either with an equation or a diagram and interpret the results of a mathematical situation.
Reflect on whether the results make sense, possibly improving/ revising the model
What number model could you construct to represent the problem?
What are some ways to represent the quantities?
What is an equation or expression that matches the diagram, number line, chart, table ?
Where did you see one of the quantities in the task in your equation or expression?
How would it help to create a diagram, graph, table?
What are some ways to visually represent . . .?
What formula might apply in this situation?
How can I represent this mathematically?
Summary of Practice Standards Prompts to develop mathematical thinking5. Use appropriate tools for mathematical practice.Use available tools recognizing the strengths and limitations of each.
Use estimation and other mathematical knowledge to detect possible errors.
Identify relevant external mathematical resources to pose and solve problems.
Use technological tools to deepen their understanding of mathematics
What mathematical tools could we use to visualize and represent the situation?
What information do you have?
What do you know that is not stated in the problem?
What approach are you considering trying first?
What estimate did you make for the solution?
In this situation would it be helpful to use a graph, number line, ruler, diagram, calculator, manipulative?
Why was it helpful to use ______?
What can using a _______ show us that _______ may not?
In what situations might it be more informative or helpful to use ________?
6. Attend to precision.Communicate precisely with others and try to use clear mathematical language when discussing their reasoning.
Understand the meanings of symbols used in mathematics and can label quantities appropriately.
Express numerical answers with a degree of precision appropriate for the problem context.
Calculate efficiently and accurately.
What mathematical terms apply to this situation?
How did you know your solution was reasonable?
Explain how you might show that your solution answers the problem?
What would be a more efficient strategy?
How are you showing the meaning of the quantities?
What symbols or mathematical notations are important in this problem?
What mathematical language, definitions, properties can you use to explain ______?
How can you test your solution to see if it answers the problem?
7. Look for and make use of structure.Apply general mathematical rules to specific situations.
Look for the overall structure and pattern in mathematics.
See complicated things as single objects or as being composed of several objects.
What observations do you make about _____ ?
What do you notice when ______?
What parts of the problem might you eliminate or simplify?
What patterns do you find in _______ ?
How do you know if something is a pattern?
What ideas that we have learned before were useful in solving this problem?
What are some other problems that are similar to this one?
How does this problem connect to other mathematical concepts?
In what ways does this problem connect to other mathematical concepts?
43
8. Look for and express regularity in repeated reasoning?See repeated calculations and look for generalizations and shortcuts.
See the overall process of the problem and still attend to the details.
Understand the broader application of patterns and see the structure in similar situations.
Continually evaluate the reasonableness of immediate results.
Explain how this strategy will work in other situations.
Is this always true, sometimes true, or never true?
How would you prove that _______?
What do you notice about ________?
What is happening in this situation?
What would happen if ________?
Is there a mathematical rule for _________?
What predictions or generalizations can this pattern support?
What mathematical consistencies do you notice?
44
In Grade 7, instructional time should focus on four critical areas:
1. Developing understanding of and applying proportional relationships2. Developing understanding of operations with rational numbers and working with
expressions and linear equations3. Solving problems involving scale drawings and informal geometric constructions, and
working with two- and three-dimensional shapes to solve problems involving area, surface area, and volume
4. Drawing inferences about populations based on samples 1. Students extend their understanding of ratios and develop understanding of proportionality to
solve single- and multi-step problems. Students use their understanding of ratios and proportionality to solve a wide variety of percent problems, including those involving discounts, interest, taxes, tips, and percent increase or decrease. Students solve problems about scale drawings by relating corresponding lengths between the objects or by using the fact that relationships of lengths within an object are preserved in similar objects. Students graph proportional relationships and understand the unit rate informally as a measure of the steepness of the related line, called the slope. They distinguish proportional relationships from other relationships.
2. Students develop a unified understanding of number, recognizing fractions, decimals (that have a finite or a repeating decimal representation), and percents as different representations of rational numbers. Students extend addition, subtraction, multiplication, and division to all rational numbers, maintaining the properties of operations and the relationships between addition and subtraction, and multiplication and division. By applying these properties, and by viewing negative numbers in terms of everyday contexts (e.g., amounts owed or temperatures below zero), students explain and interpret the rules for adding, subtracting, multiplying, and dividing with negative numbers. They use the arithmetic of rational numbers as they formulate expressions and equations in one variable and use these equations to solve problems.
3. Students continue their work with area from Grade 6, solving problems involving the area and circumference of a circle and surface area of three-dimensional objects. In preparation for work on congruence and similarity in Grade 8 they reason about relationships among two-dimensional figures using scale drawings and informal geometric constructions, and they gain familiarity with the relationships between angles formed by intersecting lines. Students work with three-dimensional figures, relating them to two-dimensional figures by examining cross-sections. They solve real-world and mathematical problems involving area, surface area, and volume of two- and three-dimensional objects composed of triangles, quadrilaterals, polygons, cubes and right prisms.
4. Students build on their previous work with single data distributions to compare two data distributions and address questions about differences between populations. They begin informal work with random sampling to generate data sets and learn about the importance of representative samples for drawing inferences.
45
Domain: The Number System 7NS (Quarter 1)Cluster: Apply and extend previous understandings of operations with fractions to add, subtract, multiply and divide rational numbers.Standard: 7.NS.1 Apply and extend previous understandings of addition and subtraction to add and subtract rational numbers; represent addition and subtraction on a horizontal or vertical line diagram.
a) Describe situations in which opposite quantities combine to make 0. For example, a hydrogen atom has 0 charge because its two constituents are oppositely charged.
b) Understand p + q as the number located a distance |p| from q, in the positive or negative direction depending on whether q is positive or negative. Show that a number and its opposite have a sum of 0 (are additive inverses). Interpret sums of rational numbers by describing real-world contexts.
c) Understand subtraction of rational numbers as adding the additive inverse, p – q = p + (-q). Show that the distance between two rational numbers on the number line is the absolute value of their difference, and apply this principal to real-world contexts.
d) Apply properties of operations as strategies to add and subtract rational numbers.
Mastery, Patterns of Reasoning: Example:
Conceptual: Understand, apply and explain the
additive inverse property
What number can we add to 5 to get 0? How many numbers can we add to 8 to get to 0? What is the relationship between 6 and -6?
Procedural: Add and subtract rational numbers
including integers, decimals and fractions
3 + -8 + 4 + -7 = _____ 2/3 + - 3/5 = ______ 1.5 + - 0.75 = _______
Representational: Model addition and subtraction of
rational number, including integers, decimals and fractions on a vertical or horizontal number line
Write two different problems this model could represent.
Critical Background Knowledge: Bridge to previous instruction:
Conceptual: Understand adding and subtracting
fractions and decimals for fluency
5.NF.1, 5.NF.4, 6.NS.3
Procedural: Fluently add and subtract positive
fractions and decimals5.NF.1, 5.NF.4, 6.NS.3
Representational: Represent addition and subtraction
of fractions with manipulatives 5.NF.1, 5.NF.4, 6.NS.3
Common misconceptions:o Some students think that the absolute value is the opposite sign of the original rather than the
distance from zero
46
Domain: The Number System 7NS (Quarter 1)Cluster: Apply and extend previous understandings of operations with fractions to add, subtract, multiply and divide rational numbers.Standard: 7.NS.2 Apply and extend previous understandings of multiplication and division and of fractions to multiply and divide rational numbers.
a) Understand that multiplication is extended from fractions to rational numbers by requiring that operations continue to satisfy the properties of operations, particularly the distributive property, leading to products such as (-1)(-1) = 1 and the rules for multiplying signed numbers. Interpret products of rational numbers by describing real-world contexts.
b) Understand that integers can be divided, provided that the divisor is not zero, and every quotient of integers (with non-zero divisor) is a rational number. If p and q are integers, then –(p/q) = (-p)/q = p/(-q). Interpret quotients of rational numbers by describing real-world contexts.
c) Apply properties of operations as strategies to multiply and divide rational numbers.d) Convert a rational number to a decimal using long division; know that the decimal form of a rational
number terminates in 0’s or eventually repeats.
Mastery, Patterns of Reasoning: Example:Conceptual:
Understand that multiplication is extended from fractions to rational numbers by requiring that operations continue to satisfy the properties of operations
Understand that integers can be divided, provided that the divisor is not zero, and every quotient of integers (with non-zero divisor) is a rational number
How many quarter pounders can you make with 12/3 pounds of hamburger?
Procedural: Apply properties of operations as strategies to multiply and
divide rational numbers Multiply and divide rational numbers, including integers,
decimals, and fractions and use properties of arithmetic to model multiplication and division or rational numbers.
Explain why division by zero is undefined Use long division to change a fraction into a terminating or
repeating decimal Interpret products of quotients of rational numbers,
including integers, decimals, and fractions in real-world contexts
Compute 2/3 • (- ¼) Convert 3/5 to a decimal using long division. Why do we say division by zero is undefined? 3÷(-1) = _____
Representational: Represent real-world contexts of quotients of rational
numbers.
Write a story problem that would represent the problem -1.25 ÷ 2.
Critical Background Knowledge: Bridge to previous instruction:
Conceptual: Understand multiplication and division of fractions
and decimals to a strong level of fluency
5.NF.1, 5.NF.4, 6.NS.3
Procedural: Fluently multiply and divide positive fractions and
decimals5.NF.1, 5.NF.4, 6.NS.3
Representational: Model multiplication and division of positive fractions
and decimals with manipulatives. 5.NF.1, 5.NF.4, 6.NS.3
Common misconceptions:o Do not understand the relationship between fractions, decimals and percent.o Sometimes think that the more decimal places they see, the smaller the number is ( 0.002 > 0.00311)
47
Domain: Expressions and Equations 7EE (Quarter 1)
Cluster: Use properties of operations to generate equivalent expressions.
Standard: 7.EE.1 Apply properties of operations as strategies to add, subtract, factor, and expand linear expressions with rational coefficients.
Mastery, Patterns of Reasoning: Example:
Conceptual: Understand the Distributive Property in order to expand
and factor linear expressions with rational numbers
Write an expression for the sequence of operations: add 3 to x, subtract the result from 1 and then double what you have.
Procedural: Use the Distributive Property to expand and factor linear
expressions with rational numbers. Combine like terms with rational coefficients.
Given , what is y when x is 4?
Simplify
Representational: Model the distributive property when expanding and
factoring linear expressions with rational numbers using area models.
Model 2( 3 + 5) with manipulatives Model 2(3 + x ) with manipulatives
Critical Background Knowledge: Bridge to previous instruction:
Conceptual: Know the Commutative Property, Associative
Property, Distributive Property Know order of operations
3.OA.5
Procedural: Use the Commutative Property, Associative Property,
Distributive Property Use order of operations Generate equivalent expressions (e.g., simplify)
involving whole numbers
3.OA.5
Representational: Model the Commutative Property, Associative
Property, and Distributive Property. 3.OA.5
Common misconceptions:o Student’s think that “7 less than a number” is 7 – x instead of x – 7o Students see multiplication and division as discrete and separate operations and not as inverse
operations
o Students sometimes do not see all instances of distribution for example the say
o Students think that division is commutative (5 ÷ 3 = 3 ÷ 5)o Students think they are always supposed to divide the smaller number into the larger number
48
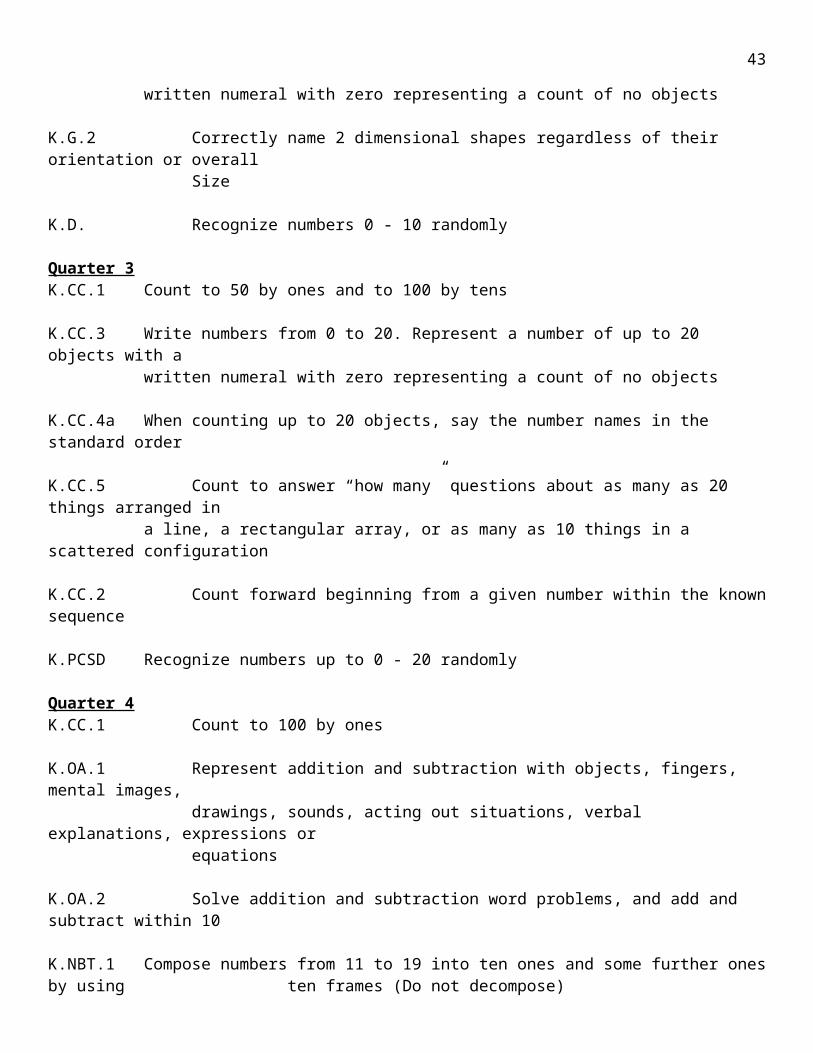
Domain: Expressions and Equations 7EE (Quarter 1)Cluster: Solve real-life and mathematical problems using numerical and algebraic expressions and equations.Standard: 7.EE.3 Solve multi-step real-life and mathematical problems posed with positive and negative rational numbers in any form (whole numbers, fractions, and decimals), using tools strategically. Apply properties of operations to calculate with numbers in any form; convert between forms as appropriate; and assess the reasonableness of answers using mental computation and estimation strategies. For example: if a woman making $25 an hour gets a 10% raise, she will make an additional 1/10 of her salary an hour, or $2.50, for a new salary of $27.50. If you want to place a towel bar 9¾ inches long in the center of a door that is 27½ inches wide, you will need to place the bar about 9 inches from each edge; this estimate can be used as a check on the exact computation.
Mastery, Patterns of Reasoning: Example:
Conceptual: Understand requirements of reasonableness of an answer Know mental computation strategies Know relationships between different forms of rational numbers
Posters of flowers costs $4 and posters of mountains cost $2. How many of each can you buy with $16.
Procedural: Solve multi-step mathematical problems involving calculations
with positive and negative rational numbers in a variety of forms Solve multi-step real-life problems involving calculations with
positive and negative rational numbers in a variety of forms Convert between forms of a rational number to simplify
calculations or communicate solutions meaningfully Assess the reasonableness of answers using mental computation
and estimation
Tim earns $150.00 weekly with an additional 10% commission on sales. If his sales last week totaled $4800.00, what is his total salary for last week?
An investment starts with $95 and grows by 13%. How much is the investment worth now?
Mentally compute the 15% tip on a meal that costs $24.
Representational: Model problems that require multiple steps of calculations using
positive and negative rational numbers.
A football team runs for 8 yards but then is penalized 15 yards for a personal foul. Write an expression that shows these measures and the final yardage in terms where the play started.
Critical Background Knowledge: Bridge to previous instruction:
Conceptual: Know relationships between fractions, decimals and
percent
5.NF.1, 5.NF.4, 6.NS.3, 6.RP.3
Procedural: Solve one-step linear equations involving non-
negative rational numbers Convert between fractions decimals and percent
6.EE.7
7.NS.2dRepresentational:
Model relationships between fractions, decimals, and percent
Use manipulatives to represent fractions, decimals and percent
5.NF.1, 5.NF.4, 6.NS.3
Common misconceptions:o Students do not properly use the order of operations, mostly associated with grouping
symbols and remembering to work left to right with equivalent levels of operations
49

Domain: Ratios and Proportional Reasoning 7RP (Quarter 2)Cluster: Analyze proportional relationships and use them to solve real-world and mathematical problemsStandard: 7.RP.1 Compute unit rates associated with ratios of fractions, including ratios of lengths, areas and other quantities measured in like or different units. For example, if a person walks ½ mile in each ¼ hour, compute the unit rate as the complex fraction ½ / ¼ miles per hour, equivalently 2 miles per hour.
Mastery, Patterns of Reasoning: Example:
Conceptual: Understand unit rates associated with ratios of fractions,
including ratios of lengths, areas and other quantities.
A health center has an indoor track. Every half lap is a fifth of a kilometer. What is the unit rate of kilometers per lap? What is the unit rate of laps per kilometer? How are these different from each other?
Procedural: Extend the concept of a unit rate to include ratios of
fractions Compute a unit rate involving quantities measured in
like or different units
If a pool’s water level raises 1/10 inch in ¼ hour, what is the unit rate of rising water per hour?
If Monica reads 7½ pages in 9 minutes, what is her average reading rate in pages per minute and in pages per hour?
Representational: Model unit rates with manipulatives, tables and graphs
Critical Background Knowledge: Bridge to previous instruction:
Conceptual: Understand the concept of a unit rate
6.RP.2
Procedural: Solve unit rate problems Simplify a complex fraction
6.RP.36.NS.1
Representational: Use manipulatives to represent complex fractions 6.NS.1
Common misconceptions:o Students confuse the significance of the numerator compared to the denominator of a fraction.o Students sometimes believe a greater denominator has a greater value than a ratio with a lesser
denominator, e.g., 1/5 . > 1/3 .o Students may rely on one configuration for setting up proportions without realizing that other
configurations may also be correct.
50
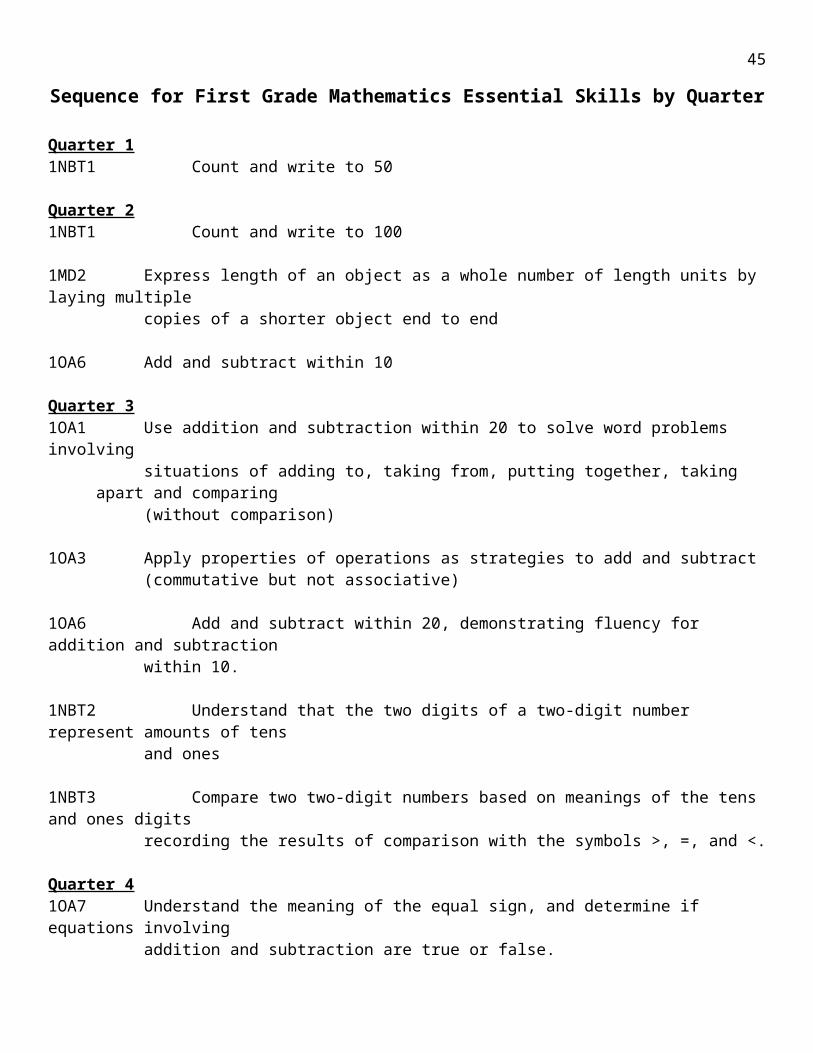
Domain: Ratios and Proportional Reasoning 7RP (Quarter 2)Cluster: Analyze proportional relationships and use them to solve real-world and mathematical problemsStandard: 7.RP.2 Recognize and represent proportional relationships between quantities.b) Identify the constant of proportionality (unit rate) in tables, graphs, equations, diagrams, and verbal descriptions of proportional relationships
Mastery, Patterns of Reasoning: Example:
Conceptual: Understand what a point (x, y) on the graph of a
proportional relationship means in terms of the situation.
Use the graph below for each bulleted problem:
What do the coordinates for point A represent?
Procedural: Verify that two quantities expressed in a table or graph
are in a proportional relationship Determine a unit rate from a table, graph, equation,
diagram or verbal description and relate it to the constant of proportionality
Write an equation for a proportional relationship in the form y = kx
Explain the meaning of the point (x, y) in the context of a proportional relationship
Explain the significance of (0, 0) and (1, r) in a graph of a proportional relationship, where r is the unit rate
Verify that points C and D are in a proportional relationship.
What is the unit rate of line 2? Write the equation for the proportional
relationship shown in line 1. Explain the meaning of point D in line 2. Find (1, r) for line 2, then explain the
significance of the value r found.
Representational: Represent proportional relationships by equations
Represent both proportional relationships of line 1 and 2 with equations.
Critical Background Knowledge: Bridge to previous instruction:
Conceptual: Understand the concept of a unit rate
6.RP.1
Procedural: Make tables generated from equivalent ratio 6.RP.3
Representational: Plot points generated from equivalent ratios 6.RP.3
Common misconceptions:o Students may rely on one configuration for setting up proportions without realizing that other
configurations may also be correct.
51
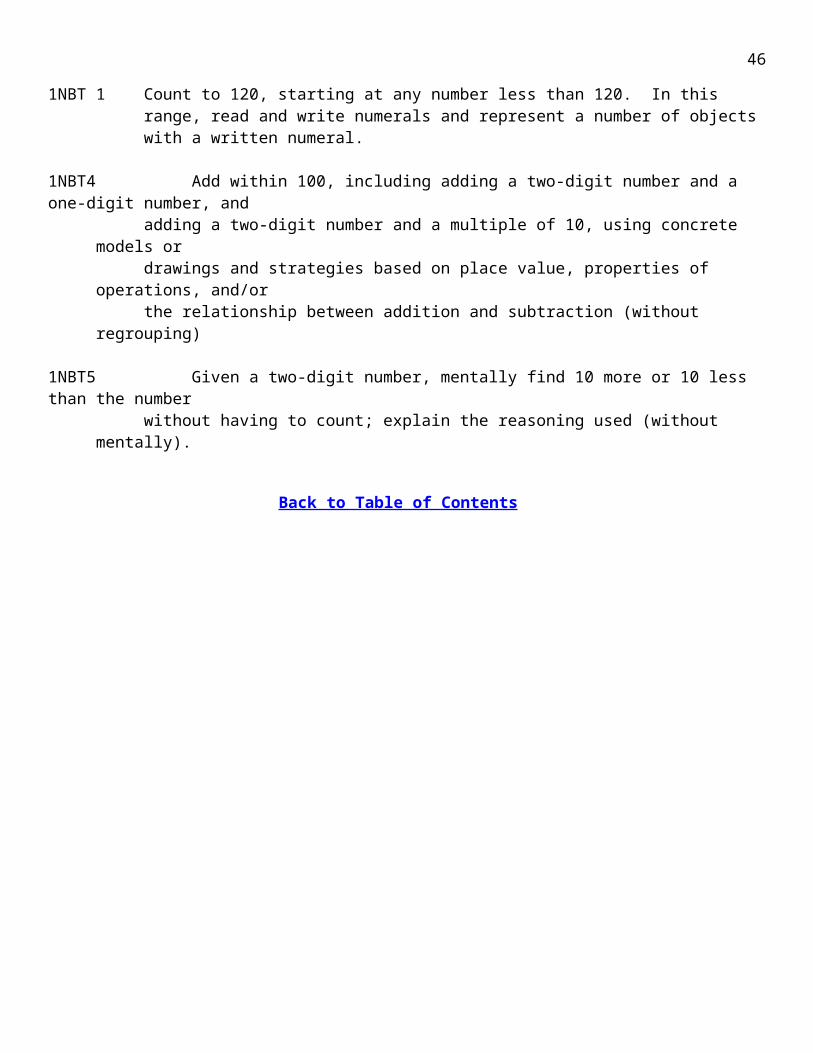
Domain: Ratios and Proportional Reasoning 7RP (Quarter 2)Cluster: Analyze proportional relationships and use them to solve real-world and mathematical problemsStandard: 7.RP.3 Use proportional relationships to solve multi-step ratio and percent problems. Examples: simple interest, tax, markups and mark downs, gratuities and commissions, fees, percent increase and decrease, percent error.
Mastery, Patterns of Reasoning: Example:
Conceptual: Know the process for using multiple steps in solving
problems involving percent. Understand the role of proportional reasoning for
solving percent problems.
What is the process for solving this problem: What is the sale price of a balloon originally priced at $0.10 marked down 10%?
How would you set up the problem above in a proportion and why do you select the numbers to go in each position of the proportion?
Procedural: Solve multi-step problems involving percent using
proportional reasoning. Find the percent of a number and extend the concept
to solving real life percent applications. Calculate percent, percent increase, decrease, and
error.
A salesman sold a coffee table for $66 and earned a 10% commission. How much was earned?
What is a 15% tip on a meal that costs $20?
Which coupon should be used to save the most money when purchasing a lamp originally marked at $75.48 Coupon 1 = save $60 on any item and coupon 2 = take 75% off any item?
Representational: Use manipulatives to model multi-step problems
involving percent and proportional reasoning.
Use manipulatives to show a 50% increase of the number 8. Then explain how the procedure could be used to find a 50% markup of any given price.
Critical Background Knowledge: Bridge to previous instruction:
Conceptual: Understand the meaning of percent
6.RP.3c
Procedural: Find a percent of a quantity as a rate per 100 Work fluently among fractions, decimals and percent Solve problems involving finding the whole given a
part and the percent
6.RP.35.NF.1, 5.NF.4, 6.NS16.RP.3
Representational: Use manipulatives to represent percent Use manipulatives to show calculations with percents
6.RP.36.RP.3
Common misconceptions:o Disassociation of percent to the whole. For example, some think that taking a 30% discount
of an original price and then another 20% discount is the same as taking a 50% discount of the original price, or an item marked down 7% and then adding a 7% tax would give the original price.
52
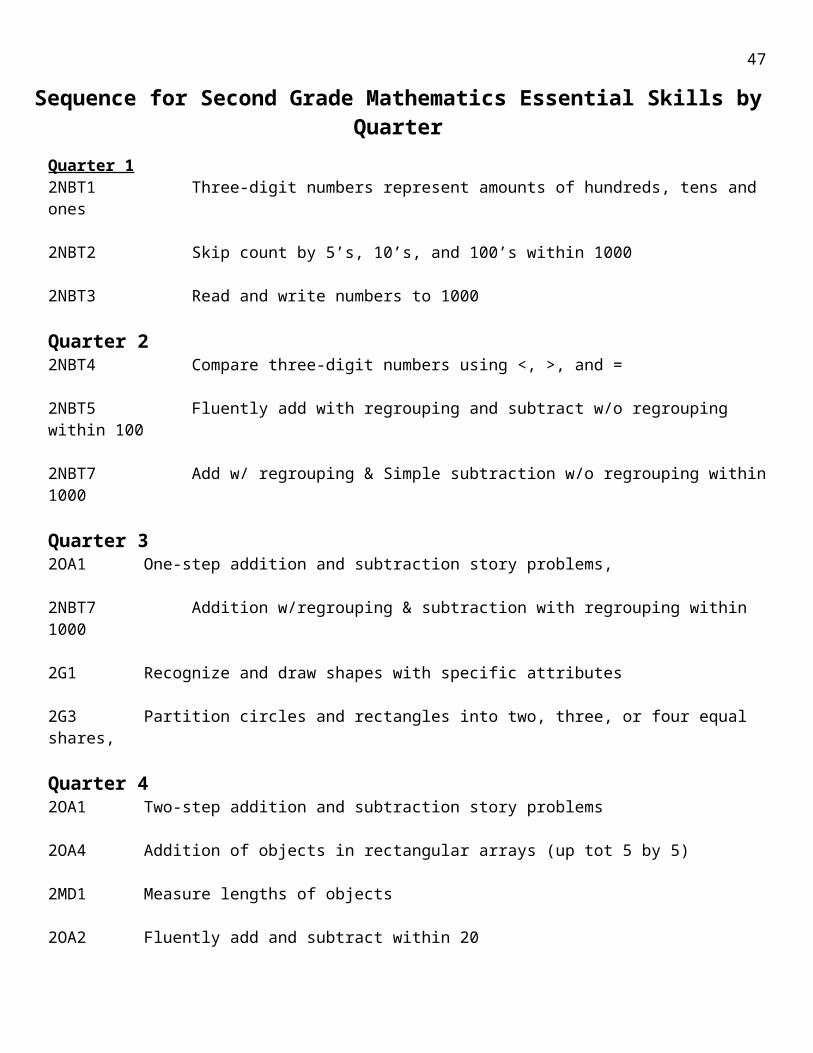
Domain: Expressions and Equations 7EE (Quarter 2)Cluster: Solve real-life and mathematical problems using numerical and algebraic expressions and equations.Standard: 7.EE.4 Use variables to represent quantities in a real-world or mathematical problem, and construct simple equations and inequalities to solve problems by reasoning about quantities.a) Solve word problems leading to equations of the form px + q = r and p(x + q) = r, where p, q, and r are specific rational numbers. Solve equations of these forms fluently. Compare an algebraic solution to an arithmetic solution, identifying the sequence of the operations used in each approach. For example, the perimeter of a rectangle is 54 cm. Its length is 6 cm. What is its width?
Mastery, Patterns of Reasoning: Example:
Conceptual: Understand that variables can be used in the creation of
equations and inequalities that model word problems.
When Zuri picks a number between -10 and 10, triples it, adds 9, divides the result by 3 and then subtracts 3, what number does she get? Why? Evaluate and use algebraic evidence to support your conclusion.
Procedural: Use variables to create equations and inequalities that
model word problems Solve word problems leading to linear equations and
inequalities Connect arithmetic solutions processes that do not use
variables to algebraic solution processes that use equations
Use symbols of inequality to express phrases such as “at most”, “at least as much as”, or “ no more than”
John and his friend have $20 total to go to the movies. Tickets cost $6.50 each. How much will they have for candy? Connect the arithmetic and algebraic methods.
When 6 is added to four times a number the result is 50. Find the number.
On an algebra test the highest grade was 42 points higher than the lowest grade. The sum of the two grades was 138. Find the lowest grade.
John can spend no more than $32. He has already spent $18. Write an inequality to show this problem.
Representational: Use manipulatives to connect arithmetic solution
processes that do not use variables to algebraic solution processes that use equations
Represent phrases such as “at most”, “at least as much as”, or “ no more than” with symbols of inequality
A car repair bid says the cost of repairs will be at most $165. The mechanic has already replaced a part for $85. Use manipulatives to show this problem and its solution.
Critical Background Knowledge: Bridge to previous instruction:
Conceptual: Know that solutions of inequalities consist of
sets of points or values
6.EE.8
Procedural: Solve one-step equations and inequalities 6.EE.7
Representational: Represent solutions of inequalities such as x <
c or x > c on a number line 6.EE.8
Common misconceptions:o Students sometimes over generalize the rules for changing the direction of inequality signs
(when adding or subtracting a negative number)o Students sometimes forget that solutions to inequalities are a set of points or values
53

Domain: Statistics and Probability 7SP (Quarter 3)Cluster: Investigate chance processes and develop, use and evaluate probability models
Standard: 7.SP.5 Understand that the probability of a chance event is a number between 0 and 1 that expresses the likelihood of the event occurring. Larger numbers indicate greater likelihood. A probability near 0 indicates an unlikely event, a probability around ½ indicates an event that is neither unlikely nor likely, and a probability near 1 indicates a likely event.
Mastery, Patterns of Reasoning: Example:
Conceptual: Understand that a probability of 0 is impossible Understand that probabilities near 0 are unlikely to
occur Understand that probabilities of .5 are equally likely
and unlikely Understand that probabilities near 1 are more likely to
occur Understand that a probability of 1 is certain.
The weatherman said that there is a 90% chance of snow today. Describe the likelihood of it snowing today
Using a six-sided number cube, have students create events that are impossible, unlikely, as likely as unlikely, likely, and certain
Procedural: Represent the probability of an event as a
fraction or decimal from 0 to 1 or percent from 0% to 100%.
When flipping a coin, what is the probability that the result is heads? Give your answer as both a decimal value and as a fraction.
A bowl contains 9 beads. 3 of the beads are purple and the other 6 are a different color. What is the probability of randomly selecting a purple bead? Give your answer as both a decimal and as a fraction.
Representational: Represent probability with area
Draw an area model representing a 30% probability. Make sure you label the model.
Critical Background Knowledge: Bridge to previous instruction:
Conceptual: Understand that 1 or 100/100 = 100%
4.NF.6, 6.SP.4
Procedural: Recognize when a number is close to 0, close
to ½, or close to 1. 4.NF.6, 5.NBT.4
Representational:
Common misconceptions:o Students sometimes believe that variability can be judged solely upon the range of the data.o Students sometimes believe that larger samples will have more variabilityo Students sometimes believe that sampling distributions for small and large sample sizes have
the same variability
54
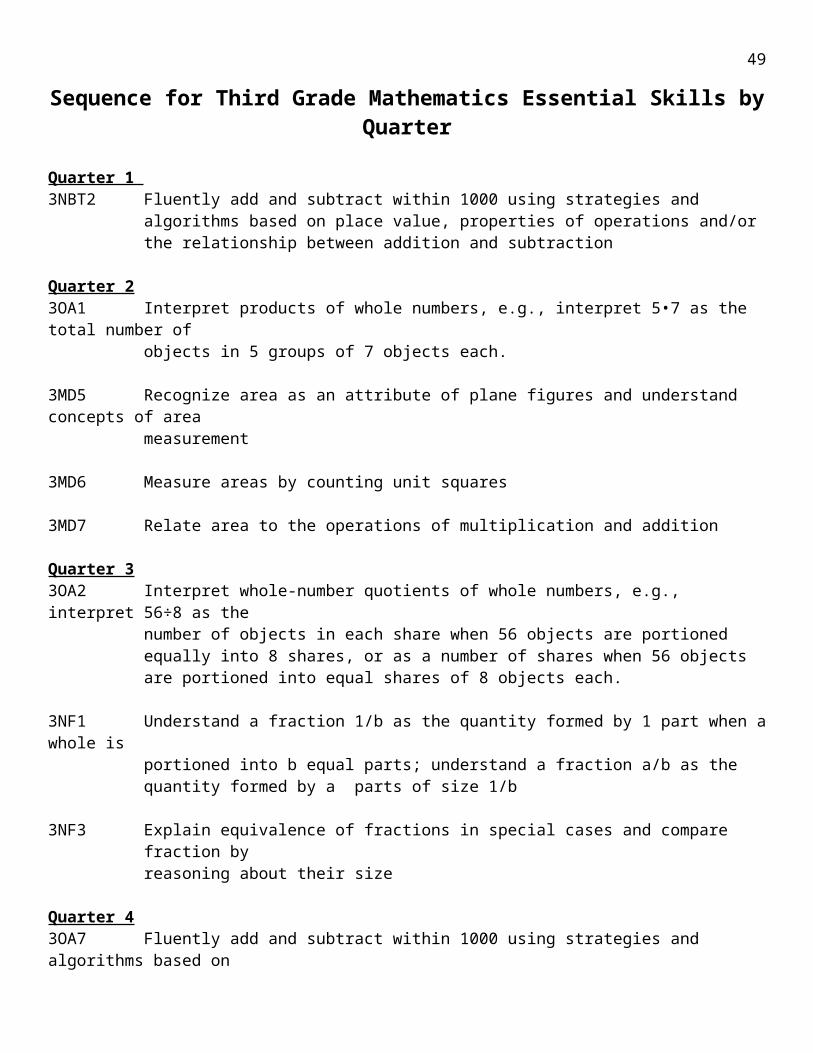
Domain: Statistics and Probability NOT ESSENTIAL 2014-15 7SP Cluster: Investigate chance processes and develop, use and evaluate probability models
Standard: 7.SP.7 Develop a probability model and use it to find probabilities of events. Compare probabilities from a model to observed frequencies; if the agreement is not good, explain possible sources of the discrepancy.a) Develop a uniform probability model by assigning equal probability to all outcomes, and use the model to determine probabilities of events. For example, if a student is selected at random from a class, find the probability that Jane will be selected and the probability that a girl will be selected.b) Develop a probability model (which may not be uniform) by observing frequencies in data generated from a chance process. For example, find the approximate probability that a spinning penny will land heads up or that a tossed paper cup will land open-end down. Do the outcomes for the spinning penny appear to be equally likely based on the observed frequencies?
Mastery, Patterns of Reasoning: Example:
Conceptual: Understand why an observed frequency and theoretical
probabilities may not agree Understand definitions of theoretical and experimental
probability
You throw a dart at a circular dartboard with circumference 18 units. Inside the dart board is a circular target with a diameter of 8 units. Assume you’re good enough to hit the dartboard everytime, and you’ll hit every point on the dartboard with equal probability. What is the probability that you will hit the target?
Procedural: Use theoretical probabilities to create a probability
model (e.g. table showing the potential outcomes of an experiment or random process with their corresponding probabilities) in which all outcomes are equally likely (uniform)
Use observed frequencies to create a probability model for the data generated from a chance process
Use probability models to find probabilities of events Compare theoretical and experimental probability.
A six-sided die is tossed. What is the probability the result is a 3?
What is the probability of rolling a sum of 1 with two six-sided dice?
What is the probability of rolling a sum of 7 with two six-sided dice?
A container has 3 red marbles, 5 blue marbles and 10 green marbles. If a marble is randomly selected, what is the probability that it is not blue?
Representational: Represent the data of observed frequencies graphically
or in tables
Toss a six-sided die 20 times and record the outcomes of each toss on a tally chart.
Critical Background Knowledge: Bridge to previous instruction:
Conceptual: Understand that 1 or 100/100 = 100%
4.NF.6, 6.SP.4
Procedural: Recognize when a number is close to 0, close
to ½, or close to 1. 4.NF.6, 5.NBT.4
Representational:
Common misconceptions:o Students sometimes believe that variability can be judged solely upon the range of the data.o Students sometimes believe that larger samples will have more variabilityo Students sometimes believe that sampling distributions for small and large sample sizes have
the same variability
55
Domain: Geometry 7G (Quarter 3)Cluster: Draw, construct, and describe geometrical figures and describe the relationships between themStandard: 7.G.1 Solve problems involving scale drawings of geometric figures, including computing actual lengths and areas from a scale drawing and reproducing a scale drawing at a different scale
Mastery, Patterns of Reasoning: Example:
Conceptual: Understand concept of scale factor
Cut an 8 ½ X 11” sheet of paper so that it represents a scale model of your desk. Place three items on the desk and using the appropriate scale factor create a scale drawing of the desk and the items on the desk. Justify your results.
Procedural: Use a scale or scale factor to find a measurement Find actual lengths and areas from a scale drawing,
using a scale factor
Given a map with the scale 1 inch = 9 miles, two cities are 3.75 inches apart, how many miles are they from one another?
Joseph made a scale drawing of the high school. The scale of the drawing was 1 millimeter = 8 meters. The actual length of the parking lot is 120 meters. How long is the parking lot in the drawing?
Representational: Create multiple scale drawings from the original model
or drawing, using different scales
Make a scale drawing of the classroom
Critical Background Knowledge: Bridge to previous instruction:
Conceptual: Understand linear and area measurements
Procedural: Find areas of geometric figures
6.G.1
Representational: Draw representations of area
Common misconceptions:o Students sometimes forget the relationship between perimeter and area and how they are
affected by scaleo Students sometimes think that different geometric shapes (e.g., circles, squares, triangles)
with the same area should have a same single directional length (same height, or width)
56
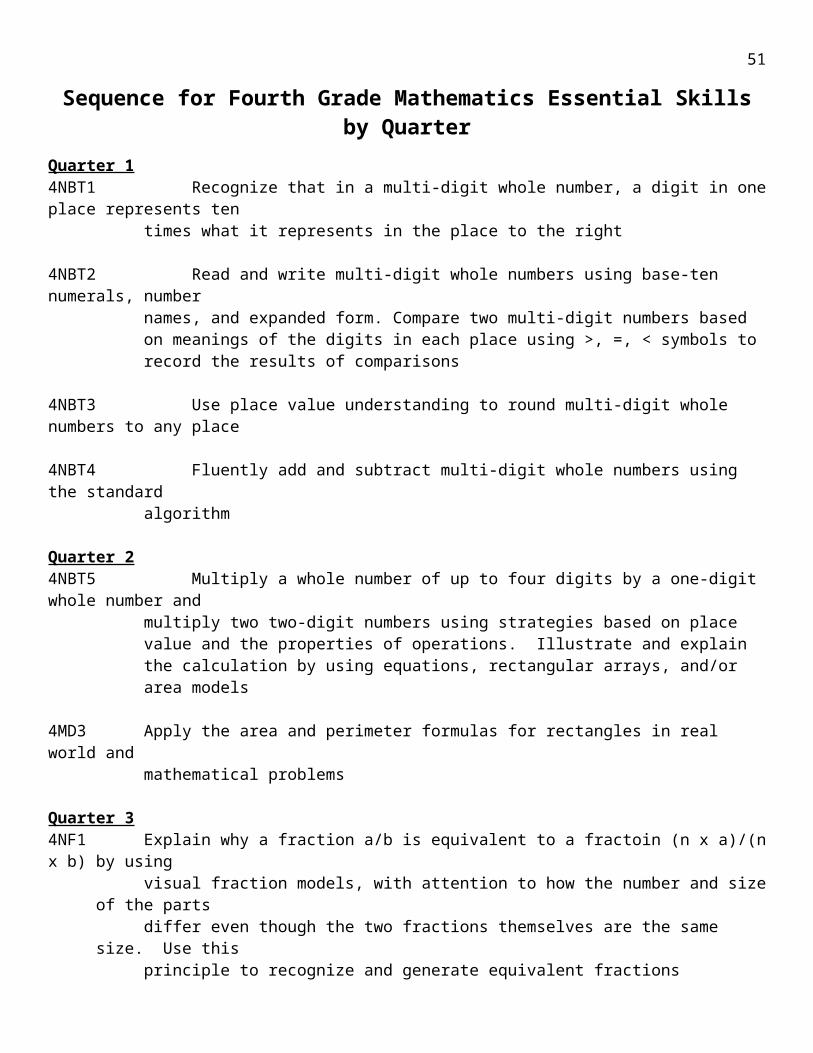
Domain: Geometry 7G (Quarter 3)Cluster: Solve real-life and mathematical problems involving angle measure, area, surface area, and volumeStandard: 7.G.4 Know the formulas for the area and circumference of a circle and use them to solve problems; give an informal derivation of the relationship between the circumference and area of a circle
Mastery, Patterns of Reasoning: Example:
Conceptual: Know the formulas for the area and circumference of a
circle Know the relationship between diameter,
circumference, and pi
Have students measure the circumference and diameter of several circular objects of different sizes and take the ratio of the circumference to the diameter to discover pi.
Procedural: Use the formulas for area and circumference of a circle
to solve problems Use the relationship between diameter, circumference,
and pi Show and explain how the circumference and area of a
circle are related
Find the area and circumference of a circle with a radius of 4cm. Round to the nearest tenth
Tennis balls are packaged in a cylindrical container containing three balls. Without measuring, determine which is longer, the height of a tennis ball container or the distance around it?
Representational: Draw and label the circumference and diameter of a
circle
Divide a circle into equal parts; rearrange pieces into a parallelogram to model thederivation of the area of a circle.
Critical Background Knowledge: Bridge to previous instruction:
Conceptual: Know the parts of a circle (radius, diameter, center). Understand that area is measured in square units no
matter the shape being measuredProcedural:
Calculate area in square unitsRepresentational:
Model area in square units Common misconceptions:
o Students sometimes forget the importance of squared units and cubed units. They want credit for the correct number even though the units is incorrect.
o Students sometimes think that pi = 3.14.
57
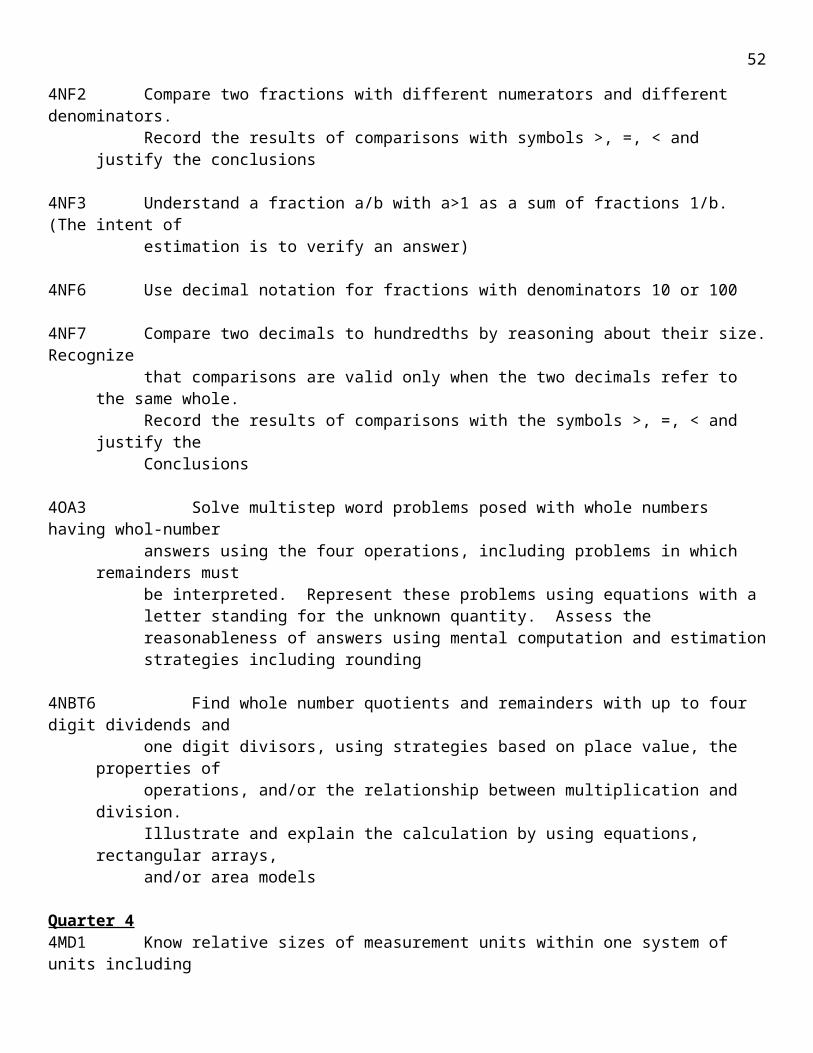
Domain: Geometry 7G (Quarter 3)Cluster: Solve real-life and mathematical problems involving angle measure, area, surface area, and volumeStandard: 7.G.5 Use facts about supplementary, complementary, vertical, and adjacent angles in a multi-step problem to write and solve simple equations for an unknown angle in a figure
Mastery, Patterns of Reasoning: Example:
Conceptual: Understand properties of supplementary,
complementary, vertical and adjacent angles
𝑚∠𝐵=102° and 𝑚∠𝐿=120°, find every other angle measure, explaining how you found each
Procedural: Define properties of supplementary, complementary,
vertical and adjacent angles Use properties of supplementary, complementary,
vertical and adjacent angles to solve for unknown angles in a figure
Write and solve equations based on a diagram of intersecting lines with some known angle measures
Solve for a and y
Representational:
Represent supplementary, complementary, vertical and adjacent angles graphically
Draw a diagram that shows angle 1is supplement of angle 2 and angle 3 is vertical to angle 1 and angle 4 is vertical to angle 2 and is also supplement of angle 1
Critical Background Knowledge: Bridge to previous instruction:
Conceptual: Understand the definition of an angle
Procedural: Solve multi-step equations
Representational: Represent angles graphically
Common misconceptions:o Students sometimes believe that a larger space means a larger angle, e.g., they think angle ABC
is larger than angle DEF when they are the same size angle
o
58
Domain: Geometry 7G (Quarter 3)Cluster: Solve real-life and mathematical problems involving angle measure, area, surface area, and volumeStandard: 7.G.6 Solve real-world and mathematical problems involving area, volume and surface area of two- and three-dimensional objects composed of triangles, quadrilaterals, polygons, cubes, and right prisms
Mastery, Patterns of Reasoning: Example:
Conceptual: Understand that two- and three-dimensional objects
have measurable attributes that can be used to calculate volume
Understand that volume is measured in cubic units Understand the relationship between area and volume
Design a container that will hold at least 300 ft3 of water, but that has a lateral surface area of less than 310 ft2
Procedural: Find the areas of triangles, quadrilaterals, polygons,
and composite figures, including those founds in real-world contexts
Find surface areas of cubes, right prisms, and right pyramids whose faces are triangles, quadrilaterals, and polygons, including those found in real-world contexts
Find volumes of cubes, right prisms, and composite polyhedra including those found in real-world contexts
Find the total volume for the house if the base of the house is 20 ft. X 50 ft. with side walls that are 10 ft. high and the peak of the house is 15 ft. from the ground.
What is the volume of a cube that has a height of 4 inches?
What is the volume of a right rectangular prism that has a base area of 12 square inches and a height of 4 inches?
Representational: Draw diagrams that represent three-dimensional
objects and show measures needed for calculating volume.
Critical Background Knowledge: Bridge to previous instruction:
Conceptual: Know volume, surface area and nets
Procedural: Find area of rectangles, special quadrilaterals,and
triangles Find the volume of rectangular prisms Find surface area using nets
(4.MD.3), (6.G.1), (6.G.1)(5.MD.5)(6.G.4)
Representational: Model area with manipulatives
Common misconceptions:o Students sometimes forget that any face of a rectangular prism can be considered a baseo Students sometimes consider surface area the same as total surface area
59
Domain: Statistics and Probability 7SP (Quarter 4)Cluster: Use random sampling to draw inferences about a population
Standard: 7.SP.1 Understand that statistics can be used to gain information about a population by examining a sample of the population; generalizations about a population from a sample are valid only if the sample is representative of that population. Understand that random sampling tends to produce representative samples and support valid inferences.
Mastery, Patterns of Reasoning: Example:
Conceptual: Understand that representative samples can be used to
make valid inferences about a population. Understand that a random sample increases the
likelihood of obtaining a representative sample of a population
Design a method of gathering a random sample from the student body to determine the school’s favorite NFL team
Explain the value and importance of taking a random sample v a non-random sample. Give examples of how data could be skewed if it is obtained with prejudice.
Procedural: Gain information about a population by examining a
sample of the population Determine if a sample as representative of that
population Take random samples of a population Define a population
Find three examples in the media that demonstrate the use of samples to make a statement about the population
Representational:
Critical Background Knowledge: Bridge to previous instruction:
Conceptual: This is completely new, no background concepts
none
Procedural:
Representational:
Common misconceptions:o Students sometimes believe they need a large sample size to use statisticso Students sometimes select an inappropriate population from which to obtain data
60
Domain: Statistics and Probability 7SP (Quarter 4)Cluster: Draw informal comparative inferences about two populations
Standard: 7.SP.3 Informally assess the degree of visual overlap of two numerical data distributions with similar variabilities, measuring the difference between the centers by expressing it as a multiple of a measure of variability. For example, the mean height of players on the basketball team is 10 cm greater than the mean height of players on the soccer team, about twice the variability (mean absolute deviation) on either team; on a dot plot, the separation between the two distributions of heights is noticeable
Mastery, Patterns of Reasoning: Example:
Conceptual: Understand that the measure of mean is independent of
the measure of variability
Define mean and variability. What are their roles in probability and statistics?
Procedural: Use visual representations to compare and contrast
numerical data from two populations using measures of variability and center.
Use measures of center and spread to compare temperatures in Honolulu, Los Angeles, and Salt Lake City over a 6 month period.
Representational: Create visual representations to compare and contrast
numerical data from two populations using measures of variability and center.
Create a graphic to compare the mean temperatures for a week in both Los Angeles and Salt Lake City.
Create a graphic to compare the variability of temperatures for a week in both Los Angeles and Salt Lake City.
Critical Background Knowledge: Bridge to previous instruction:
Conceptual: Know how to read number Line Graphs including dot
plots, histograms, and box plots.
6.SP.4
Procedural: Calculate the measures of center (median and/or mean)
and the measures of variability (interquartile range and/or mean absolute deviation)
6.SP.5
Representational: Create number Line Graphs including dot plots,
histograms, and box plots to represent data 6.SP.4
Common misconceptions:o Students sometimes believe that variability can be judged solely upon the range of the data.o Students sometimes believe that larger samples will have more variabilityo Students sometimes believe that sampling distributions for small and large sample sizes have
the same variability
Back to Table of Contents
61

Math 8 Resource Guide for Provo City School District’s Essentials
62
Summary of Practice Standards Prompts to develop mathematical thinking1. Make sense of problems and persevere in solving them.Interpret and make meaning of the problem to find a starting point.
Analyze what is given in order to explain to themselves the meaning of a problem.
Plan a solution pathway instead of jumping to a solution.
Monitor their progress and change the approach if necessary.
See relationships between various representations.
Relate current situations to concepts or skills previously learned and connect mathematical ideas to one another.
Continually ask themselves, “Does this make sense?”
Can understand various approaches to solutions
How would you describe the problem in your own words?
How would you describe what you are trying to find?
What do you notice about . . .?
Describe the relationship between quantities.
Describe what you have already tried. What might you change?
Talk me through the steps in the steps you’ve used to this point.
What steps in the process are you most confident about?
What are some other strategies you might try?
What are some other problems that are similar to this one?
How might you use one of your previous problems to help you begin?
How else might you organize . . . represent . . . show . . .?
2. Reason abstractly and quantitatively.Make sense of quantities and their relationships.
Decontextualize (represent a situation symbolically and manipulate the symbols) and contextualize (make meaning of the symbols in a problem) quantitative relationships.
Understand the meaning of quantities and are flexible in the use of operations and their properties
Create a logical representation of the problem.
Attend to the meaning of quantities, not just how to compute them.
What do the numbers used in the problem represent?
What is the relationship of the quantities?
How is __________ related to ___________?
What is the relationship between ____________ and ____________?
What does ___________ mean to you? (e.g., symbol, quantity, diagram)
What properties might we use to find a solution?
How did you decide in this task that you needed to use . . .?
Could we have used another operation or property to solve this task? Why or why not?
3. Construct viable arguments and critique the reasoning of others.Analyze problems and use stated mathematical assumptions, definitions, and established results in constructing arguments.
Justify conclusions with mathematical ideas.
Listen to the arguments of others and ask useful questions to determine if an argument makes sense.
Ask clarifying questions or suggest ideas to improve/revise the argument.
Compare two arguments and determine correct or flawed logic.
What mathematical evidence would support your solution?
How can we be sure that . . .? How could you prove that . . .?
Will it still work if . . .?
What were you considering when . . .?
How did you decide to try that strategy?
How did you test whether your approach worked?
How did you decide what the problem was asking you to find? (What was unknown?)
Did you try a method that did not work? Why didn’t it work? Would it ever work? Why or why not?
What is the same and what is different about . . .?
How could you demonstrate a counter-example?
4. Model with mathematics.Understand this is a way to reason quantitatively and abstractly (able to decontextualize and contextualize, see standard 2 above).
Apply the mathematics they know to solve everyday problems.
Are able to simplify a complex problem and identify important quantities to look at relationships.
Represent mathematics to describe a situation either with an equation or a diagram and interpret the results of a mathematical
What number model could you construct to represent the problem?
What are some ways to represent the quantities?
What is an equation or expression that matches the diagram, number line, chart, table ?
Where did you see one of the quantities in the task in your equation or expression?
How would it help to create a diagram, graph, table?
63
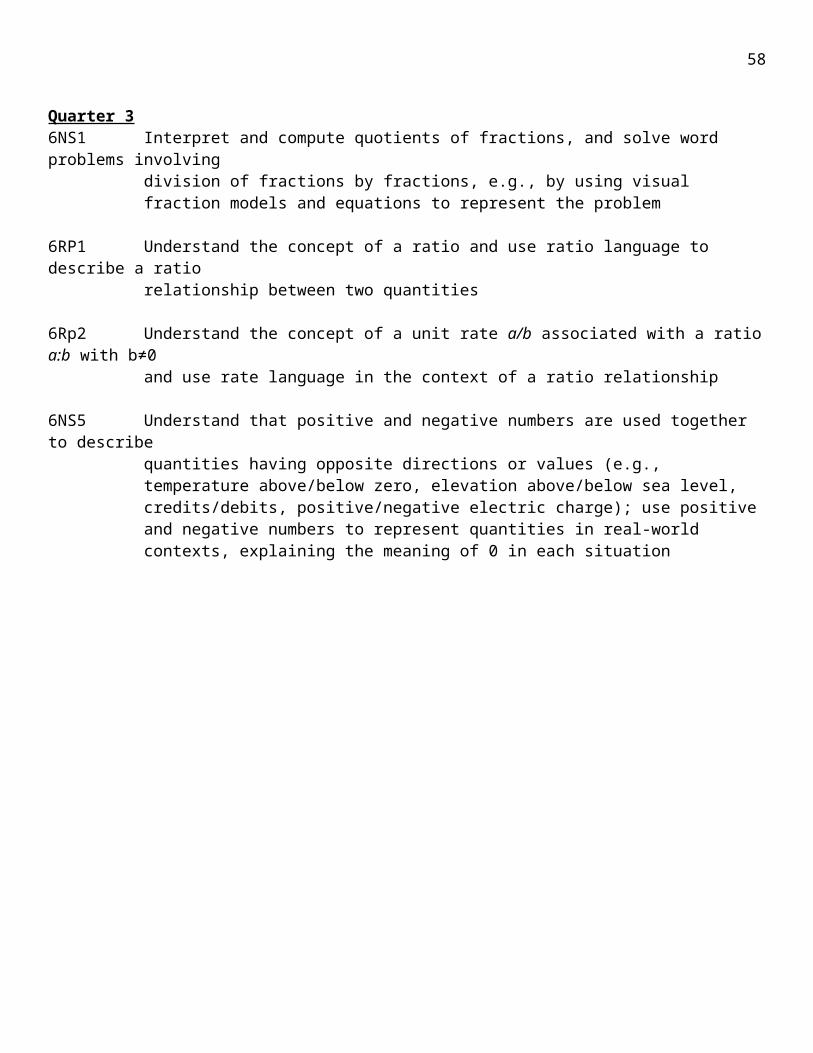
situation.
Reflect on whether the results make sense, possibly improving/ revising the model
What are some ways to visually represent . . .?
What formula might apply in this situation?
How can I represent this mathematically?
Summary of Practice Standards Prompts to develop mathematical thinking5. Use appropriate tools for mathematical practice.Use available tools recognizing the strengths and limitations of each.
Use estimation and other mathematical knowledge to detect possible errors.
Identify relevant external mathematical resources to pose and solve problems.
Use technological tools to deepen their understanding of mathematics
What mathematical tools could we use to visualize and represent the situation?
What information do you have?
What do you know that is not stated in the problem?
What approach are you considering trying first?
What estimate did you make for the solution?
In this situation would it be helpful to use a graph, number line, ruler, diagram, calculator, manipulative?
Why was it helpful to use ______?
What can using a _______ show us that _______ may not?
In what situations might it be more informative or helpful to use ________?
6. Attend to precision.Communicate precisely with others and try to use clear mathematical language when discussing their reasoning.
Understand the meanings of symbols used in mathematics and can label quantities appropriately.
Express numerical answers with a degree of precision appropriate for the problem context.
Calculate efficiently and accurately.
What mathematical terms apply to this situation?
How did you know your solution was reasonable?
Explain how you might show that your solution answers the problem?
What would be a more efficient strategy?
How are you showing the meaning of the quantities?
What symbols or mathematical notations are important in this problem?
What mathematical language, definitions, properties can you use to explain ______?
How can you test your solution to see if it answers the problem?
7. Look for and make use of structure.Apply general mathematical rules to specific situations.
Look for the overall structure and pattern in mathematics.
See complicated things as single objects or as being composed of several objects.
What observations do you make about _____ ?
What do you notice when ______?
What parts of the problem might you eliminate or simplify?
What patterns do you find in _______ ?
How do you know if something is a pattern?
What ideas that we have learned before were useful in solving this problem?
What are some other problems that are similar to this one?
How does this problem connect to other mathematical concepts?
In what ways does this problem connect to other mathematical concepts?
8. Look for and express regularity in repeated reasoning?See repeated calculations and look for generalizations and shortcuts.
See the overall process of the problem and still attend to the details.
Understand the broader application of patterns and see the structure in similar situations.
Continually evaluate the reasonableness of immediate results.
Explain how this strategy will work in other situations.
Is this always true, sometimes true, or never true?
How would you prove that _______?
What do you notice about ________?
What is happening in this situation?
What would happen if ________?
Is there a mathematical rule for _________?
What predictions or generalizations can this pattern support?
What mathematical consistencies do you notice?
64
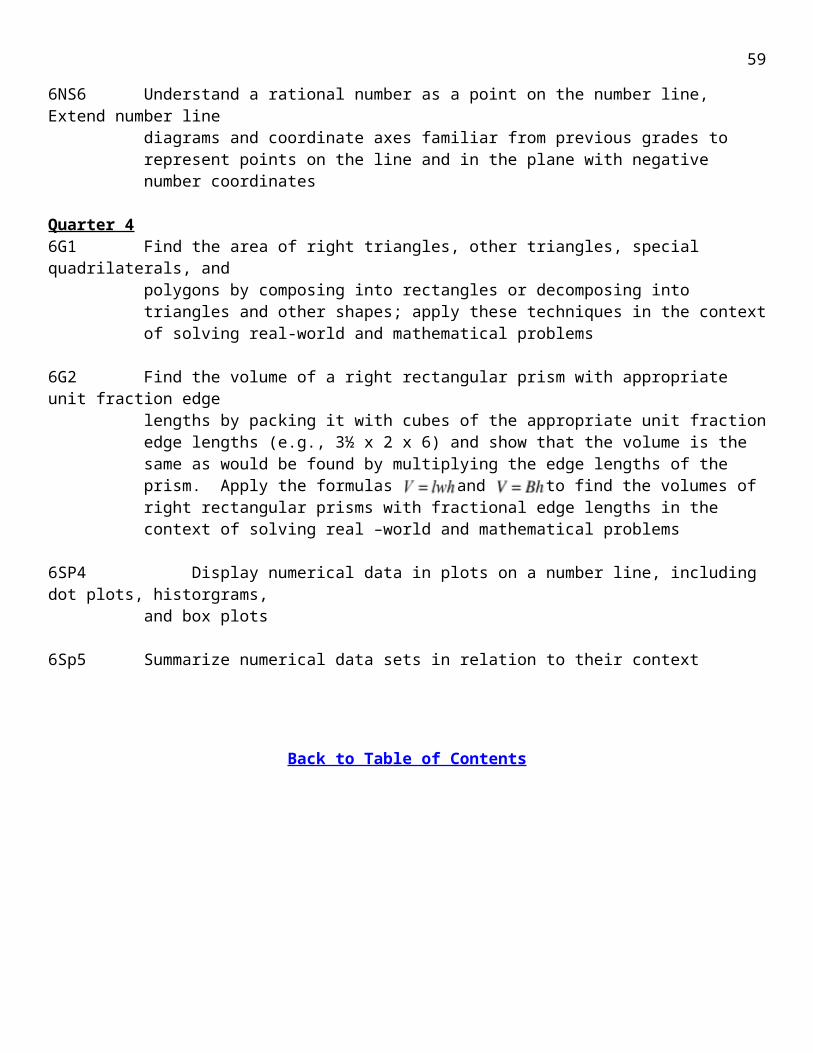
65
In Grade 8, instructional time should focus on three critical areas:
5. Formulating and reasoning about expressions and equations, including modeling an association in bivariate data with a linear equation, and solving linear equations and systems of linear equations
6. Grasping the concept of a function and using functions to describe quantitative relationships
7. Analyzing two- and three-dimensional space and figures using distance, angle, similarity, and congruence, and understanding and applying the Pythagorean Theorem
1. Students use linear equations and systems of linear equations to represent, analyze, and solve a variety of problems. Students recognize equations for proportions (y/x = m or y = mx) as special linear equations (y = mx + b), understanding that the constant of proportionality (m) is the slope, and the graphs are lines through the origin. They understand that the slope (m) of a line is a constant rate of change, so that if the input or x-coordinate changes by an amount A, the output or y-coordinate changes by the amount m·A. Students also use a linear equation to describe the association between two quantities in bivariate data (such as arm span vs. height for students in a classroom). At this grade, fitting the model, and assessing its fit to the data are done informally. Interpreting the model in the context of the data requires students to express a relationship between the two quantities in question and to interpret components of the relationship (such as slope and y-intercept) in terms of the situation.
Students strategically choose and efficiently implement procedures to solve linear equations in one variable, understanding that when they use the properties of equality and the concept of logical equivalence, they maintain the solutions of the original equation. Students solve systems of two linear equations in two variables and relate the systems to pairs of lines in the plane; these intersect, are parallel, or are the same line. Students use linear equations, systems of linear equations, linear functions, and their understanding of slope of a line to analyze situations and solve problems.
2. Students grasp the concept of a function as a rule that assigns to each input exactly one output. They understand that functions describe situations where one quantity determines another. They can translate among representations and partial representations of functions (noting that tabular and graphical representations may be partial representations), and they describe how aspects of the function are reflected in the different representations.
3. Students use ideas about distance and angles, how they behave under translations, rotations, reflections, and dilations, and ideas about congruence and similarity to describe and analyze two-dimensional figures and to solve problems. Students show that the sum of the angles in a triangle is the angle formed by a straight line, and that various configurations of lines give rise to similar triangles because of the angles created when a transversal cuts parallel lines. Students understand the statement of the Pythagorean Theorem and its converse, and can explain why the Pythagorean Theorem holds, for example, by decomposing a square in two different ways. They apply the Pythagorean Theorem to find distances between points on the coordinate plane, to find lengths, and to analyze polygons. Students complete their work on volume by solving problems involving cones, cylinders, and spheres
66
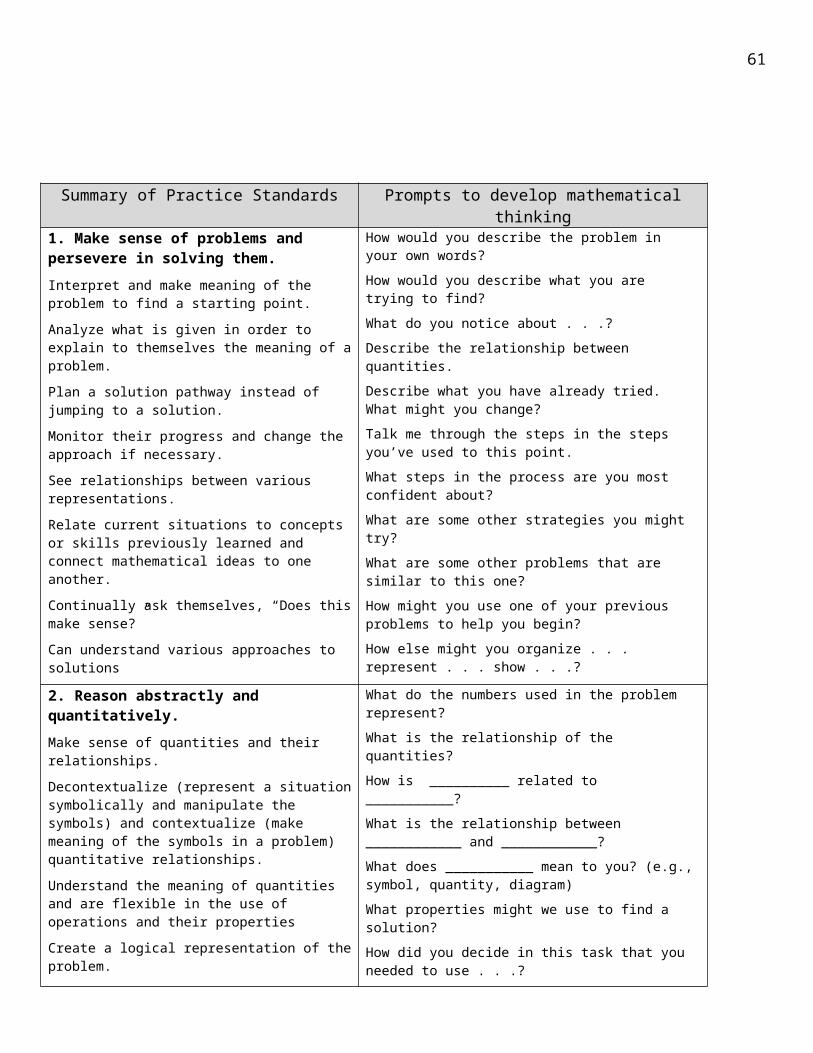
Domain: Expressions and equations 8EE (Quarter 1)Cluster: Analyze and solve linear equations and pairs of simultaneous linear equations
Standard: 8EE7 Solve linear equations in one variablea) Give examples of linear equations in one variable with one solution, infinitely many
solutions, or no solutions. Show which of these possibilities is the case by successively transforming the given equation into simpler forms, until an equivalent equation of the form x = a, a = a, or a = b results (where a and b are different numbers).
b) Solve linear equations with rational number coefficients, including equations whose solutions require expanding expressions using the distributive property and collecting like terms
Mastery, Patterns of Reasoning: Example:Conceptual:
Understand that linear equations in one variable can have a single solution, infinitely many solutions or no solutions
Understand how to expand expressions using the distributive property and collecting like terms
What are the three possibilities that describe solutions to linear equations?
What is another way to write 3(x + 4)? Solve for x: 2(3x + 1)= -5(-1 – 4x)
Procedural: Identify and provide examples of equations that have one
solution, infinitely many solutions, or no solutions Solve multistep linear equations with rational coefficients
and variables on both sides of the equation
Solve 6 = x/4 + 2 Solve -1 = (5 + x)/6 Find two values of x that make the
statement true: x2 < x Which equation has infinitely many
solutions? a) 2x = 16 b) 2x + 16 = 2(x + 8) c) 2x + 16 = x + 8
Representational: Model examples of equations that have a single
solution, infinitely many solutions, or no solutions
Find and model the function that adds one and then multiplies the result by 2
Critical Background Knowledge: Bridge to previous instruction:
Conceptual: Understand properties of algebra necessary for
simplifying algebraic expressions
6EE1, 6EE2, 7EE4a
Procedural: Solve one- and two-step equations Use properties of algebra to simplify algebraic
expressions
7EE4a6EE1
Representational: Use manipulatives to model the solving of one-step and
two-step equations6EE2
Common misconceptions:o Students confuse the operations for the properties of integer exponents, most often due to
memorization of rules rather than internalizing the concepts behind the laws of exponentso Students sometimes incorrectly assume a value is negative when its exponent is negativeo When simplifying with the quotient of powers rule, students often make subtraction mistakeso Students sometimes forget there is a negative square root as well as the principal positive rooto Students sometimes mistakenly believe that zero slope is the same as “no slope” and then confuse zero
slope with undefined slope.
67
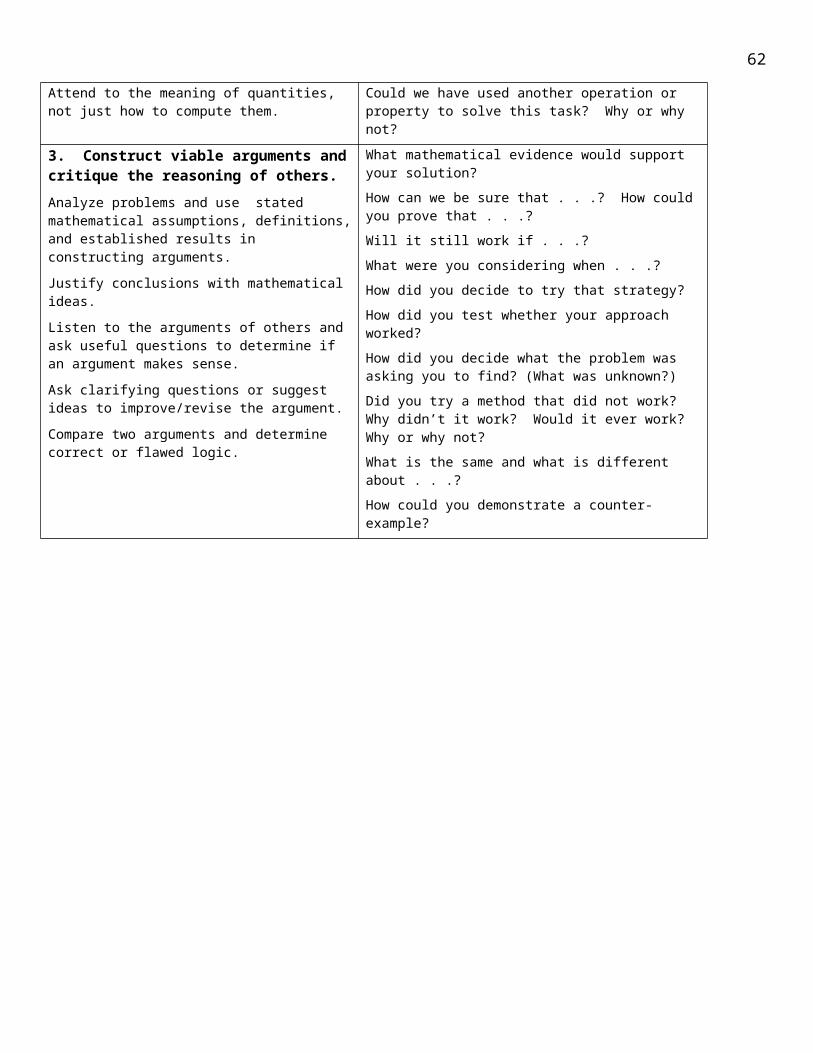
Domain: Functions 8F (Quarter 1)
Cluster: Define, evaluate, and compare functions
Standard: 8F1 Understand that a function is a rule that assigns to each input exactly one output. The graph of a function is the set of ordered pairs consisting of an input and the corresponding output
Mastery, Patterns of Reasoning: Example:
Conceptual: Understand that a function is a rule that assigns to
each input exactly one output
Does the set of students in the classroom and their birthdays represent a function?
Procedural: Recognize a graph of a function as the set of ordered
pairs consist
Does the set of ordered pairs (2, 5), (3, 5), (4, 6), (2, 8), and (6, 7) represent a function?
Could the set of ordered pairs, (2, 5), (3, 5), (4, 6), (2, 8), and (6, 7) describe the number of seconds since you left home and the number of meters you’ve walked? Is this a function?
Representational: Model solutions of equations that have a single
solution, infinitely many solutions, or no solutions
Which of the following are functions?a) b)
c)
Critical Background Knowledge: Bridge to previous instruction:
Conceptual: Understand what a solution to a linear equation is 8EE7
Procedural: Evaluate expressions for a given value 5OA1, 6EE2
Representational: Graph ordered pairs on the coordinate plane 6NS6
Common misconceptions:o Students believe a function is a grapho Students believe that all functions include the notation f(x)o Students sometimes interchange inputs and outputs causing problems with domain and
range as well as independent v dependent variables
68
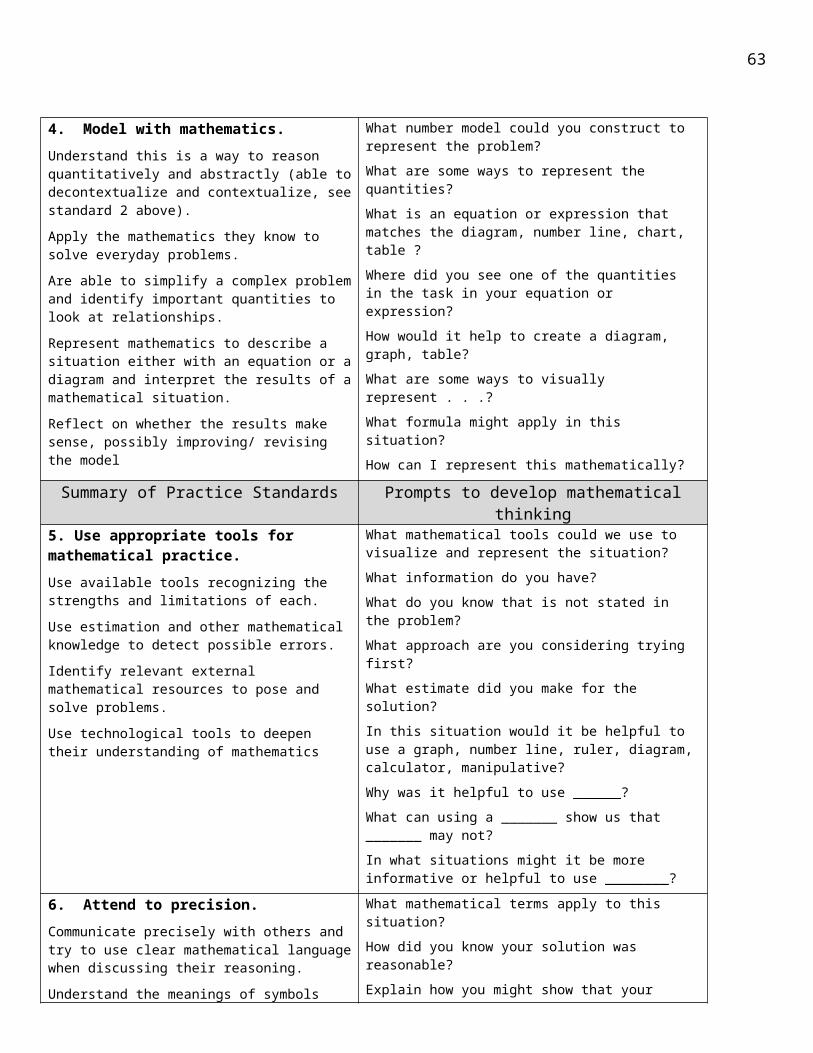
Domain: Expressions and equations 8EE (Quarter 1)Cluster: Understand the connections between proportional relationships, lines and linear equations
Standard: 8EE5 Graph proportional relationships, interpreting the unit rate as the slope of the graph. Compare two different proportional relationships represented in different ways. For example, compare a distance-time graph to a distance-time equation to determine which of two moving objects has greater speed.
Mastery, Patterns of Reasoning: Example:
Conceptual: Understand the connections between proportional
relationships, lines and linear equations Understand that the unit rate is the slope of a linear
graph
Assuming the relationship between minutes and phone calls is directly proportional, if Sam spends 6 minutes on the phone for 3 phone calls. How many phone calls does Sam need to make to be on the phone 10 minutes?
If Gordin has 16 cards in 4 packages and 6 packages has 24 cards, which description of the graph would show this?a) a straight line that drops as it moves to the rightb) a straight line that rises as it moves to the rightc) a curve that grows steeper as it moves to the
rightProcedural:
Recognize unit rate as slope and interpret the meaning of the slope in context
Recognize that proportional relationships include the point (0,0)
Compare different representations of two proportional relationships represented as contextual situations, graphs, or equations
50 plates in 5 stacks = _____ plates per stack Solve for x: 15:6 = x:4 Do these ratios form a proportion? 8 tents: 32
campers and 5 tents: 20 campers. (Yes or No)
Representational: Represent proportional relationships graphically when
given a table, equation or contextual situation Model proportional relationships with manipulatives
Use h to represent heartbeats and t to represent time. Tiffany counted her heartbeats every 10 seconds for one minute and got the following values (15, 30, 45, 60, 75, 90). Graph these values and find an equation to represent the relationship.
Critical Background Knowledge: Bridge to previous instruction:
Conceptual: Understand unit rates 6RP2, 6RP3
Procedural: Use an equation to create a table Calculate unit rates
6EE9, 7RP26RP3
Representational: Represent values by plotting them on the
coordinate axes5G1, 6G3, 6NS8, 6NS6
Common misconceptions:o Students do not understand the relationship of the wording so proportions are incorrectly
writteno Students struggle with ratios that do not have the same unitso Students will occasionally reduce the significance of ratio to simply being a fraction and a
proportion is the equality of two ratios. This eliminates the importance of the constant
69

relation between quantities
70
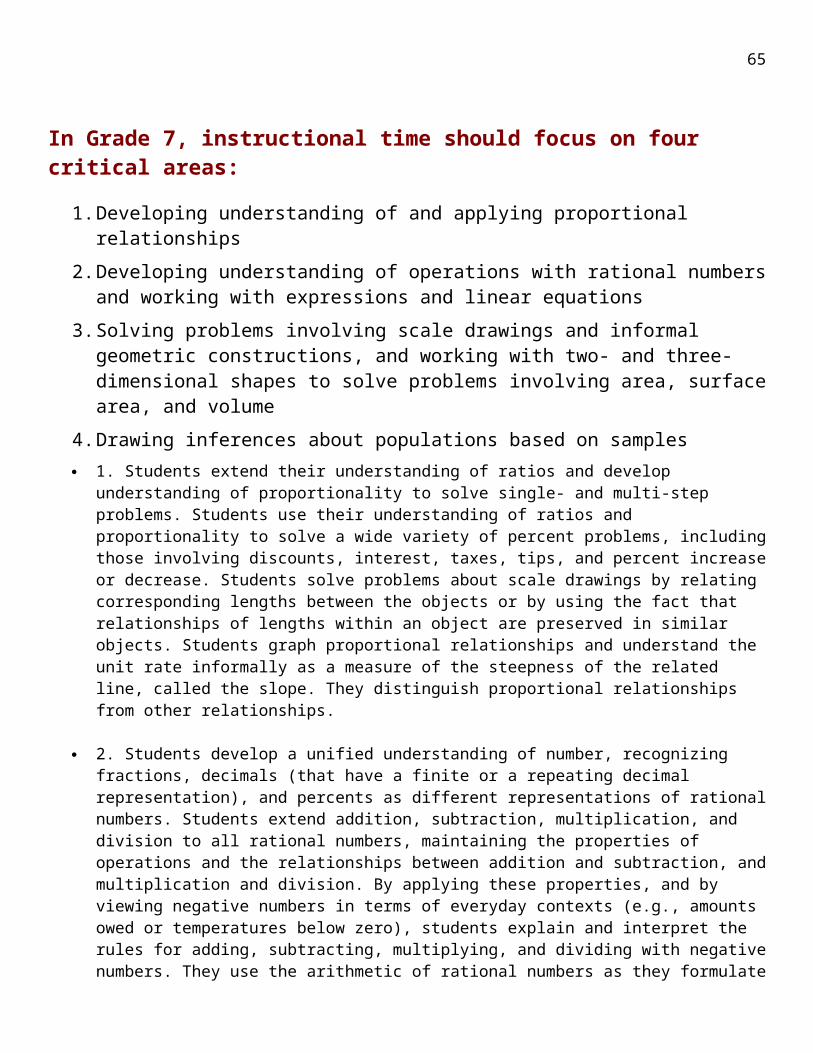
Domain: Statistics and Probability 8SP (Quarter 1)
Cluster: Investigate patterns of association in bivariate data
Standard: 8SP1 Construct and interpret scatter plots for bivariate measurement data to investigate patterns of association between two quantities. Describe patterns such as clustering, outliers, positive or negative association, linear association, and nonlinear association
Mastery, Patterns of Reasoning: Example:
Conceptual: Understand clustering patterns of positive or negative
association, linear association, and nonlinear association
Know what outliers are
Create and describe examples of scatter plots that are positive-, negative- and non-correlation
Procedural: Collect, record, and construct a set of bivariate data
using a scatter plot Interpret patterns on a scatter plot such as clustering,
outliers, and positive, negative or not association
Measure and record the height and arm span of all class members. Then create a scatter plot of the data. Is there a relationship between a student’s height and their arm span?
Representational: Graphically represent the values of a bivariate data
set with a scatter plot
Construct a scatter plot and describe any association you observe for the data:Height hand span70 in 10 in72 in 9.5 in 61 in 8 in 62 in 9.5 in68 in 9 in
Critical Background Knowledge: Bridge to previous instruction:
Conceptual: Understand graphing of linear values and points Understand the meaning of linear and nonlinear
5G1
Procedural: Graph points on a coordinate system 7EE1
Representational: Represent linear relationships graphically 8EE7
Common misconceptions:o Students sometimes attempt to connect all points on a scatter ploto Students often believe that correlation between two variables automatically implies causation o Students sometimes believe that bivariate data is only displayed in scatter plots
71
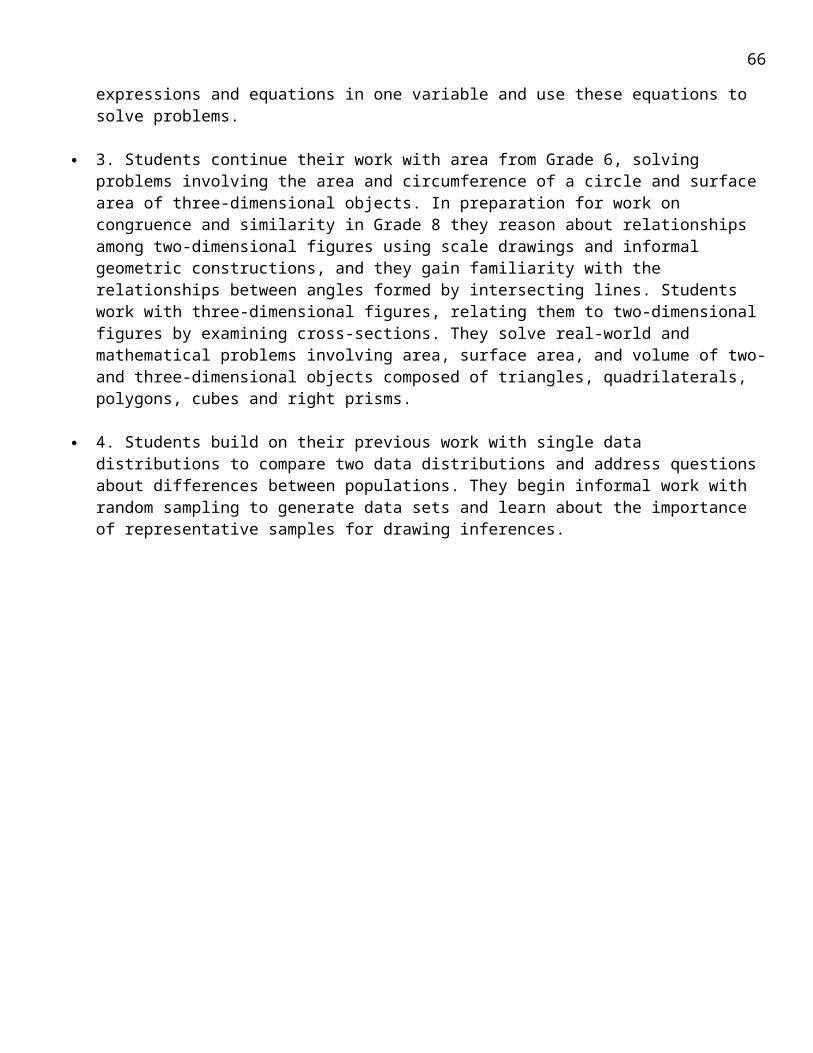
Domain: Expressions and equations 8EE (Quarter 2)Cluster: Understand the connections between proportional relationships, lines and linear equations
Standard: 8EE6 Use similar triangles to explain why the slope m is the same between any two distinct points on a non-vertical line in the coordinate plane; derive the equation y = mx for a line through the origin and the equation y = mx + b for a line intercepting the vertical axis at b.
Mastery, Patterns of Reasoning: Example:
Conceptual: Understand why the slope is the same between any
two distinct points on a non-vertical line
What does a 7% slope mean? How can it be represented with different measures?
Procedural: Explain why the slope is the same between any two
distinct points on a non-vertical line using similar right triangles
Write an equation in the form y = mx + b from a graph of a line on the coordinate plane
Determine the slope of a line as the ratio of the leg lengths of similar right triangles
Write the equation of the line containing points A and D
Graph y = 2x
Representational: Represent similar right triangles on a coordinate
plane to show equivalent slopes
Points A, D, B and E are collinear. Show that segment AB and segment DE have the same slope
Critical Background Knowledge: Bridge to previous instruction:
Conceptual: Understand triangle similarity requires
proportionality7RP2
Procedural: Recognize similar triangles 4G2, 6G4, 7G2
Representational: Model similar triangles on a coordinate plane 5G2, 6NS6, 6G3
Common misconceptions:o Students sometimes cannot visualize the corresponding parts of similar triangles because of
orientationo Students sometimes forget that congruent triangles are also similar
72
Domain: Functions 8F (Quarter 2)Cluster: Use functions to model relationships between quantities
Standard: 8F4 Construct a function to model a linear relationship between two quantities. Determine the rate of change and initial value of the function from a description of a relationship or from two (x, y) values, including reading these from a table or from a graph. Interpret the rate of change and initial value of a linear function in terms of the situation it models, and in terms of its graph or a table of values
Mastery, Patterns of Reasoning: Example:
Conceptual: Know how to determine the initial value and rate of
change given two points, a graph, a table of values, a geometric representation, or a story problem
How would you find the rate of change on the graph below?
Procedural: Determine the initial value and rate of change given
two points, a graph, a table of values, a geometric representation, or a story problem
Write the equation of a line given two points, a graph a table of values, a geometric representation, or a story problem (verbal description) of a linear relationship
Find the equation of the line that goes through (3, 5) and (-5, 7)
What is the initial value and rate of change if we know that during a run, sally was 2 km from her starting point after 2.7 minutes and then at 11.5 minutes she was at 7.7 km?
Representational: Model relationships between quantities
The student council is planning a ski trip to Sundance. There is a $200 deposit for the lodge and the tickets will cost $70 per student. Construct a function, build a table, and graph the data showing how much it will cost for the students’ trip
Critical Background Knowledge: Bridge to previous instruction:
Conceptual: Understand the meaning of slope and y-intercept 8EE5,
Procedural: Write an equation as y = mx + b given a graph 8EE6
Representational: Graphically represent linear equations 8EE5
Common misconceptions:o Students sometimes confuse the two axes of the grapho Students sometimes do not understand the significance of points in the same location relative to one of
the axeso Students often believe the graph is a picture of situations rather than an abstract representationo Students often believe graphs must go through the origino Students often think graphs must go through both axeso Students often believe all relationships are linear
Domain: Expressions and equations 8EE (Quarter 2)
73
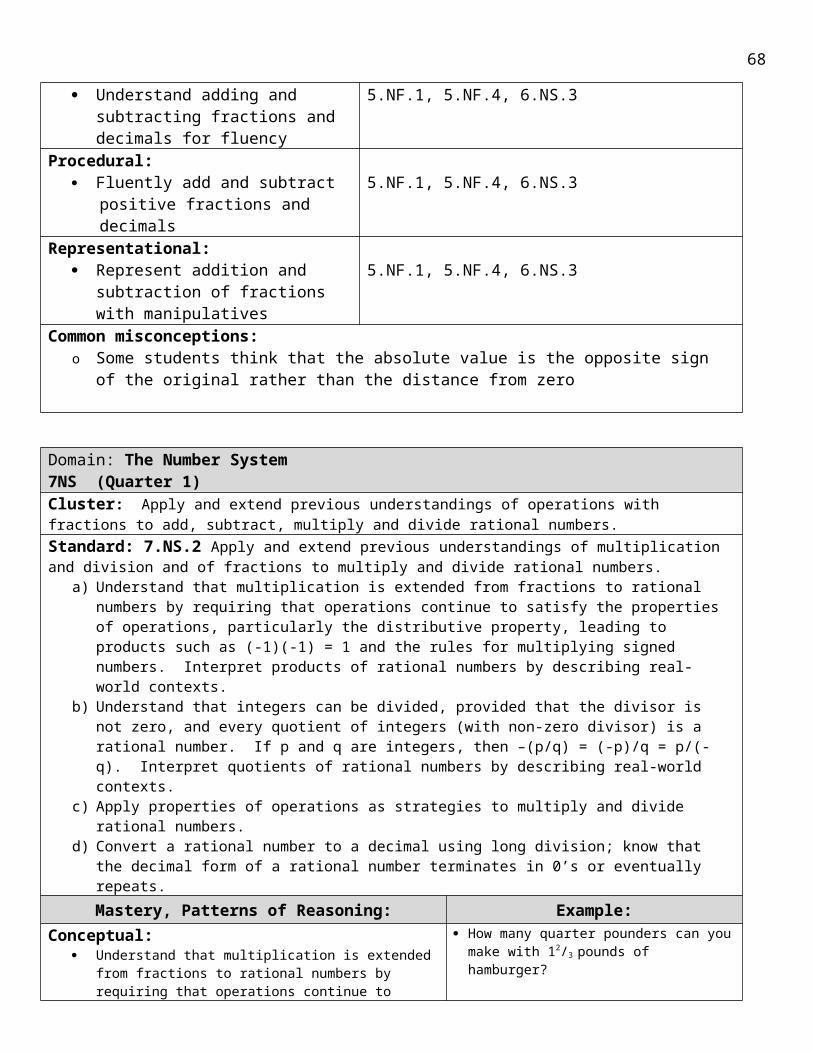
Cluster: Analyze and solve linear equations and pairs of simultaneous linear equations
Standard: 8EE8 Analyze and solve pairs of simultaneous linear equationsa) Understand that solutions to a system of two linear equations in two variables correspond to
points of intersection of their graphs, because points of intersection satisfy both equations simultaneously
b) Solve systems of two linear equations in two variables algebraically, and estimate solutions by graphing the equations. Solve simple cases by inspections. For example, 3x + 2y = 5 and 3x + 2y = 6 have no solution because 3x + 2y cannot simultaneously be 5 and 6.
Mastery, Patterns of Reasoning: Example:
Conceptual: Understand that solutions to a system of two
linear equations in two variables correspond to points of intersection of their graphs, because points of intersection satisfy both equations simultaneously
You are solving a system of two linear equations in two variables. You have found more than one solution that satisfies the system. Which of the following is true?a) there are exactly two solutions to the systemb) there are exactly three solutions to the systemc) there are infinitely many solutions to the systemd) there isn’t enough information to tell
Procedural: Solve systems of two linear equations in two
variables algebraically Estimate solutions by graphing the
equations Solve simple cases by inspections Solve real-world and mathematical
problems leading to two linear equations in two variables
Solve the systems of equations: 2x + 3y = 4 and –x + 4y = -13
When trying to find the solutions to the system 4x – 2y = 4 and 2x – y = 3, you complete several correct steps and get a result 4 = 6. Which statement is true?a) x = 6 and y = 4b) y = 6 and x = 4c) the system has no solutiond) the system has infinitely many solutions
Representational: Model solutions of equations that have a
single solution, infinitely many solutions, or no solutions
You have been hired by a cell phone company to create two rate plans for customers, one that benefits customers with low usage and that benefits customers with high usage. At 500 minutes, both plans should be within $5 of each other. Design a presentation showing two plans that will meet these requirements, including graphs and equations
Critical Background Knowledge: Bridge to previous instruction:
Conceptual: Understand what a solution to a linear
equation is6EE6, 8EE7
Procedural: Solve a one variable equation Solve for a specified variable in an equation
5OA1, 6EE2, 6EE6, 7EE4, 8EE7
Representational: Represent linear equations graphically 6NS6
Common misconceptions:o Students sometimes do not know what “solution” means, they know it as an answer, but not
what it represents.
74
Domain: The Number System 8NS (Quarter 3)Cluster: Know that there are numbers that are not rational, and approximate them by rational numbersStandard: 8NS1Know that numbers that are not rational are called irrational. Understand informally that every number has a decimal expansion; for rational numbers, show that the decimal expansion repeats eventually, and convert a decimal expansion which repeats eventually into a rational number
Mastery, Patterns of Reasoning: Example:
Conceptual: Know that there are numbers that are not rational Know that numbers that are not rational are called
irrational Understand informally that every number has a decimal
expansion, for rational numbers, show that the decimal expansion repeats eventually
Group the following numbers based on your understanding of the number system:5.31.7 where the 7 repeats infinitelysquare root of 102pi4.01001000100001. . .
Procedural: Convert a decimal expansion which repeats into a
rational number
Convert 0.352 (where the 2 repeats infinitely) to a fraction
Representational: Graph the approximate value of an irrational number
on a number line
Graph the values or approximate values of the square roots of 1, 2, 3 and 4 on a single number line
Critical Background Knowledge: Bridge to previous instruction:
Conceptual: Understand the subsets of the real number system
(natural numbers, whole numbers, integers, rational numbers)
6NS6, 7EE3, 7NS2,
Procedural: Convert rational numbers to decimals using long
division (terminating and repeating)7NS2d
Representational: Graph rational numbers on a number line 6NS6
Common misconceptions:o Students sometimes think that non-common numbers that do not terminate but repeat
infinitely are not rational for example, 1.1666666. . . o Students sometimes think that a square root sign automatically identifies an irrational number
(even the square root of 4)o Students often think that all fractions are rational (square root of six over 3)
75
Domain: Expressions and equations 8EE (Quarter 3)Cluster: Work with radicals and integer exponents
Standard: 8EE1 Know and apply the properties of integer exponents to generate equivalent numerical expressions. For example:32 x 3-5 = 3-3 = 1/3
3 = 1/27
Mastery, Patterns of Reasoning: Example:
Conceptual: Know the properties of integer exponents
Write the expression 4•4•4•4 using exponents
Procedural: Apply the properties of integer exponents to simplify
and evaluate numerical expressions
Which equation has more than one solution, but not infinitely many solutions? a) 2x = 16 b) x2 = 16
c) 2x + 16 = x + 8
Representational: Model the properties of integer exponents as multiple
multiplications
Caleb has a job that pays $39,000 annually with a promise of a 5% raise each year if his work remains satisfactory. Determine his salary for the next ten years.
Critical Background Knowledge: Bridge to previous instruction:
Conceptual: Understand exponents as repeated multiplication 6EE1
Procedural: Compute fluently with integers (add, subtract,
and multiply)4NBT4, 5NBT5, 6NS2, 6NS3,
Representational: Model multiplication of integers 4OA1, 4NBT6
Common misconceptions:o Students confuse the operations for the properties of integer exponents, most often due to
memorization of rules rather than internalizing the concepts behind the laws of exponentso Students sometimes incorrectly assume a value is negative when its exponent is negativeo When simplifying with the quotient of powers rule, students often make subtraction mistakeso Students sometimes forget there is a negative square root as well as the principal positive rooto Students sometimes mistakenly believe that zero slope is the same as “no slope” and then
confuse zero slope with undefined slope.
76
Domain: Geometry 8G (Quarter 3)Cluster: Understand congruence and similarity using physical models, transparencies, or geometry softwareStandard: 8G3 Describe the effect of dilations, translations, rotations, and reflections on two-dimensional figures using coordinates
Mastery, Patterns of Reasoning: Example:
Conceptual: Understand how to dilate, translate, rotate, and
reflect two-dimensional figures on the coordinate plane
The vertices of triangle A are (1, 0), (1,1), (0, 0) and triangle A’ are (2, 1), (2, 2), (3, 1). Describe the series of transformations performed on triangle A that result in triangle A’
Procedural: Describe the effects of dilations, reflections,
translations and rotations using coordinate notation Given an image and its transformed image, use
coordinate notation to describe the transformation
Given a triangle with vertices at (5, 2), (-7, 8) and (0, 4) find the new vertices of the triangle after undergoing the transformation described as follows:
Representational: Model transformations on a coordinate plane
Given a triangle with vertices at (4, 3), (-8, 7) and (-1, 5), show on a coordinate plane the transformation of (x, y) –> (x + 1, y -1)
Critical Background Knowledge: Bridge to previous instruction:
Conceptual: Know coordinate notation 5OA3, 5G1, 5G2
Procedural: Plot points on a coordinate plane Identify points on a coordinate plane
5G1, 5G2
Representational: Represent location on a coordinate plane 5G1, 5G2, 6NS6
Common misconceptions:o Students often confuse horizontal and verticalo Students sometimes use a corner of an object being rotated with the center of rotation
77
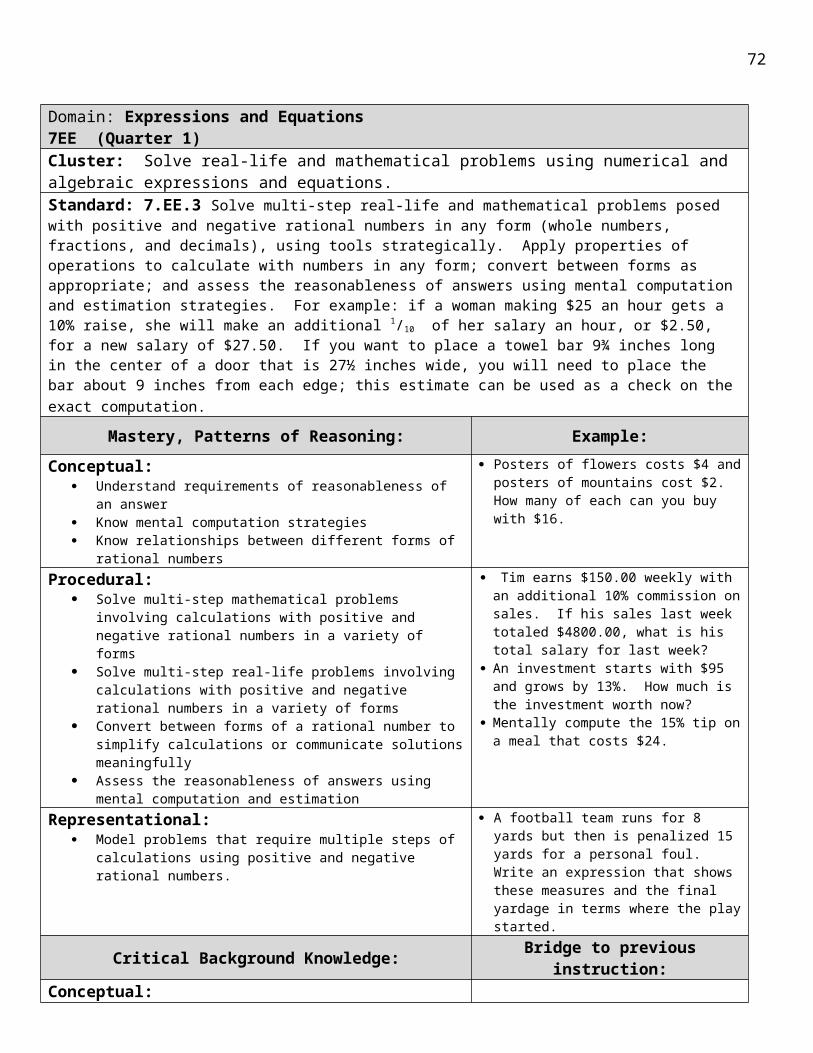
Domain: Geometry 8G (Quarter 3)Cluster: Understand congruence and similarity using physical models, transparencies, or geometry software
Standard: 8G4 Understand that a two-dimensional figure is similar to another if the second can be obtained from the first by a sequence of rotations, reflections, translations, and dilations; given two similar two-dimensional figures, describe a
sequence that exhibits the similarity between them
Mastery, Patterns of Reasoning: Example:
Conceptual: Understand that any combination of
transformations will result in similar figures
What combination of transformations would make triangle ABC be similar to triangle A’B’C’?
Procedural: Describe the sequence of transformations
needed to show how one figure is similar to another
Point A was reflected about the x-axis. What is the next transformation needed to map point A to point A’?
Representational: Model dilations of figures by a given scale
factor
If the measure of segment GA is 12 units, and the measure of segment GE is 6 units then what is the scale factor of triangle EHJ to triangle ABC?
Critical Background Knowledge: Bridge to previous instruction:
Conceptual: Understand ratios and proportions
6.RP.1, 7.RP.1, 7.RP.2, 7.RP.3
Procedural: Rotate, translate, reflect and dilate two-dimensional
figures
8.G.1, 8.G.2
Representational: Represent rotations, reflections, translations, and
dilations graphically
8.G.3
Common misconceptions:o Students sometimes do not understand that congruence is not dependent upon orientation.o Students sometimes apply congruence requirements to similarity. They believe similar shapes must have congruent
sides.o Students might not recognize that the ratio of the perimeters of similar polygons is the same as the scale factor of
corresponding side lengthso Students might not recognize that the ratio of the areas of similar polygons is the square of the scale factor of
corresponding side lengths
78
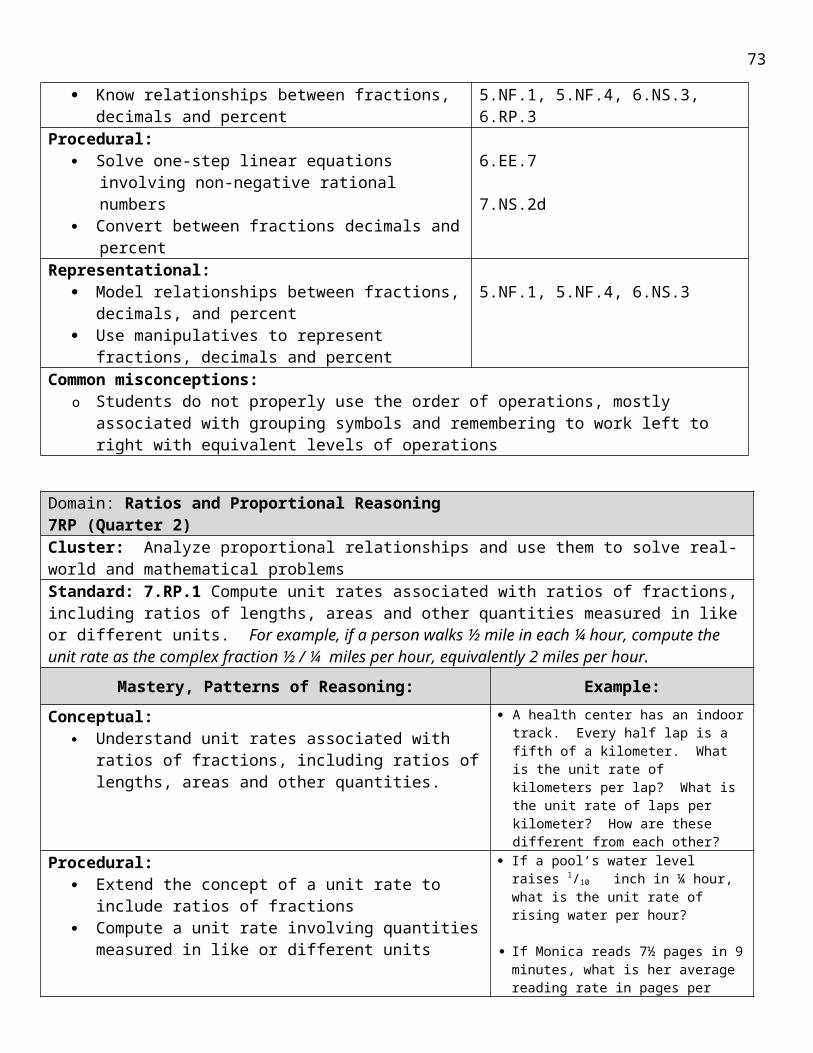
Domain: Geometry 8G (Quarter 4)
Cluster: Understand congruence and similarity using physical models, transparencies, or geometry software
Standard: 8G5 Use informal arguments to establish facts about the angle sum and exterior angle of triangles, about the angles created when parallel lines are cut by a transversal, and the angle-angle criterion for similarity of triangles. For example, arrange three copies of the same triangle so that the sum of the three angles appears to form a line, and give an argument in terms of transversals why this is so
Mastery, Patterns of Reasoning: Example:
Conceptual: Understand that the measure of an exterior angle of triangle is equal to
the sum of the measures of the non-adjacent angles Know that the sum of the angles of a triangle equals 180 degrees. Recognize that if two triangles have two congruent angles, they are
similar (A-A similarity) Know what a transversal is and its properties in relation to parallel
lines and pairs of angles
Are these triangles similar?
Procedural: Determine the relationship between corresponding angles,
alternate interior angles, alternate exterior angles, vertical angle pairs, and supplementary pairs when parallel lines are cut by a transversal
Use transversals and their properties to argue three angles of a triangle create a line
If line l || m, what is the measure of angle 4?
Representational: Model A-A similarity Model the sum of three angles of a triangle form a line
Using a paper triangle, show the three angles of the triangle from a line.
Critical Background Knowledge: Bridge to previous instruction:
Conceptual: N/A
Procedural: Measure angles
4.MD.5
Representational: Model adjacent angles
7.G.5
Common misconceptions:o Students sometimes think the numbering of angles created by a transversal cutting parallel
lines must always be the same and attempt to memorize the relationship between the numbers rather than the relationship of position
79
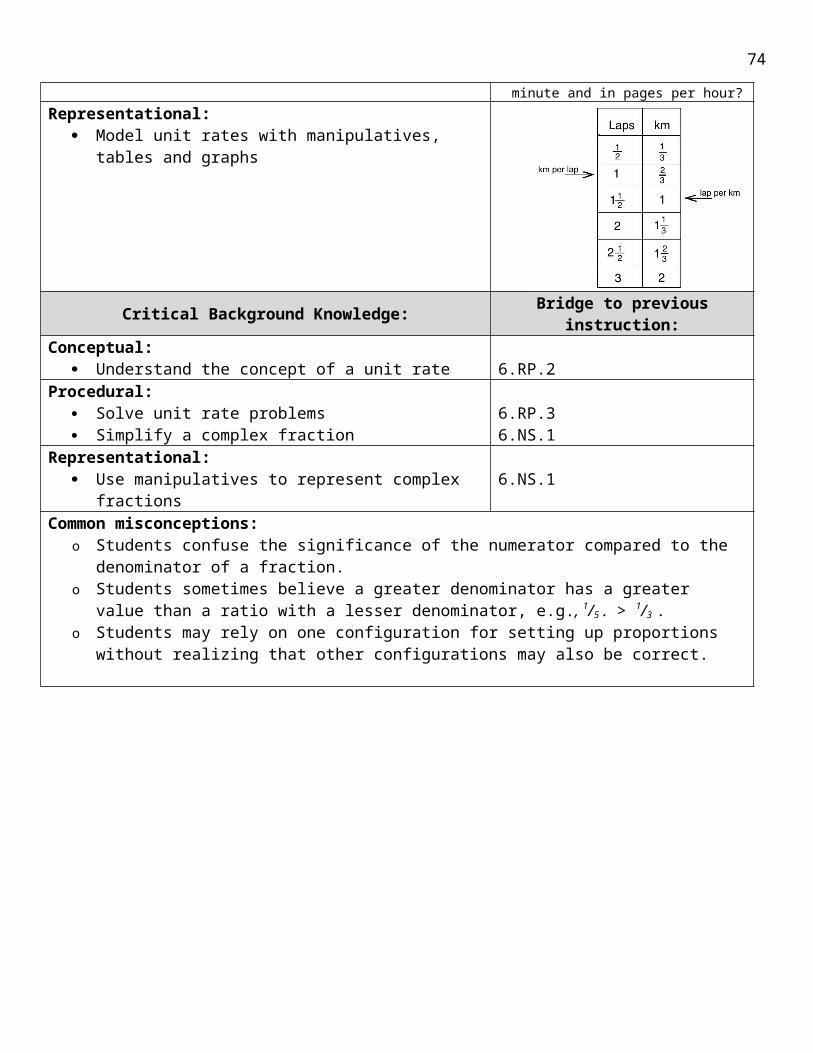
Domain: Geometry 8G (Quarter 4)Cluster: Understand and apply the Pythagorean Theorem
Standard: 8G7 Apply the Pythagorean Theorem to determine unknown side lengths in right triangles in real-world and mathematical problems in two and three dimensions
Mastery, Patterns of Reasoning: Example:
Conceptual: Know the Pythagorean Theorem
Can you use the Pythagorean Theorem to find the length of an unknown side of a non-right triangle?
Procedural: Use the Pythagorean Theorem to solve for a missing side
of a right triangle given the other two sides Use the Pythagorean Theorem to solve problems in real-
world contexts, including three-dimensional contexts.
What is the length of b?
If the height of a cone is 10 m and the
radius is 6 m, what is the slant height?Representational:
Use manipulatives to represent the Pythagorean Theorem to find missing sides of a right triangle
TV’s are measured along their diagonal to report their dimension. How does a 52 in. HD (wide screen) TV compare to a traditional 52 in. (full screen) TV?
Critical Background Knowledge: Bridge to previous instruction:
Conceptual: Know approximate values of irrational numbers
8.NS.2
Procedural: Solve an equation using squares and square roots Use rational approximations of irrational numbers to
express answers
8.EE.2, 8.NS.2
Representational: Represent approximate values of irrational numbers on a
number line
8.NS.2
Common misconceptions:o Students sometimes misinterpret the relationship of the number 2 in squares and square roots and then multiply
or divide by 2 rather than squaring or taking the square root.o Students often combine numbers under the radicand when they should be combining like terms (e.g., 2√3 +4√3 =
6√6)o Students sometimes over extend order of operations without regard to rules of exponents.
e.g.,
80
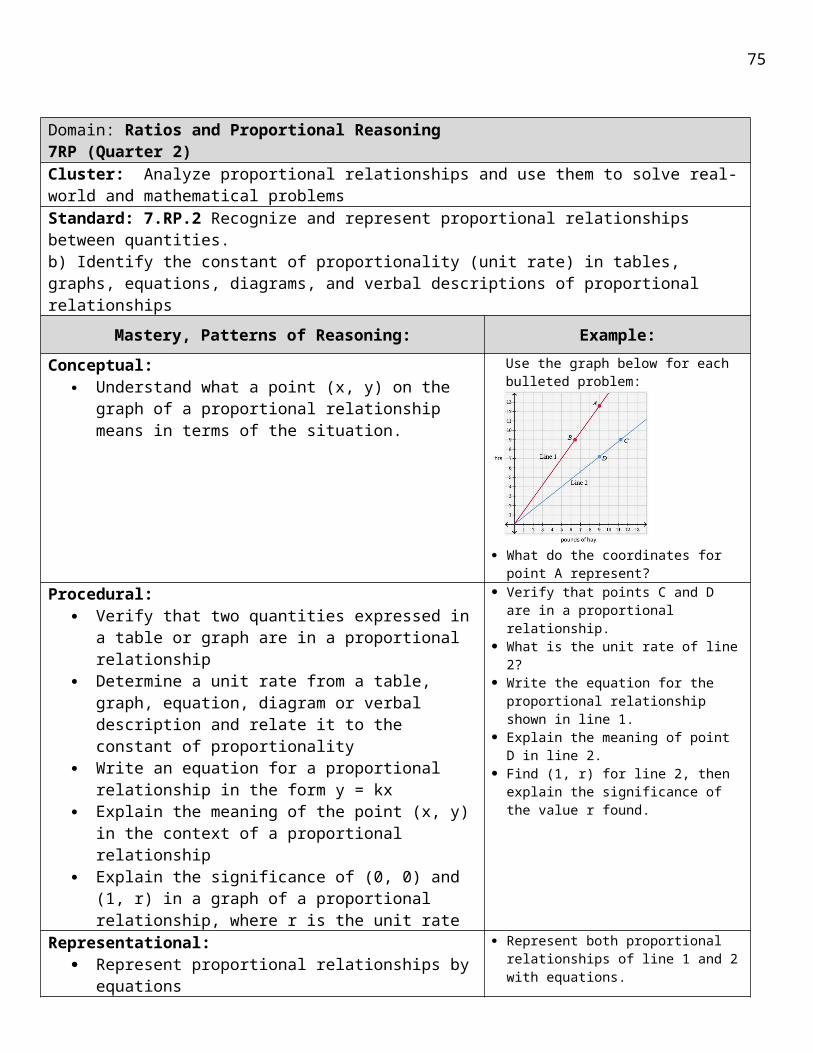
Domain: Geometry 8G (Quarter 4)Cluster: Solve real-world and mathematical problems involving volume of cylinders, cones, and spheresStandard: 8G9 Know the formulas for the volumes of cones, cylinders, and spheres and use them to solve real-world and mathematical problems
Mastery, Patterns of Reasoning: Example:
Conceptual: Know the formulas for the volumes of cones,
cylinders, and spheres
What is the formula for the volume of a cylinder? What is the formula for the volume of a sphere?
Procedural: Use the formulas for volume to find the
volumes of cones, cylinders, and spheres
A silo has 1500 ft3 of grain. The grain fills up the silo 20 ft .high. What is the radius of the silo?
What is the relationship between the volume of a cylinder and a cone with the same radius and height?
What does the height of the cone need to be so that one spherical scoop of ice cream with the same radius as the cone won’t overflow if it melts?
Representational: Use manipulatives to represent the volumes
of cones and cylinders
Find the volume of a given tin can. After calculating the volume, attempt to fill the can with the amount of water to verify your calculation.
Critical Background Knowledge: Bridge to previous instruction:
Conceptual: Know what is and how to derive itπ Understand that volume is measured in cubic
units Understand exponential notation for squares
and cubes
8.NS.25.MD.3, 5.MD.4, 5.MD.5, 6.G.2, 7.G.65.NBT.2, 6.EE.1
Procedural: Solve equations involving square roots and
cube roots
8.EE.2
Representational: Represent rational approximations of
irrational numbers such as pi
8.NS.2
Common misconceptions:o Students learning volume sometimes do not understand the volume of an object is independent of the material it is
made of, they confuse mass and volume.o Students often ignore the relationship of the height and radius on volume, for example, if we create two cylinders
with one piece of 8.5” •11” each, one that is made with the top and bottom connected and one with the left side connected to the right side, do they have the same volume? Many student will say yes or think the taller cylinder has more volume.
81
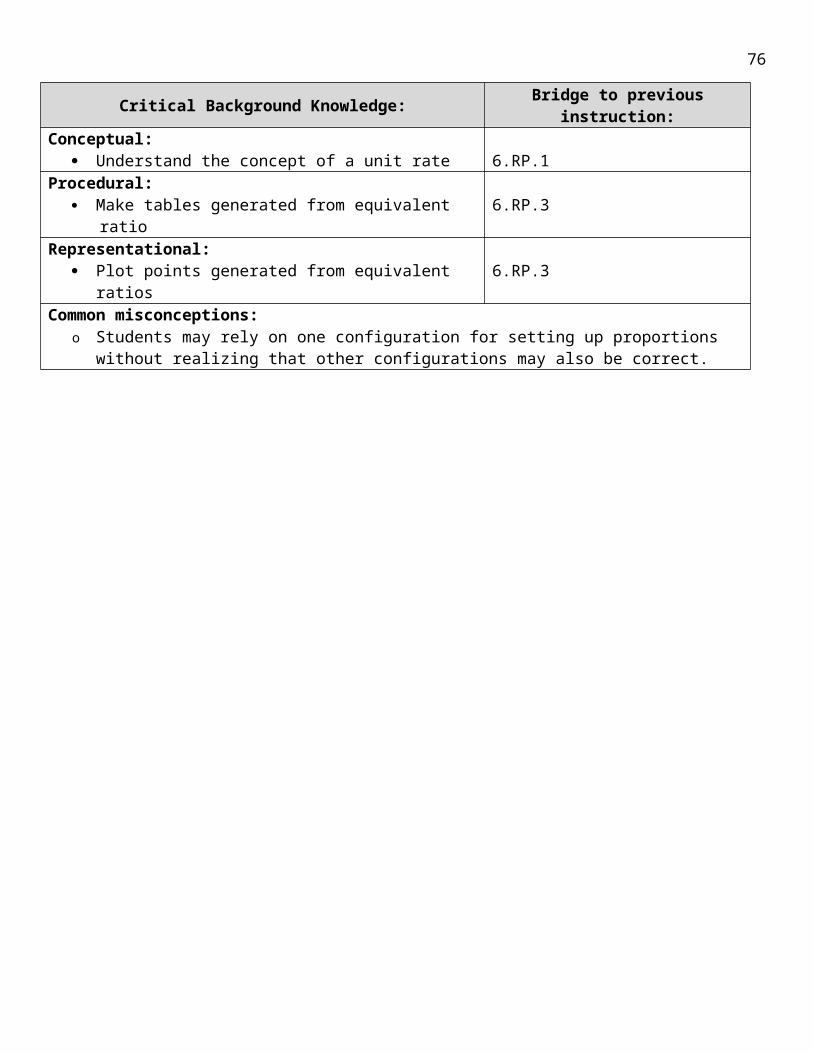
Domain: Statistics and Probability 8SP (Quarter 4)Cluster: Investigate patterns of association in bivariate data
Standard: 8SP1 Construct and interpret scatter plots for bivariate measurement data to investigate patterns of association between two quantities. Describe patterns such as clustering, outliers, positive or negative association, linear association, and nonlinear association
Mastery, Patterns of Reasoning: Example:
Conceptual: Understand clustering patterns of positive or
negative association, linear association, and nonlinear association
Know what outliers are
What is an outlier?
Procedural: Collect, record, and construct a set of bivariate
data using a scatter plot Interpret patterns on a scatter plot such as
clustering, outliers, and positive, negative or not association
Do the point plotted below have a positive, negative, or not association?
Representational:
Graphically represent the values of a bivariate data set with a scatter plot
Construct a scatter plot and describe any association you observe with the values below
Height Hand span70 in 10 in72 in 9.5 in61 in 8 in62 in 9.5 in68 in 9 in
Critical Background Knowledge: Bridge to previous instruction:
Conceptual: Understand graphing of linear values and
points Understand the meaning of linear and
nonlinear
5.G.2, 5.OA.3
Procedural: Graph points on a coordinate system
5.OA.3, 6.NS.8
Representational: Represent linear relationships graphically
7.RP.2, 7.EE.4
Common misconceptions:o Students sometimes confuse the x- and y-coordinates as well as the x- and y-axiso Students often confuse vertical and horizontal change in slope
Back to Table of Contents
82
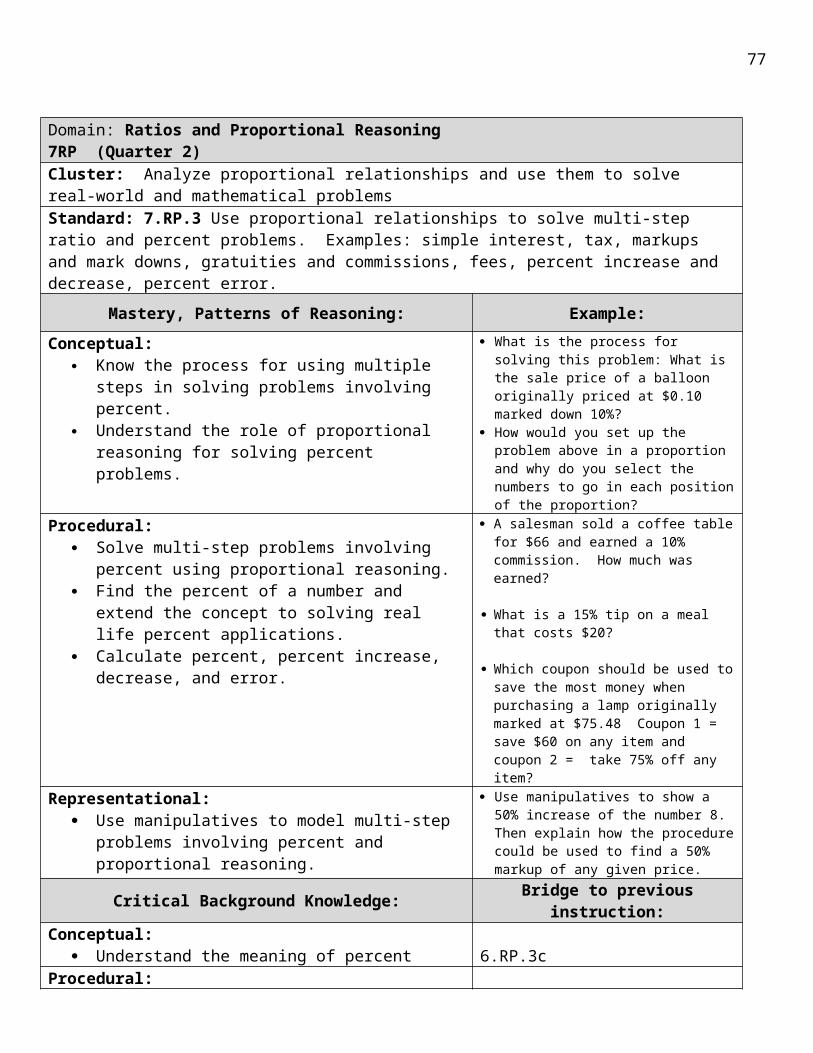
Secondary Math coursesProvo High School
83
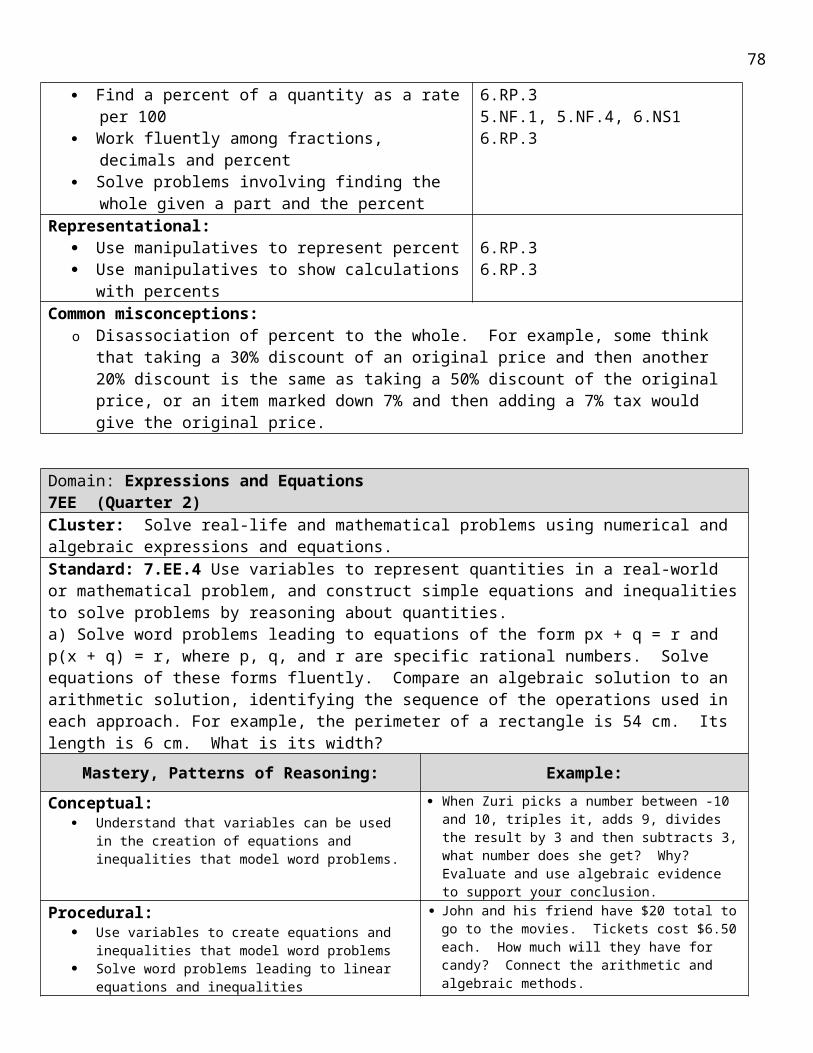
Secondary Math 1 OutlineCorrelated to Math 1 Book from McGraw-Hill
Unit 1 (6 days) Variables and Expressions SM1–PHS Q1
# Days Sec. # Title of SectionUtah CORE Standard
Learning Targets Notes
1 Intro to course and diagnostic test
1 1.1 Integers and exponents review I can add/subtract/multiply/divide integers
I can evaluate expressions with positive exponents
I can simplify exponents with a negative base (i.e., –32)
Needs supplemental worksheet
1 1.2 Order of operations and parts of expressions 1.A.SSE.1(2)
I can identify parts of expressions (term, factors, coefficient, constant, base, power)
I can perform the correct order of operations
Identify and interpret parts of expressions (supplement)
1 1.3, 1.4 Properties of Real Numbers I can simplify algebraic expressions (using distribution and combining like terms)
I can evaluate an expression given specific values for variables
I can recognize and use the associative, commutative, distributive, inverse, identity, and substitution properties
Review
1 Test
84
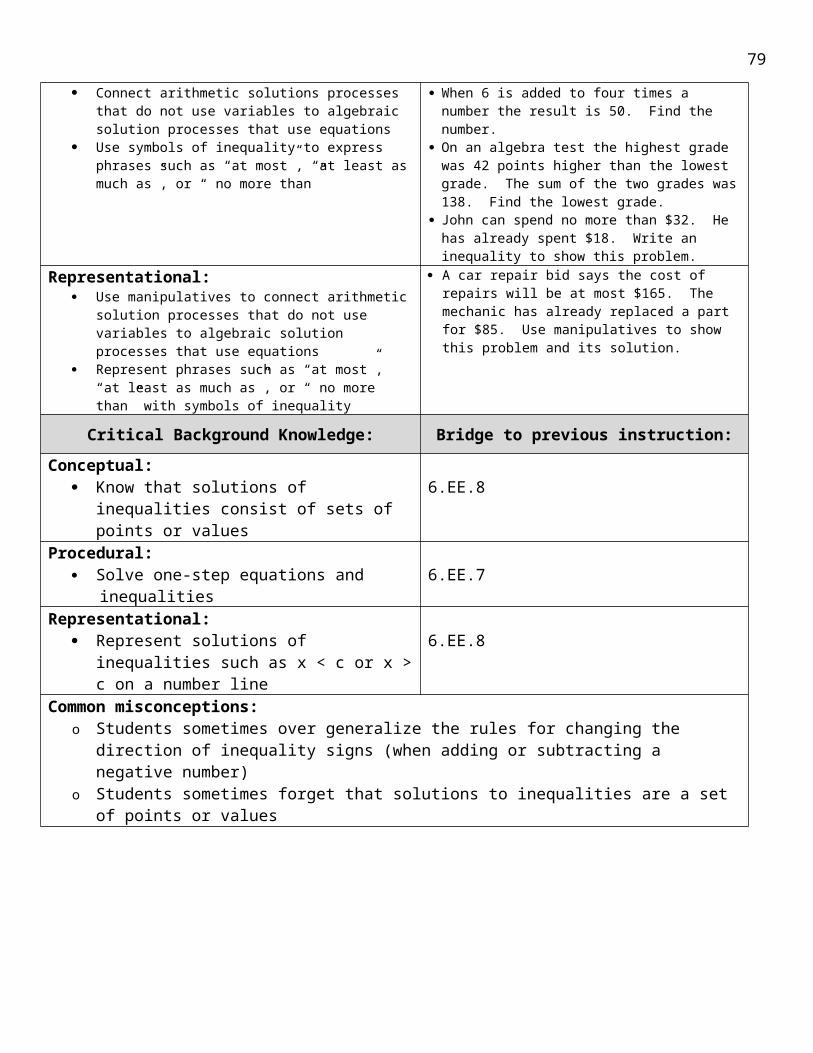
Unit 2 (8 days) Solving Linear Equations SM1–PHS Q1
# Days Sec. # Title of SectionUtah CORE Standard
Learning Targets Notes
1 2.1 Writing equations (single variable)
1.A.CED.1(1)1.A.CED.3(1)
I can translate sentences into equations I can translate equations into sentences
Need to write from contextual situations
1 2.2 Solving one-step equations 1.A.CED.1(1)1.A.CED.3(1)
3.A.REO.13.A.REI.13.A.REI.33.A.REI.5
I can solve one-step equations
Solve and interpret in context
1 2.3 Solving multi-step equations I can solve equations involving more than one operation
1 2.4, 2.9 Solving equations with variables on both sides
1.A.CED.3(1)3.A.REI.13.A.REI.33.A.REI.5
I can solve equations with the variable on both sides
I can solve an equation using the distributive property
1 2.6 Ratios and proportions1.N.Q.2(3)
I can compare ratios and determine if they are equivalent
I can solve proportions1 2.8 Literal equations
1.A.CED.4(1) I can solve literal equations for a given
variable I can use formulas to solve problems
1 Review
1 Test
85
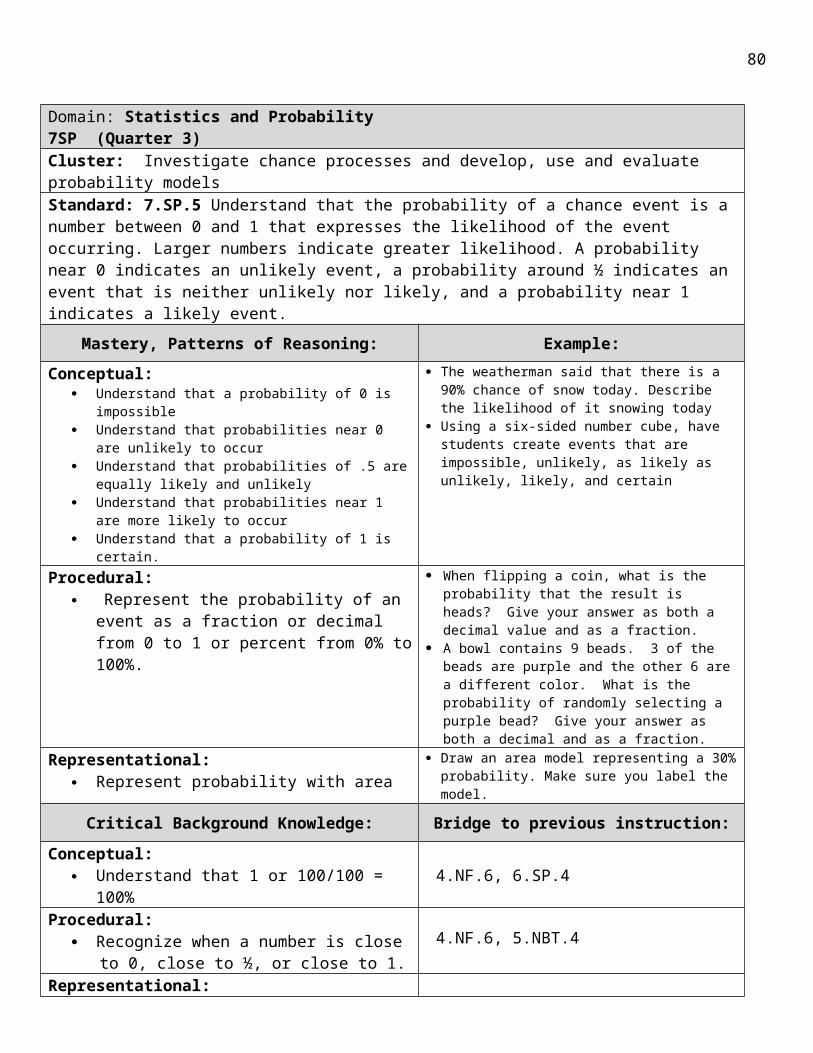
Unit 3 (5 days) Functions – notation and interpretation SM1–PHS Q1
# Days Sec. # Title of SectionUtah CORE Standard
Learning Targets Notes
1 Relations I can represent a relation as a set of ordered pairs, a table, a mapping or a function
I can interpret a relation I can identify the domain and range of a
relation
Supplement: write equations using function notation
1 Functions I can determine if a relation is a function I can use function notation to evaluate a
function
Do some interval notation, supplement context relationship with domain
1 Interpreting graphs of functions I can use interval notation to describe intervals
I can find the intercepts of a function I can determine intervals where a
function is increasing, decreasing or constant
Supplement: recognizing solutions and non-solutions, supplement for exponential (wiki – 2.2, 2.3)
1 Review
1 Test
86
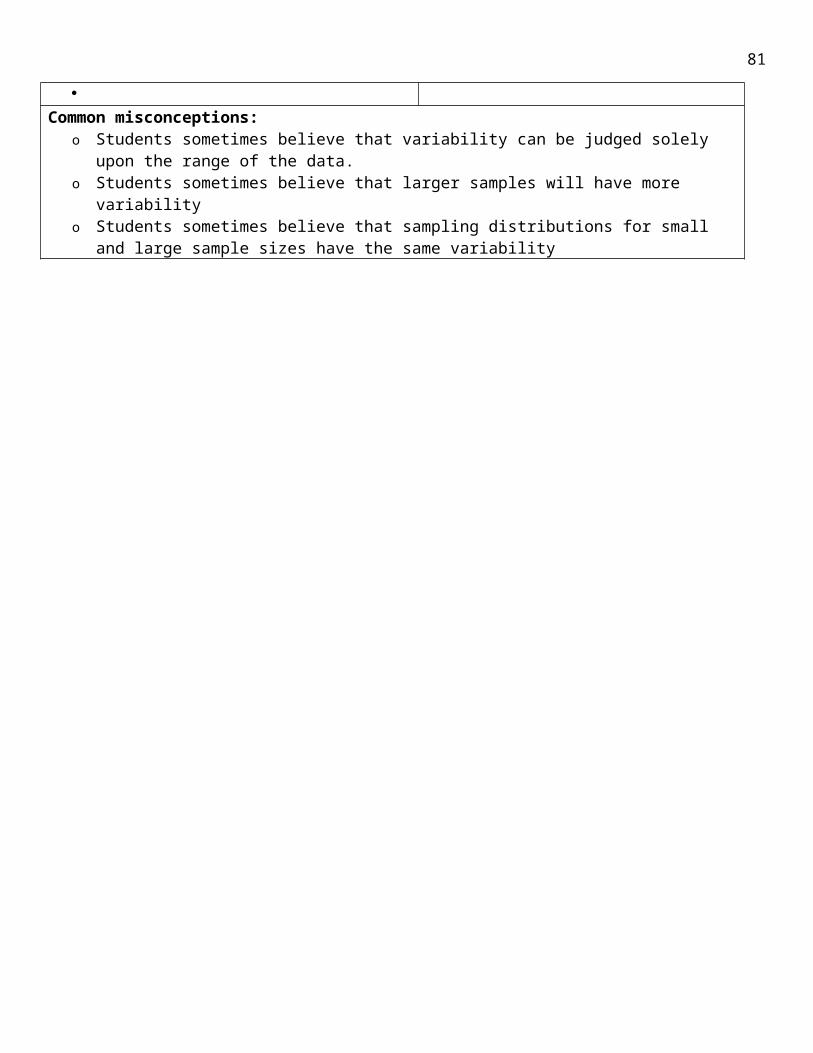
Unit 4 ( 6 days) Graphing linear functions SM1–PHS Q2
# Days Sec. # Title of SectionUtah CORE Standard
Learning Targets Notes
1 3.1 Graphing linear equations in standard form 2.A.REI.10(1)
1.A.CED.2(1)
I can identify the x and y intercepts for a given graph or table
I can graph a linear equation in standard form by finding the intercepts
1 3.3 Slope and rate of change1.N.Q.1(3)
4.S.ID.72.F.IF.6(3)2.F.LE. (5)
I can use the rate of change to solve problems (apply slope in context)
I can find the slope of a line given a graph I can find the slope given a table I can find the slope of a line through two
points
Supplemental worksheet: (Maybe with 4.2) – weak on tables
1 4.1 Graphing equations in slope-intercept Form 1.A.CED.2(1)
I can graph a line given an equation in slope-intercept form
1 Understanding linear equations in context
I can interpret the meaning of the slope and y-intercept of an equation given in context
Supplement growth and decay wiki –(text 3.2 revised)
1 Review
1 Test
87
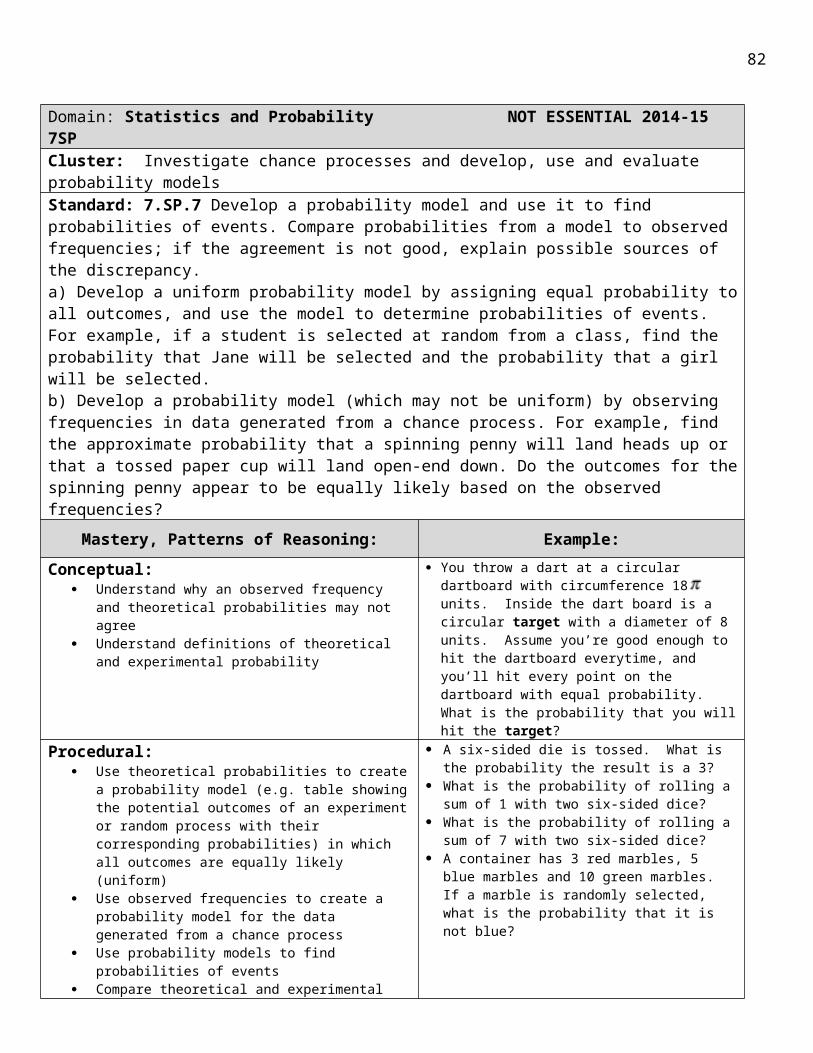
Unit 5 (6 days) Writing Linear Equations SM1–PHS Q2
# Days Sec. # Title of SectionUtah CORE Standard
Learning Targets Notes
1 4.2 Writing linear equations in slope intercept from (both slope and intercept given)
1.A.CED.2(1)2.F.LE.2
2.F.IF.7(3)
I can write an equation in slope-intercept form given slope and y-intercept
I can write an equation in slope-intercept form given a graph
I can write an equation in slope-intercept form given a table
1 4.3 Writing linear equations using point-slope formula
I can write an equation in slope-intercept form given slope and one point on the line
I can write an equation in slope-intercept form given two points
I can write an equation in slope-intercept form given a table (intercept not in the table)
1 4.4 Equations of parallel and perpendicular lines
6.G.GPE.5(1)5.G.CO.1(1)
I can determine if two lines are parallel or perpendicular from their equations
I can write an equation of a line through a given point, parallel to a given line
I can write an equation of a line through a given point, perpendicular to a given line
In context
1 4.5 Scatter plots and line of best fit
4.S.ID.64.S.ID.7
I can make a scatter plot given a set of data and draw a line of best fit (by hand)
I can find the equation of a line of best fit using technology
I can find and interpret the correlation coefficient
1 Review
1 Test
88
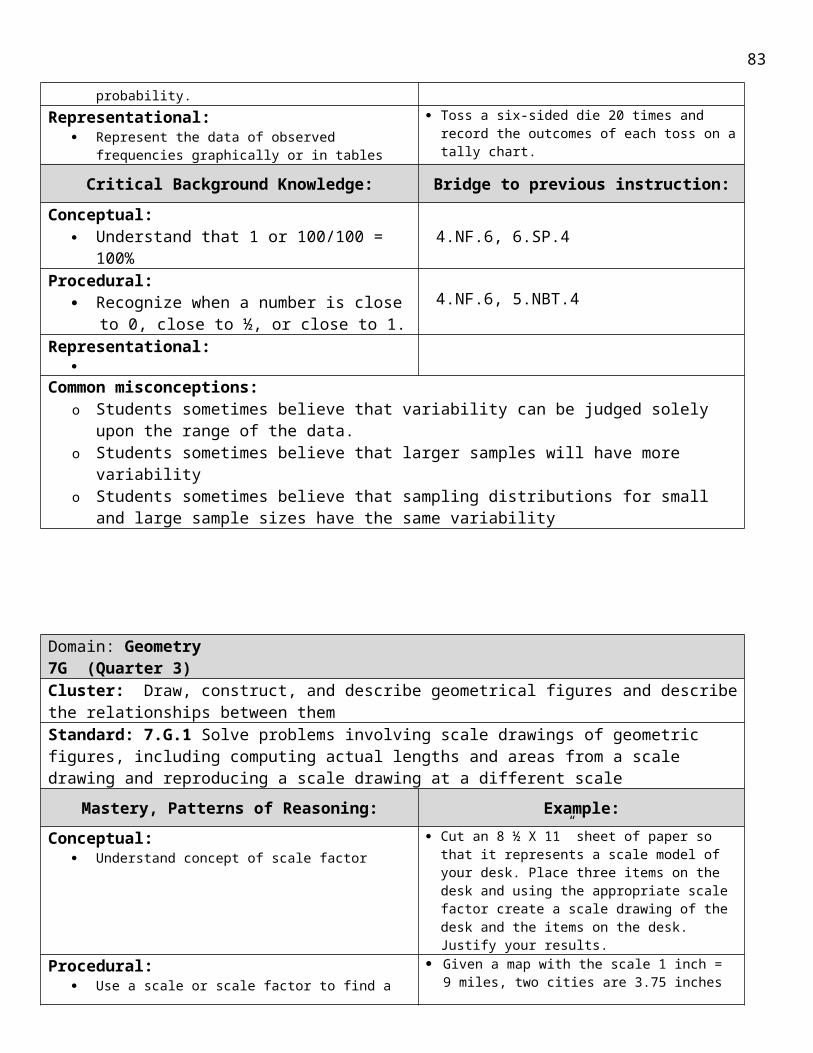
Unit 6 (6 days) Inequalities SM1–PHS Q2
# Days Sec. # Title of SectionUtah CORE Standard
Learning Targets Notes
1 5.1 5.2 Solving inequalities by addition, subtraction, multiplication, and division
1.A.CED.1 (1)1.A.CED.3 (1)
I can solve a one-step inequality in one variable
I can graph an inequality in one variable
1 5.3 Solving multi-step inequalities I can solve linear inequalities with more than one operations
I can solve linear inequalities using the distributive property
1 5.6 Graphing in equalities in two variables 2.A.REI.12 (1)
I can graph a linear inequality on a coordinate plane
1 Understanding linear inequalities in context
I can write an inequality given in context and I can interpret the meaning of the solution
1 Review
1 Test
89
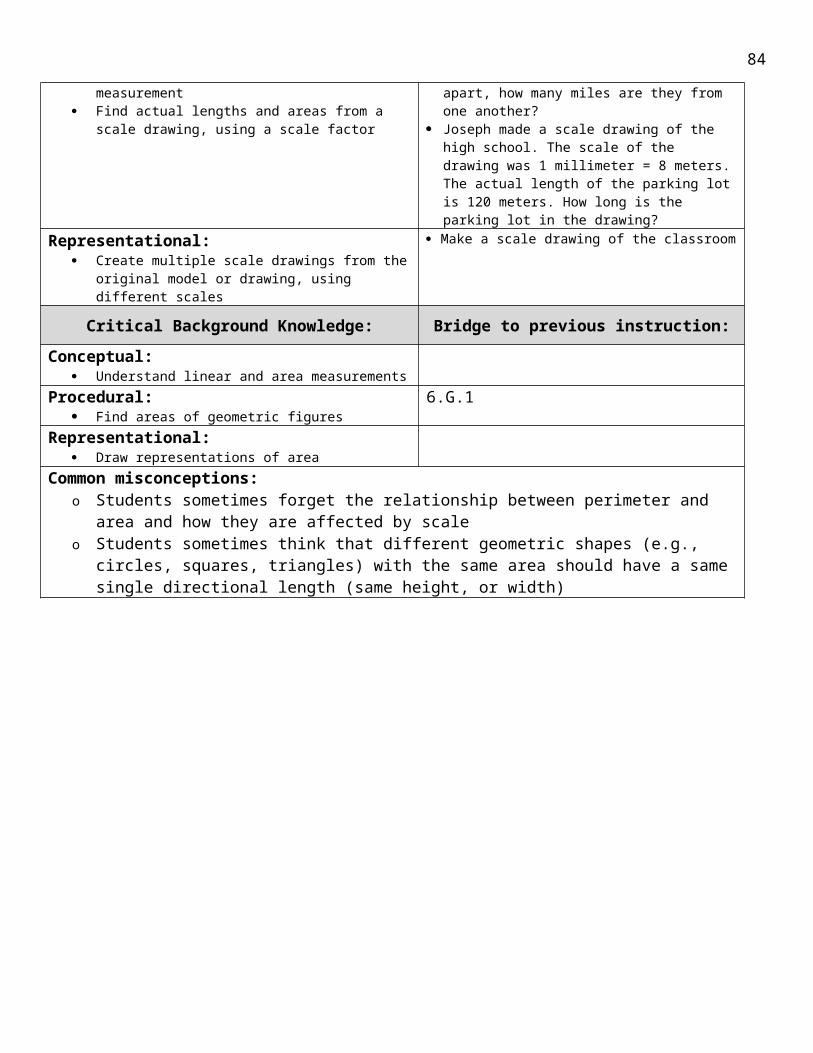
Unit 7 (9 days) Exponential Functions SM1–PHS Q3
# Days Sec. # Title of SectionUtah CORE Standard
Learning Targets Notes
1 7.1 Exponent multiplication properties
I can multiply two powers that have the same base by adding their exponents
I can find the power of a power by multiplying the exponents
I can find the power of a product by raising each factor to the power
1 7.2 Exponent division properties I can divide two powers that have the same base by subtracting their exponents
I can simplify a quotient raised to a power1 7.2 Negative and zero exponents I can explain and use the negative
exponent property I can explain and use the zero exponent
property1 7.4 Scientific notation I can convert from scientific notation to
standard form I can convert from standard form to
scientific notation I can evaluate numeric expressions that
use scientific notation1 7.5 Graphing exponential functions I can graph an exponential function using
a table
1 7.6 Growth and decay I can apply exponential growth formulas in context
I can apply exponential decay forumulas in context
I can apply the compound interest formula
1 Comparison of linear and exponential functions
I can compare the rates of change for linear and exponential functions
I can determine if a function is linear or exponential from a table of values
I can find a function to model a linear or exponential situation given in context
1 Review
1 Test
90
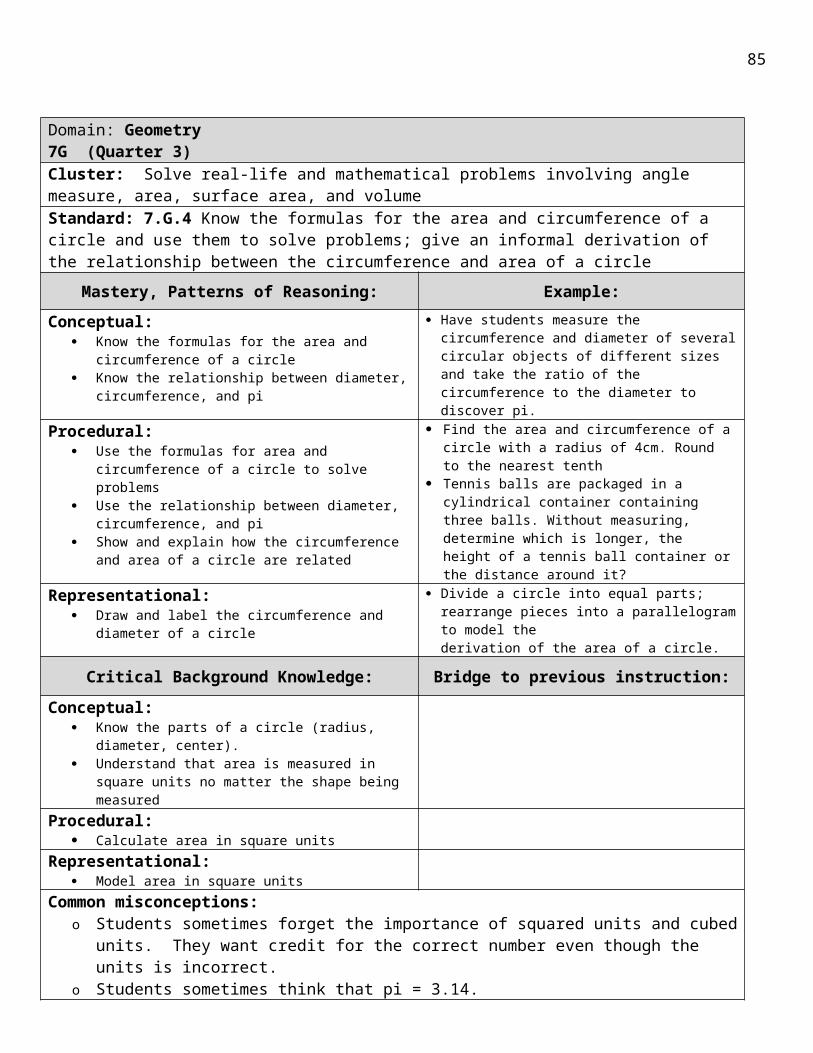
Unit 8 (7 days) Sequences SM1–PHS Q3
# Days Sec. # Title of SectionUtah CORE Standard
Learning Targets Notes
1 3.5 Arithmetic sequence
2.F.BF.1 (2)2.F.BF,2 (2)2.F.LE.2 (4)2.F.IF.3 (3)
I can recognize if a sequence is arithmetic I can identify the common difference I can find the next term in an arithmetic
sequence1 3.5 Formulas of arithmetic sequences I can write an explicit formula for an
arithmetic sequence I can find the nth term in an arithmetic
sequence1 7.7 Geometric sequence I can recognize if a sequence is geometric
I can identify the common ratio I can find the next term in a geometric
sequence1 7.7 Formulas of geometric sequences I can write an explicit formula for an
arithmetic sequence I can find the nth term in a geometric
sequence1 7.8 Recursive formulas
2.F.BF.1 (2)2.F.BF,2 (2)2.F.IF.3 (3)
I can write a recursive formula for an arithmetic sequence
I can write a recursive formula for a geometric sequence
I can use a recursive formula to find the nth term
1 Review
1 Test
91

Unit 9 (7 days) Systems of Equations SM1–PHS Q3
# Days Sec. # Title of SectionUtah CORE Standard
Learning Targets Notes
1 6.1 Linear systems and solving by graphing
A.REI.6A.REI.11A.REI.12
I can determine the number of solutions of a system of equations by looking at the graph of the system
I can determine if an ordered pair is a solution to a system of equations by evaluating
I can solve a system of equations by graphing
Need to use graphing technology
1 6.2 Solving systems by substitution
3.A.REI.53.A.REI.6
I can solve a system of equations using substitution
1 6.3 Solving systems by elimination (no multiplying required)
I can solve a system of equation using the linear combination (elimination ) method
1 6.4 Solving systems by elimination (must multiply one or both sides)
I can multiply one or both sides of equations so they are set up to use elimination
I can solve a system of equations using linear combinations method that requires multiplying
1 6.5 Systems in context I can solve contextual problems requiring systems of equations
1 Review
1 Test
92

Unit 10 (9 days) Statistics SM1–PHS Q4
# Days Sec. # Title of SectionUtah CORE Standard
Learning Targets Notes
1 9.1 Mean and standard deviation I can find the mean of a data set I can find the standard deviation of a data
set1 9.B Median and 5-number summary
4.S.ID.24.S.ID.3
I can find the 5 number summary of a data set
I can find the range I can find interquartile range (IRQ)
1 9.B 9.C Representing data
4.S.ID 1
I can create a dot plot I can create a box-plot I can create a histogram
1 9.2 Distributions of data I can define and recognize the difference between symmetrical and skewed distributions
I can decide which statistics to use to describe center and spread
1 9.3 Comparing sets of data4.S.ID.24.S.ID.3
I can compare the central tendency and spread of two sets of data in context
1 9.B Outliers and their effects I can identify an outlier in a given data set I can explain the effect of an outlier on
central tendency of a set of data1 9.3A Two-way frequency tables
4.S.ID.5
I can create a 2-way frequency table, including marginal frequencies
I can use a 2-way frequency table to find probabilities
1 Review
1 Test
93
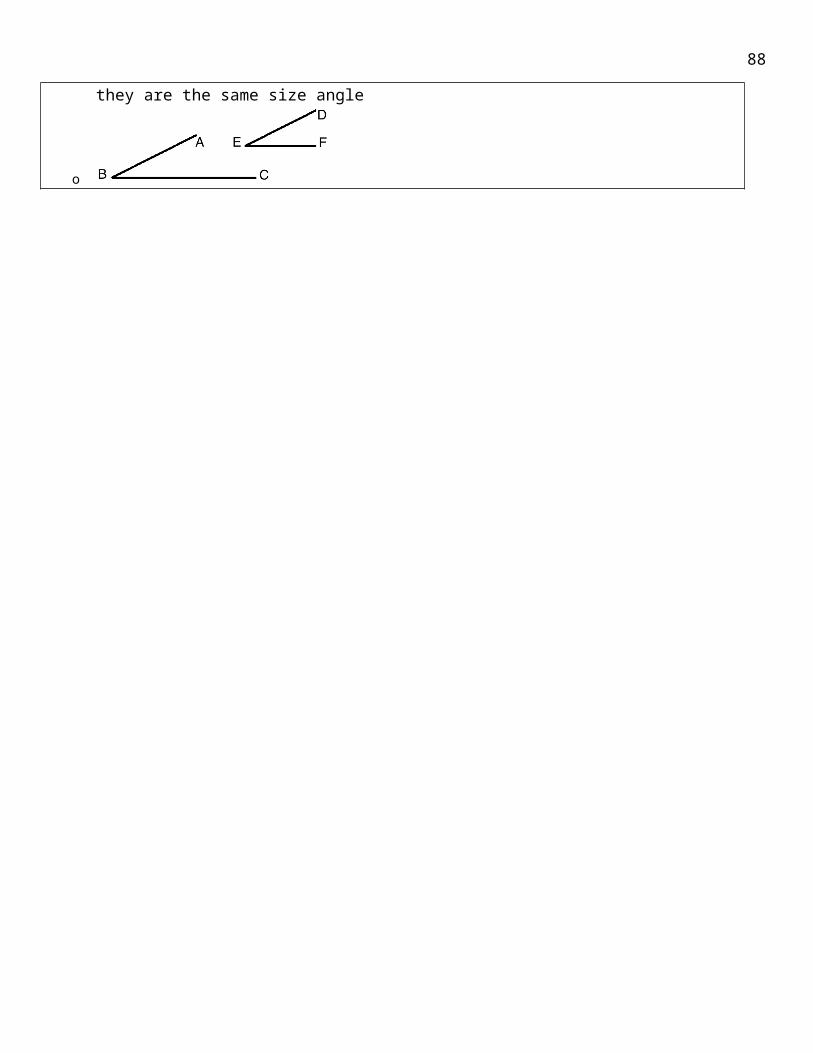
Unit 11 (7 days) Tools of Geometry SM1–PHS Q4
# Days Sec. # Title of SectionUtah CORE Standard
Learning Targets Notes
1 10.1 Points, lines and planes5.G.CO.1 (1)
I can identify and model points, lines and planes using correct notation
I can identify intersecting lines and planes
1 10.7 Linear measure I can identify line segments using correct notation
I understand the difference between congruence and equality
I can use congruence marks in geometric figures
I can apply the segment addition postulate to find missing lengths
1 10.8 Angle measure I can identify angles using correct notation
I can measure and classify angles I can identify angles and bisectors of
angles I can apply the angle measure postulate
to find missing angles1 10.6 Two-dimensional figures
5.G.CO.1 (1)6.G.PE.7 (1)
I can identify convex and concave polygons
I can identify equilateral, equiangular and regular polygons
I can find the perimeter and area of triangles, rectangles and circles
1 10.3 Distance, midpoint, and polygons in the coordinate plane
6.G.PE.4 (1)6.G.PE.7 (1)
I can find the distance between two points
I can find the midpoint of a segment I can use the distance formula to find
perimeter and area of polygons in a coordinate plane
1 Review
1 Test
94
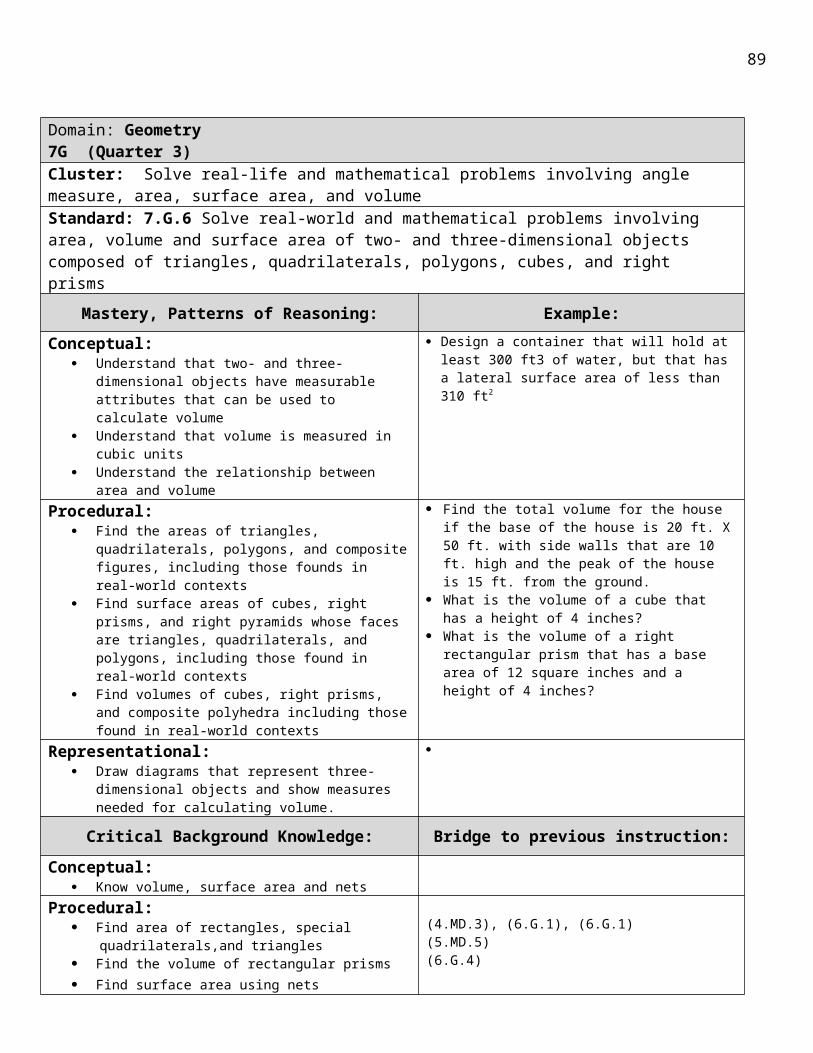
Unit 12 (7 days) Transformations and Triangle Congruence SM1–PHS
# Days Sec. # Title of SectionUtah CORE Standard
Learning Targets Notes
1 12.1 12.2
Classifying triangles
5.G.CO.7 (1)
I can classify triangles by angle measures I can classify triangles by side lengths
Angles of triangles I can use the triangle sum theorem to find a missing angle
I can use the linear pair theorem to find a missing angle
I can use the vertical angles theorem to find a missing angle
1 12.3 Congruent triangles I can identify and name corresponding parts of congruent triangles
I can determine if triangles are congruent using SAS, SSS, ASA, and AAS
1 14.4 12.7
Reflections
5.G.CO.2 (1) 5.G.CO.3 (1)5.G.CO.4 (1)5.G.CO.5 (1)5.G.CO.6 (1)
I can draw a reflection in the coordinate plane across a given line
1 14.5 12.7 14.7
Translations I can draw a translation in the coordinate plane given a transformation rule
I can identify a transformation rule from a plot of an image and pre-image
1 14.6 12.7 14.7
Rotations I can draw a rotation in the coordinate plane around a given point
I can identify line and rotational symmetries of 2D figures
1 Review
1 Test
Beginning of PHS Courses
Back to Table of Contents
95
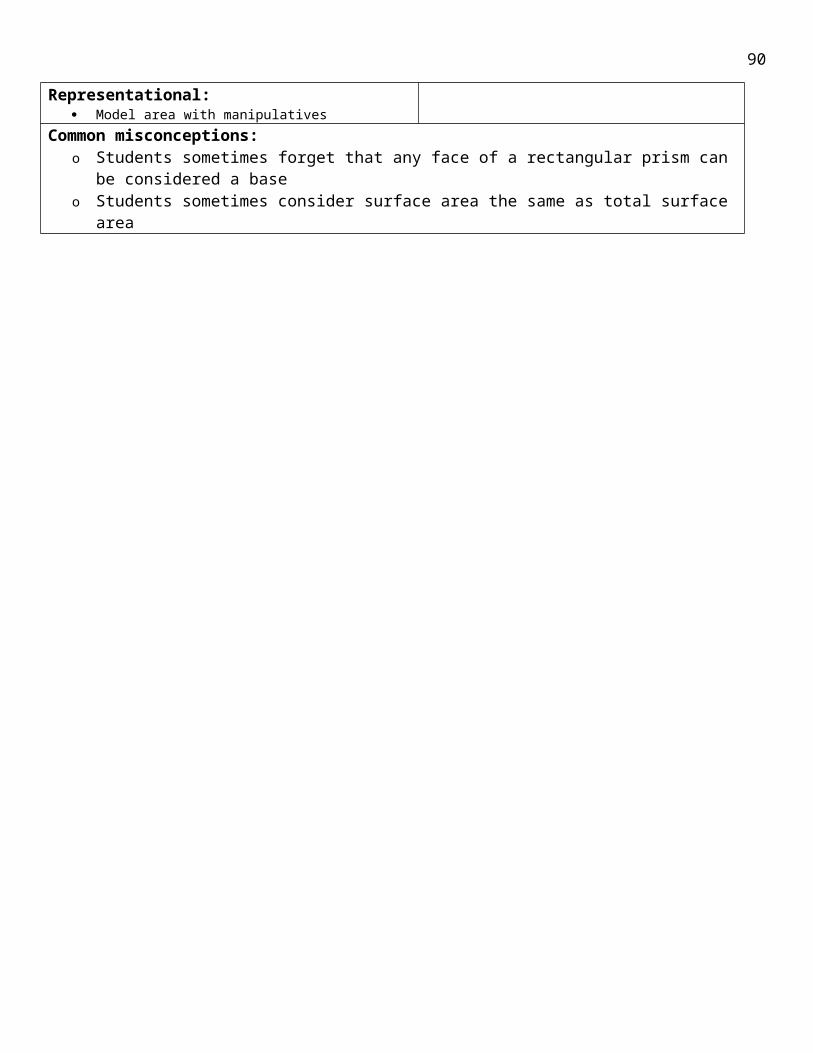
Secondary Math 2 OutlineCorrelated to Math 2 Book from McGraw-Hill
Unit 1 (11 days) Polynomial operations, factoring SM2–PHS Q1
# Days Sec. # Title of SectionUtah CORE Standard
Learning Targets Notes
1 1.2 Multiplying a polynomial by a monomial
1.A.APR.1 (5)3.A.SSE.1 (1)
I can multiply a polynomial by a monomial (distributive property)
I can solve an equation using the distributive property
I can factor out the GCF from a polynomial1 1.3 Multiplying polynomials I can multiply two binomials
I can multiply polynomials by using the distributive property
1 1.4 Special products 1.A.APR.1 (5) I can find the square of sums and differences I can find the product of a sum and difference
1 Review and mini test
1 1.5 Using the distributive property1.A.APR.1 (5)
I can use the distributive property to factor a polynomial
I can factor polynomials with 4 terms by grouping1 1.6 Factoring x2 + bx + c
2.IF.82.IF.9 (2)
I can factor a trinomial of the form x2 + bx + c using algebra tiles
I can factor a trinomial of the form x2 + bx + c I can factor a trinomial when the GCF can be factored
out No solving, just emphasize factoring
1 1.7 Factoring ax2 + bx + c I can factor ax2 + bx + c by regrouping or trial and error
1 1.8 Difference of squares 2.IF.8 (2)2.IF.9 (2)
3.A.SSE.2 (1)3.A.SSE.3 (2)
I can recognize and factor the difference of squares I can recognize and factor perfect square trinomials I know when to factor the GCF before factoring a
trinomial 1 1.9 Perfect squares
1 All factoring methods
1 Review1 Test
96
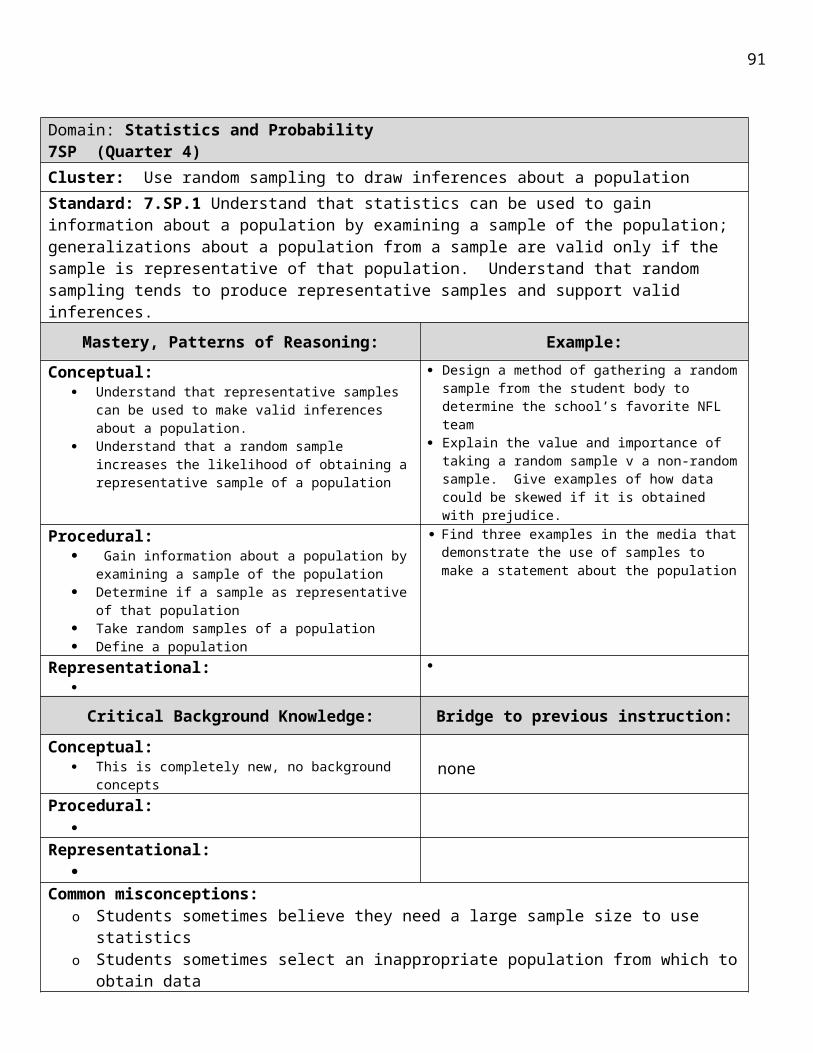
Unit 2 (11 days) Solving quadratics by factoring and graphing SM2–PHS Q1
# Days Sec. # Title of SectionUtah CORE Standard
Learning Targets Notes
1 2.1 Graphing quadratic functions
2.F.IF.5 (1)2.F.IF7 (2)2.F.IF.9 (2)
I can graph a basic quadratic function y = x2
I can identify a quadratic equation in standard form I can find the vertex of a quadratic in standard form using
the axis of symmetry I can graph a quadratic function in standard form I can identify the domain and range of a quadratic function I can identify the vertex as the maximum or minimum
2 2.3 Transformations of quadratics I can graph a quadratic in vertex form I can determine the translation horizontal and/or vertical
shift of a quadratic function I can determine the reflection of a quadratic function I can determine the dilation (vertical shrink/stretch) of a
quadratic function
3.4 Transformations of quadratic graphs3.4 explore lab
Families of parabolas
1 Review/ Test1 2.2 Solving quadratic equation by
graphing
3.A.REI.4 (4)3.A.SSE.3 (2)
I can determine the roots, zeros, solution, and intercept of a quadratic function
I can determine the type of solution to a quadratic function by graphing
I can graph a quadratic equation using a graphing calculator1 3.1 Solving quadratic equations by
factoring I can solve quadratic equations by factoring using any
method I can find the constant to complete the square
Solve by factoring
1.10 Roots and zeros2.4 Solving quadratic equations by
completing the squareInclude literal equation
1 2.5 Solving quadratic equations by using the quadratic formula
3.A.REI.4 (4)
I can use the quadratic formula to solve a quadratic function I can use my calculator correctly to find solutions I can simplify radicals to get a solution using the quadratic
formula1 Supp Applications of quadratics I can determine when an object hits the ground
I can determine where a thrown object reaches its maximum height
I can determine a reasonable domain and range for a thrown object
PHS math Dropbox
97

1 3.2 Complex numbers 1.N.CN.1 (3)1.N.CN.2 (3)1.N.CN.3 (+)3.N.CN.7 (5)
I can add and subtract complex numbers I can multiply complex numbers I can simplify radicals I can use the quadratic formula to get complex solutions
1 3.3 The quadratic formula and the discriminant
1.N.CN.1 (3)1.N.CN.2 (3)1.N.CN.7 (5)
I can determine the number and type of solutions to a quadratic equation using the discriminant
1 Review1 Test
98
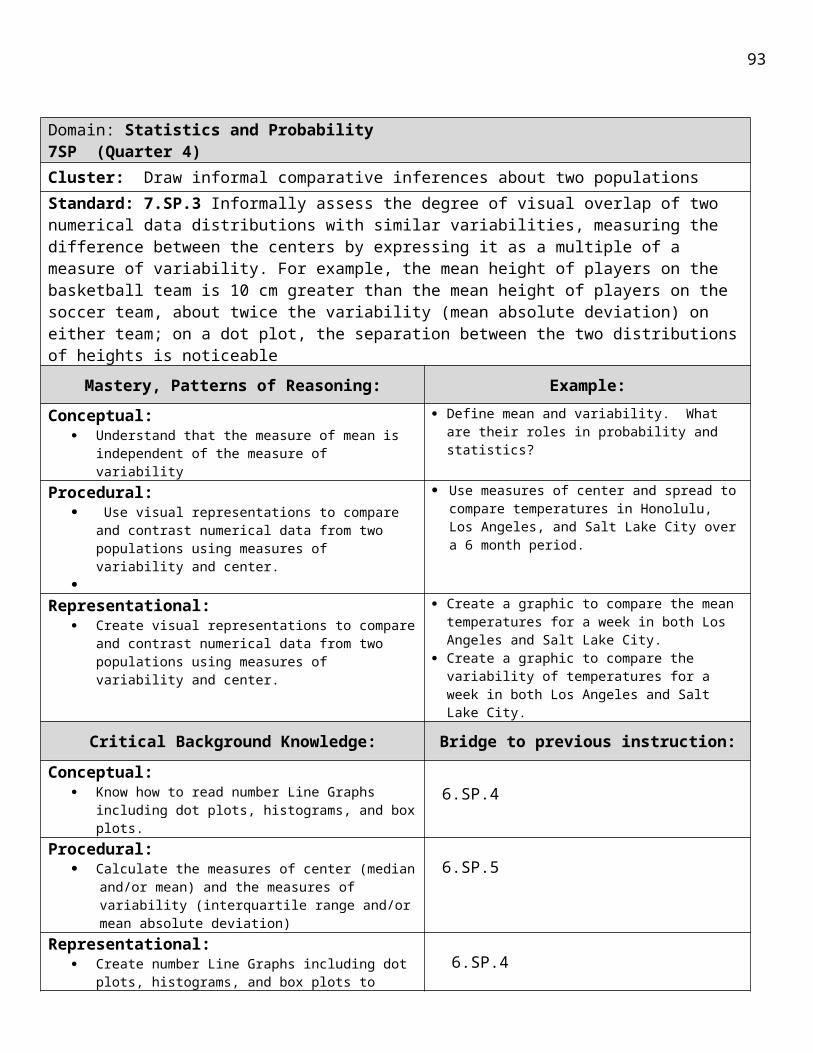
Unit 3 (6 days) Special Functions SM2–PHS Q2
# Days Sec. # Title of SectionUtah CORE Standard
Learning Targets Notes
1 Supp/ 4.1
Review linear/exponential functions 2.F.IF.5 (1)
I can graph a linear function I can graph an exponential function I can graph an absolute value function I can identify the domain and range of functions Ican perform vertical, horizontal and stretch on functions I can graph a square root function
Emphasize domain
2.7 Special functions (absolute value 2.F.BF.3 (4)2.F.IF.5 (1)
Emphasize doamin and range
1 0.7 Inverse linear functions 2.F.BF.4 (4)
2.F.IF.5 (1)
Needs supplement
0.7 lab Drawing inverses
2 2.6 Analyze functions with successive differences 2.F.IF.4 (1)
2.F.IF.5 (1)2.F.IF.6 (1)2.F.LE.3 (5)
I can identify linear, quadratic and exponential functions from a given table
I can write equations that model functions from a given table
I can find the average rate of change in a given interval
Compare linear, quadratic and exponential rates of change
3.4 extend lab
Quadratics and rate of change
1 Review
1 Test
99
Unit 4 (8 days) Angle relationships, triangle congruence SM2–PHS Q2
# Days Sec. # Title of SectionUtah CORE Standard
Learning Targets Notes
1 5.1 Postulates and paragraph proofs
5.G.CO.9 (2)
I can identify and use basic postulates about points, lines and planes
UNO proofs
1 5.4 Proving angle relationships I can identify supplementary and complementary angles I can identify corresponding angles, alternate interior
angles, alternate exterior angles, same side interior angles and vertical angles
I can use the angle pair relationships to find missing angles
No proofs
5.5 Angles and parallel lines
1 Supp Uno and algebra proofs5.G.CO.10 (2)5.G.SRT.5 (3)
I can prove triangle congruence I can do an UNO proof I can use the properties of algebra to write a two column
proof and a paragraph proof1 6.1 Angles of triangles
5.G.CO.10 (2)
I can reasonably explain the triangle sum theorem I can use the triangle sum theorem to find missing
measures in triangles I can name and use corresponding parts of congruent
polygons
Prove triangle sum theorem
6.2 Congruent triangles (corresponding parts)
1 6.3 Proving triangles congruent SSS
5.G.CO.10 (2)5.G.SRT.5 (3)
I can identify SSS, SAS, ASA, and AAS triangle congruence I can use SSS, SAS, ASA, and AAS to test whether triangles
are congruent
No proofs
6.4 Proving triangles congruent ASA
1 6.5 Isosceles and equilateral triangles I can justify the isosceles triangle theorem I can use properties of isosceles triangles I can use properties of equilateral triangles
1 Review
1 Test
100
Unit 5 (5 days) Parallelogram SM2–PHS Q2
# Days Sec. # Title of SectionUtah CORE Standard
Learning Targets Notes
1 8.2 Parallelograms 5.G.CO.11 (2)6.G.PE.4
I can recognize and apply properties of parallelograms
Emphasize proof of properties of parallelograms8.3 Tests for parallelograms
1 8.4 Rectangles
5.G.CO.11 (2)
I can recognize and apply properties of rectangles I can recognize and apply properties of rhombi and
squares
8.5 Rhombi and squares
1 8.6 Trapezoids and kites I can recognize and apply properties of trapezoids and kites
1 Review1 Test
101
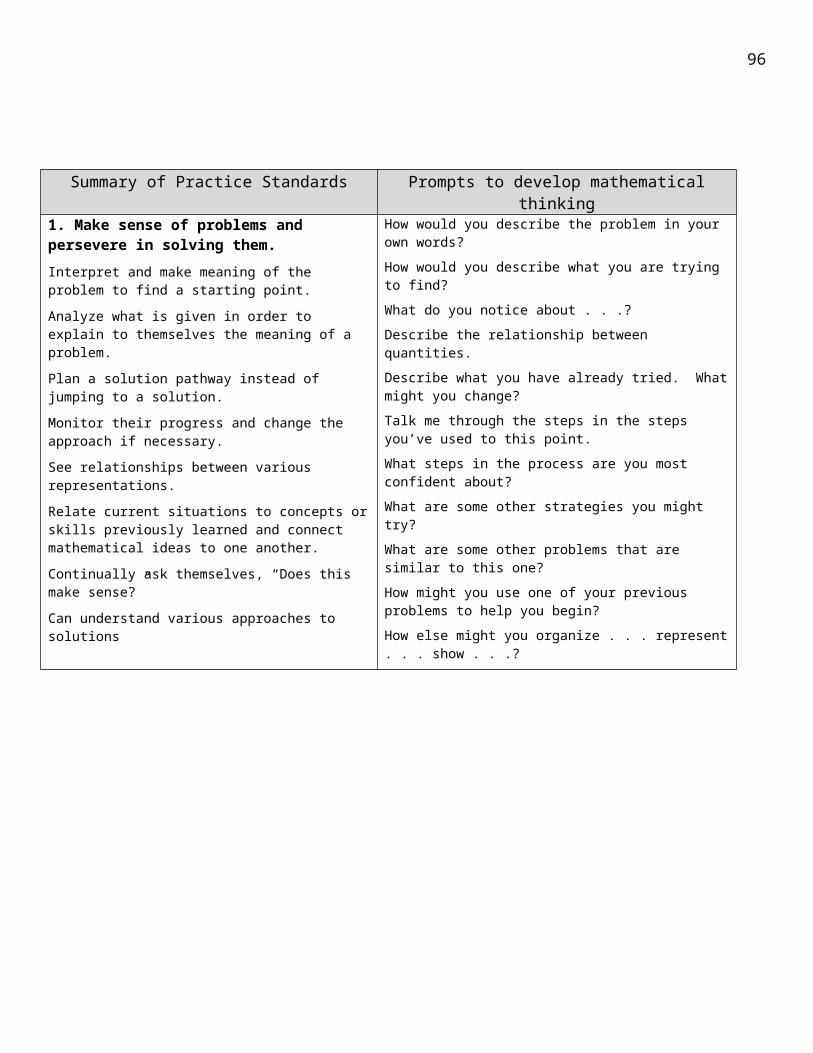
Unit 6 (5 days) Similarity SM2–PHS Q3
# Days Sec. # Title of SectionUtah CORE Standard
Learning Targets Notes
1 9.1 Ratios and proportions Prerequisite I can recognize and apply properties of ratios and proportions
9.2 Similar polygons
5.G.SRT.2 (1)5.G.SRT.3 (1)
I can determine if two polygons are similar
1 9.3 Similar triangles I can use AA, SAS, and SSS similarity to determine if two triangles are similar
I can find missing side lengths given that two triangles are similar
I can use the midsegment theorem to find missing lengths of a triangle
1 9.6 10.8 Similarity transformations, dilations
5.G.SRT.1 (1) I can find the scale factor for a dilation I can draw a dilation given a shape and scale factor
1 Review
1 Test
102
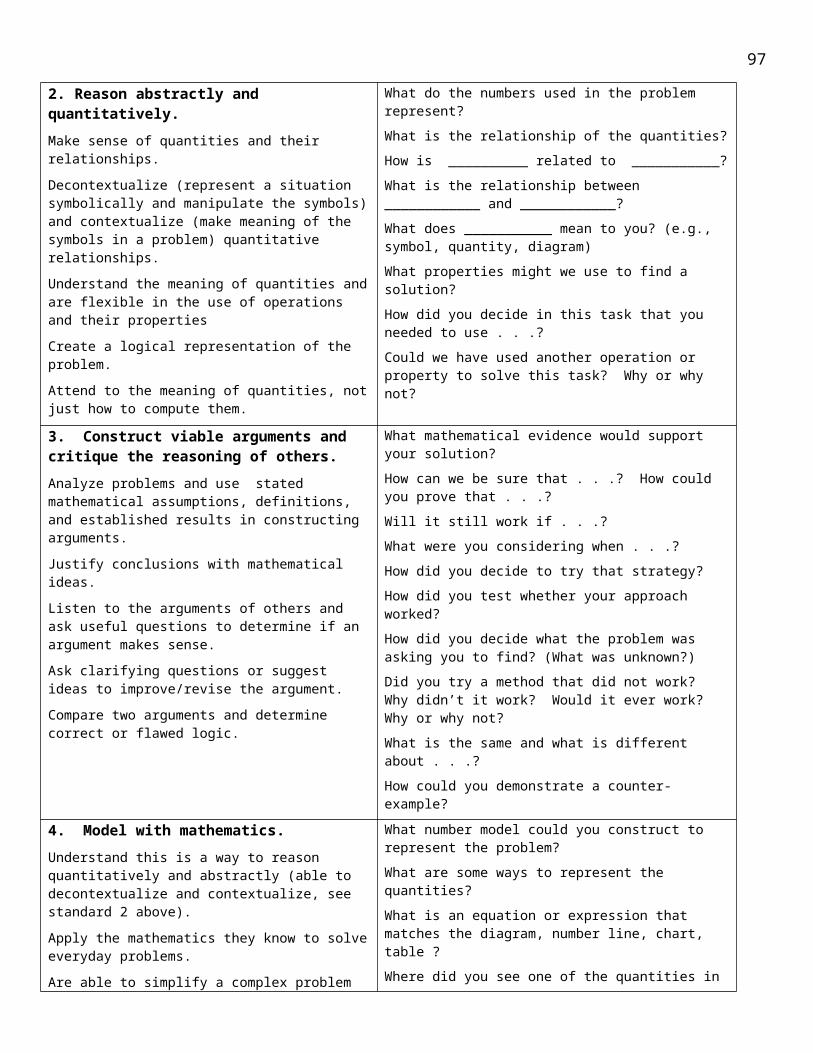
Unit 7 (7 days) Trigonometry SM2–PHS Q3
# Days Sec. # Title of SectionUtah CORE Standard
Learning Targets Notes
1 10.2 The Pythagorean Theorem and its converse
5.G.SRT.8 (5) I can apply the Pythagorean Theorem to right
triangles to find missing sides
1 10.3 Special right triangles 5.G.SRT.6 (5) I can use the special right triangles to determine side lengths of similar triangles
1 10.4 Trigonometry5.G.SRT.6 (5) 5.G.SRT.7 (5)
5.TF.8 (6)
I can use sin, cos, and tan to find the trig ratios I can use sin, cos, and tan to find the missing sides of
any right triangle I can find the angles of any right triangle using the
inverses of sin, cos, and tan.
Do problem #61 to emphasize Pythagorean Identity
1 10.5 Angles of elevation and depression 5.G.SRT.8 (5)
I can identify angles of elevation and depression I can use angles of elevation and depression to find
distances between two objects1 Review1 Test
103
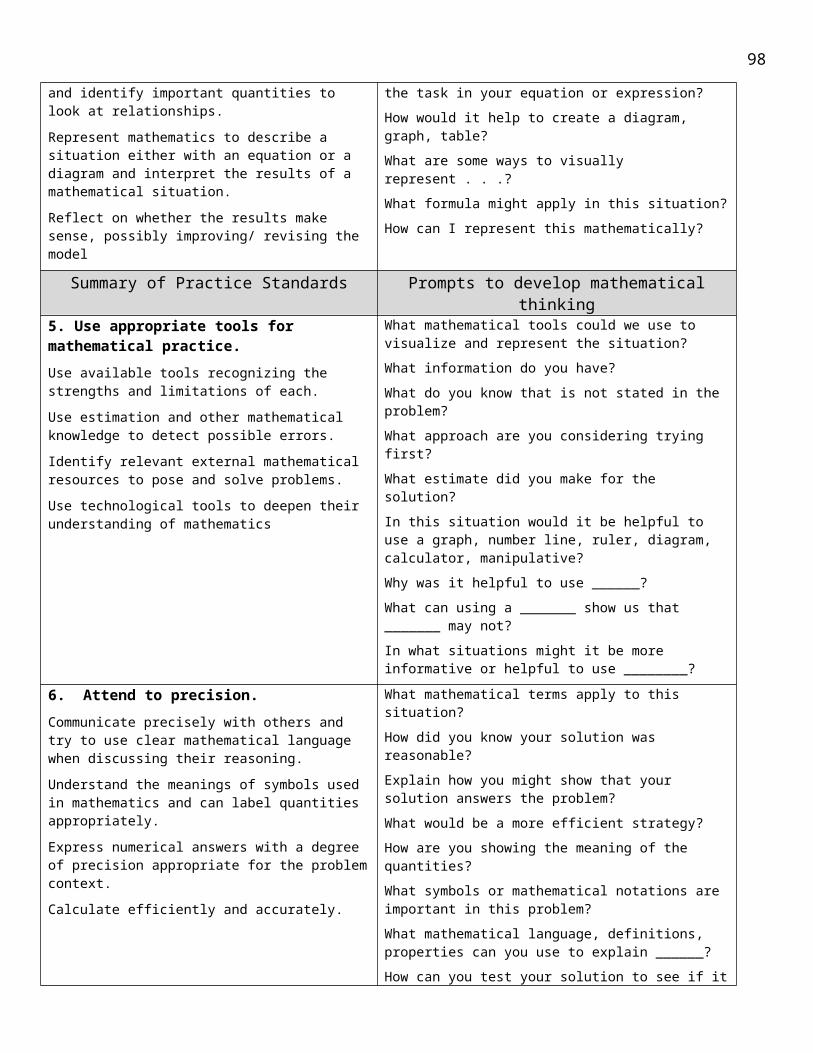
Unit 8 (7 days) Circles SM2–PHS Q3
# Days Sec. # Title of SectionUtah CORE Standard
Learning Targets Notes
3 11.1 Circles and circumference 6.G.C.16.G.C.36.G.C.5
I can identify parts of circles (radius, diameter, chord, inscribed angles, tangent)
I can find the circumference of a circle I can find the area of a circle I can find the area of sectors of circles I can identify central angles, major arcs, minor arcs
and semicircles I can find arc length I can find the measures of inscribed angles I can find the measures of angles of an inscribed
quadrilateral I can use properties of tangent lines I can solve problems involving inscribed polygons
11.9 Areas of circles and sectors
11.2 Measuring angles and arcs 6.G.C. 26.G.C. 311.4 Inscribed angles
11.3 Arcs and chords 6.G.C.211.5 Tangents 6.G.C.411.5 lab Inscribed and circumscribed
circles6.G.C.3
Given polygon, construct circumscribed and inscribed circle
11.9 Areas of circles and sectors 6.G.C.21 11.8 Equations of circles
6.G.GPE.13.A.REI.7 (7)5.G.GPE.6 (4)
I can write the equation of a circle I can graph a circle on a coordinate plane Given the graph of a circle, I can write the equation of
the circle Given the endpoints of a diameter, I can write the
equation of the circle
G.GPE.6 pg 780 challenge questions 48 and 49
1 11.8 lab Parabolas, solve systems of equations involving lines, circles and quadratics
6.G.GPE.23.A.REI.7 (7)
I can solve a system of equations involving circles, quadratics, and linear functions
1 Review1 Test
104
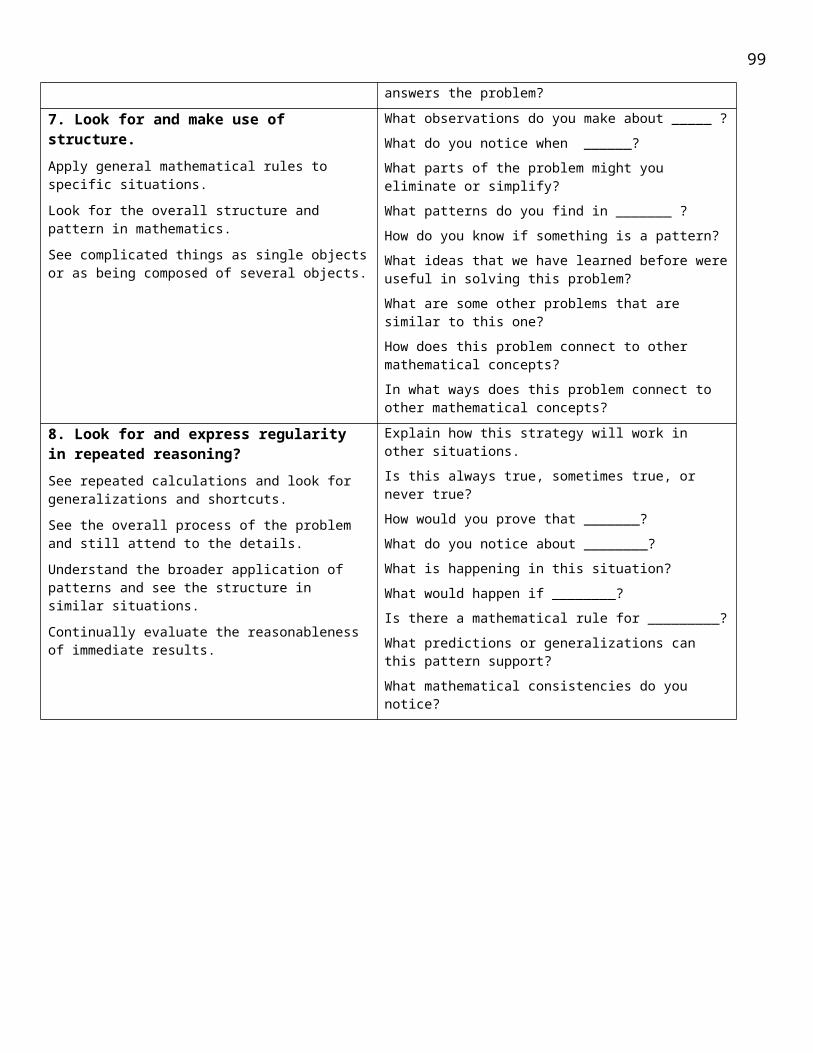
Unit 9 (5days) Volume and surface area SM2–PHS Q4
# Days Sec. # Title of SectionUtah CORE Standard
Learning Targets Notes
1 12.4 Volumes and surface area of prisms and cylinders
H.6.G.GMD.26.G.GMD.3
I can find the volume of a prism and cylinder I can find the surface area of prisms and cylinders
1 12.5 Volumes of Pyramids and cones 6.G.GMD.36.G.GMD.1
I can find the volume of a pyramid and cone I can manipulate the formulas for volume and
surface area of 3d objects
1 12.6 Surface areas and volumes of spheres 6.G.GMD.3
I can find the volume of a sphere I can find the surface area of a sphere
1 Review
1 Test
105
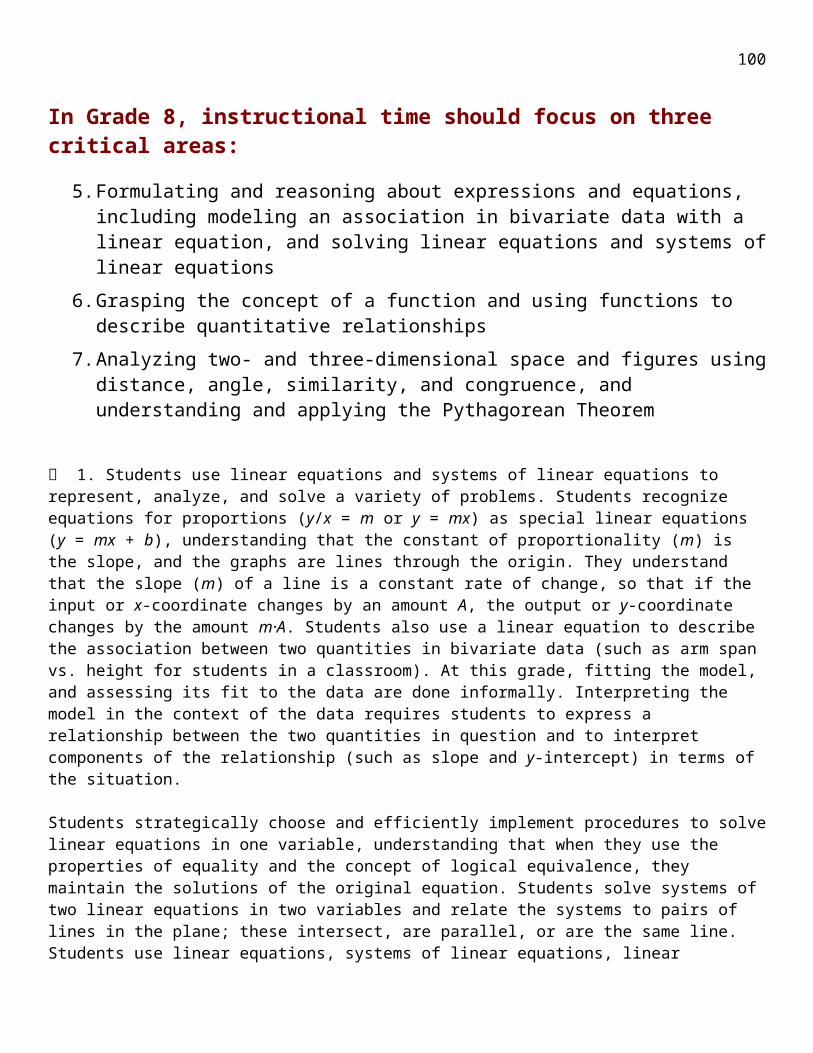
Unit 10 (5days) Circles SM2–PHS Q4
# Days Sec. # Title of SectionUtah CORE Standard
Learning Targets Notes
1 13.1 Representing sample spaces
4.S.CP.1 (1)
I can use lists, tables, and tree diagrams to represent sample spaces
I can use the Fundamental Counting principle to count outcomes
I can identify an event as a subset of a sample space1 13.5
13.5 labProbabilities of independent and depended events
4.S.CP.5 (1)
I can find the probabilities of two independent events
I can find probabilities of two dependent events I can find conditional probabilities I can use probability trees to calculate probabilities I can use two-way frequency tables to find
probabilities1 13.6 Probabilities of mutually exclusive
events4.S.CP.7 (2)
I can find probabilities of events that are mutually exclusive
I can find probabilities of events that are not mutually exclusive
I can use Venn diagrams to help find probabilities I can find probabilities of complements
1 Review
1 Test
Beginning of PHS Courses
Back to Table of Contents
106
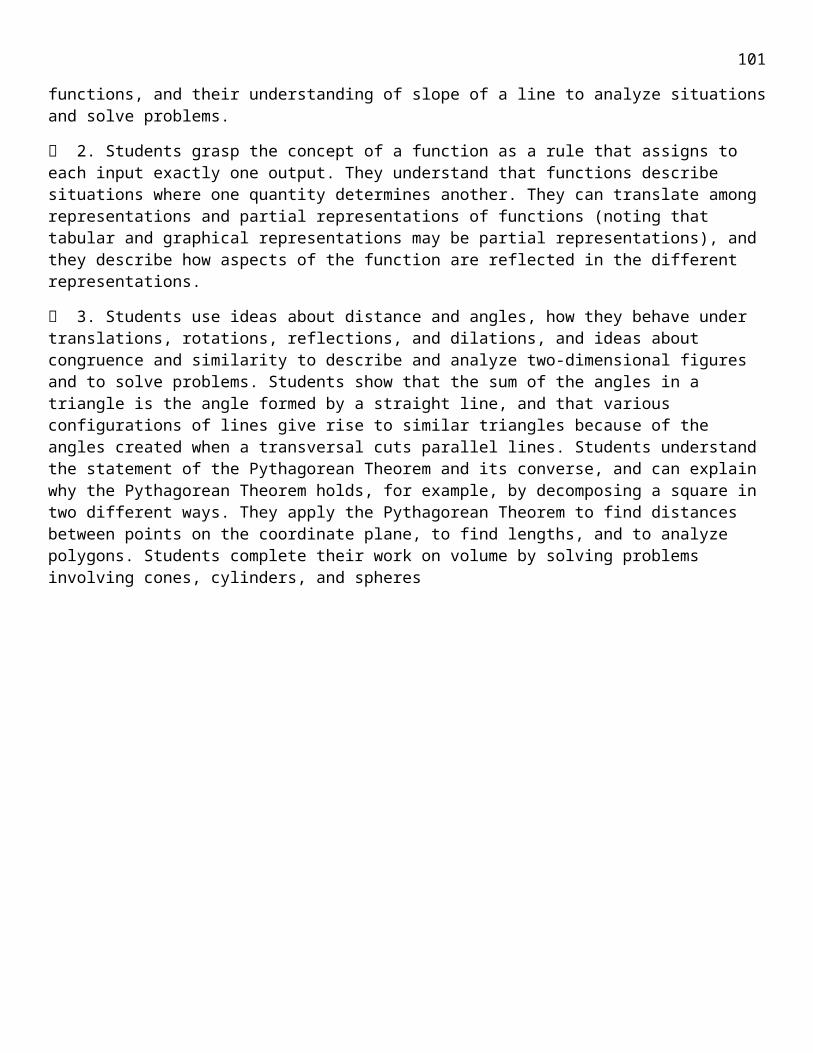
Secondary Math 3 OutlineCorrelated to Math 3 Book from McGraw-HillUnit 1 (9 days) Relations and functions SM3–PHS Q1
# Days
Sec. # Title of SectionUtah CORE Standard
Learning Targets Notes
1 2.4 Writing linear relations and functions
4.A.CED.1
I can write the equation of a line given the slope and y-intercept or points on the line
I can identify slope/rate of change, y-intercept/initial amount, or two points from a context
I can write a linear function given a context
Emphasize application problems and modeling
1 2.1 Relations and functions4.F.IF.5
I can write the definition of a function I can identify the domain and range of a function from a graph I can identify the domain and range of a function from context
Basic review of domain to build for rest of course
1 2.2 Linear relations and functions
4.F.IF.4
I can find the intercepts of a function given a graph I can identify the intervals where a function is increasing,
decreasing or constant given a graph In can identify the intervals where a function is positive or
negative given a graph or a table I can identify the maximum and minimum values of a function
given a graph or a table
Intercepts
1 2.3 Rate of change and slope4.F.IF.6
I can find the average rate of change of any function from a graph, from two points or from context
Supplement with average rate of change over a given interval
1 2.6 Parent functions and transformations
4.F.IF.7
I can graph the parent functions of linear, quadratic, cubic and absolute value functions
I can use horizontal and vertical shifts to graph transformations of parent functions
I can use vertical stretches and compressions and reflections to graph transformations of parent functions
I can write the equations of any transformed linear, quadratic, cubic and absolute value functions
Piecewise, step and absolute value
1 2.5 Special functions4.F.BF.3
I can graph a piecewise function I can write a piecewise function given a graph I can evaluate a piecewise function I can graph a step function given an equation or given a context
1 Review1 Test
Correlated to Math 3 Book from McGraw-Hill
107
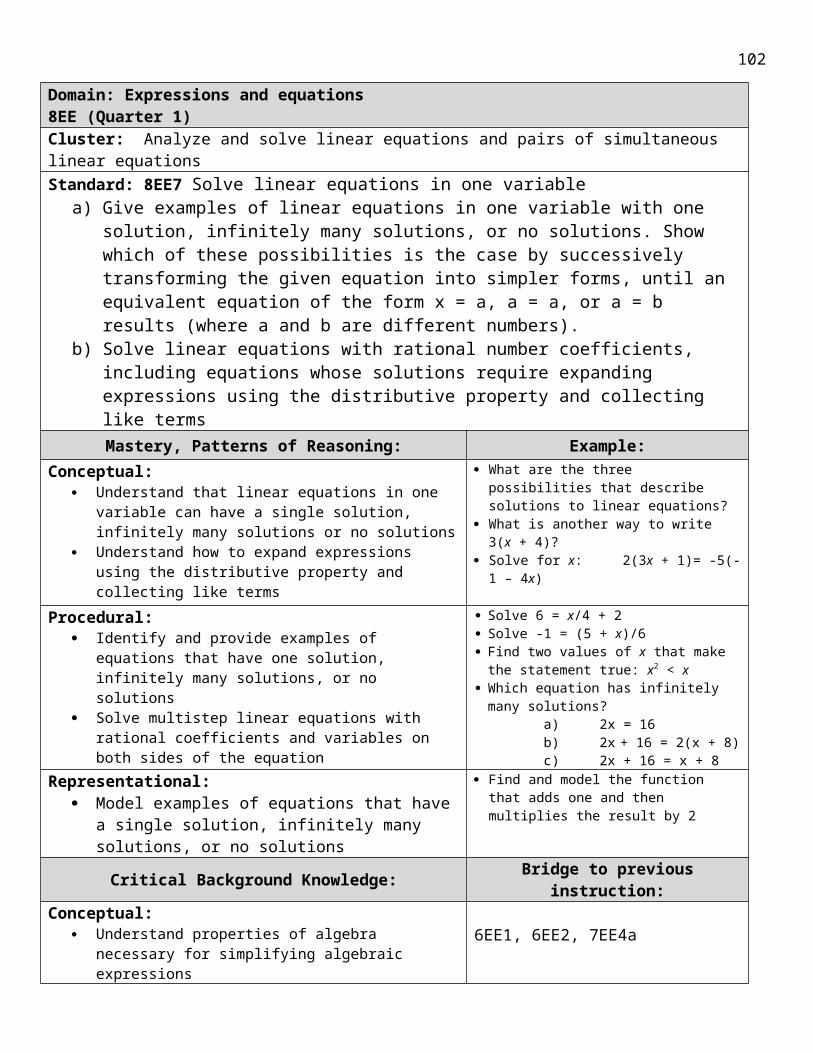
Unit 2 (6 days) Operations with polynomials SM3–PHS Q1#
DaysSec. # Title of Section
Utah CORE Standard
Learning Targets Notes
1 4.2 Dividing polynomials 2.A.APR.6 I can divide polynomials
1 4.3 4.4 Polynomial functions/analyzing graphs of polynomial functions
2.F.IF.42.F.IF.7
I can define a polynomial function I can identify the degree, leading coefficient, and the constant of a
polynomial I can determine if a polynomial is a monomial, binomial or trinomial I can determine the end behavior of a polynomial function I can find the zeros of a polynomial function I can graph a possible function given its zeros and end behavior
1 4.1 Operations with polynomials
2.A.APR.1 I can add and subtract polynomials I can multiply two or more polynomials
1 4.2 4.6 4.7
Dividing polynomials 2.F.IF.42.F.IF.7
2.A.APR.6
I can divide polynomials using synthetic division I can divide polynomials using long division
1 Review
1 Test
108
Unit 3 (6 days) Polynomials SM3–PHS Q1#
DaysSec. # Title of Section
Utah CORE Standard
Learning Targets Notes
1 4.5 Solving polynomial equations
2.A.CED.1
I can factor simple quadratic expressions of the form x2 + bx + c I can factor complex quadratic expression of the form ax2 + bx + c I can factor complex quadratic expression of the form ax2 + bx + c by
regrouping I can factor complex quadratic expression of the form ax2 + bx + c by
substitution I can factor expressions of the form a2 – b2 using the difference of
squares I can factor the sum and difference of cubes I can reason through expansion of the sum and difference of cubes I can use factoring to solve a polynomial
1 4.5 lab Polynomial identities 2.A.APR.4 I can find polynomial identities
1 4.6 The Remainder and Factor Theorem
2.A.APR.22.A.APR.3
2.F.IF.7
I can apply the Remainder Theorem I can apply the Factor Theorem
1 4.7 4.8 Roots and Zeros 2.A.APR.32.N.VN.8(+)2.N.VN.9(+)
I can use the Rational Root Theorem to find all possible zeros of a polynomial
I can use the Fundamental Theorem of Algebra to state the number of complex roots a polynomial has
1 Review
1 Test
109
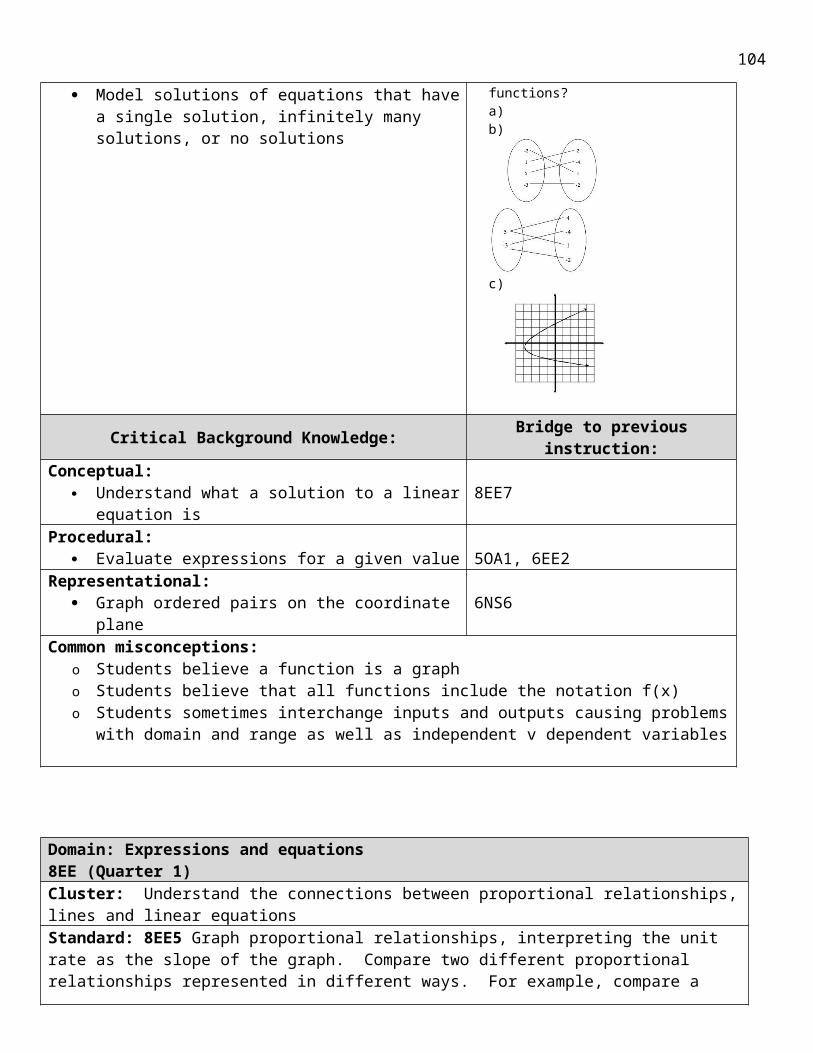
Unit 4 (9 days) Functions SM3–PHS Q2#
DaysSec. # Title of Section
Utah CORE Standard
Learning Targets Notes
1 5.1 Operations on functions (composition is honors)
4.F.IF.94.F.BF.1c
I can use function notation to perform operations on polynomials I can evaluate the composition of functions
1 5.2 Inverse functions and relations (verifying with composition in honors)
4.F.BF.4a
I can find the inverse of a function given an equation I can find the inverse of a function given a table or graph I can verify that two functions are inverses using composition
Find inverse functions and graph
1 5.3 Square root functions and inequalities
4.F.IF.64.F.BF.3
I can graph a square root function (use parent function and transformations)
I can find the domain and range of a square root function1 5.4 Nth roots
2.A.SSE.2
I can simplify an nth root radical
1 5.5 Operations with radical expressions
I can add and subtract radical expressions I can multiply two radical expressions I can divide two radical expressions I can use conjugates to rationalize a denominator
1 5.6 Rational exponents In SM2 core I can apply properties of exponents to rational exponential expressions I can convert between rational exponents and radicals
Need to cover again here
1 5.7 Solving radical equations and inequalities
2.A.SSE.2
I can solve an equation with radicals on one side I can solve an equation with radicals on both sides I can solve an equation with rational exponents I can give examples showing how extraneous solutions arise
1 Review
1 Test
110

Unit 5 (7 days) Logarithms SM3–PHS Q2#
DaysSec. # Title of Section
Utah CORE Standard
Learning Targets Notes
1 6.1 Logarithms and logarithmic functions
4.F.LE.4
I can write an exponential function in logarithmic form I can use a table to graph an exponential function I can use a table to graph a logarithmic function
1 6.3 Properties of logarithms
I can derive the properties of logarithms from the properties of exponents
I can use properties of logarithms to condense logarithms I can use properties of logarithms to expand logarithms
1 6.46.5
Common logarithms/ base e and natural logarithms
I can identify what a common logarithm is I can do operations on common logarithms I can identify what a natural logarithm is I can do operations on natural logarithms
1 6.2 Solving logarithmic equations and inequalities
I can identify appropriate methods to solve logarithmic equations Methods:– by converting to exponential form– by condensing an expression– by taking a log of both sides– by changing the bases
1 6.6 Using exponential and logarithmic functions
I can write an exponential equation from context I can write a logarithmic equation from context I can determine whether to solve using exponential or logarithmic form
depending on the unknown
1 Review1 Test
111
Unit 6 (7 days) Rational expressions, equations, and inequalities SM3–PHS Q2#
DaysSec. # Title of Section
Utah CORE Standard
Learning Targets Notes
1 7.1 Multiplying and dividing rational expressions
2.A.APR.62.A.APR.7+
I can write an exponential function in logarithmic form I can use a table to graph an exponential function I can use a table to graph a logarithmic function
1 7.2 Adding and subtracting rational expressions (not on SAGE)
2.A.APR.7+
I can find the lowest common denominator (LCD) with a monomial I can find the LCD with a polynomial using factoring I can add and subtract rational expressions by creating a LCD I can simplify complex fractions using LCD’s.
1 7.3 Graphing reciprocal functions 2.F.IF.7d
I can graph the parent reciprocal function (hyperbola) I can identify the vertical and horizontal asymptotes of a reciprocal
function I can identify the domain and range of a reciprocal function
1 7.4 Graphing rational functions 2.F.IF.7d
4.A.CED.2
I can look at a rational function and identify the horizontal asymptote I can identify when there is a slant asymptote I can identify points of discontinuity I can use asymptotes and points of discontinuity to graph rational
functions1 7.5 Solving rational
equations and inequalities
2.A.REI.2
I can solve a rational equation by finding common denominators I can solve a rational equation by factoring the denominators I can find the critical points for an inequality I can use test values to find which intervals are solutions to inequalites
1 Review1 Test
112
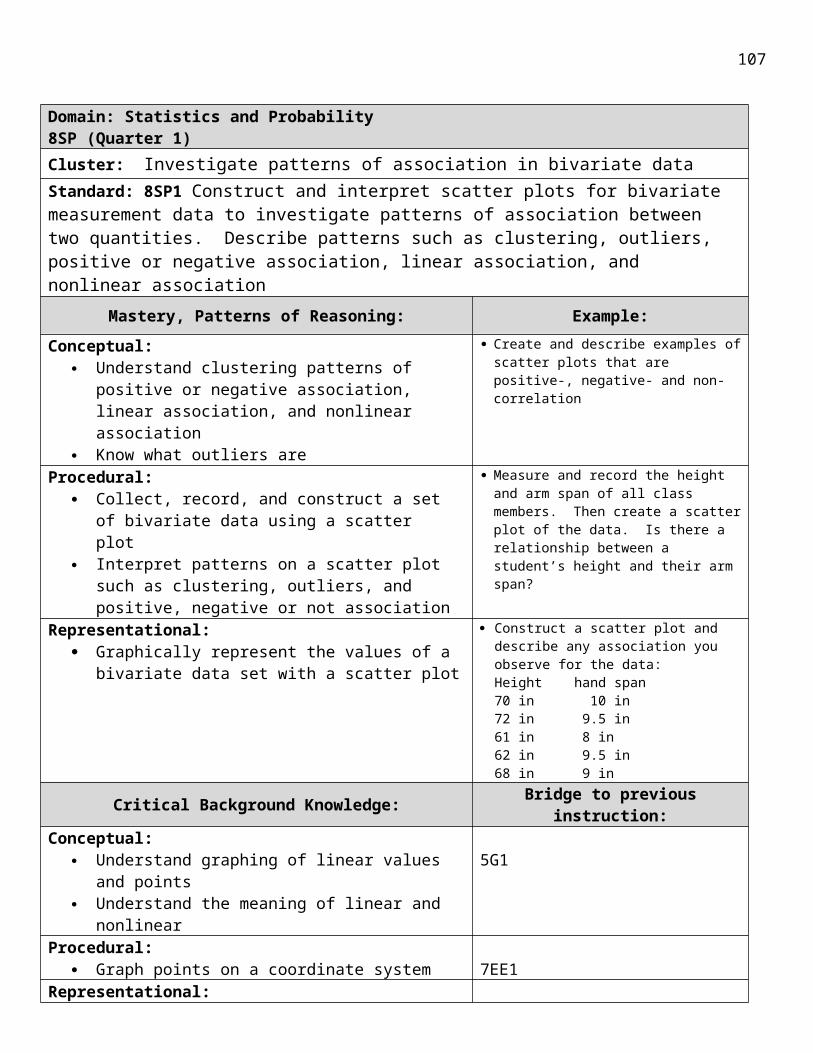
Unit 7 (6 days) Rational equations and expressions SM3–THS Q3#
DaysSec. # Title of Section
Utah CORE Standard
Learning Targets Notes
1 11.1 Trig functions in right triangles
Review
I can evaluate the six trig functions given a right triangle Given one trig ratio, I can use the Pythagorean Theorem to find the five
remaining trig ratios I can use special right triangles to find the trig values for 30˚, 45˚ and 60˚ I can use trig functions to find missing sides of a right triangle I can use inverse trig functions to find missing angles of a right triangle I can use angles of elevation and depression to solve real world
problems1 11.2 Angles and angle
measure 3.F.TF.13.F.TF.2
I can draw positive and negative angles in standard position I can identify the initial side and terminal side of an angle I can find a co-terminal angle to any angle I understand how to measure angles with radians I can use the central angle and the radius to find arc length
1 11.4 Law of sines (not on SAGE)
3.G.SRT.93.G.SRT.103.G.SRT.11
I can find the area of a triangle when given SAS I can use the law of sines to solve triangles
1 11.5 Law of cosines (not on SAGE)
3.G.SRT.103.G.SRT.11
I know when to use the law of cosines to solve triangles I can use the appropriate law to solve triangles
1 Review1 Test
113
Unit 8 (7 days) Rational equations and expressions SM3–THS Q3#
DaysSec. # Title of Section
Utah CORE Standard
Learning Targets Notes
2 11.3 Trig functions of general angles 3.F.TF.2
I can find the exact value of a trig function using the unit circle Given any point on the coordinate plane, I can find the six trig functions Given any angle, I can find its reference angle
1 11.9 Inverse trig functions4.F.BF.4a
I can find the value of an angle by using inverse trig functions on my calculator and using the unit circle
I understand the restrictions on the domain for inverse functions1 11.6
11.7Circular and periodic functions, graphing trig functions
3.F.TF.23.F.TF.5
I can determine the period of a function given a graph I can determine the amplitude and period of sine and cosine functions I know the difference between a sine and cosine graph I can graph sine and cosine functions I can identify the domain and range of sine and cosine functions
Core only covers sine and cosine
1 11.8 Translations of trig graphs 3.F.TF.5
I can identify the amplitude, period, vertical shift, and phase shift of sine and cosine functions
I can use the translations to graph sine and cosine functions I can write the equation of a trig function given the graph
1 Review1 Test
114
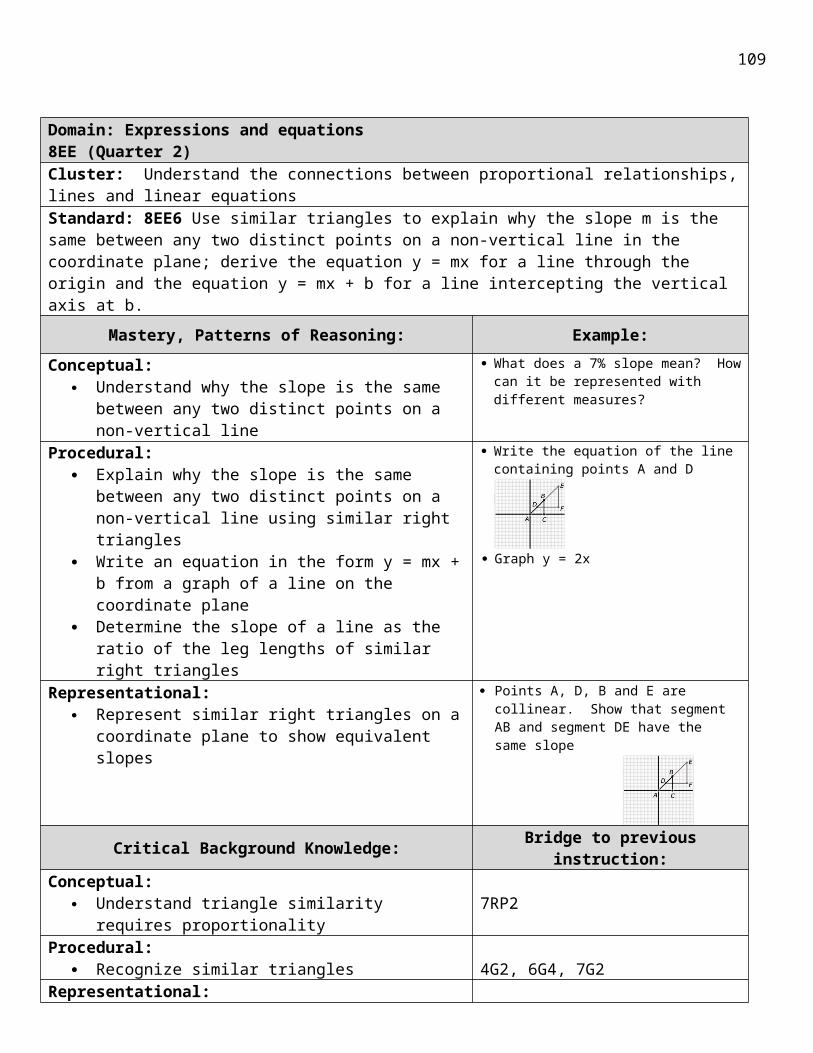
Unit 9 (5 days) Rational equations and expressions SM3–THS Q3#
DaysSec. # Title of Section
Utah CORE Standard
Learning Targets Notes
1 3.1 Solving systems of non-linear equations
4.A.CED.32.A.REI.11
I know what it means to solve a system of equation I can solve a system of equations by graphing I can solve a system of equations by substitution I can solve a system of equations by elimination
Need to include polynomial, rational, absolute value, exponential, and logarithmic functions
1 3.2 Solving systems of inequalities by graphing
I can solve systems of inequalities by graphing I can find the vertices of the polygon formed by a system of inequalities
1 3.3 Optimization with linear programming
4.G.MG.3
Given constraints, I can find the maximum and minimum of a function I can write a system of inequalities to model real-world situations and
use it to find the maximum and/or minimum
Very weak- need to supplement with geometric optimization problems
1 Review1 Test
115
Unit 10 (5 days) Sequences and Series SM3–PHS Q4#
DaysSec. # Title of Section
Utah CORE Standard
Learning Targets Notes
1 9.2 Arithmetic sequence and series
2.A.SSE.4
I can write an equation for the nth term of an arithmetic sequence I can find a specific term in an arithmetic sequence I can find the partial sum of an arithmetic sequence I understand sigma notation and can find the sum given sigma notation
Maybe teach arithmetic sequence and series one day and geometric sequence and series the next
1 9.3 Geometric sequence and series
I can write an equation for the nth term of a geometric sequence I can find the specific term in a geometric sequence I can find the partial sum of a geometric sequence I can find the sum of a geometric sequence written in sigma notation
2 15.1 Representations of 3-D figures – do cross sections, solids of revolutions and density
4.G.GMD.44.G.MG.24.G.MG.3
I can identify the shapes of 2-D cross sections of 3-D objects I can identify 3-D objects generated by the rotation of 2-D objects I can apply geometric concepts in modeling situations I can apply geometric methods to solve design problems
Requires heavy supplement
1 Review1 Test
116
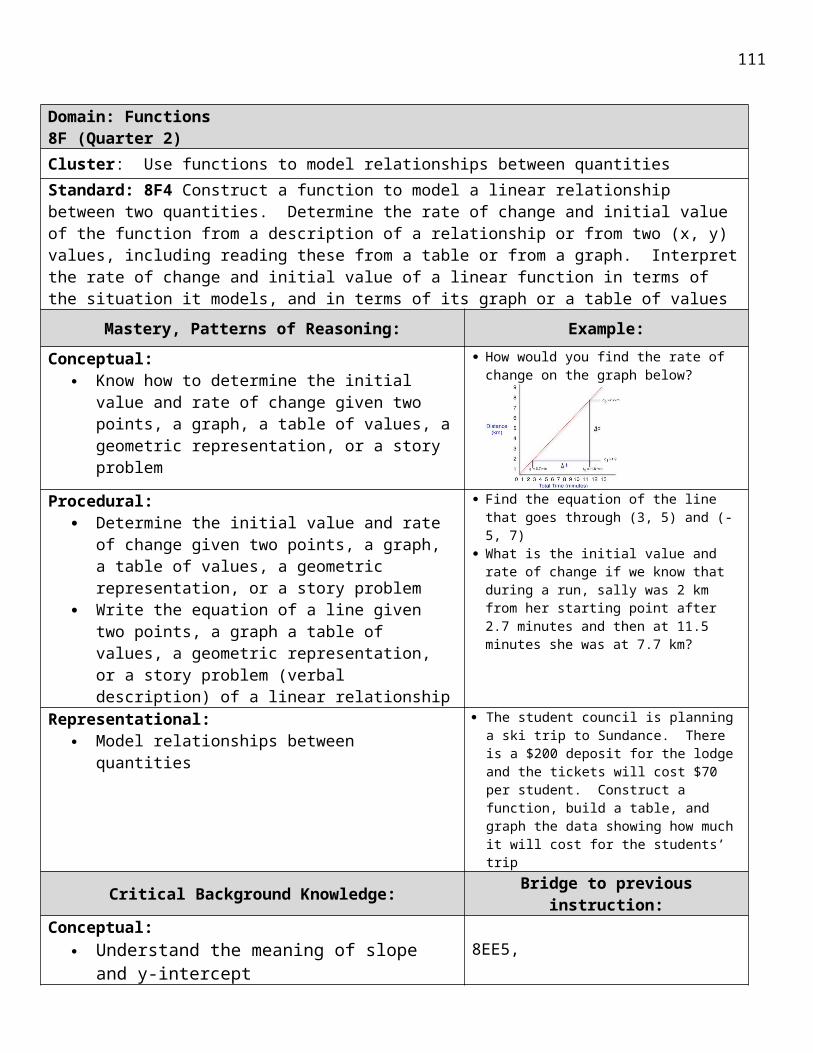
Unit 11 (10 days) Sequences and Series SM3–PHS Q4#
DaysSec. # Title of Section
Utah CORE Standard
Learning Targets Notes
1 10.1 Designing a study
1.S.IC.11.S.IC.3
I can give examples of a population and applicable parameters I can give examples of a sample and applicable statistics I can define what standard deviation measures I can determine whether a study can conclude causation I can determine whether a study can make valid inferences to a
population
Weak on population, sample, SRS vs convenience or voluntary sample – infer results for population, random number generator
1 10.2 Distributions of data1.S.IC.1
I can define a distribution I can calculate means and medians I can calculate the standard deviation I can calculate the five-number summary
2 10.5 The normal distribution
1.S.ID.4
I can define the law of large numbers I can define the standard normal distribution (mean of 0 and
standard deviation of 1) I can define a standardized score (z-score) I can calculate a standardized score I can use Table A to find probabilities
2 10.610.1 ext
Confidence intervals and hypothesis testing/simulations and margin of error
1.S.IC.11.S.IC.41.S.IC.5
I can find define margin of error I can calculate margin of error
Weak on statistical significance
1 10.6 Hypothesis testing 1.S.IC.41.S.IC.5
I can write a null and alternative hypothesis I can define a p-value I can find a p-value using Table A I can use the p-value to determine whether to reject or fail to
reject H0
I can design and conduct simulations
10.7 Simulations1.S.IC.2
1 Critical analysis of existing studies
1.S.IC.6 I can determine an expected value (on SAGE) Requires supplement
1 Review1 Test
Beginning of PHS Courses
Back to Table of Contents
117
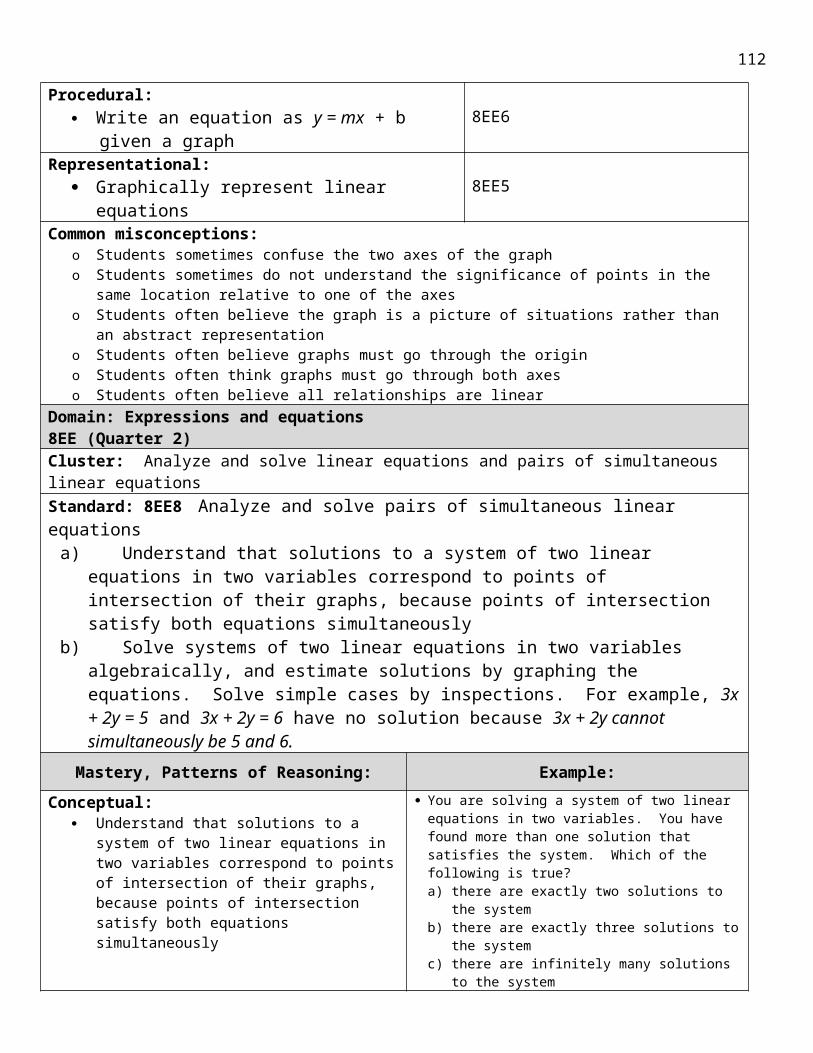
Secondary Math coursesTimpview High School
118
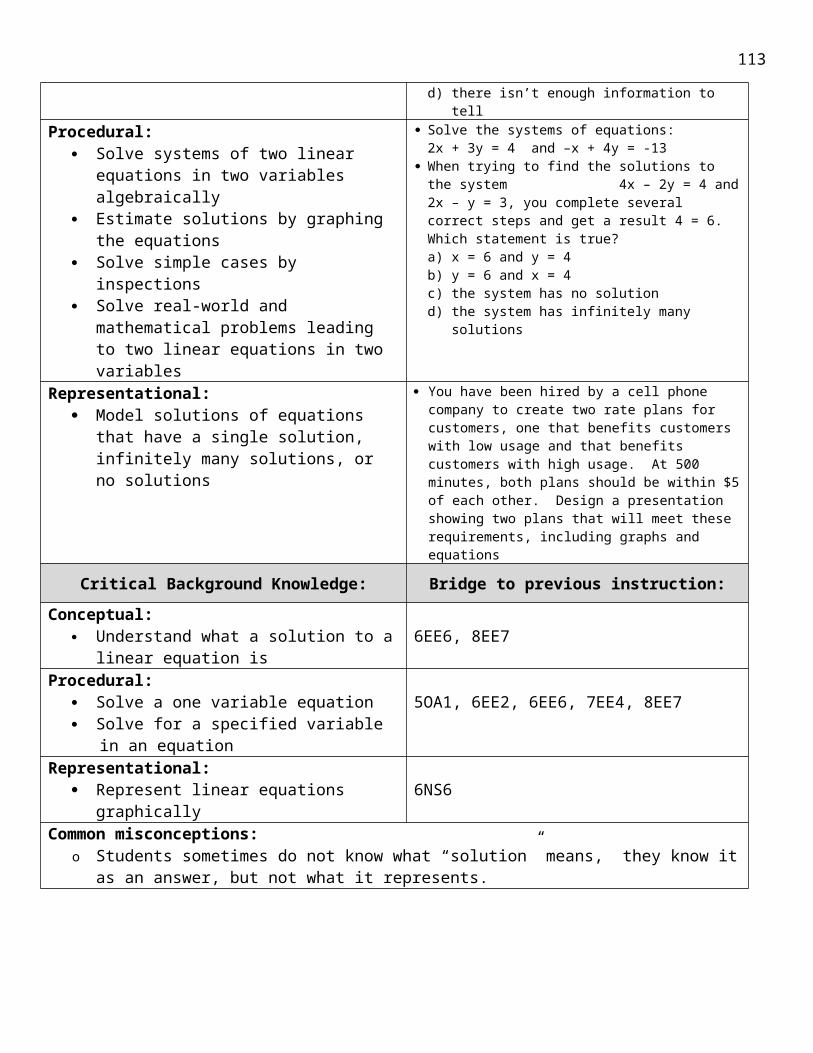
Secondary Math 1 OutlineCorrelated to Math 1 Book from McGraw-Hill
Unit 1 (6 days) Variables and Expressions SM1–THS Q1
# Days Sec. # Title of SectionUtah CORE Standard
Learning Targets Notes
1 Introduction
1 Adding, subtracting, multiply, divide integers and exponential properties (numerical)
I can add, subtract, multiply, and divide integers
I can apply properties of integer exponents
1 1.1 Variables and expressions
1.A.SSE.1(2)
I can identify the constants, variables, and coefficients in algebraic expressions
I can write an algebraic expression as a verbal expression
I can write a verbal expression as an algebraic expression
I can evaluate expressions using substitution
Needs supplemental worksheet
1.2 Order of operations I can evaluate numerical expressions using order of operations
1 1.3 Properties of numbers I can identify the properties of number I can use the properties of numbers
1.4 The distributive property I can use the distributive property correctly
I can simplify algebraic expressions1 Review
1 Test
119

Unit 2 (7 days) Solving Linear Equations SM1–THS Q1
# Days Sec. # Title of SectionUtah CORE Standard
Learning Targets Notes
1 2.1 Writing equations (single variable)
1.A.CED.1(1)1.A.CED.3(1)
I can write verbal equations as algebraic equations
I can write algebraic equations as verbal equations
Need to write from contextual situations
2.2 Solving one-step equations 1.A.CED.1(1)1.A.CED.3(1)
3.A.REO.13.A.REI.13.A.REI.33.A.REI.5
I can solve one-step equations
Solve and interpret in context
1 2.3 Solving multi-step equations I can solve equations involving more than one operation
1 2.4, 2.9 Solving equations with variables on both sides
1.A.CED.3(1)3.A.REI.13.A.REI.33.A.REI.5
I can solve equations with the variable on both sides
1 2.6 Ratios and proportions1.N.Q.2(3)
I can determine if two ratios are equivalent
I can solve proportions1 2.8 Literal equations 1.A.CED.4(1) I can solve an equation for any specified
variable
1 Review
1 Test
120

Unit 3 (8 days) Graphing linear functions SM1–THS Q1
# Days
Sec. # Title of SectionUtah CORE Standard
Learning Targets Notes
1 1.6 1.7
Relations and function notation
2.F.IF.1 (3)2.F.IF.2 (3)
I can identify the x-axis, y-axis, coordinates, and quadrants on a graph
I can interpret graphs given a context Given a relation, I can identify domain, range, and whether it is
a function I understand function notation and can evaluate functions I can write equations using function notation
Supplement: write equations using function notation
1 1.8 Interpreting graphs of functions, relate the domain of a function to its graph, and where applicable, to the quantitative relationship it describes
N.Q.12.F.IF.4 (3)2.F.IF.7 (3)2.F.IF.5 (3)
I can use interval notation correctly Given an graph, I can correctly express the following: domain,
x-intercepts, y-intercept Given a graph I can correctly identify where the graph is
positive, negative, increasing and decreasing Given a graph, I can correctly identify relative maximum and
minimum Given a graph, I can correctly identify end-behavior
Do some interval notation, supplement context relationship with domain
1 3.17.5
Graphing linear equations (using tables), graph simple exponential equations 2.A.REI.10 (1)
1.A.CED.2 (1)2.F.IF.7 (3)
I can graph a linear equation using a table of values I can graph a linear equation by finding intercepts I can evaluate exponential functions I can graph a simple exponential equation using a table values
Supplement: recognizing solutions and non-solutions, supplement for exponential (wiki – 2.2, 2.3)
1 3.3 Slope and rate of change, linear and simple exponential equations, slope is rate of change of secant line
1.N.Q.1 (3)2.F.IF.6.(3)2.F.LE. (5)
I can determine the average rate of change given a table, graph, coordinates, or equation
I can recognize when the rate of change has a value of 0, is undefined, is positive or negative
Supplement for exponential (wiki 2.4, 3.4)
1 3.3 Linear, exponential, interpret parameters in context, compare properties of two functions each represented in a different way
2.F.LE.5 (4)2.F.IF.9 (3)
I can identify the meaning of domain, x- and y-intercepts in context with both linear and exponential functions
I can compare the domain, slope, x- and y-intercepts for two functions represented differently (tables, graphs, equations)
Weak – especially for exponents
1 Compare linear and exponential rates of change, applications
2.F.LE.1 I can compare the rate of change for linear and exponential
functionsUse workbook units 2, 3, 4
Linear v exponential, exp exceeds 2.F.LE.3 (4) I can show an exponential function eventually exceeds linear1 Review
1 Test
121
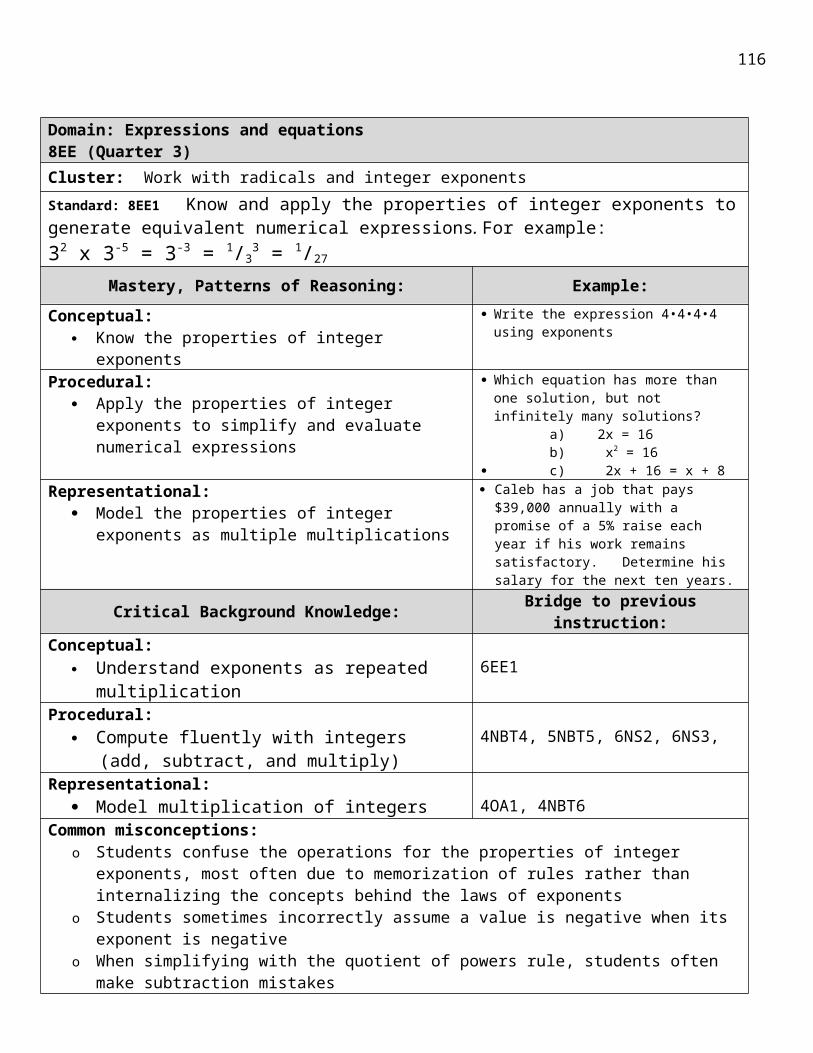
Unit 4 ( 10 days) Graphing and writing equations SM1–THS Q2
# Days Sec. # Title of SectionUtah CORE Standard
Learning Targets Notes
1 4.1 Graphing in slope intercept form1.A.CED.2(1)
I can graph a line when I know the slope and y-intercept I can identify the slope and y-intercept given an equation in
slope-intercept form1 4.1 Writing linear equations from a
graph or table 1.A.CED.2 (1)2.F.IF.7(3)
2.F.LE.2
I can find the slope and y-intercept given a graph of a line I can find the slope and y-intercept given a table I can write the equation of a line when given a graph I can write the equation of a line when given a table
Supplemental worksheet: (Maybe with 4.2) – weak on tables
1 4.2 Writing equations in slope-intercept Form 2.f.IF.7 (3)
I can write an equation of a line in slope-intercept form when given the slope and y-intercept
I can write the equation of a line when given two points1 7.6
3.3Linear, exponential functions given graphs, relationship, table, growth and decay, applications – linear v exponential, write functions and interpret
1.A.CED.2(1)
I can identify exponential growth or decay when given a graph
I can identify exponential growth or decay when given an equation
I can use information to write an exponential equation (growth model, decay model, and compound interest model)
Supplement growth and decay wiki –(text 3.2 revised)
1 4.3 Writing equations in point-slope form
I can write an equation in point-slope form when given a point and slope of the line
I can graph an equation given in point-slope form I can change an equation from point-slope to slope-intercept
form
Not necessary, not in core
1 4.4 Parallel and perpendicular lines 6.G.GPE.5 (1)5.G.CO.1 (1)
I can determine if two lines are parallel by showing their slopes are equal
Given a point and a line, I can write an equation of a line through the point parallel to the given line
I can determine if two lines are perpendicular by showing their slopes are opposite-reciprocals
Given a point and a line, I can write an equation through the point perpendicular to the given line
1 4.5 Scatter plot and line of best fit 4.S.ID.64.S.ID.7
I can identify positive, negative and no correlation in scatterplots
I can draw a line of best-fit to make predictions about data
Could be done with statistics
122
1 4.6 Regression and median-fit lines (on calculator, residuals)
4.S.ID.84.S.ID.94.S.ID.6
I can compute the correlation coefficient using technology I can interpret the correlation coefficient of a linear fit I can describe the difference between correlation and
causation I can plot and analyze residuals of a linear fit to informally
assess the fit of the function
Don’t include median fit lines
1 Review
1 Test
123
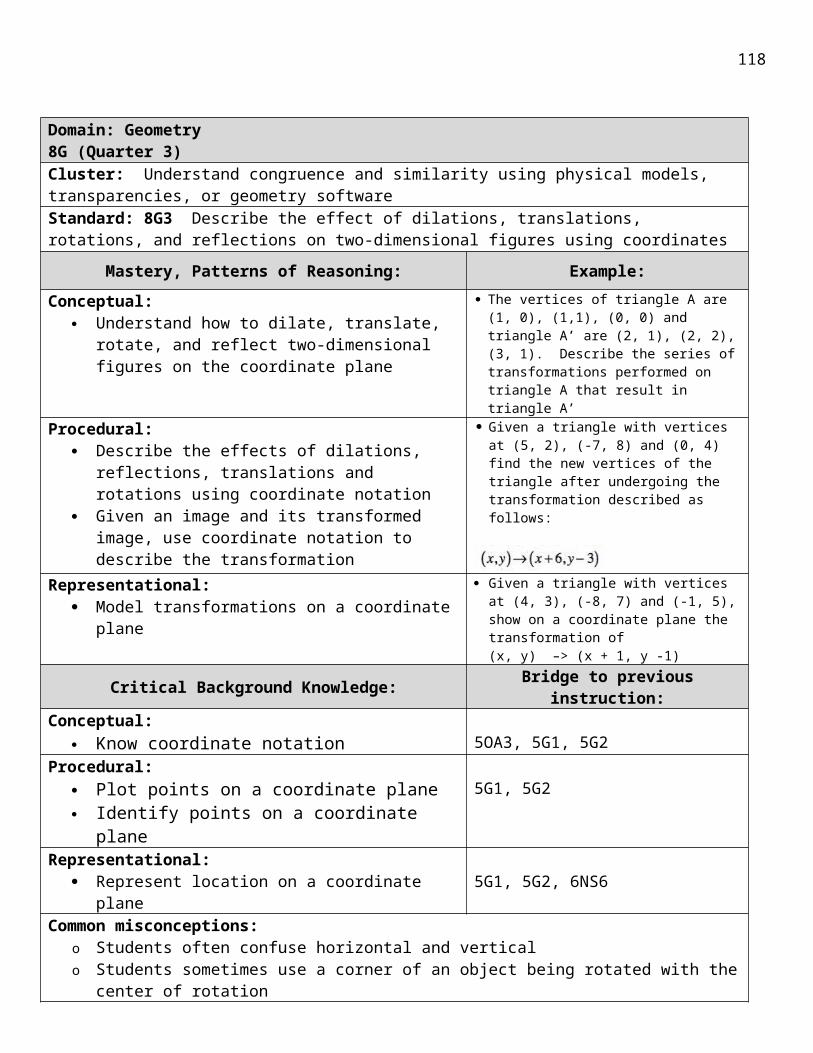
Unit 5 (5 days) Inequalities SM1–THS Q2
# Days Sec. # Title of SectionUtah CORE Standard
Learning Targets Notes
1 5.1 Solving inequalities by addition, subtraction,
1.A.CED.1 (1)1.A.CED.3 (1)
I can solve inequalities by adding and subtracting on both sides of the inequality
5.2 Solving inequalities by multiplication, and division
I can solve inequalities using multiplication and division on both sides of the inequality
I can graph the solution of an inequality on a number line
1 5.3 Solving multi-step inequalities I can solve inequalities using more than one operation
I can use the distributive property in solving linear inequalities
1 5.6 Graphing inequalities in two variables 2.A.REI.12 (1)
I can graph a linear inequality on the coordinate plane
I can solve inequalities by graphing
In context
1 Review
1 Test
124
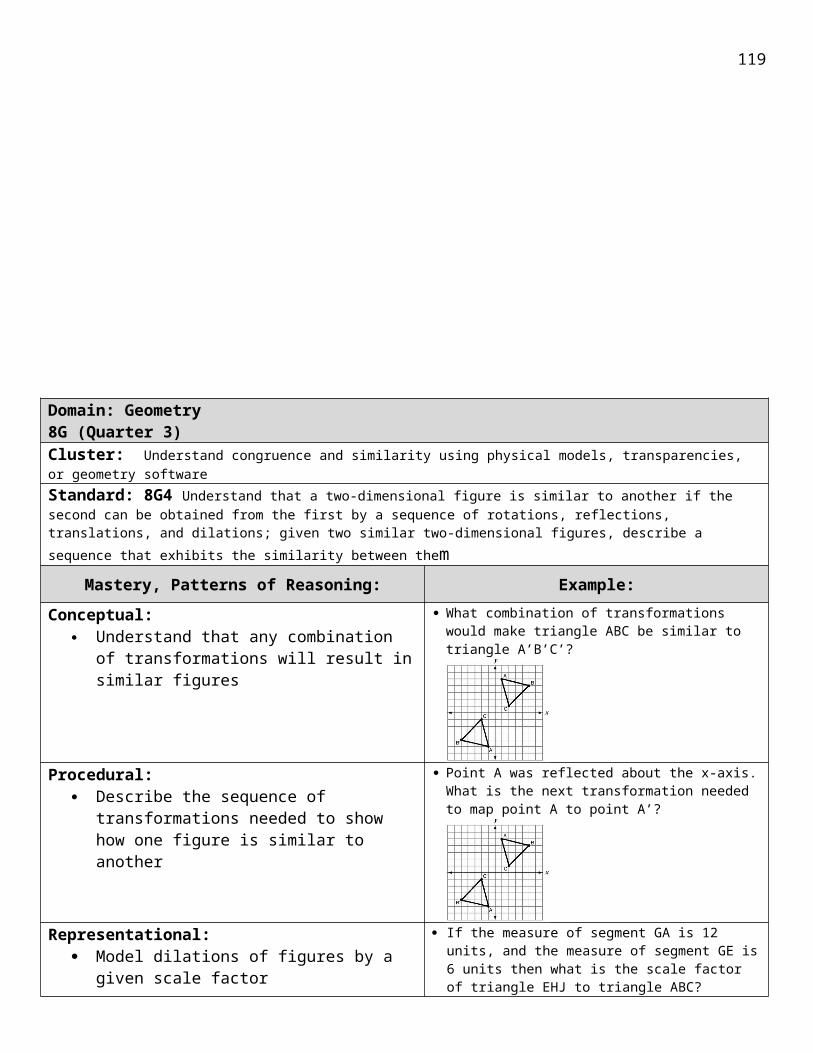
Unit 6 (5 days) Exponential Functions SM1–THS Q2
# Days Sec. # Title of SectionUtah CORE Standard
Learning Targets Notes
1 7.1 Multiplication properties of exponents
I can multiply two powers that have the same base by adding their exponents
I can find the power of a power by multiplying the exponents
I can find the power of a product by raising each factor to the power
I can simplify expressions using properties of exponents1 7.2 Division properties of exponents I can divide monomials using properties of exponents
I can simplify expressions containing negative and zero exponents
1 7.4 Scientific notation I can express numbers written in standard form in scientific notation
I can a number in scientific notation in standard form I can multiply numbers written in scientific notation I can divide numbers written in scientific notation
1 Review
1 Test
125
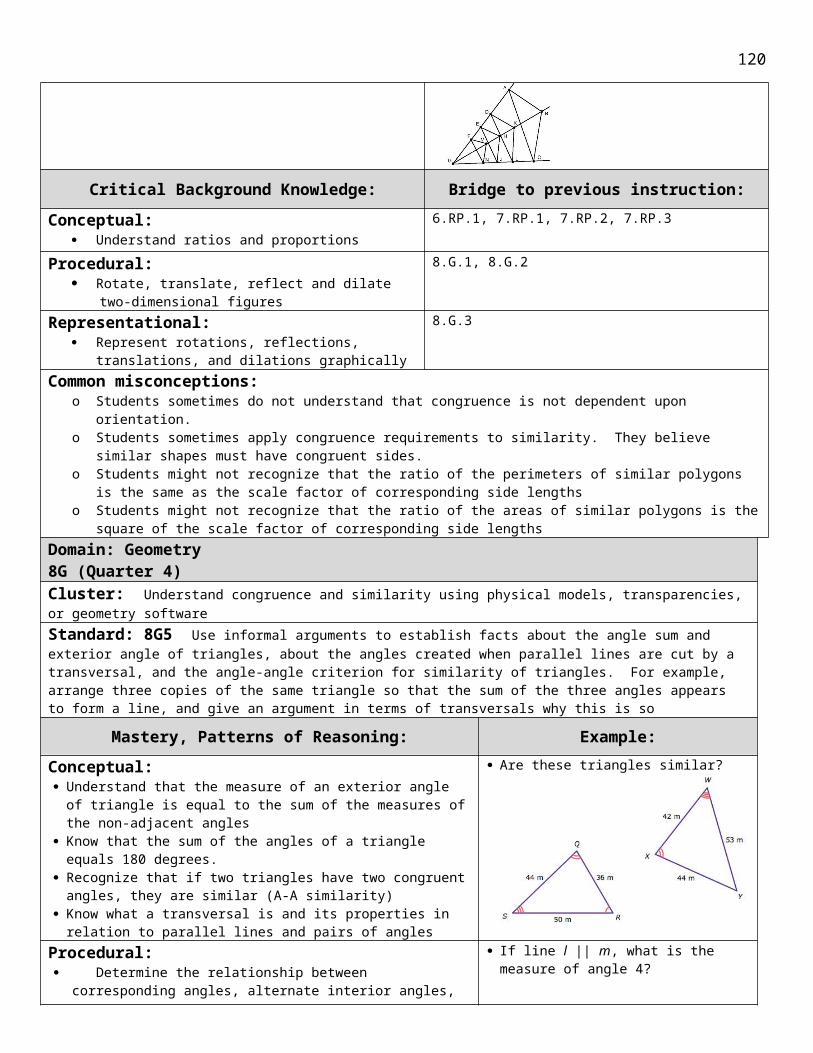
Unit 7 (6 days) Sequences SM1–THS Q3
# Days Sec. # Title of SectionUtah CORE Standard
Learning Targets Notes
1 3.5 Arithmetic sequence2.F.BF.1 (2)2.F.BF,2 (2)2.F.LE.2 (4)2.F.IF.3 (3)
I can recognize arithmetic sequences I can write the nth term of an arithmetic sequence given
the first term and the common difference1 7.7 Geometric sequence I can recognize geometric sequences
I can write the nth term of a geometric sequence given the first term and the common ratio
1 7.8 Recursive formulas 2.F.BF.1 (2)2.F.BF,2 (2)2.F.IF.3 (3)
I can use a recursive formula to list terms in a sequence I can write recursive formulas for arithmetic sequences I can write recursive formulas for geometric sequences
1 Review
1 Test
126
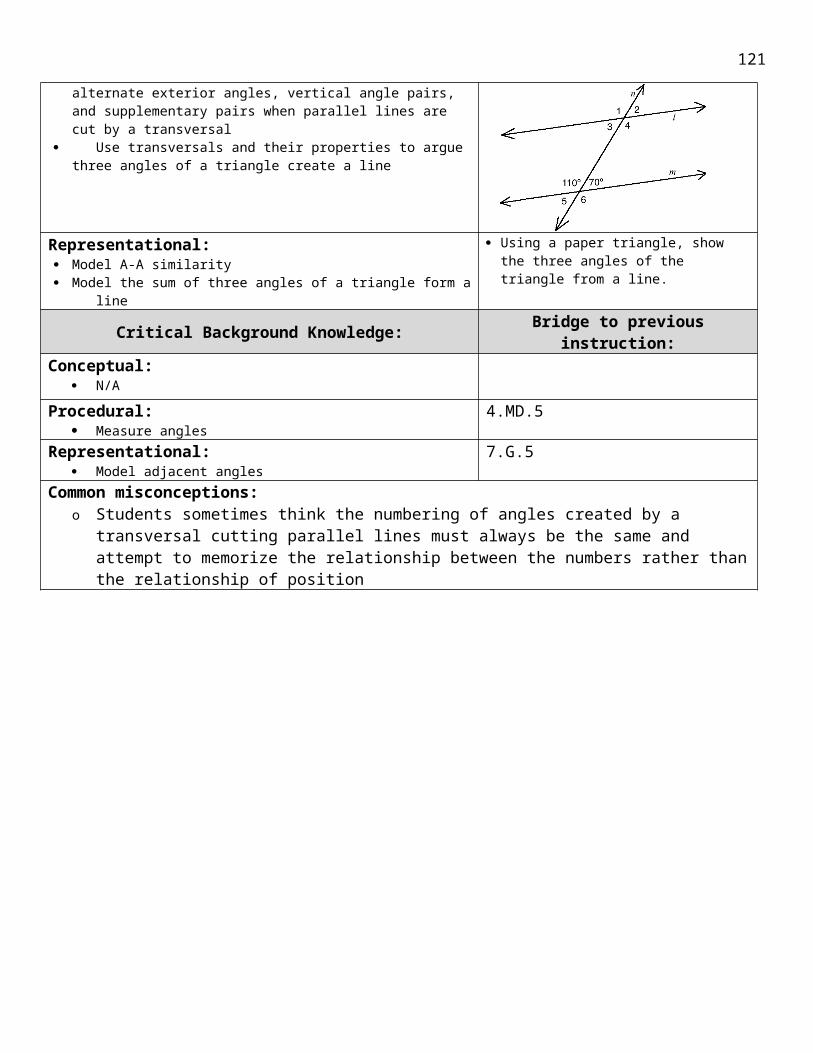
Unit 8 (8 days) Systems of Equations SM1–THS Q3
# Days Sec. # Title of SectionUtah CORE Standard
Learning Targets Notes
1 6.1 Solving systems by graphing, checking whether ordered pairs are solutions. Approximate solutions using tables.
A.REI.6A.REI.11A.REI.12
I can determine the number of solutions of a system of equations by looking at the graph of the system
I can determine if an ordered pair is a solution to a system of equations by evaluating
I can identify a system of equations as consistent or inconsistent and dependent or independent
I can solve a system of equations by graphing
Need to use graphing technology
1 6.2 Solving systems by substitution
3.A.REI.53.A.REI.6
I can solve a system of equations using the substitution method
1 6.3 Solving systems by elimination (no multiplying required)
I can solve a system of equation using the linear combination method (elimination).
1 6.4 Solving systems by elimination (must multiply one or both sides)
I can multiply one or both sides of equations so they are set up to use elimination
I can solve a system of equations using linear combinations method that requires multiplying
1 6.5 Applying systems of linear equations I can solve contextual problems requiring systems of equations
1 6.6 Systems of inequalities A.REI.12A.CED.3
I can solve systems of linear inequalities by graphing I can use systems of inequalities to solve problems in
context1 Review
1 Test
127
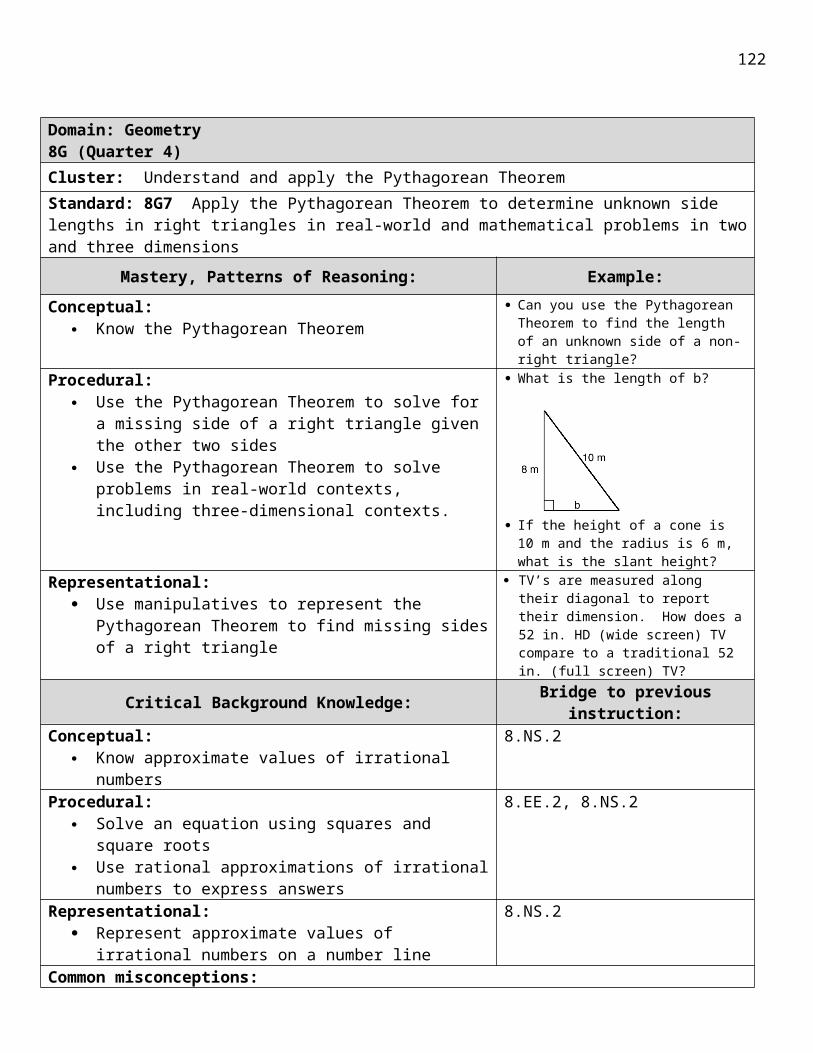
Unit 9 (8 days) Statistics SM1–THS Q4
# Days Sec. # Title of SectionUtah CORE Standard
Learning Targets Notes
1 9 Measures of center, variation and position 4.S.ID.2
4.S.ID.3
I can find measures of central tendency (mean, median and mode) of a given set of numerical data
I can find measures of spread (range, standard deviation, and interquartile range)
1 9 Outliers in data4.S.ID.1
I can identify outliers using interquartile range. I can identify the effects of extreme data points
(outliers) on the mean, median, standard deviation and interquartile range.
1 9.2 9.3 Graphs of data 4.S.ID 1 I can graph data using plots on the real number line (dot plots, histograms, and box-plots
1 9.3 Comparing sets of data
4.S.ID.24.S.ID.3
I can identify which measures of center and spread based on the shape of the data (symmetrical – mean, standard deviation, skewed/outliers- median, interquartile range)
I can determine the relationship of the mean, median and mode from the shape of the data
I can recognize possible associations and trends in the data
I can identify and interpret similarities and differences in shape, center and spread of two data sets.
1 9.3A Two-way frequency tables4.S.ID.24.S.ID.34.S.ID.5
I can summarize categorical data for two categories in two-way frequency tables
I can interpret relative frequencies in the context of the data (including joint, marginal, and conditional relative frequencies).
1 Review
1 Test
128
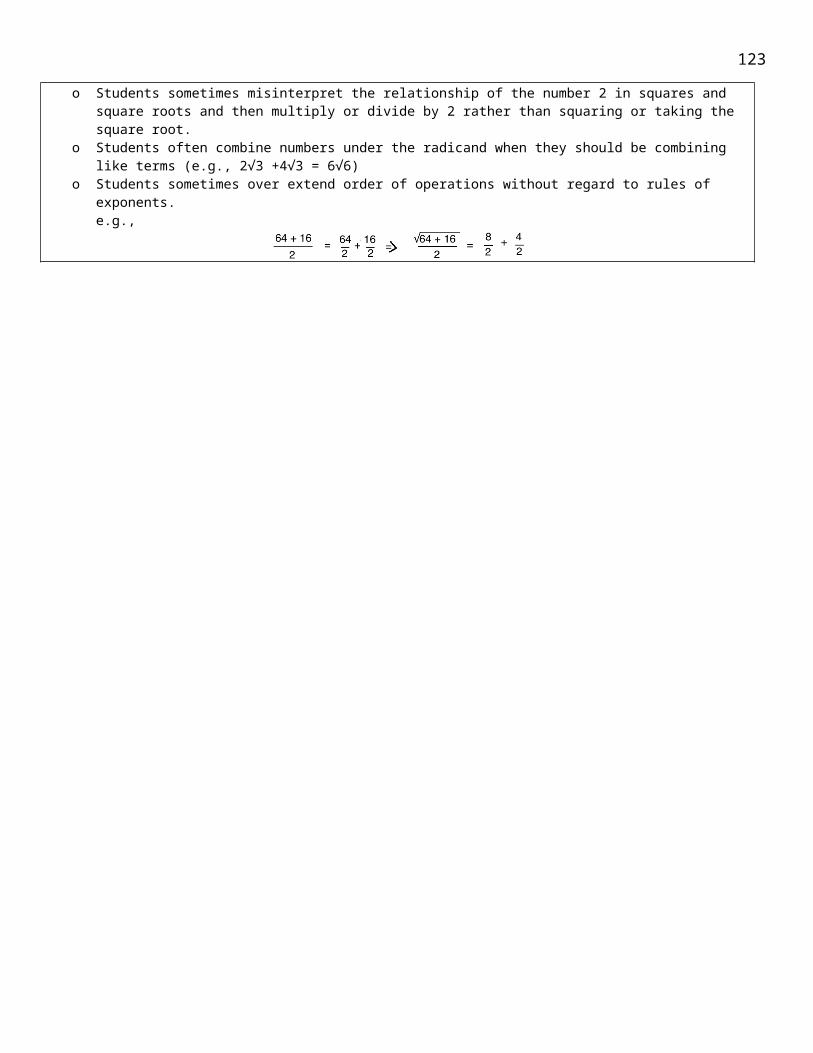
Unit 10 (9 days) Tools of Geometry SM1–THS Q4
# Days Sec. # Title of SectionUtah CORE Standard
Learning Targets Notes
1 10.1 Points, lines and planes
5.G.CO.1 (1)
I can identify points, lines and planes in a figure I can identify parallel and perpendicular lines I can identify the intersection of lines and planes I can identify collinear points and coplanar points and lines
10.2 Construct: copy a segment5.G.CO.12 (1)
I can construct a copy of a segment using a straightedge and compass
Linear Measure5.G.CO.1 (1)
I can measure line segments I can determine if line segments are congruent I can solve problems involving line segments
2 10.3 Distance and midpoints
6.G.GPE.4 (1)6.G.GPE.7 (1)
I can find the distance between two points on a coordinate grid using the distance formula
I can find the midpoint of two points on a coordinate grid using the midpoint formula
I can solve problems using coordinate proof I can solve perimeters of polygons using the distance formula I can find area of triangles and rectangles using the distance
formulaSupp Coordinates to prove theorems with
lines, segments, and angles6.G.GPE.4
I can determine the type of triangle given the three vertices using coordinate proof.
I can show a quadrilateral is a rectangle using coordinate proof (congruent diagonals)
10.3 Bisect a segment5.G.CO.12 (1)
I can bisect a segment using only straightedge and compass and using paper folding.
I can bisect a segment and construct parallel and perpendicular lines using technology
129
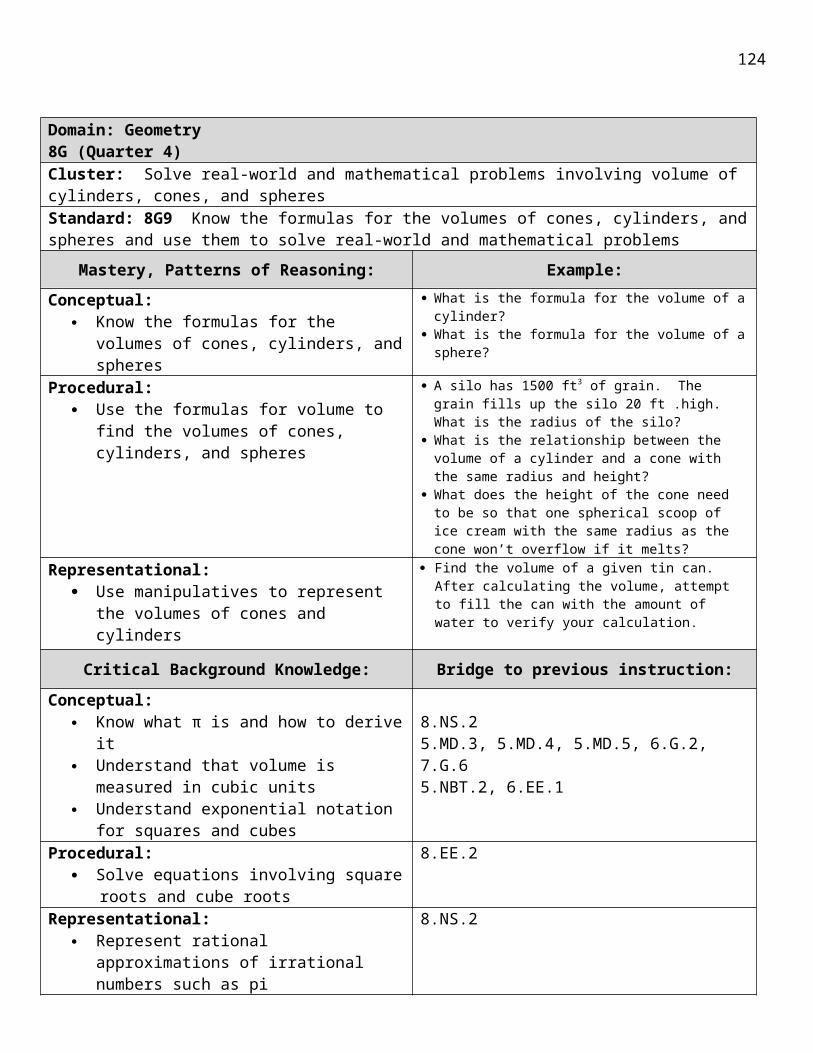
1 10.4 Angle measure5.G.CO.1 (1)
I can measure an angle using degrees on a protractor I can solve problems using angle relationships
Bisect an angle
5.G.CO.12 (1)
I can bisect an angle using only a straight edge and compass, using paper folding and technology
Copy an angle I can measure an angle using degrees on a protractor2 10.5 lab Construct perpendicular lines I can construct perpendicular lines using only a straightedge
and compass, using paper folding, and technologyConstruct perpendicular bisector of a line segment
I can construct perpendicular bisectors using only a straightedge and compass, using paper folding, and technology
11.5 pg 677
Construct a line parallel to a given line through a point on the line
I can construct parallel lines using only a straightedge and compass, using paper folding and technology
workbook Construct equilateral triangle, square, regular hexagon 5.G.CO.13 (1)
I can construct an equilateral triangle, square, and regular hexagon inscribed in a circle using a straightedge and compass and technology
Supplement wiki text, 9-4
10.6 Two-dimensional figures
5.G.CO.1 (1)6.G.GPE.7 (1)
I can find the perimeter and area of a triangle using coordinates
I can find the perimeter and area of a rectangle using coordinates
Supplement using coordinates to find area & perimeter
1 Review1 Test
130
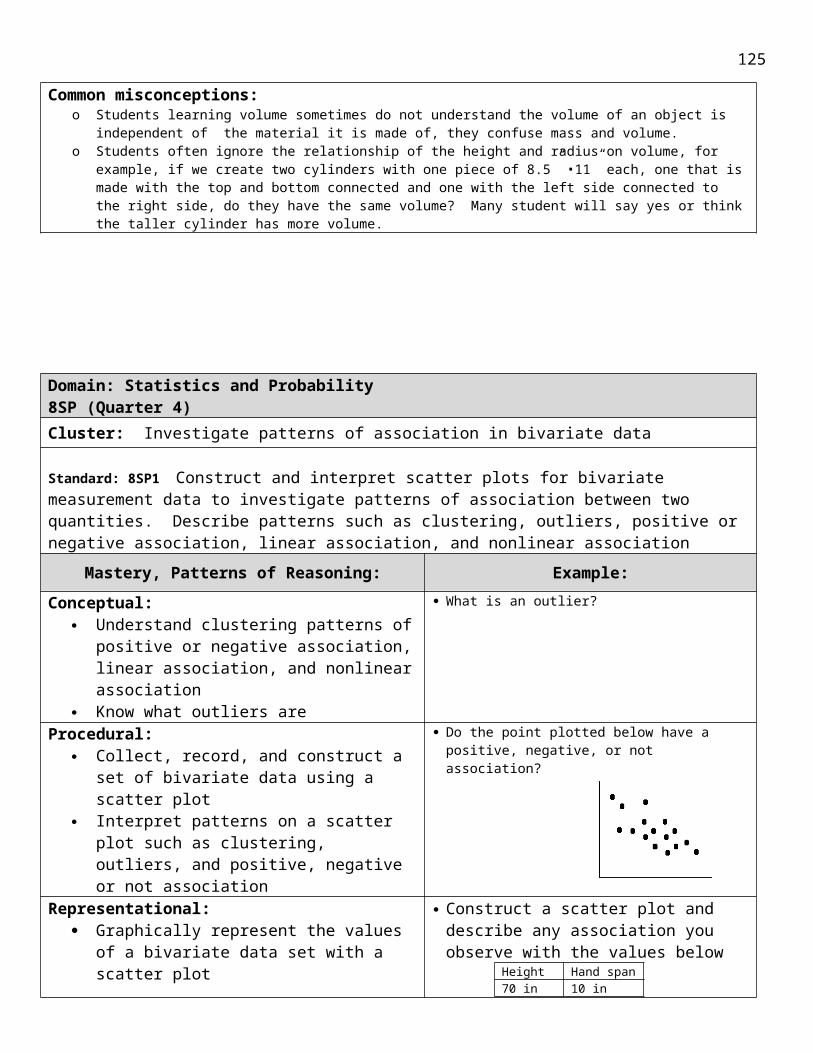
Unit 11 (7 days) Triangle Congruence SM1–THS Q4
# Days Sec. # Title of SectionUtah CORE Standard
Learning Targets Notes
1 12.1 Classifying triangles
5.G.CO.7 (1)
I can classify triangles by their sides I can classify triangles by their angles
Vocabulary review
12.2 Angles of triangles
12.3 Congruent triangles I can find missing angles using the triangle sum theorem I can find missing angles using the linear pair theorem I can find missing angles using vertical angles
Exterior not in core
1 12.4 Proving triangles Congruent SSS, SAS (determine)
5.G.CO.8 (1)
I can write congruence statements for congruent triangles I can determine that parts of congruent triangles are
congruent (CPCTC)1 12.5 Proving triangles Congruent
ASA, AAS (determine) I can show triangles are congruent by SSS and SAS postulates AAS not in core,
construct not in core but supports other construct and triangle properties
1 Review 1 Test
131
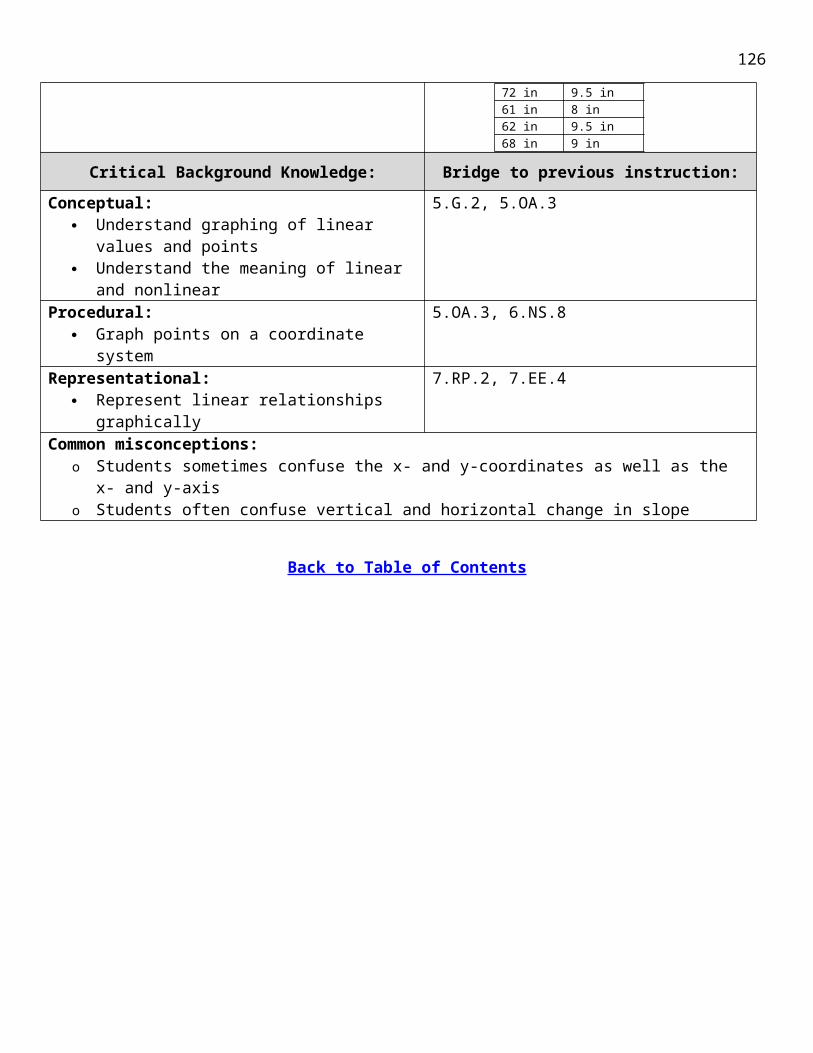
Unit 11 (7 days) Transformations SM1–THS Q4
# Days Sec. # Title of SectionUtah CORE Standard
Learning Targets Notes
1 14.4 12.7
Reflections
5.G.CO.2 (1) 5.G.CO.3 (1) 5.G.CO.4 (1) 5.G.CO.5 (1) 5.G.CO.6 (1)
1 14.5 12.714.7
Translations, compositions of translations
I can compare and contrast rigid and non-rigid transformations I can understand transformations as functions that take points in the
plane as inputs (pre-image) and give other points as outputs (image) I can perform reflections using a variety of methods . . . (paper folding,
use of a grid, perpendicular line segments, technology)1 14.6
12.714.7
Rotations, compositions of transformations
I can perform translations using a variety of methods . . . (use of ordered pair, vectors, reflect over two parallel lines, technology)
1 14.7 Compositions of transformations 5.G.CO.5 (1)
I can perform rotations using a variety of methods . . .(given point, angle and direction, reflect over two intersecting lines, technology)
I can identify the point and angle of rotation when given two intersecting lines.
1 14.8 Symmetry
5.G.CO.3 (1)
I can identify the sequence of transformations that will carry a given figure to another.
I can understand that the composition of transformations is not commutative
I can define rotations, reflections and translations using angles, circles, perpendicular lines, parallel lines, and line segments
1 SAGE Testing I can describe and identify lines and points of symmetry I can describe rotations and reflections which take a rectangle,
parallelogram, trapezoid, or regular polygon onto itself1 SAGE Testing1 Review1 Test
Beginning of Timpview coursesBack to Table of Contents
132
Secondary Math 2 OutlineCorrelated to Math 2 Book from McGraw-HillUnit 1 (7 days) Exponents SM2–THS Q1
# Days Sec. # Title of SectionUtah CORE Standard
Learning Targets
1 Supp Review integer exponent properties
1.N.RN.1 (1)1.N.RN.2 (1)
I can simplify integer exponents
Supp Teach rational exponent properties
I can convert from radical to rational notation I can convert rational notation to radical notation
1 4.3 Simplifying radical expressions1.N.RN.2 (1)
1.N.RN.3
I can simplify large numbers in a radical or any given index I can simplify radical/rational notation I can rewrite an expression with a radical in the denominator
(rationalization)1 4.4 Operations with radical
expressions 1.N.RN.3 (2) I can add and subtract radicals I can multiply radicals
1 3.2 Complex numbers 1.N.CN.1 (3) I can determine the real and imaginary parts of a complex number I can add and subtract complex numbers I can solve radical equations
1 4.5 Radical equations I can solve radical equations
1 Review1 Test
133
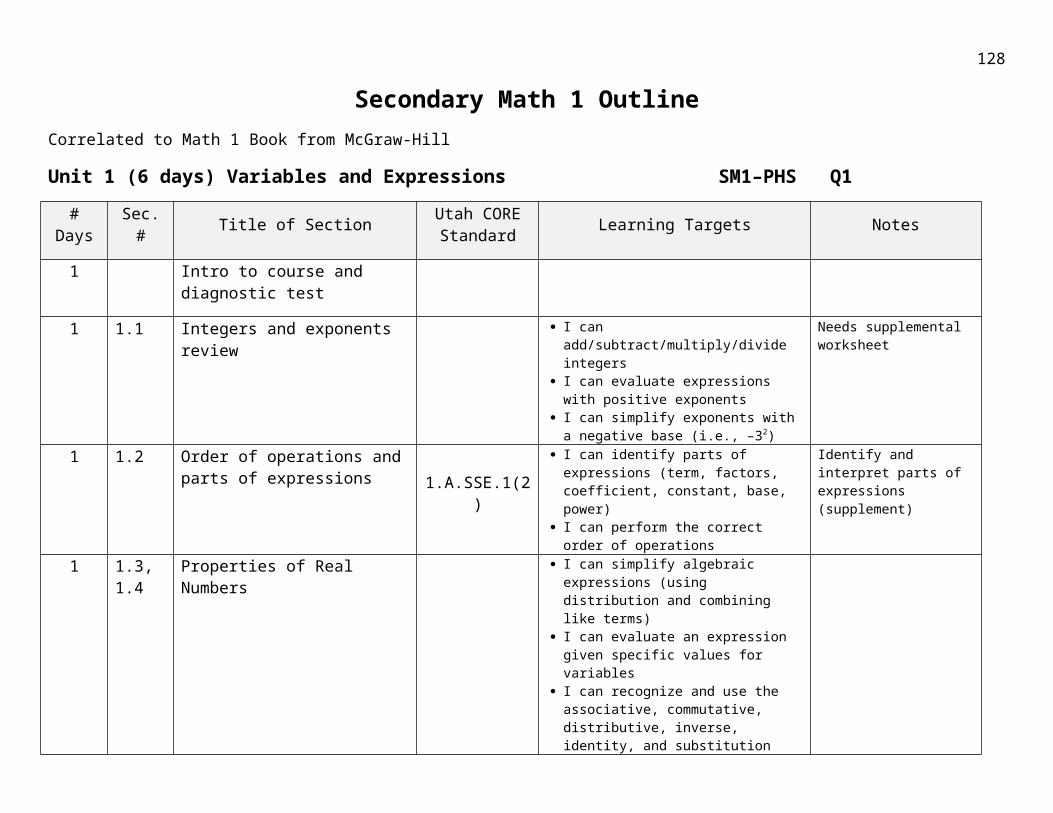
Unit 2 (11 days) Solving quadratics by factoring and graphing SM2–THS Q1
# Days Sec. # Title of SectionUtah CORE Standard
Learning Targets Notes
1 1.1 Adding and subtracting polynomials
1.A.APR.1 (5)3.A.SSE.1 (1)
I can write polynomials in standard form (descending order)
I can identify a term, base, exponent, degree, coefficient, leading coefficient, expression, variable, constant, monomial, binomial, and trinomial
I can add and subtract polynomial expresions
Identify parts of expressions (coefficients degree, etc)
1 1.2 Multiplying a polynomial by a monomial
1.A.APR.1 (5)
I can multiply a monomial by a polynomial using the distributive property
I can multiply a binomial by a binomial using the distributive property
I can multiply a binomial by a trinomial using the distributive property
1.3 Multiplying polynomials
1 1.4 Special products I can find the squares of sums and differences I can find the product of a sum and a difference
1 Review and mini test
1 1.5 Factoring using GCF and grouping1.A.APR.1 (5)
I can factor a GCF from a polynomial I can factor polynomials with 4 terms by grouping
1 1.6 Factoring x2 +bx +c2.F.IF.8
2.F.IF.9 (2)
I can factor a trinomial of the form x2 +bx +c I can factor a trinomial after the GCF is factored out
No solving just emphasize factoring1 1.7 Factoring ax2 +bx +c I can factor ax2 +bx +c by grouping or trial and error
2 1.8 Difference of squares2.F.IF.8
2.F.IF.9 (2)3.A.SSE.2 (1)3.A.SSE.3 (2)
I can recognize and factor differences of squares I can recognize and factor a perfect square trinomial I know when to factor the GCF before factoring a trinomial I can find the constant to complete the square
No solving just emphasize factoring 2.4 # 10-18 type problems
1.9 Perfect squares2.4 Solving quadratic equations by
completing the square
1 Review1 Test
134
Unit 3 (6 days) Quadratics SM2–THS Q1
# Days Sec. # Title of SectionUtah CORE Standard
Learning Targets Notes
1 3.1 Solving quadratic equations by factoring
3.A.REI.4 (4)
I can define zeros, roots, and x-intercepts of a quadratic equation
I can solve quadratic equations by factoring using any method (factor, grouping, difference of squares, perfect square trinomial, and trial and error)
Solve by factoring
1.10 Roots and zeros
1 2.4 Solving quadratic equations by completing the square 3.A.REI.4 (4)
3.A.SSE.3 (2)3.A.CED.4
F.IF.8
I can complete the square to solve a quadratic equation Include literal equations
1 2.5 Solving quadratic equations by the quadratic formula
I can use the quadratic formula to solve a quadratic function (decimal answers and/or exact answers, including complex solutions)
1 3.3 The quadratic formula and the discriminant
1.N.CN.1 (3)1.N.CN.2 (3)3.N.CN.7 (5)
I can determine the number and type of solutions to a quadratic equation by finding the discriminant
1 Review1 Test
135
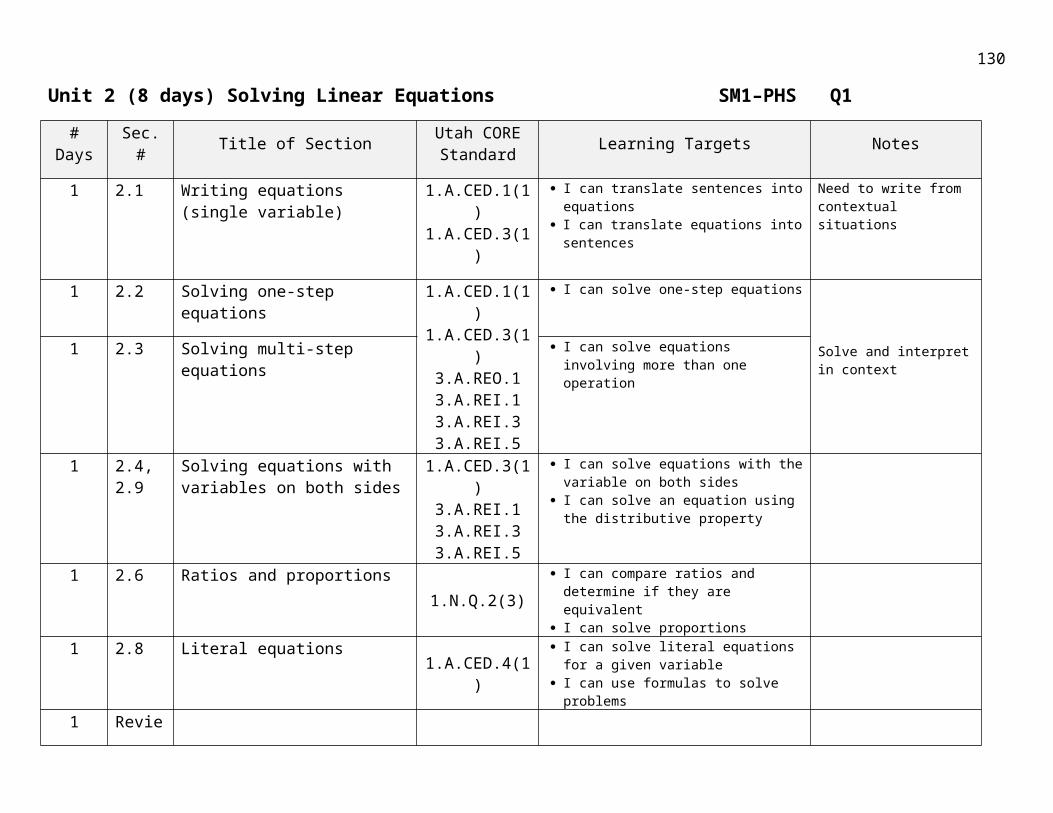
Unit 4 (8 days) Analyzing functions SM2–THS Q2
# Days Sec. # Title of SectionUtah CORE Standard
Learning Targets Notes
1 supp Review and graph linear and exponential functions
I can graph a linear function I can graph an exponential function I can identify the domain and range of a linear
function and exponential functions
Heavily supplemented
4.1 2.F.IF.5 (1) Emphasize domain
1 2.1 Graphing quadratic functions 2.F.IF.7 (2)2.F.IF.5 (1)2.F.IF.9 (2)
I can organize a quadratic equation into standard form
I can find the vertex of a quadratic in standard form using the axis of symmetry
I can graph a quadratic function in standard form I can identify the domain and range of a quadratic
function I can identify the vertex as a maximum or minimum
Emphasize standard form and factored form to build graphs
1 2.2 Solving quadratic equations by graphing 3.A.REI.4 (4)
F.IF.8a
1 2.6 Analyzing functions with successive differences
2.F.IF.4 (1)2.F.IF.5 (1)2.F.IF.6 (1)2.F.LE.3 (5)
I can determine the roots, zeros, solutions and x-intercepts of a quadratic function
I can determine the type of solution to a quadratic equation by graphing
Compare linear, quadratic and exponential relationships with rates of change, heavy supplement
3.4 extend lab
Quadratics and rate of change
1 2.3 Transformations of quadratic functions 2.F.IF.7 (2)
2.F.IF.5 (1)2.F.IF.9 (2)
f.IF.8a
I can graph a quadratic in vertex form I can determine the translation horizontal and/or
vertical shift of a quadratic function I can determine the reflection of a quadratic
function I can determine the vertical shrink/stretch
Emphasize vertex form
3.4 Transformations of quadratic graphs
3.4 extend lab
Families of parabolas
1 3.5 Quadratic inequalities I can graph the solutions to quadratic inequalities
1 Review1 Test
136
Unit 5 (6 days) Special functions SM2–THS Q2
# Days Sec. # Title of SectionUtah CORE Standard
Learning Targets Notes
2 2.7 Special functions (absolute value, step and piecewise)
2.F.BF.3 (4)2.F.IF.5 (1)
I can graph step functions using transformations I can graph absolute value functions using
transformations I can graph piecewise functions using
transformations I can state the domain and range of step functions,
absolute value functions, and piecewise functions
Emphasize domain and range, etc. and do transformations – needs supplement
2 0.7 Inverse linear functions
2.F.BF.4 (4)2.F.IF.5 (1)
I can find an inverse relation by switching places with x and y
I can graph an inverse relation I can find an inverse relation algebraically I can determine if the inverse relation is a function I can make the inverse relation a function by limiting
the domain
Needs supplement0.7 lab Drawing inverses
1 Supp Build a function that models relationship and graph them 2.F.BF.1 (3)
2.F.IF.5 (1)3.A.CED.2 (3)
Emphasize domain and range, etc. Emphasize domain and range, etc. linear, exponential and quadratic
1 ReviewTest
137
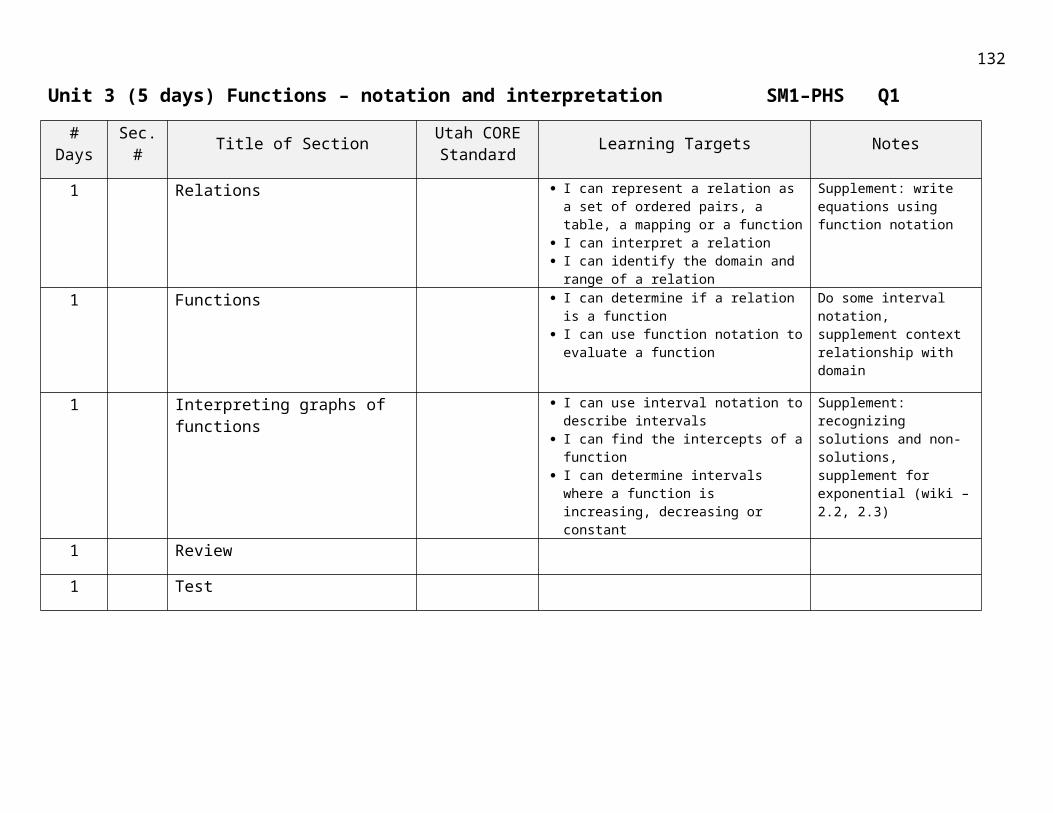
Unit 6 (6 days) Geometry, proof, parallel lines and triangles SM2–THS Q2
# Days Sec. # Title of SectionUtah CORE Standard
Learning Targets Notes
1 5.1 Postulates and paragraph proofs
5.G.CO.9 (2)
I can write a sllogism I can do an UNO proof I can do a two-column proof
UNO proofs, algebraic, basic geometric5.2 Algebraic proof
1 5.5 Angles and parallel lines I can identify supplementary and complementary angles
I can identify corresponding angles, alternate interior, alternate exterior, same side interior, and vertical angles
I can use the angle pair relationships to find missing angles and justify solutions
Using angle relationships, I can prove that lines are parallel
Prove alternate interior and corresponding angles
5.6 Proving lines parallel
1 6.1 Angles and triangles
5.G.CO.10 (2)
I can prove the Triangle Sum Theorem I can prove the sum of the 2 remote interior angles
equal the exterior angle I can set up and solve equations using properties of
angle measurements
Prove triangle sum theorem
1 6.2 Congruent triangles (corresponding parts)
5.G.CO.10 (2)5.G.CO.5 (3)
I can identify corresponding parts of congruent triangles
I can write a proof showing that triangles are congruent
I can use CPCTC in proofs I can I can
6.3 Proving triangles congruent –SSS, SAS
6.4 Proving triangles congruent –ASA, AAS
1 Review1 Test
138
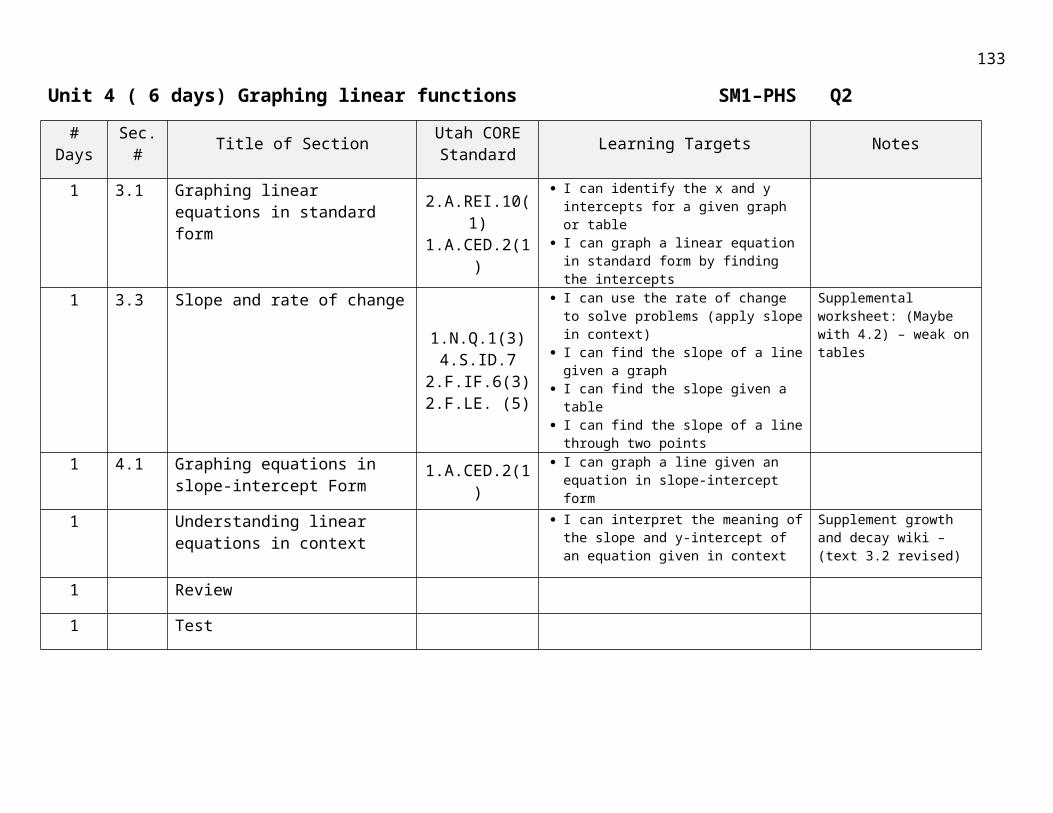
Unit 7 (8 days) Triangles and quadrilaterals SM2–THS Q3
# Days Sec. # Title of SectionUtah CORE Standard
Learning Targets Notes
1 6.5 Isosceles and equilateral triangles5.G.CO.10 (2)5.G.SRT.5 (3)
I can prove base angles in an isosceles triangle are congruent
I can use properties of isosceles triangles and equilateral triangles to solve problems
Emphasize proof
1 6.6 Triangles and coordinate proof
6.G.GPE.4
I can calculate the slope of a line I can use the distance formula or pythagorean
theorem to find the length of a segment I can classify a shape using slope and the
pythagorean theorem or distance formula I can use coordinate proof to show triangles scalene,
isosceles, or equilateral1 7.1 Bisectors of triangles
5.G.CO.9 (2) I can I can identify the difference between the
perpendicular bisector, angle bisector, median and altitude of a triangle
I can use properties of medians, altitudes and bisectors to solve problems
Do problem #61 to emphasize Pythagorean Identity
7.2 Medians and altitudes of triangles 5.G.CO.10 (2)1 8.1 Angles of polygons
Prerequisite skill
I can calculate the sum of the interior angles for an n-sided polygon
I can find the measure of an interior or exterior angle for a polygon
1 8.2 Parallelograms 5.G.CO.11 (2) I can set up and solve equations using properties of parallelograms
I can prove that a quadrilateral is also a parallelogram
I can set up and solve equations using properties of trapezoids and kites
8.3 Tests for parallelograms 5.G.CO.11 (2)6.G.GPE.4
1 8.4 Rectangles5.G.CO.11 (2)8.5 Rhombi and sqares
8.6 Trapezoids and kites (optional)1 Review1 Test
139
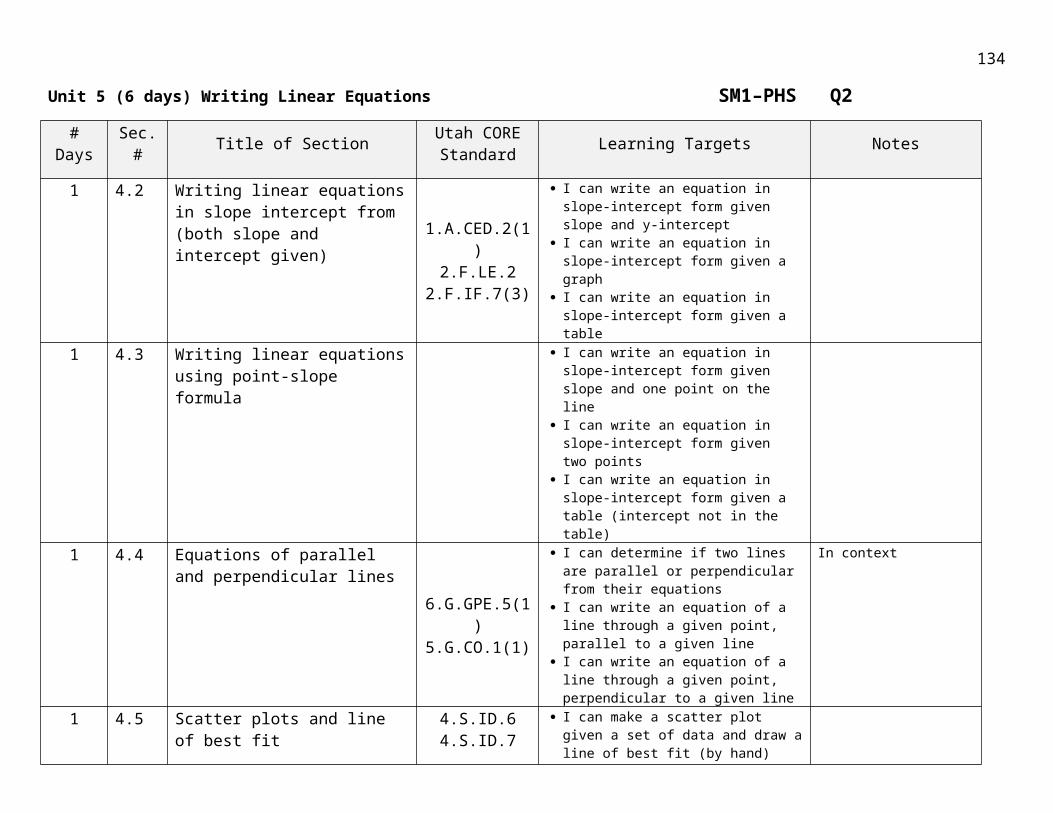
Unit 8 (4 days) Similar polygons SM2–THS Q3
# Days Sec. # Title of SectionUtah CORE Standard
Learning Targets Notes
1 9.1 Ratios and proportions prerequisite I can write and solve proportions I can recognize when: polygons are similar;
corresponding angles are congruent; and corresponding sides are proportional
I can determine the scale factor of similar polygons I can find missing measures in similar polygons
9.2 Similar polygons
5.G.SRT.2 (1) 5.G.SRT.3 (1)
AA Similarity
1 9.3 Similar triangles I can use AA similarity to prove that two polygons are similar
I can use properties of similarity to find missing measures in triangles
I can apply the Triangle Midsegment Theorem to solve for missing measures in a triangle
9.4 Parallel lines and proportional parts 5.G.CO.10 (2)5.G.SRT.4 (3)
Midsegment theorem
1 9.6 10.8
Similarity transformations, dilations5.G.SRT.1 (1)
I can apply the scale factor for a dilation I can draw a dilation given a shape and a scale factor I can determine if the dilation is a reduction, an
enlargement or an isometry
dilations
1 Review1 Test
140
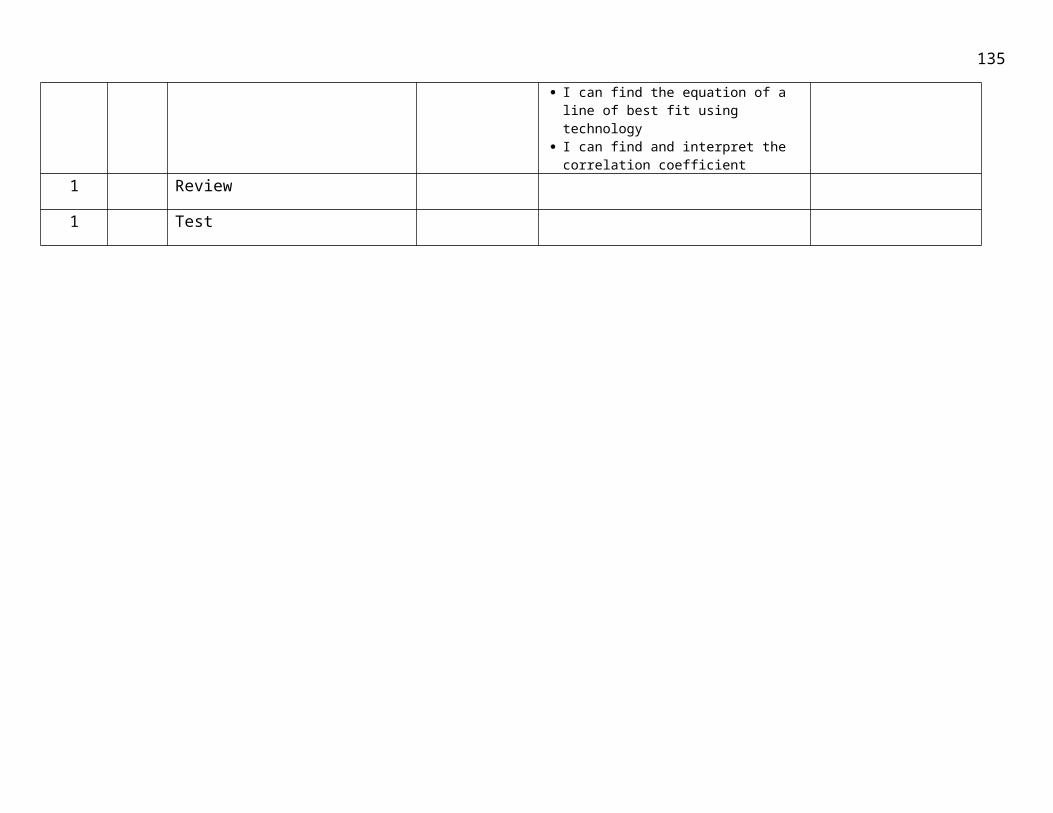
Unit 9 (5days) Right Triangle Trigonometry SM2–THS Q3
# Days Sec. # Title of SectionUtah CORE Standard
Learning Targets Notes
1 10.2 The Pythagorean Theorem and its converse
5.G.SRT.8 (5)
I can use the Pythagorean Theorem to solve for missing measures in right triangles
I can identify a Pythagorean triple and generate new ones
I can determine if a triangle is right given the three sides
1 10.3 Special right triangles5.G.SRT.6 (5)
I can I can use patterns to find missing measures in 30/60/90 triangles
I can use patterns to find missing measures in 45/45/90 triangles
1 10.4 Trigonometry
5.G.SRT.6 (5)5.G.SRT.7 (5)5.G.SRT.8 (6)
I can define sine, cosine, and tangent as ratios of sides in a right triangle
I can solve for a missing angle measure in a right triangle using a trig ratio
I can solve for a missing angle measure in a right triangle using an inverse ratio
I can explain the relationship between sine and cosine in complementary angles
I can find all three ratios sin, cos and tan if I am given only one of the ratios
Do #61 to emphasize Pythagorean Identity
10.5 Angles of elevation and depression 5.G.SRT.8 (5)
I can use angles of elevation and depression to solve right triangles
I can use angles of elevation and depression to solve for the distance between two objects
1 Review
1 Test
141
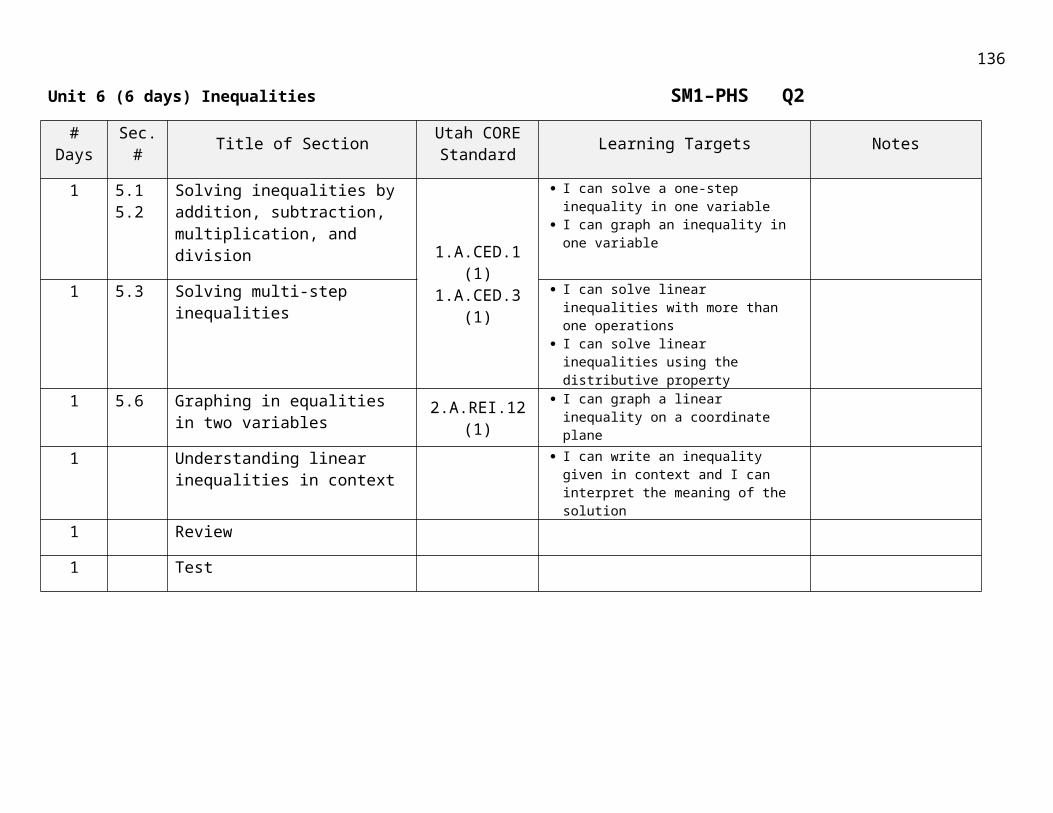
Unit 10 (7 days) Circles SM2–THS Q4
# Days Sec. # Title of SectionUtah CORE Standard
Learning Targets Notes
1 11.1 Circles and circumference, all circles are similar 6.G.C.1
6.G.C.36.G.C.5
6.G.GMG.16.G.GMD.1
I can sate why all circles are similar I can define the following terms: circle, chord, radius,
diameter, arc, tangent, and secant I can calculate circumference given the radius or
diameter I can calculate the area of a circle I can calculate the area of a sector of a circle I can find the missing measures (i.e., radius, etc) in
circles
11.9 Areas of circles and sectors
1 11.2 Measuring angles and arcs6.G.C.26.G.C.36.G.C.5
I can find the arc length given a central angle I can find the arc length given an inscribed angle I can find the length of an arc I can find missing measures in circles using
properties of central and inscribed angles
11.4 Inscribed angles
1 11.3 Arcs and chords 6.G.C.2 I can find missing measures using properties of
chords I can find missing measures using tangents of circles11.5 Tangents 6.G.C.4
6.G.CO.12Given a polygon, construct circumscribed and inscribed circle
11.5 lab Inscribed and circumscribed circles 6.G.C.3
1 11.8 Equations of circles6.G.GPE.1
3.A.REI.7 (7)5.G.GPE.6 (4)
I can graph a circle given the equation in standard form
I can write the equation of a circle given center and radius or diameter
I can complete the square to write the equation of a circle in standard form
G.GPE.6 pg 780 challenge questions 48 and 49
1 11.8 labsupp
Parabolas, solve systems of equations involving lines, circles and quadratics
6.GPE.23.A.REI.7 (1)
I can find the point(s) of intersection, if they exist between a line and a circle or a circle and a quadratic by solving a system of equations
Emphasize systems of equations and intersections
1 Review
1 Test
142

Unit 11 (5 days) Constructions and volume SM2–THS Q4
# Days Sec. # Title of SectionUtah CORE Standard
Learning Targets Notes
1 Constructions
G.C.3G.C.4
G.CO.12
I can construct a perpendicular bisector I can construct an angle bisector I can construct a circle through 3 non-collinear points I can construct a tangent line to a circle given a point
outside the circle I can construct a circle inside a triangle I can construct a triangle circumscribed about a circle
1 12.4 Volumes of prisms and cylindersH.6.G.GMD.2
6.G.GMD.36.G.GMD.1
I can determine the shape of the base for a given prism
I can calculate the volume of a prism I can calculate the volume of a cylinder Given the volume of a prism or cylinder, I can
calculate missing measures1 12.5 Volumes of pyramids and cones
6.G.GMD.36.G.GMD.1
I can determine the shape of the base for a given pyramid
I can calculate the volume of a pyramid I can calculate the volume of a cone Given the volume of a cone or pyramid, I can calculate
missing measures1 12.6 Volumes of spheres
6.G.GMD.3
I can calculate the volume of a sphere I can calculate the volume of a hemisphere Given the volume of a sphere or hemisphere, I can
calculate the radius
Just volume
1 Review
Test
Unit 11 (6 days) Probabilities SM2–THS Q4
143
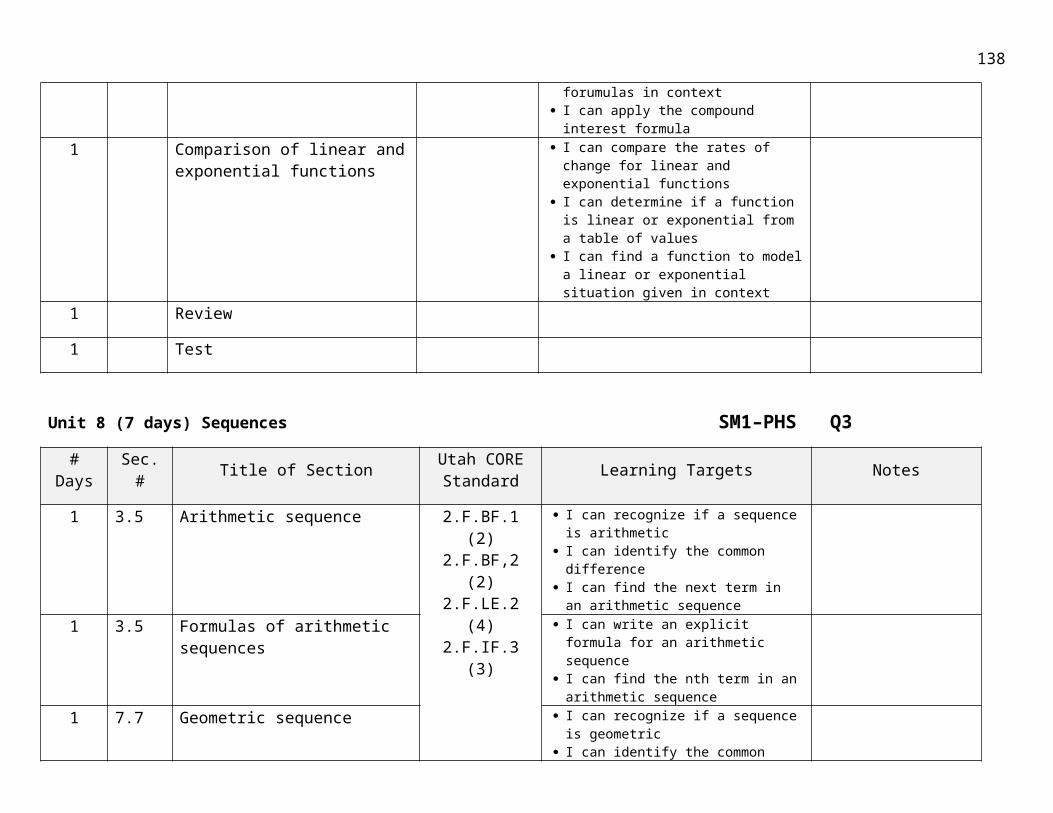
# Days Sec. # Title of SectionUtah CORE Standard
Learning Targets Notes
1 13.1 Representing sample spaces
4.S.CP.1 (1)
I can use lists, tables, Venn Diagrams, and tree diagrams to represent sample spaces
I can use the fundamental Counting Principle to count outcomes
I can identify an event as a subset of a sample space I can determine whether a situation is a permutation
and a combination I can calculate the number of possible outcomes in a
given situation using P= ___ for permutations and C=___ for combinations
I can calculate probability using either permuations or combinations
Union, intersection, complements include Venn diagram
13.2 Probability with permutations and combinations
4.S.CP.H (3)
1 13.513.5 lab
Probabilities of independent and dependent events 4.S.CP.2 (1)
4.S.CP.5 (1)4.S.CP.4 (1)
I can find probabilities of two independent events I can find probabilities of two dependent events I can find conditional probabilities I can use a probability tree to calculate probabilities I can use two-way frequency tables to find
probabilities1 13.6 Probabilities of mutually exclusive
events 4.S.CP.3 (1)4.S.CP.6 (2)4.S.CP.7 (2)
I can find probabilities of events that are mutually exclusive
I can find probabilities of events that are not mutually exclusive
I can use Venn Diagrams to help find probabilities I can find probabilities of complements
Conditional probability/Addition rule
1 13.4 Simulations (optional)4.S.CP.H.6 (3)
Include frequency table
1 Review
1 Test
Beginning of Timpview coursesBack to Table of Contents
144
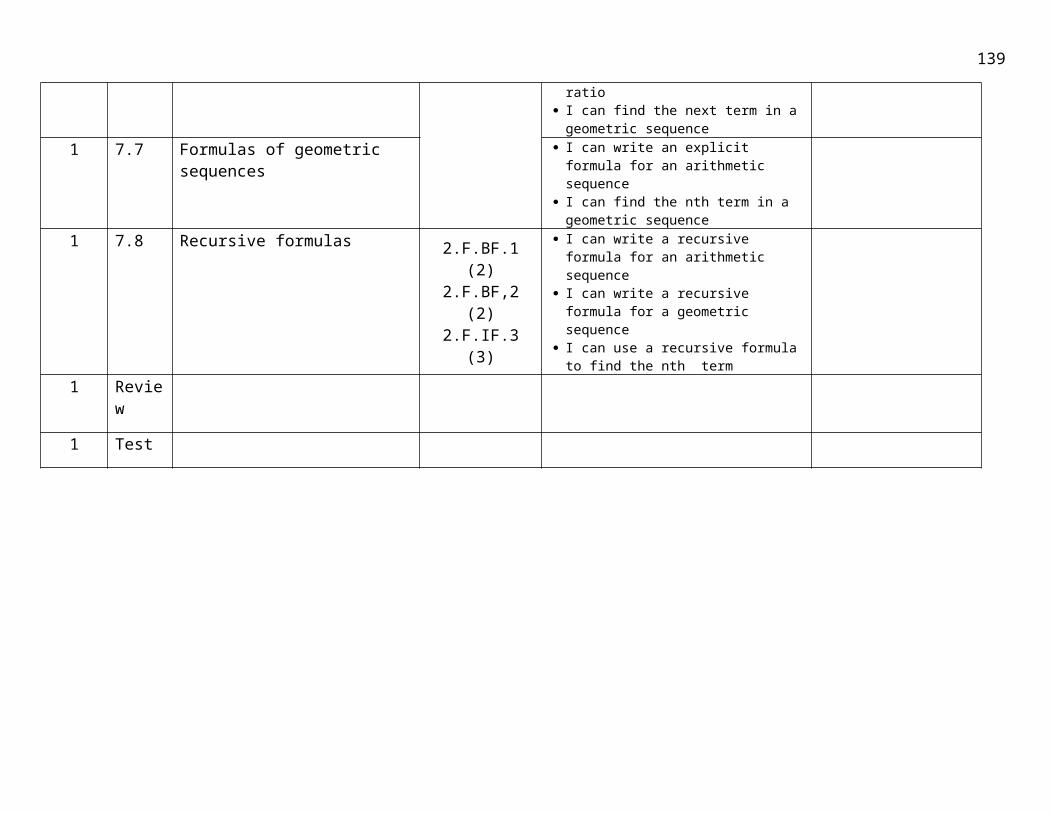
Secondary Math 3 OutlineCorrelated to Math 3 Book from McGraw-HillUnit 1 (9 days) Relations and functions SM3–THS Q1
# Days Sec. # Title of SectionUtah CORE Standard
Learning Targets Notes
1 2.1 Relations and functions4.F.IF.5
I can write the definition of a function I can identify the domain and range of a function from a graph I can identify the domain and range of a function from context
Basic review of domain to build for rest of course
1 2.2 Linear relations and functions
4.F.IF.4
I can find the intercepts of a function given a graph I can identify the intervals where a function is increasing, decreasing
or constant given a graph In can identify the intervals where a function is positive or negative
given a graph or a table I can identify the maximum and minimum values of a function given
a graph or a table1 2.3 Rate of change and slope
4.F.IF.6 I can find the average rate of change of any function from a graph I can find the average rate of change of any function from two points I can find the average rate of change of any function from context
Supplement with average rate of change over a given interval
1 2.4 Writing linear relations and functions
4.A.CED.1
I can write the equation of a line given the slope and y-intercept or points on the line
I can identify slope/rate of change, y-intercept/initial amount, or two points from a context
I can write a linear function given a context
Emphasize application problems and modeling more than skill/process
1 2.5 Special functions4.F.BF.3
I can graph a piecewise function I can write a piecewise function given a graph I can evaluate a piecewise function
1 2.6 Parent functions and transformations
4.F.IF.7
I can graph the parent functions of linear, quadratic, cubic and absolute value functions
I can use horizontal and vertical shifts to graph transformations of parent functions
I can use vertical stretches and compressions and reflections to graph transformations of parent functions
I can write the equations of any transformed linear, quadratic, cubic and absolute value functions
Piecewise, step and absolute value
1 2.7 Graphing linear and absolute value inequalities (optional) 4.A.CED.1
I can graph linear inequalities I can graph absolute value inequalities
Review graphing linear equations; do linear inequalities only; ABS inequalities not in core
1 Review1 Test
145
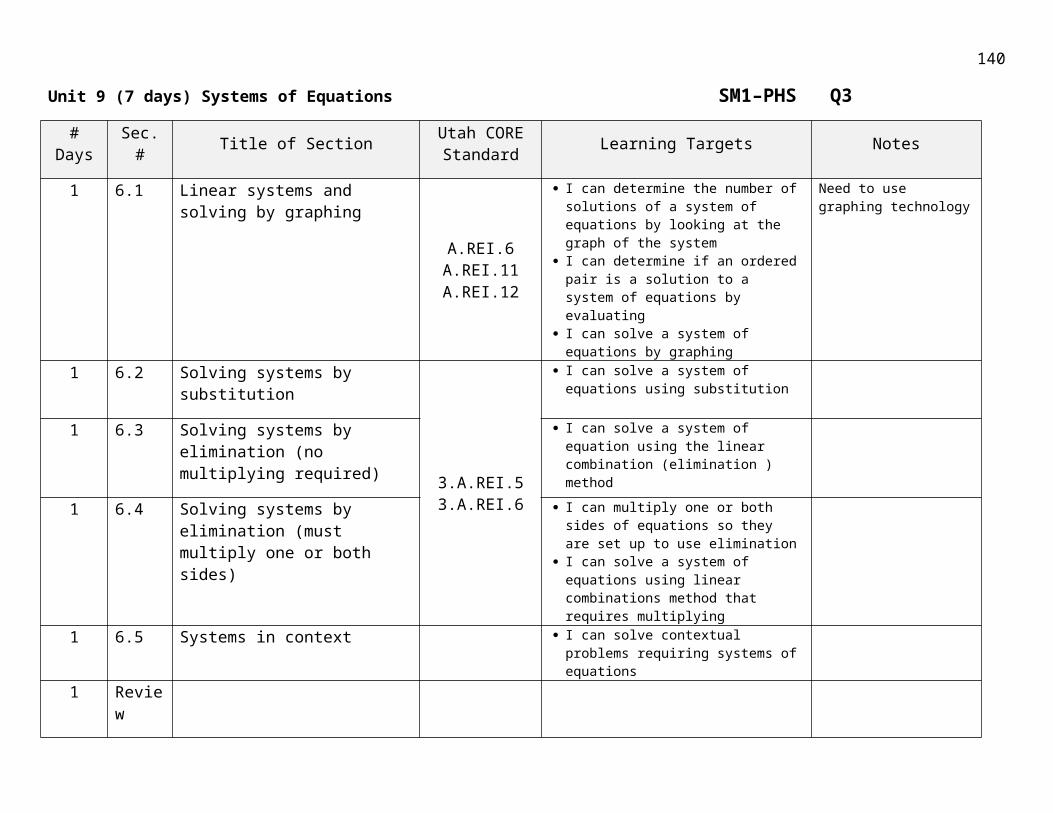
Correlated to Math 3 Book from McGraw-HillUnit 2 (5 days) Operations with polynomials SM3–THS Q1
# Days
Sec. # Title of SectionUtah CORE Standard
Learning Targets Notes
1 4.1 Operations with polynomials
2.A.APR.1 I can add and subtract polynomials I can multiply two or more polynomials
1 4.2 Dividing polynomials
2.A.APR.6
I can divide polynomials using long division I can divide polynomials using synthetic division
Divide a monomial, linear factor, synthetic divsion
1 4.3 Polynomial functions
2.F.IF.42.F.IF.7
I can define a polynomial function I can identify the degree, leading coefficient, and the constant of a
polynomial I can determine the end behavior of a polynomial function
4.4 Analyzing graphs of polynomial functions
I can find the zeros of a polynomial function from a graph I can graph a possible function given its zeros and end behavior I can find the minima and maxima of a polynomial function
1 Review
1 Test
146
Unit 3 (6 days) Polynomials SM3–THS Q1#
DaysSec. # Title of Section
Utah CORE Standard
Learning Targets Notes
1 4.5 Factoring review: Solving polynomial equations 2.A.CED.1
I know when and how to factor using the greatest common factor technique
I know when and how to factor trinomials I know when and how to factor differences of squares I know when and how to factor sums and differences of cubes I know when and how to factor by grouping
Factoring and how that applies to solving
1 4.5 lab Polynomial identities2.A.APR.4
I can find the zeros of a polynomial on a graph I can find the zeros of a polynomial by factoring I can find the zeros of a polynomial using the quadratic equation
1 4.6 The Remainder and Factor Theorem
2.A.APR.22.A.APR.3
2.F.IF.7
I can find the value of a function using synthetic division I can figure out if something is a factor of a polynomial using synthetic
division I can find factors of a polynomial when given a polynomial and one of its
factors
Emphasize the meaning of a root/zero and x-intercept, and recognize them on a graph or in an equation
1 4.7 Roots and Zeros
2.A.APR.32.N.VN.8(+)2.N.VN.9(+)
I understand how zeros, roots, factors, and intercepts are related I can find a polynomial when given the zeros, intercepts, factors or roots I understand what it means to be a real solution and a complex solution
to a polynomial I understand that every complex solution comes with a partner, and
when given one complex solution to a function, I can find its conjugate pair
I can find how many real and non-real solutions there are to a polynomial using the discriminant
I can find a polynomial when given the zeros, including complex zeros1 Review1 Test
147

Unit 4 (9 days) Functions SM3–THS Q2#
DaysSec. # Title of Section
Utah CORE Standard
Learning Targets Notes
1 5.1 Operations on functions
4.F.BF.1b
I can use function notation when adding, subtracting, multiplying and dividing two functions
I understand what a composite function is and find f(g(x)) and g(f(x))
Emphasize function notation in combinations and composition
1 5.2 Inverse functions and relations (verifying with composition is Honors
4.F.BF.4a
I can understand what it means to be an inverse function I can find the inverse function to a set of ordered pairs. I can find the inverse function when given a function f(x) I can determine whether a pair of functions are inverses of each other
Find inverse functions and graph
1 5.3 Square root functions and inequalities
4.F.IF. 6F.F.BF.3
I can identify the domain and range of a square root function I can graph a square root function using translations, reflections and
stretches1 5.4 Nth roots
2. A.SSE.2
I understand what an nth root is I can identify positive, negative and non-real roots I can simplify nth root problems I can find the nth root of a number on my calculator
1 5.5 Operations with radical expressions
I can simplify nth root problems using the product property I can rationalize the denominator of a fraction by getting rid of the
radical I can multiply and divide radicals I can add and subtract radicals
1 5.6 Rational exponents In SM2 Core
I can convert between radical and exponential forms I can solve problems with rational exponents I can simplify an expression with radical exponents
Need to cover again here
1 5.7 Solving radical equations and inequalities
2.A.SSE.2 I can solve radical equations I understand what an extraneous solution is
Solving cube root equations
1 Review1 Test
148
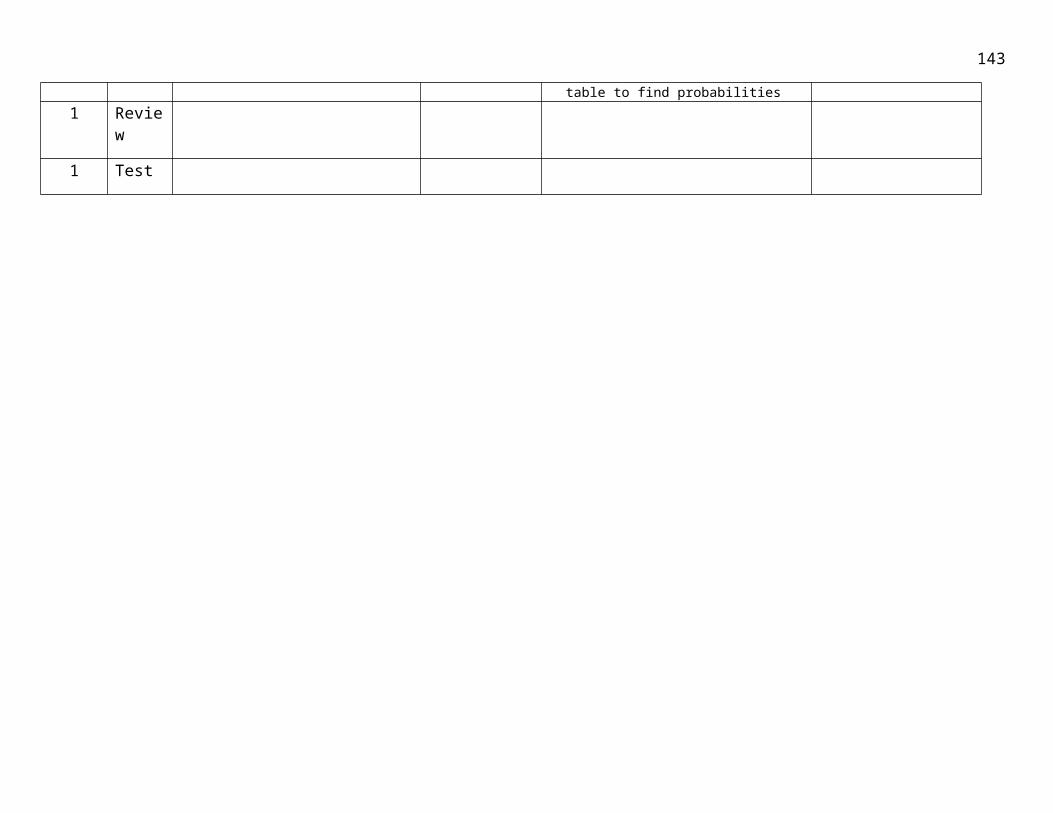
Unit 5 (7 days) Rational equations and expressions SM3–THS Q3#
DaysSec. # Title of Section
Utah CORE Standard
Learning Targets Notes
1 7.1 Multiplying and dividing rational expressions
2.A.APR.62.A.APR.7
I can simplify a rational expression by factoring I can simplify a rational expression by multiplication I can simplify a rational expression by division I can simplify a complex fraction
1 7.2 Adding and subtracting rational expressions 2.A.APR.7
I can find the lowest common denominator (LCD) with a monomial I can find the LCD with a polynomial using factoring I can add and subtract rational expressions by creating a LCD I can simplify complex fractions using LCDs
1 7.3 Graphing reciprocal functions
2.F.IF. 7d
I can graph the parent reciprocal function y = 1/x (hyperbola) I can use transfiguration to graph any reciprocal function I can identify the vertical and horizontal asymptotes of a reciprocal
function I can identify the domain and range of a reciprocal function
1 7.4 Graphing rational functions (optional) 2.F.IF.7d
4.A.CED.2
I can look at a rational function and identify the horizontal asymptote I can identify when there is a slant asymptote I can identify points of discontinuity I can use asymptotes and points of discontinuity to graph rational
functions
Emphasized in precalculus
1 7.5 Solving rational equations (and inequalities) (optional)
2.A.REI.2 I can solve a rational equation by finding common denominators I can solve a rational equation by factoring the denominators
1 Review1 Test
149
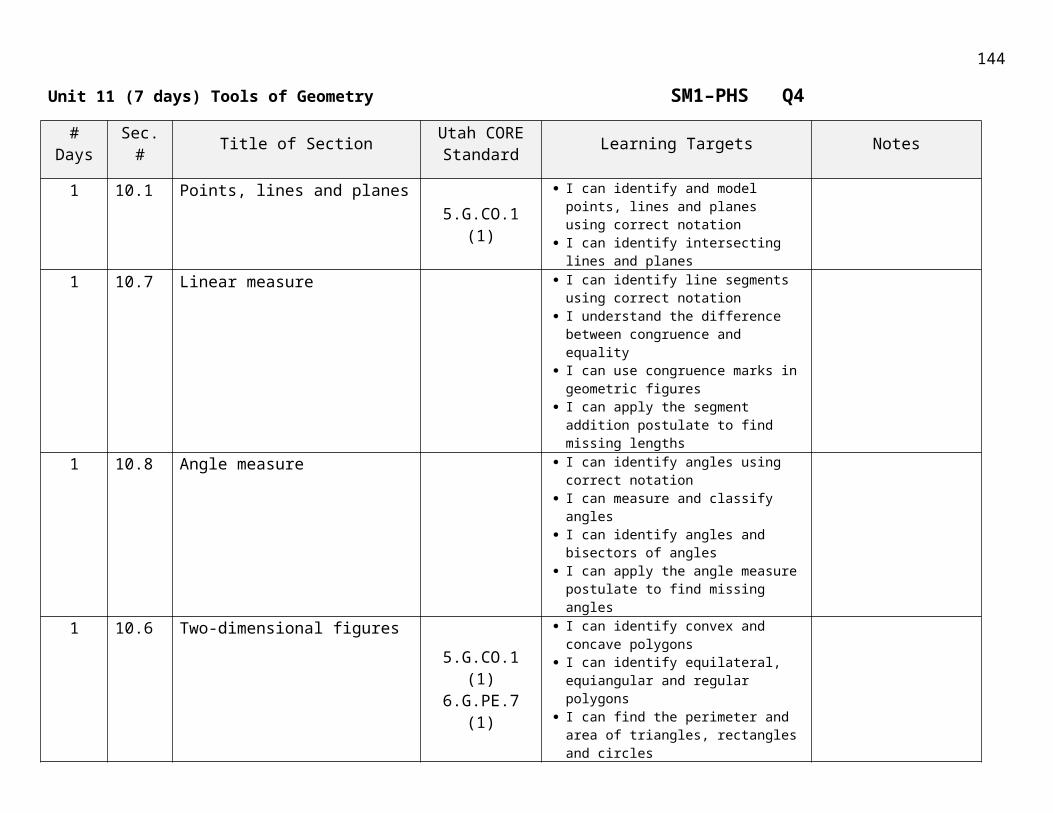
Unit 6 (7 days) Rational equations and expressions SM3–THS Q3#
DaysSec. # Title of Section
Utah CORE Standard
Learning Targets Notes
1 11.1 Trig functions in right triangles
Review
I can evaluate the six trig functions given a right triangle Given one trig ratio, I can use the Pythagorean Theorem to find the five
remaining trig ratios I can use special right triangles to find the trig values for 30˚, 45˚ and 60˚ I can use trig functions to find missing sides of a right triangle I can use inverse trig functions to find missing angles of a right triangle I can use angles of elevation and depression to solve real world
problems1 11.2 Angles and angle
measure 3.F.TF.13.F.TF.2
I can draw positive and negative angles in standard position I can identify the initial side and terminal side of an angle I can find a co-terminal angle to any angle I understand how to measure angles with radians I can use the central angle and the radius to find arc length
radians
1 11.4 Law of sines 3.G.SRT.93.G.SRT.103.G.SRT.11
I can find the area of a triangle when given SAS I can use the law of sines to solve triangles
1 11.5 Law of cosines 3.G.SRT.103.G.SRT.11
I know when to use the law of cosines to solve triangles I can use the appropriate law to solve triangles
1 supp Unit circle 3.F.TF.2 I can know the ratios of side lengths of special right triangles I know how sine and cosine are related to a unit circle
Unit circle
1 Review1 Test
150
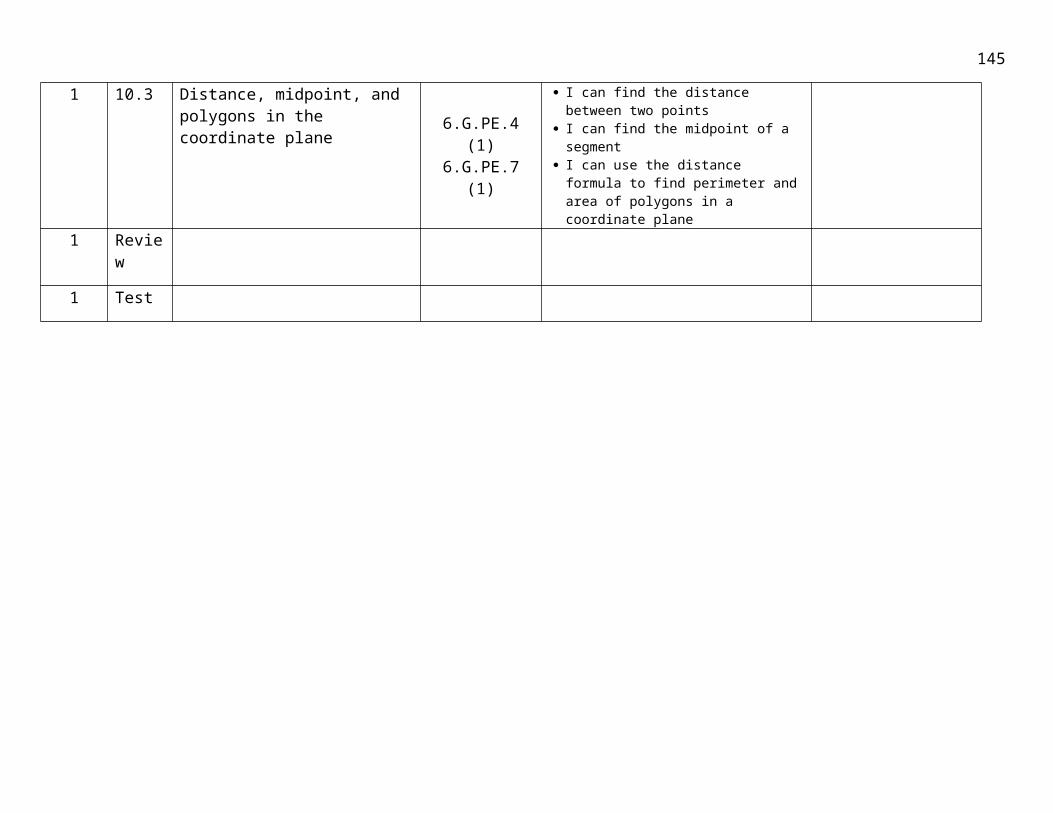
Unit 7 (7 days) Rational equations and expressions SM3–THS Q3#
DaysSec. # Title of Section
Utah CORE Standard
Learning Targets Notes
2 11.3 Trig functions of general angles 3.F.TF.2
I can find the exact value of a trig function using the unit circle Given any point on the coordinate plane, I can find the six trig functions Given any angle, I can find its reference angle
1 11.9 Inverse trig functions4.F.BF.4a
I can find the value of an angle by using inverse trig functions on my calculator and using the unit circle
I understand the restrictions on the domain for inverse functions1 11.6
11.7Circular and periodic functions, graphing trig functions
3.F.TF.23.F.TF.5
I can determine the period of a function given a graph I can determine the amplitude and period of sine and cosine functions I know the difference between a sine and cosine graph I can graph sine and cosine functions I can identify the domain and range of sine and cosine functions
Core only covers sine and cosine
1 11.8 Translations of trig graphs 3.F.TF.5
I can identify the amplitude, period, vertical shift, and phase shift of sine and cosine functions
I can use the translations to graph sine and cosine functions I can write the equation of a trig function given the graph
1 Review1 Test
151
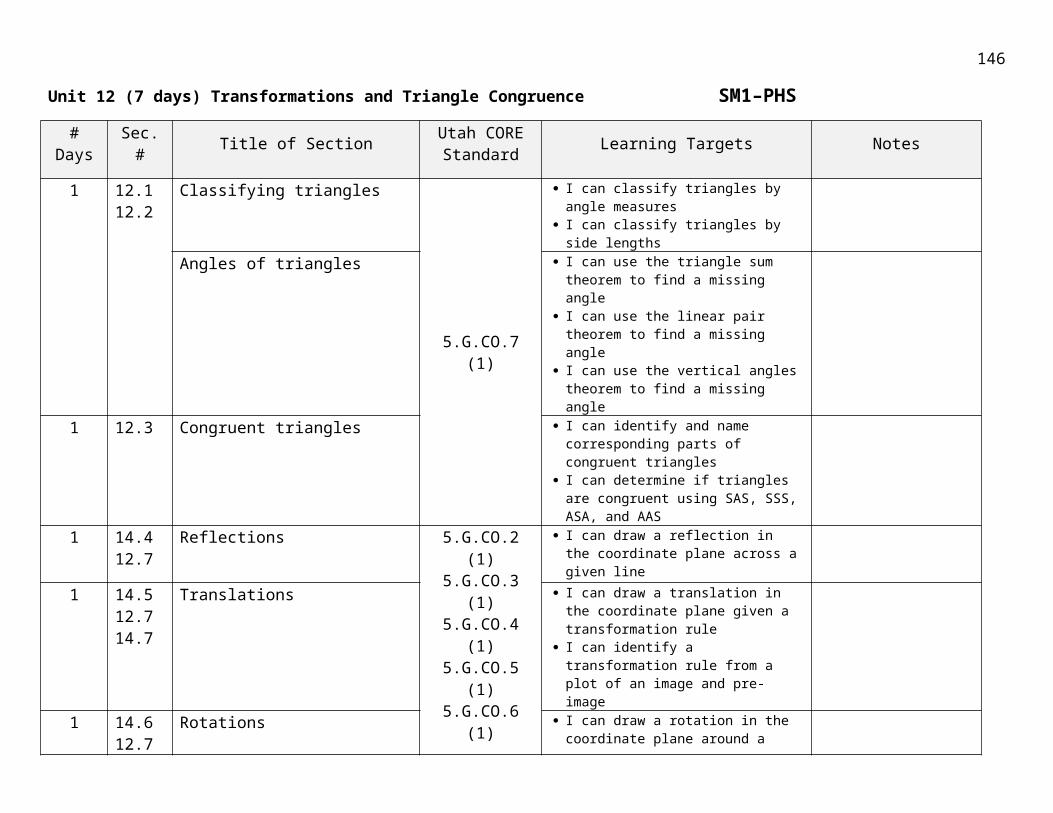
Unit 8 (7 days) Rational equations and expressions SM3–THS Q4#
DaysSec. # Title of Section
Utah CORE Standard
Learning Targets Notes
2 CumRev
Review of linear, exponential, quadratic, absolute value, piecewise, polynomial, logarithmic, rational and trigonometric functions
2.A.SSE.12.A.CED.44.F.BF.14.F.IF.8
Requires supplement, emphasize graphing functions
1 3.1 Solving systems of non-linear equations
4.A.CED.32.A.REI.11
I know what it means to solve a system of equation I can solve a system of equations by graphing I can solve a system of equations by substitution I can solve a system of equations by elimination
Need to include polynomial, rational, absolute value, exponential, and logarithmic functions
1 3.2 Solving systems of inequalities by graphing
I can solve systems of inequalities by graphing I can find the vertices of the polygon formed by a system of inequalities
1 3.3 Optimization with linear programming
4.G.MG.3
Given constraints, I can find the maximum and minimum of a function I can write a system of inequalities to model real-world situations and
use it to find the maximum and/or minimum
Very weak- need to supplement with geometric optimization problems
1 Review1 Test
152
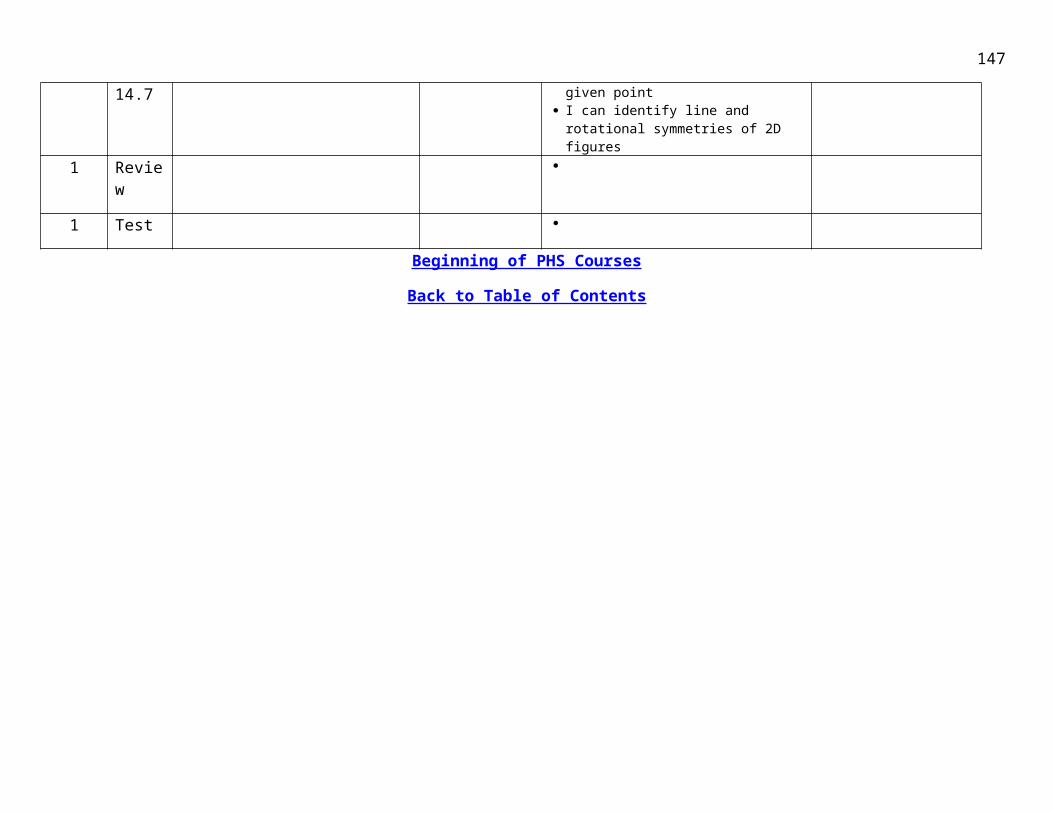
Unit 9 (7 days) Sequences and Series SM3–THS Q4#
DaysSec. # Title of Section
Utah CORE Standard
Learning Targets Notes
1 9.2
2.A.SSE.4
I can write an equation for the nth term of an arithmetic sequence I can find a specific term in an arithmetic sequence I can find the partial sum of an arithmetic sequence I understand sigma notation and can find the sum given sigma notation
Maybe teach arithmetic sequence and series one day and geometric sequence and series the next
9.3 I can write an equation for the nth term of a geometric sequence I can find the specific term in a geometric sequence I can find the partial sum of a geometric sequence I can find the sum of a geometric sequence written in sigma notation
2 15.1 4.G.GMD.44.G.MG.24.G.MG.3
I can identify the shapes of 2-D cross sections of 3-D objects I can identify 3-D objects generated by the rotation of 2-D objects I can apply geometric concepts in modeling situations I can apply geometric methods to solve design problems
1 Review1 Test
153
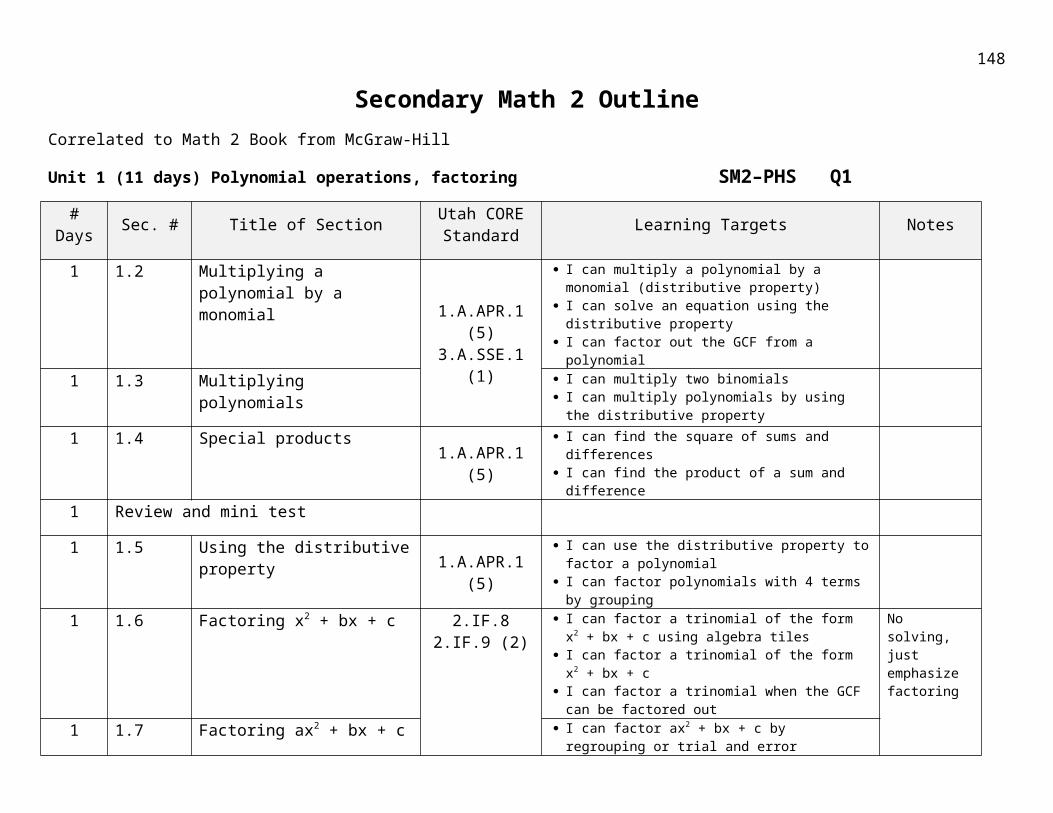
Unit 10 (7 days) Sequences and Series SM3–THS Q4#
DaysSec. # Title of Section
Utah CORE Standard
Learning Targets Notes
1 10.1 Designing a study 1.S.IC.11.S.IC.3
I can determine whether each situation describes a survey, and experiment or an observational study
I can identify whether a survey question is biased or unbiased and design a survey
I can determine whether a statistical study is reliable and identify the errors if not reliable
I can determine how a sample size decreases the margin of error
Weak on population, sample, SRS vs convenience or voluntary sample – infer results for population, random number generator
10.1 ext
Simulations and margin of error
1.S.IC.11.S.IC.4
1 10.2 Distributions of data
1.S.IC.1
I know the shapes of symmetric, negatively skewed, and positively skewed distributions
I can use the shapes of distributions to compare data I can find the mean and standard deviation of symmetric data I can find the five-number summary for skewed data
2 10.5 The normal distribution
1.S.ID.4
I know the key concepts of Normal distribution I can use the Empirical Rule to analyze data and distribute I can calculate the z-values and understand what it means I can use z-values and the standard normal distribution to find
probabilities2 10.6 Confidence intervals
and (hypothesis testing optional)
1.S.IC.41.S.IC.5
I can find the maximum error of estimate I can find confidence intervals for normally distributed data I can determine whether the sample mean falls in a critical region to
accept or reject the hypothesis (optional)
Weak on statistical significance
1 10.7 Simulations1.S.IC.2
I can design and conduct simulations to estimate probability I understand how to analyze results of a simulation, numerically and
graphically1 Critical analysis of
existing studies1.S.IC.6
I can evaluate the validity of a statistical study Requires supplement
1 Review1 Test
Back to Table of Contents Beginning of Timpview courses
154