« thermoelectricity » summer school...
TRANSCRIPT

Thermoelectric materials synthesis: from the phase diagram to the materials
« Thermoelectricity » Summer School 2014
David Bérardan Institut de Chimie Moléculaire et des Matériaux d’Orsay Université Paris-Sud

« thermoelectricity » - summer school 2014 « from the phase diagram to the materials »
outline
Prologue : binary phase diagrams
I. single-crystalline and polycrystalline materials
II. nanocrystalline materials : top-down approaches
Epilogue : and… after the synthesis?
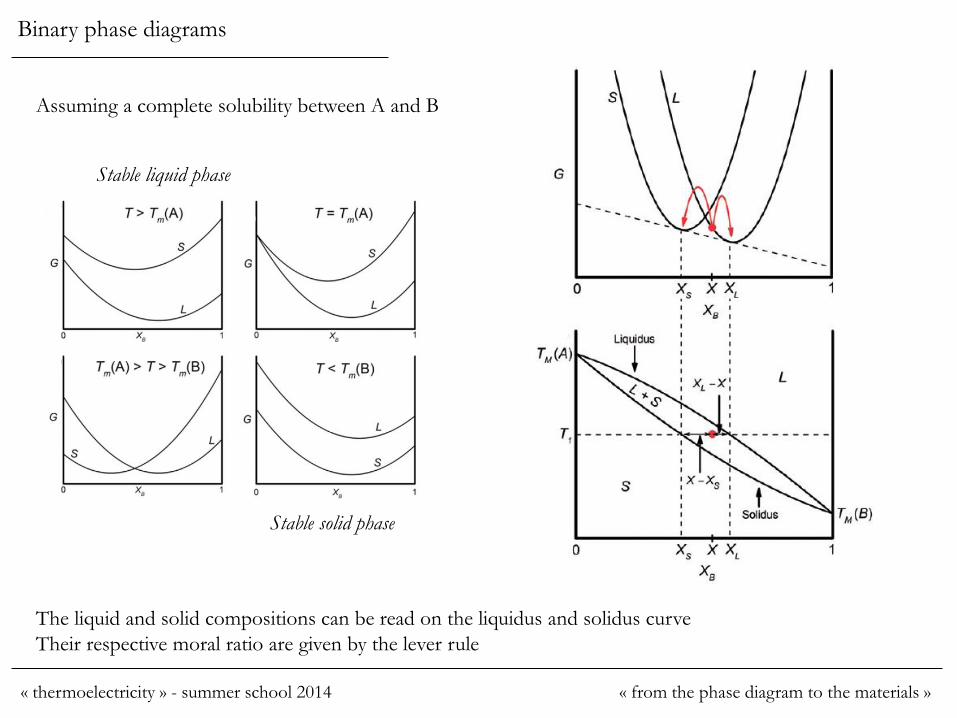
Binary phase diagrams
Assuming a complete solubility between A and B
Stable liquid phase
Stable solid phase
The liquid and solid compositions can be read on the liquidus and solidus curve
Their respective moral ratio are given by the lever rule
« thermoelectricity » - summer school 2014 « from the phase diagram to the materials »
Mixture of two components A and B → Gibbs free energy of mixing DGm
DGm = DHm - TDSm
enthalpy of mixing entropy of mixing
Linked to the difference between EAB
and the average between EAA and EBB
(bonding energies)
DHm = u XA.XB
u : positive or négative
→ DHm positive or négative
always positive
DSm = -R[XA ln(XA) + XB ln(XB)]
AB bonds favored, miscibility AA and BB bonds favored,
Partial or total immiscibility
Binary phase diagrams
« thermoelectricity » - summer school 2014 « from the phase diagram to the materials »

what happens when Hm is positive…
at T ↑ DSm is predominant
at T ↓ DHm is predominant
immiscibility dome at « low » temperature
Binary phase diagrams
« thermoelectricity » - summer school 2014 « from the phase diagram to the materials »

example of binary phase diagram
eutectic
congruent melting incongruent melting
(peritectic)
phase rule:
F = C – P + 2
F = degrees of freedom
C = nb of components
P = nb of phases
(for fixed pressure: C – P +1)
ex : eutectic → F = 0
L → F = 2
Binary phase diagrams
« thermoelectricity » - summer school 2014 « from the phase diagram to the materials »
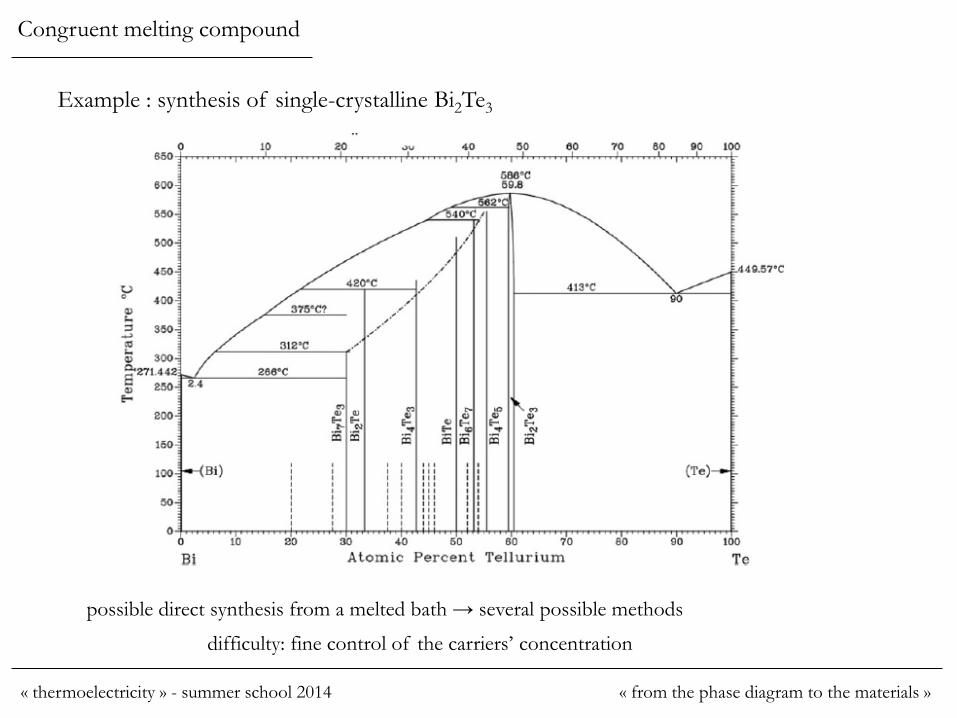
Congruent melting compound
Example : synthesis of single-crystalline Bi2Te3
possible direct synthesis from a melted bath → several possible methods
difficulty: fine control of the carriers’ concentration
« thermoelectricity » - summer school 2014 « from the phase diagram to the materials »

Liquidus maximum around Te 60%
Slight difference in the initial stoichiometry → strong influence on the carriers concentration
Strong influence of the sintering temperature on the concentration+ p/n switching ~ 583.5 °C
Satterthwaite et al., Phys Rev 108, 1164 (1957)
Congruent melting compound
« thermoelectricity » - summer school 2014 « from the phase diagram to the materials »

• growth from a seed
czochralski
• slow epitaxial solidification
Congruent melting compound
« thermoelectricity » - summer school 2014 « from the phase diagram to the materials »
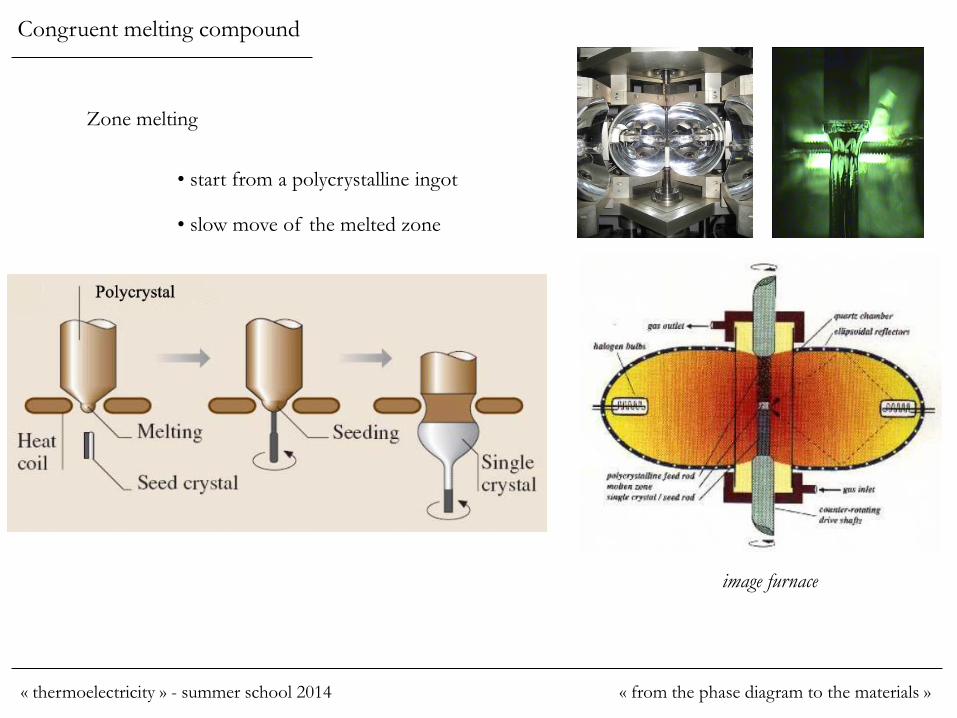
Zone melting
• start from a polycrystalline ingot
• slow move of the melted zone
image furnace
Congruent melting compound
« thermoelectricity » - summer school 2014 « from the phase diagram to the materials »

Using both methods, impurities (dopants) segregation during the synthesis
[dopant] ↑ in the liquid phase
[dopant] ↓ in the solid phase
in both methods, the dopant concentration depends on the position in the ingot
1
0 1
effk
effs gCkC
[C0] : starting concentration
g : fraction of liquid
Congruent melting compound
« thermoelectricity » - summer school 2014 « from the phase diagram to the materials »
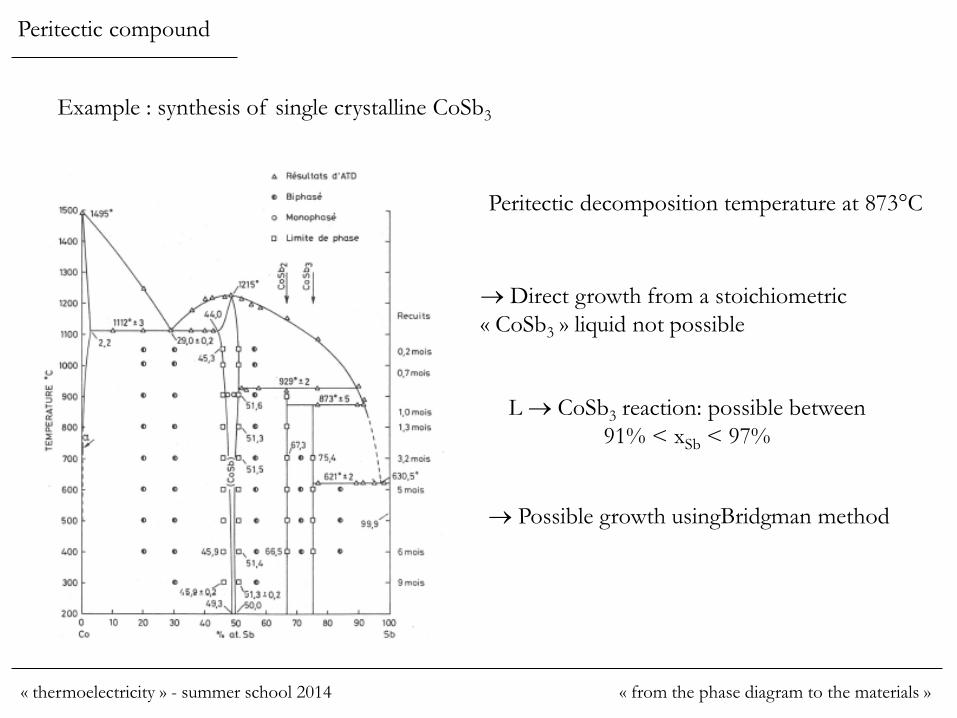
Peritectic compound
Example : synthesis of single crystalline CoSb3
Peritectic decomposition temperature at 873°C
Direct growth from a stoichiometric
« CoSb3 » liquid not possible
L CoSb3 reaction: possible between
91% < xSb < 97%
Possible growth usingBridgman method
« thermoelectricity » - summer school 2014 « from the phase diagram to the materials »

• melting of the precursors in sealed silica tubes
• slow moving of the tube in a thermal gradient
• CoSb3 solidification as mm cristals,
[Sb] ↑ in the liquid phase
• at (T=621°C, xSb=97%), eutectic temperature
Simultaneous solidification of Sb major phase and
CoSb3 minor phase
part of the ingot: CoSb3 crystals
part of the ingot: Sb rich and CoSb3 poor mixture
Peritectic compound
« thermoelectricity » - summer school 2014 « from the phase diagram to the materials »

Example : synthesis of polycrystalline CoSb3
Possible synthesis from a stoichiometric
« CoSb3 » mixture
• melting of the precursors in sealed silica tube
• quenching
• long sintering at T < Tpéritectique
Polycrystalline CoSb3, grains > 10 µm
Peritectic compound
« thermoelectricity » - summer school 2014 « from the phase diagram to the materials »
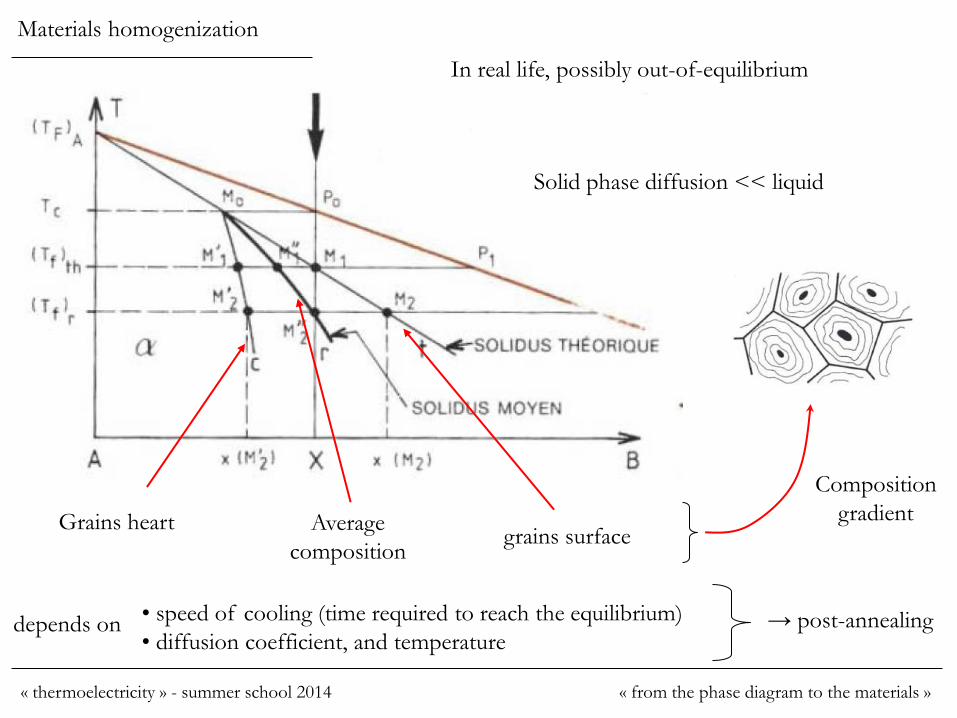
Materials homogenization
Solid phase diffusion << liquid
Grains heart Average
composition grains surface
Composition
gradient
depends on • speed of cooling (time required to reach the equilibrium)
• diffusion coefficient, and temperature → post-annealing
In real life, possibly out-of-equilibrium
« thermoelectricity » - summer school 2014 « from the phase diagram to the materials »

Refractory compounds
Example: Yb11MnSb14
• ternary phase diagram
Yb-Mn-Sb not well established
but
• in the Yb-Sb binary, high Tm
compounds
ex: Yb4Sb3, Tm > 1850 °C
>> Teb (Sb)
not really possible to synthesize
from a melt
« thermoelectricity » - summer school 2014 « from the phase diagram to the materials »
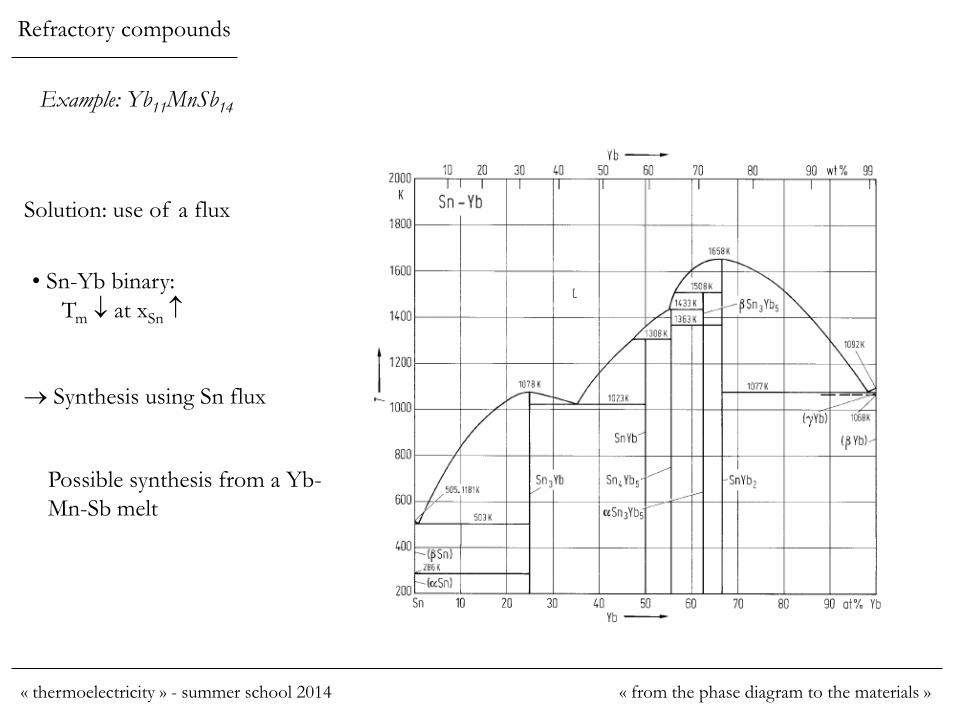
Solution: use of a flux
Synthesis using Sn flux
• Sn-Yb binary:
Tm at xSn
Possible synthesis from a Yb-
Mn-Sb melt
Refractory compounds
Example: Yb11MnSb14
« thermoelectricity » - summer school 2014 « from the phase diagram to the materials »

Initial composition : Yb14Mn6Sb11Sn86
• keep at 500°C → Sn melting
• total melting of the precursors
during the heating up to 1100°C
• precursors mixed in an alumina crucible
sealed in a silica tube under Ar
• mm-size cristals during slow cooling
• flux removed by decantation or
centrifugation (hot temperature)
Refractory compounds
« thermoelectricity » - summer school 2014 « from the phase diagram to the materials »

Choice of the best flux depends on the targeted material:
• must enable a total melting of the precursors at a « reasonnable » temperature
• should not react with the precursors in the synthesis conditions
• solubility of the flux in the targeted material as small as possible (or
if slighlty soluble, not electrically active)
no un-intentional doping !
• should be removed without major difficulty (decantation, dissolved)
generally not one single possible choice
• common flux: self-flux (an element of the targeted material),
low Tm metals (Sn, Sb, Pb),
salts (NaOH, NaCl/KCl)
Refractory compounds
« thermoelectricity » - summer school 2014 « from the phase diagram to the materials »
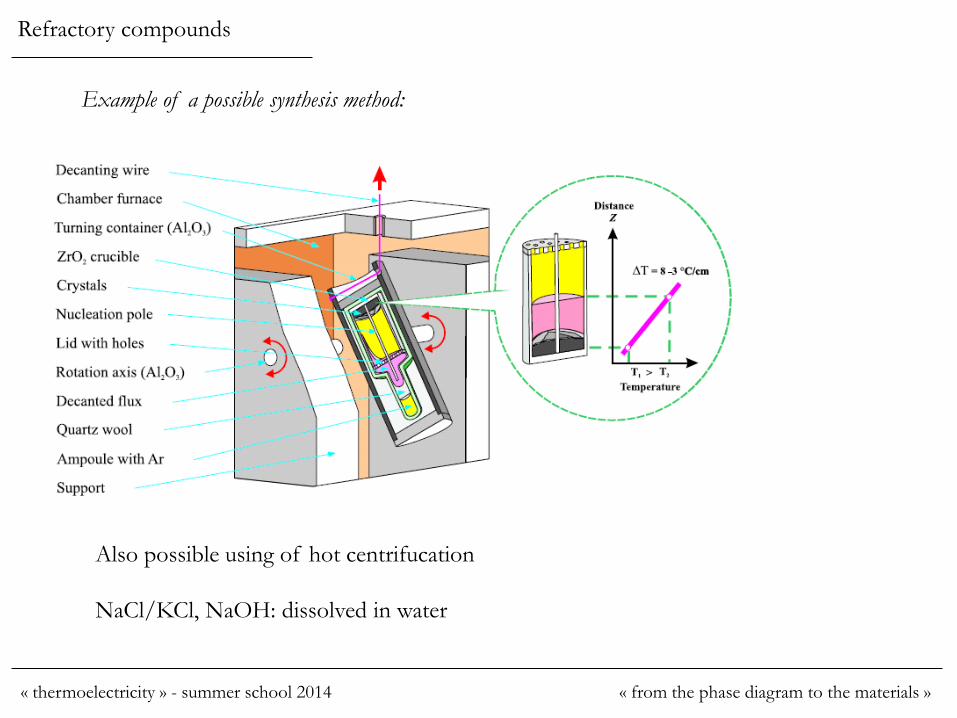
Example of a possible synthesis method:
Also possible using of hot centrifucation
NaCl/KCl, NaOH: dissolved in water
Refractory compounds
« thermoelectricity » - summer school 2014 « from the phase diagram to the materials »

the particular case of oxides
Similar synthesis process, but possible air synthesis
Most often, grinding/mixing + sintering
decarbonation, ex: CaCO3 → CaO + CO2 (>900°C)
deshydration, ex: 2 La(OH)3 → La2O3 + 3 H2O (>900°C)
Calcination steps often required:
strong influence of the synthesis atmosphere on the properties
« thermoelectricity » - summer school 2014 « from the phase diagram to the materials »

oxides, influence of PO2
oxides → [n] strongly influenced by the oxygen stoichiometry
OeVO O
X
O 22
1'2
Equilibrium reaction fonction of PO2
22/1]].[.[
2nVPK OO
with K that depends on the formation energy of oxygen vacancies
leads to 6/1
2][
OPn (assuming a single mechanism and K = constant)
and ].[2][
OVn
« thermoelectricity » - summer school 2014 « from the phase diagram to the materials »
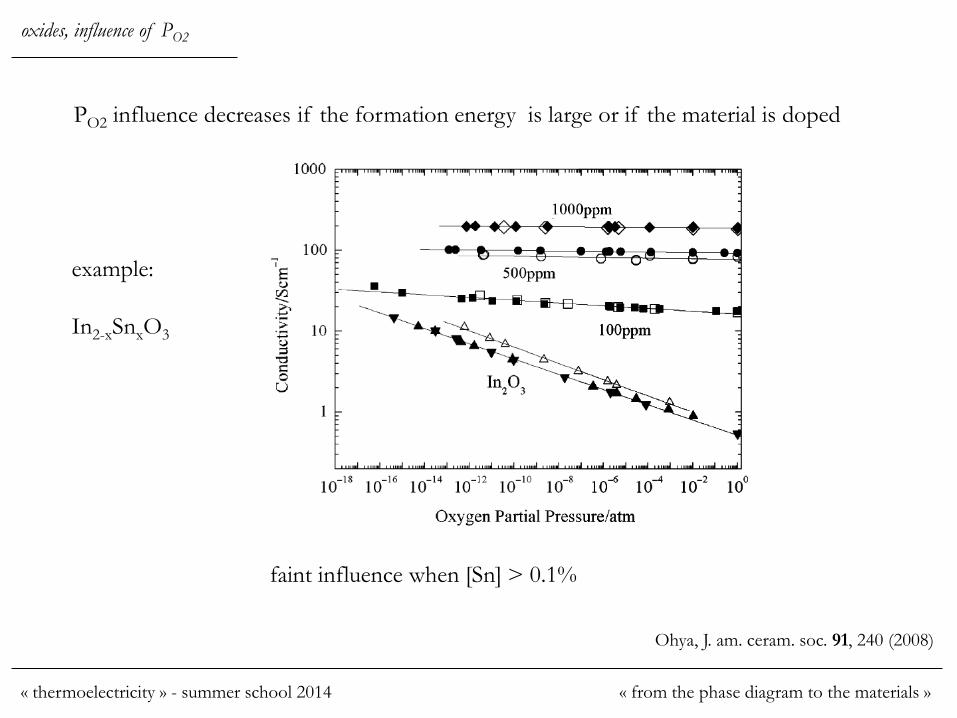
PO2 influence decreases if the formation energy is large or if the material is doped
example:
In2-xSnxO3
Ohya, J. am. ceram. soc. 91, 240 (2008)
faint influence when [Sn] > 0.1%
oxides, influence of PO2
« thermoelectricity » - summer school 2014 « from the phase diagram to the materials »

But cannot be neglected in all materials
0.000 0.005 0.010 0.015 0.02010
19
1020
1021
1400°C 5h, air
1400°C 5h, N2
[n]
(cm
-3)
Al fraction (x)
example:
Zn1-xAlxO
[n] 3 times larger for PO2 = 10-5 than for PO2 ~ 1
(formation of neutral clusters at large PO2)
PO2 influence decreases if the formation energy is large or if the material is doped
oxides, influence of PO2
« thermoelectricity » - summer school 2014 « from the phase diagram to the materials »

2
3
4
5
6
7
89
0.1
2
3
4
5
6
7
89
1
O2 P
ressu
re (
ba
r)
0.0016 0.0015 0.0014 0.0013 0.0012 0.0011
1/T (K-1
)
900800700650Temperature (K)
YBa2Cu3O7-x
130 110
10
0
90
90
80
70
60
60 50
40
30
30
30
20
Low formation energy → very strong influence « isovalue » lines of S
(µV
/K
)
example:
YBa2Cu3Ox
oxides, influence of PO2
« thermoelectricity » - summer school 2014 « from the phase diagram to the materials »

→ PO2 = one supplementary degree of freedom for the materials optimization
example:
SrxBa1-xNb2O6-d PO2 : A = 10-16
B = 10-14
C = 10-12
D = 10-10
For a single cationic composition, transport properties can be optimized in a wide range
If PO2 during synthesis ≠ 0.2 atm, the materials will not be
« stable » under air at « high temperature »
oxides, influence of PO2
« thermoelectricity » - summer school 2014 « from the phase diagram to the materials »
oxides, influence of PO2
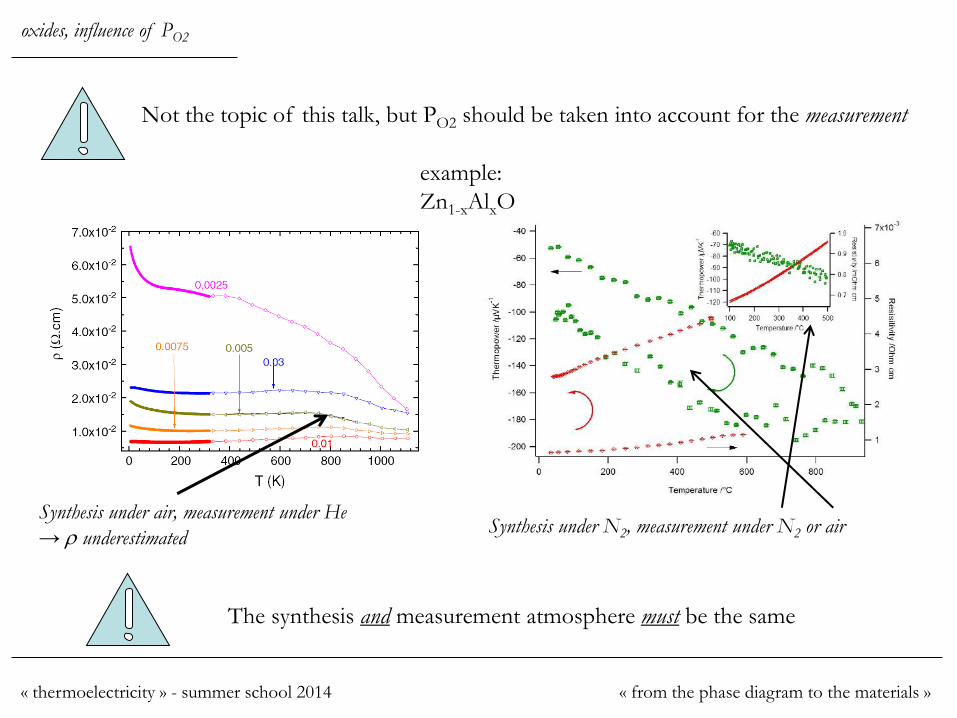
Not the topic of this talk, but PO2 should be taken into account for the measurement
Synthesis under air, measurement under He
→ r underestimated Synthesis under N2, measurement under N2 or air
The synthesis and measurement atmosphere must be the same
example:
Zn1-xAlxO
« thermoelectricity » - summer school 2014 « from the phase diagram to the materials »
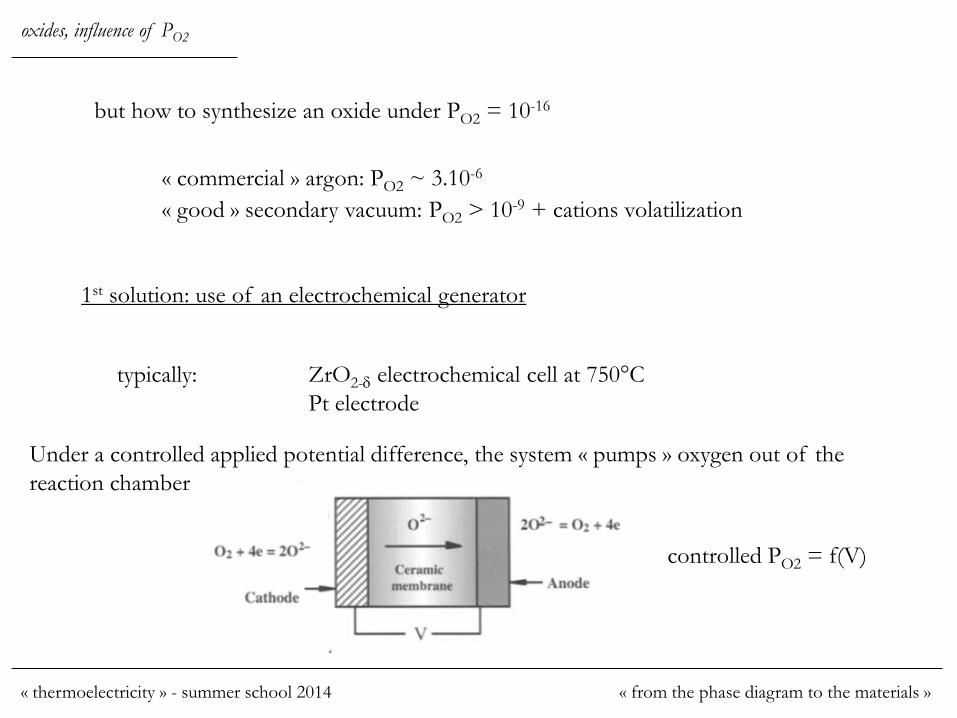
but how to synthesize an oxide under PO2 = 10-16
« commercial » argon: PO2 ~ 3.10-6
« good » secondary vacuum: PO2 > 10-9 + cations volatilization
1st solution: use of an electrochemical generator
typically: ZrO2-d electrochemical cell at 750°C
Pt electrode
Under a controlled applied potential difference, the system « pumps » oxygen out of the
reaction chamber
controlled PO2 = f(V)
oxides, influence of PO2
« thermoelectricity » - summer school 2014 « from the phase diagram to the materials »

2nd solution: use of a gaz mixture
Use of a redox couple, H2/H2O or CO/CO2
MO + H2 → M + H2O
MO + CO → M + CO2
Reducing character increases as PH2/PH2O ↑
PCO/PCO2 ↑
The controlled PH2/PH2O or PCO/PCO2 ratio is « equivalent » to a given PO2
oxides, influence of PO2
« thermoelectricity » - summer school 2014 « from the phase diagram to the materials »

example : PO2 = 10-16 at 1300°C
equivalent to:
PH2/PH2O ~ 2.103
PCO/PCO2 ~ 1.103
oxides, influence of PO2
« easily » obtained
« thermoelectricity » - summer school 2014 « from the phase diagram to the materials »
in both cases:
« easy » to create a low PO2…
… but it should correspond to the PO2 surrounding the sample
• no O2 desorbing from the pipes (electropolished stainless steel)
• no O2 desorbing close to the sample (crucibles…)
• very good sealing of the system
• preliminary purges, and flowing gas mixture before the synthesis
→ not so easy experimentally
oxides, influence of PO2
« thermoelectricity » - summer school 2014 « from the phase diagram to the materials »

→ consequences for « high temperature oxides » synthesis
densification: more and more use of SPS
• Graphite molds
• Argon(1-10 ppm O2) or vacuum (few Pa)
PO2 ~ 10-11
« SPS » conditions
→ strongly reducing conditions
→ non-stœchiometric samples
equilibrium
under air
oxides, influence of PO2
If PO2 during synthesis ≠ 0.2 atm, not « stable » under air at « high temperature »
« thermoelectricity » - summer school 2014 « from the phase diagram to the materials »

Experimentally: very quick sintering → out of equilibrium conditions
heart ≠ surface
PO2 ~ 10-11 PO2 = ??
Use of the materials at high temp → post-annealing required
as synthesized 600°C 750°C 900°C
2.0x10¹⁹
4.0x10¹⁹
6.0x10¹⁹
8.0x10¹⁹
1.0x10²⁰
1.2x10²⁰
heart
surface[n
] (
cm
-3)
post-synthesis
example : Zn1-xAlxO
• SPS (graphite mold, Ar)
• post-annealing under air, 24h
the temperature and duration of the post-annealing depend on the material
~temperature of application depends on oxygen diffusion coefficient (and T)
oxides, influence of PO2
« thermoelectricity » - summer school 2014 « from the phase diagram to the materials »
outline
Prologue : binary phase diagrams
I. single-crystalline and polycrystalline materials
II. nanocrystalline materials : top-down approaches
Epilogue : and… after the synthesis?
« thermoelectricity » - summer school 2014 « from the phase diagram to the materials »

nanostructuration: nanocomposites
2 possible approaches
« top-down » « bottom-up »
« thermodynamic » approach using
the phase diagrams:
• nanocrystalline second phase
precipitation in a bulk matrix
• phase separation with materials
structuration at micro or nano-scale
(spinodal decomposition, eutectic or
eutectoïd reaction, …)
densification of a nanocristallin powder
• synthesis using a solid route (mechanical
alloying) or liquid route
« hierarchical » structuration
Lorette Sicard, thursday
« thermoelectricity » - summer school 2014 « from the phase diagram to the materials »

nanostructuration: spinodal decomposition
Gibbs free energy with an immiscibility dome
boundaries of the immiscibility dome at T2
I II III
I and III : 02
2
dX
Gd
II : 02
2
dX
Gd
Very different behaviour
between (I-III) and (II)
« thermoelectricity » - summer school 2014 « from the phase diagram to the materials »

III I
II
binode = boundary of the
immiscibility dome
spinode
In real life, Tc ↓
(elastic stress)
• in domain II : 02
2
dX
Gd
→ any composition fluctuation: G decreases
instable situation
• in domains I and III : 02
2
dX
Gd
→ any composition fluctuation: G increases
metastable situation
nanostructuration: spinodal decomposition
« thermoelectricity » - summer school 2014 « from the phase diagram to the materials »

Assuming an alloy with composition X’0:
• at T1: solid solution
• at T2: immiscibility, but 02
2
dX
Gd
→ large composition fluctuations are
required to have G decrease
« classical » germination and growth mechanism (similar to precipitation in a liquid)
Thermodynamical barrier to overcome
nanostructuration: spinodal decomposition
« thermoelectricity » - summer school 2014 « from the phase diagram to the materials »
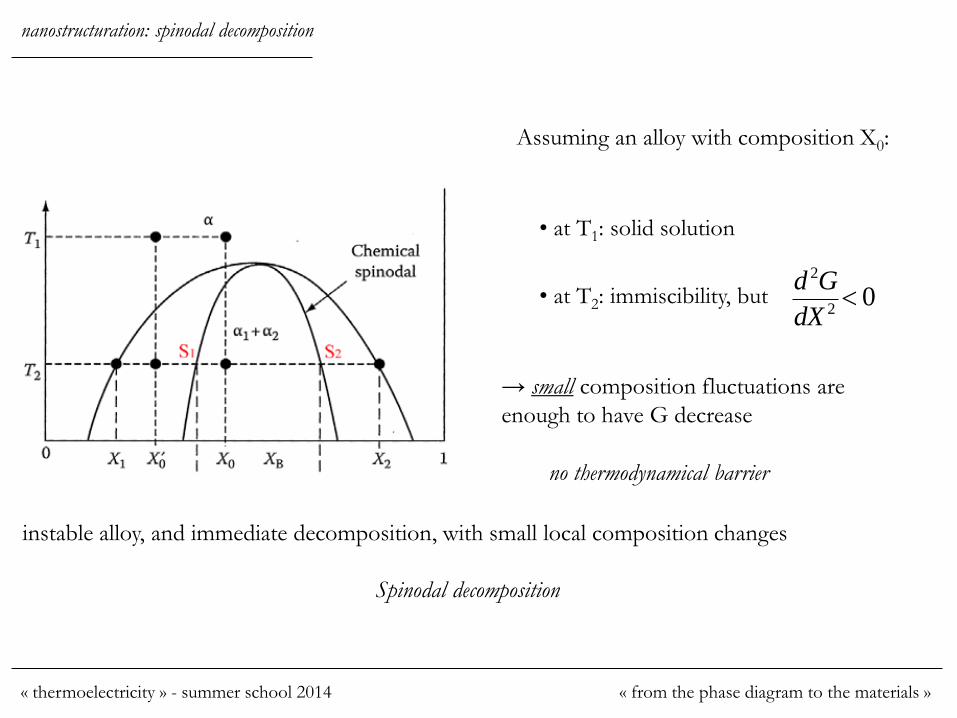
• at T2: immiscibility, but
→ small composition fluctuations are
enough to have G decrease
02
2
dX
Gd
instable alloy, and immediate decomposition, with small local composition changes
Spinodal decomposition
no thermodynamical barrier
nanostructuration: spinodal decomposition
Assuming an alloy with composition X0:
• at T1: solid solution
« thermoelectricity » - summer school 2014 « from the phase diagram to the materials »

Grains at final
composition
directly
modulation of
composition
at low temperature (slow diffusion) and « short » time, modulation at nano-scale
nanostructuration: spinodal decomposition
same final state (equilibrium)
« thermoelectricity » - summer school 2014 « from the phase diagram to the materials »
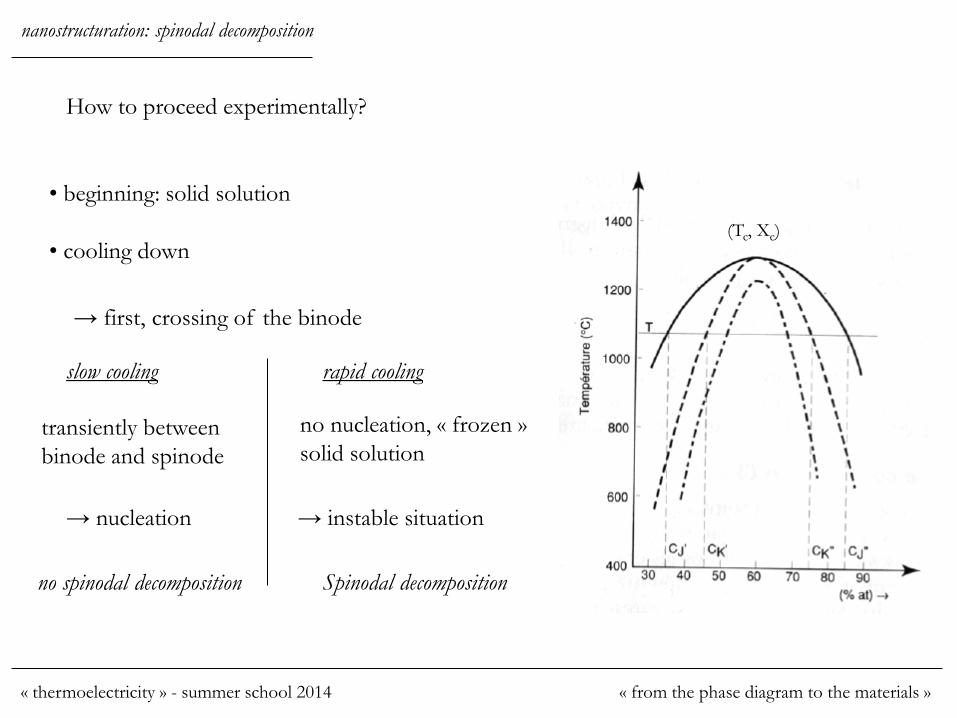
How to proceed experimentally?
(Tc, Xc)
• beginning: solid solution
• cooling down
→ first, crossing of the binode
slow cooling
transiently between
binode and spinode
→ nucleation
no spinodal decomposition
rapid cooling
no nucleation, « frozen »
solid solution
→ instable situation
Spinodal decomposition
nanostructuration: spinodal decomposition
« thermoelectricity » - summer school 2014 « from the phase diagram to the materials »
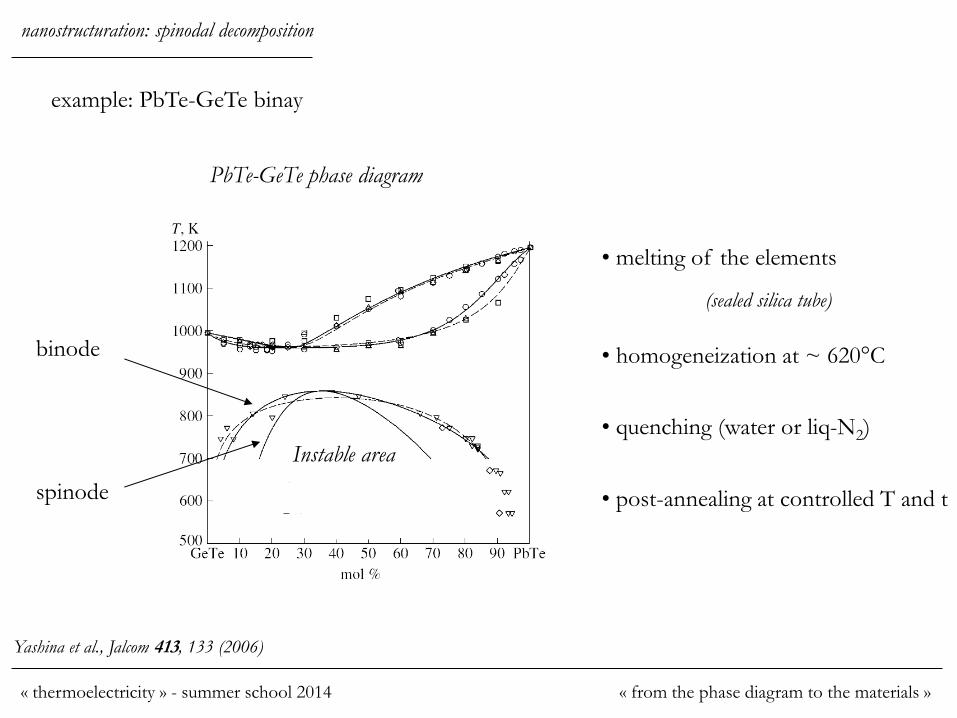
example: PbTe-GeTe binay
PbTe-GeTe phase diagram
Yashina et al., Jalcom 413, 133 (2006)
binode
spinode
• melting of the elements
(sealed silica tube)
• homogeneization at ~ 620°C
Instable area • quenching (water or liq-N2)
• post-annealing at controlled T and t
nanostructuration: spinodal decomposition
« thermoelectricity » - summer school 2014 « from the phase diagram to the materials »

Microstructure evolution:
Pb0.3Sn0.1Ge0.6Te - HRTEM
homogeneization followed by quenching in water
• one single phase
• « slight » composition fluctuations
after 16h at 500°C
Dado et al., J electron mat 39, 2165 (2010)
nanostructuration: spinodal decomposition
« thermoelectricity » - summer school 2014 « from the phase diagram to the materials »
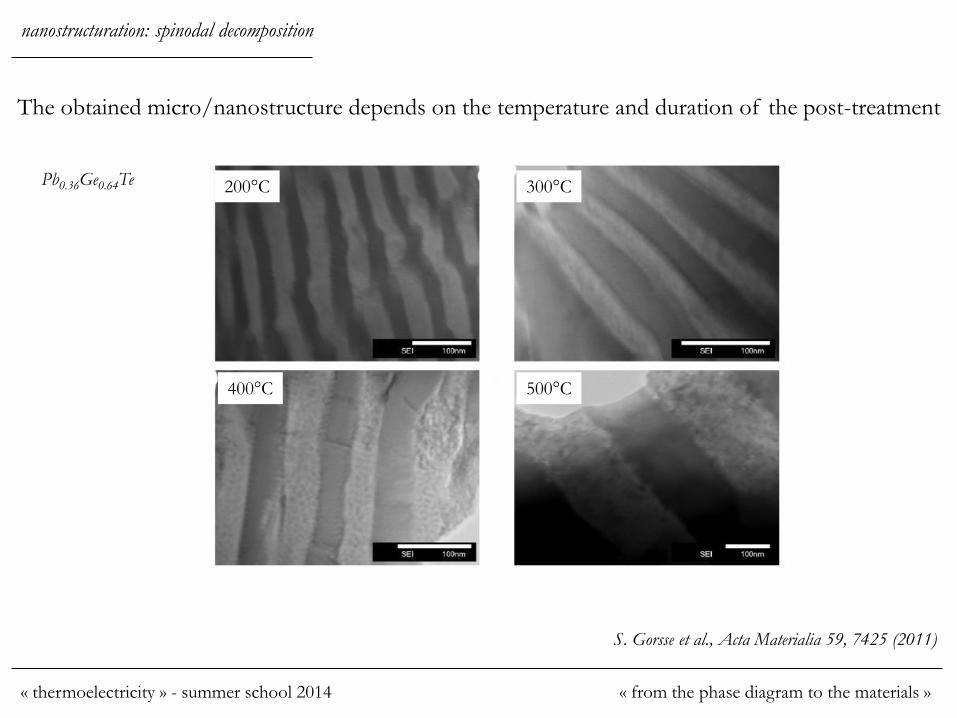
The obtained micro/nanostructure depends on the temperature and duration of the post-treatment
Pb0.36Ge0.64Te 200°C 300°C
400°C 500°C
S. Gorsse et al., Acta Materialia 59, 7425 (2011)
nanostructuration: spinodal decomposition
« thermoelectricity » - summer school 2014 « from the phase diagram to the materials »

Large variety of possible microstructures
lamellar structure fishbone structure channel network
the micro/nano-structure depends on the grains boundaries
energy, and of the duration/temperature of the treatment
same temperature but ≠ duration
nanostructuration: spinodal decomposition
« thermoelectricity » - summer school 2014 « from the phase diagram to the materials »

nanostructuration: in-situ précipitation
homogeneous solid → instability → precipitation → (nano)-composite
T2 < T < Tf T < T2
driving force : decrease of the
system Gibbs free energy
volume contribution:
surface contribution:
DGtot = DGS + DGV
elastic contribution (linked to elastic stress)
DGelas
« thermoelectricity » - summer school 2014 « from the phase diagram to the materials »

DGS , DGelas
DGvol
opposite contributions with radius:
• surface free energy ↑
• elastic free energy ↑
• volume free energy ↓
→ critical radius r* for germination
r* ↓ when T ↓
→ supersaturated solid solution
radius
nanostructuration: in-situ précipitation
« thermoelectricity » - summer school 2014 « from the phase diagram to the materials »
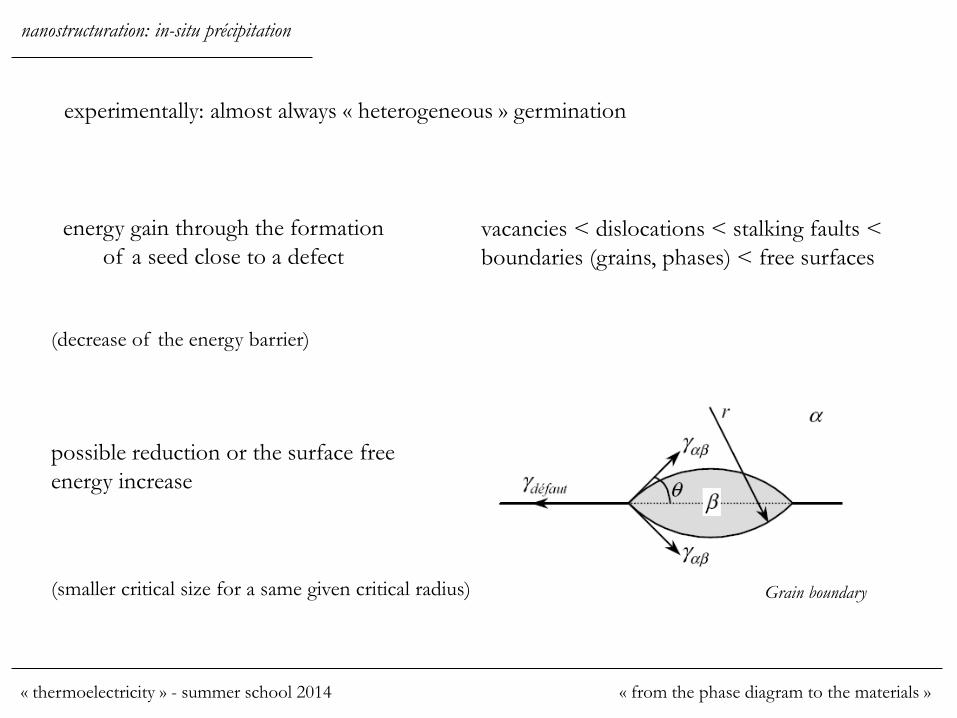
experimentally: almost always « heterogeneous » germination
energy gain through the formation
of a seed close to a defect
vacancies < dislocations < stalking faults <
boundaries (grains, phases) < free surfaces
possible reduction or the surface free
energy increase
Grain boundary (smaller critical size for a same given critical radius)
(decrease of the energy barrier)
nanostructuration: in-situ précipitation
« thermoelectricity » - summer school 2014 « from the phase diagram to the materials »
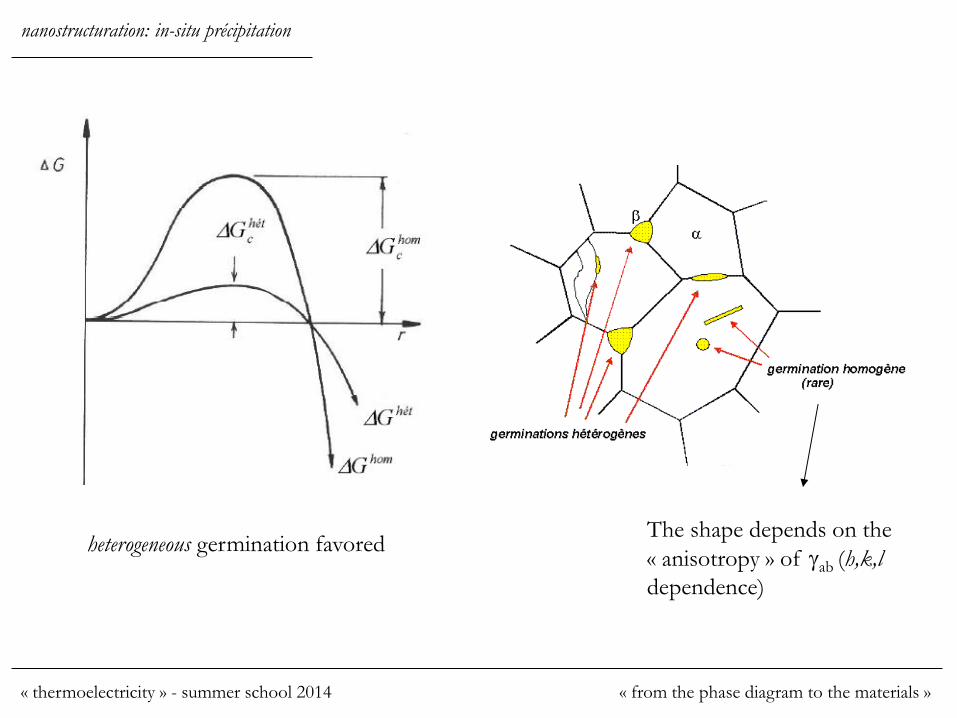
The shape depends on the
« anisotropy » of gab (h,k,l
dependence)
heterogeneous germination favored
nanostructuration: in-situ précipitation
« thermoelectricity » - summer school 2014 « from the phase diagram to the materials »

example: precipitation of Ag2Te in PbTe • melting of the elements at 1000°C
(sealed silica tubes)
• quenching
• homogeneization at 700°C
• quenching
• annealing at 500°C
(sealed silica tube)
(sealed silica tube)
• grinding + densification < 500°C
Pei et al., Adv. Func. Mat. 21, 241, 2011
nanostructuration: in-situ précipitation
depends on the phase diagram: no solubility!!
« thermoelectricity » - summer school 2014 « from the phase diagram to the materials »

Formation of Ag2Te nano-precipitates
Pei et al., Adv. Func. Mat. 21, 241, 2011
nanostructuration: in-situ précipitation
« thermoelectricity » - summer school 2014 « from the phase diagram to the materials »

example : nano-precipitates of Pb or Sb in PbTe
Obtained by melting at 1000°C followed by quenching, without post-annealing
→ most-probably not stable at the temperature of application
He et al., JACS 132, 8669 (2010)
nanostructuration: in-situ précipitation
(ZT>2 in « hierarchical » PbTe nanostructures
« thermoelectricity » - summer school 2014 « from the phase diagram to the materials »
nanostructuration
top-down approaches
• can lead to various micro/nano-structures
• « in-situ » nanostructuration → no densification step required
• possible « multi-scale » micro/nano-structures
but
• require the (good) knowledge of the phase diagram
• carriers concentration not easilly controlled
alternatives : bottom-up approaches
« thermoelectricity » - summer school 2014 « from the phase diagram to the materials »

outline
Prologue : binary phase diagrams
I. single-crystalline and polycrystalline materials
II. nanocrystalline materials : top-down approaches
Epilogue : and… after the synthesis?
« thermoelectricity » - summer school 2014 « from the phase diagram to the materials »

nanostructuration: aging
after the synthesis: the aging issue
nanocrystalline compounds, or nanocrystalline composites → out of equilibrium
• grains growth
• nanostructure growth
driving force: decrease of the interphase
tension / surface tension
Decrease of the surface/volume ratio
Question the stability of the nanostructure for a long term use at high temperature
« thermoelectricity » - summer school 2014 « from the phase diagram to the materials »
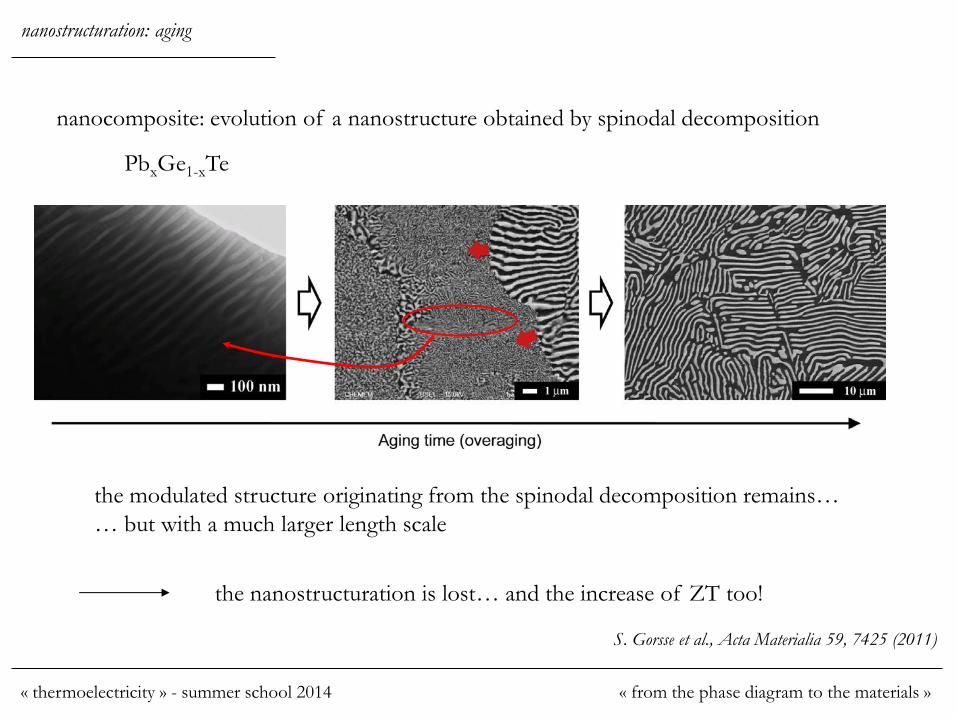
nanocomposite: evolution of a nanostructure obtained by spinodal decomposition
PbxGe1-xTe
the modulated structure originating from the spinodal decomposition remains…
… but with a much larger length scale
the nanostructuration is lost… and the increase of ZT too!
S. Gorsse et al., Acta Materialia 59, 7425 (2011)
nanostructuration: aging
« thermoelectricity » - summer school 2014 « from the phase diagram to the materials »
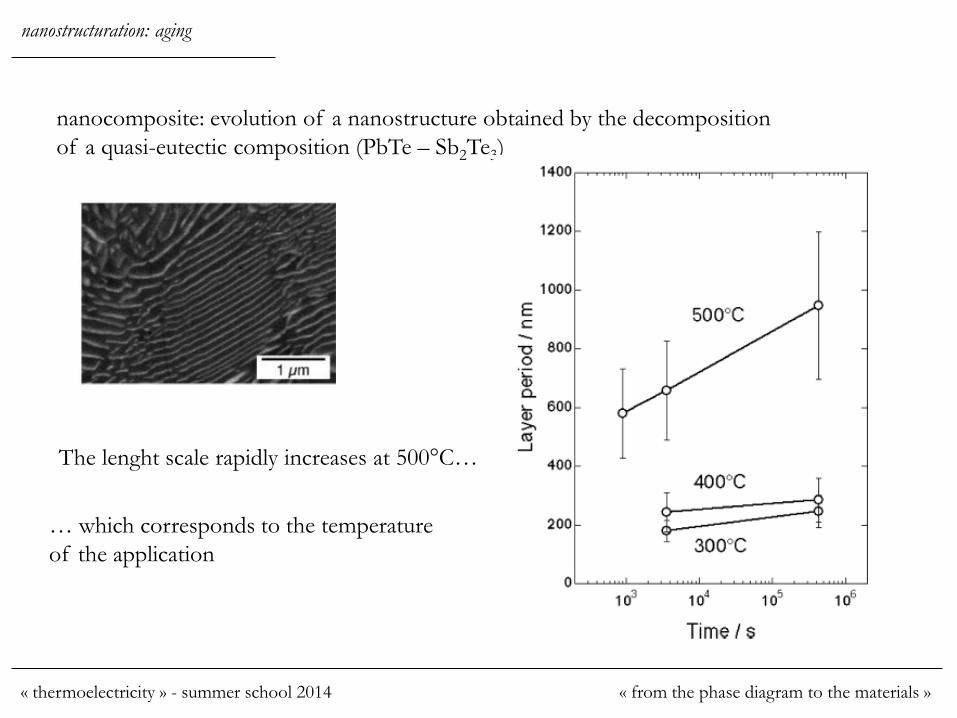
nanocomposite: evolution of a nanostructure obtained by the decomposition
of a quasi-eutectic composition (PbTe – Sb2Te3)
The lenght scale rapidly increases at 500°C…
… which corresponds to the temperature
of the application
nanostructuration: aging
« thermoelectricity » - summer school 2014 « from the phase diagram to the materials »

Nanocristalline material, example: Zn1-xGaxO
densified at 200°C under 500 MPa → d = 27 nm
short annealing at different temperatures
strong crystal above 700°C…
… for applications at 800-1000°C !
nanostructuration: aging
« thermoelectricity » - summer school 2014 « from the phase diagram to the materials »
possible solutions?
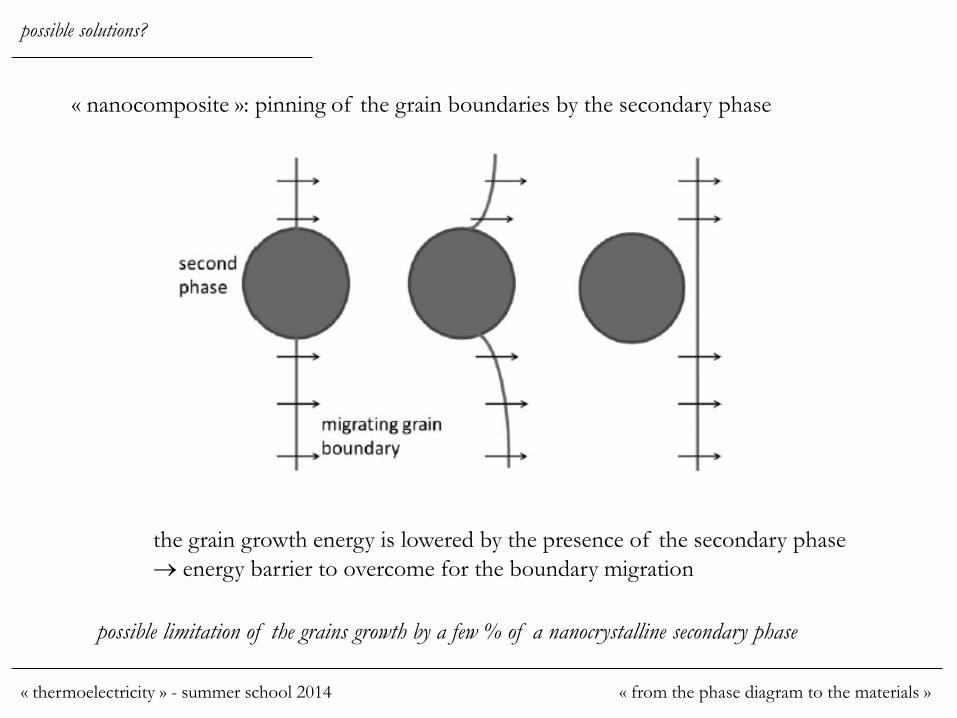
« nanocomposite »: pinning of the grain boundaries by the secondary phase
the grain growth energy is lowered by the presence of the secondary phase
energy barrier to overcome for the boundary migration
possible limitation of the grains growth by a few % of a nanocrystalline secondary phase
« thermoelectricity » - summer school 2014 « from the phase diagram to the materials »
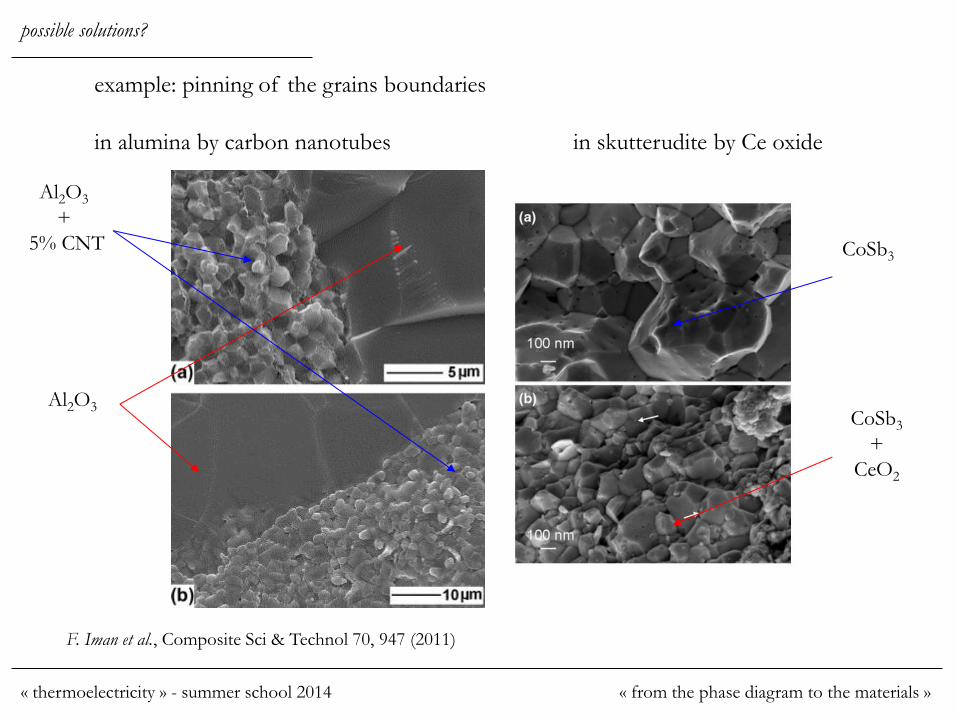
F. Iman et al., Composite Sci & Technol 70, 947 (2011)
example: pinning of the grains boundaries
in alumina by carbon nanotubes in skutterudite by Ce oxide
Al2O3
Al2O3
+
5% CNT
possible solutions?
CoSb3
CoSb3
+
CeO2
« thermoelectricity » - summer school 2014 « from the phase diagram to the materials »

further reading:
• S-J. L. Kang, « Sintering : Densification, Grain growth and microstructure », Butterworth-Heinemann
• Kanatzidis, « The Metal Flux: A Preparative Tool for the Exploration of Intermetallic Compounds »,
Angewandte Chem Int Ed 44, 6996 (2005)
• C. Carter, « Kinetics of materials », Wiley Interscience
• D.A. Porter, « Phase transformations in metal and alloys », Chapman et Hall
« thermoelectricity » - summer school 2014 « from the phase diagram to the materials »