þ r j c rpqv q q q q - europa q2 2016.pdf · albita sculeni ubla vysne nemecke terehova narva...
TRANSCRIPT

Q2Q1Q3 Q4
Eastern Partnership Risk Analysis Network Quarterly Quarter 2 • April–June 2016

Frontex official publications fall into four main categories: risk analysis, training, operations and research, each marked with a distinct graphic identifier. Risk analysis publications bear a triangular symbol formed by an arrow drawing a triangle, with a dot at the centre. Metaphorically, the arrow represents the cyclical nature of risk analysis processes and its orientation towards an appropriate operational response. The triangle is a symbol of ideal proportions and knowledge, reflecting the pursuit of factual exactness, truth and exhaustive analysis. The dot at the centre represents the intelligence factor and the focal point where information from diverse sources converges to be processed, systematised and shared as analytical products. Thus, Frontex risk analysis is meant to be at the centre and to form a reliable basis for its operational activities.
Plac Europejski 6 00-844 Warsaw, PolandT +48 22 205 95 00 F +48 22 205 95 01 [email protected] www.frontex.europa.eu
Warsaw, October 2016 Risk Analysis Unit Frontex reference number: 18237 / 2016
OPOCE Catalogue number TT-AK-16-002-EN-N ISSN 2467-3684
© Frontex, 2016 All rights reserved. Reproduction is authorised provided the source is acknowledged.
DISCLAIMERSThis is a Frontex staff working document. Its contents do not imply the expression of any opinion whatsoever on the part of Frontex concerning the legal status of any country, territory or city or its authorities, or concerning the delimitation of its frontiers or boundaries. All charts included in this report are the sole property of Frontex and any unauthorised use is prohibited.
ACKNOWLEDGMENTSThe Eastern Partnership Risk Analysis Network Quarterly has been prepared by the Frontex Risk Analysis Unit. During the course of developing this product, many colleagues at Frontex and from the EaP-RAN contributed to it and their assistance is hereby acknowledged with gratitude.

Table of contents Introduction #3
I. Situational overview #4
Summary of EaP-RAN indicators #5
Situation at the border #6
Border surveillance #6
Border checks #8
Situation in the Eastern Partnership region #10
Illegal stay in EaP-RAN countries #10
II. Statistical annex #11
w
1 of 17
EaP-RAN · Q2 2016

2 of 17
FRAN · q1 2015
List of abbreviations used
BCP border-crossing pointCIS Community of Independent StatesEaP Eastern PartnershipEaP-RAN Eastern Partnership Risk Analysis NetworkEB-RAN Eastern European Borders Risk Analysis Network (now defunct)EDF European Union Document-FraudEU European UnionEUR euroFRAN Frontex Risk Analysis NetworkFrontex European Agency for the Management of Operational Cooperation at the External Borders of the Member States
of the European UnionICJ International Court of JusticeID identification documentn.a. not availableQ/Qtr quarter of the yearRAU Frontex Risk Analysis UnitRUB Russian roubleSAC Schengen Associated CountriesUNSCR United Nations Security Council Resolution
2 of 17
3 of 17
FRAN · q1 2015
Introduction
As of January 2016, three new countries joined the Eastern Borders Risk Analysis Network (EB-RAN) operating under the EU-funded Eastern Partnership Integrated Border Management Capacity Building Project: Armenia, Azerbaijan and Geor-gia. Upon this extension, the network has been renamed as the Eastern Partnership Risk Analysis Network (EaP-RAN).
Concept
The Eastern Partnership Risk Analysis Network (EaP-RAN) performs monthly exchanges of statistical data and informa-tion on the most recent irregular migra-tion trends. This information is compiled at the level of the Frontex Risk Analysis Unit (RAU) and analysed in cooperation with the regional partners on a quarterly and annual basis. The annual reports of-fer a more in-depth analysis of the occur-ring developments and phenomena which
impact the regional and common bor-ders while the quarterly reports are meant to provide regular updates and identify emerging trends in order to maintain sit-uational awareness. Both types of reports are aimed at offering support for strategic and operational decision making.
Methodology
The Eastern Partnership Quarterly statis-tical overview is focused on quarterly de-velopments for the seven key indicators of irregular migration: (1) detections of ille-gal border-crossing between BCPs; (2) de-tections of illegal border-crossing at BCPs; (3) refusals of entry; (4) detections of ille-gal stay; (5) asylum applications; (6) de-tections of facilitators; and (7) detections of fraudulent documents.1
The backbone of this overview are monthly statistics provided within the framework
1 Please note that the analysis of this indicator is now limited to EaP countries only given that EU Member States have transitioned to the European Union Document-Fraud (EDF) reporting scheme;
of the EaP-RAN (Armenia, Azerbaijan2, Be-larus, Georgia, Moldova and Ukraine) and reference period statistics from common border sections of the neighbouring EU Member States and Schengen Associated Countries (Norway, Finland, Estonia, Lat-via, Lithuania, Poland, Slovakia, Hungary and Romania). The data are processed, checked for errors and merged into an Ex-cel database for further analysis.
Structure
The general Situational overview broken down by main areas of work of border-control authorities and police activities related to irregular migration. The cur-rent issue of the Eastern Partnership Risk Analysis Network Quarterly is the second following the extension of the network with new members.
2 Data for Armenia and Azerbaijan not available for Q2 2016 for technical reasons
3 of 17
EaP-RAN · Q2 2016
Featured Risk Analyses
4 of 17
I. Situational overview
Source: Frontex RAU Analytics Team
Skopje
Zahony
Medininkai
Dorohusk
Korczowa
Medyka
Kuznica
Galati
AlbitaSculeni
Ubla
Vysne Nemecke
Terehova
Narva
Terespol
PulemetsDomanove
Dolsk
Vystupovych
Novi Yarylovych
Sokyriany
Mohyliv Podilskyi
Tudora
Palanca
Guguti
Red Bridge
Sadakhlo
SarpiLagodeekhi
Vale
Kazbegi
Niirala
ImatraNuijamaa
Vaalimaa
Warsaw
Chisinau
Athens
Yerevan
Sofia
Riga
Kyiv
Helsinki
Minsk
Budapest
BakuTirana
BelgradeBucharest
Podgorica
Tallinn
Ankara
Moscow
Vilnius
TbilisiGeorgia
BELARUS
Ukraine
Azerbaijan
Az.
Armenia
Moldova
Iraq
Kazakhstan
Russian Federation
Russian Federation
Russian Federation
Bulgaria
Greece
Syria
Turkey
Hungary
Poland
Slovakia
Estonia
Finland
Latvia
Lithuania
Romania
Iran
Serbia
Norway
Finland
Storskog
Salla
Raja-Jooseppi
National capitals
Main BCPs
Main BCPs of the EaP-RAN countries
Borders covered by EU/SAC data only
Main roads
External borders of EaP countries
Eastern Partnership (EaP) borders
Common borders
Eastern Partnership countries
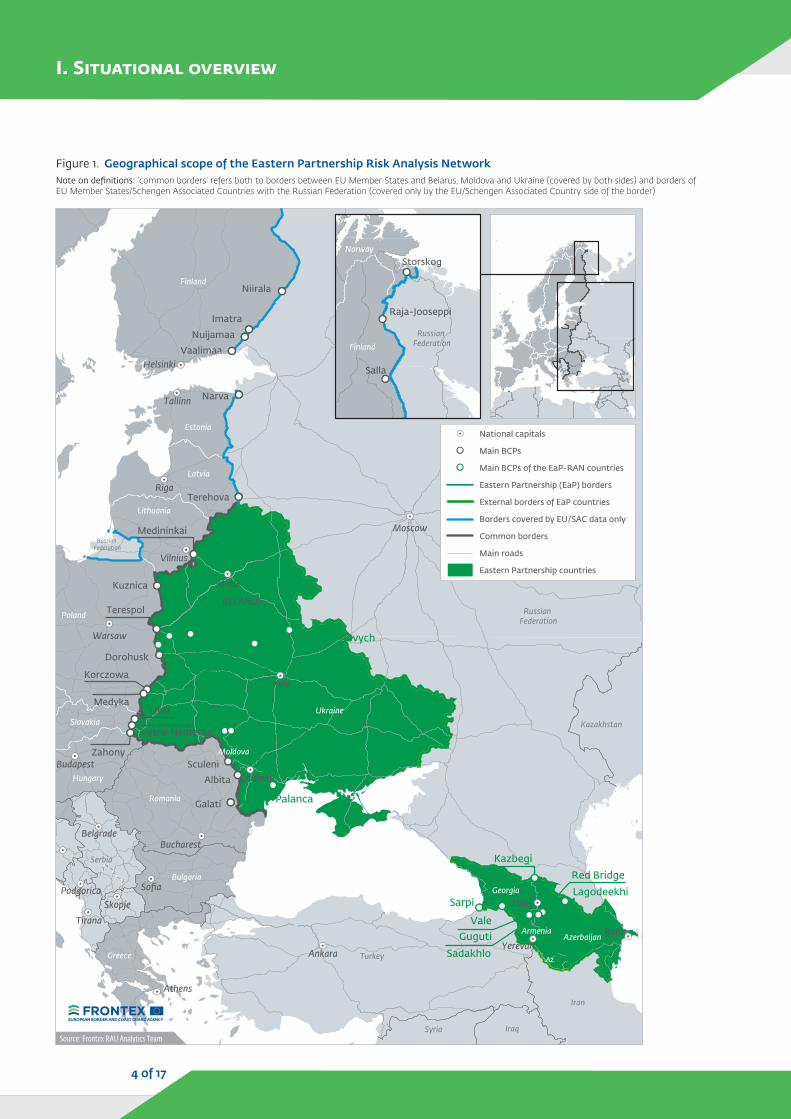
Figure 1. Geographical scope of the Eastern Partnership Risk Analysis NetworkNote on definitions: ‘common borders’ refers both to borders between EU Member States and Belarus, Moldova and Ukraine (covered by both sides) and borders of EU Member States/Schengen Associated Countries with the Russian Federation (covered only by the EU/Schengen Associated Country side of the border)

Summary of EaP-RAN indicators
5 of 17
EaP-RAN · Q2 2016
Table 1. Summary of FRAN, EaP-RAN and selected EU Member State indicators for Q2 2016
EU total EU Member States (eastern
land borders only)** % of EU total only EaP-RAN countries*
Indicator
Illegal border-crossing between BCPs 75 044 11 348 15.1% 555
Clandestine entries 403 36 8.9% 3 971Facilitators 3 522 208 5.9% 16Illegal stay 111 874 12 869 12% 6 667Refusals of entry 33 792 15 744 47% 12 483
Applications for asylum 290 153 21 840 8% 180
False travel documents n.a. n.a. n.a. 125Return decision issued 73 037 19 671*** 27% n.a.Effective returns 46 365 8 263*** 18% n.a.
* Belarus, Georgia, Moldova and Ukraine
** Norway, Finland, Estonia, Latvia, Lithuania, Poland, Slovakia, Hungary and Romania
*** Total numbers reported in FRAN by Norway, Finland, Estonia, Latvia, Lithuania, Poland, Slovakia, Hungary and Romania
Source: FRAN and EaP-RAN data as of 10 August 2016

Featured Risk Analyses
Illegal border-crossing
During the second quarter of 2016, 874 persons were detected for illegal bor-der-crossing between BCPs by the East-ern Partnership Risk Analysis Network (EaP-RAN) member countries.1 Ukraine reported the highest number of detec-tions, followed by Latvia and Hungary. The most significant growth in detec-tions was reported by Latvia at the Lat-vian-Russian border section.
Almost 57% detections involved regional nationals (citizens of EaP and CIS coun-tries), mostly Ukrainians, Russians and Moldovans. The vast majority of these cases (82%) were reported as being linked
1 Data for Armenia and Azerbaijan not available
Border surveillance
Situation at the border
18 PVC inflatable boats detected in Belarus
On 5 May 2016 Belarusian border guards of the Gomel region, together with police officers and representatives of the Tax In-spection, uncovered 18 PVC boats trans-ported in a car by a Belarusian citizen.
It cannot be excluded that the boats might have been designated for illegal border-crossing into the EU via border rivers.Source: State Border Committee of the Republic of Belarus (gpk.gov.by), 6 May 2016
6 of 17
I. Situational overview
Source: FRAN and EaP data as of 10 August 2016
@
@@
@
@@
@
@
@
@
@
@
@
@
@
@
@
@
@
-52%
-41%
44%
61%
-88%
-62%
-31%
93%
-66%
N.A.
N.A.
N.A.
40%
-5%
18%
-33%-13%6%
Moldova
N.A.
RussianFederation
Ukraine
Poland
Belarus
Finland
Romania
Latvia
Serbia
Bulgaria
Hungary
Lithuania
Estonia
Slovakia
Sweden
Croatia
@
@
@
Armenia
N.A.N.A.
N.A.
AZ
RussiaFederation
Turkey
Azerbaijan
Iran
Georgia
Kazakhstan
@
@@
Figure 2. Detections of illegal border-crossing between BCPs reported by EaP-RAN members at all borders show that the highest pressure in Q2 2016 was recorded at the Latvian-Russian border section, which showed the highest increase when compared with Q2 2015Detections of illegal border-crossing between BCPs at all borders covered by the EaP-RAN in Q2 2016
© State Border Committee of the Republic of Belarus

either to smuggling or to other reasons not related to migration.
Non-regional migrants, mostly Afghans and Vietnamese, constituted 43% of the detected cases. Irregular migration was the main reason for crossing the border illegally for both nationalities.
At the common borders, detections of il-legal border-crossing between BCPs in-creased by almost 17% compared with the first quarter 2016 and dropped by 46% in relation to the same quarter of 2015.
At the Eastern Partnership and exter-nal borders1, 324 cases of illegal bor-der-crossing were detected. More than three-quarters of detections took place at Ukrainian borders, involving mostly re-gional migrants, i.e. Ukrainians and Mol-dovans. Non-regional migrants (mostly citizens of Vietnam, Turkey and Iran) were detected in very low numbers.
1 Data for Armenia and Azerbaijan not available
Facilitators
When compared with the first quarter of 2016, the number of detected facili-tators at the common borders signifi-cantly decreased (from 205 in Q1 2016 to 45 in Q2 2016). The drop can be ex-plained by the definite closure of the so-called Arctic route.
As regards nationality, the facilitators were mostly citizens of the Russian Fed-eration (of Caucasus origin), Belarus and Estonia.
7 of 17
EaP-RAN · Q2 2016

Featured Risk Analyses
Border checks
Clandestine entries
In the second quarter of 2016, there were 15 cases of clandestine entry attempts re-ported by Romania, Poland, Georgia and Slovakia, and were related to Ukraini-ans, Russians, Moldovans and Georgians.
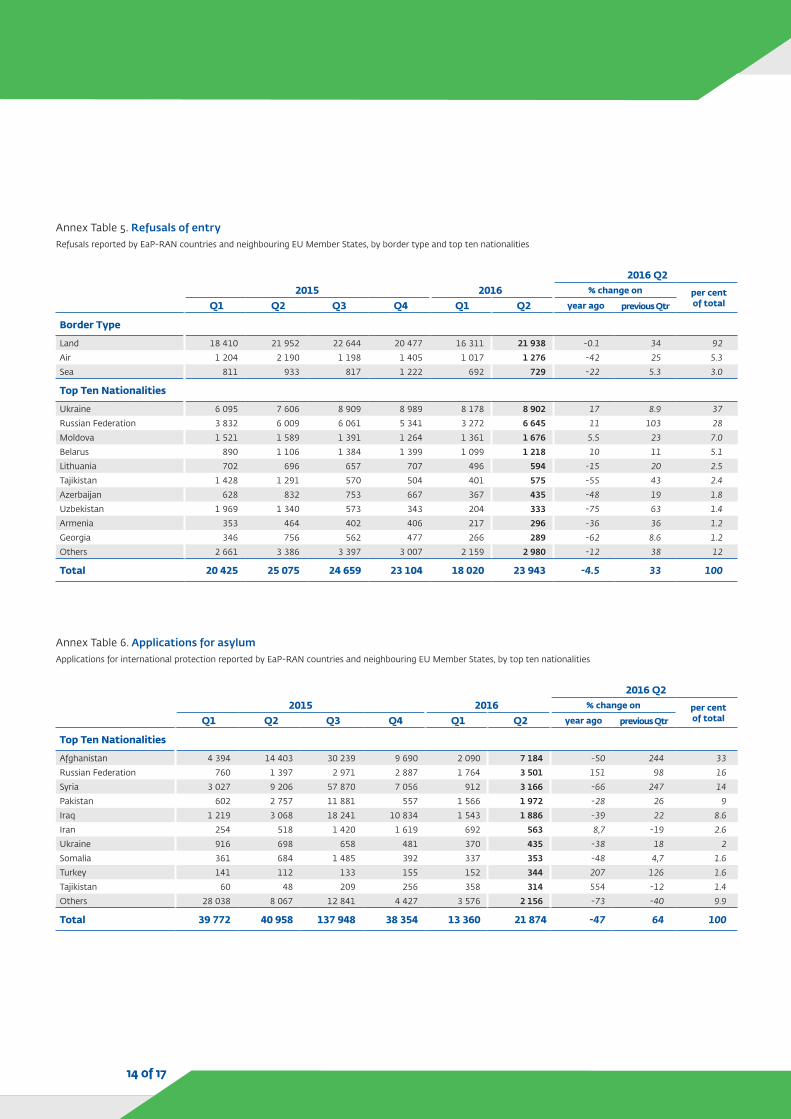
Refusals of entry
There were 25 604 refusals of entry re-ported during the second quarter 2016 by members of the Eastern Partnership Risk Analysis Network. Nearly 90% of refus-als were issued at land borders, mostly by Poland and Belarus. The top three re-fused entry were citizens of Ukraine, the Russian Federation and Moldova.
At the common borders, refusals of en-try issued by the EU Member States and Schengen Associated Countries increased by over 24% in relation to Q1 2016, and by 41% in relation to the same period of 2015.
The vast majority were reported by Po-land with Ukrainian and Russian citizens representing the top two nationalities.
Over 12 480 refusals were reported by Eastern Partnership countries. 78% and 15%, respectively, were issued at land and air borders. Belarus issued the majority of refusals, followed by Ukraine and Georgia.
Document fraud
During the second quarter of 2016, there were 125 detections of persons using fraudulent documents reported by four Eastern Partnership countries (Belarus, Georgia, Moldova and Ukraine). A grow-ing number of detections was registered by all the reporting countries apart from Belarus. Most detections were made by Ukraine.
As regards nationalities, Ukrainians, Mol-dovans and Georgians were the most frequently detected among fraudulent document users.
8 of 17
I. Situational overview
A fantasy ‘diplomatic passport’ in hands of Russian citizen
In May 2016, a 50-year-old Russian citizen, driving a Porsche 911 Carrera, presented a non-existing diplomatic passport at the BCP Panemunė while travelling from the Kaliningrad Oblast to Lithuania. The fantasy document carried the name of the ‘International Human Rights Defence Committee Diplomatic Passport’ did not entitle him to enter the EU.Source: State Border Guard Service of the Republic of Lithuania (www.pasienis.lt), 23 May 2016
© S
tate
Bor
der G
uard
Ser
vice
of t
he R
epub
lic o
f Lith
uani
a
© S
tate
Bor
der G
uard
Ser
vice
of t
he R
epub
lic o
f Lith
uani
a

The vast majority of detected fraudulent documents were passports (90%). False entry/exit stamps, visas and ID cards, ac-counted for 6% of all fraudulent docu-ments reported.
Similar to the previous quarter, visa abuse remained one of the main modi operandi used by non-regional migrants in an at-tempt to enter the EU. Moreover, fraudu-lently obtained visas are likely to be used by OCGs as an effective tool in their THB activities. Open sources indicate that a growing number of Russian student visas are used for trafficking people from Ni-geria to the Russian Federation (see box).
THB from Nigeria on Russian student visas
According to some Moscow-based NGOs focusing on preventing human trafficking, around 2 000-3 000 Nigerian girls are brought to the Russian Federation each year for prostitution. Criminal groups appear to be taking advantage of Russian student vi-sas, which are not easy to obtain, as universities must provide supporting documents for the applications. Nigerians come to the Russian Federation officially to study and then disappear for years into the sex trade and the authorities are unable to track them.
Girls in Nigeria are lured by promises of a well-paid job in the Russian Federation allow-ing them to reimburse the costs of the visa and the journey (estimated at the level of USD 40 000). Surprisingly, even illiterate teenagers were being trafficked to the Russian Federation on the basis of student visas officially to study at a university.
The Head of Mission at the Nigerian Embassy in Moscow is aware of Nigerians being trafficked for sex to Russia and indicated that this phenomenon has been growing, as it was not such a huge problem ten years ago. Source: www.dw.com, 21 April 2016
9 of 17
EaP-RAN · Q2 2016

Featured Risk Analyses
10 of 17
I. Situational overview
Situation in the Eastern Partnership region
Illegal stay in EaP-RAN countries
In the second quarter of 2016 there were over 6 660 detections of illegal stay re-ported by Belarus, Georgia, Moldova and Ukraine. The top five detected nationalities included Russians, Ukrainians, Moldovans, Georgians and Azerbaijanis. Citizens of the Russian Federation and Azerbaijan were mostly detected by Ukraine, while Ukrain-ians, Georgians and Moldovans tended to be reported by Belarus.
99% of detections of illegal stay were re-ported on exit. Ukrainian borders were the most affected ones, followed by Be-larusian airports.
In the case of Belarus, Georgia, Moldova and Ukraine only (reporting countries in Q1 2016 and Q2 2016), detections of illegal stay in Q2 2016 show a 6% increase when compared with the first quarter of 2016. The growth was mostly related to an in-creased number of Ukrainians and Mol-dovans detected for illegal stay on exit at Eastern Partnership land borders.
Operation ‘Frontier-2016’ ongoing in Ukraine
Following the operation ‘Frontier-2015’, which led to the detection of over 1 970 irregu-lar migrants, the State Border Guard Service of Ukraine launched the operation ‘Fron-tier-2016’ as of 20 April 2016. This national-scale operation includes close cooperation of the majority of Ukrainian ministries and departments, as well as representatives of law-enforcement authorities of the neighbouring countries.
The operation aims at combating irregular migration, human trafficking, illegal movement of excise goods and smuggling of drugs and weapons across the state border of Ukraine.
The main objectives of the operation are to perform regular checks of the most frequent places of stay of irregular migrants as well as comprehensive inspections of roads, airports, sea and river harbours and vessels to identify routes and channels of irregular migra-tion flows across the territory of Ukraine. Moreover, the operation involves strength-ened controls in border areas and cooperation with neighbouring EU Member States.
According to open sources, from the beginning of the operation ‘Frontier-2016’ until mid-July, 705 persons were detected breaching the state border, over 1 600 persons abus-ing border regime detained and 102 irregular migrants apprehended. In addition, more than 28 tonnes of contraband alcohol, nearly 1 million packs of cigarettes, 150 kg of am-ber, 38 kg of drugs and 120 weapons were seized.Source: State Border Guard Service of Ukraine

LEGEND
Symbols and abbreviations: n.a. not applicable : data not available
Source: EaP-RAN and FRAN data as of 10 August 2016, unless otherwise indicated
II. Statistical annex
11 of 17
EaP-RAN · Q2 2016

FRAN · q1 2015
Annex Table 1. Illegal border-crossing between BCPsDetections reported by EaP-RAN countries and neighbouring EU Member States, by purpose of illegal border-crossing and top ten nationalities
2016 Q2
2015 2016 % change on per cent of totalQ1 Q2 Q3 Q4 Q1 Q2 year ago previous Qtr
Purpose of Illegal Border-Crossing
Irregular migration 373 762 944 607 377 400 -48 6.1 44Other 235 322 560 239 274 289 -10 5.5 32Smuggling 86 169 133 93 97 139 -18 43 15Not specified 75 161 250 166 55 80 -50 45 8.8
Top Ten Nationalities
Ukraine 201 335 483 236 246 277 -17 13 31
Vietnam 100 283 254 122 66 158 -44 139 17
Moldova 56 88 107 70 93 92 4.5 -1.1 10Russian Federation 52 82 111 61 65 82 0 26 9.0Afghanistan 66 212 277 241 99 59 -72 -40 6.5Sri Lanka 3 12 17 40 41 31 158 -24 3.4Belarus 28 24 38 23 21 30 25 43 3.3Georgia 68 107 145 25 23 30 -72 30 3.3India 0 17 11 2 16 21 24 31 2.3Bangladesh 5 12 13 7 4 18 50 350 2.0Others 190 242 431 278 129 110 -55 -15 12
Total 769 1 414 1 887 1 105 803 908 -36 13 100
Annex Table 2. Illegal border-crossing at BCPsDetections reported by EaP-RAN countries and neighbouring EU Member States, by purpose of illegal border-crossing and top ten nationalities
2016 Q2
2015 2016 % change on per cent of totalQ1 Q2 Q3 Q4 Q1 Q2 year ago previous Qtr
Purpose of Illegal Border-Crossing
Other 3 049 6 035 4 574 4 001 3 101 3 800 -37 23 96Smuggling 91 98 93 96 118 128 31 8.5 3.2Irregular migration 35 44 32 26 26 20 -55 -23 0.5
Not specified 1 1 0 1 14 10 900 -29 0.3
Top Ten Nationalities
Ukraine 2 948 5 893 4 423 3 832 2 992 3 706 -37 24 94Moldova 158 207 129 141 181 181 -13 0 4.6Romania 16 13 28 26 18 33 154 83 0.8Russian Federation 9 19 47 37 23 14 -26 -39 0.4Belarus 7 6 6 18 3 3 -50 0 0.1Poland 1 2 1 2 3 3 50 0 0.1Bulgaria 1 1 3 7 2 2 100 0 0.1Not specified 3 5 5 2 5 2 -60 -60 0.1Uzbekistan 2 2 2 8 2 2 0 0 0.1United States 0 0 1 0 0 2 n.a. n.a. 0.1Others 31 30 54 51 30 10 -67 -67 0.3
Total 3 176 6 178 4 699 4 124 3 259 3 958 -36 21 100
12 of 17

13 of 17
FRAN · q1 2015
Annex Table 3. FacilitatorsDetections reported by EaP-RAN countries and neighbouring EU Member States, by place of detection and top ten nationalities
2016 Q2
2015 2016 % change on per cent of totalQ1 Q2 Q3 Q4 Q1 Q2 year ago previous Qtr
Place of Detection
Land 50 33 59 47 205 49 48 -76 92Air 3 1 0 0 1 4 300 300 7.5
Top Ten Nationalities
Russian Federation 16 14 24 12 11 22 57 100 42Belarus 12 2 0 7 5 11 450 120 21Estonia 2 1 0 2 0 6 500 n.a. 11Ukraine 0 2 11 6 5 3 50 -40 5.7Slovakia 0 0 1 2 0 2 n.a. n.a. 3.8Turkey 0 1 0 0 2 2 100 0 3.8Latvia 0 4 8 2 0 2 -50 n.a. 3.8Poland 2 0 0 0 2 2 n.a. 0 3.8Finland 0 0 0 0 0 1 n.a. n.a. 1.9Ecuador 0 0 0 0 0 1 n.a. n.a. 1.9Others 21 10 15 15 181 1 -90 -99 1.9
Total 53 34 59 47 206 53 56 -74 100
Annex Table 4. Illegal stayDetections reported by EaP-RAN countries and neighbouring EU Member States, by place of detection and top ten nationalities
2016 Q22015 2016 % change on per cent
of totalQ1 Q2 Q3 Q4 Q1 Q2 year ago previous Qtr
Place of Detection
Land 5 996 7 426 9 904 9 890 7 160 8 438 14 18 84Air 1 558 1 640 1 703 1 341 1 267 1 492 -9 18 15Sea 55 101 101 60 46 76 -25 65 0.8Between BCPs 109 60 155 57 22 41 -32 86 0.4Inland 37 25 24 30 12 25 0 108 0.2
Top Ten Nationalities
Ukraine 2 135 3 060 4 625 4 981 3 019 4 137 35 37 41Russian Federation 1 962 1 829 2 202 1 748 1 505 1 349 -26 -10 13Moldova 549 775 852 1 019 840 1 098 42 31 11Georgia 627 792 743 448 381 498 -37 31 4.9Belarus 288 318 455 346 315 341 7.2 8.3 3.4Azerbaijan 286 330 402 466 338 303 -8.2 -10 3.0Turkey 150 153 169 189 281 236 54 -16 2.3Hungary 159 157 154 165 185 173 10 -6.5 1.7Romania 94 84 83 180 77 157 87 104 1.6Poland 132 177 230 168 143 148 -16 3.5 1.5Others 1 373 1 577 1 972 1 668 1 423 1 632 3.5 15 16
Total 7 755 9 252 11 887 11 378 8 507 10 072 8.9 18 100
13 of 17
EaP-RAN · Q2 2016
14 of 17
FRAN · q1 2015
Annex Table 5. Refusals of entryRefusals reported by EaP-RAN countries and neighbouring EU Member States, by border type and top ten nationalities
2016 Q22015 2016 % change on per cent
of totalQ1 Q2 Q3 Q4 Q1 Q2 year ago previous Qtr
Border Type
Land 18 410 21 952 22 644 20 477 16 311 21 938 -0.1 34 92Air 1 204 2 190 1 198 1 405 1 017 1 276 -42 25 5.3Sea 811 933 817 1 222 692 729 -22 5.3 3.0
Top Ten Nationalities
Ukraine 6 095 7 606 8 909 8 989 8 178 8 902 17 8.9 37Russian Federation 3 832 6 009 6 061 5 341 3 272 6 645 11 103 28Moldova 1 521 1 589 1 391 1 264 1 361 1 676 5.5 23 7.0Belarus 890 1 106 1 384 1 399 1 099 1 218 10 11 5.1Lithuania 702 696 657 707 496 594 -15 20 2.5Tajikistan 1 428 1 291 570 504 401 575 -55 43 2.4Azerbaijan 628 832 753 667 367 435 -48 19 1.8Uzbekistan 1 969 1 340 573 343 204 333 -75 63 1.4Armenia 353 464 402 406 217 296 -36 36 1.2Georgia 346 756 562 477 266 289 -62 8.6 1.2Others 2 661 3 386 3 397 3 007 2 159 2 980 -12 38 12
Total 20 425 25 075 24 659 23 104 18 020 23 943 -4.5 33 100
Annex Table 6. Applications for asylumApplications for international protection reported by EaP-RAN countries and neighbouring EU Member States, by top ten nationalities
2016 Q22015 2016 % change on per cent
of totalQ1 Q2 Q3 Q4 Q1 Q2 year ago previous Qtr
Top Ten Nationalities
Afghanistan 4 394 14 403 30 239 9 690 2 090 7 184 -50 244 33Russian Federation 760 1 397 2 971 2 887 1 764 3 501 151 98 16Syria 3 027 9 206 57 870 7 056 912 3 166 -66 247 14Pakistan 602 2 757 11 881 557 1 566 1 972 -28 26 9Iraq 1 219 3 068 18 241 10 834 1 543 1 886 -39 22 8.6Iran 254 518 1 420 1 619 692 563 8,7 -19 2.6Ukraine 916 698 658 481 370 435 -38 18 2Somalia 361 684 1 485 392 337 353 -48 4,7 1.6Turkey 141 112 133 155 152 344 207 126 1.6Tajikistan 60 48 209 256 358 314 554 -12 1.4Others 28 038 8 067 12 841 4 427 3 576 2 156 -73 -40 9.9
Total 39 772 40 958 137 948 38 354 13 360 21 874 -47 64 100
14 of 17

15 of 17
FRAN · q1 2015
Annex Table 7. Document fraudDetections reported by EaP-RAN countries, by border type, document type, top ten nationalities and top ten countries of issuance of documents
2016 Q22015 Q4 2016 % change on per cent
of totalQ1 Q2 Q3 Q4 Q1 Q2 year ago previous Qtr
Border TypeLand 31 72 37 31 25 58 -19 132 56Air 37 53 54 50 45 33 -38 -27 32Sea 7 6 10 11 9 12 100 33 12Not specified 3 0 6 4 0 0 n.a. n.a.
Document TypePassports 61 113 95 81 66 99 -12 50 96ID cards 3 2 1 6 3 3 50 0 2.9Stamps 2 0 0 2 3 1 n.a. -67 1Residence permits 0 0 1 0 0 0 n.a. n.a.Not specified 9 3 2 5 1 0 n.a. n.a.Visa 3 13 8 2 6 0 n.a. n.a.
Top Ten NationalitiesUkraine 9 13 12 13 28 39 200 39 38Moldova 16 60 25 20 19 24 -60 26 23Cuba 0 0 0 0 0 6 n.a. n.a. 5.8Turkey 2 2 4 5 3 5 150 67 4.9India 1 1 4 5 2 4 300 100 3.9Nigeria 1 0 0 0 0 3 n.a. n.a. 2.9Syria 10 5 8 4 2 3 -40 50 2.9Romania 0 0 1 1 0 2 n.a. n.a. 1.9Tunisia 2 1 0 0 0 2 100 n.a. 1.9Georgia 5 1 6 7 0 2 100 n.a. 1.9Others 32 48 47 41 25 13 -73 -48 13
Top Ten Countries of Issuance of DocumentsUkraine 9 15 16 10 11 30 100 173 29Moldova 11 54 23 12 12 23 -57 92 22Hungary 0 0 2 1 16 7 n.a. -56 6.8Cuba 0 0 0 0 0 5 n.a. n.a. 4.9India 1 1 4 5 2 4 300 100 3.9Romania 2 4 3 18 6 4 0 -33 3.9Bulgaria 6 0 2 5 0 4 n.a. n.a. 3.9Syria 4 0 1 3 0 3 n.a. n.a. 2.9Turkey 2 1 5 2 4 3 200 -25 2.9Italy 0 2 0 0 1 3 50 200 2.9Others 43 54 51 40 27 17 -69 -37 17
Total 78 131 107 96 79 103 -21 30 100
15 of 17
EaP-RAN · Q2 2016

16 of 17
FRAN · q1 2015
Explanatory note
Detections reported for Member States for indicators Illegal border-crossing be-tween BCPs, Illegal border-crossing at BCPs, Refusals of entry and Document fraud are detections at the common land borders on entry only. For Facilitators, detections at the common land borders on entry and exit are included. For Illegal
stay, detections at the common land bor-ders on exit only are included. For Asylum, all applications (land, sea, air and inland) are included.
For EaP-RAN countries, all indicators – save for Refusals of entry – include de-tections (applications) on exit and entry at the land, sea and air borders.
Each section in the table (Border type, Place of detection, Top five border section and Top ten nationalities) refers to total detections reported by EaP-RAN countries and to land border detections reported by neighbouring Member States.
16 of 17

FRAN · q1 2015

Plac Europejski 6 00-844 Warsaw, Poland
T +48 22 205 95 00 F +48 22 205 95 01
[email protected] www.frontex.europa.eu
For Public Release
Risk Analysis Unit
Reference number: 18237 / 2016
TT-AK-16-002-EN-N ISSN 2467-3684
Warsaw, October 2016