q industry~ trade summary - usitc · fatty chemicals have no significant direct ... products of the...
TRANSCRIPT

. Q
Industry~ Trade Summary Fatty Chemicals
USITC Publication 2747 March 1994
OFFICE OF INDUSTRIES U.S. International Trade Commission Washington, DC 20436

UNITED STATES INTERNATIONAL TRADE COMMISSION
COMMISSIONERS
. Don E. Newquist, Chairman
Peter S. Watson, Vice Chairman
David B. Rohr
Anne E. Brunsdale
Carol T. Crawford Janet A. Nuzum
Robert A. Rogowsky Director of Operations
Vern Simpson Director of Industries
This report was prepared principally by
Robert L. Randall
Organic and Inorganic Chemicals Branch Energy, Chemicals, and Textiles Division
Address all communications to Secretary to the Commission
United States International Trade Commission Washington, DC 20436

PREFACE
In 1991 the United States International Trade Commission initiated its current Industry and Trade Summary series of infonnational reports on the thousands of products imported into and exported from the United States. Each summary addresses a different commodityfmdustry area and contains infonnation on product uses, U.S. and foreign produceIS, and customs ueatment. Also included is an analysis of the basic factors affecting trends in consumption, production, and trade of the commodity, as well as those bearing on the competitiveness of U.S. industries in domestic and foreign markets. I
This report on fatty chemicals covers the period 1988-92 and represents one of approximately 250 to 300 individual reports to be produced in this series during the first half of the 1990's. Listed below are the individual summary reports published to date on the chemicals and textiles sectors.
US/TC publication Publication number date
Chemicals: 2458 November 1991 ........ 2509 May 1992 ............. 2548 August 1992 .. , ........
2578 November 1992 ........ 2588 December 1992 ......... 2590 February 1993 ..........
2598 March 1993 ............
2736 February 1994 .......... 2743 February 1994 ..........
..................... 2741 February 1994 .......... 2747 March 1994 ............
Textiles and apparel: 2543 August 1992 ......... .. 2580 December 1992 ........ . 2642 June 1993 ............ . 2695 November 1993 ....... . 2702 November 1993 ....... . 2703 November 1993 ....... .
Title
Soaps, Detergents, and Surface-Active Agents
Inorganic Acids Paints, Inks, and Related
Items Crude Petroleum Major Primary Olefins Polyethylene Resins in
Primary Forms Perfumes, Cosmetics, and
Toiletries Antibiotics
. Saturated Polyester Resins in Primary Forms
Natural Rubber Fatty Chemicals
Nonwoven Fabrics Gloves Yam Carpets and Rugs Fur Goods Coated Fabrics
1 The information utd malysis provided in this report are for the purpose of this report only. Nolhing in this ieport should be construed to indicate how the Commission would find in ut invesligallon conducted 1D1der stannory authority covering the s1111e or similar subject mauer.


CONTENTS Page
Preface ............................................................................. .
Introduction . . . . . . . . . . . . . . . . . . . . . . . . . . . . . • . . . . . . . . . . . . • • . . . . . . . . . . . • . . . . . . . . . . . . . . . . . 1
U.S. industry profile . . . . . . . . . . . . . . . . . . . . . . . . . . . . . . . . . . . . . . . . • . . . . . . . . . . . . . . . . . . . . . . . . . 1
lndustty structure . . . . . . . • . . • • . . . . . . . • . . . . . • . . . . . . . • • . . • . . . • • . . . . . . • • . . • . . • . • . . . • . . • • . 1 Products . . . . . . • . . . . . . . . . . . . . . . . . . . . . . . . . . . . . . . . . . . . • . . . • . . . • . . . . . . . . . . . . . . . . . . . . . 1 Production processes . . . . . . . . . . . . . . . . . . . . . . . . . . . . . . . . . . . . . . . . . . . . . . . . . . . . . . . . . . . . . . . 1 Characteristics of the U.S. industty . . . . . . . . . . . . . . . . . . . . . . . . . • . . . . . . . . . . . . . . . . • . . . . . . . . 3 Trends in the industty . . . . . . . . . . . . . . . . . . . . . . . . . . . . . . . . . . . . . . . . . . . . • . . . . . . . . . . . . . . . . . 3
Consumer characteristics and factors affecting demand . . . . . . . . . . . . . . . . . . . • . . . . . . . . • . . . • . . . . 4
Foreign industry profile . . . . . . . . . . . . . . . . . . . . . . . . • . . . . . . . . . . . . . . . . . . . . . . . . . . . . . . . . • . . . . . 4
U.S. trade measures . . . . . . . . . . . . . . . . . . . . . . . . . . . . . . . . . . . . . . . . • . . . . . . . . . . . . . . . . . . . . . . . . . 4 Tariff measures . . . . . . . . . . . . . . . . . . . . . . . . . . . . . . . . . . . . . . . . . . . . . . . . . . . . . . . . . . . . . . . . . . . . . 4 Nontariff measures . . . . . . . . . . . . . . . . . . . . . . . . . . . • . . . . . . . . . . . . . . . . . . . . . . . . . . . . . . . . . . . . . . 5
Foreign trade measures . . . . . . . . . . . . . . . . . . . . . . . . . . . . . . . . • . . . . . • . . . . . . . . . . . . . . . . . . . . . . . . 5
U.S. market . . . . . . . . . . . . . . . . . . . . . . . . . . . . . . . . . . . . . . . . . . . . . . . . . . . . . . . . . . . . . . . . . . . . . . . . . 5 Consumption and production . . . . . . . . . . . . . . . . . . . . . . . . . . . . . . . . . . . . . . . . . . . . . . . . . . . . . . . . . . 5 Imports ...... ,..................................................................... 5
Foreign markets . . . . . . . . . . . . . . . . . . . . . . . . . . . . . . . . . . . . . . . . . . . . . . . . . . . . . . . . . • . . . . . . . . . . . . 6 Foreign market profile . . . . . . . . . . . . . . . . . . . . . . . . . . . . . . . . . . . . . . . . . . • . . . • . . . . . . . . . . . . . . • . 6 U.S. exports . . . . . . . . . . . . . . . . . . . . . . . . . . . . . . . . . . . . . . . . . . . . . . . . . . . . . . . . . . . . . . . . . . . . . . . . 6 U.S. ttade balance . . . . . . . . . . . . . . . . . . . . . . . . . . . . . • . . . . . . . . • . . . . . . . . . . . . • . . . . . . . . . . . . . . . 6
Appendixes A. Explanation of tariff and ttade agreement terms . . . .. . . . . . . . .. . . . .. . . .. . . . . . .. . . .. . . . . . A-1 B. Statistical tables . . . . . . . . . . . . . . . . . . . . . . . . . . . . . . . . . . . . . . . . . . . . . . . . . • . . . . . . . . . . . . . . . B-1
Figure 1. Fatty chemicals: Structure of the U.S. industry . . . . . . . . . . . . . . . . . . . . . . . . . . . . . . . . .. . . . . . 2
Tables 1. Typical principal fatty acid composition of commercially
important sources of fatty chemicals . . . . . . . . . . . . . . . . . . . . . . . . . . . . . . . . . . . . . . . . . . . . . . 2 2. Fatty acids and fatty alcohols: Patterns of exports from
selected Southeast Asian countties to selected destinations, 1990 . . . . . . . . . . . . . . . . . . . . . . . 5 B-1. Fatty chemicals: Hannoniud Tariff Schedule subheading;
description; U.S. col. 1 rate of duty as of Jan. 1, 1993; U.S. exports, 1992; and U.S. imports, 1992 . . . . . . . . . . . . . . . . . . . . . . . . . . . . . . . . . . . . . . . . B-2
B-2. Fatty chemicals: U.S. imports for consumption, by principal sources, 1988-92 . . . . . . . . . . . . . . . . . . . . . . . . . . . . . . . . . . . . . . . . . . . . . . . . . . . . B-3
B-3. Fatty chemicals: U.S. exports of domestic merchandise, by principal markets, 1988-92 . . . . . . . . . . . . . . . . . . . . . . . . . . . . . . . . . . . . . . . . . . . . . . . . . . . B-4
B-4. Fatty chemicals: U.S. exports of domestic merchandise, imports for consumption, and merchandise ttade balance, by selected countties and countty groups, 1988-92 . . . . . . . . . . . . . . . . . . . . . . . . . . . . . . . . . . B-5
iii


INTRODUCTION This summary covers the Commission's Fatty
Chemicals ttade monitoring group, which is a group of chemicals, masdy of natural origin, corresponding roughly to the. oleochemicals industty. Soap and detergents are not included in this summary. The period covered is 1988-92. The summary is organized by sections on U.S. and foreign market profiles, U.S. and foreign ttade measures, U.S. and foreign markets, and U.S. trade balance.
Fatty chemicals are a loosely defined class, described more explicidy in the section below, originally isolated from, or related tO, natural fats. The major production of these chemicals is still from natural fats and oils. The oxo-alcohols (detergent alcohols) in this group are produced in large quantities by synthetic processes. The most significant products comprising both production and imports are stearic acid and oleic acid.
Fatty chemicals are made from natural fats and oils by hydrolysis and ttansamination. Detergent alcohols and amines also can be made from petro-chemical feedstocks by synthetic processes. Natural feedstocks are animal fats, vegetable oils, and tall oil, a by-product of the kraft (sulfate) process for pulping softwoods (conifers). Animal fats and vegetable oils are esters of glycerine (sometimes called glycerol); a uihydric alcohol, while tall oil is a similar chemical where rosin plays a role similar to that of glycerine.
Fatty chemicals have no significant direct consumer uses. A large proportion of primary fatty chemicals are used to make related chemical products, in the same plant or elsewhere. The end uses for fatty chemicals depend primarily upon their surface-active and lubricating properties. Fatty chemicals are incorporated into a wide variety of f onnulated products, such as shaving creams, shampoos, and food and beverage products. Lubricating greases are often heavy-metal soaps of fatty acids.
U.S. INDUSTRY PROFILE
Industry Structure
Products The oleochemicals (fatty chemicals) industty
generally is defined by its raw materials (animal fats, vegetable oils, tall oil I) and its basic production processes-hydrolysis and ttansamination. The products of the oleochemicals industty include fatty acids, related alcohols, amides, amines and esters, glycerine, and various mon~ and diglycerides. There is no specific definition of what constitutes a fatty acid, but straight, or slightly branched caiboxylic acids, saturated or unsaturated, with carbon chain lengths ranging between 6 and 24, are generally recognized to
1 Tall oil is a byproduct of sulfale (kraft) pulping of softwoods (conifers).
be fatty acids. The other fatty chemicals are those related to such fatty acids. Figure 1 shows the principal features of the structure of the fatty chemicals industty.
The principal fatty acid composition of some important natural sources of fatty acids is shown in table 1. These principal fatty acids include lauric (12 caibon atoms), myristic (14 carbon atoms), palmitic (16 caibon atoms), stearic (18 carbon atoms), oleic (18 carbon atoms, 1 double bond), and linoleic (18 caibon atoms, 2 double bonds). The three 18-carbon fatty acids are readily interconverted. by hydrogenation/ dehydrogenation processes. The purity and composition of commercial fatty acids varies considerably. Some fatty acids are sold as mixtures in the proportions found in the fat or oil from which they were obtained. Fatty acids are separated and purified by distillation and/or crystalli7.ation.
The Commission's Fatty Chemicals· trade monitoring group includes principally the fatty acids (part of standard industrial classification (SIC) 2899), some fatty acid esters (SIC 2865) and salts, oleyl alcohol (SIC 2899), some other fatty alcohols made synthetically (SIC 2869), and acid oils, a by-product of vegetable oil refining (SIC 2074-6) too contaminated with breakdown products to be consumed by humans or animals. The oleochemicals industty, as nonnally defined, includes production of glycerine (SIC 2841) and glycerides (SIC 2899), but not synthetic (oxo) alcohols. The oleochemicals industty grew out of soap-making (SIC 2841), being based on closely related hydrolytic processes and the chemical products being used for closely related purposes. Many oleochemicals operations in the United States and abroad are associated with major soap and detergent manufacturers.
Tall oil fractionation produces a mixture of fatty acids, called tall oil fatty acid (TOFA), and rosin. The tall oil fatty acids are contaminated with difficult-to-remove rosin, which limits use of TOFA to industrial end uses, such are varnishes, inks, and coatings. Most tall oil processors are associated with, or subsidiaries of, pulp and paper companies.
Production Processes The characteristic manufacturing process for
oleochemicals is acid hydrolysis (soap is made by alkaline hydrolysis). either in a batch or continuous process. Hydrolysis (splitting) of animal fats and vegetable oils (uihydric esters of glycerine) occurs in step-wise seque"ce, i.e., one fatty acid comes off, then a second, then the third. Thus batch processing is suited to direct preparation of mono- and diglycerides (which can also be made indirecdy, by complete breakdown to glycerine and the constituent fatty acids in continuous processes, separation and purification, followed by re-esterification to the desired products). Most fatty acid production employs continuous processing, which is more energy, labor, and capital efficient than batch processing, if the production
1

Figure 1 Fatty chemicals: Structure of the U.S. Industry
Source: Compiled by USITC staff.
Table 1 Typlcal prlnclpal fatty acid composttlon of commercially Important sources of fatty chemicals
(Percentage)
Source Laurie Myrlstlc Palmltlc Stear le Ole le Llnolelc
Tallow (beef) .••....•...••.•.....• 3 29 19 47 3 Cottonseed oil ................... 1 21 2 33 44 Soybean oil ••••...•.••........... 7 5 1 34 5-3 Palm oil ..••••....•..•.•....•••.. 1 4-3 4 43 10 Palm kernel oil .•..••••...••.••••• 47 14 9 1 19 1 Coconut oil ...................... 48 18 9 2 6 3 Talloil •..••••...•.......•.••..•.• 6 2 40 44
Note.--Percentages shown may not add to 100 percent because ofother constituents not included as principal fatty acids.
Source: Encyclopedia of Chemical Technology. Third Ed., Vol. 4, "Carboxylic Acids,• John Wiley & Sons, New York, 1978.
2

volumes warrant its use. However, batch processing is often preferred for processing unrommon vegetable oils because less product is off-grade due to start-up and shut-down associated with continuous processing. Ba1Ch processing is sometimes used with animal fats because animal fats may be difficult to bring up to the requisite purity and uniformity for cmtinuous processing.
Transamination is similar to hydrolysis, except that amm.mia is the reactant rather than water. Depending on processing conditions, the resultant products are fatty amides and amines, rather than fatty acids. Glycerine is a co-product of both hydrolysis and transamination.
Tall oil is fractionated into 10FA and rosin by a hydrolytic process similar to that used for fat splitting, but the clJemical engineering details are different owing to the different characteristics of the two feedstocks.
Characteristics of the U.S. Industry
The U.S. industry is generally divided into three branches ccnespooding · to the principal raw material-tall oil, vegetable oil, or animal fats-which affects both the processing and the products, and ultimately determines what the products can be used for. Tall oil fractionators noonally do not handle vegetable oil or animal fats. The remaining producers are less ·specialized, using a variety of vegetable oils. Some also process tallow (beef fat), although most tallow is made into soap.
Four companies fractionate tall oil in 12 plants in the United States. There are about 12 companies producing the other fatty acids in about 20 plants in the United States. (The count is imprecise because several companies and plants have operations in both categories and because several companies are re<rganizing and consolidating divisions after acquisitions.) The plants are principally located in the Southeast, the Midwest, and in California.
Statistical information on production. employment, earnings, R&D expenditures, capital investment, etc., is not available for this industry from government or industry somces. Several private sector organizations offer proprietary studies that estimate such parameters, particularly the production of various fatty chemicals and their consumption by end-uses. Such estimates are difficult to make because, like petrochemicals. oleochemicals are made from one another and considerable allowance must be made for the double-counting that occurs if one were to just sum the individual flows in the product streams. The major oleocbemicals, particularly the fatty acids, are used both as final chemical ingredients ilx:orpmated into various consumer and industrial products and as intermediates in the manufacture of other fatty chemicals, such as esters. alcohols, amides, and amines.
Like other chemical process industries relying principally on continuous processing, the oleochemicals industry is not labor intensive (i.e., the fatty chemicals industry is relatively capital intensive), as relatively few people are needed to handle bulk inputs from tank cars or tank trucks, and the products are sold in bulk or bulk packages to other manufacturers. The chemical processing is largely autooiated, requiring few operators. While the processing plants may be moderately large, the technology chaDges slowly and regular maintenance can easily keep plants in operation for several decades, so capital cmsumption. per unit of output is not significant. Relatively little product research is done by most oleocbemical producers. Most process research tends to be done by the engineering-construction firms that hope to sell processes and equipment, but the small size of this industry, its lack of growth, and its slow capital replacement rate does not present a major business opportunity for process development by engineering firms.
The principal problems of the oleocbemicals industry are those of any process industry manufacturing mostly commodity products, namely, relatively easy entry. imbalance Of demand for co-products, periodic overcapacity, and consequent gluts. These problems are exacerbated by the relatively large number of producers, so any one producer is reluctant to reduce production. Inasmuch as fatty chemicals are intermediate industrial products, incmporated by other industries into their products, lower prices during periods of oversupply generally cannot effectuate market clearing. These problems are particularly ooerous fer the tall oil fractimators, who are limited to a single raw material, supply of which is tied to highly cyclical kraft pulp production. Further, tall oil has no other commercial uses, so the captive tall oil fraction.at.ors are under pressure to keep operating even if demand fer their products is weak. mstorically, the demand for rosin and fer tall oil fatty acids have not been in balance.
Trends in the Industry
In production, there is a loog-term trend to greater use of cmtinuous processing, greater instrumentation and autooiation Of process control, greater attentim to energy efficiency, and more intensive processing to reduce release of residuals into environment.
The most important trend affecting the U.S. industry has been the acquisition of smaller companies by larger companies and by foreign companies, leading to cmsolidation, speciali7.11tion, rationali:uition of operations and investment m a global scale, and the development of long-term integrated global investment. production, and marketing management strategies. While tall oil fractionators are being consolidated under the large U.S. pulp and paper companies, 9 of the 12 major fatty acid producers have been acquired by foreign companies within recent years.
3
Consumer Characteristics and Factors Affecting Demand
Fatty chemicals are used primarily as ingredients in formulated industrial or consumer products or as precursors of other chemicals. In either case, customers for oleochem.icals are other manufacturers. Vutually all domestic sales of fatty chemicals are direct manufacturer-to-manufacturer transactions. although small quantities or imports may be handled by speciali7.ed dealers or agents. Fatty chemicals are bought by specificatim in quantities related to the purchaser's anticipated manufacturing consumption and price/shipping breakpoints (typically truckload quantities). Spot prices reflect supply/demand conditions, but there is little price discrimination between custmners by suppliers. Prices of fatty acids are more variable than those of fatty chemicals several stages further advanced in chemical processing where the value-added is greater.
Fatty chemicals may be key ingredients providing essential performance characteristics of the final product, for example, detergents or lubricants, but a change in the price of fatty chemicals is unlikely to greatly stimulate or depress sa1es of the final product, and with it, the consumption of fatty chemicals incorporated in the final consumer or industrial product.
FOREIGN INDUSTRY PROFILE The foreign oleocbemicals industry has much the
same characteristics and histay as the U.S. industry. The dominant fmeign oleochemical producers are detergent manufacturers who integrated backward into oleochem.ical production decades ago when tallow soap was the only availabJe detergent. As in the United States, some producers speciali7.e in tallow-based products, which in tum usually relates to indigenous beef and dairy cattle production.
Several laige European and Japanese companies established large, modem facilities in tropical countries, particularly in Malaysia, lndooesia, and the Philippines, drawing on availability of supplies of palm, palm-kernel, and coconut oil. Generally organized as joint ventures between local invest<rs and the foreign .corporation, the foreign company usually providing most of the capital, technology, and technical, operational. and marketing management for oleochemicals manufacturing. Vntually all the fatty chemicals produced are exported, frequently to affiliates of the foreign investor, while the local pirtners have been mme prominent in the associated oil seed plantations and agricultural operations. Table 2 shows the major export destinations fer fatty acids and fatty alcohols produced in those three countries.
Outside the United States, tall oil processing is laigely confined to Scandinavia, Austria, the United Kingdom, and Canada, i.e., countries with pine-based borea1 and temperate forest products industries. A 1988 industry publication lists 26 major Western European
4
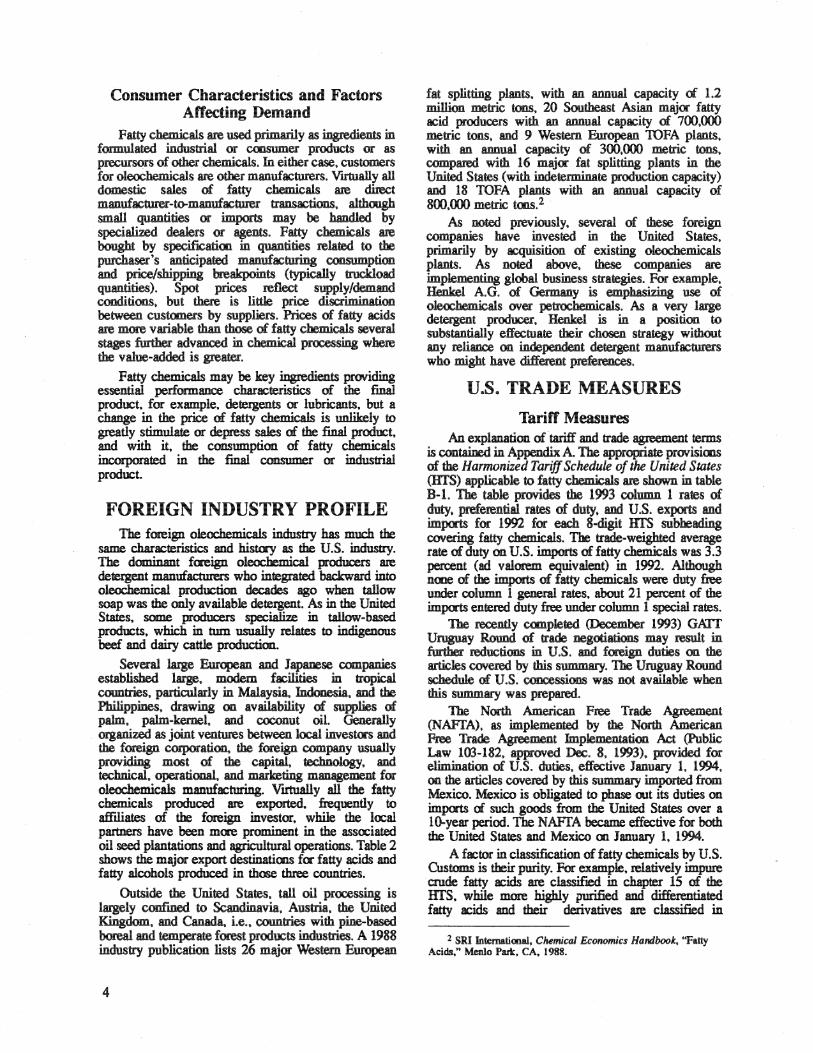
fat splitting plants, with an annual capacity of 1.2 million metric tons, 20 Southeast Asian major fatty acid producers with an annual capacity of 700,000 metric tons, and 9 Western :European TOFA plants, with an annual capacity of 300,000 metric tons, compared with 16 major fat splitting plants in the United States (with indeterminate production capacity) and 18 TOFA plants with an annual capacity of 800,000 metric kllS. 2
As noted previously, several of these foreign companies have invested in the United States, primarily by acquisition of existing oleochemicals plants. As noted above, these companies are implementing global business strategies. For example, Henkel A.G. of Germany is emphasizing use of oleochemicals over petrochemicals. As a very large detergent producer, Henkel is in a positi~ to substantially effectuate their chosen strategy without any reliance on independent detergent manufacturers who might have different preferences.
U.S. TRADE MEASURES
Tariff Measures An explanation of tariff and trade agreement terms
is contained in Appendix A. The appropriate provisims of the Harmonized Tariff Schedule of the United States (IITS) applicable to fatty chemicals are shown in table B-1. The table provides the 1993 column 1 rates of duty, preferential rates of duty, and U.S. exports and impcrts for 199'2 for each 8-digit HfS subheading covering fatty chemicals. The trade-weighted average rate of duty on U.S. imports of fatty chemicals was 3.3 percent (ad valorem equivalent) in 1992. Although nme of the imports of fatty chemicals were duty free Wider column I general rates, about 21 pen:ent of the impcrts entered duty free under column 1 special rates.
The recently canpleted (December 1993) GA1T Uruguay Round of trade negotiations may result in fmther reductions in U.S. and foreign duties on the articles covered by this summary. The Uruguay Round schedule of U.S. concessions was not available when this summary was prepared.
The North American Free Trade Agreement (NAFfA). as implemented by the North American Free Trade Agreement Jmplementaticm. Act (Public Law 103-182, approved Dec. 8, 1993). provided for elimination of U.S. duties, effective January 1. 191)4, cm. the articles covered by this summary imported from Mexico. Mexico is obligated to phase out its duties on impcrts c::J. such goods from the United States over a 10-year period. The NAFI'A became effective for both the United States and Mexico m January 1, 191J4.
A factor in classification of fatty chemicals by U.S. Customs is their purity. For example. relatively impure crude fatty acids are classified in chapter 15 of the HfS, while more highly purified and differentiated fatty acids· and their derivatives are classified in
2 SRI IntematiOOlll, CMmical Economics Handbook. "Fatty Acids,'' Menlo Park, CA, 1988.

Table2 Fatty acids and fatty alcohols:1 Patterns of expons from selected Southeast Asian countries to selected destinations, 199<>2
Fatty chemical exporters3
Destination MYS IND PHL MYS IND PHL
(Million dollars) -- -- (Million kilograms) --United States . . . . • . . . . . . . . . . . . . • . 5 3 6 11 8 6 United Kingdom . . . . . . . . . . . . . . . . . . 23 4 4 78 16 6 Germany........................ 16 7 6 43 20 10 Belgium......................... 1 8 3 1 18 6 Japan........................... 24 Korea........................... 3
3 5 33 4 11 1 6 5 1 5
1 This is notthe same grouping of fatty chemicals as used elsewhere in this summary; this table represents the UN trade statistical groups for fatty acids plus fatty alcohols.
2 Some countries report on a fiscal year basis, with varying ending dates. Note that values are believed to have been converted directly into dollars using annual average exchange rates rather than more frequently on the basis of the actual currency used in trade. .
3 Country codes used in table: MYS • Malaysia, IND • Indonesia, PHL - Philippines. Source: Compiled from United Nations Trade Statistics data tapes.
chapter 29. Subheading 3823.90.40 classifies materials of fatty origin that do not have a specific place in the HTS. Subheading 3823.90.40 also includes natural or artificial mixtures of fatty materials.
NontaritT Measures Fatty chemicals sold for use as food additives or
used in cosmetics or pharmaceuticals must meet the applicable standards under the Food, Drug and Cosmetic Act, administered by the U.S. Food and Drug Administration (FDA). These standards usually include certain purity requirements and "good manufacturing practice," a catch-all requirement that covers manufacturing processes and conditions. The FDA standards do not discriminate between products of U.S. and foreign mgin. Any applicable laboratory testing fees, certification fees, or inspection fees must be paid by any producer selling fatty chemicals for such uses. However, the fees may be proportionately more burdensome for small producers than large producers and more burdensome for foreign producers than U.S. producers, as the travel costs for U.S. inspectors to visit foreign facilities are likely to be greater.
FOREIGN TRADE MEASURES The classification of fatty chemicals used by other
countries differs in detail and scope from that used by the United States in its HTS. However, the following tabulation is indicative of tariffs levied by major U.S. trading panners on certain types of fatty chemicals:
Fatty Acids
Country or region Crude Refined Tall 011
EU ................. 7-8% 6.5-10% 4.5% Japan ............... 2.5% 3.9-4.6% 4% Mexico .............. 5% 15% 10% Canada ............. 13.1% 13.1% Free
U.S. MARKET
Consumption and Production No quantitative measures of U.S. production or
apparent consumption of fatty chemicals are available from official or industry sources. However, shipments of fatty acids were estimated at approximately $440 million in 1992. This estimate does not include the value of derivative fatty chemicals (which would have to be reduced by the value of the fatty acids consumed in their manufacture, if manufactured at a location other than that of the fatty acids) nor does it include the value of oxo-alcohols produced synthetically in petroehemical plants. Overall U.S. consumption of fatty chemicals is growing only very slowly. Modest increases in consumption in detergent, shampoo, etc. applications are offset by declines in usage of fatty chemicals in coatings, heavy greases, etc.
Imported fatty chemicals are considered to be of high quality, exceeding the quality available in the United States for similar grades, according to industry sources. Import penetration is increasing. As noted previously in the U.S. Industry Profile, several major companies are increasingly pursuing global business strategies for fatty chemicals that are not based on national boundaries. These strategies include specialimtion and greater reliance on fatty chemical production in Southeast Asia near low cost sources of tropical oils.
Imports U.S. imports are a combination of high-valued
specialty fatty chemicals from Europe and high grade/low priced basic fatty acids from Southeast Asian countries. Imports fJf the latter are accorded duty-free entry under provisions of the Generalized System of Preferences (GSP). During 1988-92, imports of fatty chemicals increased 64 percent by quantity to 99.0 million kilograms and 26 percent by value to
5

$110.8 million (table B-2). Most of the increase in the quantity of U.S. imports since 1989 represents increased imports from Malaysia, ·which has added palm oil plantations and chemical processing facilities at a rapid rate. As noted previously, a considerable fraction of U.S .. imports are from related companies abroad.
FOREIGN MARKETS
Foreign Market Profile Virtually no infonnation is available on
consumption of fatty chemicals in foreign markets. Fatty chemicals are produced in significant amounts in only a few, primarily industrialized, countries. Southeast Asian production based on tropical oils is an important exception noted previously. Other countries lacking raw material sources import fatty chemicals, primarily stearic and oleic acids and oleyl alcohol, from these few producing countries. Based upon estimates of production capacity for various fatty chemicals, the United States represents about 45 percent of the total of world production capacity. 3
3 usrrc staff estimate,. based on infonnation contained in the Chemical EcoNJmics Handbook, published by SRI Intemalional.
6
U.S. Exports During 1988-92, exports of fatty chemicals
increased 146 percent by quantity to 210.4 million kilograms and 145 percent by value to $273.3 million (table B-3). U.S. exports to neighboring countries, Canada and Mexico, represent the largest and third largest U.S. export markets for fatty chemicals, respectively. The Netherlands is the second largest export markeL Exports to industrialized countries are a large proportion of U.S. exports. As with imports, a substantial proportion of U.S. exports are to affiliates of U.S. producers.
U.S. Trade Balance As shown in table B-4, the overall U.S. trade
surplus in fatty chemicals was as high as $166 million in 1991, before declining slightly to $163 million in 1992. The positive trade balance is primarily reflective of the fact that the United States is a principal producer of the raw materials from which fatty chemicals are made. In terms of total flow of trade (imports plus exports), the principal U.S. trading partners for fatty chemicals are Canada, the Netherlands, and Mexico.

APPENDIX A EXPLANATION OF TARIFF AND TRADE AGREEMENT TERMS

TARIFF AND TRADE AGREEMENT TERMS
The Harmonized TariJf Schedule of the United Stlltes (HTS) replaced the Tariff Schedules of the United States (TSUS) effective January I, I989. Chapters I through 97 are based upon the internationally adopted Hannonized Commodity Description and Coding System through the 6-digit level of product description, with additional U.S. product subdivisions at the 8-digit level. Chapters 98 and 99 contain special U.S. classification provisions and temporary rate
. provisions, respectively.
Rates of duty in the general subcolumn of HTS column I are most-favored-nation (MFN) rates; for the most pan, they represent the final concession rate from the Tokyo Round of Multilateral Trade Negotiations. Column I-general duty rates are applicable ·to imponed goods from all countries except (1) those enumerated in general note 3(b) to the HTS plus Serbia and Montenegro, whose products are dutied at the rates set fonh in column 2, and (2) countries whose goods are subject to embargo. Goods from Albania, Armenia, Belarus, Bulgaria, the People's Republic of China, the Czech Republic, Estonia, Georgia, Hungary, Kazakhstan, Kyrgyzstan, Latvia, Lithuania, Moldova, Mongolia, Poland, Romania, Russia, Slovakia, Turkmenistan, and the Ukraine are currently eligible for MFN treatment, as are the other republics of the fonner Socialist Federal Republic of Yugoslavia. Among anicles dutiable at column I-general rates, particular products of enumerated countries may be eligible for reduced rates of duty or for duty-free entry under one or more preferential tariff programs. Such tariff treatment is set fonh in the special subcolumn of HTS 'COiumn I. Where eligibility for special tariff treatment is not claimed or established, goods are dutiable at column I-general rates.
The Generallz.ed System of Preferences (GSP) affords nonreciprocal tariff preferences to developing countries to aid their economic development and to diversify and expand their production and exports. The U.S. GSP, enacted in title V of the Trade Act of I974 and renewed in the Trade and Tariff Act of I 984, applies to merchandise imponed on or after January I, I976 and before September 30, I994. Indicated by the symbol "A" or "A*" in the special subcolumn of column I, the GSP provides duty-free entry to eligible anicles the product of and imponed directly from designated beneficiary developing
A-2
countries, as set fonh in general note 3(c)(ii) to the HTS.
The Caribbean Basin Economic Recovery Act (CBERA) affords nonreciprocal tariff preferences to developing countries in the Caribbean Basin area to aid their economic development and to diversify and expand their production and exports. The CBERA, enacted in title II of Public Law 98-67, implemented by Presidential Proclamation 5I33 of November 30, I983, and amended by the Customs and Trade Act of I990, applies to merchandise entered, or withdrawn from warehouse for consumption, on or after January I, 1984; this tariff preference program has no expiration date. Indicated by the symbol "E" or "E*" in the special subcolumn of column I, the CBERA provides duty-free entry to eligible anicles, and reduced-duty treatment to certain other anicles, which are the product of and imponed directly from designated countries, as set fonh in general note 3(c)(v) to the HTS.
Preferential rates of duty in the special subcolumn of column I followed by the symbol "IL" are applicable to products of Israel under the United States-Israel Free Trade Area Implementation Act of I985 (IFTA), as provided in general note 3(c)(vi) of the HTS. Where no rate of duty is provided for products of Israel in the special subcolumn for a particular provision, the rate of duty in the general subcolumn of column 1 applies.
Preferential rates of duty in the special subcolumn of column I followed by the symbol "CA" ·are applicable to eligible goods originating in the territory of Canada under the United States-Canada Free-Trade Agreement (CFrA), as provided in general note 3(c)(vii) to the HTS.
Preferential nonreciprocal duty-free or reduced-duty treatment in the special subcolumn of column I followed by the symbol "J" or "J*" in parentheses is afforded to eligible articles the product of designated beneficiary countries under the Andean Trade Preference Act (ATPA), enacted in title II of Public Law I02-I82 and implemented by Presidential Proclamation 6455 of July 2, 1992 (effective July 22, 1992), as set fonh in general note 3(c)(ix) to the HTS.
Other special tariff treatment applies to particular products of insular possessions (general note 3(a)(iv)), goods covered by the Automotive Products Trade Act (APTA) (general note

3(c)(iii)) and the Agreement on Trade in CivU Aircrqft (ATCA) (general note 3(c)(iv)), and artkus imported from freely associated states (general note 3(c)(viii)).
The General Agreement on TariJJs and Trade (GATT) (61 Stat (pt 5) A58; 8 UST (pt 2) 1786) is the multilateral agreement setting forth basic principles governing international trade among its 111 signatories. The GATT's main obligations relate to most-favored-nation treatment, the maintenance of scheduled concession rates of duty, and national (nondiscriminatory) treatment for imported products; the GATT also provides the legal framework for customs valuation standards, "escape clause" (emergency) actions, antidumping and countervailing duties, and other measures. Results of GATT-sponsored multilateral tariff negotiations are set forth by way of separate schedules of concessions for each
participating contracting party, with the U.S. schedule designated as Schedule XX.
Officially known as '"The Arrangement Regarding International Trade in Textiles," the Multij"Jber A"angement (MFA) provides a framework. for the negotiation of bilateral agreements between importing and produc~g countries, or for unilateral action by importing countries in the absence of an agreement These bilateral agreements establish quantitative limits on imports of textiles and apparel, of cotton and other vegetable fibers, wool, man-made fibers and silk blends, in order to prevent mark.et disruption in the importing countries-restrictions that would otherwise be a departure from GATT provisions. The United States has bilateral agreements with many supplying countries, including the four largest suppliers: China, Hong Kong, the Republic of Korea, and Taiwan.
A-3


APPENDIXB STATISTICAL TABLES

Table B-1 = Fatty chemicals: Hannonlzed Tariff Schedule subheading; description; U.S. col. 1 rate of duty as of Jan. 1, 1993; U.S. expons, 1992; and ~ U.S. lmpons, 1992
HTS subheading
1519.11.00
1519.12.00
1519.13.00 1519.19.20
1519.19.40
1519.20.20
1519.20.40
1519.20.60
2915.70.00 2915.90.10 2916.15.10 2916.15.50 3823.90.40
Col. 1 rate of duty as of Jan. 1. 1993
Description General Spec1a1i
Stearic acid . . . . . . . . . . . . . . • . . . . . . . . . . . . . . . . . . . . . . . . . . . . . . . . 3.3¢1kg + 6%
Oleic: acid . . . . . . . . . . . . . . . . . . . . . . . . . . . . . . . . . . . . . . . . . . . . . . . . 3.3¢1kg + 5o/o
Tall oil fatty acids . . . . . . . . . . . . . . . . . . . . . . . . . . . . . . . . . . . . . . . . . . . 5o/o Other Industrial monocarboxylic fatty acids derived from
coconut, palm-kernel or palm oil . . . . . . . . . . . . . . . . . . .. . . . . . . . 5%
Other industrial monocarboxylic fatty acids . . . . . . . . . . . . . . . . . . . . 5%
Oleyl alcohol .•....•....................................... 7.9%
Other industrial fatty alcohols derived from fatty substances of animal or vegetable origin . . . . . . . . . . . . . . . . 5%
Other industrialfatty alcohols . . . . . . . . . . . . . . . . . . . . . . . . . . . . . . . . 3. 7%
Free (A,E,IL.~) 1.6¢/kg + 3% (CA) Free (A,E,IL,J) 1.6¢/kg + 5% (CA) Free (CA,E,IL,J)
Free (A,E,IL,J) 2.5% (CA) Free (l:,IL,J) 2.5% CCA) Free (l:,IL,J) 3.9% (CA)
Free ((E,IL,J) 2.5% Free (E,IL,J) 1.8% (CA)
Palmitic:, acid, stearic acid, their salts and esters................ 5% Free (A,CA,E,IL,J) Other fatty acids of animal or vegetable origin . . . . . . . . . . . . . . . . . . 5% Free (A,CA,E,IL,J) Oleic:, linoleic: or ll'nolenic acids . . . . . . . . . • . . . . . • . . . . . . . . . . . . . . . 4.9¢.lkg + 5% Free (CA,E,IL,J) Salts or esters of oleic:, linoleic or linolenic acids . . . . . . . . . . . . . . . . 4.4% Free (A,CA,E,ll,J)
U.S. U.S. exports, Imports, 1992 1992
-- Million doHars --
89
6 2
0
0
0
0
0
23 0 3 3
82
2 1
13
15
3
13
1
10 9 1
>1 Fatty substances of animal or vegetable origin
and mixtures thereof ..•.•..•............................. 4.6% Free (A,CA,E,IL,J) 24 10
1 Programs under which special tariff treatment may be provided, and the corresponding symbols for such programs as they are indicated in the •Special• subcolumn, are as follows: Generalized System of Preferences CA); Automotive Products Trade Ad (B); Agreement on Trade in Civil Aircraft (C); United States-Canada Free-Trade Agreement (CA); Caribbean Basin Economic: Recovery Act (E); United States-Israel Free Trade Area (IL); and Ancfean Trade Preference Act (J). Source: U.S. exports and imports compiled from official statistics of the U.S. Department of Commerce.
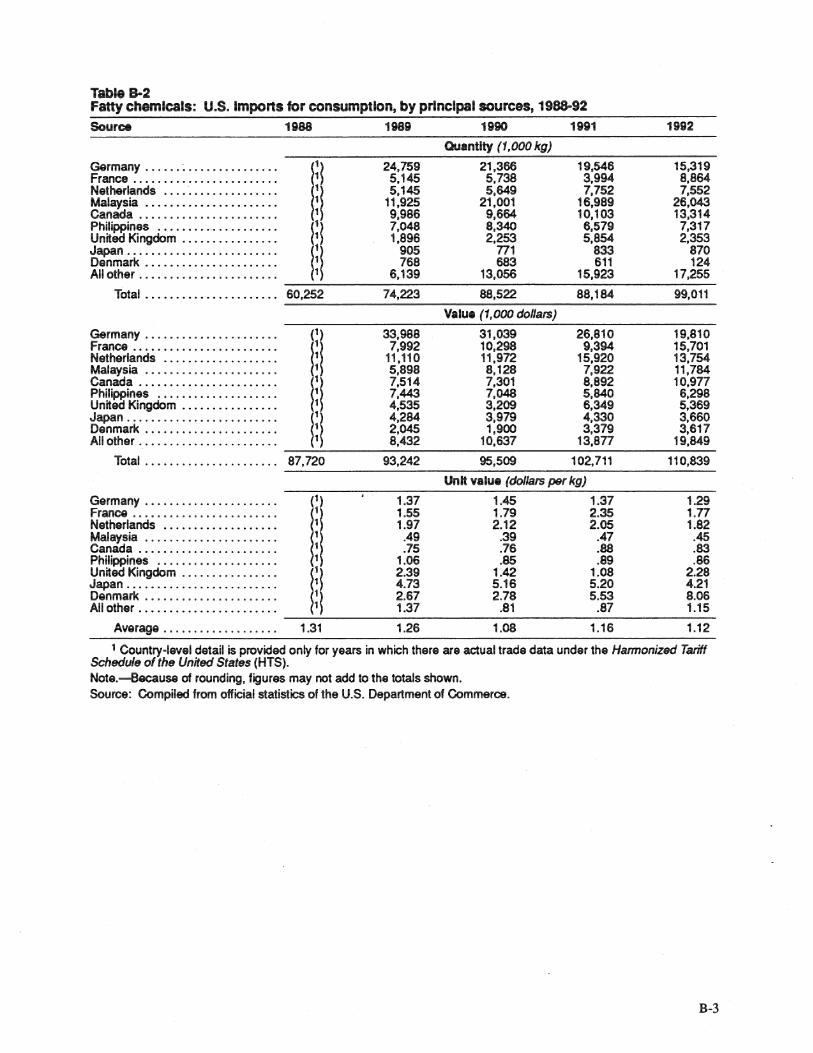
Table B-2 Fatty chemicals: U.S. lmpons for consumption, by prlnclpal sources, 1988-92 Source 1988 1989 1990 1991 1992
Quantity (1,000 kg)
Germany .•.••• ~ .•••••••••••.•• ~J 24,759 21,366 19,546 15,319 France ........................ 5,145 5,738 3,994 8,864 Netherlands ...................
~~ 5,145 5,649 7,752 7,552
Malaysia ...................... 11,925 21,001 16,989 26,043 Canada ....................... 9,986 9,664 10,103 13,314 Philippines •••••.••.....••.•••• ~J 7,048 8,340 6,579 7,317 United Kingdom .••.•........... 1,896 2,253 5,854 2,353 Japan •••••••••••.•••••...•••..
m 905 771 833 870
Denmark •.•.•..•..••...••..... 768 683 611 124 All other ....................... 6,139 13,056 15,923 17,255
Total •.••...•••.••....•.... 60,252 74,223 88,522 88,184 99,011
Value (1,000 dollars)
Germany ••.....•..............
l! 33,988 31,039 26,810 19,810
France •••••••••.••.•••.....••• 7,992 10,298 9,394 15,701 Netherlands ................... 11,110 11,972 15,920 13,754 Malaysia ...................... 5,898 8,128 7,922 11,784 Canada .......................
~~ 7,514 7,301 8,892 10,977
Philippines ••..••.••...•....... 7,443 7,048 5,840 6,298 United Kingdom ...........•...• 4,535 3,209 6,349 5,369 Japan ......••.....•........... l~J 4,284 3,979 4,330 3,660 Denmark ...................... 2,045 1,900 3,379 3,617 All other •••.•..•..•............ (1) 8,432 10,637 13,877 19,849
Total .........••.•....••... 87,720 93,242 95,509 102,711 110,839
Unit value (dollars per kg)
Germany •••••.••...•.......... (1) 1.37 1.45 1.37 1.29 France ...•..............•..... l~~ 1.55 1.79 2.35 1.77 Netherlands •..•.•.....••..•..• 1.97 2.12 2.05 1.82 Malaysia ......................
m .49 .39 .47 .45
Canada ....................... .75 .76 .88 .83 Philippines •••.••.•••••........ 1.06 .85 .89 .86 United Kingdom .....•........•• l~J 2.39 1.42 1.08 2.28 Japan ••••••••••••............. 4.73 5.16 5.20 4.21 Denmark .•..•...•••..••.•..... l~~ 2.67 2.78 5.53 8.06 All other ••••.•••............... 1.37 .81 .87 1.15
Average •.•.•.............. 1.31 1.26 1.08 1.16 1.12
1 Country-level detail is provided only for years in which there are actual trade data under the Harmonized Tariff Schedule of the United States (HTS). Note.-Because of rounding, figures may not add to the totals shown. Source: Compiled from official statistics of the U.S. Department of Commerce.
B-3

Table B-3 Fatty chemlcals: U.S. exports of domestic merct".andlse, by prlnclpal markets, 1988-92
Market 1988 1989 1990 1991 1992
Quantity (1,000 kg)
Canada ....••. · ............... l~~ 28,171 36,824 41,888 43,028 Netherlands .................. 34,724 23,511 35,283 35,367 Mexico ......•............•...
m 19,741 19,424 25,133 26,616
Japan .......•........•....... 20,048 16,975 21,320 19,232 Germa~ ..................... 5,280 4,110 3,846 5,914 United ingdom ............... l~~ 5,280 6,408 11,089 10,979 South Korea .................. 2,014 4,069 5,714 7,421 Taiwan .......•........•..•...
m 3,543 3,877 4,960 7,074
France ................•...... 1,437 3,045 7,564 7,842 All other ..................•... 23,288 36,106 40,721 46,913
Total ..•.................. 85,427 143,526 154,348 197,517 210,385
Value (1,000 dollars)
Canada ..•...... -............. (1) 37,160 41,539 46,050 45,486 Netherlands ..................
~~l 40,761 33,298 43,761 39,318
Mexico .....•................. 24,902 26,516 36,783 34,887 Japan ........................ 29,085 24,280 32,189 29,491 Germa~ ..•..................
~~l 5,987 9,323 9,051 14,491
United ' ingdom ............... 6,189 12,671 17,670 13,350 South Korea .................. 3,783 6,261 10,258 11,374 Taiwan ....................... l~~ 6,079 5,788 7,282 10,376 France ....................... 2,476 . 4,487 8,330 9,968 All other ...................... (1) 37,579 46,030 56,877 64,415
Total ..................... 111,697 194,001 210,192 268,251 273,347
Canada ......................
m Unit value (dollars P8' kg)
1.32 1.13 1.10 1;30 Netherlands .................. 1.17 1.42 1.24 1.11 Mexico ....................... 1.26 1.37 1.46 1.31 Japan ..•..................... ~~ 1.45 1.43 1.51 1.53 Germarl ..................... 1.13 2.27 2.35 2.48 United · ingdom ...............
~l 1.17 1.98 1.59 1.22
South Korea .................. 1.88 1.54 1.80 1.53 Taiwan ....................... 1.72 1.49 1.47 1.47 France ....................... ~~~ 1.72 1.47 1.10 1.27 All other ...................... 1.61 1.27 1.40 1.37
Average .................. 1.31 1.35 1.36 1.36 1.30
1 Country-level detail is provided only for years in which there are actual trade data under the Harmonized Tariff Schedule of the United States (HTS). Note.-Because of rounding, figures may not add to the totals shown. Source: Compiled from official statistics of the U.S. Department of Commerce.
B4

Table B-4 Fatty chemlcals: U.S. exports of domestic merchandise, Imports for consumption, and merchandise trade balance, by selected countries and country groups, 1988-921
(Thousand dollars)
lem 1988 1989 1990 1991 1992
U.S. exports of domestic merchandise: Canada ••••••.•••••.•••.••.•.•....•.... 37,160 41,539 46,050 45,486 Netherlands •••••••••••••..••••.••••••.. 40,761 33,298 43,761 39,318 Mexico ................................ 24,902 26,516 36,783 34,887 Germany .•••••••••••••..•..........•.. 5,987 9,323 9,051 14,683 Japan ••••••.••••....•.•••••••..•.••... 29,085 24,280 32,189 29,491 France •••••••.....•..•.•..•••.•....... 2,476 4,487 8,330 9,968 United Kingdom ..................•.....• 6,189 12,671 17,670 13,350 Malariia ••••••••.••..•.....•...•....... 239 196 201 414 Sout Korea ....•...................•..•
~l 3,783 6,261 10,258 11,374
Taiwan ................................ 6,079 5,788 7,282 10,376 All other •.•.•......•••••••.•........• 37,340 45,834 56,676 64,001
Total •....•.•.••••••.........•...•... 111,697 194,001 210,192 268,251 273,347
EU-12 •.•.•.•••••..••••.•.••••..••••...
~f 62,290 66,412 87,270 87,962
NAFTA ................................. 62,062 68,055 82,833 80,373 ASEAN ..•.••.••••••••••••....•.•..•••. 4,955 6,640 9,018 10,747
U.S. imports for consumption: Canada •.•..•.•...........•...........• 7,514 7,301 8,892 10,997 Netherlands .........••................. 11, 110 11,972 15,920 13,754 Mexico .................................. 708 1,319 1,727 2,555 Germany •..•.•..•...•......•..•....... 33,988 31,039 26,810 19,810 Japan .••...•••..•..•..........•....... 4,284 3,979 4,330 3,660 France •••••••..••...•..••...•......... 7,992 10,298 9,394 15,701 United Kingdom ......•...••...•........• 4,535 3,209 6,349 5,369 Malar.ia .•••............•.......••..•.. 5,898 8,128 7,922 11,784 Sout Korea ............................ 11 0 0 9 Taiwan ................................. 3 38 0 254
All other ••.•.•.••.•••........••..••.. 17,198 18,227 21,367 26,945
Tota •••..••..•..•.................... 87,720 93,242 95,509 102,711 110,839
EU-12 •.....•..................•...•.••
~f 61,228 60,278 63,122 60,408
NAFTA ................................ 8,223 8,620 10,620 13,553 ASEAN ••••••••...•..........••........ 13,444 16,560 11,5n 26,563
U.S. merchandise trade balance: Canada ..••..•. ~ ........•.•••.•.....••.. 29,646 34,238 37,157 34,488 Netherlands ......•..................... 29,651 21,326 27,841 25,564 Mexico ................................ 24,193 25, 197 35,056 32,332 Germany ................................ -28,002 -21,716 -17,759 -5,126 Japan .•.•..•..•.•...••.•••.••.•...•... 24,801 20,301 27,859 25,831 France ••...•..•...••••.•.••.•.•.•••... -5,515 -5,811 -1,064 -5,733 United Kingdom ••..•.•••••......•••.•..• 1,653 9,462 11,321 7,981 Matar.is ••••••••.•..•••...............• -5,659 -7,932 -7,720 -11,370 Sout Korea ••....•.•...••.•............ 3,772 6,261 10,258 11,365 Taiwan ................................ 6,076 5,750 7,282 10,121
All other ••.•••.•••.••................ 20,143 27,607 35,308 37,056
Total •..........•..•...•............• 23,978 100,758 114,683 165,540 162,508
EU-12 .•.•..••........•................ ~~ 1,062 6,134 24,148 27,554
/ NAFTA ................................ 53,839 59,435 72,213 66,820 ASEAN .•••.••••........•.............• (2) -8,489 -9,920 -8,559 -15,816
1 Import values are based on customs value; export values are based on f.a.s. value, U.S. port of export. U.S. trade with East Germany is included in "Germany.•
2 Country level detail is provided only for years for which there are actual trade data under the Harmonized Tariff Schedule of the United States (HTS).
B-5

