logicamms · petromod businesses were also closed, freeing up more than $1.5 million in working...
TRANSCRIPT
CLEAR FOCUSANNUAL REPORT 2017
LO
GIC
AM
MS
AN
NU
AL
RE
PO
RT
20
17

Our business ........................................................................................................ 1FY2017 performance summary ....................................................................... 2FY2018 business priorities ................................................................................ 2Chairman’s Report .............................................................................................. 5Chief Executive Officer’s Report ...................................................................... 7Board and management ................................................................................... 9Corporate Governance Statement ................................................................ 10Directors' Report............................................................................................... 11 Principal activities ....................................................................................................................11
Operating and Financial Review ....................................................................................11
Information on Directors ....................................................................................................14
Information on Company Secretary ............................................................................15
Meetings of Directors ............................................................................................................15
Remuneration Report – audited ....................................................................................16
Indemnification and insurance of officers and auditors ........................................................................................................24
Non-audit services ..................................................................................................................24
Proceedings on behalf of the Company ...................................................................25
Auditor's Independence Declaration ..........................................................................25
Rounding of amounts ...........................................................................................................25
Financial statements ........................................................................................ 26 Consolidated statement of profit or loss
and other comprehensive income ...............................................................................27
Consolidated statement of financial position........................................................28
Consolidated statement of changes in equity ......................................................29
Consolidated statement of cash flows .......................................................................30
Notes to the financial statements .................................................................................31
Directors Declaration ....................................................................................... 63Independent Auditor’s Report ....................................................................... 64Auditor’s Independence Declaration ............................................................ 71ASX information ............................................................................................... 72
CONTENTS
Purpose of the annual report
The purpose of this annual report is to explain LogiCamms’ strategy and operations, and the performance of the business during FY2017. The report also sets out our strategic objectives and business priorities for FY2018.
1LogiCamms 2017 Annual Report
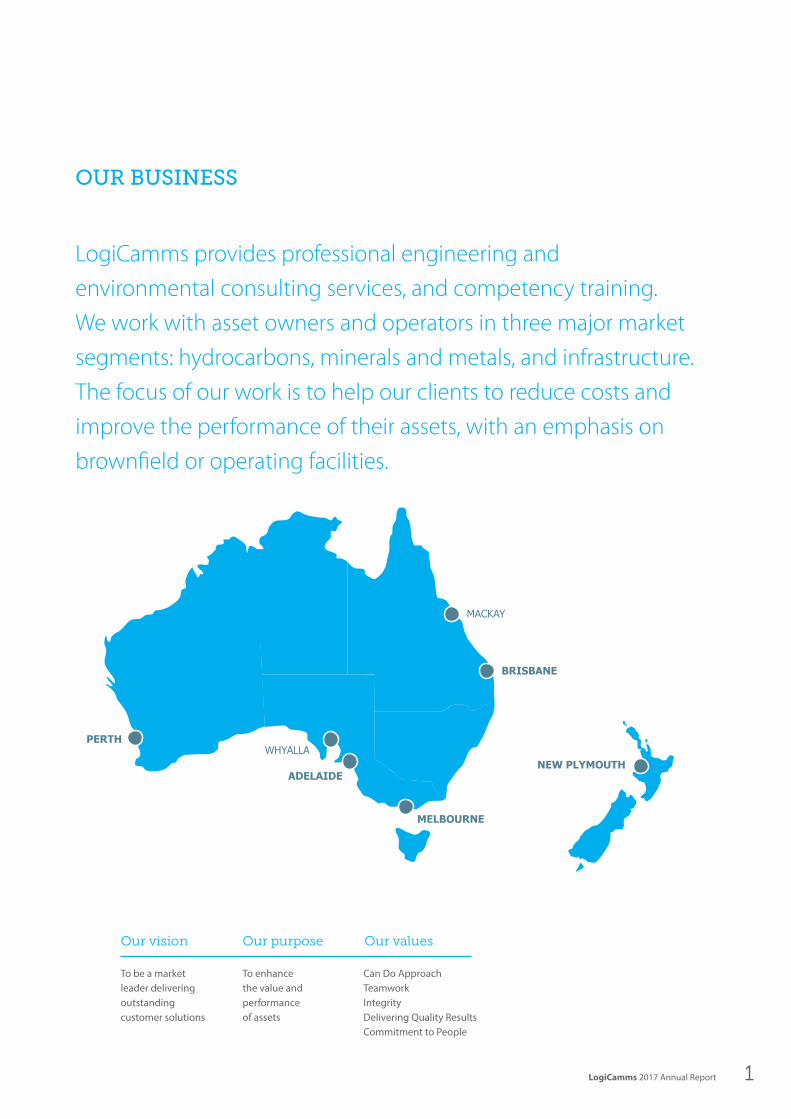
OUR BUSINESS
LogiCamms provides professional engineering and
environmental consulting services, and competency training.
We work with asset owners and operators in three major market
segments: hydrocarbons, minerals and metals, and infrastructure.
The focus of our work is to help our clients to reduce costs and
improve the performance of their assets, with an emphasis on
brownfield or operating facilities.
Our vision Our purpose Our values
To be a market leader delivering outstanding customer solutions
To enhance the value and performance of assets
Can Do Approach Teamwork Integrity Delivering Quality Results Commitment to People
NEW PLYMOUTH
BRISBANE
MELBOURNE
ADELAIDE
PERTH
MACKAY
WHYALLA

LogiCamms 2017 Annual Report2
FY2017 PERFORMANCE SUMMARY
FY2018 BUSINESS PRIORITIES
OPERATIONAL PERFORMANCE• Completed organisation restructure to re-base the business
for FY18 and beyond by:
- concentrating on our core strengths in automation, electrical instrumentation and controls, and engineering procurement and commissioning (EPC) projects
- re-balancing client facing resources and corporate overheads for the current market
- reducing annualised operating costs by $10.5 million (at a one-off cash cost of $2.1 million recognised in FY17) with savings to be realised in FY18 and beyond
- closing low margin Hunter Valley and Petromod businesses.
• Expanded portfolio of Master Service Agreements which make LogiCamms a pre-qualified supplier with these clients. Approximately 35 of these agreements are actively delivering an increase in firm work orders.
• Progressed development and commercialisation of our suite of new technology products. These projects build on our acknowledged expertise in control systems, and are reaching a critical level of maturity and client acceptance.
• Increased the term and approved limit on our banking facilities to support current order book growth and the working capital needs of the business, with the support of NAB.
• The Company entered FY18 with more than $25 million in work in hand at 30 June 2017, and has won a further $13 million in new work in FY18 as client spending deferred in FY17 begins to convert to revenue.
• Re-based business is positioned to capitalise on a recent uplift in client spending in our core market segments:
- Minerals and Metals: Increased commodity prices are encouraging investments in new projects to unlock productivity gains and catch up on deferred capital expenditure on operating assets
- Infrastructure: Increasing new project investments by governments and private sector organisations. LogiCamms is expanding services into new infrastructure markets in water and agribusiness
- Hydrocarbons: LogiCamms continues to focus on major projects with upstream gas producers.
• Build on the portfolio of Master Service Agreements to pursue new project and revenue opportunities with existing and new clients.
• Leverage our specialist expertise in control systems integration, automation and electrical installation and commissioning to pursue opportunities in our traditional market segments and selected new growth sectors and markets.
• Explore new commercial models including collaborations and partnerships with asset owners and other service providers, to increase revenue and margins.
• Accelerate development and commercialisation of our technology products and commercial models, to increase the share of revenue from value-based services rather than traditional professional fees contracts.
• Become an employer of choice in the consulting engineering market by offering staff the right mix of challenging project work, personal and technical development opportunities, monetary and non-monetary benefits, and a safe, social and inclusive place to work.
1 Underlying EBITDAI is not an IFRS measure and is not audited. It is calculated by adjusting statutory net profit after tax by adding back interest, tax, depreciation, amortisation and goodwill impairment.
12 months to 30 June 2017 FY17 ($m) FY16 ($m)
Revenue 81.1 108.2
NPAT (23.6) (38.1)
EBITDAI1 (8.1) (8.4)

3LogiCamms 2017 Annual Report

LogiCamms 2017 Annual Report4 LogiCamms 2017 Annual Report4

The business is now well positioned to capitalise on increasing client activity in our traditional engineering, training and environmental consultancy businesses, and we have started the new financial year with improving order book momentum.
LogiCamms reported a statutory net loss after tax of $23.6 million, which compares with a loss of $38.1 million for the previous year. This includes a goodwill impairment of $11.0 million which does not impact on the cash position of the Company.
The Board has taken the prudent decision not to recommend an interim or final dividend for the 2016-17 financial year.
The Company has a cautiously optimistic outlook for the year ahead, after the re-structuring of the business and taking into account recent order book growth. Market conditions for our clients are also improving with increased commodity prices and commitments by public and private sector organisations to a number of new infrastructure developments.
The Board has taken the opportunity to consider the composition of skills required to guide the business through its current opportunities and challenges.
Charles Rottier is an experienced engineering and construction executive with extensive experience in Australia and internationally. His appointment in September 2017 as an independent non-executive director complements the existing Board skills set, and brings first-hand knowledge of the dynamics of our core market segments to guide strategic decision making.
I would like to thank the staff of LogiCamms for their continued hard work and focus during a year of adjustment within the business. They continue to deliver high quality engineering solutions for our clients, which underpin the success of the business. Thank you also to the Company’s leadership and directors who have steered the business through necessary changes to return LogiCamms to profitable growth.
On behalf of the Board, I would also like to thank our clients and shareholders for their continued support of the business through the financial year and into the future.
Peter Watson Chairman
LogiCamms responded decisively to continued tough market conditions during 2016-17, with our new management team restructuring the business to reduce operating costs, re-balance our workforce and re-focus on our core strengths.
CHAIRMAN’S REPORT
5LogiCamms 2017 Annual Report 5LogiCamms 2017 Annual Report

LogiCamms 2017 Annual Report6 LogiCamms 2017 Annual Report6

I have also spent time talking to our employees and shareholders about the challenges and opportunities facing the business. This has been an invaluable exercise, giving us an up-to-date and informed perspective on the market, and a solid foundation for the work to re-set the business for the future.
Given the nature of our business, safety is always our first and most important priority. I am pleased to say that we reported no lost time injuries in FY17 for the first time in recent years. This can be attributed to a consistent focus across the business on injury prevention, early incident reporting and responsible injury management. However, this positive result was tempered by the fact that our FY17 Total Recordable Injury Rate was 3.59. While none of these were significant injuries, they were still distressing for the people involved and entirely preventable, which shows that safety must remain our foremost day-to-day priority.
Our safety focus for FY18 is to build on this momentum by engaging everyone across the business to create a “hearts and minds” movement to strengthen our individual and collective values towards safety, health & wellbeing, quality and environmental sustainability.
During the financial year, we reported no environmental incidents and attained ISO 14001 (Environmental Management) for all of our Australian operations. This reinforces that we are on the right path to environmental sustainability and best practice.
The restructuring of the business has concentrated our activities on the core strengths for which LogiCamms has long been recognised, in automation, electrical instrumentation and controls, and engineering procurement and commissioning (EPC) projects. We have secured more than 50 Master Service Agreements (MSAs) with clients, which position us as a pre-qualified supplier in our core areas of expertise. Approximately 35 of these agreements are actively delivering an increase in firm work orders.
During the second half of the financial year, we also restructured the business to reduce operating costs and align our workforce to suit prevailing market conditions. At the outset of FY17, the cost base of the business had been set for a budget to achieve revenue of more than $100 million. However, projects that had been anticipated for FY17 were deferred into the following year or converted into revenue more slowly than we had forecast.
The business was unable to replace the significant volume of work on the Roy Hill iron ore project that concluded in FY16 after contributing revenue of more than $30 million in that year. In addition, intense competition negatively impacted both our sell rates and gross margins.
We took a number of actions to address these challenges to the business.
Between June and August 2017, we reduced the workforce by a total of 80 roles from corporate overheads and non-reimbursable labour through a combination of the restructuring and natural attrition. Our workforce at the end of the financial year totalled approximately 405 full-time equivalent roles, down from 450 in the previous financial year. These changes reduced labour costs by $8.8 million.
We also undertook a comprehensive review of overheads, generating savings of $1.7 million across IT and communications, premises and other general and administrative expenses.
These changes will reduce total operating costs by $10.5 million. One-off restructuring costs of $2.1 million were recognised in FY17, and the cost savings will be realised in FY18. The low-margin Hunter Valley and Petromod businesses were also closed, freeing up more than $1.5 million in working capital.
All of these changes have effectively re-based the business for FY18 and beyond. We are a more focused and streamlined business, with a consulting workforce and overhead structure that is closely aligned to the current pipeline of opportunities.
In the early months of FY18, we have begun to see the benefits of restructuring the business and reinforcing our value proposition that spans from environmental consulting through engineering design, project management and commissioning, to competency training.
In our traditional market segments, we are beginning to see an upward shift in client spending. Increasing commodity prices are giving clients in the Minerals and Metals segment greater confidence to invest in projects that unlock productivity gains and catch up on deferred capital expenditure on brownfield assets. In the infrastructure segment, governments and private sector organisations are increasing their investments in new projects. Through the financial year, the Company continued to expand its services into new areas of the infrastructure segment, carrying out a significant volume of work for water utilities in Queensland, South Australia and Western Australia, and in agribusiness for Viterra.
Since my appointment as CEO in February 2017, I have spent a great deal of time connecting with our clients to understand the factors that currently drive their businesses.
CHIEF EXECUTIVE OFFICER’S REPORT
7LogiCamms 2017 Annual Report 7LogiCamms 2017 Annual Report

LogiCamms 2017 Annual Report8
To access new opportunities within these traditional market segments, we have also pursued a number of strategic partnerships. Already this strategy has led to some exciting developments, with the Company winning a role on Northconnex, Australia’s longest road tunnel project, in New South Wales. We have also signed an agreement with Dassault Systèmes to jointly pursue technical and business opportunities in the natural resources, energy and utilities, and life sciences industries.
We have also continued to invest in developing new technology solutions that build on our recognised expertise in control systems, and which offer our clients innovative ways to improve the performance of their operating assets.
These products are beginning to reach a critical level of maturity and client acceptance, and we secured our first significant commercial contract for LogiCamms’ proprietary Automated Infrastructure Design Engine (AIDE) with a blue-chip CSG producer. AIDE was developed by our software engineers and GIS (Geographic Information Systems) specialists to reduce design time and costs for linear infrastructure projects such as gas pipelines and telecommunication, road, rail and energy networks.
In addition, our in-field data capture and tracking solution, Stacks On, is currently undergoing proof of concept trials with a major ASX-listed client. This product allows clients to optimise the performance of materials stockpiles and we are targeting first commercial contracts in FY18.
The commercial models for these solutions are based on sharing the value they create for clients rather than traditional professional fees, and offer potential to develop new, higher margin revenue streams.
These developments are contributing to strengthening order book momentum for the business. At the end of the FY17 year, the Company reported Work in Hand of $25.1 million, which equates to approximately 33 per cent of forecast FY18 engineering consulting revenue. Since the year end, we have also secured new contract wins totalling more than $13 million. LogiCamms is actively recruiting specialist engineering and technology resources to support this growth in our order book. We have also had the support of NAB to increase both the term and approved limit of our banking facility, to support this order book growth and the working capital needs of the business.
We continue to refine the Company’s strategic direction and position the business to capitalise on prevailing market conditions. An updated strategic plan is being developed under the theme of Clear Focus, concentrating on the value proposition, markets and alliance partners to profitably grow the business and as a result, create greater value for shareholders. The plan will outline actions to develop our strong market position in the core professional consulting and engineering services, broaden our services and capabilities through the investments in technology products and new commercial models, and expand into new growth industries and segments in which we have a defined competitive advantage.
I am optimistic about the performance of the business and the market outlook for FY18. I am also pleased that we have maintained the support of our employees, clients, financiers and shareholders as we have managed the transition to strengthen the competitive position of the business. Thank you for your continued support for LogiCamms.
Flora Furness Chief Executive Officer

9LogiCamms 2017 Annual Report
BOARD AND MANAGEMENT
Peter WatsonNon-Executive Chairman
Peter is a business leader with more than 30 years of experience in engineering, construction and services. He has a strong background in achieving growth for businesses on local and international scale.
• Joined LogiCamms 2011
• Former CEO of Transfield Services (ASX: TSE)
• Chairman, Regional Rail Link Victoria and AssetCo
Peter WallNon-Executive Director
Peter is a founding Board member of LogiCamms and has decades of experience in management and board positions, with a focus on human resources and corporate governance.
• Joined LogiCamms in 2007
• Long standing tenure at S. Smith & Sons (The Yalumba Wine Company) and role in international trade facilitation for the wine industry
Richard Robinson Non-Executive Director
Richard has extensive experience in the oil and gas industry in Australia and Papua New Guinea in project management, operations and commercial roles in upstream and downstream sectors. He has also been a consultant in the oil and gas, engineering and construction industries.
• Joined LogiCamms in 2015
• Former Executive General Manager at Oil Search (ASX: OSH)
• Chairman of Kina Petroleum Limited (ASX:KPL)
Charles Rottier Non-Executive Director
Charles is a senior manager with extensive management and project experience in local and international engineering, construction and maintenance services companies. He has managed successful businesses with operations in Australia, PNG, Asia, and the Americas.
• Joined LogiCamms in September 2017
• Former CEO, Austin Engineering (ASX: ANG)
• Former Executive General Manager at Transfield Services (ASX: TSE)
Management
Flora FurnessChief Executive Officer
Dan DreweChief Financial Officer
Iulius MincuDirector, Innovation Technology & Asset Performance
Chief Operating OfficerRole currently being recruited

CORPORATE GOVERNANCE STATEMENTFor the year ended 30 June 2017
LogiCamms Limited and the Board are committed to achieving
and demonstrating the highest standards of corporate
governance. LogiCamms Limited has reviewed its corporate
governance practices against the Corporate Governance Principles
and Recommendations (3rd edition) published by the ASX
Corporate Governance Council. The 2017 corporate governance
statement is dated as at 30 June 2017 and reflects the corporate
governance practices in place throughout the 2017 financial year.
The 2017 corporate governance statement was approved by the
board on 12 September 2017. A description of the group’s current
corporate governance practices is set out in the group’s corporate
governance statement which can be viewed at
www.logicamms.com.au/investor-relations/corporategovernance.
LogiCamms 2017 Annual Report10
11LogiCamms 2017 Annual Report
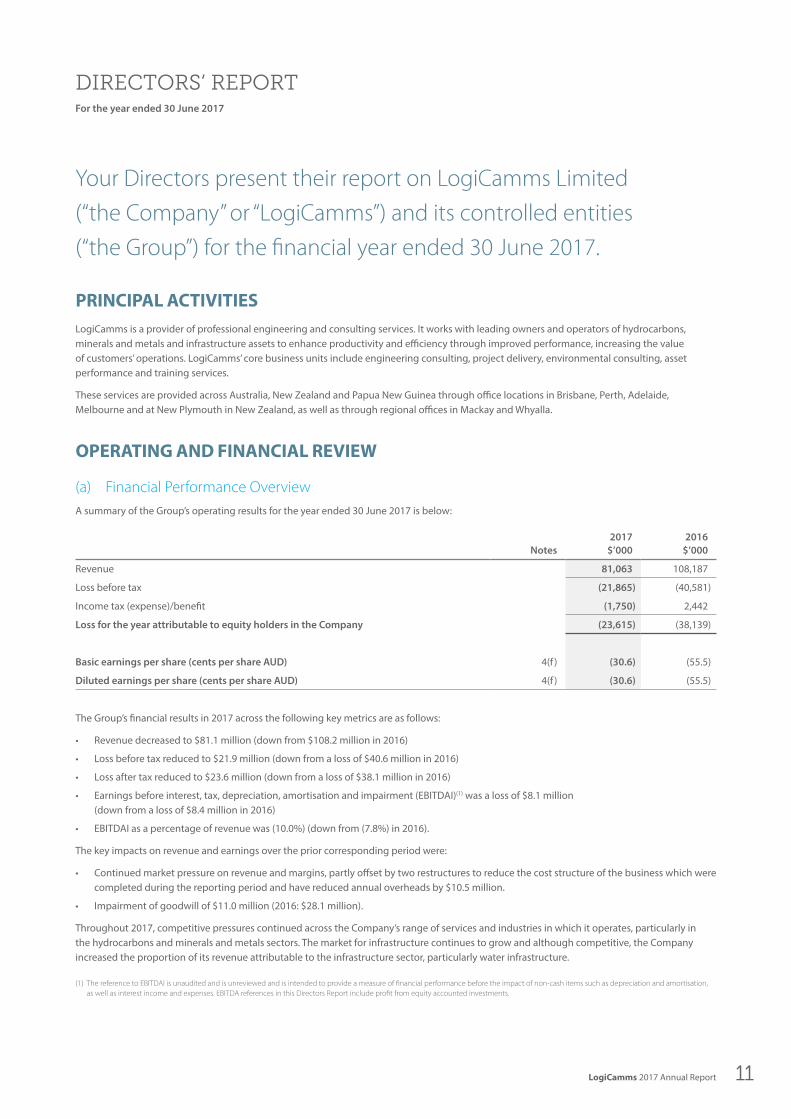
DIRECTORS’ REPORTFor the year ended 30 June 2017
Your Directors present their report on LogiCamms Limited
(“the Company” or “LogiCamms”) and its controlled entities
(“the Group”) for the financial year ended 30 June 2017.
PRINCIPAL ACTIVITIESLogiCamms is a provider of professional engineering and consulting services. It works with leading owners and operators of hydrocarbons, minerals and metals and infrastructure assets to enhance productivity and efficiency through improved performance, increasing the value of customers’ operations. LogiCamms’ core business units include engineering consulting, project delivery, environmental consulting, asset performance and training services.
These services are provided across Australia, New Zealand and Papua New Guinea through office locations in Brisbane, Perth, Adelaide, Melbourne and at New Plymouth in New Zealand, as well as through regional offices in Mackay and Whyalla.
OPERATING AND FINANCIAL REVIEW
(a) Financial Performance OverviewA summary of the Group’s operating results for the year ended 30 June 2017 is below:
Notes2017
$’0002016
$’000
Revenue 81,063 108,187
Loss before tax (21,865) (40,581)
Income tax (expense)/benefit (1,750) 2,442
Loss for the year attributable to equity holders in the Company (23,615) (38,139)
Basic earnings per share (cents per share AUD) 4(f ) (30.6) (55.5)
Diluted earnings per share (cents per share AUD) 4(f ) (30.6) (55.5)
The Group’s financial results in 2017 across the following key metrics are as follows:
• Revenue decreased to $81.1 million (down from $108.2 million in 2016)
• Loss before tax reduced to $21.9 million (down from a loss of $40.6 million in 2016)
• Loss after tax reduced to $23.6 million (down from a loss of $38.1 million in 2016)
• Earnings before interest, tax, depreciation, amortisation and impairment (EBITDAI)(1) was a loss of $8.1 million (down from a loss of $8.4 million in 2016)
• EBITDAI as a percentage of revenue was (10.0%) (down from (7.8%) in 2016).
The key impacts on revenue and earnings over the prior corresponding period were:
• Continued market pressure on revenue and margins, partly offset by two restructures to reduce the cost structure of the business which were completed during the reporting period and have reduced annual overheads by $10.5 million.
• Impairment of goodwill of $11.0 million (2016: $28.1 million).
Throughout 2017, competitive pressures continued across the Company’s range of services and industries in which it operates, particularly in the hydrocarbons and minerals and metals sectors. The market for infrastructure continues to grow and although competitive, the Company increased the proportion of its revenue attributable to the infrastructure sector, particularly water infrastructure.
(1) The reference to EBITDAI is unaudited and is unreviewed and is intended to provide a measure of financial performance before the impact of non-cash items such as depreciation and amortisation, as well as interest income and expenses. EBITDA references in this Directors Report include profit from equity accounted investments.

LogiCamms 2017 Annual Report12
DIRECTORS’ REPORTFor the year ended 30 June 2017
OPERATING AND FINANCIAL REVIEW (CONTINUED)
(a) Financial Performance Overview (continued)The Company also secured its first commercial revenue emanating from prior year investments in its technology and innovation business. The Company has secured an ongoing contract for the use of its proprietary Automated Infrastructure Design Engine (“AIDE”) with a blue-chip CSG Company. A number of other clients are evaluating or are currently in the proof of concept phase with a range of products with the commercial models being value-based rather than on a traditional reimbursable basis.
During the 2017 financial year, the Company delivered reduced revenue of $81.1 million, compared to $108.2 million in 2016. Our key focus for cost efficiencies, in line with the down turn in the market, was to reduce our overhead costs in areas that impact our ability to improve revenue performance. The Company achieved annualised labour cost savings of $8.8 million during the reporting period, at a one-off cash cost of $2.1 million.
In addition to the restructure, the low-margin Hunter Valley and Petromod businesses were closed as at 31 July 2017, freeing up over $1.5 million of working capital. A full review of overheads was also conducted, with further savings of $1.7 million identified across IT and communications, premises costs and other general and administrative expenses. The benefit of these savings will impact the 2018 financial year.
(b) Performance Across MarketsThe Company operates across three key markets, being hydrocarbons, minerals and metals and infrastructure. Hydrocarbons again was responsible for most of the work at 57% of revenue (up from 48% the previous year) which reflected continued work with upstream gas producers such as Santos, Origin Energy, Oil Search, BP and Vector.
Steady growth was achieved through the Company’s continued expansion of its services into the infrastructure sector. Notably, a significant volume of work was carried out for water utilities, including SA Water and Watercorp and agri-business for Viterra. Infrastructure now accounts for 16% of revenue, up from 13% in the 2016 financial year and is expected to grow substantially in the 2018 financial year.
Minerals and Metals revenue remained steady following the completion of the Roy Hill project in quarter three in the last financial year. Greater than 50% of the revenue has come from work carried out for iron ore clients such as Rio Tinto, Roy Hill, Fortescue and BHP.
The Company’s work in international markets was focused primarily around existing operations in New Zealand, as well as an increasing workflow out of Papua New Guinea. Ad hoc projects were conducted in Asia, predominately through Competency Training, our wholly owned Registered Training Organisation.
(c) Market Review and OutlookThe market for services to the hydrocarbons and minerals and metals markets continues to be highly competitive, however, within those markets, there remain significant opportunities for LogiCamms to apply its asset performance and engineering services to enable its customers to extract more value from existing assets.
The outlook in the hydrocarbons and minerals and metals sectors in Australia and New Zealand has seen marked improvement in recent months, driven by higher commodity prices, with requests for proposals and specialist capability by clients seeking to extract productivity improvements and undertake work that has been deferred from prior periods. In addition, greenfield and brownfield opportunities in infrastructure continue to be a core focus of the Company in the upcoming financial year.
As a result of the restructure process undertaken throughout the 2017 financial year, the Company is well positioned to deliver cost effective solutions to its customers as market conditions improve and clients are looking to invest in productivity improvements and sustaining capital and operating expenditure.
The key drivers of future revenue and earnings growth are:
• LogiCamms has over 50+ Master Services Agreements (“MSA’s”) secured with clients, providing a pipeline of sustainable work to support the core engineering disciplines
• Expanding our existing capabilities and strengths into non-traditional markets and regions including renewables, transport, defence, rail and agri-business, and geographically into NSW and Victoria
• Continued development and commercialisation of the Company’s innovative technology products including the Automated Infrastructure Design Engine (“AIDE”), drone-based survey and data analysis capability (“Ninox Robotics”) and in-field data capture and tracking tool (“StacksOn”)
• Leveraging value adding, higher margin opportunities generated by our collaborations and partnerships with asset owners and other service providers
• Utilising our end-to-end project capabilities, from environmental consulting, through engineering, procurement, commissioning, maintenance and training to generate synergistic opportunities to add value to our client’s operations
• Disciplined and focused approach to resource planning and overhead cost management

13LogiCamms 2017 Annual Report
OPERATING AND FINANCIAL REVIEW (CONTINUED)
(d) Working Capital ManagementThe group had negative operating cash flows of $9.2 million (2016: outflow of $8.3 million) primarily as a result of the continuation of poor market conditions. The Company has focused strongly on working capital management during the year. Debtors days outstanding and WIP aging have both reduced significantly. Outstanding debtors balances greater than 30 days have been reduced to less than $0.6 million (4.5%) at 30 June 2017.
During the year, the Company borrowed $4.0 million under its working capital facility with the National Australia Bank (“NAB”) and raised $4.5 million in equity. These funds were used for restructure costs and general working capital requirements, with $5.0 million remaining in cash at bank at 30 June 2017 and headroom available under the working capital facility was $1.0 million.
Subsequent to the end of the year, the limit on the Company’s working capital facility was increased by $4.0 million to provide additional headroom for general working capital requirements and to fund growth.
(e) Statement of Financial PositionThe Company’s total assets decreased to $51.0 million in 2017 (2016: $68.5 million) primarily from the impairment of goodwill. The end of year cash balance of $5.0 million was reduced from $6.6 million in 2016.
The net assets of the Group have reduced to $24.8 million at 30 June 2017 from $43.6 million at 30 June 2016. This decrease is primarily the result of the impairment to goodwill combined with continued operating losses.
The Company’s total liabilities increased to $26.2 million (2016: $24.9 million), due to borrowings under the working capital facility.
The Company has utilised $5.2 million of its current $12.5 million bank guarantee and bonding facilities (2016: utilised $7.4 million of $17.0 million).
Declared after end of year
No dividends were declared after the balance sheet date.
(f ) Key Strategic GoalsThe Company operates various business lines, including core engineering services (comprising design, onsite maintenance, installation and commissioning services) and specialist businesses, including Asset Performance (incorporating the Technology & Innovation business), Competency Training and Monarc Environmental.
The Company’s key strategic goals include:
• Building on the extensive portfolio of MSA’s to drive opportunities with new and existing clients
• Increasing revenue and margins by exploring new commercial models including collaborations and partnerships with asset owners and other service providers
• Leveraging its traditional expertise in control systems integration, automation and electrical installation and commissioning into the growth sectors of the economy, including renewables, transport, defence, rail and agri-business, and geographically into NSW and Victoria
• Accelerating the commercialisation of products developed by its technology and innovation business, increasing its share of revenue from value based services rather than traditional reimbursable-based contracts
• Becoming an employer of choice in the engineering consulting market by offering staff the right mix of challenging project work, personal and technical development opportunities, monetary and non-monetary benefits and a safe, social and inclusive place to work
The Company continues to refine its strategic direction under the theme of Clear Focus, concentrating on value proposition, markets, and alliance partners to maximise shareholder value through profitable expansion of the business in FY18 and beyond.
(g) Significant RisksThe Company is subject to a number of external, business, financial and operational risks. As LogiCamms is a service provider to the hydrocarbons, minerals and metals and infrastructure industries, any exposure that those industries have to risk factors will have some impact on LogiCamms’ business. Although LogiCamms has in place strategies to mitigate the impact of this, such as industry and service diversification, the volatility and uncertainty from such events may impact the nature and timing of work under contract.
LogiCamms is also subject to other external risks such as currency exchange movements, changes in demand for key commodities (including iron ore, oil and gas) and political risk. The majority of LogiCamms’ revenues are based in Australia and New Zealand and both revenue and associated costs are denominated in Australian and New Zealand dollars, and as such, foreign currency risks are somewhat reduced.
As a professional services business, the attraction, retention and investment in our people is critical to the success of the business. LogiCamms manages the risks associated with a people-based business through significant investment in training, attraction and retention strategies.
DIRECTORS’ REPORTFor the year ended 30 June 2017

LogiCamms 2017 Annual Report14
OPERATING AND FINANCIAL REVIEW (CONTINUED)
(g) Significant Risks (continued)The Company also faces risks in its relationship with customers. In order to optimise the delivery of services to customers, the Company has in place a robust risk management and governance framework that applies to the assessment, tender and delivery of customer projects.
LogiCamms is exposed to financial risks, which are partly inter-dependent on the external and business risks mentioned above. Significant investment has occurred in the development of risk and financial management systems and processes available to the business. Further, LogiCamms manages working capital closely to ensure minimal volatility in results and the appropriate delivery of services within commercial agreed terms.
In relation to the operational risks to the business, LogiCamms has a strong focus on ensuring that work is carried out on terms that satisfy the Company’s internal policies relevant to appropriate return and risk. LogiCamms has a focus on long term sustainable projects and relationships and applies margins to work accordingly.
The Company also has detailed procedures in place to ensure that the Company is staffed efficiently and that its people are working at a level of business that balances the goal of strong margins with that of ensuring the Company’s people are working in an environment that encourages sustainable personal development and growth opportunities.
The Company maintains a register of key risks and has in place crisis management and disaster recovery plans.
INFORMATION ON DIRECTORSThe Directors in office at any time during or since the end of the year were:
Mr Peter Watson Independent Non-Executive Director and Chairman
Appointed 2 June 2011. Year last re-elected: 2016.
Experience Peter Watson has 30 years of international experience in engineering, construction and services industries. As former Chief Executive Officer of Global Services Group, Transfield Services (ASX: TSE) from 1999 to 2009 (now known as Broadspectrum), Peter stewarded the company through its listing in 2001 and led its transformation from a local operator to a global business. Since 2009 Peter has served on a number of boards including Save the Children Pty Ltd, AssetCo Pty Ltd, Zinfra Pty Ltd, and Ross River Solar Farm Pty Ltd. Peter is a member of the AICD, Institute of Engineers Australia, and is a fellow of ATSE.
Peter is a member of the Nomination and Remuneration Committee, and a member of the Audit and Risk Committee.
Current directorships held in other listed entities
Watpac Limited
Mr Peter Wall Independent Non-Executive Director
Appointed 8 October 2007. Year last re-elected: 2015.
Experience Peter has extensive management expertise, including a focus on human resources and corporate governance. Peter had a long tenure at S. Smith & Son (The Yalumba Wine Company); is a former board member of SA WorkCover Corporation and Chairman of the South Australian Vocational Employment Education & Training Board. Peter is Chair of the Nomination & Remuneration Committee, and Chair of the Audit and Risk Committee.
Current directorships held in other listed entities
None
Mr Richard Robinson Independent Non-Executive Director
Appointed 26 May 2015. Year last re-elected: 2015
Experience Richard Robinson has nearly 40 years’ experience in the Oil & Gas industry in Australia and Papua New Guinea. Richard’s experience covers project, operations and commercial management in the upstream, downstream and associated service sectors. Richard held senior roles for more than 10 years at Oil Search Limited, retiring from his role as Executive General Manager in 2013. He has since held a number of Non-Executive Director and consulting roles within the Oil & Gas, engineering and construction sectors.
Richard is a member of the Nomination & Remuneration Committee, and a member of the Audit & Risk Committee.
Current directorships held in other listed entities
Chairman of Kina Petroleum Limited having been appointed as a Non-Executive director in 2013.
DIRECTORS’ REPORTFor the year ended 30 June 2017

15LogiCamms 2017 Annual Report
DIRECTORS’ REPORTFor the year ended 30 June 2017
INFORMATION ON DIRECTORS (CONTINUED)
Mr Steve Banning Managing Director
Reappointed 2 March 2015. Resigned 22 February 2017.
Experience Steve Banning has extensive experience across the resources and energy industry. Prior to his role as Managing Director at LogiCamms, he was Managing Director of Epic Energy from 2007 until 2011. In his role as MD of Epic Energy, Steve led the business through a period of significant growth. Steve’s other roles have included General Manager Commercial of Epic Energy, Group Manager of Duke Energy and various roles within ExxonMobil.
Steve has a Bachelor of Science (Honours).
Steve Banning was re-appointed as Managing Director on 2 March 2015.
Current directorships held in other listed entities
None
INFORMATION ON COMPANY SECRETARYThe role of Company Secretary was held by two individuals throughout the financial year ended 30 June 2017.
Paul Bowker was appointed to the position of Company Secretary 2011 and also held the position of Director - Corporate Development until his resignation from the company and as Company Secretary on 17 February 2017.
David Shaw was appointed to the position of Company Secretary on 17 February 2017 and also holds the position of Legal Counsel at LogiCamms, a role in which he has served since joining LogiCamms in 2012. David holds a Bachelor of Laws and has a legal and compliance background gained from working in the corporate sector in Australia, including with Mills Oakley Lawyers and Ebsworth Lawyers.
MEETINGS OF DIRECTORSThe number of Directors’ meetings (including meetings of committees of Directors) and number of meetings attended by each of the Directors of the Company during the financial year are:
Director Board MeetingsAudit & Risk
Committee Meetings
Nomination and Remuneration
Committee MeetingsProject
Committee Meetings
A B A B A B A B
Peter Watson 19 19 4 5 5 5 NA NA
Richard Robinson 16 19 5 5 4 5 5 5
Peter Wall 19 19 5 5 5 5 NA NA
Steve Banning 11 11 3 3 3 3 2 3
A = Number of meetings attended B = Number of meetings held during the time the Director was a member of the Board or Committee

LogiCamms 2017 Annual Report16
DIRECTORS’ REPORTFor the year ended 30 June 2017
REMUNERATION REPORT – AUDITEDThe Directors present the LogiCamms 2017 remuneration report, outlining key aspects of our remuneration policy and framework, and remuneration awarded this year. This Remuneration Report outlines the Key Management Personnel (KMP) remuneration arrangements of the Group in accordance with the requirements of the Corporations Act 2001 and its Regulations. For the purpose of this report KMP of the Group are defined as those persons having authority and responsibility for planning, directing and controlling the major activities of the Group, directly or indirectly, including any Director (whether executive or otherwise).
The report is structured as follows:
(a) Overview of the Company’s approach to executive reward
(b) Governance of remuneration arrangements
(c) Elements of remuneration
(d) Consequences of performance on shareholder wealth
(e) Remuneration expenses for executive KMP
(f ) Contractual arrangements for executive KMP
(g) Non-executive director arrangements
(a) Overview of the Company’s approach to executive rewardThe Board has adopted a remuneration policy that takes into account the current size and nature of the Company’s operations.
Remuneration of KMPs is set at levels to reflect market conditions and encourage the continued services of KMP’s including by benchmarking KMP remuneration to determine where roles are currently positioned, reviewing base salary, short-term incentives and long-term incentives.
The Group’s remuneration strategy recognises and rewards performance in a way that is consistent with general practices in the markets in which the Group operates. The Group’s remuneration philosophy is focused on the following key principles:
• Alignment to sustainable long-term value creation
• Assist the attraction and retention of highly skilled employees
• Be competitive within the global markets in which the Group operates
• Alignment is best achieved through significant levels of equity ownership
• Provide high rewards for true outperformance
• Simple and transparent remuneration framework
• Consistent remuneration framework across the organisation
• Strategically align talent and succession planning for future growth
This report specifically sets out remuneration information for the key people who can directly influence the long term strategic direction of the Company and had the authority for planning, directing and controlling the affairs of the Group during the financial year ended 30 June 2017. They include the Chief Executive Officer and other key executives and Non-Executive Directors, of the Company as set out below:
Non-executive and executive Directors (see page 9 for details about each Director)
Name Position
Peter Watson Chairman
Peter Wall Non-executive Director
Richard Robinson Non-executive Director
Steve Banning Managing Director (until 22 February 2017)

17LogiCamms 2017 Annual Report
REMUNERATION REPORT – AUDITED (CONTINUED)
(a) Overview of the Company’s approach to executive reward (continued)
Other key management personnel
Name Position
Flora Furness Director – Deliver (until 22 February 2017), Chief Executive Officer (from 22 February 2017)
Dan Drewe Chief Financial Officer (from 09 June 2017)
Iulius Mincu Director – Hydrocarbons (until 17 March 2017) Director – Technology, Innovation and Asset Performance (from 17 March 2017)
Steve Banning Managing Director (until 22 February 2017)
Paul Bowker Director – Corporate Development (until 17 February 2017)
Craig White Interim Chief Financial Officer (from 17 February 2017 until 09 June 2017)
Except as noted, the named persons held their current position for the whole of the financial year and to the date of this report.
(b) Remuneration governanceTo determine the remuneration of its KMP the Company has a Nomination and Remuneration Committee. The Committee makes recommendations to the Board in relation to the remuneration of KMP, including the fixed and at risk components of remuneration. Based on the information and recommendations provided by the Committee, the Board applies its discretion to determine remuneration, including any changes to fixed components of KMP remuneration as well as any awards under the STI and LTI Plans. The Committee assists the Board in establishing human resources and compensation policies and practices including the specific remuneration (including base pay, incentive payments, bonuses, equity awards, superannuation, retirement rights, termination payments and services contracts) of the Chief Executive Officer and other KMP. The proceedings of each Committee meeting are reported directly to the Board. The Chairman of the Committee shall be a Non-Executive Director, with all other members being members of the Board. The Chief Executive Officer is invited to attend Committee meetings.
The primary objective of LogiCamms’ executive remuneration strategy is creating a framework that supports sustainable growth over the long term, recognising that this is in the interest of all stakeholders. This framework seeks to reward, retain, and motivate senior executives in a manner aligned with shareholders.
(c) Elements of remunerationRemuneration and other terms of employment for the Chief Executive Officer and other executive KMP are formalised in Executive Service Agreements and incentive plans. The total remuneration packages for these KMP contain:
• A fixed component – Base salary including superannuation. This is expressed as a specific amount that the executive may take in a form agreed with the Company and is determined based on market reference, the scope and nature of the individual’s role, their performance and experience.
• At-risk components – The Board considers that the financial and operational performance and prospects of the Company are strongly linked to creating shareholder wealth. Accordingly, the Board has put in place at-risk components to remuneration based on success in delivering on pre-defined targets. For 2017, at-risk components were in the form of:
– Short Term Incentive (STI) – payable in cash and ordinary shares. Outcomes based on LogiCamms financial and operational performance over the 2017 financial period, in addition to individual performance measures; and
– Long Term Incentives (LTI) – payable through the issue of Performance Rights and Performance Options. These LTI instruments are issued for the purposes of aligning KMP interests with those of shareholders by rewarding long term sustainable shareholder value creation. LTI outcomes for 2017 were based on strategic performance measures.
(i) Fixed annual remuneration (FR)
The fixed remuneration component of salaries includes a base salary and superannuation. Fixed remuneration may be allocated at the executive’s discretion to cash, superannuation (subject to legislative minimum), motor vehicles and certain other benefits. The fixed remuneration component is determined based on the scope and nature of the individual’s role, their performance and experience.
DIRECTORS’ REPORTFor the year ended 30 June 2017

LogiCamms 2017 Annual Report18
REMUNERATION REPORT – AUDITED (CONTINUED)
(c) Elements of remuneration (continued)
(ii) Short-term incentives
Under the terms of the STI for 2017, each participant had an annual target STI award based on a percentage of base salary for the year. Payment of the individual’s target STI was dependent on performance against the key metrics set out in the table below.
For financial year 2017, KMP had a maximum STI opportunity ranging from 20% to 50% of their fixed remuneration where targets are met. However, if the threshold performance for a measure is not met, the payment may be reduced.
The STI payment is subject to the participant being employed with the Company at the time the STI is due to be paid.
STI awards are determined after a review of performance against the key performance drivers by the Board at the end of the financial year.
Award criteria for STI
The award criteria for the STI are based on achievement against the Performance Objectives for the Company for the 2017 financial year. The table below sets out the criteria and performance against those criteria:
FY17 Scorecard Weight Position
Financial 50% Revenue, EBITDA, Capital and Cash Management
Operational 50% Reimbursability (proportion of billable hours), Staff Turnover, Training and Diversity
The Nomination and Remuneration Committee have reviewed the performance of the KMP against the above criteria. Based on the performance of the Group no STI was awarded.
The award criteria for the 2018 STI are based on achievement against the Performance Objectives for the Company for the 2018 financial year. Awards under the 2018 STI are to be paid in the form of cash and ordinary shares in a combination to be determined by the Board. The table below sets out the award criteria.
FY18 Scorecard Weight Position
Financial – EBITDAI 50% Earning Before Interest, Taxes, Depreciation, Amortisation and Impairment
Financial – OCAT 30% Operating Cashflow After Tax
Operational 20% Health, Safety, Environment and Quality
The Board has discretion to make a determination on individual performance of a KMP and apply such determination as a modifier to increase or decrease the STI payable.
(iii) Long-term incentives
For the 2017 financial year, each of the executive KMP listed in (a) above was eligible to participate in the LTI Plan, awards for which can be made in the form of Performance Rights or Performance Options.
Award criteria for LTI
Due to the change in Key Management Personnel during the year and the financial performance of the Group, no LTI award criteria were set and no LTI was awarded for the financial year ended 30 June 2017.
DIRECTORS’ REPORTFor the year ended 30 June 2017

19LogiCamms 2017 Annual Report
DIRECTORS’ REPORTFor the year ended 30 June 2017
REMUNERATION REPORT – AUDITED (CONTINUED)
(c) Elements of remuneration (continued)
Proportions of fixed and at risk remuneration
The table below sets out LogiCamms’ target mix of fixed and at risk (STI & LTI) components for each of the executive KMP for 2017 as a percentage of total remuneration:
Name Title Fixed Remuneration
STI LTI
Flora Furness Chief Executive Officer 50% 20% 30%
Dan Drewe Chief Financial Officer 100% – –
Iulius Mincu Director – Technology, Innovation and Asset Performance
62.5% 18.75% 18.75%
Craig White Interim Chief Financial Officer 100% – –
(d) Consequences of performance on shareholder wealthIn considering the Group’s performance and benefits for shareholder wealth, the Nomination and Remuneration Committee has had regard to a number of factors including profit (as determined under Australian Accounting Standards), dividends, earnings per share (EPS), return on equity and the performance of the share price.
The Nomination and Remuneration Committee has regard to the following indices in respect of the 2017 financial year and the previous four financial years.
2017 2016 2015 2014 2013
Profit/(loss) for the year attributable to owners of the Company ($’000)
(23,615) (38,139) 8,336 5,006 11,096
EBITDAI ($'000) (8,133) (8,409) 12,057 6,724 14,060
Dividends payments ($'000) – 2,410 4,884 4,545 6,307
Basic earnings per share (cents) (31) (56) 12 7 17
Increase/(decrease) in share price ($) (0.22) (0.31) (0.13) (0.48) 0.21
Return on equity % (95) (87) 10 6 14
Earnings before interest, tax, depreciation, amortisation and impairment (EBITDAI) was a loss of $8.1 million, down from a loss of $8.4 million in 2016.
EBITDAI is considered one of the key financial performance targets in setting the STI as EBITDAI is a measure of free cash flow excluding the impact of financing, non-cash accounting adjustments and tax treatments. It is considered to be a measure of the operating performance of the business that is most influenced by management decisions. EBITDAI amounts for 2013 to 2017 have been calculated by adjusting net profit calculated in accordance with Australian Accounting Standards (AASBs) and adding back net finance expenses, tax expense, depreciation, amortisation and impairment charges.
The overall level of executive KMP compensation takes into account these and other factors in assessing the performance of the Group and executive KMP over a number of years. When comparing financial year 2017 to financial year 2016, the Group continued to experience significant EBITDAI losses. The Nomination and Remuneration Committee has determined that no STI be awarded under the 2017 STI plan.

LogiCamms 2017 Annual Report20
DIRECTORS’ REPORTFor the year ended 30 June 2017
REMUNERATION REPORT – AUDITED (CONTINUED)
(e) Remuneration expenses for executive KMPDetails of the nature and amount of each major element of remuneration of each of the Key Management Personnel are:
Fixe
d
rem
uner
atio
nVa
riab
le
rem
uner
atio
nPr
opor
tion
of
rem
uner
atio
n pe
rfor
man
ce
rela
ted %
Valu
e of
op
tions
and
ri
ghts
as
prop
ortio
n of
re
mun
erat
ion %
Nam
eYe
ar
Cash
sa
lary
$
Non
-m
onet
ary
bene
fits $
Post
- em
ploy
men
t be
nefit
s Te
rmin
atio
n be
nefit
s %
Opt
ions
an
d ri
ghts
$To
tal $
Non
-Exe
cutiv
e D
irect
ors
Pete
r Wat
son
2017
140,
000
––
––
140,
000
––
20
1614
0,00
0–
––
10,9
5515
0,95
5–
7.3%
Pete
r Wal
l20
1780
,000
––
––
80,0
00–
–
20
1680
,323
––
––
80,3
23–
–
Rich
ard
Robi
nson
2017
75,0
00–
––
10,4
2185
,421
–12
.2%
20
1675
,000
––
––
75,0
00–
–
Gile
s Eve
rist (
resig
ned
5 D
ecem
ber 2
015)
2016
42,5
00–
––
–42
,500
––
Tota
l Non
-Exe
cutiv
e D
irect
or re
mun
erat
ion
2017
295,
000
––
–10
,421
305,
421
20
1633
7,82
3–
––
10,9
5534
8,77
8
Exec
utiv
e D
irect
ors
Stev
e Ba
nnin
g (re
tired
22
Febr
uary
201
7)20
1739
8,62
63,
900
22,6
9290
,000
(1,3
92)
513,
826
–(0
.3%
)
20
1650
4,59
2–
36,2
48–
164,
309
705,
149
23.3
%23
.3%
Exec
utiv
es
Flor
a Fu
rnes
s (a
ppoi
nted
22
Febr
uary
201
7)20
1735
6,66
16,
500
27,2
32–
90,0
0048
0,39
318
.7%
18.7
%
20
1631
8,90
1–
22,0
00–
36,0
0037
6,90
19.
6%9.
6%
Paul
Bow
ker (
resi
gned
17
Febr
uary
201
7)20
1720
4,23
03,
900
21,5
7717
0,19
2(2
9,25
0)37
0,64
9(7
.9%
)(7
.9%
)
20
1630
7,63
0–
30,7
84–
45,7
5038
4,16
411
.9%
11.9
%
Iuliu
s M
incu
2017
315,
946
2,31
030
,015
–35
,000
383,
271
9.1%
9.1%
20
1631
9,63
5–
30,3
65–
35,0
0038
5,00
09.
1%9.
1%
Crai
g W
hite
(app
oint
ed 1
7 Fe
brua
ry 2
017,
re
sign
ed 0
9 Ju
ne 2
017)
2017
134,
116
2,60
012
,113
–-
148,
829
––
Dan
Dre
we
(app
oint
ed 0
9 Ju
ne 2
017)
2017
9,23
0–
877
––
10,1
07–
–
Dav
id H
arris
(res
igne
d 1
Apr
il 20
16)
2016
235,
383
–15
,773
166,
460
–41
7,61
6–
–
Tota
l exe
cutiv
e di
rect
ors
and
exec
utiv
es20
171,
418,
809
19,2
1011
4,50
626
0,19
294
,358
1,90
7,07
5
2016
1,68
6,14
1–
135,
170
166,
460
281,
059
2,26
8,83
0
Tota
l KM
P Re
mun
erat
ion
2017
1,71
3,80
919
,210
114,
506
260,
192
104,
779
2,21
2,49
6
2016
2,02
3,96
4–
135,
170
166,
460
292,
014
2,61
7,60
8

21LogiCamms 2017 Annual Report
REMUNERATION REPORT – AUDITED (CONTINUED)
(e) Remuneration expenses for executive KMP (continued)
Equity instruments
KMP disclosed below were issued Performance Rights as detailed below that impact on compensation in the 2017 or subsequent reporting periods. The service or performance criteria used to determine the number of Performance Rights issued is set out earlier in this report in the discussion of the Company’s LTI Plan.
No terms of equity-settled share-based payment transactions have been altered or modified by the issuing entity since the date of grant. All Performance Rights were provided at no cost to the recipients. Performance Rights expire on the earlier of their expiry date or termination of the individual’s employment.
Analysis of incentives included in remuneration
Details of the vesting profile of the Performance Rights granted to KMP and impacting on compensation in the 2017 reporting period as at the date of this report, or subsequent reporting periods that are still outstanding are detailed below.
Name Instrument NumberGrant Date
Fair Value per
instrument at grant date
Vested in Year
Forfeited in Year
Number at reporting
date
Financial Years
in which Grant Vests
Steve Banning Performance Rights 166,667 2-Mar-15 $0.80 50% 50% – 2017-8
Performance Rights 69,444 26-Aug-15 $0.60 – 100% – 2017
Performance Rights 346,154 28-Sep-16 $0.39 – 100% – 2017
Performance Rights 346,154 28-Sep-16 $0.39 – 100% – 2018
Paul Bowker Performance Rights 48,750 26-Aug-15 $0.60 – 100% – 2017
Performance Rights 138,462 28-Sep-16 $0.39 – 100% – 2017
Performance Rights 138,462 28-Sep-16 $0.39 – 100% 2018
Flora Furness Performance Rights 138,462 28-Sep-16 $0.39 100% – – 2017
Performance Rights 138,462 28-Sep-16 $0.39 – – 138,462 2018
Iulius Mincu Performance Rights 134,615 28-Sep-16 $0.39 100% – – 2017
Performance Rights 134,615 28-Sep-16 $0.39 – – 134,615 2018
Richard Robinson Performance Rights 16,667 24-Nov-16 $0.44 100% – – 2017
Performance Rights 16,666 24-Nov-16 $0.44 – – 16,666 2018
The performance period for rights issued 28 September 2016, shown above, under the 2016 LTI awards is the year from 1 July 2015 to 30 June 2016. The Performance Rights vest into shares for no further consideration on a 1 for 1 basis subject to tenure at the time of vesting. The form of the share based payments for Steve Banning for 2016 were subject to approval by resolution of the shareholders at the 2016 AGM. The resolution was not passed and the shares were forfeited.
Other terms
Performance Rights granted under the LTI Plan carry no voting or dividend entitlements. Currently, based on the number of Performance Rights issued and held pursuant to the LTI Plan, should all of these securities convert to shares they would represent 0.2% of the Company’s issued share capital.
Exercise of Options or Performance Rights
During the period 138,462 shares were issued to Flora Furness with a fair value at grant date of $0.39, 16,667 shares were issued to Richard Robinson with a fair value at grant date of $0.44 and 83,334 shares were issued to Steve Banning with a fair value at grant date of $0.80. All shares issued were on the conversion of Performance Rights granted in the current or prior years as compensation. No exercise price was payable on the conversion of the Performance Rights. The Performance Rights were all STI awards in respect of the 2016 financial year.
DIRECTORS’ REPORTFor the year ended 30 June 2017
LogiCamms 2017 Annual Report22
REMUNERATION REPORT – AUDITED (CONTINUED)
(e) Remuneration expenses for executive KMP (continued)
Exercise of Options or Performance Rights (continued)
152,977 Performance Rights issued to Steve Banning and 325,674 Performance Rights issued to Paul Bowker were forfeited on cessation of employment. 692,308 Performance Rights for Steve Banning for 2016 were not approved by resolution of the shareholders at the 2016 AGM.
No other Performance Rights previously granted to KMPs were exercised during the reporting period.
On Market Purchases
All shares underpinning equity awards may be purchased on market, or be newly issued shares or a combination of both. As at 1 July 2016, the LogiCamms Employee Share Trust held 270,614 ordinary LogiCamms shares which had been purchased on market in prior periods. During the 2017 financial year, the LogiCamms Employee Share Trust acquired 478,181 shares on market and allocated 748,794 shares.
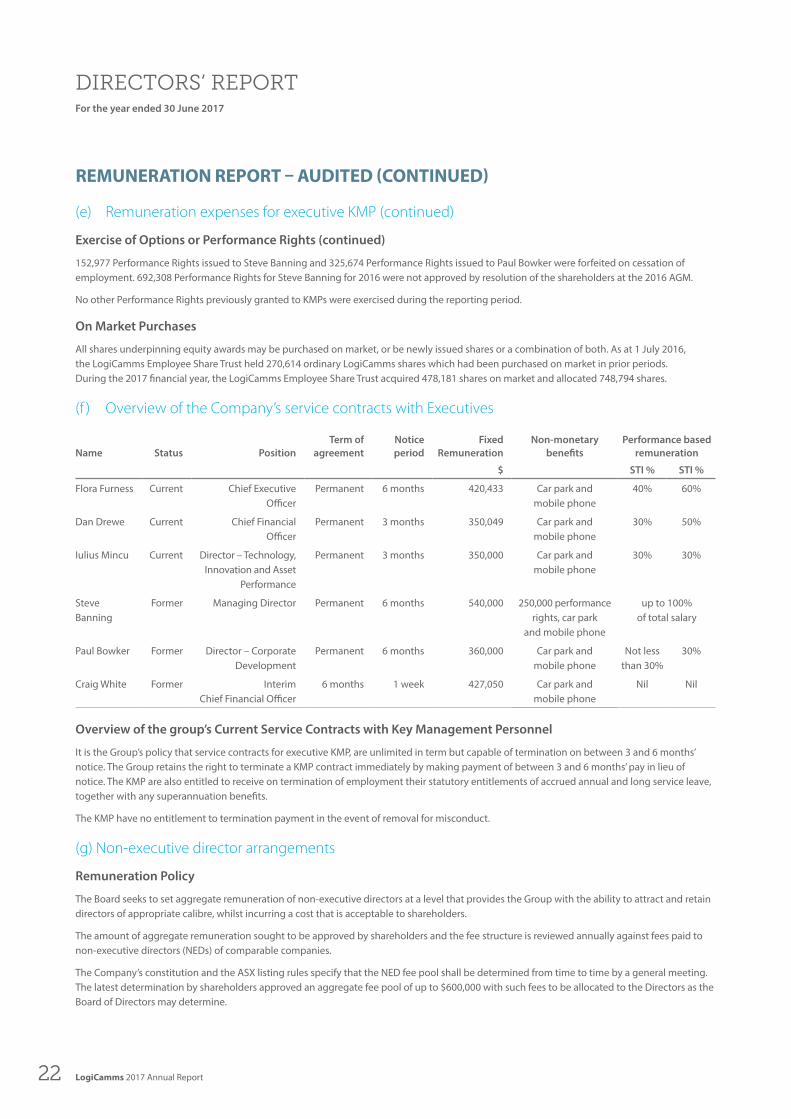
(f ) Overview of the Company’s service contracts with Executives
Name Status PositionTerm of
agreementNotice period
Fixed Remuneration
Non-monetary benefits
Performance based remuneration
$ STI % STI %
Flora Furness Current Chief Executive Officer
Permanent 6 months 420,433 Car park and mobile phone
40% 60%
Dan Drewe Current Chief Financial Officer
Permanent 3 months 350,049 Car park and mobile phone
30% 50%
Iulius Mincu Current Director – Technology, Innovation and Asset
Performance
Permanent 3 months 350,000 Car park and mobile phone
30% 30%
Steve Banning
Former Managing Director Permanent 6 months 540,000 250,000 performance rights, car park
and mobile phone
up to 100% of total salary
Paul Bowker Former Director – Corporate Development
Permanent 6 months 360,000 Car park and mobile phone
Not less than 30%
30%
Craig White Former Interim Chief Financial Officer
6 months 1 week 427,050 Car park and mobile phone
Nil Nil
Overview of the group’s Current Service Contracts with Key Management Personnel
It is the Group’s policy that service contracts for executive KMP, are unlimited in term but capable of termination on between 3 and 6 months’ notice. The Group retains the right to terminate a KMP contract immediately by making payment of between 3 and 6 months’ pay in lieu of notice. The KMP are also entitled to receive on termination of employment their statutory entitlements of accrued annual and long service leave, together with any superannuation benefits.
The KMP have no entitlement to termination payment in the event of removal for misconduct.
(g) Non-executive director arrangements
Remuneration Policy
The Board seeks to set aggregate remuneration of non-executive directors at a level that provides the Group with the ability to attract and retain directors of appropriate calibre, whilst incurring a cost that is acceptable to shareholders.
The amount of aggregate remuneration sought to be approved by shareholders and the fee structure is reviewed annually against fees paid to non-executive directors (NEDs) of comparable companies.
The Company’s constitution and the ASX listing rules specify that the NED fee pool shall be determined from time to time by a general meeting. The latest determination by shareholders approved an aggregate fee pool of up to $600,000 with such fees to be allocated to the Directors as the Board of Directors may determine.
DIRECTORS’ REPORTFor the year ended 30 June 2017

23LogiCamms 2017 Annual Report
REMUNERATION REPORT – AUDITED (CONTINUED)
(g) Non-executive director arrangements (continued)
Structure
The remuneration of NEDs consists of directors’ fees and committee fees. NEDs do not receive retirement benefits.
Mr Richard Robinson received a base fee of $75,000 inclusive of superannuation for being a director of the Group. The Board Chairman, Mr Peter Watson, received a base fee of $140,000 inclusive of superannuation for the period. Mr Peter Wall received a base fee of $80,323 inclusive of superannuation due to an additional fee being payable as chair of the Audit Committee and Nomination and Remuneration Committee.
An additional fee may be payable for a Director (except for the Board Chairman) who is a chair of a Board committee. The payment of additional fees for serving on a committee recognises the additional time commitment required by NEDs who serve on sub-committees. NEDs do not participate in the Company’s STI or LTI plans.
Movements in shares
The movement during the reporting year in the number of ordinary shares in the Company held directly, indirectly or beneficially, by KMP, is as follows:
2017 Name
Balance at the start of the
year
Received on vesting of
rights
Other changes during the
year
Balance at the end of the
year
Ordinary shares
Peter Watson 811,029 66,666 39,474 917,169
Peter Wall 200,001 – 39,474 239,475
Richard Robinson – 33,334 – 33,334
Steve Banning (1) 175,827 83,333 39,474 298,634
Paul Bowker (2) 327,876 – – 327,876
Flora Furness – 138,462 – 138,462
Iulius Mincu – 134,615 – 134,615
Craig White – – – –
Dan Drewe – – – –
(1) Steve Banning retired during the period, balance is representative at 28 February 2017. (2) Paul Bowker left during the period, balance is representative at 17 February 2017.
Other changes during the period represents shares acquired by Directors as part of the Share Purchase Plan.
Directors interests
The relevant interest of each Director in the Shares and Performance Rights issued by the Company at the date of this report is as follows:
DirectorOrdinary
SharesPerfromance
Rights
Richard Robinson 33,334 16,666
Peter Wall 239,475 –
Peter Watson 917,169 –
Options and rights granted to Directors and Officers of the Company
During or since the end of the financial year, the Company granted no additional rights over unissued ordinary shares in the Company to the Key Management Personnel.
The Performance Rights require the holder to remain employed by the Company prior to vesting. Performance Rights over unissued ordinary shares in the Company granted in the previous financial year were detailed in the previous Annual Report.
Unissued shares under options
At the date of this report there are no other unissued ordinary shares of the Company under option.
DIRECTORS’ REPORTFor the year ended 30 June 2017
LogiCamms 2017 Annual Report24
DIRECTORS’ REPORTFor the year ended 30 June 2017
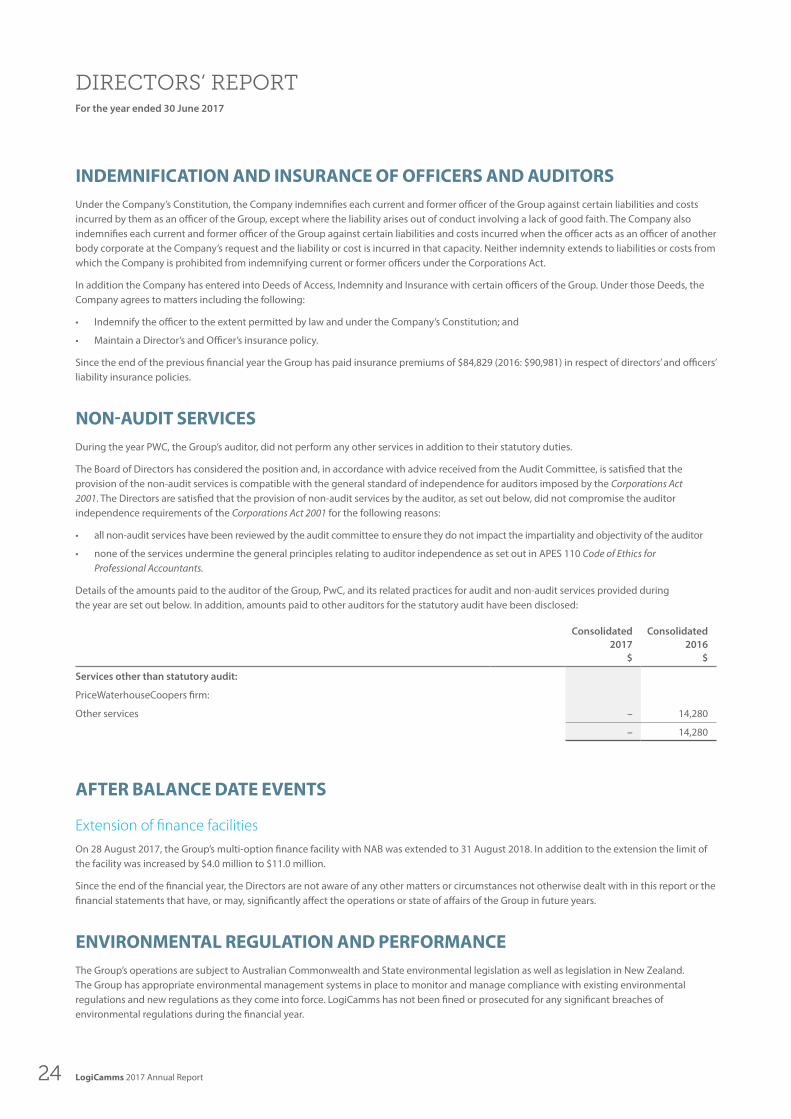
INDEMNIFICATION AND INSURANCE OF OFFICERS AND AUDITORSUnder the Company’s Constitution, the Company indemnifies each current and former officer of the Group against certain liabilities and costs incurred by them as an officer of the Group, except where the liability arises out of conduct involving a lack of good faith. The Company also indemnifies each current and former officer of the Group against certain liabilities and costs incurred when the officer acts as an officer of another body corporate at the Company’s request and the liability or cost is incurred in that capacity. Neither indemnity extends to liabilities or costs from which the Company is prohibited from indemnifying current or former officers under the Corporations Act.
In addition the Company has entered into Deeds of Access, Indemnity and Insurance with certain officers of the Group. Under those Deeds, the Company agrees to matters including the following:
• Indemnify the officer to the extent permitted by law and under the Company’s Constitution; and
• Maintain a Director’s and Officer’s insurance policy.
Since the end of the previous financial year the Group has paid insurance premiums of $84,829 (2016: $90,981) in respect of directors’ and officers’ liability insurance policies.
NON-AUDIT SERVICESDuring the year PWC, the Group’s auditor, did not perform any other services in addition to their statutory duties.
The Board of Directors has considered the position and, in accordance with advice received from the Audit Committee, is satisfied that the provision of the non-audit services is compatible with the general standard of independence for auditors imposed by the Corporations Act 2001. The Directors are satisfied that the provision of non-audit services by the auditor, as set out below, did not compromise the auditor independence requirements of the Corporations Act 2001 for the following reasons:
• all non-audit services have been reviewed by the audit committee to ensure they do not impact the impartiality and objectivity of the auditor
• none of the services undermine the general principles relating to auditor independence as set out in APES 110 Code of Ethics for Professional Accountants.
Details of the amounts paid to the auditor of the Group, PwC, and its related practices for audit and non-audit services provided during the year are set out below. In addition, amounts paid to other auditors for the statutory audit have been disclosed:
Consolidated 2017
$
Consolidated 2016
$
Services other than statutory audit:
PriceWaterhouseCoopers firm:
Other services – 14,280
– 14,280
AFTER BALANCE DATE EVENTS
Extension of finance facilitiesOn 28 August 2017, the Group’s multi-option finance facility with NAB was extended to 31 August 2018. In addition to the extension the limit of the facility was increased by $4.0 million to $11.0 million.
Since the end of the financial year, the Directors are not aware of any other matters or circumstances not otherwise dealt with in this report or the financial statements that have, or may, significantly affect the operations or state of affairs of the Group in future years.
ENVIRONMENTAL REGULATION AND PERFORMANCEThe Group’s operations are subject to Australian Commonwealth and State environmental legislation as well as legislation in New Zealand. The Group has appropriate environmental management systems in place to monitor and manage compliance with existing environmental regulations and new regulations as they come into force. LogiCamms has not been fined or prosecuted for any significant breaches of environmental regulations during the financial year.

25LogiCamms 2017 Annual Report
PROCEEDINGS ON BEHALF OF THE COMPANYNo person has applied to the Court under section 237 of the Corporations Act 2001 for leave to bring proceedings on behalf of the Company, or to intervene in any proceedings to which the Company is a party, for the purpose of taking responsibility on behalf of the Company for all or part of those proceedings.
No proceedings have been brought or intervened in on behalf of the Company with leave of the Court under section 237 of the Corporations Act 2001.
AUDITOR’S INDEPENDENCE DECLARATIONA copy of the auditor’s independence declaration as required under section 307C of the Corporations Act 2001 is set out on page 71.
ROUNDING OF AMOUNTSThe Company is of a kind referred to in ASIC Corporations (Rounding in Financial/Directors’ Reports) Instrument 2016/191 dated 24 March 2016. Amounts in the Directors’ report have been rounded off in accordance with that Legislative Instrument to the nearest thousand dollars, or in certain cases, to the nearest dollar.
This report is made in accordance with a resolution of Directors.
Peter Watson Chairman
Brisbane 30 August 2017
DIRECTORS’ REPORTFor the year ended 30 June 2017

LogiCamms 2017 Annual Report26

27LogiCamms 2017 Annual Report
CONSOLIDATED STATEMENT OF PROFIT OR LOSS AND OTHER COMPREHENSIVE INCOME For the year ended 30 June 2017
Notes2017
$’0002016
$’000
Revenue 4(a) 81,063 108,187
Cost of sales (52,624) (73,520)
Gross profit 28,439 34,667
Other income 4(b) 323 2,001
Business development expenses (6,179) (7,370)
Other expenses (34,020) (37,476)
(11,437) (8,178)
Onerous lease benefit/(expense) 11(b) 668 (4,200)
Results from operating activities (10,769) (12,378)
Finance income 4(c) 4 81
Finance expenses 4(d) (85) (151)
Net finance income (81) (70)
Revaluation / share of net loss of equity accounted investees 9(b) (15) (33)
Impairment charge (11,000) (28,100)
(11,015) (28,133)
Loss before income tax (21,865) (40,581)
Income tax benefit/(expense) 4(e) (1,750) 2,442
Loss for the year attributable to owners of the Company (23,615) (38,139)
Other comprehensive income
Items that may be reclassified to profit or loss
Foreign currency translation differences 325 1,434
Other (26) –
Other comprehensive income for the year, net of tax 299 1,434
Total comprehensive loss for the year attributable to owners of the Company (23,316) (36,705)
Earnings per share
Basic earnings per share (cents per share AUD) 4(f ) (30.6) (55.5)
Diluted earnings per share (cents per share AUD) 4(f ) (30.6) (55.5)
The above Consolidated statement of profit or loss and other comprehensive income should be read in conjunction with the accompanying notes.

LogiCamms 2017 Annual Report28
CONSOLIDATED STATEMENT OF FINANCIAL POSITIONFor the year ended 30 June 2017
Notes2017
$’0002016
$’000
ASSETS
Cash and cash equivalents 5(a) 4,983 6,637
Trade and other receivables 5(b) 18,245 20,832
Current tax asset 4(e) – 508
Total current assets 23,228 27,977
Investments in equity accounted investees 9(b) – 15
Property, plant and equipment 6(a) 2,877 1,851
Deferred tax assets 4(e) 3,328 4,713
Intangible assets 6(b) 21,537 33,801
Other non-current assets – 125
Total non-current assets 27,742 40,505
Total assets 50,970 68,482
LIABILITIES
Trade and other payables 5(c) 7,576 9,471
Borrowings 5(g) 4,000 –
Current tax liability 4(e) 122 –
Employee benefits 5(e) 3,591 4,499
Provisions 5(f ) 3,839 4,807
Deferred income 5(d) 2,242 681
Total current liabilities 21,370 19,458
Trade and other payables 5(c) 1,210 961
Employee benefits 5(e) 839 878
Provisions 5(f ) 2,779 3,560
Total non-current liabilities 4,828 5,399
Total liabilities 26,198 24,857
Net assets 24,772 43,625
EQUITY
Share capital 57,619 53,163
Reserves 2,760 2,435
Accumulated losses (35,607) (11,973)
Total equity attributable to owners of the Company 24,772 43,625
The above Consolidated statement of financial position should be read in conjunction with the accompanying notes.

29LogiCamms 2017 Annual Report
Attributable to owners of LogiCamms
Share capital $’000
Reserves $’000
Retained earnings/
(Accumulated losses)
$’000 Total
$’000
Balance at 1 July 2015 53,416 1,001 28,497 82,914
Loss for the year – – (38,139) (38,139)
Other comprehensive income – 1,434 – 1,434
Total comprehensive income for the year – 1,434 (38,139) (36,705)
Dividends paid – – (2,410) (2,410)
Employee share scheme – – 79 79
Treasury shares (253) – – (253)
Balance at 30 June 2016 53,163 2,435 (11,973) 43,625
Balance at 1 July 2016 53,163 2,435 (11,973) 43,625
Loss for the year – – (23,615) (23,615)
Other comprehensive income – 325 (26) 299
Total comprehensive income for the year – 325 (23,641) (23,316)
Issuance of shares 4,456 – – 4,456
Employee share scheme – – 7 7
Balance at 30 June 2017 57,619 2,760 (35,607) 24,772
The above Consolidated statement of changes in equity should be read in conjunction with the accompanying notes.
CONSOLIDATED STATEMENT OF CHANGES IN EQUITY AND OTHER COMPREHENSIVE INCOME For the year ended 30 June 2017

LogiCamms 2017 Annual Report30
Notes2017
$’0002016
$’000
Cash flows from operating activities
Receipts from customers 83,963 110,568
Payments to suppliers and employees (93,446) (118,784)
(9,483) (8,216)
Interest paid (85) (22)
Income taxes (paid)/refunded 401 (82)
Net cash outflow from operating activities (9,167) (8,320)
Cash flows from investing activities
Interest received 4 81
Proceeds from sale of property, plant and equipment 4 –
Acquisition of property, plant and equipment 6(a) (951) (295)
Payments for acquisition of subsidiary, net of cash acquired – (1,835)
Dividends and return of capital from equity accounted investee 9(b) – 228
Payment of earn out – (500)
Acquisition of intangible assets – (1,910)
Net cash outflow from investing activities (943) (4,231)
Cash flows from financing activities
Proceeds from issues of shares and other equity securities 7(a) 4,456 –
Proceeds from borrowings – external 5(g) 4,000 –
Payments for shares bought back 7(a) – (253)
Dividends paid to shareholders – (2,410)
Net cash inflow/(outflow) from financing activities 8,456 (2,663)
Net (decrease) in cash and cash equivalents (1,654) (15,214)
Cash and cash equivalents at the beginning of financial year 6,637 21,851
Cash and cash equivalents at the end of the financial year 5(a) 4,983 6,637
The above Consolidated statement of cash flows should be read in conjunction with the accompanying notes.
CONSOLIDATED STATEMENT OF CASH FLOWS AND OTHER COMPREHENSIVE INCOME For the year ended 30 June 2017

31LogiCamms 2017 Annual Report
1 GENERAL INFORMATIONLogiCamms Limited (the “Company”) is a company domiciled in Australia. The address of the Company’s registered office is Level 14, 200 Mary Street, Brisbane, Australia. The Consolidated financial statements of the Company as at and for the year ended 30 June 2017 comprise the Company and its subsidiaries (together referred to as “the Group” and individually as “Group entities”) and the Group’s interest in associates and jointly controlled entities.
The Group is primarily involved with the energy, resources and infrastructure sectors providing engineering consulting services primarily in Australia and New Zealand. Comparative information has been reclassified where appropriate to enhance comparability.
The financial statements were approved by the Board of Directors on 30 August 2017.
2 BASIS OF PREPARATIONThe financial statements have been prepared on a going concern basis, which contemplates that the Group will continue to meet its commitments, realise its assets and settle its liabilities in the normal course of business.
The Group recorded an operating loss (excluding impairment) of $10.8 million and net operating cash outflows of $9.2 million during the 2017 financial year. In response, the Group carried out two restructures at a cost of $2.1 million during the year, removing an annualised $10.5 million of overhead and operating costs from the business. The Group also raised $4.5 million through an equity raising in November 2016, and drew down borrowings under its working capital facility of $4.0 million.
The Group operates its business through management of its cash reserves, operating cash flows and a working capital facility provided by NAB. As at 30 June 2017 cash on hand was $5.0 million and borrowings under the working capital facility totalled $4.0 million. The Group has prepared detailed cash flow forecasts for the next twelve months which show an improvement in operating cash flows. The Group continues to have a strong cash collection and billing cycle over its debtors and work in progress (WIP) with minimal debts being written off during the course of the 2017 financial year and the aging profile of WIP and debtors improved significantly.
The nature of the Group’s work requires that bank guarantees or bonds are issued in relation to certain projects. At 30 June 2017, the Group had on issue $5.2 million in bank guarantees and bonds. These commitments are met out of an existing $7.0 million multi option bank guarantee and working capital facility with NAB (the limit on this facility was temporarily increased at 30 June 2017 to $10.0 million to support the restructure activities announced in June 2017) and a $7.5 million performance bond facility with SwissRe. The Group believes that the $8.3 million headroom under these facilities at 30 June 2017 is sufficient to meet the requirements of any currently identified projects or proposals.
Subsequent to the end of the financial year, the approved limit on the NAB multi-option facility has been increased by $4.0 million to $11.0 million and extended to 31 August 2018 to support the working capital needs of the business and the growth currently being experienced in the new financial year. The increased facilities provide some headroom in the event that actual performance varies significantly from that assumed in the Group’s forecasts.
The Group’s forecasts and projections, taking into account reasonably possible changes in trading performance, show that the Director’s expect the group to operate within the limit of its current facilities. The Group believes that the headroom remaining under the bonding and bank guarantee facility with SwissRe and the multi option facility with NAB continues to be sufficient to meet the foreseeable future working capital and bond requirements of the business. However, should forecasts indicate that additional working capital is required in the future, the Directors are confident that the Group will be able to raise additional funds through an equity raising, further increasing the limit of its existing debt facilities, by obtaining alternative longer-term debt facilities or through the sale of assets.
The Group entered the 2018 financial year with its strongest order book in several years, with work in hand of $25.1 million representing approximately 33% of the Group’s forecast engineering consulting revenue for the upcoming financial year. Since the end of the financial year, the Group has won over $13.0 million of new work, with work previously deferred in the 2017 financial year beginning to flow through from clients. With the significant number of MSA’s that the Group now has and the strategic partnerships the Group has recently formed, there is a pipeline of work and prospects/proposals flowing from the Group’s traditional client base and new, higher margin opportunities being generated from the Group’s investment in it’s technology and innovation division.
NOTES TO THE FINANCIAL STATEMENTSFor the year ended 30 June 2017

LogiCamms 2017 Annual Report32
2 BASIS OF PREPARATION (CONTINUED)Based on the current cash position, facilities in place, cost savings achieved in the recent restructure, as well as the Group’s work in hand and proposal pipeline, the Directors believe that the Group will continue to meets its debts as and when they fall due, and accordingly, have prepared the annual financial report on a going concern basis.
(a) Statement of complianceThe consolidated financial statements are general purpose financial statements which have been prepared in accordance with Australian Accounting Standards (“AASs”) (including Australian Interpretations adopted by the Australian Accounting Standards Board (“AASB”)) and the Corporations Act 2001. The consolidated financial statements comply with International Financial Reporting Standards (“IFRSs”) and interpretations adopted by the International Accounting Standards Board.
(b) Basis of measurement and presentation currencyThe Consolidated financial statements have been prepared on the historical cost basis, except for specific assets and liabilities to be measured at fair value.
The Consolidated financial statements are presented in Australian dollars, which is the Company’s functional currency.
The Company is of a kind referred to in legislative instrument 2016/191 and in accordance with that legislative instrument, all financial information presented in Australian dollars has been rounded to the nearest thousand unless otherwise stated.
(c) Use of estimates and judgementsThe preparation of financial statements requires management to make judgements, estimates and assumptions that affect the application of accounting policies and the reported amounts of assets, liabilities, income and expenses. Actual results may differ from these estimates.
Estimates and underlying assumptions are reviewed on an on-going basis. Revisions to accounting estimates are recognised in the period in which the estimate is revised and in any future periods affected.
In particular, information about significant areas of estimation, uncertainty and critical judgements in applying accounting policies that have the most significant effect on amounts recognised in the financial statements are included in the following notes:
• Note 2 - Basis of preparation
• Notes 4(a) and 5(b) – revenue recognition and project work in progress
• Note 4(e) – tax loss recognition
• Note 6(b) – measurement of the recoverable amounts of cash-generating units containing goodwill
NOTES TO THE FINANCIAL STATEMENTSFor the year ended 30 June 2017

33LogiCamms 2017 Annual Report
3 SIGNIFICANT ACCOUNTING POLICIESThe accounting policies set out below have been applied consistently to all periods presented in these consolidated financial statements, and have been applied consistently by the Group.
(a) Goods and Services Tax (GST)Revenue, expenses and assets are recognised net of the amount of goods and services tax (GST), except where the amount of GST incurred is not recoverable from the taxation authority. In these circumstances, the GST is recognised as part of the cost of acquisition of the asset or as part of the expense.
(b) Foreign currency
Foreign currency transactions
Transactions in foreign currencies are translated to the respective functional currency of the Group entities at exchange rates at the dates of the transactions.
Monetary assets and liabilities denominated in foreign currencies at the reporting date are retranslated to the functional currency using the exchange rate at that date. Foreign currency gains or losses on monetary items is the difference between amortised cost in the functional currency at the beginning of the year, adjusted for effective interest and payments during the year, and the amortised cost in foreign currency translated at the exchange rate at the end of the year.
Non-monetary assets and liabilities that are measured at fair value in a foreign currency are retranslated to the functional currency at the exchange rate at the date that the fair value was determined. Non-monetary items that are measured based on historical cost in a foreign currency are translated using the exchange rate at the date of the transaction.
Foreign currency differences arising on retranslation are generally recognised in profit or loss.
Foreign operations
The assets and liabilities of foreign operations, including goodwill and fair value adjustments arising on acquisition, are translated to the presentation currency at exchange rates at the reporting date. The income and expenses of foreign operations are translated to Australian dollars at exchange rates at the dates of the transactions. Foreign currency differences are recognised in other comprehensive income, and presented in the foreign currency translation reserve (translation reserve) in equity.
When the settlement of a monetary item receivable from or payable to a foreign operation is neither planned nor likely in the foreseeable future, foreign exchange gains and losses arising from such items are considered to form part of the net investment in the foreign operation and are recognised in other comprehensive income, and presented in the translation reserve in equity.
(c) New accounting standards and interpretations not yet adoptedA number of new standards, amendments to standards and interpretations are effective for annual periods beginning after 1 July 2017. None of these have had a significant effect on the consolidated financial statements of the Group.
The Group has not elected to adopt early any accounting standards and/or amendments.
NOTES TO THE FINANCIAL STATEMENTSFor the year ended 30 June 2017

LogiCamms 2017 Annual Report34
3 SIGNIFICANT ACCOUNTING POLICIES (CONTINUED)
(c) New accounting standards and interpretations not yet adopted (continued)At the date of authorisation of the financial statements, the Standards and Interpretations listed below were in issue but not yet effective:
Title of standard AASB 9 Financial Instruments
Nature of change AASB 9 addresses the classification, measurement and derecognition of financial assets and financial liabilities, introduces new rules for hedge accounting and a new impairment model for financial assets.
Impact The majority of the Group’s financial assets are in the form of cash and cash equivalents and trade and other receivables.
Accordingly, the Group does not expect the new guidance to have a significant impact on the classification and measurement of its financial assets.
The new impairment model requires the recognition of impairment provisions based on expected credit losses rather than only incurred credit losses as is the case under AASB 139. It applies to financial assets classified at amortised cost, debt instruments measured at FVOCI, contract assets under AASB 15 Revenue from Contracts with Customers, lease receivables, loan commitments and certain financial guarantee contracts. While the Group has not yet undertaken a detailed assessment of how its impairment provisions would be affected by the new model, it may result in an earlier recognition of credit losses.
The new standard also introduces expanded disclosure requirements and changes in presentation. These are expected to change the nature and extent of the Group’s disclosures about its financial instruments particularly in the year of the adoption of the new standard.
Date of adoption by Group
Must be applied for financial years commencing on or after 1 January 2018. The Group will apply the new rules retrospectively from 1July 2018, with practical expedients permitted under the standard. Comparatives for 30 June 2018 will not be restated.
Title of standard AASB 9 Revenue from Contracts with Customers
Nature of change The AASB has issued a new standard for the recognition of revenue. This will replace AASB 118 which covers revenue arising from the sale of goods and the rendering of services and AASB 111 which covers construction contracts.
The new standard is based on the principle that revenue is recognised when control of a good or service transfers to a customer.
The standard permits either a full retrospective or a modified retrospective approach for the adoption.
Impact Management is currently assessing the effects of applying the new standard on the Group’s financial statements.
At this stage, the Group is not able to estimate the effect of the new rules on the Group’s financial statements. The Group will make more detailed assessments of the effect over the next twelve months.
The application of AASB15 may further result in the identification of separate performance obligations in relation to some contracts which could affect the timing of the recognition of revenue going forward.
Date of adoption by Group
Must be applied for financial years commencing on or after 1 January 2018. The Group intends to adopt the standard using the modified retrospective approach which means that the cumulative impact of the adoption will be recognised in retained earnings as of 1 July 2018 and that comparatives will not be restated.
Title of standard AASB 16 Leases
Nature of change Under the new standard, an asset (the right to use the leased item) and a financial liability to pay rentals are recognised.
Impact As at the reporting date, the Group has operating lease commitments of $11.3 million. However, the Group has not yet determined to what extent these commitments will result in the recognition of an asset and a liability for future payments and how this will affect the Group’s profit and classification of cash flows. Some of the commitments may be covered by an exception for short-term and low-value leases and some commitments may relate to arrangements that will not qualify as leases under AASB16.
The impact of this new standard will result in lower operating expenses and higher depreciation and finance charges, as premises leases are brought onto the balance sheet. Debt to equity ratios will increase.
Date of adoption by Group
Mandatory for financial years commencing on or after 1 January 2019. At this stage, the Group does not intend to adopt the standard before its effective date. The Group intends to apply the simplified transitions approach and will not restate comparative amounts for the year prior to first adoption.
NOTES TO THE FINANCIAL STATEMENTSFor the year ended 30 June 2017

35LogiCamms 2017 Annual Report
3 SIGNIFICANT ACCOUNTING POLICIES (CONTINUED)
(c) New accounting standards and interpretations not yet adopted (continued)There are no other standards that are not yet effective and that are expected to have a material impact on the entity in the current or future reporting periods and on foreseeable future transactions.
(d) Other accounting policiesSignificant and other accounting policies that summarise the measurement basis used and are relevant to an understanding of the financial statements are provided throughout the notes to the financial statements.
4 OPERATIONS – RESULTS FOR THE YEAR
(a) Revenue
2017 $’000
2016 $’000
Project and services revenue 75,760 101,086
Training courses 5,303 7,101
81,063 108,187
Revenue from projects and services
With respect to fixed price contracts, revenue is recognised depending on the stage of completion of those services. The Group estimates the percentage of costs based on the portion that contract costs incurred for work performed to date bear to the estimated total contract costs.
Contract revenue includes the initial amount agreed in the contract plus any variations in contract work, claims and incentive payments to the extent that it is probable that they will result in revenue and can be measured reliably.
When the outcome of a contract cannot be estimated reliably, contract revenue is recognised only to the extent of contract costs incurred that are likely to be recoverable. An expected loss on a contract is recognised immediately in profit or loss.
Revenue from training courses
Revenue from training courses is recognised when the course is completed.
(b) Other income
Notes2017
$’0002016
$’000
Reduction in earn outs payable 9(c) 300 2,000
Other 23 1
323 2,001
(c) Finance income
2017 $’000
2016 $’000
Interest income on bank deposits 4 81
4 81
NOTES TO THE FINANCIAL STATEMENTSFor the year ended 30 June 2017

LogiCamms 2017 Annual Report36
4 OPERATIONS – RESULTS FOR THE YEAR (CONTINUED)
(d) ExpensesThe statement of profit or loss and other comprehensive income includes the following specific expenses:
2017 $’000
2016 $’000
Personnel expenses 58,424 68,416
Contractor expenses 4,569 17,183
Contributions to defined contribution superannuation funds 4,561 4,511
Operating leases 3,046 3,223
Depreciation 1,099 2,543
Amortisation 1,552 1,459
Interest expense on financial liabilities 85 151
Personnel expenses and Contributions to defined contribution superannuation funds
The Group’s accounting policy for liabilities associated with employee benefits is set out in Note 5(e). The majority of employees in Australia and New Zealand are party to a defined contribution scheme and receive fixed contributions from the Group and the Group’s legal or constructive obligation is limited to these contributions. Contributions to defined contribution funds are recognised as an expense as they become payable.
Operating leases
Payments made under operating leases are recognised in profit or loss on a straight-line basis over the term of the lease. Lease incentives received are recognised as an integral part of the total lease expense, over the term of the lease.
Depreciation and amortisation
The Group’s accounting policy for depreciation and amortisation is set out in Notes 6(a) and 6(b).
(e) TaxationIncome tax expense comprises current and deferred tax. Current and deferred tax is recognised in profit or loss except to the extent that it relates to items recognised directly in equity, in which case it is recognised in equity or in other comprehensive income.
Income tax expense
2017 $’000
2016 $’000
Current tax expense
Current year 213 (473)
Withholding tax paid 136 78
Adjustments for current tax of prior periods 17 (240)
366 (635)
Deferred tax expense
Decrease (increase) in deferred tax assets 1,384 (1,807)
Total income tax (benefit) / expense 1,750 (2,442)
NOTES TO THE FINANCIAL STATEMENTSFor the year ended 30 June 2017

37LogiCamms 2017 Annual Report
4 OPERATIONS – RESULTS FOR THE YEAR (CONTINUED)
(e) Taxation (continued)
Numerical reconciliation between tax expense and pre-tax accounting profit2017
$’0002016
$’000
Loss for the year (23,615) (38,139)
Total income tax (benefit) / expense 1,750 (2,442)
Loss before income tax (21,865) (40,581)
Income tax using the Company’s domestic tax rate of 30.0% (2016 – 30.0%) (6,560) (12,174)
Tax effect of amounts which are not deductible (taxable) in calculating taxable income:
Effect of tax rates in foreign jurisdictions 3 15
Non-deductible expenses – Goodwill impairment 3,300 8,430
Non-deductible expenses – other (146) (219)
Non-assessable income (90) (600)
Withholding taxes paid 136 73
Franking credits 213 (58)
Tax losses and incentives not recognised 4,877 2,641
Adjustments for current tax of prior periods 17 (240)
Research and development tax credit – (310)
Total income tax expense 1,750 (2,442)
The difference between the actual income tax expense and the income tax expense using the Company’s domestic rate of 30% is mainly attributable to tax losses and incentives not recognised combined with goodwill impairment.
Current tax assets and liabilities
Current tax is the expected tax payable or receivable on the taxable income for the year, using tax rates enacted or substantively enacted at the reporting date, and any adjustment to tax payable in respect of previous years.
2017 $’000
2016 $’000
Current tax asset – 508
Current tax liability (122) –
Tax assets and liabilities – recognised deferred tax assets and liabilities
A deferred tax asset is recognised to the extent that it is probable that future taxable profits will be available against which the temporary difference can be utilised. Deferred tax assets are reviewed at each reporting date and are reduced to the extent that it is no longer probable that the related tax benefit will be realised.
Deferred tax is based upon the expected manner of realisation or settlement of the carrying amount of assets and liabilities using the applicable tax rates. Deferred tax is recognised in respect of temporary differences between the carrying amounts of assets and liabilities for financial reporting purposes and the amounts used for taxation purposes.
Deferred tax assets and liabilities are offset if there is a legally enforceable right to offset current tax liabilities and assets; and they relate to income taxes levied by the same tax authority on the same taxable entity, or on different tax entities, but they intend to settle current tax liabilities and assets on a net basis or their tax assets and liabilities will be realised simultaneously.
NOTES TO THE FINANCIAL STATEMENTSFor the year ended 30 June 2017

LogiCamms 2017 Annual Report38
4 OPERATIONS – RESULTS FOR THE YEAR (CONTINUED)
(e) Taxation (continued)
Deferred tax assets2017
$’0002016
$’000
The balance comprises temporary differences attributable to:
Trade receivables 114 51
Fixed Assets 228 258
Employee benefits 1,322 1,606
Other payables 494 1,170
Revenue received in advance 673 8
Provisions 1,813 2,080
Share based payments 15 41
4,659 5,214
Set-off of deferred tax liabilities pursuant to set-off provisions (1,331) (501)
Net deferred tax assets 3,328 4,713
Movements
Trade receivables
$’000
Fixed assets $’000
Employee benefits
$’000
Other payables
$’000
Revenue received in
advance $’000
Provisions $’000
Share based
payments $’000
Total $’000
At 1 July 2015 185 9 1,938 623 22 879 56 3,712
(Charged)/credited – to profit or loss
(134) 249 (332) 547 (14) 1,201 (15) 1,502
At 30 June 2016 51 258 1,606 1,170 8 2,080 41 5,214
At 1 July 2016 51 258 1,606 1,170 8 2,080 41 5,214
(Charged)/credited – to profit or loss 63 (30) (284) (676) 665 (267) (26) (253)
At 30 June 2017 114 228 1,322 494 673 1,813 15 4,659
Deferred tax liabilities2017
$’0002016
$’000
The balance comprises temporary differences attributable to:
Work in progress (1,331) (477)
Equity accounted investee – (24)
(1,331) (501)
Set-off of deferred tax liabilities pursuant to set-off provisions 1,331 501
Net deferred tax liabilities – –
NOTES TO THE FINANCIAL STATEMENTSFor the year ended 30 June 2017

39LogiCamms 2017 Annual Report
4 OPERATIONS – RESULTS FOR THE YEAR (CONTINUED)
(e) Taxation (continued)
Deferred tax liabilities (continued)
Movements
Equity accounted
investee $’000
Work in progress
$’000 Total
$’000
At 1 July 2015 (93) (1,249) (1,342)
(Charged)/credited – to profit or loss 69 772 841
At 30 June 2016 (24) (477) (501)
At 1 July 2016 (24) (477) (501)
(Charged)/credited – to profit or loss 24 (854) (830)
At 30 June 2017 – (1,331) (1,331)
Deferred tax is not recognised for the following temporary differences:
• Initial recognition of assets or liabilities in a transaction that is not a business combination and that affects neither accounting nor taxable profit;
• Differences relating to investments in subsidiaries and jointly controlled entities to the extent that it is probable that they will not reverse in the foreseeable future; and
• Initial recognition of goodwill.
At 30 June 2017 there were unrecognised and unused tax losses of $7.7 million.
Tax consolidation
The Company and its wholly-owned Australian resident entities are part of a Tax Consolidated Group (“TCG”). As a consequence, all members of the Tax Consolidated Group are taxed as a single entity. The head entity within the Tax Consolidated Group is LogiCamms Limited.
NOTES TO THE FINANCIAL STATEMENTSFor the year ended 30 June 2017

LogiCamms 2017 Annual Report40
4 OPERATIONS – RESULTS FOR THE YEAR (CONTINUED)
(f ) Earnings per share
Reconciliation of earnings used in calculating earnings per share2017
$’0002016
$’000
Loss for the year 23,615 38,139
WANOS(1) used to calculate basic EPS (Shares) 77,175 68,741
WANOS(1) used to calculate diluted EPS (Shares) 77,393 69,193
Basic EPS (cents per share) (30.6) (55.5)
Diluted EPS (cents per share) (30.6) (55.5)
(1) Weighted average number of ordinary shares
2017 $’000
2016 $’000
WANOS used to calculate basic EPS (Shares) 77,175 68,741
Effect of performance rights on issue 218 452
WANOS used to calculate diluted EPS (Shares) 77,393 69,193
There have been no transactions involving ordinary shares between the reporting date and the date of completion of these financial statements which would impact on the above EPS calculations.
Calculation of earnings per share
Basic earnings per share
Basic earnings per share is calculated as net profit attributable to members of the parent, adjusted to exclude any costs of servicing equity (other than dividends), divided by the weighted average number of ordinary shares, adjusted for any bonus elements.
Diluted earnings per share
Diluted earnings per share are calculated as net profit attributable to members of the parent, adjusted for: • Cost of servicing equity (other than dividends)
• Cost of servicing equity (other than dividends)
• the after-tax effect of dividends and interest associated with dilutive potential ordinary shares that have been recognised as expenses; and
• other non-discretionary changes in revenue or expenses during the year that would result from the dilution of potential ordinary shares divided by the weighted average number of ordinary shares and dilutive potential ordinary shares, adjusted for any bonus element.
(g) Segment reportingThe Group has a single reportable segment in which it operates, being engineering services. This is based on information that is internally provided to the Managing Director for assessing performance and making operating decisions. Therefore no additional disclosures in relation to the revenues, profit or loss, assets and liabilities and other material items have been made.
The Company is domiciled in Australia, with operations located across Australia and in New Zealand. Revenue and non-current assets are attributed to the above regions based on the revenue earned and non-current assets owned by the subsidiaries domiciled in each region and are as follows:
2017 $’000
2016 $’000
Revenue 69,406 93,230
Australia 11,657 14,957
New Zealand 81,063 108,187
NOTES TO THE FINANCIAL STATEMENTSFor the year ended 30 June 2017

41LogiCamms 2017 Annual Report
4 OPERATIONS – RESULTS FOR THE YEAR (CONTINUED)
(g) Segment reporting (continued)2017
$’0002016
$’000
Non-current assets excluding deferred tax assets
Australia 24,096 35,341
New Zealand 318 451
24,414 35,792
Revenue from one customer of the Group amounted to greater than 10% of the Group’s total revenues for the year ended 30 June 2017. This one customer in the Hydrocarbon sector amounts to $8.9 million (2016: One customer in the Minerals and Metals sector $19.4 million.)
(h) Auditors’ remunerationDuring the year the following fees were paid or payable for services provided by the auditor of the parent entity, its related practices and non-related audit firms:
2017 $
2016 $
Audit services
Audit of the Company’s Financial Report 200,000 185,000
200,000 185,000
Non-audit services
Other services – 14,280
– 14,280
Total remuneration of PriceWaterhouse Coopers 200,000 199,280
NOTES TO THE FINANCIAL STATEMENTSFor the year ended 30 June 2017

LogiCamms 2017 Annual Report42
5 OPERATIONS – OPERATING ASSETS AND LIABILITIES
(a) Cash and cash equivalentsCash balances reconcile to the amount of cash shown in the statement of cash flows at the end of the financial year.
The Group’s exposure to interest rate risk and a sensitivity analysis for financial assets and liabilities is disclosed in Note 8(b).
Reconciliation of cash flows from operating activities
Cash flows are included in the statement of cash flows on a gross basis. The GST components of cash flows arising from investing and financing activities which are recoverable from, or payable to, the ATO are classified as operating cash flows.
2017 $’000
2016 $’000
Cash flows from operating activities
Loss for the year (23,615) (38,139)
Adjustment for
Depreciation and amortisation 2,643 4,002
Impairment of goodwill 11,000 28,100
Equity settled share-based payments transactions 129 31
Net loss on sale of non-current assets 13 23
Equity accounted investee transactions 15 33
Reclassification of interest to investing (4) 70
Finance charge accruals 32 (22)
Income tax expense/(benefit) 2,015 (2,525)
Operating loss before changes in working capital and provisions (7,772) (8,427)
Change in trade and other receivables 1,688 2,557
Change in trade and other payables (3,696) (1,567)
Change in deferred income 1,561 (813)
Change in provisions and employee benefits (948) (70)
Net cash from operating activities (9,167) (8,320)
(b) Trade and other receivables2017
$’0002016
$’000
Current
Trade receivables 13,475 10,971
Provision for impairment of receivables (381) (170)
Project work in progress 4,607 9,369
Prepayments and sundry debtors 544 662
18,245 20,832
NOTES TO THE FINANCIAL STATEMENTSFor the year ended 30 June 2017

43LogiCamms 2017 Annual Report
5 OPERATIONS – OPERATING ASSETS AND LIABILITIES (CONTINUED)
(b) Trade and other receivables (continued)
Trade and other receivables
Trade and other receivables are recognised initially at fair value and subsequently at amortised cost using the effective interest method, less any impairment losses. At 30 June 2017 trade receivables include retentions of $0.02 million relating to contracts in progress (2016: $0.16 million). The Group’s exposure to credit risk and impairment losses related to Trade and other receivables (excluding project work in progress) are disclosed in Note 8(b)).
Project work in progress
Project work in progress represents the gross unbilled amount expected to be collected from customers for contract work performed to date. It is measured at cost plus profit recognised to date less progress billings and recognised losses. Cost includes all expenditure related directly to specific projects and an allocation of fixed and variable overheads incurred in the Group’s contract activities based on normal operating capacity. If payments received from customers exceed the income recognised, then the difference is presented as deferred income in the balance sheet.
(c) Trade and other payables2017
$’0002016
$’000
Current
Trade payables 3,117 3,775
GST payable 574 464
Accrued expenses 3,416 5,232
Lease incentives 469 –
(7,576) (9,471)
Non-Current
Contingent consideration – 300
Lease incentives 1,210 661
1,210 961
Trade and other payables are recognised initially at fair value less transaction costs and subsequently at amortised cost using the effective interest method.
The Group’s exposure to currency and liquidity risk related to Trade and other payables is disclosed in Note 8(b).
Receivables and payables are stated with the amount of GST included. The net amount of GST recoverable from, or payable to, the Australian Tax Office (“ATO”) is included as a current asset or liability in the statement of financial position.
(d) Deferred Income2017
$’0002016
$’000
Current
Revenue Received in Advance 79 681
Billings in advance 2,163 –
2,242 681
The Group’s policy in relation to deferred income is disclosed in Note 5(b).
NOTES TO THE FINANCIAL STATEMENTSFor the year ended 30 June 2017

LogiCamms 2017 Annual Report44
5 OPERATIONS – OPERATING ASSETS AND LIABILITIES (CONTINUED)
(e) Employee benefits2017 2016
Current $’000
Non-Current $’000
Total $’000
Current $’000
Non-Current $’000
Total $’000
Leave obligations 3,591 839 4,430 4,499 878 5,377
Annual leave, long service leave and time off in lieu
The liability for annual leave, long service leave and time off in lieu is measured as the present value of expected future payments (including on-costs) for the service provided by employees up to the reporting date. Expected future payments are discounted using the yield on high quality corporate bonds that have maturity dates approximating the terms of the Group’s obligations.
(f ) Provisions2017 2016
Current $’000
Non-Current $’000
Total $’000
Current $’000
Non-Current $’000
Total $’000
Onerous lease provision 1,375 1,788 3,163 1,983 3,069 5,052
Superannuation provision 1,011 – 1,011 841 – 841
Make good provision – 991 991 625 491 1,116
Service warranties 354 – 354 1,358 – 1,358
Restructuring costs 1,099 – 1,099 – – –
3,839 2,779 6,618 4,807 3,560 8,367
Movements in provisions
The movement in provisions for the period is shown below:
Restructuring obligations
$’000
Service warranties
$’000
Onerous lease $’000
Make good provision
$’000
Superannuation provision
$’000Total
$’000
Carrying amount at the start of the year – 1,358 5,052 1,116 841 8,367
Additional provisions recognised 1,099 – – 359 170 1,628
Derecognition of provision – – (668) – – (668)
Unwind of provision – (1,004) (1,221) (484) – (2,709)
Carrying amount at end of year 1,099 354 3,163 991 1,011 6,618
A provision is recognised if, as a result of a past event, the Group has a present legal or constructive obligation that can be estimated reliably and it is probable that an outflow of economic benefits will be required to settle the obligation. Provisions are determined by discounting the expected future cash flows at a pre-tax rate that reflects current market assessments of the time value of money and the risks specific to the liability.
Warranty
A provision for warranty is usually recognised at the commencement of a project based on risks identified during the planning stage. Projects are subsequently reviewed periodically to ensure provisions remain sufficient. A full reassesment is performed at each reporting date, taking into account historical warranty expenses and contract terms to ensure the provision is appropriate.
NOTES TO THE FINANCIAL STATEMENTSFor the year ended 30 June 2017

45LogiCamms 2017 Annual Report
5 OPERATIONS – OPERATING ASSETS AND LIABILITIES (CONTINUED)
(f ) Provisions (continued)
Onerous leases
A provision for onerous leases is recognised when the expected benefits (expected lease inflows) to be derived by the Group from a lease are lower than the unavoidable cost of meeting its obligations under the lease. The provision is measured at the present value of the lower of the expected cost of terminating the lease and the expected net cost of continuing the lease. Before a provision is established, the Group recognises any impairment loss on the assets associated with the lease.
Following successful negotiations to exit the lease for the Group’s former Brisbane head office, an amount of $0.7 million was derecognised and is presented separately on the income statement for the year ended 30 June 2017.
Superannuation provision
The Group has recognised a provision for superannuation amounts potentially owing to certain contractors falling in the SGA Act’s expanded definition of employees. The provision is measured at the expected cost of settling the liability.
Make good provision
A make good obligation is recognised when the Group has a present legal or constructive obligation as a result of a past event, it is probable that an outflow of resources will be required to settle the obligation and the amount can be reliability estimated. The provisions are calculated on a $/sqm basis and are reviewed for appropriateness periodically.
Restructure provision
A provision has been recognised for the value of termination payments to be paid to staff that were notified prior to 30 June 2017 that their role was redundant but that had not yet left the business at the balance sheet date. The provision is expected to be fully settled within the next three months.
(g) Borrowings2017 2016
Current $’000
Non-Current $’000
Total $’000
Current $’000
Non-Current $’000
Total $’000
Secured
Bank loans 4,000 – 4,000 – – –
Total secured borrowings 4,000 – 4,000 – – –
(i) Secured liabilities and assets pledged as security
Bank loans represent amounts borrowed under the Group’s multi-option working capital facility with NAB. The loan is in the form of a 90 day market rate loan and is rolled over each 90 days. The carrying amount of the bank loans is a reasonable approximation of their fair value.
The facility is secured by a fixed and floating charge over the Group’s assets. Covenants imposed by the bank require the Group’s quarterly EBITDA to fall within 85% of the forecast EBITDA provided to the bank as part of the annual renewal process. During the year, the Group breached this covenant in the March 2017 quarter and forecast that it would breach the covenant in the June 2017 quarter. The Group obtained a waiver from the bank for these breaches.
During the year the Group renewed its facilities with NAB, extending the expiry date of the facility to 31 March 2018. The Group also obtained a temporary limit increase of $3.0 million to fund working capital and the restructure undertaken in June and July 2017. Details of the amount utilised and available at the reporting date are set out below:
Facility Limit at 30 June 2017 Amount Used Amount available
NAB Multi-Option Facility (allocated to working capital loans)
$5.0 million (including $3.0 million
temporary increase)
$4.0 million $1.0 million
NOTES TO THE FINANCIAL STATEMENTSFor the year ended 30 June 2017

LogiCamms 2017 Annual Report46
5 OPERATIONS – OPERATING ASSETS AND LIABILITIES (CONTINUED)
(g) Borrowings (continued)
(i) Secured liabilities and assets pledged as security (continued)
Subsequent to the end of the financial year, the NAB Multi-Option facility was amended, with the limit formally increased from $7.0 million to $11.0 million (split $7.9 million working capital and $3.1 million bank guarantee facility at time of extension) and the expiry date extended until 31 August 2018. The amended facility also includes a Finance Charges Cover Ratio covenant, whereby the Group’s EBITDA, adjusted for onerous lease payments and any finance lease charges, must exceed interest expenses by a ratio of 2:1.
(ii) Bank guarantees and contract performance bonds
The Group utilises bank guarantees and contract performance bonds as security for its obligations under premises leases and to guarantee its performance and warranty obligations under certain construction, procurement and engineering services contracts. The following facilities were in place at 30 June 2017:
Facility Limit at 30 June 2017 Amount Used Amount available
NAB Multi-Option Facility (allocated to bank guarantees)
$5.0 million $4.8 million $0.2 million
SwissRe AssetInsure contract bond facility $7.5 million $0.4 million $7.1 million
Total $12.5 million $5.2 million $7.3 million
(iii) Other facilities
As at 30 June 2017 the Group also had a credit card facility with a limit of $0.35 million (repaid monthly) and an asset finance facility with a limit of $0.5 million (currently undrawn).
6 NON-OPERATING ASSETS
(a) Property, plant and equipmentPlant and
equipment $’000
Motor vehicles
$’000
Building fit outs
$’000 Total
$’000
At 1 July 2015
Cost 3,444 199 3,476 7,119
Accumulated depreciation (1,979) (114) (873) (2,966)
Net book amount 1,465 85 2,603 4,153
Year ended 30 June 2016
Opening net book amount 1,465 85 2,603 4,153
Additions 120 – 175 295
Acquisition of subsidiary 9 – – 9
Disposals (25) – – (25)
Depreciation charge (477) (46) (2,020) (2,543)
Transfers (192) – 192 –
Exchange differences (11) 5 (32) (38)
Closing net book amount 889 44 918 1,851
NOTES TO THE FINANCIAL STATEMENTSFor the year ended 30 June 2017

47LogiCamms 2017 Annual Report
6 NON-OPERATING ASSETS (CONTINUED)
(a) Property, plant and equipment (continued)Plant and
equipment $’000
Motor vehicles
$’000
Building fit outs
$’000 Total
$’000
At 30 June 2016
Cost 2,537 286 3,429 6,252
Accumulated depreciation (1,648) (242) (2,511) (4,401)
Net book amount 889 44 918 1,851
Year ended 30 June 2017
Opening net book amount 889 44 918 1,851
Additions 378 – 2,141 2,519
Disposals (14) (4) (433) (451)
Depreciation charge (315) (36) (748) (1,099)
Transfers 56 – – 56
Exchange differences 2 (1) – 1
Closing net book amount 996 3 1,878 2,877
At 30 June 2017
Cost 3,325 263 4,087 7,675
Accumulated depreciation (2,329) (260) (2,209) (4,798)
Net book amount 996 3 1,878 2,877
Recognition and measurement
Items of property, plant and equipment are measured at cost less accumulated depreciation. Cost includes expenditure that is directly attributable to the acquisition of the asset. Purchased software that is integral to the functionality of the related equipment is capitalised as part of that equipment.
When parts of an item of property, plant and equipment have different useful lives, they are accounted for as separate items (major components) of property, plant and equipment. Any gain or loss from derecognising the assets (the difference between the proceeds of disposal and the carrying amount of the asset) is included in “Other income” in the period the asset is recognised.
Depreciation
Depreciation is recognised in profit or loss on a straight-line basis over the estimated useful lives of each part of an item of property, plant and equipment. Leased assets are depreciated over the shorter of the lease term and their useful lives unless it is reasonably certain that the Group will obtain ownership by the end of the lease term. Land is not depreciated. Depreciation methods, useful lives and residual values are reviewed at each reporting date.
The estimated useful lives for the current and comparative periods are as follows:
• Plant and equipment 3 – 10 years
• Building fit out costs 4 – 7 years
• Motor vehicles 4 – 5 years
Leased assets
Leases for which the Group assumes substantially all the risks and rewards of ownership are classified as finance leases. Upon initial recognition the leased asset is measured at an amount equal to the lower of its fair value and the present value of the minimum lease payments. Subsequent to initial recognition, the asset is accounted for in accordance with the accounting policy applicable to that asset. Other leases are operating leases and the leased assets are not recognised on the Group’s consolidated statement of financial position.
NOTES TO THE FINANCIAL STATEMENTSFor the year ended 30 June 2017
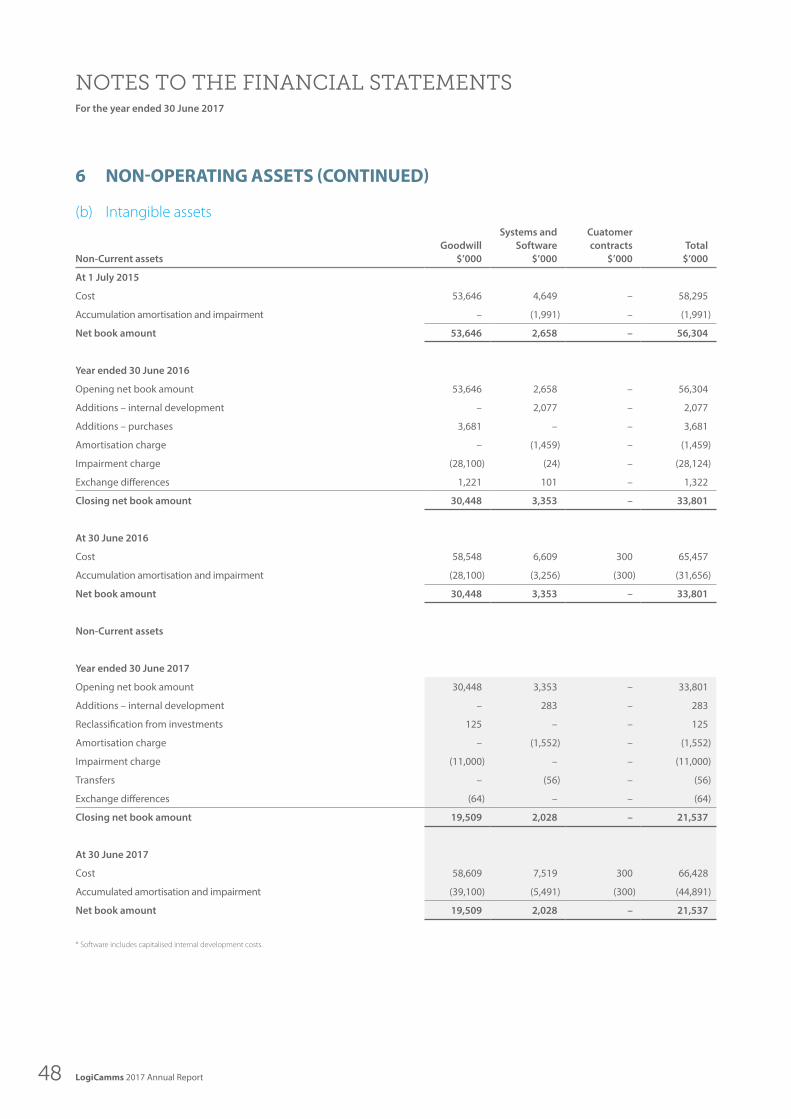
LogiCamms 2017 Annual Report48
6 NON-OPERATING ASSETS (CONTINUED)
(b) Intangible assets
Non-Current assetsGoodwill
$’000
Systems and Software
$’000
Cuatomer contracts
$’000 Total
$’000
At 1 July 2015
Cost 53,646 4,649 – 58,295
Accumulation amortisation and impairment – (1,991) – (1,991)
Net book amount 53,646 2,658 – 56,304
Year ended 30 June 2016
Opening net book amount 53,646 2,658 – 56,304
Additions – internal development – 2,077 – 2,077
Additions – purchases 3,681 – – 3,681
Amortisation charge – (1,459) – (1,459)
Impairment charge (28,100) (24) – (28,124)
Exchange differences 1,221 101 – 1,322
Closing net book amount 30,448 3,353 – 33,801
At 30 June 2016
Cost 58,548 6,609 300 65,457
Accumulation amortisation and impairment (28,100) (3,256) (300) (31,656)
Net book amount 30,448 3,353 – 33,801
Non-Current assets
Year ended 30 June 2017
Opening net book amount 30,448 3,353 – 33,801
Additions – internal development – 283 – 283
Reclassification from investments 125 – – 125
Amortisation charge – (1,552) – (1,552)
Impairment charge (11,000) – – (11,000)
Transfers – (56) – (56)
Exchange differences (64) – – (64)
Closing net book amount 19,509 2,028 – 21,537
At 30 June 2017
Cost 58,609 7,519 300 66,428
Accumulated amortisation and impairment (39,100) (5,491) (300) (44,891)
Net book amount 19,509 2,028 – 21,537
* Software includes capitalised internal development costs.
NOTES TO THE FINANCIAL STATEMENTSFor the year ended 30 June 2017

49LogiCamms 2017 Annual Report
6 NON-OPERATING ASSETS (CONTINUED)
(b) Intangible assets (continued)
Goodwill
Goodwill that is acquired in a business combination is initially measured at cost. Goodwill is measured at the cost of the acquisition less the net fair value of the identifiable assets, liabilities and contingent liabilities. Following initial recognition, goodwill is measured at cost less accumulated impairment losses. In respect of equity accounted investees, the carrying amount of goodwill is included in the carrying amount of the investment.
Software and Systems
Capitalised software expenditure is initially recognised at cost. The expenditure capitalised includes the direct labour and overhead costs that are directly attributable to preparing the asset for its intended use. Following initial recognition, software and systems are carried at cost less amortisation and any impairment losses. Amortisation is recognised in the profit or loss on a straight-line basis over the estimated useful lives of intangible assets, other than goodwill, from the date that they are available for use. The estimated useful life applied is usually 4 years.
7 CAPITAL AND RESERVES
(a) Share capital and reserves
Share Capital
2017 $’000
2016 $’000
Number of ordinary shares $’000
On issue at 1 July 69,430 69,117
Capital raising 12,310 –
Exercise of performance rights – 313
On issue at 30 June – fully paid 81,740 69,430
Ordinary shares are classified as equity. Incremental costs directly attributable to the issue of ordinary shares and share options are recognised as a deduction from equity, net of any tax effects.
The Company does not have authorised capital or par value in respect of its issued shares. The holders of ordinary shares are entitled to receive dividends as declared from time to time and are entitled to one vote per share at meetings of the Company. All shares rank equally with regard to the Company’s residual assets.
Where share capital recognised as equity is repurchased, the amount of consideration paid, which includes directly attributable costs, net of any tax effects, is recognised as a deduction from equity.
As at 30 June 2017, 91,981 (2016: 362,594) treasury shares were included in the consolidated statements of financial position. These shares will be held by the Employee Share Trusts to meet future obligations to employees under the incentive plans upon vesting of granted Performance and Share Appreciation Rights (refer Remuneration Report).
Dividends
Dividends are recognised as a liability in the period in which they are declared.
No dividends were declared or paid during the financial year to 30 June 2017.
Declared and paid during the period
2017 $’000
2016 $’000
Final dividend for the year ended 30 June 2015 of 3.5 cents per fully paid share 50% franked
Final dividend – 2,410
NOTES TO THE FINANCIAL STATEMENTSFor the year ended 30 June 2017

LogiCamms 2017 Annual Report50
7 CAPITAL AND RESERVES (CONTINUED)
(a) Share capital and reserves (continued)
Franking credits
2017 $’000
2016 $’000
Franking credits available for subsequent reporting periods based on a tax rate of 30.0% (2016 – 30.0%)
– (189)
The above amounts are calculated from the balance of the franking account as at the end of the reporting period, adjusted for franking credits and debits that will arise from the settlement of liabilities or receivables for income tax and dividends after the end of the year.
8 RISK
(a) Financial instruments
Non-derivative financial instruments
Non-derivative financial instruments comprise investments in equity securities, trade and other receivables, cash and cash equivalents, and trade and other payables.
Non-derivative financial instruments are recognised initially at fair value plus, for instruments not at fair value through profit or loss, any directly attributable transaction costs. Subsequent to initial recognition non-derivative financial instruments are measured as described below.
A financial instrument is recognised if the Group becomes a party to the contractual provisions of the instrument. Financial assets are derecognised if the Group’s contractual rights to the cash flows from the financial assets expire or if the Group transfers the financial asset to another party without retaining control or substantially all risks and rewards of the asset. Regular way purchases and sales of financial assets are accounted for at trade date, i.e., the date that the Group commits itself to purchase or sale of the asset. Financial liabilities are derecognised if the Group’s obligations specified in the contract expire or are discharged or cancelled.
Cash and cash equivalents comprise cash balances and term deposits.
Other non-derivative financial instruments are measured at amortised cost using the effective interest method, less any impairment losses.
(b) Financial risk management
Overview
The Group has exposure to the following risks from its use of financial instruments:
• Credit risk
• Liquidity risk
• Market risk
This note presents information about the Group’s exposure to each of the above risks, their objectives, policies and processes for measuring and managing risk, and the management of capital.
Risk management framework
To discharge their obligation to establish and exercise oversight of the Group’s risk management framework the Board of Directors have delegated to the Audit and Risk Committee the responsibility to exercise oversight of how management monitors and reviews the adequacy of the risk management framework.
The Group’s risk management policies are established to identify and analyse the risks faced by the Group, to set appropriate risk limits and controls, and to monitor risks and adherence to limits. Risk management policies and systems are reviewed regularly to reflect changes in market conditions and the Group’s activities.
Credit risk
Credit risk is the risk of financial loss to the Group if a contracting entity fails to meet its obligations under a financial instrument or customer contract that will result in a financial loss to the Group. The Group is exposed to credit risk from its operating activities (principally from customer receivables and financial guarantees granted to customers) and financing activities including deposits with financial institutions.
NOTES TO THE FINANCIAL STATEMENTSFor the year ended 30 June 2017

51LogiCamms 2017 Annual Report
8 RISK (CONTINUED)
(b) Financial risk management (continued)
Exposure to credit risk
The carrying amount of the Group’s financial assets represents the maximum credit exposure. The Group’s maximum exposure to credit risk at the end of the reporting period was:
2017 $’000
2016 $’000
Trade receivables (net of provision for impairment) 13,094 10,801
Sundry debtors and prepayments 544 662
Project work in progress 4,607 9,369
18,245 20,832
Cash and cash equivalents 4,983 6,637
23,228 27,469
Credit risks related to trade receivables
The Group trades with recognised, creditworthy third parties such as government bodies, large contracting companies or customers whom the Group has established trading history with. Customer credit risk is managed based on established policies, procedures and controls relating to customer credit risk management. This includes:
• for new customers – performing a creditworthiness assessment before credit terms are allowed and including the performance of credit checks if required
• prior to signing a large contract – credit worthiness is assessed as part of the process of submitting the bid and negotiating terms and conditions
• purchase limits – outside special terms required for large contracts, credit limits are established for each customer
Customers that fail to meet the Group’s benchmark creditworthiness may transact only on a prepayment basis.
In addition, the recoverability of receivable balances are regularly monitored as part of the monthly commercial and performance reviews of each major project by senior management to ensure that the trade receivables and the carrying value of each project’s work in progress is recoverable. In extreme cases, the Group may consider ceasing work until any aged outstanding receivables or disputed amounts are paid or resolved.
The Group has established an allowance for impairment that represents its estimate of incurred losses in respect of trade and other receivables.
The maximum exposure to credit risk for trade and other receivables (excluding provision for doubtful debts) by geographic region is as follows.
2017 $’000
2016 $’000
Australia 11,989 8,519
New Zealand 1,330 1,594
Other regions 156 857
13,475 10,970
Details of the Group’s most significant customer receivable balances at 30 June 2017 are shown in the following table. The most significant single customer at 30 June 2017 is a large, Australian based company in the hydrocarbon sector.
Non-Current assets
Carrying amount
2017 $’000
% of trade receivables
2017
Carrying amount
2016 $’000
% of trade receivables
2016
Most significant single customer 1,611 12% 1,291 13%
Top ten most significant customers 7,455 55% 6,058 60%
NOTES TO THE FINANCIAL STATEMENTSFor the year ended 30 June 2017

LogiCamms 2017 Annual Report52
8 RISK (CONTINUED)
(b) Financial risk management (continued)
Impairment losses
The aging of the Group’s Trade receivables at the reporting date was:
Non-Current assets2017
$’0002016
$’000
Not past due 11,378 5,140
Past due 0–30 days 1,474 3,623
Past due 31–120 days 35 1,886
Past due 121 days to one year 462 158
More than one year 102 2
Retentions 24 162
13,475 10,971
The movement in the allowance for impairment in respect of trade receivables during the year was as follows:
2017 $’000
2016 $’000
Balance at start of year 170 487
Recoveries of previous year impairments (54) (75)
Impairment losses recognised 265 130
Amounts written off as non-recoverable – (372)
Balance at 30 June 381 170
The impairment loss at 30 June 2017 relates to specific invoices that the Group considers are at risk of being recovered. The allowance account in respect of trade receivables is used to record impairment losses unless the Group is satisfied that no recovery of the amount owing is possible. At that point the amount is considered irrecoverable and is written off against the financial asset directly. The Group will continue to strongly pursue all debts provided for.
Credit risks related to financial instruments and cash deposits
Credit risk from balances with banks and financial institutions is managed by the Group’s Finance team. Investments of surplus funds are made with the Group’s bankers who have a credit rating by Standard & Poor’s rating agency of AA- or higher.
Liquidity risk
Liquidity risk is the risk that the Group will not be able to meet its financial obligations as they fall due.
The Group manages this risk by ensuring, as far as possible, that it always has sufficient liquidity to meet its liabilities when due, under both normal and stressed conditions. The Group ensures that it has sufficient cash available on demand to meet expected operational commitments in the short term including the servicing of financial obligations. The Group regularly forecasts cash flows to assess future liquidity requirements with sufficient time to hold discussions with the Group’s bankers, if such discussions are required.
NOTES TO THE FINANCIAL STATEMENTSFor the year ended 30 June 2017
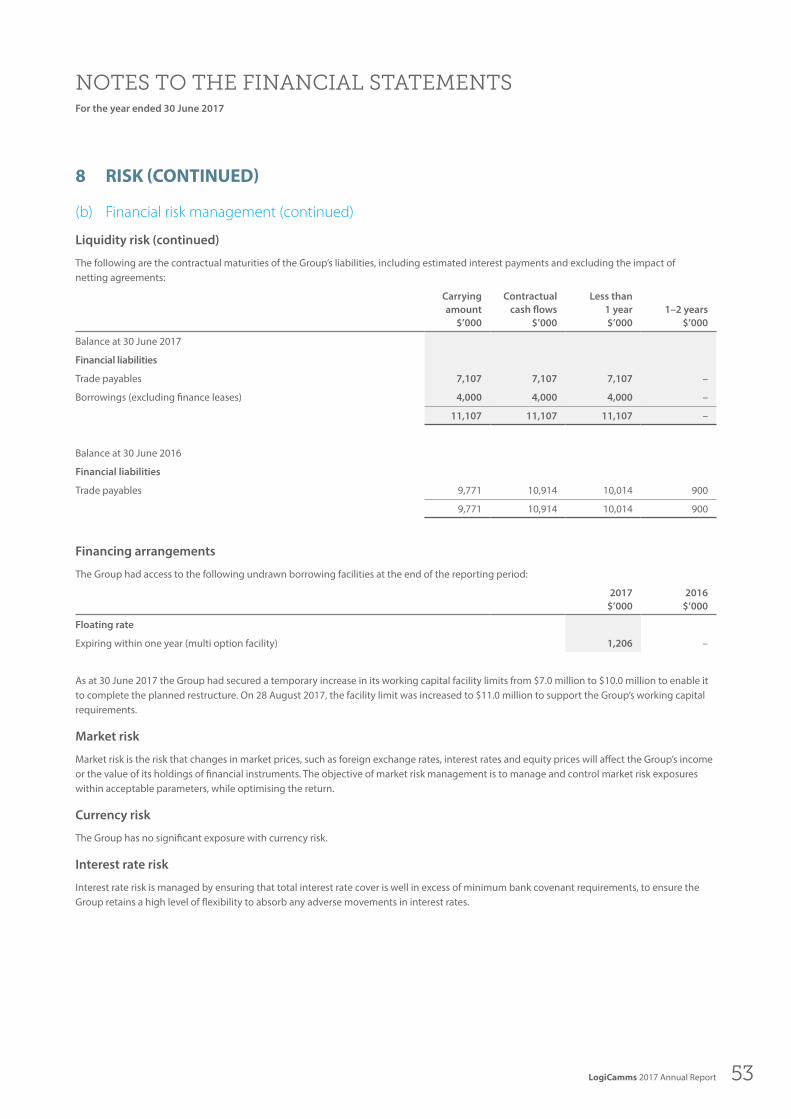
53LogiCamms 2017 Annual Report
8 RISK (CONTINUED)
(b) Financial risk management (continued)
Liquidity risk (continued)
The following are the contractual maturities of the Group’s liabilities, including estimated interest payments and excluding the impact of netting agreements:
Carrying amount
$’000
Contractual cash flows
$’000
Less than 1 year $’000
1–2 years $’000
Balance at 30 June 2017
Financial liabilities
Trade payables 7,107 7,107 7,107 –
Borrowings (excluding finance leases) 4,000 4,000 4,000 –
11,107 11,107 11,107 –
Balance at 30 June 2016
Financial liabilities
Trade payables 9,771 10,914 10,014 900
9,771 10,914 10,014 900
Financing arrangements
The Group had access to the following undrawn borrowing facilities at the end of the reporting period:
2017 $’000
2016 $’000
Floating rate
Expiring within one year (multi option facility) 1,206 –
As at 30 June 2017 the Group had secured a temporary increase in its working capital facility limits from $7.0 million to $10.0 million to enable it to complete the planned restructure. On 28 August 2017, the facility limit was increased to $11.0 million to support the Group’s working capital requirements.
Market risk
Market risk is the risk that changes in market prices, such as foreign exchange rates, interest rates and equity prices will affect the Group’s income or the value of its holdings of financial instruments. The objective of market risk management is to manage and control market risk exposures within acceptable parameters, while optimising the return.
Currency risk
The Group has no significant exposure with currency risk.
Interest rate risk
Interest rate risk is managed by ensuring that total interest rate cover is well in excess of minimum bank covenant requirements, to ensure the Group retains a high level of flexibility to absorb any adverse movements in interest rates.
NOTES TO THE FINANCIAL STATEMENTSFor the year ended 30 June 2017

LogiCamms 2017 Annual Report54
8 RISK (CONTINUED)
(b) Financial risk management (continued)
Profile
At reporting date the interest rate profile of the Group’s interest-bearing financial instruments was:
Carrying amount
2017 $’000
2016 $’000
Variable rate instruments
Financial assets 4,983 6,600
Financial liabilities (4,000) –
983 6,600
Cash flow sensitivity analysis for variable rate instruments
A change of 200 basis points in interest rates would have increased (decreased) equity and profit by the amounts shown below. A sensitivity of 2% (2016: 2%) has been selected as this is considered reasonably possible. The Directors cannot nor do not seek to predict movements in interest rates. These sensitivities are shown for illustrative purposes only.
2017 $’000
2016 $’000
Effect on profit before tax increase/(decrease)
If interest rates were 2% higher (2016: 2%) 20 243
If interest rates were 2% lower (2016: 2%) (20) (243)
Effect on profit after tax increase/(decrease)
If interest rates were 2% higher (2016: 2%) 14 170
If interest rates were 2% lower (2016: 2%) (14) (170)
Effect on shareholders' equity increase/(decrease)
If interest rates were 2% higher (2016: 2%) 14 170
If interest rates were 2% lower (2016: 2%) (14) (170)
Fair value versus carrying amounts
The fair values and carrying amounts of financial assets and liabilities shown in the balance sheet were not materially different at 30 June 2017 due to the short term nature of these financial assets and liabilities.
The Group has no financial instruments carried at fair value and therefore has not disclosed the fair value hierarchy.
Capital management
The Board’s policy is to maintain a strong capital base so as to maintain investor, creditor and market confidence and to sustain future development of the business. The Board of Directors monitors the return on capital, which the Group defines as net operating income divided by total shareholders’ equity. The Board of Directors also monitors the level of dividends to ordinary shareholders.
The Company will aim to provide a balance between share price / capital growth and income in the form of dividends. The ultimate dividend paid will be determined by the board after consideration of general business and financial conditions, working capital requirements, taxation position, and future capital expenditure requirements.
As at the balance date the Group had a multi-option working capital and bank guarantee facility of $10.0 million (refer to Note 5(g) for details of this facility). Subsequent to the end of the financial year the limit of this facility was increased to $11.0 million. The Group monitors its working capital position on a monthly basis and forecasts its cash flows on a weekly basis to ensure that adequate levels of liquidity are maintained at all times.
The Group also had in place a performance bond facility with SwissRe of $7.5 million and an equipment lease facility with NAB of $0.5 million (currently unutilised).
NOTES TO THE FINANCIAL STATEMENTSFor the year ended 30 June 2017

55LogiCamms 2017 Annual Report
8 RISK (CONTINUED)
(c) Impairment
Financial assets
A financial asset is assessed at each reporting date to determine whether there is any objective evidence that it is impaired. A financial asset is considered to be impaired if objective evidence indicates that one or more events have had a negative effect on the estimated future cash flows of that asset.
An impairment loss in respect of a financial asset measured at amortised cost is calculated as the difference between its carrying amount, and the present value of the estimated future cash flows discounted at the original effective interest rate. An impairment loss in respect of an available-for-sale financial asset is calculated by reference to its fair value.
Individually significant financial assets are tested for impairment on an individual basis. The remaining financial assets are assessed collectively in groups that share similar credit risk characteristics.
All impairment losses are recognised in profit or loss.
Non-financial assets
Testing for impairment
The Group tests non-financial assets for impairment:
• At least annually for indefinite life intangible assets and goodwill; and
• Where there is an indication that the asset may be impaired (which is assessed at least each reporting period); or
• Where there is an indication that previously recognised impairment (on assets other than goodwill) may have changed.
If any such indication exists then the asset’s recoverable amount is estimated, being the greater of its value in use and its fair value less costs to sell.
For the purpose of impairment testing, assets are grouped together into the smallest group of assets that generates cash inflows from continuing use that are largely independent of the cash inflows of other assets or groups of assets (the “cash-generating unit”). The Group considers that it has one cash generating unit for the purpose of impairment testing of goodwill.
Inputs to impairment calculations
The Value In Use calculation uses cash flow projections based on the Group’s corporate plans and business forecasts prepared by management and approved by the Board. The corporate plans are developed annually and on the understanding that actual outcomes may differ from the assumptions used. For these calculations, adjustments are incorporated for the relevant industry metrics. In the circumstances that the Cash Generating Unit (“CGU”) is unable to achieve the forecast growth in earnings, there is a risk that the carrying value of the CGU would exceed its recoverable amount.
Cash flow projections over the five year period, which are based on Group estimates, take into consideration historical performance as well as expected long term operating conditions. Growth rates do not materially exceed the consensus forecasts of the long term average growth rate for the market sector in which the CGU operates.
The pre-tax discount rates are based on the weighted average cost of capital determined by prevailing or benchmarked market inputs, risk adjusted where necessary, and other assumptions are determined with reference to external sources of information. Consistent, conservative estimates for variables such as terminal cash flow multiples are used. Increases in discount rates or changes in other key assumptions, such as operating conditions or financial performance, may cause the recoverable amounts to fall below carrying values.
EBITDA and projected margins are based on actual performance in prior years adjusted for expected efficiency improvements and cost reductions as a result of the recent business restructure.
Impairment charge
The Group has conducted an assessment of the carrying value of its net assets and has determined that it is appropriate to recognise an impairment to goodwill of $11.0m, reducing the goodwill balance to $19.5m (2016: $30.4m).
There were a number of factors that indicated an impairment of goodwill as at 30 June 2017, including:
• Financial performance across the business in the six months to 30 June 2017 was lower than expected
• Slow recovery of key commodities markets in the six months to 30 June 2017 have continued to impact on client capital and operating expenditure
• The requirement for the Group to implement a program of restructure to reduce overhead and operational costs during March and June 2017.
• The Company’s market capitalisation was significantly below the level of its net assets.
NOTES TO THE FINANCIAL STATEMENTSFor the year ended 30 June 2017

LogiCamms 2017 Annual Report56
8 RISK (CONTINUED)
(c) Impairment (continued)
Non-financial assets (continued)
Impairment calculations
Assets are impaired if their carrying value exceeds their recoverable amount. The recoverable amount of an asset or CGU is determined as the higher of its fair value less costs of disposal or Value In Use.
The recoverable amount of the goodwill is based on a Value In Use calculation with respect to the CGU and was determined by applying a five year net present value calculation of projected cash flows and a terminal value at the end of the fifth year. The calculation of Value In Use was determined having regard to the following key assumptions:
• A pre-tax discount rate applied to cash flows of 16.90% (2016: 19.29%)
• Expected future profits for the first year based on internal financial forecasts
• Cost savings from the recent business restructures
• Future nominal revenue growth of 15% for year two, 12% year three and 10% years four and five. (2016: 4% per year for years three to four and 8% for year five)
• After the fifth year a terminal value was applied using a growth rate of 2.5% (2016: 2.5%)
The recoverable value of the CGU is particularly sensitive to changes in the level of EBITDA over the 5 year forecast period, and the forecast long-term EBITDA that drives terminal value. As the goodwill for the LogiCamms CGU is carried at its Value In Use assessment, any variation to the key assumptions used to determine Value In Use, may result in an impairment of goodwill.
Sensitivity to changes in assumptions
Management recognises that there are various reasons the estimates used in these assumptions may vary. There are possible changes in key assumptions that could cause the carrying value of the CGU to exceed its recoverable amount.
NOTES TO THE FINANCIAL STATEMENTSFor the year ended 30 June 2017

57LogiCamms 2017 Annual Report
9 CORPORATE AND GROUP
(a) Group entities
Parent and ultimate controlling entity
The Group’s principal subsidiaries at 30 June 2017 are set out below. Unless otherwise stated, they have share capital consisting solely of ordinary shares that are held directly by the Group, and the proportion of ownership interests held equals the voting rights held by the Group. The country of incorporation or registration is also their principal place of business.
Country of incorporation Ownership Interest
2017 %
2016 %
LogiCamms Holdings Pty Ltd Australia 100 100
LogiCamms (WA) Pty Ltd Australia 100 100
LogiCamms Consultants Trust Australia 100 100
LogiCamms (PNG) Pty Ltd Australia 100 100
Competency Training Pty Ltd Australia 100 100
LogiCamms Australia Pty Ltd Australia 100 100
LogiCamms (CGH) Pty Ltd Australia 100 100
LogiCamms (Central) Pty Ltd Australia 100 100
LogiCamms Shared Services Pty Ltd Australia 100 100
LogiCamms Consulting Pty Ltd Australia 100 100
Petromod Pty Ltd Australia 100 100
LogiCamms New Zealand Limited (formerly Independent Technology Limited) New Zealand 100 100
Independent Technology Holdings Limited New Zealand 100 100
ITL Engineering New Zealand Limited New Zealand 100 100
ITL Limited New Zealand 100 100
ITL Engineering Australia Pty Ltd New Zealand 100 100
Subsidiaries are all entities over which the Group has control. The Group controls an entity when the Group is exposed to, or has rights to, variable returns from its involvement with the entity and has the ability to affect those returns through its power to direct the activities of the entity. Subsidiaries are fully consolidated from the date on which control is transferred to the Group and are deconsolidated from the date that control ceases.
NOTES TO THE FINANCIAL STATEMENTSFor the year ended 30 June 2017

LogiCamms 2017 Annual Report58
9 CORPORATE AND GROUP (CONTINUED)
(a) Group entities (continued)
Parent entity disclosures
Result of the parent entity
(Loss)/Profit and comprehensive income for the year (24,165) (30,245)
Financial position of parent entity at year end
Current assets 6,134 8,746
Total assets 50,126 63,768
Current liabilities 7,231 5,426
Total liabilities 12,282 6,808
Net assets 37,844 56,960
Total equity of the parent entity comprising of
Share capital 68,943 64,462
Reserves 2,371 2,092
Accumulated losses (33,470) (9,594)
37,844 56,960
Parent entity contingencies
2017 $’000
2016 $’000
GST liabilities of other entities within the GST Group – 475
Tax (assets)/liabilities of other entities within the Tax Consolidated Group (3,850) (809)
(b) Equity accounted investees (joint venture)The Group’s share of profits in its equity accounted investee, the LogiCamms-Electro 80 joint venture, for the year is set out below in the summary financial information.
Country of incorporation Ownership
nNme of entity2017
%2016
%
LogiCamms-Electro 80 joint venture Australia 50 50
NOTES TO THE FINANCIAL STATEMENTSFor the year ended 30 June 2017

59LogiCamms 2017 Annual Report
9 CORPORATE AND GROUP (CONTINUED)
(b) Equity accounted investees (joint venture) (continued)
LogiCamms-Electro 80 joint venture
30 June 2017 $’000
30 June 2016 $’000
Current assets 1 31
Non-current assets – –
Total assets 1 31
Current liabilities – 2
Non-current liabilities – –
Total liabilities – 2
Net assets 1 29
Group's share of net assets – 15
Revenues 2 64
Expenses (7) (130)
Loss (5) (66)
Group's share of loss at 50% (3) (33)
This equity accounted investee effectively ceased trading in the prior financial year with minimal wind up costs being accounted for in the 2017 financial year. As such, during the year the Group revalued its investment in the LogiCamms-Electro 80 JV to reflect the current trading position of the equity accounted investee. The Group received no dividends and returns of capital (2016: $0.2 million) during the period.
Interests in joint ventures are accounted for using the equity method. Under the equity method of accounting, the investments are initially recognised at cost and adjusted thereafter to recognise the Group’s share of the post-acquisition profits or losses of the investee in profit or loss, and the Group’s share of movements in other comprehensive income of the investee in other comprehensive income. Dividends received or receivable from associates and joint ventures are recognised as a reduction in the carrying amount of the investment.
When the Group’s share of losses in an equity-accounted investment equals or exceeds its interest in the entity, including any other unsecured long-term receivables, the Group does not recognise further losses, unless it has incurred obligations or made payments on behalf of the other entity.
Unrealised gains on transactions between the Group and its associates and joint ventures are eliminated to the extent of the Group’s interest in these entities. Unrealised losses are also eliminated unless the transaction provides evidence of an impairment of the asset transferred. Accounting policies of equity accounted investees have been changed where necessary to ensure consistency with the policies adopted by the Group.
(c) AcquisitionsOn 8 July 2015, the Group acquired 100% of a business called Petromod Pty Ltd (“Petromod”) for $4.0 million. The consideration paid was comprised of $2.2 million cash and the accrual of a profit earn out of $1.8 million.
The Group has subsequently considered reasonable sensitivities in relation to the achievement of the performance targets and, based on those sensitivities, a reduction of $1.5 million at 30 June 2016 was made to deferred consideration payable to Petromod. Following review of performance during 2017, the Group decided that achievement of the performance targets would not be met, and the remaining deferred consideration of $0.3 million has now been released to profit.
NOTES TO THE FINANCIAL STATEMENTSFor the year ended 30 June 2017

LogiCamms 2017 Annual Report60
9 CORPORATE AND GROUP (CONTINUED)
(d) Related parties
Key management Personnel compensation
The Key Management Personnel compensation included in ‘Personnel expenses’ (see Note 4(d)) is as follows:
2017 $
2016 $
Short-term employee benefits 1,713,809 2,023,963
Post-employment benefits 114,506 135,170
Non-monetary benefits 19,210 –
Share-based payments 104,779 292,014
Termination benefits 260,192 166,460
2,212,496 2,617,607
Individual Directors and executives compensation disclosures
Information regarding individual Directors’ and executives’ compensation and some equity instruments disclosures as required by Corporations Regulations 2M.3.03 are provided in the Remuneration Report section of the Directors’ Report. Apart from the details disclosed in this note, no Director has entered into a material contract with the Group since the end of the previous financial year and there were no material contracts involving Directors’ interests existing at year-end.
Key Management Personnel and their related parties
No loans were made to Key Management Personnel and their related parties during the year. The Group has not advanced loans to key management persons or their related parties.
456,411 ordinary shares were provided to Key Management Personnel during the reporting period upon exercise of rights granted as compensation in prior periods (2016: 396,464).
The movement during the reporting year in the number of ordinary shares in the Company held, directly, indirectly or beneficially, by Key Management Personnel is detailed in the Remuneration Report.
The terms and conditions of these transactions with management persons and their related parties were no more favourable than those available, or which might reasonably be expected to be available, on similar transactions to non-director related entities on an arm’s length basis.
Non-Key Management Personnel disclosures
There were no transactions with non-Key Management Personnel during the year that require disclosure.
Acquisition of shares from related parties
There were no acquisitions of shares from related parties in the 2017 financial year.
Subsidiaries
There is a related party relationship between the parent, LogiCamms Limited, and each of its subsidiaries listed in Note 9(a).
NOTES TO THE FINANCIAL STATEMENTSFor the year ended 30 June 2017

61LogiCamms 2017 Annual Report
10 SHARE-BASED PAYMENTSTwo separate tranches of performance rights were in effect during the 2017 finance year. The first issued on 10 November 2011 and the second issued on 28 September 2016.
The terms and conditions of the Rights are as follows:
Tranche: 10 November 2011The terms of the Performance Rights issued on 10 November 2011 require that the recipient must remain in the continuous employment of the Company until the vesting date. These Rights have no exercise price and are to be settled by physical delivery of shares at a conversion ratio of 1:1.
In addition to the tenure condition noted above, the terms of the other Performance and Share Appreciation Rights have two performance conditions:
• A relative total shareholder return measure over the performance period
• An absolute earnings per share growth target over the performance period
The performance measures are mutually exclusive. Performance was assessed over a period of three years.
Tranche: 28 September 2016The performance period for rights issued 28 September 2016 under the 2016 LTI awards is the year from 1 July 2015 to 30 June 2016. The Performance Rights vest into shares for no further consideration on a 1 for 1 basis subject to tenure at the time of vesting.
The LTI dollar value determined for each executive was calculated based on a percentage of the executive’s annual fixed remuneration for the year ended 39 June 2016 and ranges from 30% to 50%. The number of Performance Rights awarded to each executive was calculated by reference to the fair value of each Performance Right at 30 June on the financial year to which the award relates.
General termsThe exercise price for these Performance Rights is nil, while the effective exercise price of the Share Appreciation Rights is equal to the share price at grant, and the payoff is equivalent to the difference between the price at the end of the performance period, and the allocation share price, with the value settled in shares at the end of the performance period. Performance Rights carry no voting or dividend entitlements.
Long Term Incentive Plan
The movement in the share rights for the year is as follows:
Performance RightsOustanding
at 1 July 2016 GrantedForfeited
or Cancelled VestedOustanding
at 1 July 2017
Issued on 10 November 2011 66,666 – – 66,666 –
Issued on 28 September 2016 1,635,256 1,012,500 333,013 289,743
66,666 1,635,256 1,012,500 399,679 289,743
Employee expenses relating to equity settled share based payments2017
$’0002016
$’000
Performance rights 129 292
Total expense recognised as employee costs 129 292
Share-based payment transactions
The grant-date fair value of options, Performance Rights or Share Appreciation Rights granted to employees is recognised as an employee expense over the contractual life of the option or right that the employees become unconditionally entitled to the awards. The amount recognised as an expense is adjusted to reflect the number of awards for which the related service and non-market performance conditions are expected to be met, such that the amount ultimately recognised as an expense is based on the number of awards that meet the related service and non-market performance conditions at the vesting date. For share-based payment awards with non-vesting conditions, the grant-date fair value of the share-based payment is measured to reflect such conditions and there is no true-up for differences between expected and actual outcomes.
NOTES TO THE FINANCIAL STATEMENTSFor the year ended 30 June 2017

LogiCamms 2017 Annual Report62
11 UNRECOGNISED ITEMS
(a) Subsequent events
Extension of finance facilities
On 25 August 2017 the Group’s multi-option finance facility with NAB was extended to 31 August 2018. As part of the extension the limit of the facility was increased by $4.0 million to $11.0 million.
There are no other material events subsequent to balance date that management is aware of that require disclosure.
(i) Operating leases
Leases as lessee2017
$’0002016
$’000
Non-cancellable operating lease rentals are payable as follows:
Less than one year 4,363 3,942
Between one and five years 6,589 7,459
More than five years 391 235
11,343 11,636
The Group leases properties in Brisbane, Perth, Melbourne and Adelaide as well as in several regional locations and in New Zealand. The leases typically run for a period of 12 months to 10 years, with options to renew. Most leases increase annually to reflect market rentals or movement in the consumer price index. During the year ended 30 June 2017 $2.5 million (2016: $7.3 million inclusive of an increase in the provision for onerous lease of $4.2 million), was recognised as an expense in the income statement in respect of operating leases. Following successful negotiations to exit the lease for the Group’s former Brisbane head office, an amount of $0.7 million was derecognised and is presented separately on the income statement for the year ended 30 June 2017.
NOTES TO THE FINANCIAL STATEMENTSFor the year ended 30 June 2017

63LogiCamms 2017 Annual Report
1. In the opinion of the Directors of LogiCamms Ltd (‘the Company’):
(a) the consolidated financial statements and notes set out on pages 20 to 58, and the Remuneration report in the Directors’ report, set out on pages 6 to 17, are in accordance with the Corporations Act 2001, including:
(i) giving a true and fair view of the Group’s financial position as at 30 June 2017 and of its performance for the financial period ended on that date, and
(ii) complying with Australian Accounting Standards, the Corporations Regulations 2001;
(b) the financial report also complies with International Financial Reporting Standards as disclosed in note 2(a);
(c) there are reasonable grounds to believe that the Company will be able to pay its debts as and when they become due and payable.
2. The Directors have been given the declarations required by section 295A of the Corporations Act 2001 from the Chief Executive Officer and Chief Financial Officer for the financial year ended 30 June 2017.
Signed in accordance with a resolution of the Directors.
Peter Watson Chairman
Brisbane 30 August 2017
DIRECTORS’ DECLARATION As at 30 June 2017

LogiCamms 2017 Annual Report64
INDEPENDENT AUDITOR’S REPORT
Independent auditor’s reportTo the members of LogiCamms Limited
Report on the audit of the financial report Our opinion In our opinion:
The accompanying financial report of LogiCamms Limited (the Company) and its controlled entities (together, the Group) is in accordance with the Corporations Act 2001, including:
a) giving a true and fair view of the Group’s financial position as at 30 June 2017 and of its financial performance for the year then ended
b) complying with Australian Accounting Standards and the Corporations Regulations 2001.
What we have audited The Group financial report comprises:
the consolidated statement of financial position as at 30 June 2017
the consolidated statement of profit or loss and other comprehensive income for the year then ended
the consolidated statement of changes in equity for the year then ended
the consolidated statement of cash flows for the year then ended
the notes to the financial statements, which include a summary of significant accounting policies
the directors’ declaration
Basis for opinionWe conducted our audit in accordance with Australian Auditing Standards. Our responsibilities under those standards are further described in the Auditor’s responsibilities for the audit of the financial report section of our report.
We believe that the audit evidence we have obtained is sufficient and appropriate to provide a basis for our opinion.
Independence
We are independent of the Group in accordance with the auditor independence requirements of the Corporations Act 2001 and the ethical requirements of the Accounting Professional and Ethical Standards Board’s APES 110 Code of Ethics for Professional Accountants (the Code) that are relevant to our audit of the financial report in Australia. We have also fulfilled our other ethical responsibilities in accordance with the Code.
Our audit approach An audit is designed to provide reasonable assurance about whether the financial report is free from material misstatement. Misstatements may arise due to fraud or error. They are considered material if individually or in aggregate, they could reasonably be expected to influence the economic decisions of users taken on the basis of the financial report.
We tailored the scope of our audit to ensure that we performed enough work to be able to give an opinion on the financial report as a whole, taking into account the geographic and management structure of the Group, its accounting processes and controls and the industry in which it operates.

65LogiCamms 2017 Annual Report
The Group provides a range of services including engineering consulting, project delivery, asset performance and maintenance services. The Group operates in offices based in Australia and New Zealand.
Materiality Audit scope Key audit matters
For the purpose of our audit we used overall materiality of $ 0.5 m, which represents approximately 5% of the Group’s profit before taxation adjusted for impairment charges.
We applied this threshold, together with qualitative considerations, to determine the scope of our audit and the nature, timing and extent of our audit procedures and to evaluate the effect of misstatements on the financial report as a whole.
We chose profit before tax, because in our view, it is a metric against which the performance of the Group is being measured. We adjusted for impairment as it is an unusual or infrequently occurring item.
We selected a 5% threshold based on our professional judgement, noting it is within the range of commonly acceptable thresholds.
Our audit focused on where the Group made subjective judgements; for example, significant accounting estimates involving assumptions and inherently uncertain future events.
The accounting processes are structured around a Group finance function located in Brisbane. Our audit procedures were mostly performed at the head office.
Our team included the use of valuation experts.
Amongst other relevant topics, we communicated the following key audit matters to the Audit Committee:– Recoverability of goodwill – Basis of preparation of the
financial report – Contract management:
Revenue recognition, accrued work in progress, and recoverability of receivables
– Provisions. These are further described in
the Key audit matters section of our report.
Key audit matters Key audit matters are those matters that, in our professional judgement, were of most significance in our audit of the financial report for the current period. The key audit matters were addressed in the context of our audit of the financial report as a whole, and in forming our opinion thereon, and we do not provide a separate opinion on these matters. Further, any commentary on the outcomes of a particular audit procedure is made in that context.
INDEPENDENT AUDITOR’S REPORT

LogiCamms 2017 Annual Report66
Key audit matter How our audit addressed the key audit matterBasis of preparation of the financial report. Refer to Note 2 Basis of Preparation
As described in Note 2 to the financial report, the financial statements have been prepared on a going concern basis, which contemplates that the Group will continue to meet its commitments, realise its assets and settle its liabilities in the normal course of business.
Assessing the appropriateness of the Group’s going concern basis of preparation for the financial report was a key audit matter due to its importance to the presentation of the financial report and the level of judgment involved in the Group forecasting future cash flows for a period of at least 12 months from the date of the financial report (the cash flow forecasts).
In assessing the appropriateness of the Group’s basis of preparation for the financial report, we performed the following audit procedures, amongst others:
Evaluated the appropriateness of the Group's assessment as to their ability to continue as a going concern, including; whether the level of analysis is appropriate given the nature of the Group; checking that the period covered is at least 12 months from the date of the auditor’s report; and that relevant information of which the auditor is aware as a result of the audit has been considered.
Enquired of management and the board of directors as to its knowledge of events or conditions that may cast doubt on the Group's ability to continue as a going concern.
Assessed whether the Group’s cash flow forecasts from operations, combined with available financing facilities, demonstrated that they were adequate for the Group to be able to pay its expected debts as they fall due for the 12 months forecast period.
To assess the cash flow forecast, we evaluated the reliability of the underlying data and considered the support for key assumptions in the Group’s cash flow forecasts.
Performed a sensitivity analysis by varying key assumptions, including revenue and debtor’s recovery, in the cash flow forecasts, to assess whether the increased financing facilities provide adequate headroom in the event that actual performance varies from that assumed in the Group’s forecasts.
Agreed the Group’s committed and available financing facilities impacting the going concern assessment to supporting agreements. Specifically, we agreed the increase and time extension of the Group’s multi-option facility with NAB which occurred in August 2017 to signed facility agreements;
Obtained an understanding from management and the Board of Directors regarding their plans for future action and the feasibility of these plans, including the availability of alternative sources of funds, if required;
Evaluated whether the Basis of Preparation disclosures in Note 2 provide adequate disclosures about these events and conditions, in view of the requirements of Australian Accounting Standards.
INDEPENDENT AUDITOR’S REPORT

67LogiCamms 2017 Annual Report
Key audit matter How our audit addressed the key audit matter
Recoverability of goodwill Refer to Note 6(b) Intangible Assets and Note 8(c ) Impairment Recoverability of goodwill was a key audit matter due to the material nature of the goodwill balance ($19.5m) and impairment charge recognised by the Group amounting to $11.0m as at 30 June 2017, and because the Group’s assessment of the ‘value in use’ (VIU) of the Cash Generating Unit (CGU) involves judgements about the future results of the business and the discount rates applied to future cash flow forecasts.
The Group performed an impairment assessment over the goodwill balance by calculating VIU for the CGU using a discounted cash flow model (model). The model used cash flow data, which contains significant judgements by the Group relating to:
(a) cash flow projections based on the Group’s budget and forecasts which includes assumptions for revenue growth, and projected Earnings before Interest, Taxation, Depreciation and Amortisation (EBITDA) margins; and
(b) pre-tax discount rates based on benchmarked market inputs, risk adjusted where considered necessary.
Based on the impairment assessment performed for the year ended 30 June 2017, the Group recognised an impairment amounting to $11.0m.
We performed the following audit procedures, amongst others:
Evaluated whether the assessment that the Group constitutes one CGU is appropriate and consistent with our knowledge of the Group’s operations and internal reporting.
Considered if estimating VIU was the best basis upon which to assess value of the CGU.
Tested forecast cash flows used in the model were consistent with the most up-to-date budgets and business plans formally approved by the Board.
Considered whether the cash flows in the model were reasonable by comparing assumptions such as revenue growth, EBITDA margins and discount rates to industry metrics developed independently by PwC valuation specialists.
Performed a sensitivity analysis on key assumptions in the model including revenue growth, discount rates and EBITDA over the 5 year forecast period.
Tested the mathematical accuracy of the model’s calculations.
Tested that the impairment of goodwill was applied correctly, and to the appropriate balance sheet items;
Evaluated the adequacy of the disclosures made in note 8c of the financial report, including those regarding the key assumptions in the valuation and sensitivities to changes in such assumptions, in light of the requirements of Australian Accounting Standards.
Contract management: Revenue recognition, accrued work in progress, and recoverability of receivables Refer to Note 4(a) Revenue and Note 5(b) Trade and Other Receivables
The Group enters into various types of contracts, including fixed price contracts, cost reimbursable contracts, capped cost reimbursable contracts and mixed contracts. For certain types of contracts, including fixed price contracts, revenue is recognised depending on the stage of completion of those services.
Certain contracts include risk, contingency and warranty terms and the Group uses judgement in determining the appropriate revenue to recognise in consideration of these terms.
The Group is exposed to credit risks from transacting on credit terms with its customers through unbilled work in progress and outstanding receivables.
This area was a key audit matter because of the judgement required by the Group in recognising revenue, work in progress and receivables from these types of contracts.
We performed the following audit procedures for the revenue streams, amongst others;
Developed an understanding of and evaluated the Group’s contract establishment and project management process.
For a sample of transactions (for each type of service), obtained the relevant contracts and compared the revenue and accrued work in progress recognised with the contract terms.
Obtained a sample of significant contracts to identify the potential risk factors including warranty claims arrangements, penalty and incentive clauses, and contingent liabilities.
For a sample of invoices, agreed the sale amount to the cash receipt in the relevant bank statement.
Recalculated the stage of completion for a sample of contracts and projects and compared this to the percentage used by the Group when recognising revenue.
Assessed the aging of accrued revenue, work in progress and receivables balances to identify areas of higher risk, for example long aged items or disputed amounts, and assessed on a sample basis whether there was any impact on revenue, work in progress or receivables recognised.
Assessed the reliability of receivables and work in progress aging reports through testing the aging of a sample of items in the report.
INDEPENDENT AUDITOR’S REPORT

LogiCamms 2017 Annual Report68
Key audit matter How our audit addressed the key audit matter
Provisions
Refer to note 5(f) Provisions
The Group’s total provisions as at the year end amounted to $6.6m. This area was a key audit matter because the Group has recognised a number of material provisions that require judgement in determining the measurement of the provision to be recognised under Australian Accounting Standards. In particular, we focused on the provisions in relation to onerous leases, warranties, lease make good, superannuation and restructuring.
For further details about the nature of each of the provisions raised by the Group please refer to Note 5 (f) Provisions in the financial report.
For each material provision we performed the following audit procedures, amongst others:
Considered the appropriateness of the Group’s accounting policies in relation to provisions, specifically comparing them to Australian Accounting Standards.
Tested the mathematical accuracy of the provision calculations.
We checked the adequacy of the disclosures in the financial report in relation to provisions, in light of the requirements of Australian Accounting Standards.
For onerous lease and make good provisions, we performed the following additional audit procedures:
Tested details of lease obligations used in the calculation of the provisions to agreements for a sample of leases in order to assess whether the commitments used by the Group in its calculations were appropriate.
Where a provision extended over a number of years, we tested the calculation of the net present value of future cash flows and assessed the discount rate applied, against the requirements of Australian Accounting Standards.
For warranty provisions, we performed the following additional audit procedures:
Obtained a sample of customer contracts to evaluate whether the Group had a legal or constructive obligation to recognise the provisions.
Recalculated, on a sample basis, the amount of the provision based on the contract values and contract terms.
For the superannuation provision, we performed the following additional audit procedures:
Obtained a sample of contracts with contractors to consider the Group’s determination whether they qualified to be paid superannuation by the Group.
Checked the mathematical accuracy of the calculation of these provisions.
For the restructuring provision, we performed the following additional audit procedures:
Assessed that the Group met the criteria for the recognition of a provision prior to year end, through considering its restructuring plans.
Tested, on a sample basis, the amount of the provision by agreeing to payments made by the Group subsequent to balance date.
INDEPENDENT AUDITOR’S REPORT

69LogiCamms 2017 Annual Report
Other information The directors are responsible for the other information. The other information comprises the Director’s Report and the ASX Information included in the Group’s annual report for the year ended 30 June 2017 but does not include the financial report and our auditor’s report thereon.
Our opinion on the financial report does not cover the other information and accordingly we do not express any form of assurance conclusion thereon.
In connection with our audit of the financial report, our responsibility is to read the other information identified above and, in doing so, consider whether the other information is materially inconsistent with the financial report or our knowledge obtained in the audit, or otherwise appears to be materially misstated.
If, based on the work we have performed, we conclude that there is a material misstatement of this other information, we are required to report that fact. We have nothing to report in this regard.
Responsibilities of the directors for the financial report The directors of the Company are responsible for the preparation of the financial report that gives a true and fair view in accordance with Australian Accounting Standards and the Corporations Act 2001and for such internal control as the directors determine is necessary to enable the preparation of the financial report that gives a true and fair view and is free from material misstatement, whether due to fraud or error.
In preparing the financial report, the directors are responsible for assessing the ability of the Group to continue as a going concern, disclosing, as applicable, matters related to going concern and using the going concern basis of accounting unless the directors either intend to liquidate the Group or to cease operations, or have no realistic alternative but to do so.
Auditor’s responsibilities for the audit of the financial report Our objectives are to obtain reasonable assurance about whether the financial report as a whole is free from material misstatement, whether due to fraud or error, and to issue an auditor’s report that includes our opinion. Reasonable assurance is a high level of assurance, but is not a guarantee that an audit conducted in accordance with the Australian Auditing Standards will always detect a material misstatement when it exists. Misstatements can arise from fraud or error and are considered material if, individually or in the aggregate, they could reasonably be expected to influence the economic decisions of users taken on the basis of the financial report.
A further description of our responsibilities for the audit of the financial report is located at the Auditing and Assurance Standards Board website at: www.auasb.gov.au/auditors_responsibilities/ar1.pdf. This description forms part of our auditor’s report.
INDEPENDENT AUDITOR’S REPORT

LogiCamms 2017 Annual Report70
Report on the remuneration report Our opinion on the remuneration report We have audited the remuneration report included in pages 7 to 16 of the directors’ report for the year ended 30 June 2017.
In our opinion, the remuneration report of LogiCamms Limited for the year ended 30 June 2017 complies with section 300A of the Corporations Act 2001.
Responsibilities The directors of the Company are responsible for the preparation and presentation of the remuneration report in accordance with section 300A of the Corporations Act 2001. Our responsibility is to express an opinion on the remuneration report, based on our audit conducted in accordance with Australian Auditing Standards.
PricewaterhouseCoopers
Michael ShewanPartner
Brisbane30 August 2017
INDEPENDENT AUDITOR’S REPORT

71LogiCamms 2017 Annual Report
AUDITOR’S INDEPENDENCE DECLARATION
PricewaterhouseCoopers, ABN 52 780 433 757480 Queen Street, BRISBANE QLD 4000, GPO Box 150, BRISBANE QLD 4001 T: +61 7 3257 5000, F: +61 7 3257 5999, www.pwc.com.au
Liability limited by a scheme approved under Professional Standards Legislation.
Auditor’s Independence Declaration
As lead auditor for the audit of Logicamms Limited for the year ended 30 June 2017, I declare that to the best of my knowledge and belief, there have been:
(a) no contraventions of the auditor independence requirements of the Corporations Act 2001 in relation to the audit; and
(b) no contraventions of any applicable code of professional conduct in relation to the audit.
This declaration is in respect of Logicamms Limited and the entities it controlled during the period.
Michael Shewan BrisbanePartnerPricewaterhouseCoopers
30 August 2017

LogiCamms 2017 Annual Report72
Additional information required by the ASX Limited Listing Rules and not disclosed elsewhere in this report is set out below. The information is correct at 30 August 2017.
Shareholdings
Twenty largest shareholders
The number of shares held by substantial shareholders and their associates are set out below:
Shareholder Units % of Units
Candyblossom Pty Ltd 10,377,699 12.70
UBS Nominees Pty Ltd 9,450,322 11.56
J.P Morgan Nominees Australia Limited 8,490,359 10.39
HSBC Custody Nominees (Australia) Limited 7,537,439 9.22
Noramary Consultancy Services Pty Ltd 2,000,000 2.45
Bond Street Custodians Limited 1,267,559 1.55
Mr Andrew John Weldon Smith & Ms Suzanne Elizabeth Smith & Ms Julia Yvonne Mustard 1,099,320 1.34
BFA Super Pty Ltd 1,000,000 1.22
National Nominees Limited 917,169 1.12
BNP Paribas Nominees Pty Ltd 856,401 1.05
Monarc Environmental Pty Ltd 671,141 0.82
Mr Ian Hamilton Paterson 624,702 0.76
Mrs Jaye Katherine Lange 600,000 0.73
Pacific Custodians Pty Limited 585,622 0.72
Mr Paul David Walker 563,149 0.69
Mr Peter James McDonald & RT McDonald Trustee Limited 471,137 0.58
Mr Alan John Hooker & Ms Beverley Janette Tatham 471,137 0.58
Mr Adam Murray Hore & Ms Meaghan Lee Rowe 431,920 0.53
Zak One Pty Limited 400,000 0.49
Mrs Millie Sally-Jane Grace Adelaide Miller & Mr Andrew James Miller 393,500 0.48
David Ricardo Asset Management Pty Ltd 388,888 0.48
TOTAL 48,597,464 59.45
Balance of Register 33,142,381 40.55
GRAND TOTAL 81,739,845 100.00
Substantial Shareholders
Shareholder Units % of Units
Candyblossom Pty Ltd 9,947,698 12.17
Tiga Trading Pty Ltd 12,850,000 16.36
Forager Funds Management Pty Ltd 8,850,988 12.27
Range of Shares
Ordinary Fully Paid Shares
Range Total Holders Units% of issued
capital
100,001 and Over 70 45,350,165 65.32
50,001 to 100,000 85 6,134,573 8.84
10,001 to 50,000 530 12,619,696 18.18
5,001 to 10,000 403 3,289,157 4.74
1,001 to 5,000 565 1,855,897 2.67
1 to 1,000 262 180,126 0.26
TOTAL 1915 69,429,614 100
ASX INFORMATION As at 30 June 2017

Unmarketable Parcels
There were 280 holders of unmarketable parcels of less than $500.
Voluntary Escrow
Nil
Unlisted Securities – Performance Rights
Issue Date Vesting Date Number of Shares
28 September 2016 30 June 2018 273,077
24 November 2016 26 May 2018 16,666
The Performance Rights are exercisable into shares for nil consideration. The terms of the Performance Rights require that the recipient must remain in the continuous employment of the Company until the vesting date.
Unlisted Securities – Options
Nil
Unlisted Securities – Share Appreciation Rights
Nil
Securities Exchange
The Company is listed on the Australian Securities Exchange.
Other information
LogiCamms Ltd, incorporated and domiciled in Australia, is a publicly listed company limited by shares.
Buy Back
There is no current on-market buy-back.
Voting rights
Ordinary shares
The voting rights attached to the ordinary shares are governed by the Constitution. On a show of hands every person present who is a member or representative of a member shall have one vote and on a poll, every member present in person or by proxy or by attorney or duly authorised representative shall have one vote for each share held.
Performance rights
Performance rights do not have voting rights.
ASX INFORMATION As at 30 June 2017

LO
GIC
AM
MS
AN
NU
AL
RE
PO
RT
20
17
LogiCamms Limited
ASX:LCMACN 127 897 689ABN 90 127 897 689
Registered Office
200 Mary Street, BrisbaneQueensland, Australia 4000Tel. + 61 7 3058 7000
www.logicamms.com.au
Location of Share Registry
Computershare Investor Services Limited45 St Georges Terrace, West Perth,Western Australia 6000Tel. + 61 8 9323 2000