contents · kwashiorkor, marasmus, pellagra, lathyrism, beriberi and blindness due to severe...
TRANSCRIPT
Report of the Steering Committee of
Nutrition
Planning Commission Government of India
New Delhi
Contents
Page No.
Executive summary i – xxix
Chapter I Introduction 1
Chapter II Sustainable food production to meet nutritional needs
9
Chapter III Equitable distribution of food stuffs 17
Chapter IV Dietary intake and nutritional status 23
Chapter V Improving nutritional status of vulnerable groups
38
Chapter VI Micronutrient Deficiencies 75
Chapter VII Nutrition monitoring and surveillance 108
Chapter VIII Recommendations 119
i
EXECUTIVE SUMMARY
Importance of optimal nutrition for health and human development is well recognised. At the time of Independence the country faced two major nutritional problems - one was the threat of famine and acute starvation due to low agricultural production and lack of appropriate food distribution system. The other was chronic energy deficiency due to: • Low dietary intake because of poverty and low purchasing power • High prevalence of infection because of poor access to safe-drinking
water, sanitation and health care • Poor utilisation of available facilities due to low literacy and lack of
awareness Chronic energy deficiency (CED) , kwashiorkor, marasmus, goitre, beriberi, blindness due to Vitamin-A deficiency and anaemia were major public health problems. The country adopted multi-sectoral, multi-pronged strategy to combat these and to improve nutritional status of the population. Constitution of India (Article 47) states that “the State shall regard raising the level of nutrition and standard of living of its people and improvement in public health among its primary duties”. Successive Five Year Plans laid down the policies and strategies for achieving these goals. The Green revolution ensured that in India, increase in food production stayed ahead of the increase in population. The country has moved from chronic shortages to an era of surplus and export in most of the foodstuffs. The country is self sufficient in food grain production and currently there is a buffer stock of over 60 million tons. Along with the steps to achieve adequate production, initiatives were taken to reach foodstuffs of right quality and quantity to right places and persons at the right time and at affordable cost through PDS. Over the years, programmes to improve access to food and health care, to address the needs of the out of work persons through food for work programme, to provide food supplementation for preschool children, primary school children, pregnant and lactating women have been operationalised. National programmes for tackling anaemia, iodine deficiency disorders and Vitamin-A deficiency are being implemented. As a result of all these interventions there has been substantial reduction in severe grades of under-nutrition in children and some improvement in nutritional status of all segments of population. Kwashiorkor, marasmus, pellagra, lathyrism, beriberi and blindness due to severe Vitamin-A deficiency have become rare. However, several challenges remain. To meet all the nutritional needs of the growing population, the country will have to produce an extra 5 million tonnes of food grains annually and achieve increase in production of livestock, fish and horticultural products. This has to be achieved inspite of shrinking arable land and farm size, low productivity, growing regional disparity and depletion of natural resource base. Appropriate steps have to be taken to minimize potential adverse consequences of globalization on domestic production, employment and price stability of food stuffs. Inspite of huge buffer stocks, 8% of Indians do not get two meals a day and there are pockets where severe under-nutrition takes their toll even today. Every third child born
ii
is under weight. Low birth weight is associated with higher infant mortality and long-term health consequences including increased risk of non-communicable diseases. While mortality has come down by 50% and fertility by 40%, reduction in under nutrition is only 20%. About half of the pre-school children suffer from under-nutrition. Micronutrient deficiencies are widespread; more than half of the women and children are anaemic; reduction in Vit.A deficiency and IDD are sub-optimal. Under-nutrition associated with HIV/AIDS will soon emerge as a public health problem. Alterations in the life styles and dietary intake have led to increasing prevalence of obesity and associated non-communicable diseases. In the new century, the country will have to gear itself to prevent and combat the dual burden of under and over-nutrition and associated health problems. SUSTAINABLE FOOD PRODUCTION TO MEET NUTRITIONAL NEEDS
The country has achieved self-sufficiency in food grains to meet the needs of the growing population and there are ample food grain stocks. . Food grain production has increased four fold (from 50.82 million tons in 1950-51 to 209 million tons in 2001-02(Economic survey 2001-02). However, productivity remains low. Improved food grain availability has not resulted in eradication of hunger or reduction in under-nutrition especially in vulnerable groups. There is a need to shift from
• Self sufficiency in food grains to meet energy needs to providing foodstuffs
needed for meeting all the nutritional needs • Production alone to reduction in post harvest losses and value addition
through appropriate processing • Food security at state level to nutrition security at the individual level
Interventions to improve food production to meet the nutrient needs Food grain production
Inputs needed to achieve sustainable increase in food grain production to meet the needs of the growing population (estimated to be 5 million tons /year) have to be provided. Coarse grains which are locally produced and procured if made available through targeted public distribution system (TPDS) at subsidised rate, may substantially bring down the subsidy cost without any reduction in calories provided and improve targeting - as only the most needy are likely to buy these coarse grains. Millets are rich in minerals and micronutrients and hence increased consumption of millets will improve dietary intake of these vital nutrients among poorer segments of the population Pulse production
In the last two decade, there has been a progressive decline in pulse consumption, especially among poorer segments of population. This is due to stagnant pulse production and rising cost of pulses. This trend has to be reversed. Measures to improve pulse production may range from reactivation of the pulse component of the oil seed and pulse mission, a
iii
major thrust on R&D and other inputs to innovative community based efforts similar to Swaminathan Foundation’s efforts in Tamil Nadu to improve pulse production. Horticultural Production
Inspite of being first and second in production of fruits and vegetables in the world, per capita consumption of these in India is very low. Consumption of adequate quantities of vegetables is essential for meeting dietary requirement of vital micronutrients; vegetables also provide several phytochemicals and fibre.
At present there is lack of sufficient focus and thrust for cultivation and marketing of the low cost, locally acceptable green leafy vegetables, yellow vegetables and fruits; because of this, consumption of these vegetables throughout the year at affordable cost both in urban and rural areas has remained an unfulfilled dream. Health and nutrition education emphasizing the importance of consuming these inexpensive rich sources of micronutrients alone will not result in any change in food habits unless there is harnessing and effective management of horticultural resources in the country to meet the growing needs of the people at affordable cost. Providing better processing, storage and transportation for horticultural products so that there is no glut and distress sale of these perishable products, will make their production economically attractive to farmers and improve availability to the consumers. Homestead production for dietary diversification
Homestead production is another method of increasing consumption of vegetables, milk and animal products and reduces the gap in consumption. Strategies can be worked out for using degraded lands for vegetable production and farm wastes as well as food grains unfit for human consumption for backyard poultry to increase homestead production of eggs and chicken and increase consumption of these at home. Food Processing and Preservation
Post harvest losses especially in vegetables and fruits are presently in the range of 20 to 50% and contribute directly to higher cost and reduction in the availability of these commodities to the people. Science and technology based precision farming and food processing which are both intellectually stimulating and economically rewarding can increase farmers’ income and rural employment considerably; these can attract and retain educated youth in farm sector; these activities would also enable the micronutrient needs of the population to be met through a sustainable food based approach. EQUITABLE DISTRIBUTION OF FOODSTUFFS
Achievement of food adequacy at the national level is a precondition, necessary but not sufficient in itself, to ensure the achievement of household
iv
nutrition security. Buffer stocks do help to combat acute transient food scarcity, caused by natural disasters like floods and droughts. Early warning systems are in place and food can be rushed to areas of threatened distress fairly rapidly. What is proving more difficult is the task of combating chronic mild / moderate under-nutrition in large number of poor households. Inequitable distribution of available food among different segments of population and even within the family is one of the major factors responsible for under-nutrition / over-nutrition. Good governance and health and nutrition education hold the key for improving equitable distribution of food based on the need.
In an attempt to limit the mounting cost of subsidy and at the same time to ensure that people below poverty line do get subsidized food grains, the Targeted Public Distribution System (TPDS) providing food grains at subsidized cost only to people below poverty line was initiated in June 1997. TPDS meets only a part of the total requirement of food grains for the family. Government’s initiatives besides TPDS to improve food security of families include: • Allocation of food grains at BPL rates to institutions where indigent people
live • Annapoorna Scheme to provide food grains to indigent old persons • Antyodaya Anna Yojana to provide food grains to poorest of the poor
families amongst BPL families at the rate of Rs.2/- per kg for wheat and Rs.3/- per kg for rice.
• Sampoorna Grameen Rozgar Yojana to cover women, scheduled castes, scheduled tribes and parents of children withdrawn from hazardous jobs and provide food for work to them
Role of the community
The Swaminathan Research Foundation has advocated formation of local Grain Banks under the supervision of the PRI to help in achieving the goals of nutrition security for all and for insulating economically and socially deprived sections of the community from seasonal food insecurity. Main features of the proposed food bank are • One bank for every village or cluster of villages with population ranging
from 2000 - 5000 • Supervised by a society or council chosen by the Gramsabha • Managed by a Stakeholder Council, with different operations assigned to
different Self Help Groups (SHGs) • To be implemented with honesty, political neutrality, fairness, absence of
discrimination based on religion, caste, class, gender and political belief Innovative local efforts can go a long way in improving nutrition security especially among poorer segments of the population living in vulnerable areas.
v
Recommendations for interventions during the Tenth plan • Identify vulnerable groups/ undernourished individuals/families and provide
them with well-targeted subsidised foodstuffs through TPDS. In addition to supply of rice and wheat, inclusion of locally procured coarse grains, pulses and iodised salt may be necessary.
• Test and evaluate various modalities of improving the efficiency of the systems currently in operation to improve household nutrition security.
• Choose appropriate modalities for making optimal use of available subsidies to meet the needs of the vulnerable segments of the population.
• Ensure that there is no duplication of schemes for improving nutrition security to vulnerable groups of the population.
MANAGEMENT OF TRANSIENT FOOD SCARCITY DUE TO DROUGHT
In the past five decades, country has averted large-scale severe under-nutrition or famine; however droughts do pose major threat to food security. Over the years, the country has developed a system for early recognition and management of transient food security in drought. .During the Ninth Plan (2000) Rajasthan, Andhra Pradesh and Gujarat were affected by drought. Of the various relief measures, Andhra Pradesh benefited only from additional ration through PDS. In the other two States, other measures such as food for work, supply of drinking water, essential medicines and cattle feed were also in operation. The National Institute of Nutrition conducted a survey in the drought affected districts in these three states to assess the impact of drought and the ongoing intervention programmes on the diet and nutritional status of the population and it was found that except in children in Rajasthan, the adverse consequences of drought on nutritional status were prevented due to intervention programme.
It is recommended that during the Tenth Plan period efforts be made to monitor rainfall data to provide early warning of drought; monitoring agricultural production will provide information about impending food insecurity. In drought prone areas intensive monitoring of nutritional status of pre-school children based on ICDS report will help to assess impact and severity of the problem at block level. Based on these data timely relief measures can be organized. Apart from other process indicators for monitoring the relief operations, monitoring the nutritional status of pre-school children through ICDS system may be used for assessing the out reach, adequacy and impact of relief measures. NUTRITIONAL STATUS OF TRIBAL POPULATION
The tribal population is not a homogeneous one. There are wide variations in the nutritional status, nutrient intake, access to and utilisation of nutrition and health services among the tribal populations. The tribal populations in North Eastern States have high literacy levels, they access available facilities, and hence their nutritional and health status is better than national level. On the other hand, primitive tribes such as the Onges in
vi
Andaman have very little awareness or access to either nutrition or health care. Differential area-specific need assessment, strategies and programmes to improve access to and utilisation of nutrition services have to be developed for each of the tribal areas.
The tribal population is recognized as socially and economically
vulnerable. Their lifestyles and food habits are different from their rural neighbours. They depend on minor forest produce, are employed as manual labourers may not have adequate income. Their food consumption pattern is dependent on vagaries of nature and varies from extreme deprivation (in lean seasons) to high intakes (post harvest period). Several focused interventions for tribal development and improvement in their health and nutritional status have been initiated in the last three decades. Though, as a result of these, there has been some reduction in the prevalence of severe forms of under nutrition and in nutritional deficiency signs, yet over time there has not been any improvement in the food and nutrient intake. The tribal population is more under nourished than their rural counterparts. Recommendations for interventions during the Tenth plan • Continue monitoring of tribal population especially of those who have poor
access to services • Monitor ICDS reporting so as to provide early warning of any deterioration
in nutritional status in pre-school children and initiate appropriate intervention
• Carry out research studies on dietary habits that contribute to good nutritional status as well as those that make the tribal population vulnerable to diseases and based on the data take up specific intervention programmes to improve nutritional status and to eliminate dietary habits that are likely to cause ill health in different tribes in the country
ENERGY REQUIREMENTS OF INDIANS Energy requirement is defined as the amount that will balance energy expenditure of the individual (as determined by body size and composition and level of physical activity) consistent with long-term good health. This intake will allow for maintenance of economically necessary and socially desirable physical activity. In children and pregnant/ lactating women, energy requirement will include energy needed for deposition of tissue and secretion of milk at the rate consistent with good health. All estimates of requirement are based on habitual intakes. Energy needs of men and women for different activity levels have been computed on the basis of recommendations made by a Joint Expert Consultation of WHO/FAO/UNO in 1985 and by an Expert Committee constituted in 1988 by the ICMR. The ICMR’s RDA is higher than those recommended by the WHO/FAO/UNU. Studies on Basal Metabolic Rate (BMR) in Indians has shown that BMR of Indians is about 5% lower than BMR predicted on the basis of WHO/FAO/UNO equations.
However, energy cost of work done computed in terms of basal energy cost or physical activity ratios are similar. For computing RDA, ICMR has
vii
taken body weight of “reference man” as 60 kg and that of woman as 50 kg. Average weight of Indian men is 52 Kg and women 44 Kg. In view of all these it is likely that energy requirement of Indians is likely to be substantially lower than the current ICMR recommendations. Over the last few decades there has been a reduction in the physical activity and hence reduction in the energy needs in all the age and weight categories. Obesity rates in all age groups are increasing mainly because of the reduction in physical activity without concomitant reduction in energy intake. In view of the known adverse health consequences of both excess and deficient energy intake, it is essential that appropriate recommendation for the RDA for Indians are evolved, especially as the country is entering an era of dual disease burden of CED and infections on one hand and of obesity and NCD on the other.
It is recommended that review of the RDA for Indians may be taken up during the tenth plan on a priority basis. ICMR has reconstituted their Expert Committee on RDA which will take all the above factors into consideration and come up with appropriate recommendations regarding dietary intake of Indians. Studies to define BMR and energy requirement of healthy adult Indian men and women, adolescents, children and elderly may be taken up on a priority basis. Simultaneously studies may be taken up to define the dietary intake needed to correct the chronic energy deficiency or excess in each of these groups. ASSESSMENT OF NUTRITIONAL STATUS Anthropometric indices (height and weight in case of children and body mass index (BMI) in case of adults) are widely used for assessment of adequacy of energy consumption. BMI, however, does not clearly bring out the entire extent of chronic under- nutrition. It has also been reported that body fat content for a given BMI is different not only between men and women but also among different countries.
BMI has been used to assess energy deficiency as well as excess. The currently used norms (<18.5 – undernutrition and >25 - obesity) were evolved on the basis of data from the developed countries where adverse health consequences of under nutrition have been shown to be associated with BMI values below 18.5 and the health hazards of obesity have been reported with BMI of over 25. Mean and frequency distribution of BMI of the Indians are substantially different from developed countries. It is therefore possible that the currently used classification may be satisfactory for developed countries but not for India. There are wide variations in height, weight, body composition and BMI right from birth through childhood and adolescence between countries and different income groups in the same country. Birth weight and growth of Indian children from well-to-do segments of the population are similar to NCHS standards but adult heights and weights in India are lower. The functional significance of inter-country variations in stature are not yet clearly understood. However, the existing gap between stature of Indians from well-to-do families where there are no nutritional constraints and under-nourished persons from poorer segments of the population is clearly due to poor nutrition and health care. The nutritional
viii
goal of the country is to identify individuals and families, who are under-nourished, provide them with adequate nutrition and health support so that they attain their full genetic potential for growth.
As both energy deficiency and excess are associated with adverse health consequences, it has been suggested that each country should develop its own norms for BMI and cut off point indicative of various degrees of under-nutrition and over-nutrition based on their own data on BMI levels and health problems. In view of the profound implications of these suggestions it is suggested that research studies are taken up in India during the Tenth Plan period to examine the usefulness of currently used cut off points of BMI as indicator of CED, metabolic functions, work capacity and health indices. It is also important to collect epidemiological data on BMI of well-nourished Indians in different regions and health profile of adults with different BMI. Epidemiological data on risk of NCD in different BMI groups in India will have to be collected to evolve appropriate cut off points for obesity in Indians so that those at risk of NCD could be identified and appropriate intervention undertaken. DIETARY INTAKE AND NUTRITIONAL STATUS OF ADULTS Over the last three decades there have been substantial changes in socio-economic status, some increase in the dietary intake of men and women especially of the affluent segments; ready availability of fast foods, ice creams and other energy rich food items at affordable costs have resulted in increased energy consumption. With cooking gas, piped water supply and labour saving gadgets and transport there has been a substantial reduction in physical activity and energy expenditure especially in middle and upper income groups. Data from NNMB repeat surveys clearly indicate that there has been some reduction in undernutrition and some increase in obesity over the last two decades. Data from NFHS confirms that currently both undernutrition and obesity are problems in women and that there are massive inter-state differences. The country will, therefore, have to gear up to prevent, detect and tackle the problems of both under-nutrition and over-nutrition in the next two decades.
Over the last two decades there is a growing number of reports that Indians are a very high-risk group for cardiovascular diseases and diabetes. Majority of them are not obese or have risk factors associated with NCD in the developed countries. The higher prevalence of non-communicable diseases among persons whose birth weights were low has been documented. It has been hypothesized that people who have lived under nutritional constraints over millennia have “thrifty genes” which enable them to survive and sustain themselves with lower energy intake. In such a population, increase in energy intake rapidly brings about increase in NCD risk. This is an area where further research studies are needed.
As both CED and obesity are public health problems in India, there is an urgent need for nutrition education on principles and practices for safe and effective correction of CED/obesity in adults. The amount by which the
ix
dietary intake should be increased or decreased to achieve this objective will depend upon the rate at which the desirable weight is to be achieved and the extent to which the deficit or excess consists of lean and fat tissue. Since adults cannot grow, appropriate weight for actual height is to be calculated and appropriate dietary intake to correct under-nutrition or over-nutrition computed. In adults who are seriously under weight for their height, there will generally be a loss of both fat stores and lean body mass and therefore to bring their weight into the normal range, additional amounts of both energy and protein are required. Clinical experience suggests that under weight adults who are free from disease can be rehabilitated fairly rapidly if they eat to appetite. For sedentary adults three meals a day with low energy dense food with lot of vegetables and fibre and adequate exercise would go a long way in terms of providing satiety and preventing obesity. The low energy diet coupled with adequate exercise will be needed to correct obesity; if low energy diet is needed for a long period it is essential to supply adequate amounts of protein and micronutrients.
It is recommended that during the Tenth plan major thrust may be laid on undertaking massive health and nutrition education to encourage appropriate dietary intake and healthy life styles among all segments of the population . Epidemiological studies may be initiated on dietary intake, nutritional status and health status to define levels at which functional impairment in health status occur. It is important to look into both under nutrition and over-nutrition so that it will be possible to use these data for early detection and correction of both these nutritional problems and prevent health hazards associated with them. GERIATRIC NUTRITION
With increasing longevity, the proportion and number of persons in the age group of 60 years and beyond is rapidly increasing; in this age-group women outnumber men. With increasing age there are metabolic changes and also reduction in physical activity; as a result their energy requirement is substantially lower than that of younger adults.
Elderly individuals face problems in ensuring appropriate dietary intake because of alteration in taste with increasing age and loss of teeth. The reduction in physical activity with increasing age when not associated with similar reduction in energy intake renders them prone for obesity. Due to low intake of vegetables and micronutrient rich food items and increased susceptibility to infection, anaemia and vitamin B complex deficiency may be more common in the elderly. Indian diets contain low levels of calcium. Adequate dietary calcium intake from birth to 30 years is critical for development of peak bone mass. There is very little data on the incidence of osteoporosis in India. Osteoporosis occurs more commonly in women than in men. With increasing longevity in India, there will be an increase in osteoporosis. Lack of social support, breaking up of the joint family system, changing life-styles, all aggravate health and nutritional problems in elderly age group. Available data from nutrition surveys indicate that among the elderly the dual problem of chronic energy and micro nutrient deficiency on
x
one hand and obesity on the other hand are seen. Innovative efforts to provide societal support, health care and nutrition services to the elderly are currently being taken up by several agencies. Simultaneously there are efforts to improve family and societal support to elderly within the existing cultural ethos in different regions. Successful models for improving quality of life will have to be replicated. In many states elderly persons who are without any financial support get old age pension. The amount as well as coverage varies between states but on the whole the amount provided is too low to meet their nutritional needs. Following reports of severe under-nutrition among the elderly and destitute persons in several states the Central and the State Govts have initiated steps to improve access to food grains to these segments of the population. National Policy on Older Persons was announced in Jan.1999. The policy provides a frame work for welfare of the elderly persons including improved financial security, increased access to health and nutrition services. For implementation of the Policy a National Plan of Action has been envisaged. The Policy recommends that research to expand the knowledge base on nutritional needs for the benefit of older persons need be carried out. Recommendations for interventions during the Tenth plan • Create data base on the magnitude of nutritional problems in the elderly
(under-nutrition, micronutrient deficiency and obesity) through the ongoing diet and nutrition surveys.
• Draw appropriate area specific/ intervention programme on the basis of data
While the technical inputs will come from the nutritionists, implementation of the programme will largely rest with the families, community and the PRI. NUTRITIONAL STATUS OF ADOLESCENTS
Projections made by the Technical Group on Population Projections indicate that the number of adolescents (10-19years) will increase from 20 crore in 1996 to 21.53 crore in 2016. Adolescents who are undergoing rapid growth and development are one of the nutritionally vulnerable groups who have not received the attention they deserve. Adolescents gain 30% of their adult weight and more than 20% of their adult height between 10 and 19 years. Though there has not been any substantial increase in the dietary intake of adolescents, there has been significant improvement in height (2.5-3.5 cms), weight (1-1.5kg) and body mass index between 1975-79 and 1995-97. Data from NNMB also shows that over the period there has been some increase in obesity among adolescents especially among the affluent groups both in urban and rural areas. Prevalence of micronutrient deficiencies are high among adolescents. With onset of menstruation, girls in this age group are vulnerable to anaemia and all its adverse consequences. Undernutrition, anaemia and poor antenatal care inevitably lead not only to increased
xi
morbidity in the mother but also to high incidence of low birth weight and perinatal mortality. Poor childrearing practices of these girls will add to the morbidity and under-nutrition in the infant, thus perpetuating intergenerational cycle of under nutrition. Appropriate education, nutrition and health interventions, delay in age at marriage, optimum health and nutrition interventions during pregnancy are some of the inter-sectoral initiatives to break this vicious cycle.
With a view to minimise these adverse effects, appropriate nutritional and health interventions for adolescents are being taken up under ICDS and RCH Programmes. Department of Women and Child Development has launched Kishori Shakti Yojana. Prime Minister in his Independence day address 2001 stated that food grains will be provided to combat undernutrition in adolescents. The Dept of WCD is in the process of operationalising this.
During the Tenth Plan, studies to improve the understanding of the relationship between energy requirements, body composition, endocrine changes and micronutrient status in children and adolescents will be taken up so that appropriate focused interventions can be initiated. Programmes to improve nutrition and health status of adolescents will be effectively implemented.
Adolescent girls fall into two major categories-those who are in school and those who are not going to school. The focus of efforts to improve the health and nutritional status of those who are in school will have to be through the school health system; efforts will be to screen all for anaemia and under-nutrition and provide appropriate management. Screening will also enable the identification of obese adolescents and initiation of appropriate remedial measures. Health and nutrition education to delay marriage until at least eighteen and postpone childbearing till twenty will be vigorously taken up. The second category is the out of school adolescents. Majority of these girls marry during early teens and conceive soon after wards. In this category the focus will be to get these girls to come over to anganwadi; AWW in collaboration with the ANM can undertake the following activities: • Screening for under/over--nutrition, micronutrient deficiencies • Targeted interventions to tackle the nutritional problems of adolescents,
especially girls • Introduction of community supported supplementary nutrition programmes
using community provided food grain banks; food to be prepared by local women’s groups using locally available foodstuffs and vegetables and given on a priority basis to adolescents who are pregnant
• IEC to improve awareness • Health and nutrition education to prevent too early pregnancies and
under nutrition • Appropriate antenatal and intrapartum care and contraceptive care when
needed
xii
NUTRITION IN PREGNANCY AND LACTATION
Traditional belief was that pregnant and lactating women require additional dietary intake as they have to meet their own nutritional requirements and also supply nutrients to the growing foetus and the infants. Some of the available data indicated that low dietary intake especially in already chronically undernourished women had adverse effect on the health and nutritional status of the mother, course and outcome of pregnancy and birth weight of the offspring. Both the ICMR and the WHO Expert Groups recommended additional intake for pregnant and lactating women. Epidemiological data from the developed and developing countries however indicate that in habitually well nourished who eat to appetite there is no increase in dietary intake during pregnancy and lactation and this did not result in any adverse effect either on their own nutritional status or on the course and outcome of pregnancy. Studies undertaken during the eighties have shown that during pregnancy there are adaptive changes; there is a reduction in basal metabolic rate and physical activity during pregnancy; there might be some improvement in the as yet unmeasured efficiency of energy utilisation. The energy and nutrients saved due to these adaptive processes are sufficient to meet the increased requirements for nutrients during pregnancy; so long as there is no reduction in habitual dietary intake there is no deterioration in maternal nutritional status either during pregnancy or during the lactation. In wellnourished individuals, additional intake during pregnancy and lactation results in excessive weight gain and this may lead to obesity.
However, there are limits to adaptations. Studies from developing countries have shown that reduction in dietary intake below habitual levels and increased workload above the habitual levels are associated with deterioration in maternal nutritional status and reduction in birth weight. Some such readily identifiable situations are • Reduction in habitual dietary intake (drought, preharvest season) • Increase in work (newly inducted manual laborers) • Combination of both the above (food for work programmes) • Adolescent pregnancy • Pregnancy in a lactating woman • Pregnancy occurring within two years after last delivery.
Research studies in India and elsewhere have shown if pregnant women in whom there has been a reduction in habitual intake or excess energy expenditure, or whose body weight is less than 40 kg are identified and given adequate continuous food supplementation and antenatal care, there is substantial improvement in outcome of pregnancy, reduction in low birth weight and neonatal mortality. Encouraged by such data, almost all developing countries embarked on food supplementation programmes for pregnant and lactating women. None of these programmes screen pregnant women and provide supplements only to those with energy gap or those with moderate/severe undernutrition. When food supplements are provided
xiii
without screening, targeting supplementation and monitoring the programme, the improvement in maternal nutrition, and birth weight, if any, is very limited. One of the major problems is to reach the food supplements to the undernourished women; even when the logistics of reaching the food to women is meticulously worked out and efficiently carried out, food sharing within the family of the recipient results in the `target' women not getting the supplements in significant quantities. Obviously this is one of the factors responsible for the demonstrated lack of beneficial effect. The lack of adequate antenatal care and continued physical work during pregnancy are two other factors responsible for lack of impact.
Under the ICDS programme food supplements are being provided to pregnant and lactating women who come to Anganwadi. Reported coverage is between 15-20% in most blocks; women who receive supplements are not being chosen on the basis of their nutritional status and may not be the most needy. There has not been any evaluation studies on this component of the ICDS . However data from nutrition surveys indicate that there has not been any significant decline in maternal under nutrition over the last decade . Recommendations for interventions during the Tenth plan
• Weigh all women as early as possible in pregnancy and monitor their
weight gain • Women who are well nourished be advised not to increase their dietary
intake to prevent over nutrition and obesity • Women who weigh less than 40 kg be identified and ¾ Given food supplements consistently throughout pregnancy ¾ Given adequate antenatal care ¾ Monitored for weight gain during pregnancy and if weight gain sub-
optimal, explore causes and attempt remedial measures ¾ Given appropriate intrapartum and postpartum care
Effective intersectoral coordination between ANMs and AWWs will
enable identification and appropriate care to undernourished pregnant women; the PRIs can play an important role by ensuring that these women receive food supplement throughout pregnancy. NUTRITIONAL STATUS OF CHILDREN New Born
India has the dubious distinction of having very high prevalence of the low birth weight. There are substantial differences in the body weight and birth weight between income groups which are partly due to differences in the nutritional status and partly due to differences in the health care. Efforts to improve these through appropriate health and nutrition interventions should be taken up on priority basis. Steering Committee recommended that every effort should be made during the Tenth Plan to see that all infants delivered at home are weighed by Anganwadi worker and those weighing less than 2.2 kg are referred to a hospital with a paediatrician
xiv
to improve neonatal survival; efforts should also be made to generate nation wide data on birth weight and prevalence of low birth weight. Growth during infancy
Growth during infancy and childhood depends upon birth weight, adequacy of infant feeding and absence of infection. Available data clearly indicate that in India exclusively breast fed infants thrive normally during the first six months of life and have lower morbidity episodes than those receiving supplements in addition to breast milk. In view of this, promotion of universal exclusive breast feeding for the first six months of life has been the National Policy. Breast milk alone is insufficient to meet the growing baby’s needs after six months; appropriate semisolid complementary foods have to be introduced to enable them to meet their nutrient needs. Care should be taken to reduce the chances of infection by providing freshly prepared food.
In India, steps taken for protection and promotion of breast-feeding have been effective and breast-feeding is almost universal. However, the message that exclusive breast feeding upto six months and gradual introduction of semisolids after six months are critical for prevention of undernutrition in infancy has not been as effectively communicated. There are substantial inter states difference in exclusive breast feeding and timely introduction of semi solid food. Too early introduction and too late introduction of supplements to breast fed infants are associated with increased risk of undernutrition and infection. It is therefore hardly surprising that as a result of these faulty infant feeding habits, there is a steep increase in prevalence of undernutrition. It is important to correct these faulty infant feeding practices through nutrition education. If this were done, it will be possible to prevent the steep increase in under nutrition between 6-24 months of age. Recommendations for interventions during the Tenth Plan are • Promotion of exclusive breast feeding in the first six month • Nutrition education for introduction of appropriate low cost, energy dense
complementary food at six months of age • Three monthly monitoring of weight in infancy and childhood • Detection of infants with growth faltering and initiating appropriate steps to
improve their nutritional status. The Goals for the Tenth Plan are • Enhance early initiation of breast-feeding (colostrum feeding) from the
current level of 15.8% (as per NFHS - 2) to 50%. • Enhance exclusive breast-feeding rate for children upto the age of 6
months from the current rate of 55.2% (as per NFHS - 2) to 80%. • Enhance complementary feeding rate at 6 months from the current level of
33.5% (as per NFHS - 2) to 75%.
xv
Growth during childhood
Indian children are smaller at birth, infancy ,childhood and adolescence. As a result their growth trajectories are lower than their developed country counterparts through out childhood, adolescence and as a result body size is smaller in adulthood; however , they do not have any major functional or intellectual impairment. In India growth curves during childhood are used mainly for the purpose of identifying those with signs of growth faltering as early as possible and bring them back to normalcy with appropriate nutrition and health inputs. In view of this, it has been suggested that it might be preferable to utilise data from growth of Indian children to identify children with growth faltering . The relatively small and well defined group of children with moderate and severe under-nutrition can be identified and given appropriate health and nutrition interventions to over come the health hazard associated with moderate and severe under nutrition.
Low dietary intake is associated with short and long term metabolic, biological, genetic, social and behaviourial adaptations. Reduction in physical activity could be behavioural adaptation in children to low energy intake; while this could be considered as a protective adaptation to ensure continuing growth, it may impair the child’s curiosity, exploration or play and hence have adverse consequences on intellectual and social development. Research studies are needed to define adaptation to low dietary intake and its functional consequences . Preschool children
Preschool children constitute one of the most nutritionally vulnerable segment of the population and their nutritional status is considered to be a sensitive indicator of community health and nutrition. Over the last two decades there has not been substantial improvement in energy intake. However over the last two ,decades there has been a clear and substantial reduction in moderate and severe under nutrition in pre school children. Though there has not been any change in the intake of green leafy vegetables and other vegetables, there has been substantial decline in prevalence of nutritional deficiency signs. This is perhaps because of the better access to health care and effective treatment of infections. The decline in fertility and reduction in the higher order births may also have contributed to this because prevalence of severe forms of under nutrition was higher among higher order births. To improve the nutritional status of preschool children and pregnant and lactating women, supplementary nutrition is being provided under the Integrated Child Development Scheme. The scheme was initiated in 1975 in 33 blocks. Over the years, the ICDS coverage has progressively increased and is almost universal now. Under this scheme food supplements are provided to pre-school children between the age of 6 months to 6 years, pregnant and lactating mothers and adolescent girls (in some selected blocks). The food supplements varies widely from ready to eat food prepared elsewhere to supply of supplements cooked in the anganwadi centres.
xvi
Realising the urgent need to prevent onset of undernutrition in the young child through nutrition education and timely introduction of complementary food to children between the age 6 to 36 months the Central Govt. provides Additional Central Assistance under PMGY specifically earmarked for providing take home food supplements for this age group. Under this scheme funds are given to the states to provide take home cereal, pulse and oil seed mixtures to BPL families with children between 6-36 months of age; it is expected that this would result in timely introduction of supplement from 6 months of age and prevent early onset of undernutrition . The programme has been in operation since 2000-01. PMGY guidelines emphasise that all infants and children should be weighed at least once in three months to detect those who are undernourished so that health and nutrition intervention could be undertaken. Even though, growth monitoring is an essential component of ICDS, it has not been operationalized.
To combat under-nutrition in preschool children and pregnant and lactating women, it is necessary to strengthen India's commitment and institutional capacity. The nutrition component of ICDS may be specifically directed to achieve reduction in both micro and macronutrient under-nutrition.
Recommended Tenth Plan interventions to achieve these are Nutrition Sector • Improve food security at community and household level. • Strengthen nutrition and health education component so that there is
appropriate intra-familial distribution of food based on needs. • Focus on reaching 6-24 months children, pregnant and lactating women • Weigh all vulnerable population, pick up those with serious CED and
provide integrated health and nutritional support so that they do recover within next three months.
• Ensure universal screening of all children at least once a quarter to identify children with growth faltering.
• Focused health and nutrition intervention to ensure that children in grade III & IV under-nutrition are in Grade II by the next quarter.
• Look for and treat health problems associated with severe under-nutrition • Enhance quality and impact of ICDS substantially through training,
supervision of the ICDS personnel and improved community ownership of the programme .
• Concentrate on improvement of the quality of care and intersectoral coordination; Strengthen nutrition action by health sector.
• Create nutrition awareness through IEC at all levels (community, women’s group, village level workers, PRI, programme managers and policy makers at State and Central levels).
• Establish reliable monitoring and evaluation mechanism
As moderate and severely undernourished children in the age group 6 months to 6 years can not consume 600 calories in one sitting in Anganwadi, they may have to be provided with take home food supplements. Nutrition Component of PMGY will continue to provide take home food supplements
xvii
because children 6-36 months age can not consume 300 calories in one sitting; Department of WCD will take steps to operationalise Prime Minister's announcement for provision of foodgrains to pregnant women and adolescent girls. There is thus a shift of focus from providing cooked food at anganwadi to take home food supplementation in several categories. Undoubtedly the food supplements provided will be shared with the family but that would add to household food security; careful monitoring of the undernourished individual will go a long way to ensure that the person does get due share from the food supplements provided. This shift may free Anganwadi worker and helper from the routine time consuming task of cooking. They can concentrate on important aspects of screening children/women for under-nutrition/nutrition education and pre-school education of 3-6 year old children as envisaged under ICDS scheme. Health Sector • Invest in upgrading nutritional knowledge and skills of all health care
workers. • Focus on management of health problems in moderately and severely
under nourished children. • Nutrition counseling to parents with sick children • Ensure screening, detection and management of moderate and severe
under-nutrition. • Ensure collaboration between AWW/ANM to improve coverage in 6-24
months children and pregnant women. • Provide nutrition and health education on feeding of infants and young
children by all health care workers. Institutional capability building • Promote advocacy for nutrition among policy makers, programme
implementers, women's groups, PRI etc. • Strengthen country’s capacity for nutrition action, training and research. • Strengthen the network of medical colleges, home science colleges,
centers undertaking nutrition monitoring and nutrition education Research • Operational research to identify and eliminate constraints in the ongoing
programme. • Analysis of nutrition needs at local level and tailoring ongoing nutritional
intervention to meet these needs. Funding of the nutrition component of ICDS Programme
The ICDS programme is a centrally sponsored programme; while the centre bears the cost of maintaining the infrastructure, the expenditure on the food component is borne by the States. With increase in coverage there is increasing need for funds for the food supplements also. Inadequacy of
xviii
funds is one of the major factors responsible for erratic food supply and poor coverage. The funding requirements were calculated for three different scenarios • To provide nutrition @ Re.1/- per day for 300 days in an year to all
pregnant women and children upto 6 years in the BPL families (by Planning Commission)
• To provide nutrition @ Re.1/- per day for 300 days in an year to beneficiaries (72 in no.) as per ICDS norms of 1999 (by Department of WCD)
• To provide double the ration to all severely under nourished children and pregnant women (by Planning Commission)
It was observed that currently in most of the states there are substantial
gaps between the funding needed to provide the food supplements to the target population and the actual funds available which includes that provided by the state plus the amount provided as ACA under nutrition component of PMGY. It is a matter of concern that the states like Bihar where poverty, undenutriton and birth rates are higher are having substantial gaps. However States like Gujarat, Tamil Nadu and Delhi are spending more than required minimum amount. Inspite of this, the nutritional status of children in these states is not better than national average. It would therefore appear that while funding constraints is a problem, effective implementation may be the bottle neck in other states; however the critical role of the family in ensuring intra-familiar food distribution based on needs in prevention of undernutrition cannot be overestimated . Recommendations for interventions during the Tenth Plan are • Persuade states to provide more funds • Optimally utilize funds provided under PMGY • Improve targeting by providing on priority basis available food to those with
undernutrition • Improve health care to undernourished children • Monitor children/women with severe grades of under-nutrition who are
receiving food supplementation and ensure that there is improvement in their nutritional status
Given the current financial constraints, states may find it difficult to increase the amount of funds currently being allocated to the programme. However experience in Orissa has shown that even with the existing outlay it is possible to achieve significant reduction in undernutrition by identifying the children with severe grades of undernutrition and ensuring that they get the required health and nutrition inputs. It is essential that appropriate guidelines for screening all children and identification of those with undernutrition and utilizing the available food supplements to fully meet the requirement of these children on priority basis are drawn up and agreed to by the centre, state, PRI and the community; the PRI and the community should play a major role in ensuring effective implementation of the programme.
xix
MICRONUTRIENT DEFICIENCIES
Goitre due to iodine deficiency, blindness due to Vit A deficiency, dry and wet beriberi, pellagra were major public health problems in the pre independent India. Sustained dietary changes resulted in elimination of beriberi and pellagra. Kerato malacia due to severe Vitamin A deficiency is no longer a public health problem. However, there has not been any decline in the prevalence of anaemia due to iron and folic acid deficiency; the decline in Vit A deficiency and iodine deficiency disorders has been very slow.
It is suggested that during the Tenth Plan a paradigm shift be made from food security to nutrition security to meet the needs of the macro, micro and phyto nutrients through dietary diversification; there will be sustained efforts to reduce/eliminate micronutrient deficiencies including universal salt iodisation to eliminate IDD and multi pronged strategy to reduce the prevalence of anaemia and associated health hazards. Anaemia
In India, prevalence of anaemia is high because of low dietary intake, poor iron and folic acid intake and poor bioavailability of iron in phytate fibre rich Indian diet. Anaemia due to deficiency of other micronutrients like copper, zinc, pyridoxine and vitamin B12 are rare in India. Studies conducted by ICMR and NNMB show that prevalence of anaemia is high (50-90%) in pregnant women and 50-70% in children.
India was the first developing country to take up a National Anaemia Prophylaxis Programme to prevent anaemia in pregnant women and children but still anaemia continues to be a major problem affecting all segments of population and there has not been any substantial decline in the adverse consequences of anaemia. A nation wide survey on anaemia using cyanmeth haemoglobin method is currently under way and will provide data on prevalence of anaemia in pre-school children, pregnant women and adolescent girls. Recommendations for interventions during the Tenth Plan are In view of widespread prevalence of iron and folate deficiency in Indian diets, major efforts may be made to increase iron and folate content of diet and wherever possible to improve bioavailability. This, when sustained over decades would result in substantial reduction in prevalence of anaemia. The major intervention strategies required for prevention and management of anaemia are (a) Improved dietary intake to meet RDA for all macro and micronutrient: Increasing the dietary intake so that it meets the calorie needs will result in increase in dietary intake of iron by one third. (b) Dietary diversification to include iron folate rich foods as well as food stuffs that promote iron absorption. (c) Food fortification including introduction of iron and iodine fortified salt and in specific areas other iron fortified items such as atta. (d) Health and nutrition education to improve over all dietary intakes and
xx
promote consumption of iron and folate rich foodstuffs (e) Among vulnerable groups (such as pregnant women) screening for early detection of anaemia. Recommended strategies for different age groups Infants • Exclusive breast feeding for six months, and introduction of green leafy
vegetables along with cereal/pulse /oilseed mix at sixth month for prevention of anaemia
• Screening for anaemia in pre term, low birth weight infants and those with growth faltering and repeated episodes of infection
• Appropriate treatment for anaemic infants Preschool children • Advocacy with regard to dietary diversification for prevention of anaemia. • All growth retarded children and those with repeated infections should
have Hb estimation carried out • Those found to be anaemic to be provided with appropriate treatment. School children • Operational research to assess the feasibility of at least once a year
screening for detection and correction of anaemia in school children as a part of school health check up needs to be explored.
• Mechanism to cover out of school children among whom anemia is likely to be more prevalent. Efforts may have to be made to explore mechanism for prevention, detection and management of anaemia in this group.
• Improvement of sanitation and IEC to not walk barefoot • Treat children giving history of passing worms with broad spectrum
antihelminthics • Screening all anaemic children for hookworm infestation and treating
them
Adolescents Wherever possible (such as school health check up) attempts be
made to screen adolescent girls especially those who are undernourished or have menstrual problems for anaemia and provide appropriate treatment. Adolescents who are pregnant should receive very high priority for screening and management of anaemia. Pregnant women
The multipronged strategy for control of anaemia in pregnancy include: a) fortification of common food stuffs with iron to increase dietary intake of iron and improve hemoglobin status of the entire population including girls and women prior to pregnancy, b) screening of all pregnant women using a reliable method of hemoglobin estimation for detection of anemia, c) oral iron folate prophylactic therapy for all non-anemic pregnant women (hemoglobin more than 11 g/dl) d) iron folate oral medication at the maximum tolerable dose throughout pregnancy for women with hemoglobin level between 8 and 11 g/dl, e) parenteral iron therapy for women with hemoglobin
xxi
level between 5 and 8 g/dl if they do not have any obstetric or systemic complication, f) hospital admission and intensive personalised care for women with hemoglobin less than 5 g/dl , g) screening and effective management of obstetric and systemic problems in all anemic pregnant women, and h) improvement in health care delivery systems and health education to the community to promote utilisation of available care. Elderly people • Research studies to assess the extent of the problem in this group need to
be undertaken on a priority basis. • Mount an appropriate intervention programme based on the findings Research and development • Evaluate safety, efficacy, acceptability and cost effectiveness of double
(iodine and iron) fortified salt so that decisions regarding universal double fortification of salt and its supply through TPDS system could be taken.
• Evaluate safety, feasibility, efficacy and cost effectiveness of fortifying food items like atta with iron can also be investigated .
Monitoring and Surveillance • Strengthening routine reporting under RCH Programme to include
percentage of pregnant women in whom haemoglobin estimation has been done, percentage anaemic, %given IFA tablets, compliance in IFA intake and the percentage given parenteral iron therapy.
• Requesting PRIs, Women Self Help Groups and AWW to monitor intake of IFA tablets.
• Evaluating the ongoing process and impact • Including questions regarding haemoglobin estimation, IFA coverage and
completeness of taking IFA tablets as a part of the Rapid household surveys.
• Collect information on prevalence of anaemia in pregnancy, childhood , adolescents and elderly as and when large scale surveys are done e.g. RHS or NFHS, so that it is possible to asses the impact of ongoing interventions.
Tenth Plan goals include • Screening of children for anaemia wherever required and is feasible; and
appropriate treatment of those found anaemic. • Universal screening of pregnant women for anaemia and appropriate
treatment • Reducing prevalence of anaemia by 25 % in children, pregnant and
lactating women and adolescents.
xxii
Iodine Deficiency Disorders Iodine deficiency disorders (IDD) have been recognised as a public health problem in India since mid nineteen twenties Unlike other micronutrient deficiencies, IDD is due to deficiency of iodine in water, soil and foodstuffs and affects all socioeconomic groups living in defined geographic areas. Initially, IDD was thought to be a problem in sub-Himalayan region. However, surveys carried out subsequently showed that IDD exists even in riverine and coastal areas. No State in India is completely free from IDD. It is estimated that 61 million population are suffering from endemic goitre and about 8.8 million people have mental/motor handicap due to iodine deficiency. Universal use of iodised salt is a simple inexpensive method of preventing IDD. Following the successful trial of iodized salt in the Kangra Valley, Himcahal Pradesh, a National Goitre Control Programme (NGCP) was launched by the Government of India in 1962. Initially the programme aimed at providing iodised salt to the well-recognized sub-himalayan ‘goiter’ belt. However due to erratic availability of salt, availability of cheaper non-iodised salt, lack of awareness regarding need to use iodised salt, there was no substantial reduction in IDD. In view of the fact that no State was free of IDD, a decision was taken for universal iodisation of salt for human consumption, which was implemented in a phased manner from 1986. The progress in implementation of this programme was tardy, as production and availability of iodised salt was a fraction of what was required. In August 1992, the NGCP was renamed as National Iodine Deficiency Disorders Control Programme (NIDDCP) taking into its ambit control of wide spectrum of IDD with the goal to reduce the prevalence of IDD below 10% in endemic districts of the country. Based on the recommendations of the Central Council of Health, the Govt. took a policy decision to iodise the entire edible salt in the country by the year 1992. There has been a steady progress in the production of iodized salt over the past few years in India. Recommendations for interventions during the Tenth Plan are
It is essential to ensure that only iodised salt is made available for human consumption in order to enable the children of the 21st century to attain their full intellectual potential and take their rightful place in a knowledge based society. Efforts to improve the quality of iodised salt will include: • Mandatory certification of adequacy of iodisation as a pre-requisite for
getting priority for transportation of salt. • Ensuring that the salt is packed in ½-1 kg consumer poly pack at
production site to prevent deterioration in quality during transportation and storage.
• Periodic checking of iodine content of salts available at wholesale/retail outlets.
• Quality check at household level through anganwadi/school based testing using salt iodine test kit.
xxiii
IEC to increase demand for good quality iodised salt will have to continue. Efforts to reduce price differentials between iodised and non-iodised salt and provide ready access to iodised salt through Targeted Public Distribution System will have to be considered. Monitoring of production , distribution , quality of salt at various levels, along with studies on prevalence of goitre among school children, urinary iodine excretion status, thyroid status of school children, neonatal thyroid status by appropriate screening techniques , may be used for assessing the progress. In areas wherever adequate iodised salt is available and used but IDD prevalence continues to be high, the possible role of goitrogens may have to be investigated Tenth Plan goals are • Achieve universal access to iodised salt. • Generate district-wise data on iodised salt consumption • Reduction in prevalence of IDD in the country to less than 10% by 2010. Vitamin A Deficiency
Vitamin A is an important micronutrient for maintaining normal growth, regulating cellular proliferation and differentiation , controlling development, for maintaining visual and reproductive functions. Diet surveys have shown that the intake of vitamin A is significantly lower than the recommended daily allowance in young children, adolescent girls and pregnant women. In these vulnerable sub groups multiple nutritional problems coexist including inadequate intake of energy as well as of micronutrients other than vitamin A . Inspite of the fact that there has not been any significant improvement in the dietary intake of vitamin A and coverage under massive dose vitamin A programme has been low, there is an unambiguous evidence of appreciable decline in clinical vitamin A deficiency in under five children in the country. This could perhaps be due to increase in access in health care, consequent reduction in severity and duration of common childhood morbidity due to infections.
Recommendations for interventions during the Tenth Plan are Clinical vitamin A deficiency often coexist with other micronutrient deficiencies and hence there is a need for broad based dietary diversification programmes aimed to improve the overall micronutrient nutritional status of the population. In addition the ongoing massive dose vitamin A supplementation programme in 9-36 months old children will be continued and its implementation strengthened. Research studies may have to be taken up during the Tenth Plan to identify:
• Vitamin A rich food stuffs – conventional as well as non-conventional • Functional decompensation associated with vitamin A deficiency in various
stages in different age, physiological status groups • Time trends in prevalence of sub clinical and clinical vitamin A deficiency
in different regions.
xxiv
Recommended strategies in specific groups are indicated below Infancy • Health and nutrition education to encourage ¾ Colostrum feeding ¾ Exclusive breast feeding for the first six months ¾ introduction of complimentary feeding including mashed greens and
yellow/orange fruits/vegetables at six months will be taken up ¾ 100,000 IU of dose Vitamin A will be given at 9 months along with
measles vaccines. • Every effort will be made to ensure early detection and prompt treatment
of infections. Childhood • Ensure adequate intake of vitamin A rich food throughout childhood. • Early detection and prompt treatment of infections. • Massive dose vitamin A administration at 18,24,30 & 36 months of age. In
order to improve coverage without too many logistic problems these four doses are to be administered by Anganwadi worker during April & October each year (pre summer/pre winter period) under the supervision of ANM.
Sick Children • All children with xerophthalmia should be given two doses of synthetic
vitamin A as per present schedule of the Government of India under the RCH programme.
• All Children suffering from measles should also be given one dose of vitamin A, if they have not received it during the previous one month.
• All cases of severe protein energy malnutrition (based on weight for age criteria or clinical signs) should be given one additional dose of vitamin A.
Pregnant and Lactating Women • Include detection and management of vitamin A deficiency as a
component of antenatal care. • ANM to Identify women with symptoms/signs of night blindness and Bitot’s
spot and administer 10,000 IU of vitamin A daily for the next four weeks. • Take up promotion of cultivation and consumption of micro nutrient rich
vegetables. Goals for the Tenth Plan • Achieve universal coverage for each of the five doses of vitamin A
under the National prophylaxis programme for nutritional blindness • Reduce prevalence of night blindness to below 1.0% and that of Bitot
Spots to below 0.5% in children between 6 months to 6 years of age • Eliminate vitamin A deficiency as a public health problem.
xxv
Dietary improvement and diversification
There are three approaches for combating micronutrient deficiencies: medicinal supplementation, food fortification and dietary diversification and increased intake of micronutrient-dense foods. The first two approaches can take care of only one or two nutrients. For long-term sustainability and ensuring adequate intake of all deficient nutrients and phytochemicals, dietary diversification is the most appropriate option. Availability , affordability access and awareness are some of the major determinants of sustained dietary diversification in families and communities. This can be made possible through community effort for increased production of micronutrient- dense foods and reduced wastage through appropriate processing; it can be linked to income generation, particularly for the rural women. Supplementary feeding programmes such as ICDS, and mid-day meal programme could use locally produced millets, fruits and vegetables given as community’s contribution to improve intake of micronutrients. It is important to update and expand available data on micro and phyto nutrient content of conventional and unconventional food stuffs so that optimal use is made of the country’s rich diverse plant resources to eliminate micro nutrient deficiencies. . Research
India is one of the pioneers in nutrition research not only in the Asian region but also in the world. Several research institutions and universities are carrying out the research studies with assistance from ministries and research funding agencies such as ICAR, ICMR, CSIR, DBT and DST. Basic, clinical, applied and operational research studies carried out in the country have identified major nutritional problems in the country, their aetiology, appropriate remedial and preventive measures to tackle the problem and the modalities of effectively operationalising the intervention programme at the regional and national level. Initially the focus of research was on deficiency diseases and chronic energy deficiency - health hazards associated with them, methods for detection, treatment and prevention. It is noteworthy that the major intervention programmes such as food supplementation programmes, anaemia prophylaxis programme, massive dose vitamin A supplementation programme have all been initiated on the basis of research work carried out in the country. During the last two decades responding to the changing spectrum of nutrition related disorders, research studies on food and drug toxins and nutritional risk factors associated with noncommunicable diseases have been initiated.
It is recommended that basic, clinical, applied operational and socio - behavioral research in nutrition may continue to receive priority attention during the Tenth Plan period so that the country can effectively and rapidly tackle the nutritional and associated health problems. Net working of the research institutions and universities carrying out research studies in nutrition may be attempted, so that there is no unnecessary duplication of efforts and
xxvi
the available resources are fully utilised. Research priorities have been indicated under each of the major areas. Priority areas for Research in Nutrition include • Nutritive value of food stuffs - for macro , micro and phyto nutrients using
newer techniques; analysis of uncommon food stuffs for their nutritive value
• Food safety including food contaminants, adulterants and genetically modified food stuffs
• Dietary intake and nutritional requirement of Indians • Evolving and testing better tools for assessment of nutritional status,
evolving appropriate norms for assessing nutritional status of Indians and assessing determinants of nutritional status
• Nutritional status and health – epidemiological data on health consequences of deviation from the norm
• Nutrition-fertility, nutrition-infection interaction • Micronutrient deficiencies and their health consequences • Changing dietary habits and lifestyles and their impact on obesity and
noncommunicable diseases • Increasing longevity-nutritional implications • Clinical nutrition including nutritional management during illness and
nutritional rehabilitation • Emerging changes in nutritional status due to changing ecology,
agriculture, life style and social policy. • Effectiveness of nutrition intervention on health, nutritional benefit and cost
of different interventions. • Socio-behavioural research-lifestyle modifications IECM to the
population to alter lifestyles • Operational research to improve efficiency of implementation on-going
programmes Nutrition Monitoring
Nutrition monitoring refers to repeated measurements of changes in the nutritional status at regular intervals, of populations or individuals over a period of time. India is a vast and varied country. There are huge differences in percapita income, purchasing power, availability of food stuffs, dietary habits; lifestyle and nutritional status between states, districts within the state, urban, rural and tribal population. Country is currently undergoing demographic, economic, social, educational, agricultural and health transition all of which can modify nutritional status. Sound reliable data is needed for appropriate, decentralised planning and monitoring of interventions to meet the local needs. It is important therefore, to strengthen, streamline and effectively utilise the existing mechanisms for monitoring nutritional status of the population. National Nutrition Policy envisaged building up “regular monitoring and surveillance system and develop reliable database in the country not only to assess the impact of ongoing nutrition and development
xxvii
programs but also to serve as an early warning system for initiating prompt action." Both ICDS and the health functionaries regularly file monthly progress reports, which are collated and reported. However there are lacunae and delays at the levels of collection, reporting, collation, analysis and reporting. Monthly progress reports are not utilized for district level monitoring and midcourse correction of the ongoing programmes. At the request of the Department of Women and Child Development, the National Institute of Nutrition has carried out a study in Andhra Pradesh during the Ninth plan for improving the monthly progress reports of the ICDS workers and improving monitoring of ICDS programme at district level. The data from the study indicated that it was possible to train and orient the ICDS functionaries to improve the quality and timeliness of the reporting. Analysis of the data and discussions on the implications of the reports with the functionaries facilitated the implementation of midcourse corrections and led to improvement in performance.
Data from the Andhra Pradesh study depicted as Geographical Information System (GIS) mapping showed that the data generated by AWW is useful for monitoring the block and district situation and could over time be useful for building up a database for nutritional surveillance. Orissa had utilized `routine’ reporting of ICDS workers for block-wise GIS mapping of the severe and moderate under-nutrition in 0-6 years age groups. The GIS maps clearly brought out trends in under-nutrition in different areas, different seasons and in different age groups. Meghalaya, Rajasthan, Maharashtra, Madhya Pradesh and Karnataka have initiated projects to improve nutrition monitoring, mapping and surveillance.
As part of efforts to monitor the nutritional component of the PMGY initiative, Planning Commission in collaboration with the Dept of WCD has drawn up a proforma for assessment and reporting of nutritional status of children under five years of age. The DWCD has incorporated this proforma as a part of the monthly ICDS reporting format. Both DWCD and Planning Commission have requested the State DWCD Secretaries to ensure that the data is compiled district wise (in two age groups, gender specific) and reported every month and monitored at the district, state and central levels. Both DWCD and Planning Commission have requested the Chief Secretaries of the States to monitor nutritional status of children in their monthly development reviews.
The nutritional status is also being monitored through independent surveys conducted at different time points. Indian Council Of Medical Research established the National Nutrition Monitoring Bureau (NNMB) in 1972 to provide information on nutritional status of all age groups of both sexes. NNMB is involved in data collection on actual intakes of families, and individuals belonging to different physiological and age groups, in different states, assesses intra-family distribution of food and nutrients, generates data periodically on diet and nutritional status of socially vulnerable groups of population like the tribals living in the integrated tribal development project
xxviii
areas, and the population at-risk physiologically like elderly population and adolescents and organizes repeat surveys to assess time trends in diet and nutritional situation. The Food and Nutrition Board of Department of Women and Child Development (WCD) conducted nutrition survey in 1993-94 in 187 districts of the country. The report was published in 1998. This was a one-time effort. The National Family Health Survey (NFHS) has undertaken height and weight measurement in a representative sample of children and women at state level. NFHS (I&II) provides state level estimates of under nutrition and comparable state level estimates at two time points i.e. 1992-93 & 1998-99. Every five years NSSO collects and reports the information on expenditure on food at family level in representative sample population all over the country. Recommendations for interventions during the Tenth Plan are • Improve coverage and quality of weight measurement and reporting of
under-nutrition in all ICDS blocks. Currently it is estimated that only about 20% of the children under five are weighed; improvement in coverage for taking weight will result in better detection of growth faltering, focused interventions for improvement in nutrition and health status of the children with severe grades of under-nutrition.
• Screen all under fives at least four times a year to identify all under-nourished children in the community and initiate targeted intervention.
• Follow up all those with severe grades of under nutrition and enable the districts to respond appropriately to the local situation regarding under-nutrition.
• Use the data generated at block and district level for: ¾ Monitoring ICDS activities in terms of reduction in under-nutrition ¾ Assessing impact of ongoing nutrition interventions ¾ Planning appropriate midcourse correction in the ongoing ICDS
programme ¾ Building up database for nutritional surveillance in vulnerable
groups • Extend nutrition surveys to all states using appropriate sample population. Nutrition Surveillance The nutrition surveillance system (NSS) provides information on nutrition status, its spatial distribution, causes, and changes in prevalence/incidence over time, the actions initiated to correct existing problems and their impact. The National Nutrition Policy 1993 recommended development and establishment of "nutritional surveillance of the country's population, especially children and mothers” in the country by the year 2000; NSS is yet to be fully developed.Currently there are three monitoring systems, which provide the essential core information that could be developed into full-fledged nutrition surveillance during the Tenth Plan period through appropriate coordination. These are the nutrition monitoring through ICDS System, the NNMB-NSSO data bases and the Pilot project on Food insecurity and vulnerability under the Dept of Food and Public Distribution. Department of WCD will ensure improvement in quality of data being collected by the ICDS functionaries. NNMB will be expanded through
xxix
appropriate arrangements to cover all the states and carry out regular surveys on dietary consumption and to assess macro and micro nutrient nutritional status and morbidity profile; special efforts will be made to cover at risk groups. Over time it may be desirable to integrate data on rainfall, food production, food distribution, vital statistics and disease surveillance and other developmental indicators related to early warning system.
1
CHAPTER –I
INTRODUCTION Nutrition has to be looked upon as an important and vital aspect of human development. At the time of Independence the country faced two major nutritional problems - one was the threat of famine and acute starvation due to low agricultural production and lack of appropriate food distribution system. The other was chronic energy deficiency due to low dietary intake because of poverty and low purchasing power; high prevalence of infection because of poor access to safe-drinking water, sanitation and health care and poor utilisation of available facilities due to low literacy and lack of awareness. Chronic energy deficiency, kwashiorkor, marasmus, goitre, beriberi, blindness due to Vitamin-A deficiency and anaemia were major public health problems. The country adopted multi-sectoral, multi-pronged strategy to combat these and to improve nutritional status of the population. Constitution of India (Article 47) states that the State shall regard raising the level of nutrition and standard of living of its people and improvement in public health among its primary duties. Successive Five Year Plans laid down the policies and strategies for achieving these goals.
Green revolution ensured that in India, increase in food production
stayed ahead of the increase in population. The country has moved from chronic shortages to an era of surplus and export in most of the foodstuffs. The country is self sufficient in food grain production and currently there is a buffer stock of over 60 million tons. Along with the steps to ensure adequate production, initiatives were taken to ensure that the foodstuffs of right quality and quantity reach the right places and persons at the right time and were available at the right cost. Over the years, there has been improvement in access to food through PDS; food for work programme has addressed the needs of the vulnerable out of work persons. ICDS programme aimed at
Initiatives during the last five decades to improve nutritionalstatus of the population include:
• Increasing food production- building buffer stocks • Improving food distribution- building up of the PDS • Improving household food security through
¾ Improving purchasing power ¾ Food for work programme ¾ Direct or indirect food subsidy
• Food supplementation to address special needs of thevulnerable groups
• Nutrition education especially through Food and NutritionBoard and Integrated Child Development Services
• Efforts of the health sector to tackle ¾ Adverse health consequences of undernutrition ¾ Adverse effects of infection and unwanted fertility on
nutritional status ¾ Micronutrient deficiency and their health
consequences
2
providing food supplementation and health care for the most vulnerable groups, the mothers and children, covers over 80% of all blocks in the country. Mid-day meal programme aims at improving dietary intake and reduction in the school drop out rates. There has been substantial improvement in access to health care. National programmes for tackling anaemia, iodine deficiency disorders and Vitamin-A deficiency have been implemented. As a result of all these interventions there has been substantial reduction in moderate and severe under-nutrition in children and some improvement in nutritional status of all segments of population. Kwashiorkor, marasmus, pellagra, lathyrism, beriberi and blindness due to severe Vitamin-A deficiency have become rare.
However, several challenges remain. Even today, sizeable segments
of the poor population are not having access to adequate foodstuffs and nutritional security eludes families and individuals. Inspite of huge buffer stocks, 8% of Indians do not get two meals a day and there are pockets where severe under-nutrition takes their toll even today. While mortality has come down by 50% and fertility by 40%, reduction in under nutrition is only 20%. About half of the pre-school children suffer from under-nutrition. Every third child born is under weight. Low birth weight is associated with higher infant mortality and long-term health consequences such as increased risk of non-communicable diseases. Vitamin deficiencies and micronutrient deficiencies are widespread. More than half of the women and children are anaemic; reduction in Vitamin A deficiency and IDD are sub-optimal. Under-nutrition associated with HIV/AIDS is an emerging public health problem. Alterations in the life styles and dietary intake have led to increasing prevalence of obesity and associated non-communicable diseases. In the new century, the country will have to gear itself to prevent and combat the dual burden of under and over-nutrition and associated health problems. It is estimated that in order to meet the needs of the growing population, the country will have to produce extra 5 million tonnes of food grains annually and also achieve significant increase in production of livestock, fish and horticultural products. This has to be achieved through suitable strategies to tackle current problems of shrinking arable land, farm size, low productivity, growing regional disparity and depletion of natural resource base. In addition, appropriate steps have to be taken to minimize potential adverse consequences of globalization on domestic production, employment and price stability all of which affect nutritional security of the population.
Major nutrition related public health problems to be tackled in the Tenth Plan are: • Chronic energy deficiency and undernutrition • Micro-nutrient deficiencies (a) Anaemia due to iron and folate deficiency (b) Vitamin A deficiency (c) Iodine Deficiency Disorders • Chronic energy excess and obesity
3
In order to review the progress upto and during the Ninth Plan and
recommend appropriate policies, strategies and programmes for improving the nutritional status of the population during the Tenth Plan, Planning Commission constituted a Steering Committee on Nutrition (office order constituting the committee is in Annexure-1.1) with the following terms of reference:
1. To assess magnitude of
a) macro and micro nutrient under-nutrition and associated health
problems; b) emerging problems of over-nutrition and obesity and associated
health problems in different segments of population in different regions of the country;
c) problem of food contamination /adulteration and associated health hazard.
2. To assess the progress achieved to intervention strategies aimed at reduction of these problems, review the findings of evaluation studies and suggest remedial actions, if any, to effect desired improvements.
3. Based on the review, draw up priority areas of intervention, strategies and programmes required during the Tenth Plan Period, taking into consideration the overall development perspective and the need to provide nutrition security and improve nutritional and health status of the population with specific reference to poorer segments.
4. To suggest institutional mechanism for nutritional monitoring and surveillance, legislation, if any, required for improving nutritional status.
5. To define mechanism for improving the implementation through inter-sectoral coordination between various Central and State Departments and collaboration among Government, Voluntary and Private Organisations, the Panchayati Raj Institutions and the Community.
The Steering Committee met twice. The first meeting of the Steering
Committee chaired by the Member (Nutrition) was held on 7.2.2001. During the first meeting, the members of the Steering Committee were requested to suggest broad areas, which would require inputs and recommendations from the two Working Groups (Working Group on Improving Nutritional Status of the Population with Special Focus on Vulnerable Groups; Working Group for Improving Micronutrient Nutritional Status of the Population). They were also requested to send a note indicating their views and suggestions on each of the terms of reference of the Steering Committee.
The second meeting was held on 2nd August 2001 under the
Chairmanship of Member (Nutrition). The reports and recommendations of both the Working Groups were presented to the Steering Committee. These were discussed in detail. The two Working Groups had made recommendations regarding goals for the Tenth Plan. Since nutrition is a
4
multi-sectoral problem, the Steering Committee recommended that the nodal Department of Women & Child Development takes into account the goals set in the related sectors such as agriculture, food distribution, health and family welfare and ensure that the goals set for the Tenth Plan by the Steering Committee on Nutrition is in harmony with the goals set by the individual Departments implementing the programmes. It was also recommended that in view of the massive interstate differences in the nutritional status of the population especially the vulnerable groups, it is important that state specific goals are set, taking into account the current status and expected levels of achievements and the national goals are derived from the state specific goals. Planning Commission and Department of WCD worked out the State specific and the national goals for 2007 taking into account the current status. Secretary (DWCD) organized a meeting of the concerned departments and also the experts in the field on 21.11.2001 and after detailed discussions, the Tenth Plan goals were finalized.
5
Annexure-1.1
No. 2(10)/2000-H&FW Government of India
Planning Commission (Health, Family Welfare & Nutrition Division)
Yojana Bhavan, Sansad Marg,
New Delhi-110001 6th December, 2000
ORDER
Subject : Steering Committee on Nutrition In the context of formulation of the Tenth Five Year Plan (2002-2007) it has been decided to set up a Steering Committee on Nutrition. The committee will look into the aspects of improving food security, improving nutritional status of all age groups and prevention, detection and management of micro nutrient deficiency. The composition of the Steering Committee is as under: K.Venkatasubramaniam Chairman Member(Health) Planning Commission, New Delhi-110001 Secretary Member Department of Women & Child Development Shastri Bhavan, New Delhi-110001 Secretary Member Department of Health Nirman Bhavan, New Delhi-110011 Secretary Member Department of Family Welfare Nirman Bhavan, New Delhi-110011 Secretary Member Department of Agriculture & Co-operation Krishi Bhavan, New Delhi-110001 Secretary Member Department of Rural Development Udyog Bhavan, New Delhi-110011 Secretary Member Department of Public Distribution, Krishi Bhavan, New Delhi-110001 Secretary Member Department of Tribal Affairs, Ministry of Tribal Affairs,

6
Shastri Bhavan, New Delhi-110001 Commissioner-cum-Secretary, Member Department of Women & Child Development, Govt. of Bihar, New Secretariat, Patna-800015 Secretary Member Department of Women & Child Development, Govt. of Uttar Pradesh, Sachivalaya Bhavan, Lucknow-226001 Secretary Member Department of Women & Child Development, Govt. of Jammu & Kashmir, Srinagar-190001 Director General Member DGHS, Ministry of Health & Family welfare Nirman Bhavan, New Delhi-110011 Director General Member ICMR, Ansari Nagar, New Delhi-110029 Dr. C. Gopalan Member President Nutrition Foundation of India C-113, Qutub Institutional Area, New Delhi-110016 Dr. M.S.Swaminathan Member M.S.Swaminathan Research Foundation 3rd Cross Street Taramani Institutional Area, Chennai-600113 Dr.Banoo Coyaji Member KEM Hospital Research Centre, Rastha Peth, Pune-411011 Dr. V.Prakash Member Director, CFTRI, Mysore-570013 Dr. Indira Chakravarty, Member Dean, All India Institute of Hygiene and Public Health, Calcutta-700073 Dr. Shanti Ghosh Member 5, Aurobindo Marg
7
New Delhi-110067 Dr. B.K.Tiwari Member Adviser(Nutrition) DGHS, Ministry of Health & Family Welfare Nirman Bhavan, New Delhi-110011 Mrs. T. K.Sarojini Member Adviser (Social Welfare) Planning Commission, New Delhi-110001 Dr.(Mrs)Prema Ramachandran Member Secretary Adviser (Nutrition) Planning Commission, New Delhi-110001 TERMS OF REFERENCE 2. The terms of reference of the committee will be as follows:
i) To assess magnitude of
a) macro and micro nutrient under nutrition and associated health problems;
b) emerging problems of over-nutrition and obesity and associated health problems indifferent segments of population in different regions of the country;
c) problem of food contamination /adulteration and associated health hazard.
ii) To assess the progress achieved to intervention strategies aimed at reduction of these problems, review the findings of evaluation studies and suggested remedial actions, if any, to effect desired improvements. iii) Based on the review, draw up priority areas of intervention, strategies and programmes required during the Tenth Plan Period taking into consideration the overall development perspective and the need to provide nutrition security and improve nutritional and health status of the population with specific reference to poorer segment. iv) To suggest institutional mechanism for nutritional monitoring and surveillance, legislation if any required for improving nutritional status. v) To define mechanism for improving the implementation through intersectoral coordination between various Central and State Departments and collaboration among Government, Voluntary and Private Organisations, the Panchayati raj Institutions and the Community.
3. The Chairman of the Steering Committee, if deemed necessary, may constitute sub-groups and also co-opt additional members.

8
4. The Steering Committee may submit the report by 30th April, 2001. 5. The TA/DA of non-official members will be paid by the Planning Commission as admissible under Government rules. The TA/DA of official members would be paid by the respective Government Departments/Institutions where they belong.
(T.R. Meena) Deputy Secretary (Administration)
Copy forwarded to the Chairman and the Members of the Steering Committee.
Copy also forwarded to:
1. PS to Deputy Chairman, Planning Commission 2. PS to Minister of State for Planning & Programmes
Implementation 3. PS to Member (Health) 4. PS to Member Secretary 5. PS to Special Secretary 6. Advisors, Planning Commission 7. Pay and Accounts Officer, Planning Commission 8. Under Secretary (Admn.)
(T.R Meena) Deputy Secretary (Administration)
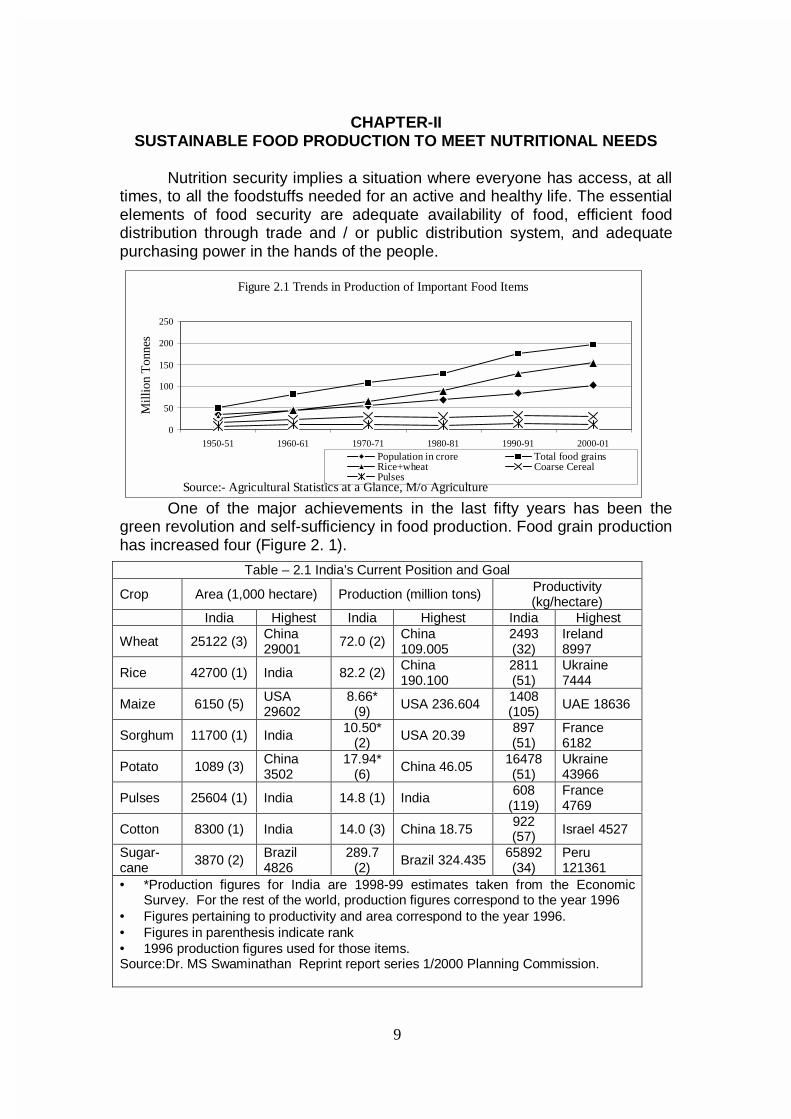
9
CHAPTER-II SUSTAINABLE FOOD PRODUCTION TO MEET NUTRITIONAL NEEDS
Nutrition security implies a situation where everyone has access, at all times, to all the foodstuffs needed for an active and healthy life. The essential elements of food security are adequate availability of food, efficient food distribution through trade and / or public distribution system, and adequate purchasing power in the hands of the people.
One of the major achievements in the last fifty years has been the green revolution and self-sufficiency in food production. Food grain production has increased four (Figure 2. 1).
Table – 2.1 India’s Current Position and Goal
Crop Area (1,000 hectare) Production (million tons) Productivity (kg/hectare)
India Highest India Highest India Highest
Wheat 25122 (3) China 29001 72.0 (2) China
109.005 2493 (32)
Ireland 8997
Rice 42700 (1) India 82.2 (2) China 190.100
2811 (51)
Ukraine 7444
Maize 6150 (5) USA 29602
8.66* (9) USA 236.604 1408
(105) UAE 18636
Sorghum 11700 (1) India 10.50* (2) USA 20.39 897
(51) France 6182
Potato 1089 (3) China 3502
17.94* (6) China 46.05 16478
(51) Ukraine 43966
Pulses 25604 (1) India 14.8 (1) India 608 (119)
France 4769
Cotton 8300 (1) India 14.0 (3) China 18.75 922 (57) Israel 4527
Sugar-cane 3870 (2) Brazil
4826 289.7
(2) Brazil 324.435 65892 (34)
Peru 121361
• *Production figures for India are 1998-99 estimates taken from the Economic Survey. For the rest of the world, production figures correspond to the year 1996
• Figures pertaining to productivity and area correspond to the year 1996. • Figures in parenthesis indicate rank • 1996 production figures used for those items. Source:Dr. MS Swaminathan Reprint report series 1/2000 Planning Commission.
Figure 2.1 Trends in Production of Important Food Items
0
50
100
150
200
250
1950-51 1960-61 1970-71 1980-81 1990-91 2000-01
Mill
ion
Ton
nes
Population in crore Total food grainsRice+wheat Coarse CerealPulses
Source:- Agricultural Statistics at a Glance, M/o Agriculture
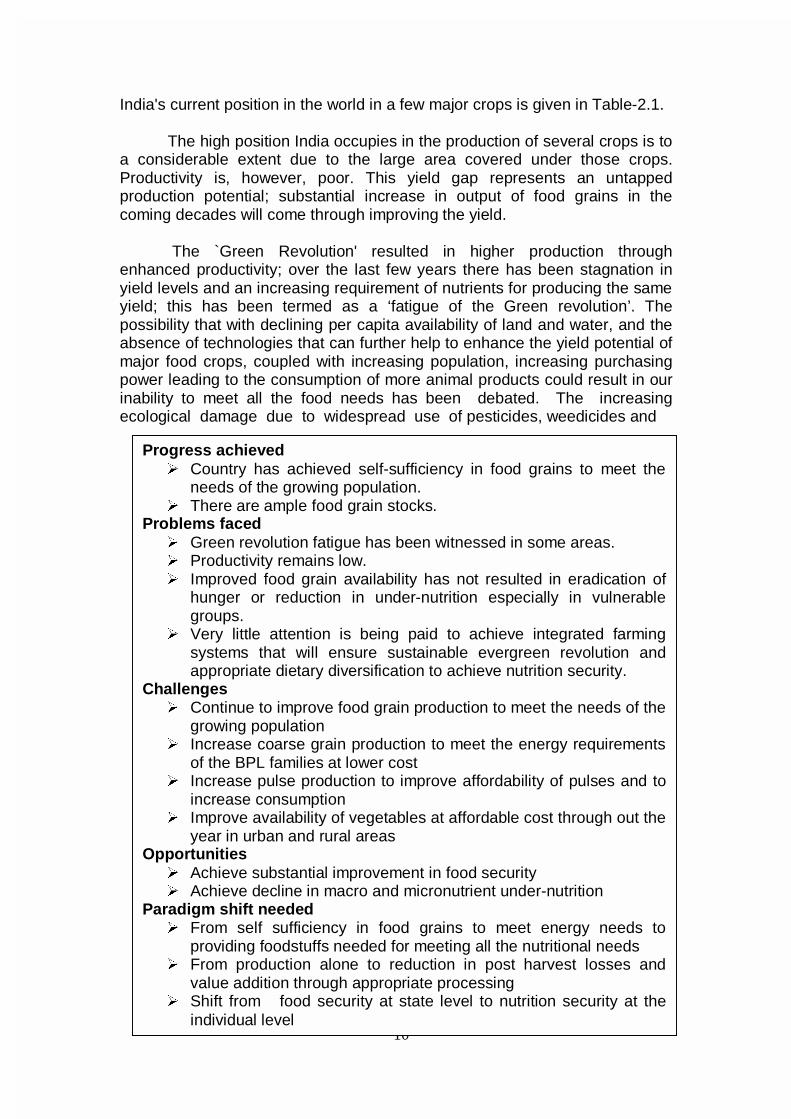
10
India's current position in the world in a few major crops is given in Table-2.1.
The high position India occupies in the production of several crops is to
a considerable extent due to the large area covered under those crops. Productivity is, however, poor. This yield gap represents an untapped production potential; substantial increase in output of food grains in the coming decades will come through improving the yield.
The `Green Revolution' resulted in higher production through
enhanced productivity; over the last few years there has been stagnation in yield levels and an increasing requirement of nutrients for producing the same yield; this has been termed as a ‘fatigue of the Green revolution’. The possibility that with declining per capita availability of land and water, and the absence of technologies that can further help to enhance the yield potential of major food crops, coupled with increasing population, increasing purchasing power leading to the consumption of more animal products could result in our inability to meet all the food needs has been debated. The increasing ecological damage due to widespread use of pesticides, weedicides and
Progress achieved ¾ Country has achieved self-sufficiency in food grains to meet the
needs of the growing population. ¾ There are ample food grain stocks.
Problems faced ¾ Green revolution fatigue has been witnessed in some areas. ¾ Productivity remains low. ¾ Improved food grain availability has not resulted in eradication of
hunger or reduction in under-nutrition especially in vulnerablegroups.
¾ Very little attention is being paid to achieve integrated farmingsystems that will ensure sustainable evergreen revolution andappropriate dietary diversification to achieve nutrition security.
Challenges ¾ Continue to improve food grain production to meet the needs of the
growing population ¾ Increase coarse grain production to meet the energy requirements
of the BPL families at lower cost ¾ Increase pulse production to improve affordability of pulses and to
increase consumption ¾ Improve availability of vegetables at affordable cost through out the
year in urban and rural areas Opportunities ¾ Achieve substantial improvement in food security ¾ Achieve decline in macro and micronutrient under-nutrition
Paradigm shift needed ¾ From self sufficiency in food grains to meet energy needs to
providing foodstuffs needed for meeting all the nutritional needs ¾ From production alone to reduction in post harvest losses and
value addition through appropriate processing ¾ Shift from food security at state level to nutrition security at the
individual level
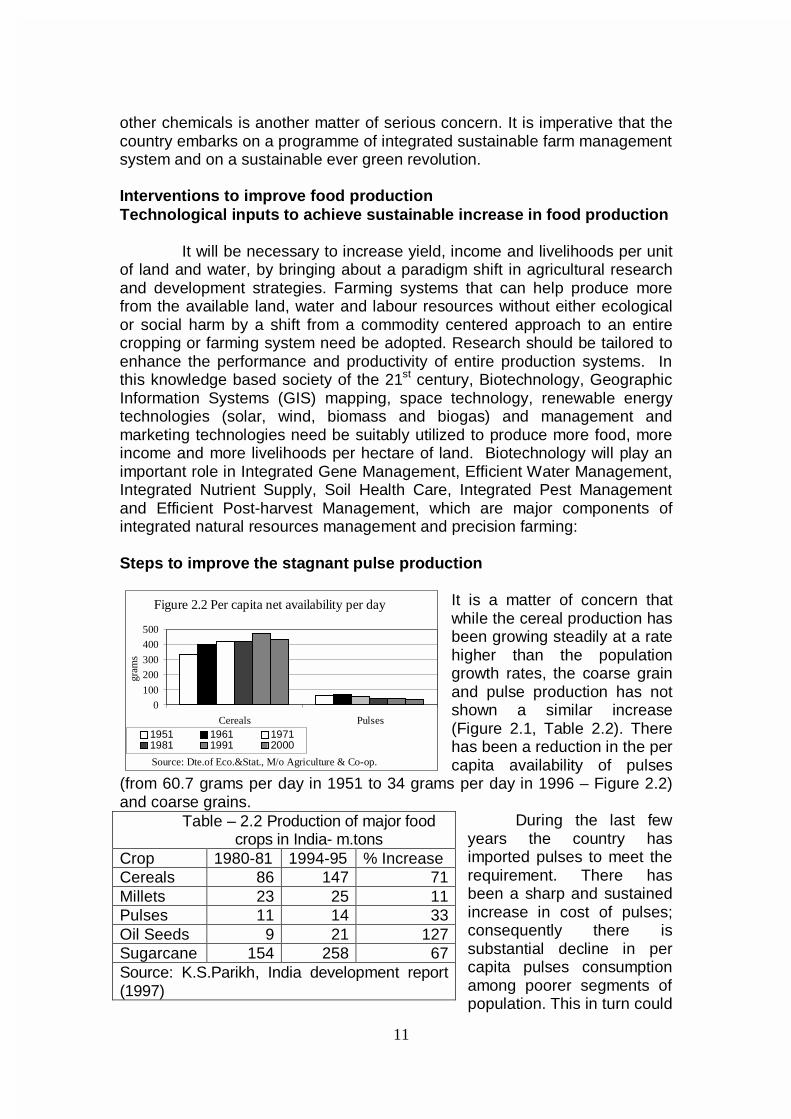
11
other chemicals is another matter of serious concern. It is imperative that the country embarks on a programme of integrated sustainable farm management system and on a sustainable ever green revolution. Interventions to improve food production Technological inputs to achieve sustainable increase in food production It will be necessary to increase yield, income and livelihoods per unit of land and water, by bringing about a paradigm shift in agricultural research and development strategies. Farming systems that can help produce more from the available land, water and labour resources without either ecological or social harm by a shift from a commodity centered approach to an entire cropping or farming system need be adopted. Research should be tailored to enhance the performance and productivity of entire production systems. In this knowledge based society of the 21st century, Biotechnology, Geographic Information Systems (GIS) mapping, space technology, renewable energy technologies (solar, wind, biomass and biogas) and management and marketing technologies need be suitably utilized to produce more food, more income and more livelihoods per hectare of land. Biotechnology will play an important role in Integrated Gene Management, Efficient Water Management, Integrated Nutrient Supply, Soil Health Care, Integrated Pest Management and Efficient Post-harvest Management, which are major components of integrated natural resources management and precision farming: Steps to improve the stagnant pulse production
It is a matter of concern that while the cereal production has been growing steadily at a rate higher than the population growth rates, the coarse grain and pulse production has not shown a similar increase (Figure 2.1, Table 2.2). There has been a reduction in the per capita availability of pulses
(from 60.7 grams per day in 1951 to 34 grams per day in 1996 – Figure 2.2) and coarse grains.
During the last few years the country has imported pulses to meet the requirement. There has been a sharp and sustained increase in cost of pulses; consequently there is substantial decline in per capita pulses consumption among poorer segments of population. This in turn could
Table – 2.2 Production of major food crops in India- m.tons
Crop 1980-81 1994-95 % Increase Cereals 86 147 71 Millets 23 25 11 Pulses 11 14 33 Oil Seeds 9 21 127 Sugarcane 154 258 67 Source: K.S.Parikh, India development report (1997)
Figure 2.2 Per capita net availability per day
0
100
200
300
400
500
Cereals Pulses
gram
s
1951 1961 19711981 1991 2000
Source: Dte.of Eco.&Stat., M/o Agriculture & Co-op.

12
have an adverse impact on the protein intake. Rising cost of pulses had a beneficial effect also. Till eighties, landless labourers in Madhya Pradesh were given wages in the form of Kesari Dal which was cheaper than cereals or coarse grains. Consumption of staple diet of Kesari Dal led to crippling disease of neuro lathyrism. Over the last three decades the rising cost of pulses has made Kesari Dal more expensive than cereals and hence it is no longer given to labourers as wages for work done; as a result the disease has virtually disappeared from that state.
Swaminathan Research Foundation’s experiments in organizing Pulse
villages in the dry districts of Pudukkotai and Ramanathapuram in Tamil Nadu, had shown that every drop of rainwater could be saved by water harvesting and by ensuring equity in water sharing, pulse production can be increased substantially; as pulses need very little water and have high sale prices, the resource-poor farmers in these areas get maximum income from the available land and water. The pulse component of the "Pulses and Oil Seeds Mission" need to receive a major thrust in terms of R&D and other inputs, so that essential pulse requirement of growing population is fully met.
Measures to increase coarse grain production
Over years per capita availability of coarse grains has undergone
substantial reduction; there has been a shift away from coarse grains to rice and wheat consumption even among poorer segments of population. One of the benefits of this change is virtual elimination of pellagra, which was widely prevalent among low-income group population in Deccan Plateau whose staple food was sorghum.
Coarse grains are less expensive than rice and wheat; they can thus provide higher calories for the same cost as compared to rice and wheat. Coarse grains which are locally produced and procured if made available through targeted public distribution system (TPDS) at subsidised rate, may substantially bring down the subsidy cost without any reduction in calories provided and improve " targeting" - as only the most needy are likely to buy these coarse grains. Millets are rich in minerals and micronutrients and hence increased consumption of millets will improve dietary intake of these vital nutrients among poorer segments of the population Horticultural Production
Horticulture crops contribute higher production from a unit area than cereals. One hectare under vegetables yields 10 to 30 tons and above of produce as against 2 to 3 tons of cereal crops. Consequently, the earnings from the same area are higher because of higher yields; also, because of higher prices these commodities command in domestic as well as international markets.
Information on production of fruits is in Table-2.3. The total production
of horticultural crops in 1997-98 was nearly112 million tons from only 24.5 million hectares as compared to 193 million tons of food grains from 124
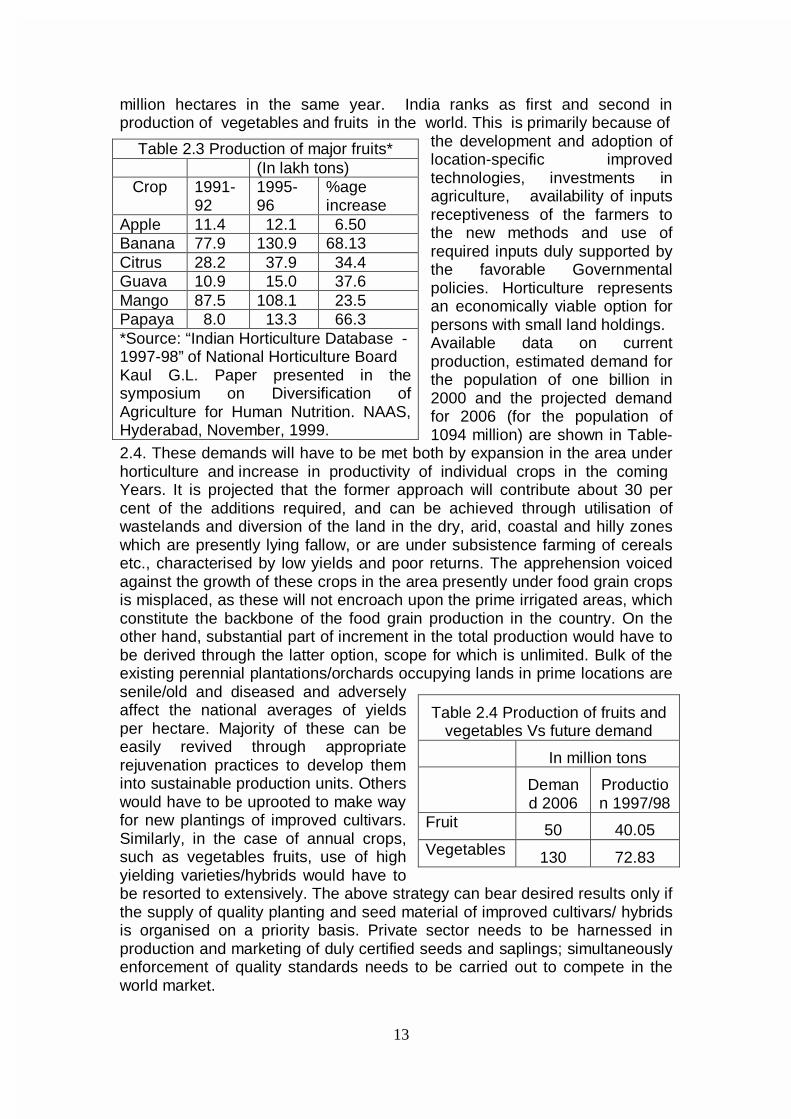
13
million hectares in the same year. India ranks as first and second in production of vegetables and fruits in the world. This is primarily because of
the development and adoption of location-specific improved technologies, investments in agriculture, availability of inputs receptiveness of the farmers to the new methods and use of required inputs duly supported by the favorable Governmental policies. Horticulture represents an economically viable option for persons with small land holdings. Available data on current production, estimated demand for the population of one billion in 2000 and the projected demand for 2006 (for the population of 1094 million) are shown in Table-
2.4. These demands will have to be met both by expansion in the area under horticulture and increase in productivity of individual crops in the coming Years. It is projected that the former approach will contribute about 30 per cent of the additions required, and can be achieved through utilisation of wastelands and diversion of the land in the dry, arid, coastal and hilly zones which are presently lying fallow, or are under subsistence farming of cereals etc., characterised by low yields and poor returns. The apprehension voiced against the growth of these crops in the area presently under food grain crops is misplaced, as these will not encroach upon the prime irrigated areas, which constitute the backbone of the food grain production in the country. On the other hand, substantial part of increment in the total production would have to be derived through the latter option, scope for which is unlimited. Bulk of the existing perennial plantations/orchards occupying lands in prime locations are senile/old and diseased and adversely affect the national averages of yields per hectare. Majority of these can be easily revived through appropriate rejuvenation practices to develop them into sustainable production units. Others would have to be uprooted to make way for new plantings of improved cultivars. Similarly, in the case of annual crops, such as vegetables fruits, use of high yielding varieties/hybrids would have to be resorted to extensively. The above strategy can bear desired results only if the supply of quality planting and seed material of improved cultivars/ hybrids is organised on a priority basis. Private sector needs to be harnessed in production and marketing of duly certified seeds and saplings; simultaneously enforcement of quality standards needs to be carried out to compete in the world market.
Table 2.3 Production of major fruits* (In lakh tons)
Crop 1991-92
1995-96
%age increase
Apple 11.4 12.1 6.50 Banana 77.9 130.9 68.13 Citrus 28.2 37.9 34.4 Guava 10.9 15.0 37.6 Mango 87.5 108.1 23.5 Papaya 8.0 13.3 66.3 *Source: “Indian Horticulture Database - 1997-98” of National Horticulture Board Kaul G.L. Paper presented in the symposium on Diversification of Agriculture for Human Nutrition. NAAS, Hyderabad, November, 1999.
Table 2.4 Production of fruits and vegetables Vs future demand
In million tons
Demand 2006
Production 1997/98
Fruit 50 40.05 Vegetables 130 72.83
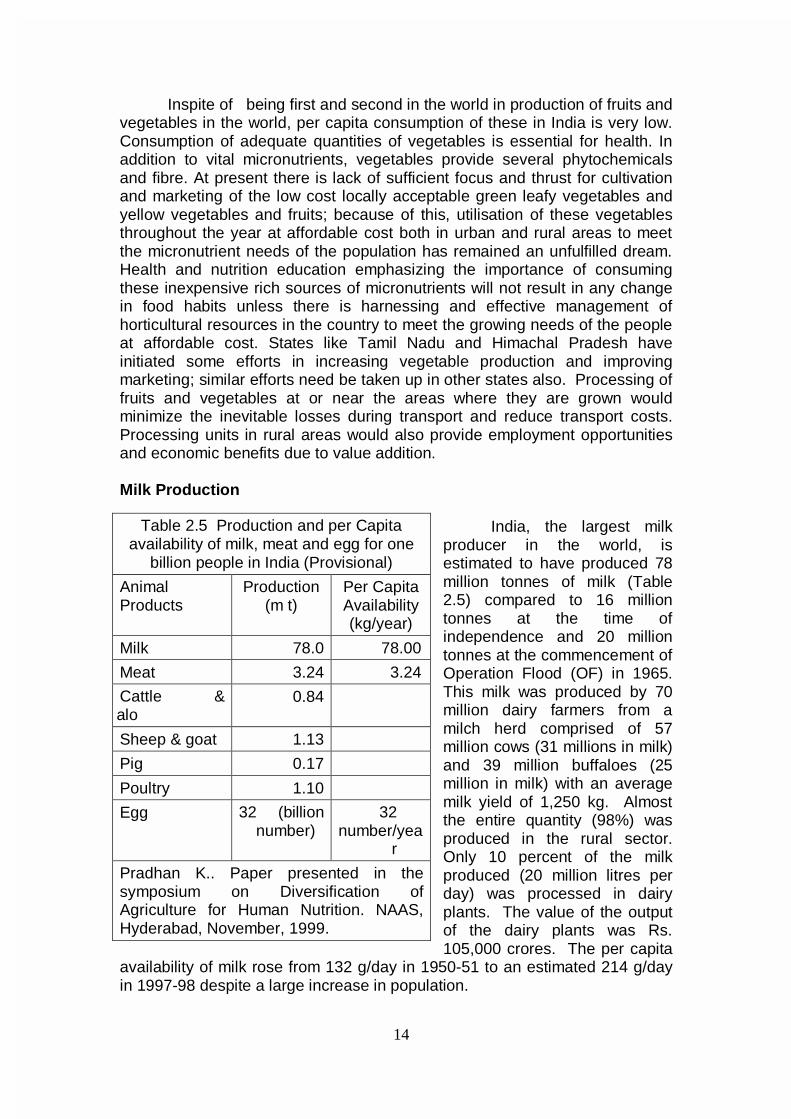
14
Inspite of being first and second in the world in production of fruits and
vegetables in the world, per capita consumption of these in India is very low. Consumption of adequate quantities of vegetables is essential for health. In addition to vital micronutrients, vegetables provide several phytochemicals and fibre. At present there is lack of sufficient focus and thrust for cultivation and marketing of the low cost locally acceptable green leafy vegetables and yellow vegetables and fruits; because of this, utilisation of these vegetables throughout the year at affordable cost both in urban and rural areas to meet the micronutrient needs of the population has remained an unfulfilled dream. Health and nutrition education emphasizing the importance of consuming these inexpensive rich sources of micronutrients will not result in any change in food habits unless there is harnessing and effective management of horticultural resources in the country to meet the growing needs of the people at affordable cost. States like Tamil Nadu and Himachal Pradesh have initiated some efforts in increasing vegetable production and improving marketing; similar efforts need be taken up in other states also. Processing of fruits and vegetables at or near the areas where they are grown would minimize the inevitable losses during transport and reduce transport costs. Processing units in rural areas would also provide employment opportunities and economic benefits due to value addition.
Milk Production
India, the largest milk
producer in the world, is estimated to have produced 78 million tonnes of milk (Table 2.5) compared to 16 million tonnes at the time of independence and 20 million tonnes at the commencement of Operation Flood (OF) in 1965. This milk was produced by 70 million dairy farmers from a milch herd comprised of 57 million cows (31 millions in milk) and 39 million buffaloes (25 million in milk) with an average milk yield of 1,250 kg. Almost the entire quantity (98%) was produced in the rural sector. Only 10 percent of the milk produced (20 million litres per day) was processed in dairy plants. The value of the output of the dairy plants was Rs. 105,000 crores. The per capita
availability of milk rose from 132 g/day in 1950-51 to an estimated 214 g/day in 1997-98 despite a large increase in population.
Table 2.5 Production and per Capita availability of milk, meat and egg for one
billion people in India (Provisional)
Animal Products
Production (m t)
Per Capita Availability (kg/year)
Milk 78.0 78.00
Meat 3.24 3.24
Cattle & alo
0.84
Sheep & goat 1.13
Pig 0.17
Poultry 1.10
Egg 32 (billion number)
32 number/yea
r
Pradhan K.. Paper presented in the symposium on Diversification of Agriculture for Human Nutrition. NAAS, Hyderabad, November, 1999.
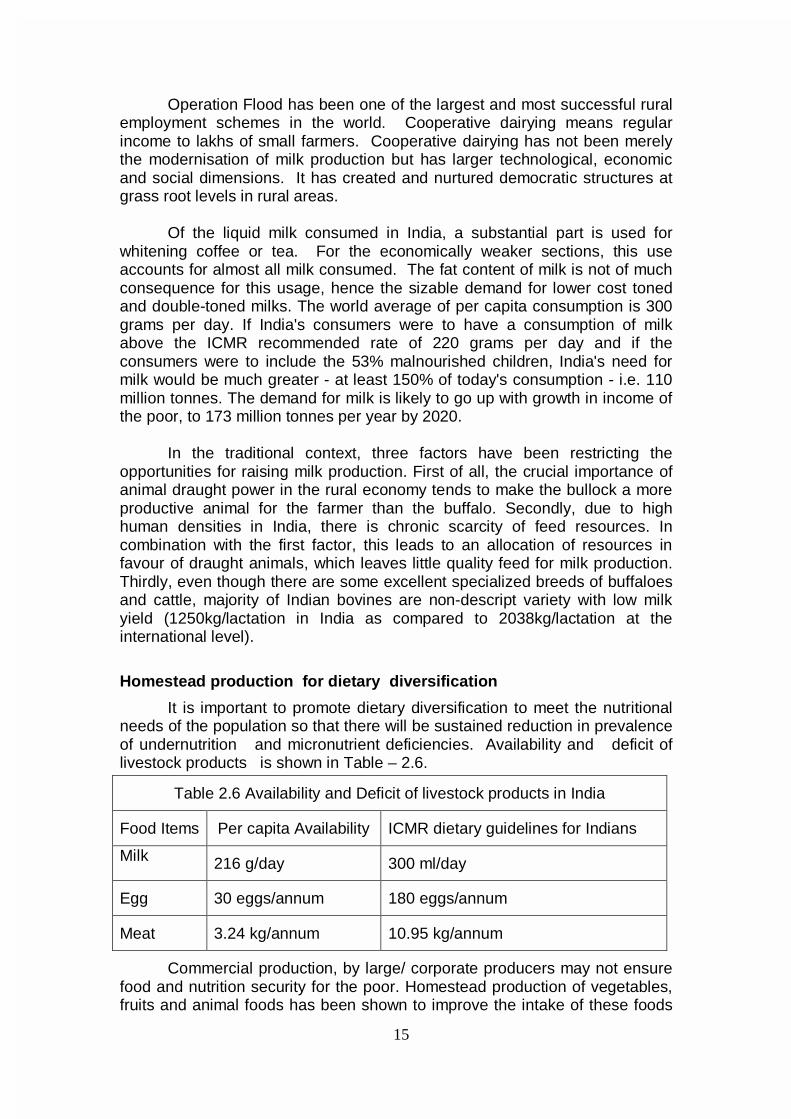
15
Operation Flood has been one of the largest and most successful rural
employment schemes in the world. Cooperative dairying means regular income to lakhs of small farmers. Cooperative dairying has not been merely the modernisation of milk production but has larger technological, economic and social dimensions. It has created and nurtured democratic structures at grass root levels in rural areas.
Of the liquid milk consumed in India, a substantial part is used for
whitening coffee or tea. For the economically weaker sections, this use accounts for almost all milk consumed. The fat content of milk is not of much consequence for this usage, hence the sizable demand for lower cost toned and double-toned milks. The world average of per capita consumption is 300 grams per day. If India's consumers were to have a consumption of milk above the ICMR recommended rate of 220 grams per day and if the consumers were to include the 53% malnourished children, India's need for milk would be much greater - at least 150% of today's consumption - i.e. 110 million tonnes. The demand for milk is likely to go up with growth in income of the poor, to 173 million tonnes per year by 2020.
In the traditional context, three factors have been restricting the
opportunities for raising milk production. First of all, the crucial importance of animal draught power in the rural economy tends to make the bullock a more productive animal for the farmer than the buffalo. Secondly, due to high human densities in India, there is chronic scarcity of feed resources. In combination with the first factor, this leads to an allocation of resources in favour of draught animals, which leaves little quality feed for milk production. Thirdly, even though there are some excellent specialized breeds of buffaloes and cattle, majority of Indian bovines are non-descript variety with low milk yield (1250kg/lactation in India as compared to 2038kg/lactation at the international level).
Homestead production for dietary diversification
It is important to promote dietary diversification to meet the nutritional needs of the population so that there will be sustained reduction in prevalence of undernutrition and micronutrient deficiencies. Availability and deficit of livestock products is shown in Table – 2.6.
Commercial production, by large/ corporate producers may not ensure food and nutrition security for the poor. Homestead production of vegetables, fruits and animal foods has been shown to improve the intake of these foods
Table 2.6 Availability and Deficit of livestock products in India
Food Items Per capita Availability ICMR dietary guidelines for Indians
Milk 216 g/day 300 ml/day
Egg 30 eggs/annum 180 eggs/annum
Meat 3.24 kg/annum 10.95 kg/annum
16
by the family including children. Such an effort should be backed by strong educational component to facilitate the right choices and utilisation. With milk, eggs, meat and fish having gone beyond the reach of the poor, there are concerns about sustaining enhanced production of animal foods.
However, even without resorting to excessive commercial production of these foods, strategies can be worked out for using degraded lands and farm wastes as well as food grains unfit for human consumption to increase the production of these highly nutritious foods. Backyard poultry needs to be promoted to increase homestead production of eggs and chicken and generate employment for farmwomen. Breeds suitable for backyard poultry have been developed in India. Food Processing and Preservation
Post harvest losses presently in the range of 20 to 30 per cent, which
contribute directly to the reduction in the availability of these commodities to the people, and estimated to cost Rs.23, 000 crores, are the other major constraint in achieving the goals. This is primarily due to very weak infrastructure available for post harvests handling, lack of appropriate technology for on-farm adoption and unorganised marketing practices in vogue. These in turn contribute to the high retail prices of these commodities, thus making these unaffordable to the ordinary consumers.
There is considerable scope and need for the expansion of agro-based
industries dealing with food preservation and processing in villages and townships. This could create job opportunities for women and men. This could also lead to better production and more effective utilisation of local food resources by the community, and reduce the present considerable loss of perishable food items. Local women’s organisations could be entrusted the responsibility of organising village level feeding programmes in schools and anganwadis to distribute locally grown food stuffs and cooked according to the local dietary culture. Supplementary nutrition programmes could then become programmes of the people, by the people and for the people. It is important to support the decentralised small-scale food production, processing and marketing systems, which provide employment opportunities to women and men in the countrysides. Wheat and wheat flour, for instance, provide livelihood and nutrition to millions of men and women in India. In the current decentralised small-scale economy, based on millions of producers, processors and traders, people are the substitutes for capital and infrastructure. India should be careful not to allow erosion in this traditional approach, which makes optimal utilisation of the abundant human resources. Planning of agriculture and food processing in villages around towns and cities will help to increase farmers’ income and rural employment considerably and will attract and retain educated youth in farming through spreading science-based precision farming and processing techniques which are both intellectually stimulating and economically rewarding.

17
CHAPTER - III EQUITABLE DISTRIBUTION OF FOODSTUFFS
Achievement of food adequacy at the national level is a precondition,
necessary but not sufficient in itself, to ensure the achievement of household nutrition security. Buffer stocks do help to combat acute transient food scarcity, caused by natural disasters like floods and droughts. These acute disasters are, no doubt, now being handled more expeditiously and efficiently than in the past, and several lives are being saved by timely action. Early warning systems are in place and food can be rushed to areas of threatened distress fairly rapidly. What is proving more difficult, however is the task of combating chronic mild / moderate under-nutrition in large number of poor households; India has today built up fairly adequate buffer stocks of food grains, but nearly a third of households in the country do not enjoy full nutrition security. It is even more important to realize that inequitable distribution of available food among different segments of population and even within the family is one of the major factors responsible for under-nutrition / over-nutrition. Good governance and health and nutrition education hold the key for improving equitable distribution of food based on the need.
Poverty and lack of purchasing power have been identified as two
major factors responsible for the low dietary intake in India. The concern over the economic factors resulting in chronic under-nutrition led to the use of calorie intake as the basis of estimating poverty and the development of food for work programmes as one of the remedial measures to alleviate this problem. The food for work programme and the employment assurance scheme are aimed at improving household food availability in families below poverty line (BPL) especially in seasons during which the employment and food availability in rural areas are low. In addition to the above initiatives taken by the Government, several non-governmental national and international agencies have also been providing food supplements to identified vulnerable groups in different parts of the country. To some extent these measures have helped in improving the household food availability but the problem of equitable distribution of available food and need based intrafamilial distribution of food persists. Public Distribution System (PDS) providing food grains at affordable prices is one of the key elements of the Government’s Food Security system. In spite of obvious limitations, PDS did play a role in improving regional food security especially in drought prone areas. In an attempt to improve availability of food to population living in most vulnerable areas (remote, tribal and drought–prone regions) the revamped public distribution system gave priority for establishment of PDS in such vulnerable areas. Evaluation studies indicate that supply of subsidized food PDS has not resulted in improvement in household food security among the poorest segment of the population. Self-sufficiency of food grains at national level and availability of food grains at affordable cost at local level have not got translated into household level food security for the poor. In an attempt to limit the mounting cost of subsidy and at the same time to ensure that people below poverty line do get subsidized
18
food grains, the Targeted Public Distribution System (TPDS) providing food grains at subsidized cost only to people below poverty line was initiated in June 1997. Food grains distributed under Public Distribution System are generally procured conforming to uniform specifications. The quality of these items is continuously monitored during storage. The food grains (wheat and rice) strictly conforming to PFA standards and free from insect infestation are issued to public distribution system. The officers of the State Government or authorized representatives are allowed to check the quality of food grains before lifting from Food Corporation of India depots. Targeted Public Distribution system
The objective of TPDS is to restrict the benefits of subsidized food grains to those sections whom the State wants to protect. A number of innovative features have been introduced in the TPDS to provide differential treatments to the BPL population vis-à-vis the APL population. In order to make the TPDS transparent and accountable and thereby plug the leakages, a number of steps have been taken. These include (a) release of food grains to the states subject to satisfactory completion of identification of eligible families; (b) involvement of the Panchayats / Nagarpalikas in the identification exercise as well as for supervision of the work of the fair price shops (FPS) (c) constitution of vigilance committee at FPS, Taluk, District and State level and (d) a system of monitoring and reporting on the working of TPDS. It is essential that the functioning of the TPDS is carefully monitored and appropriate corrective measures taken to ensure that subsidized food does reach the needy. In addition to rice and wheat it might be preferable to provide coarse grains, pulses and iodised salt through TPDS to the population. Basis of allocation under TPDS Planning Commission estimates percentage of BPL families in each State. The basis of arriving at estimates of BPL families is with respect to consumption expenditure required to meet the minimum calorie requirement, which is 2400 Kcal in rural areas and 2200 Kcal in urban areas. Computed per capita requirement of cereals is 436 grams per day or13.26 kg per month or 159 kg per year. Taking the average household size as 5.51 (1991 census) the monthly requirement of food grain for a household works out to 73 kg. TPDS stipulated 10kg of food grains to be distributed monthly to every BPL household in the country. TPDS therefore meets only a small part of the total requirement of food grains for the family; as such this scheme only supplements the efforts to improve the purchasing power, in achieving food security. Recent Initiatives
Under the TPDS, the Government has increased the allocation of food grains to BPL families from 10 kg to 20 kg per month from April 2000. The allocation of food grains for BPL families has now been determined on the
19
basis of population as per census 2001 instead of the earlier base of projected population of 1996. The Government has recently decided to • Allocate food grains at BPL rates to State Governments at the rate of 5kg
per head per month for covering categories of indigent people living in welfare institutions such as beggar homes, hostels for SC/ST/backward class students, homes for nariniketans etc. sponsored by the State Governments and the concerned administrative ministry of Government of India.
• Allocate food grains under the Annapoorna scheme to indigent old persons even in the case of those receiving old-age pension from the State Governments.
• Allocate food grains at CIP applicable for BPL families for all welfare schemes implemented by the various Ministries of government of India.
• Where the beneficiaries belong to the BPL category, allocate food grains at BPL rates to developmental schemes implemented by NGOs sponsored by the State Governments and the administrative ministry in the GOI as also by the international organizations like the World Food Programme.
Antyodaya Anna Yojana launched on 25th December 2000 provides
25 kg of food grains per month to one crore poorest of the poor families amongst BPL families at the rate of Rs.2/- per kg for wheat and Rs.3/- per kg for rice. The increased allocation to poorest of the BPL families is intended to meet requirements of calorie intake to this vulnerable section who do not get two square meals a day for certain months of the year.
On the eve of the Independence Day, Prime Minister announced that a
composite, Centrally-sponsored Scheme involving an annual expenditure of about Rs.10,000 crore is being initiated to provide additional and guaranteed employment in the rural areas. The Ministry of Rural Development has accordingly launched the Sampoorna Grameen Rozgar Yojana (SRGY) scheme under which 50 lakh tonnes of food grains amounting to Rs.5000 crore will be provided every year, free of cost, to the State Governments and Union Territory Administrations. The remaining funds (Rs.5000 crore) will be utilized to meet the cash component of wages and the material cost. The payment of food grains (at economic cost) will be made by the Ministry of Rural Development to the FCI directly. Under the scheme, it is envisaged that about 100 crore mandays of employment will be generated every year. The Panchayati Raj Institutions (PRIs) will be fully involved in the operationalisation of the scheme. All the wage employment schemes of the Central Government would be part of the composite SGRY and would be executed by the PRIs. Guaranteed employment in the rural areas will be the longer-term objective of the scheme. The scheme also envisages employment guarantee, food security and creation of durable community, social and economic assets and infrastructure development in rural areas. The SGRY will be available for all the poor (BPL/APL) who are in need of wage employment and are willing to take up manual/unskilled work in and around his/her village or habitation. The programme is self-targeting in nature and will cover women, scheduled castes and scheduled tribes and parents of children withdrawn from hazardous labour. Swaminathan Research Foundation has suggested that the nature of employment under SGRY can be for eco-
20
development like establishment of waterbanks, landcare, control of desertification and afforestation. Role of PRI PRIs have a vital role to play in monitoring the programmes for providing food stuffs though the TPDS, food for work and other food grain distribution programmes as well as ongoing nutritional supplementation programmes for vulnerable groups so that these programmes are implemented well and the target groups do benefit from the programme. The Task Force on Panchayati Raj Institutions constituted by the Planning Commission has made a number of recommendations for mainstreaming the role of PRIs, which are as listed below: • In respect of ICDS programme, the village level panchayats with the help
of gram sabha should select the Anganwadi worker and helper. • Village Panchayat should promote inter-sectoral linkages particularly
between health and nutrition programme. They should also see that the ICDS centers operate regularly and necessary equipments like weighing machines are available and are in working order. It should monitor whether food supplements are being received in time and should seek assistance of block panchayat / zilla parishads in arranging them in time so that there are no interruption in services.
• Gram Sabha should help in identification of beneficiary households, providing necessary assistance to anganwadi worker for cooking food where necessary, verifying whether the benefits are reaching the right people etc.
• District and block level panchayats should arrange training programmes for AWWs and review impact of the programme on malnourished children.
• Village panchayat with the help of gram sabha should arrange and organize awareness camps where Food and Nutrition Board officials can disseminate nutrition awareness through demonstration programmes through available local food. It should also promote nutrition awareness in their public contact programmes as well as through the local anganwadi centers and health subcentres.
Role of the community
The Swaminathan Research Foundation has advocated formation of local Grain Banks under the supervision of the PRI to help in achieving the goals of nutrition security for all and for insulating economically and socially deprived sections of the community from seasonal food insecurity. They state that the present system of procuring and storing food grains under Food Corporation of India has become economically unviable. Nearly Rs.2200 p.a. is required to maintain one tonne of food grains. Community Food Banks provide a decentralized and efficient method of food grain storage and distribution that entails low transaction and transportation costs. Thay can also provide opportunities for strengthening food security through a broad based food basket including a wide range of millets, oilseeds and grain legume grown locally.
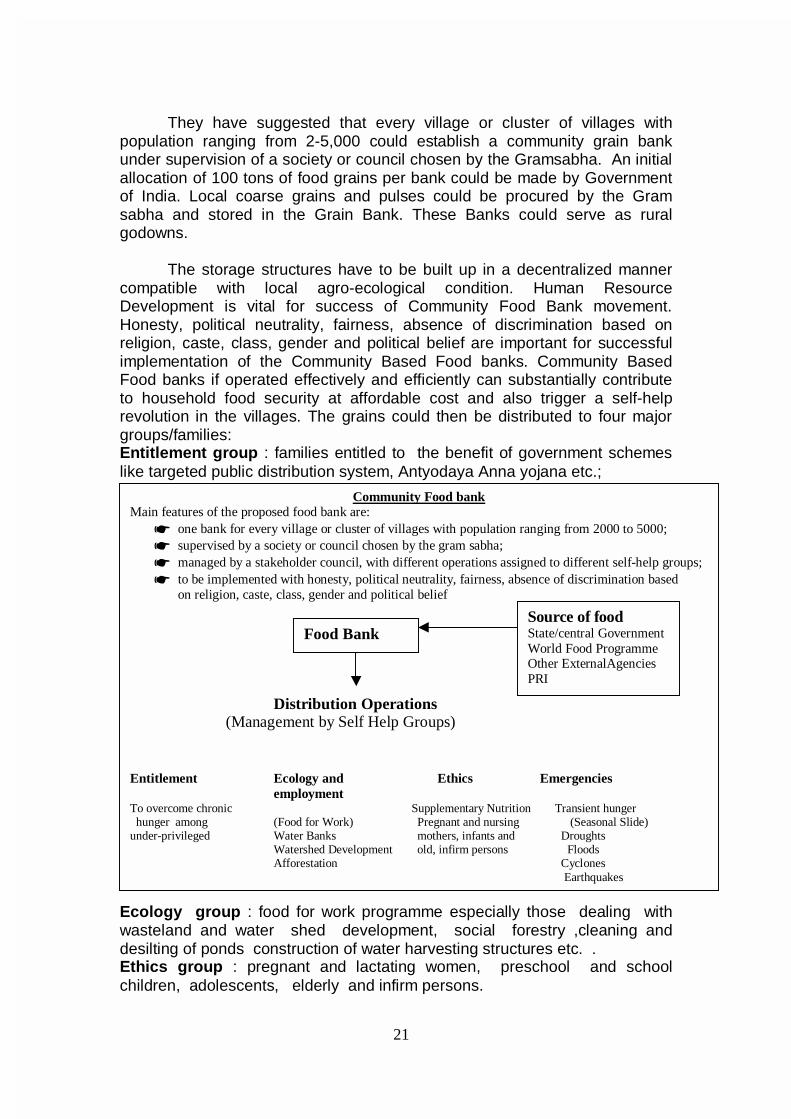
21
They have suggested that every village or cluster of villages with
population ranging from 2-5,000 could establish a community grain bank under supervision of a society or council chosen by the Gramsabha. An initial allocation of 100 tons of food grains per bank could be made by Government of India. Local coarse grains and pulses could be procured by the Gram sabha and stored in the Grain Bank. These Banks could serve as rural godowns.
The storage structures have to be built up in a decentralized manner
compatible with local agro-ecological condition. Human Resource Development is vital for success of Community Food Bank movement. Honesty, political neutrality, fairness, absence of discrimination based on religion, caste, class, gender and political belief are important for successful implementation of the Community Based Food banks. Community Based Food banks if operated effectively and efficiently can substantially contribute to household food security at affordable cost and also trigger a self-help revolution in the villages. The grains could then be distributed to four major groups/families: Entitlement group : families entitled to the benefit of government schemes like targeted public distribution system, Antyodaya Anna yojana etc.; Ecology group : food for work programme especially those dealing with wasteland and water shed development, social forestry ,cleaning and desilting of ponds construction of water harvesting structures etc. . Ethics group : pregnant and lactating women, preschool and school children, adolescents, elderly and infirm persons.
Community Food bank Main features of the proposed food bank are:
☛ one bank for every village or cluster of villages with population ranging from 2000 to 5000; ☛ supervised by a society or council chosen by the gram sabha; ☛ managed by a stakeholder council, with different operations assigned to different self-help groups; ☛ to be implemented with honesty, political neutrality, fairness, absence of discrimination based
on religion, caste, class, gender and political belief
Distribution Operations (Management by Self Help Groups) Entitlement Ecology and Ethics Emergencies
employment To overcome chronic Supplementary Nutrition Transient hunger hunger among (Food for Work) Pregnant and nursing (Seasonal Slide) under-privileged Water Banks mothers, infants and Droughts Watershed Development old, infirm persons Floods Afforestation Cyclones Earthquakes
Food Bank Source of food State/central Government World Food Programme Other ExternalAgencies PRI

22
Emergencies: immediate relief operations following major natural catastrophies like drought, floods, cyclone and earthquake as well as to meet the challenge of seasonal slides in livelihood opportunities because of crop failure.
Four separate self-help groups supported by revolving food stocks
could manage these activities. Priority in establishment of grain banks could go to areas, which are known to be food deficient. For the Community Based Food Bank movement to succeed, there is a need for training of managers of such Food Banks and building up capacity in the community to plan and monitor its operation. There will have to be a network of institutions that will provide necessary managerial, technical and training support to managers of Community Based Food Banks. A diagrammatic representation of the Community Food Security System is given in Figure 3.1. Recommendations for Tenth Plan
Every effort is to be made to ensure that there is no duplication of
efforts for ensuring nutrition security to various groups of the population. Identification of vulnerable groups/ undernourished individuals for well targeted food and health care should be attempted. Various modalities of improving the efficiency of the systems currently in operation to improve household food security and address the special needs of the vulnerable groups may have to be tested and evaluated; the most appropriate and cost effective model for each location has to be chosen for making optimal use of available subsidies to meet the needs of the vulnerable segments of the population.
23
CHAPTER- IV
DIETARY INTAKE AND NUTRITIONAL STATUS
Diet provides essential nutrients for
• Satisfactory growth in infants, children and adolescents, • Maintaining body weight and health, • Permitting normal work capacity in the adults and • Providing nutritional support to the mother-child dyad during pregnancy
and lactation. Nutritional requirement is defined as the amount required to balance nutrient expenditure consistent with long-term good health. This intake will allow for maintenance of economically necessary and socially desirable physical activity. Nutrient requirements are determined by body size and composition and level of physical activity. In children and pregnant/ lactating women, requirement will include nutrient needed for deposition of tissue and secretion of milk at the rate consistent with good health. Estimates of requirement are ultimately derived from actual data of intake and expenditure from individuals. Actual intakes and expenditure of people of same age, sex, similar body size and physical activity are used to compute requirement for the groups. All estimates of requirement are based on habitual intakes; though these are expressed as daily intake, it is not implied that these amounts must be consumed on daily basis.
Energy is the most widely used parameter for measuring requirement, deficiency or excess of dietary intake because
• It is the largest component of diet and in habitual diets the availability of
most nutrients are proportionate to the energy intake (this however is not true in junk foods).
• Precise techniques for measurement of energy requirements are now available.
• Anthropometric indices provide an easy and accurate method for assessing the impact of energy intake.
Deficiency of other nutrients especially micronutrients may influence
and modify efficiency of energy utilization and hence alter both requirements and impact of dietary intake on anthropometric indices. Studies on energy metabolism carried out during the last two decades utilising newer techniques for estimating energy requirements have enabled research workers to obtain more precise information on energy requirements under varying conditions. These findings have important implications on programmes to combat macro and micronutrient deficiencies as well as the problem of obesity and associated health hazards in the country.
In India ICMR recommendations regarding energy intake have been
used as the basis for defining poverty line. RDI is also an essential input for
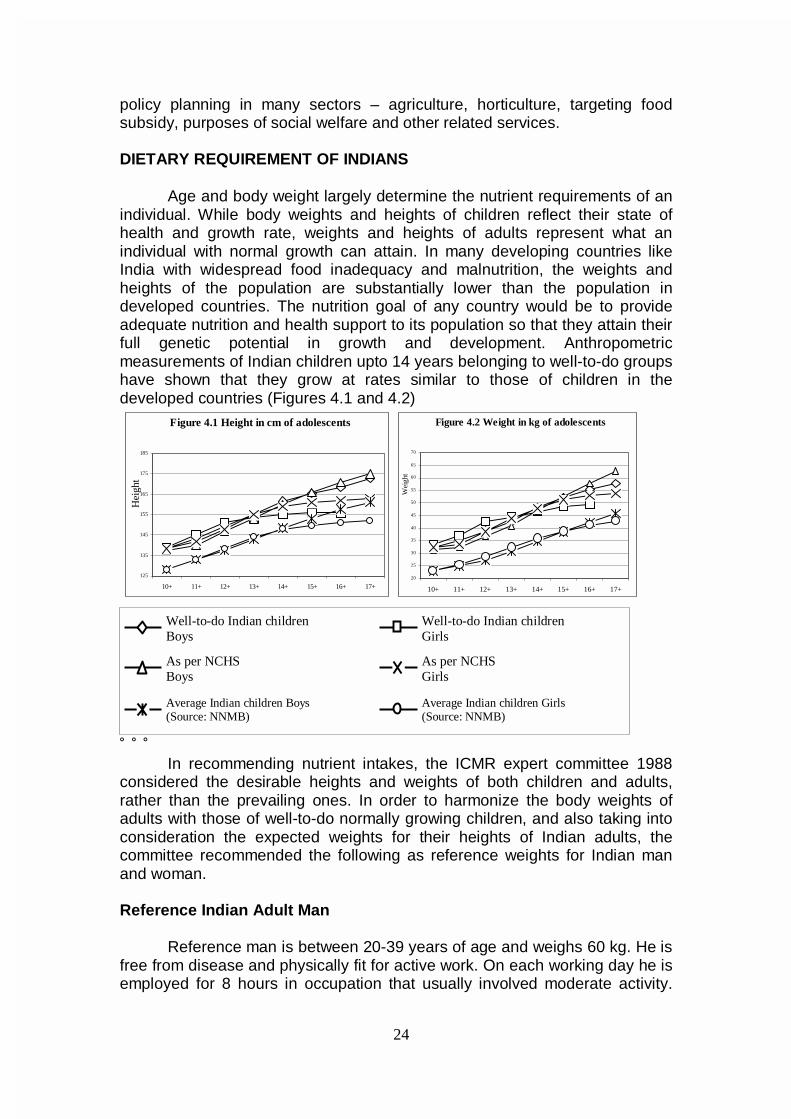
24
Well-to-do Indian children Boys
Well-to-do Indian children Girls
As per NCHS Boys
As per NCHS Girls
Average Indian children Boys (Source: NNMB)
Average Indian children Girls (Source: NNMB)
policy planning in many sectors – agriculture, horticulture, targeting food subsidy, purposes of social welfare and other related services.
DIETARY REQUIREMENT OF INDIANS
Age and body weight largely determine the nutrient requirements of an individual. While body weights and heights of children reflect their state of health and growth rate, weights and heights of adults represent what an individual with normal growth can attain. In many developing countries like India with widespread food inadequacy and malnutrition, the weights and heights of the population are substantially lower than the population in developed countries. The nutrition goal of any country would be to provide adequate nutrition and health support to its population so that they attain their full genetic potential in growth and development. Anthropometric measurements of Indian children upto 14 years belonging to well-to-do groups have shown that they grow at rates similar to those of children in the developed countries (Figures 4.1 and 4.2)
˚ ˚ ˚ In recommending nutrient intakes, the ICMR expert committee 1988
considered the desirable heights and weights of both children and adults, rather than the prevailing ones. In order to harmonize the body weights of adults with those of well-to-do normally growing children, and also taking into consideration the expected weights for their heights of Indian adults, the committee recommended the following as reference weights for Indian man and woman.
Reference Indian Adult Man
Reference man is between 20-39 years of age and weighs 60 kg. He is free from disease and physically fit for active work. On each working day he is employed for 8 hours in occupation that usually involved moderate activity.
Figure 4.1 Height in cm of adolescents
125
135
145
155
165
175
185
10+ 11+ 12+ 13+ 14+ 15+ 16+ 17+
Hei
ght
Figure 4.2 Weight in kg of adolescents
20
25
30
35
40
45
50
55
60
65
70
10+ 11+ 12+ 13+ 14+ 15+ 16+ 17+
Wei
ght
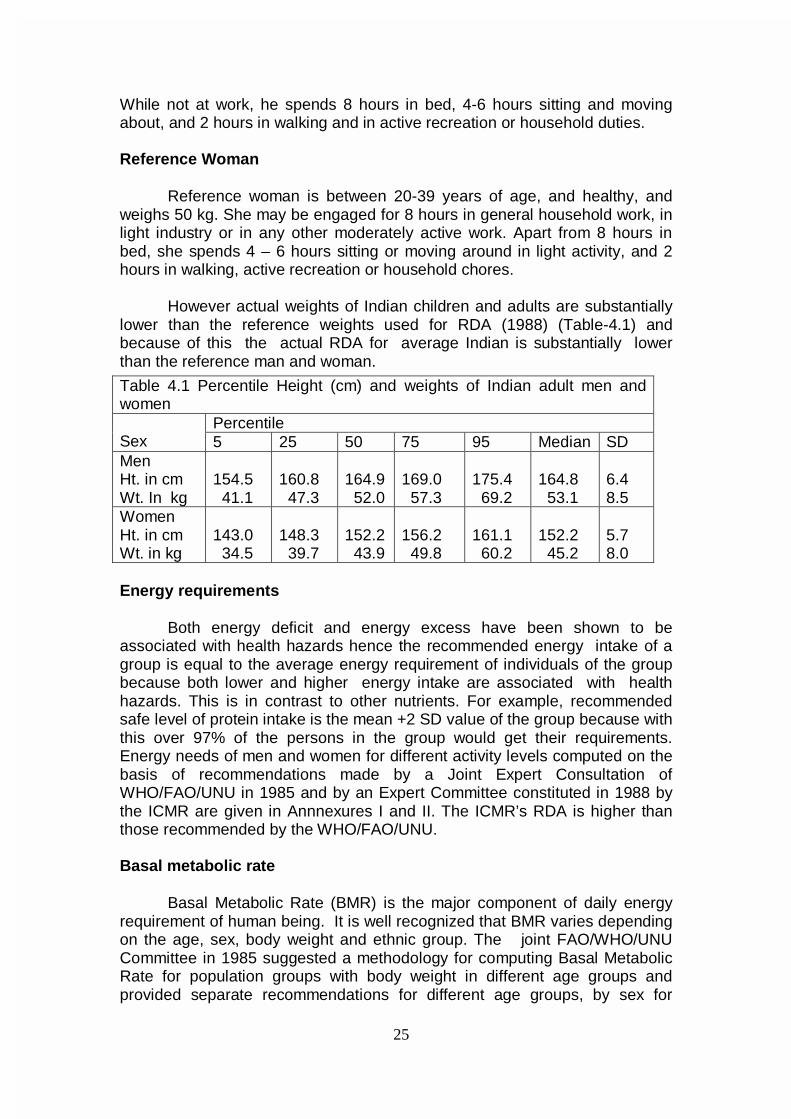
25
While not at work, he spends 8 hours in bed, 4-6 hours sitting and moving about, and 2 hours in walking and in active recreation or household duties. Reference Woman
Reference woman is between 20-39 years of age, and healthy, and weighs 50 kg. She may be engaged for 8 hours in general household work, in light industry or in any other moderately active work. Apart from 8 hours in bed, she spends 4 – 6 hours sitting or moving around in light activity, and 2 hours in walking, active recreation or household chores.
However actual weights of Indian children and adults are substantially lower than the reference weights used for RDA (1988) (Table-4.1) and because of this the actual RDA for average Indian is substantially lower than the reference man and woman.
Energy requirements
Both energy deficit and energy excess have been shown to be associated with health hazards hence the recommended energy intake of a group is equal to the average energy requirement of individuals of the group because both lower and higher energy intake are associated with health hazards. This is in contrast to other nutrients. For example, recommended safe level of protein intake is the mean +2 SD value of the group because with this over 97% of the persons in the group would get their requirements. Energy needs of men and women for different activity levels computed on the basis of recommendations made by a Joint Expert Consultation of WHO/FAO/UNU in 1985 and by an Expert Committee constituted in 1988 by the ICMR are given in Annnexures I and II. The ICMR’s RDA is higher than those recommended by the WHO/FAO/UNU. Basal metabolic rate Basal Metabolic Rate (BMR) is the major component of daily energy requirement of human being. It is well recognized that BMR varies depending on the age, sex, body weight and ethnic group. The joint FAO/WHO/UNU Committee in 1985 suggested a methodology for computing Basal Metabolic Rate for population groups with body weight in different age groups and provided separate recommendations for different age groups, by sex for
Table 4.1 Percentile Height (cm) and weights of Indian adult men and women
Percentile Sex 5 25 50 75 95 Median SD Men Ht. in cm Wt. In kg
154.5 41.1
160.8 47.3
164.9 52.0
169.0 57.3
175.4 69.2
164.8 53.1
6.4 8.5
Women Ht. in cm Wt. in kg
143.0 34.5
148.3 39.7
152.2 43.9
156.2 49.8
161.1 60.2
152.2 45.2
5.7 8.0
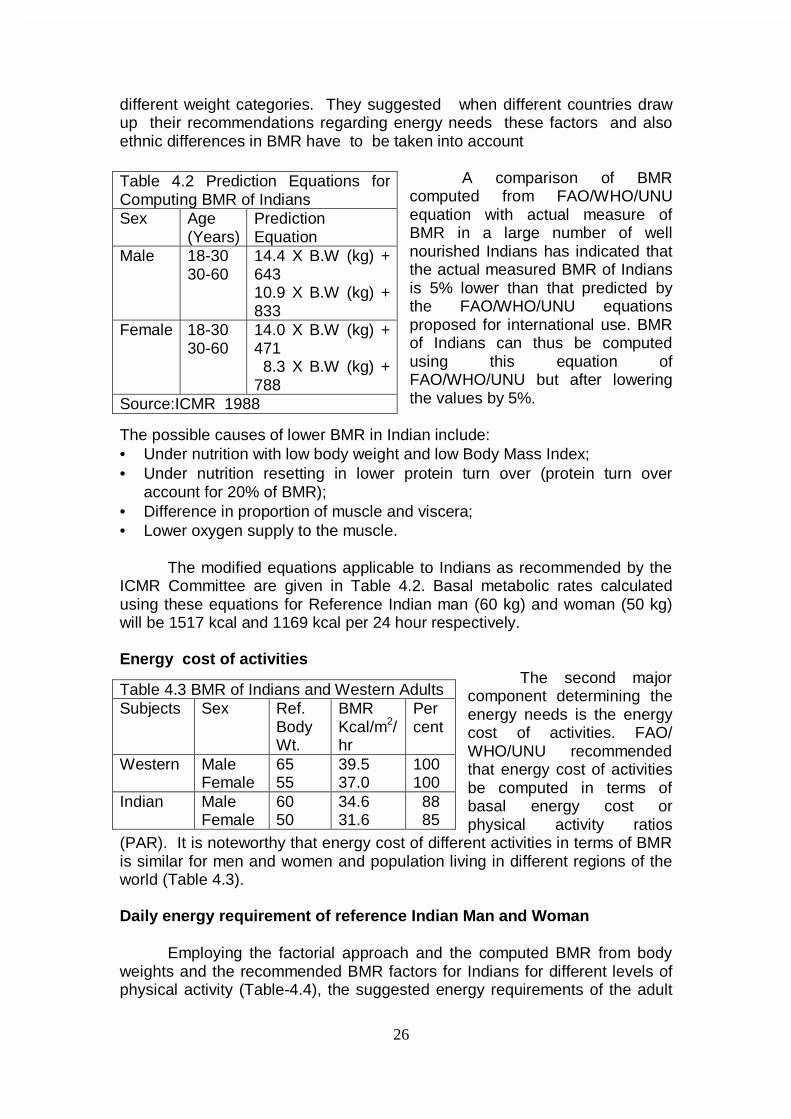
26
different weight categories. They suggested when different countries draw up their recommendations regarding energy needs these factors and also ethnic differences in BMR have to be taken into account
A comparison of BMR computed from FAO/WHO/UNU equation with actual measure of BMR in a large number of well nourished Indians has indicated that the actual measured BMR of Indians is 5% lower than that predicted by the FAO/WHO/UNU equations proposed for international use. BMR of Indians can thus be computed using this equation of FAO/WHO/UNU but after lowering the values by 5%.
The possible causes of lower BMR in Indian include: • Under nutrition with low body weight and low Body Mass Index; • Under nutrition resetting in lower protein turn over (protein turn over
account for 20% of BMR); • Difference in proportion of muscle and viscera; • Lower oxygen supply to the muscle.
The modified equations applicable to Indians as recommended by the ICMR Committee are given in Table 4.2. Basal metabolic rates calculated using these equations for Reference Indian man (60 kg) and woman (50 kg) will be 1517 kcal and 1169 kcal per 24 hour respectively. Energy cost of activities
The second major component determining the energy needs is the energy cost of activities. FAO/ WHO/UNU recommended that energy cost of activities be computed in terms of basal energy cost or physical activity ratios
(PAR). It is noteworthy that energy cost of different activities in terms of BMR is similar for men and women and population living in different regions of the world (Table 4.3). Daily energy requirement of reference Indian Man and Woman
Employing the factorial approach and the computed BMR from body weights and the recommended BMR factors for Indians for different levels of physical activity (Table-4.4), the suggested energy requirements of the adult
Table 4.2 Prediction Equations for Computing BMR of Indians Sex Age
(Years) Prediction Equation
Male 18-30 30-60
14.4 X B.W (kg) + 643 10.9 X B.W (kg) + 833
Female 18-30 30-60
14.0 X B.W (kg) + 471 8.3 X B.W (kg) + 788
Source:ICMR 1988
Table 4.3 BMR of Indians and Western Adults Subjects Sex Ref.
Body Wt.
BMR Kcal/m2/hr
Per cent
Western Male Female
65 55
39.5 37.0
100 100
Indian Male Female
60 50
34.6 31.6
88 85
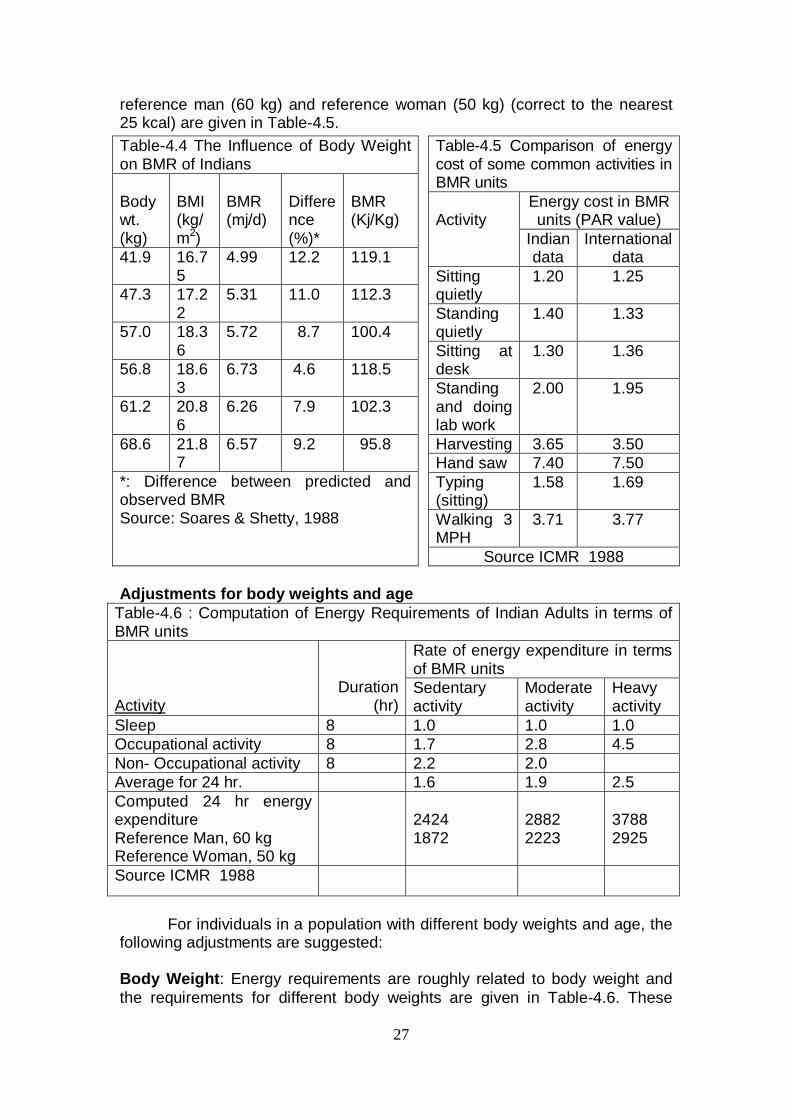
27
reference man (60 kg) and reference woman (50 kg) (correct to the nearest 25 kcal) are given in Table-4.5.
Adjustments for body weights and age
Table-4.6 : Computation of Energy Requirements of Indian Adults in terms of BMR units
Rate of energy expenditure in terms of BMR units
Activity Duration
(hr) Sedentary activity
Moderate activity
Heavy activity
Sleep 8 1.0 1.0 1.0 Occupational activity 8 1.7 2.8 4.5 Non- Occupational activity 8 2.2 2.0 Average for 24 hr. 1.6 1.9 2.5 Computed 24 hr energy expenditure Reference Man, 60 kg Reference Woman, 50 kg
2424 1872
2882 2223
3788 2925
Source ICMR 1988
For individuals in a population with different body weights and age, the
following adjustments are suggested: Body Weight: Energy requirements are roughly related to body weight and the requirements for different body weights are given in Table-4.6. These
Table-4.4 The Influence of Body Weight on BMR of Indians Body wt. (kg)
BMI (kg/m2)
BMR (mj/d)
Difference (%)*
BMR (Kj/Kg)
41.9 16.75
4.99 12.2 119.1
47.3 17.22
5.31 11.0 112.3
57.0 18.36
5.72 8.7 100.4
56.8 18.63
6.73 4.6 118.5
61.2 20.86
6.26 7.9 102.3
68.6 21.87
6.57 9.2 95.8
*: Difference between predicted and observed BMR Source: Soares & Shetty, 1988
Table-4.5 Comparison of energy cost of some common activities in BMR units
Energy cost in BMR units (PAR value)
Activity
Indian data
International data
Sitting quietly
1.20 1.25
Standing quietly
1.40 1.33
Sitting at desk
1.30 1.36
Standing and doing lab work
2.00 1.95
Harvesting 3.65 3.50 Hand saw 7.40 7.50 Typing (sitting)
1.58 1.69
Walking 3 MPH
3.71 3.77
Source ICMR 1988
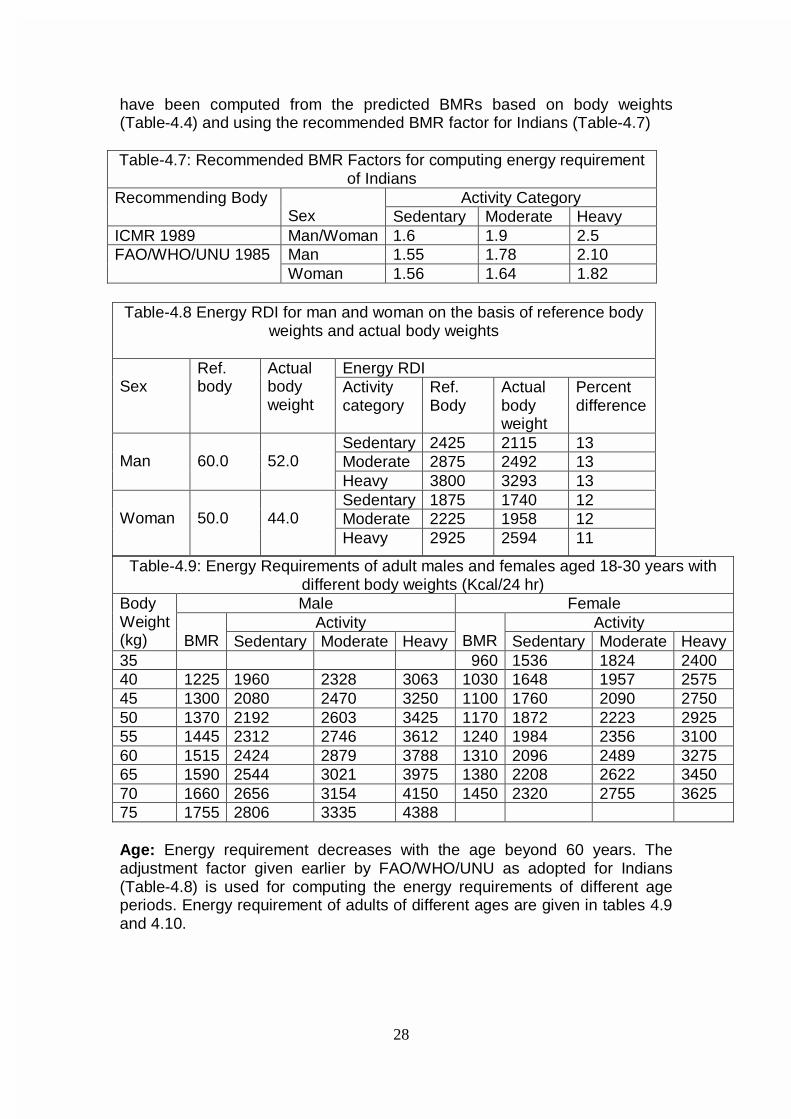
28
have been computed from the predicted BMRs based on body weights (Table-4.4) and using the recommended BMR factor for Indians (Table-4.7) Table-4.7: Recommended BMR Factors for computing energy requirement
of Indians Activity Category Recommending Body
Sex Sedentary Moderate Heavy ICMR 1989 Man/Woman 1.6 1.9 2.5
Man 1.55 1.78 2.10 FAO/WHO/UNU 1985 Woman 1.56 1.64 1.82
Table-4.9: Energy Requirements of adult males and females aged 18-30 years with different body weights (Kcal/24 hr) Male Female
Activity Activity Body Weight (kg)
BMR Sedentary Moderate Heavy
BMR Sedentary Moderate Heavy
35 960 1536 1824 2400 40 1225 1960 2328 3063 1030 1648 1957 2575 45 1300 2080 2470 3250 1100 1760 2090 2750 50 1370 2192 2603 3425 1170 1872 2223 2925 55 1445 2312 2746 3612 1240 1984 2356 3100 60 1515 2424 2879 3788 1310 2096 2489 3275 65 1590 2544 3021 3975 1380 2208 2622 3450 70 1660 2656 3154 4150 1450 2320 2755 3625 75 1755 2806 3335 4388 Age: Energy requirement decreases with the age beyond 60 years. The adjustment factor given earlier by FAO/WHO/UNU as adopted for Indians (Table-4.8) is used for computing the energy requirements of different age periods. Energy requirement of adults of different ages are given in tables 4.9 and 4.10.
Table-4.8 Energy RDI for man and woman on the basis of reference body weights and actual body weights
Energy RDI
Sex Ref. body
Actual body weight
Activity category
Ref. Body
Actual body weight
Percent difference
Sedentary 2425 2115 13 Moderate 2875 2492 13
Man
60.0
52.0
Heavy 3800 3293 13 Sedentary 1875 1740 12 Moderate 2225 1958 12
Woman
50.0
44.0
Heavy 2925 2594 11
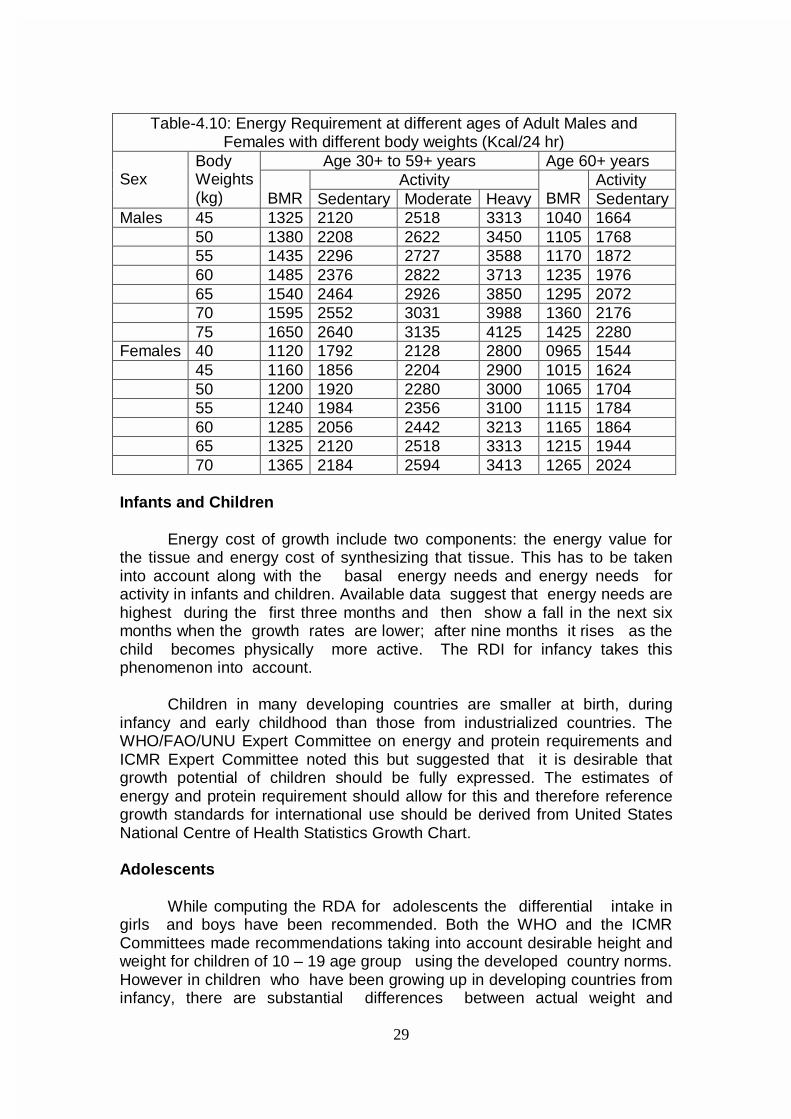
29
Table-4.10: Energy Requirement at different ages of Adult Males and Females with different body weights (Kcal/24 hr)
Age 30+ to 59+ years Age 60+ years Activity Activity
Sex
Body Weights (kg)
BMR Sedentary Moderate Heavy
BMR Sedentary
Males 45 1325 2120 2518 3313 1040 1664 50 1380 2208 2622 3450 1105 1768 55 1435 2296 2727 3588 1170 1872 60 1485 2376 2822 3713 1235 1976 65 1540 2464 2926 3850 1295 2072 70 1595 2552 3031 3988 1360 2176 75 1650 2640 3135 4125 1425 2280 Females 40 1120 1792 2128 2800 0965 1544 45 1160 1856 2204 2900 1015 1624 50 1200 1920 2280 3000 1065 1704 55 1240 1984 2356 3100 1115 1784 60 1285 2056 2442 3213 1165 1864 65 1325 2120 2518 3313 1215 1944 70 1365 2184 2594 3413 1265 2024
Infants and Children
Energy cost of growth include two components: the energy value for
the tissue and energy cost of synthesizing that tissue. This has to be taken into account along with the basal energy needs and energy needs for activity in infants and children. Available data suggest that energy needs are highest during the first three months and then show a fall in the next six months when the growth rates are lower; after nine months it rises as the child becomes physically more active. The RDI for infancy takes this phenomenon into account.
Children in many developing countries are smaller at birth, during
infancy and early childhood than those from industrialized countries. The WHO/FAO/UNU Expert Committee on energy and protein requirements and ICMR Expert Committee noted this but suggested that it is desirable that growth potential of children should be fully expressed. The estimates of energy and protein requirement should allow for this and therefore reference growth standards for international use should be derived from United States National Centre of Health Statistics Growth Chart.
Adolescents
While computing the RDA for adolescents the differential intake in
girls and boys have been recommended. Both the WHO and the ICMR Committees made recommendations taking into account desirable height and weight for children of 10 – 19 age group using the developed country norms. However in children who have been growing up in developing countries from infancy, there are substantial differences between actual weight and
30
expected weight based on that of industrialized countries. It is unlikely that any extra food at this stage can accelerate or extend duration of physical growth. Therefore, it might be more realistic to take appropriate weight for height rather than weight for age in adolescents while different countries make their recommendations regarding energy intake. Wherever there are no clear data on acceptable weight for height it is recommended that actual height and median weight for height may be used. Energy Requirement during Pregnancy and Lactation
Traditional belief was that pregnant and lactating women require
additional dietary intake as they have to meet their own nutritional requirements and also supply nutrients to the growing foetus and the infants. Some of the available data indicated that low dietary intake especially in already chronically undernourished women had adverse effect on the health and nutritional status of the mother, course and outcome of pregnancy and birth weight of the offspring.
Both the ICMR and the WHO Expert Groups recommended additional
intake for pregnant and lactating women. WHO had recommended additional 300 Kcal through out pregnancy and 500 additional kilo calories during the first year of lactation. ICMR has recommended additional intake is 300 kcal during the second and third trimester of pregnancy, 550 kcal during the first six months of lactation and 400 kcal during 7- 12 months of lactation.
Epidemiological data from the developed and developing countries
however indicate that in habitually well nourished who eat to appetite there is no increase in dietary intake during pregnancy and lactation; this did not result in any adverse effect either on their own nutritional status or on the course and outcome of pregnancy. Studies undertaken during the eighties have shown that during pregnancy there are adaptive changes; there is a reduction in basal metabolic rate and physical activity during pregnancy; there might be some improvement in the as yet unmeasured efficiency of energy utilisation. The energy and nutrients saved due to these adaptive processes are sufficient to meet the increased requirements for nutrients during pregnancy; so long as there is no reduction in habitual dietary intake there is no deterioration in maternal nutritional status either during pregnancy or during the lactation. In wellnourished individuals, additional intake during pregnancy and lactation results in excessive weight gain and this may lead to obesity.
Intakes needed to correct CED /obesity Adults
Since adults cannot change their height, hence appropriate weight for actual height is to be computed and appropriate dietary intake ensured. Under-nutrition or over-nutrition will require correction by appropriate changes in energy intake. The amount by which the requirement should be increased or decreased to achieve this objective will depend upon the rate at which the desirable weight is to be achieved and the extent to which the deficit or
31
excess consists of lean and fat tissue. The adults who are seriously under weight for their height, there will generally be a loss of both fat stores and lean body mass and therefore to bring their weight into the normal range requires additional amounts of both energy and protein. Clinical experiences suggested that under weight adults who are free from disease could be rehabilitated fairly rapidly if they eat to appetite. Being over weight is due to excess fat. The low energy diet used for the management of obesity if maintained for long periods must supply adequate amounts of protein and other nutrients. Energy Requirement for Catch up Growth in children
Quantitative estimates of requirement of catch up growth are very difficult because the targeted body weight is not fixed but increases with time in a growing child so that the longer the period of rehabilitation the greater the gap to be filled. Secondly two components contribute to the weight deficit viz., height deficit and inadequate dietary intake. The child who is stunt may not be able to compensate the deficit in height. It is impossible to generalize about the amounts of additional energy and protein needed for catch up growth in children who have become under nourished as a result of continuing inadequate dietary intake. The relative contributions of these two factors and their severity will vary in different communities. Clinical monitoring is critical to achieve optimal results.
One of the priority areas of research during the Tenth Plan may be studies to define BMR and energy requirement of healthy adult men and women, adolescents, children and elderly. Simultaneously studies should be taken up to define the dietary intake needed to correct the chronic energy deficiency or excess in each of these groups. There is an urgent need to review all the available data emerging from global and Indian studies and if required revise the RDI for Indians. ICMR has reconstituted their RDI Committee to take all these factors into consideration and come up with appropriate recommendation in dietary intake of Indians. This may be taken up on a priority basis during the Tenth Plan. Energy density of food
Diets consumed by Indians from low income group families are
predominantly cereal based, have low fat content and are not energy dense; young children share the food from family pot . Infants and young children require more energy per kg. weight than adults but they have relatively small stomach capacity. As a result, unlike the adults who have a larger stomach capacity can readily meet their energy needs though the cereal pulse diet taken as three meals, the children from poorer segments of population have problems in meeting their energy needs unless fed five to six times a day (Table 4.11).
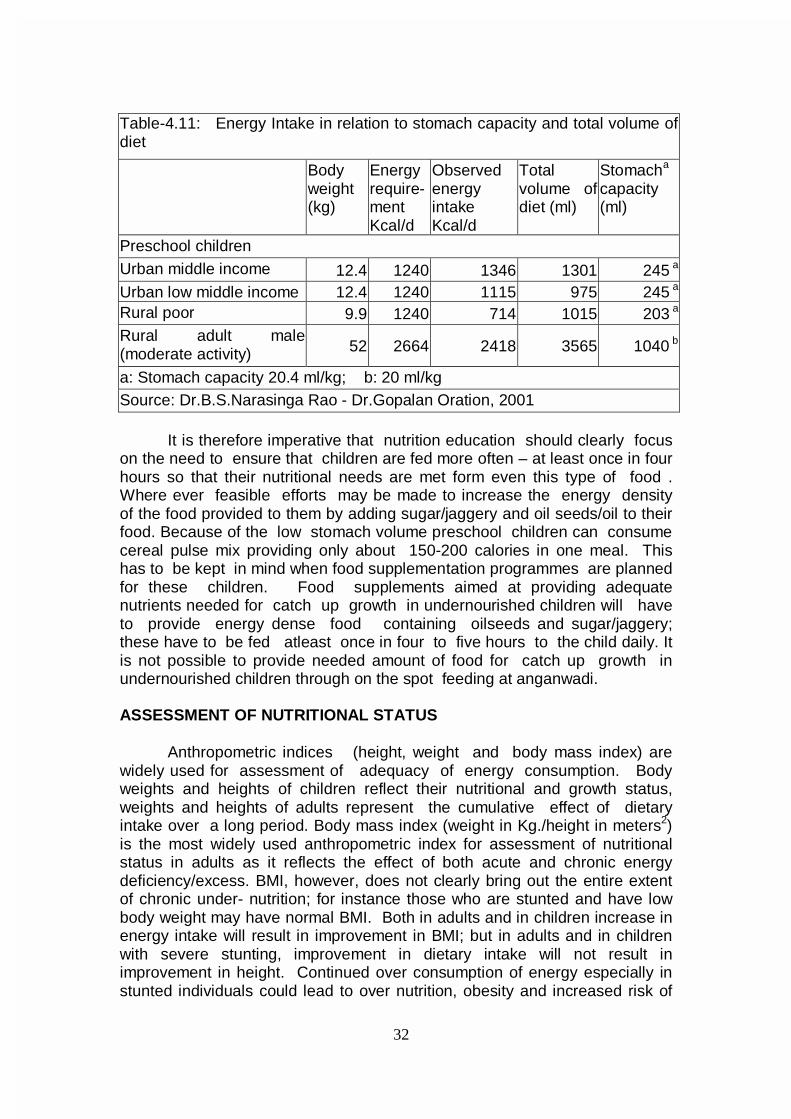
32
Table-4.11: Energy Intake in relation to stomach capacity and total volume of diet
Body weight (kg)
Energy require-ment Kcal/d
Observed energy intake Kcal/d
Total volume of diet (ml)
Stomacha
capacity (ml)
Preschool children Urban middle income 12.4 1240 1346 1301 245 a Urban low middle income 12.4 1240 1115 975 245 a Rural poor 9.9 1240 714 1015 203 a Rural adult male (moderate activity) 52 2664 2418 3565 1040 b
a: Stomach capacity 20.4 ml/kg; b: 20 ml/kg Source: Dr.B.S.Narasinga Rao - Dr.Gopalan Oration, 2001
It is therefore imperative that nutrition education should clearly focus
on the need to ensure that children are fed more often – at least once in four hours so that their nutritional needs are met form even this type of food . Where ever feasible efforts may be made to increase the energy density of the food provided to them by adding sugar/jaggery and oil seeds/oil to their food. Because of the low stomach volume preschool children can consume cereal pulse mix providing only about 150-200 calories in one meal. This has to be kept in mind when food supplementation programmes are planned for these children. Food supplements aimed at providing adequate nutrients needed for catch up growth in undernourished children will have to provide energy dense food containing oilseeds and sugar/jaggery; these have to be fed atleast once in four to five hours to the child daily. It is not possible to provide needed amount of food for catch up growth in undernourished children through on the spot feeding at anganwadi. ASSESSMENT OF NUTRITIONAL STATUS Anthropometric indices (height, weight and body mass index) are widely used for assessment of adequacy of energy consumption. Body weights and heights of children reflect their nutritional and growth status, weights and heights of adults represent the cumulative effect of dietary intake over a long period. Body mass index (weight in Kg./height in meters2) is the most widely used anthropometric index for assessment of nutritional status in adults as it reflects the effect of both acute and chronic energy deficiency/excess. BMI, however, does not clearly bring out the entire extent of chronic under- nutrition; for instance those who are stunted and have low body weight may have normal BMI. Both in adults and in children increase in energy intake will result in improvement in BMI; but in adults and in children with severe stunting, improvement in dietary intake will not result in improvement in height. Continued over consumption of energy especially in stunted individuals could lead to over nutrition, obesity and increased risk of
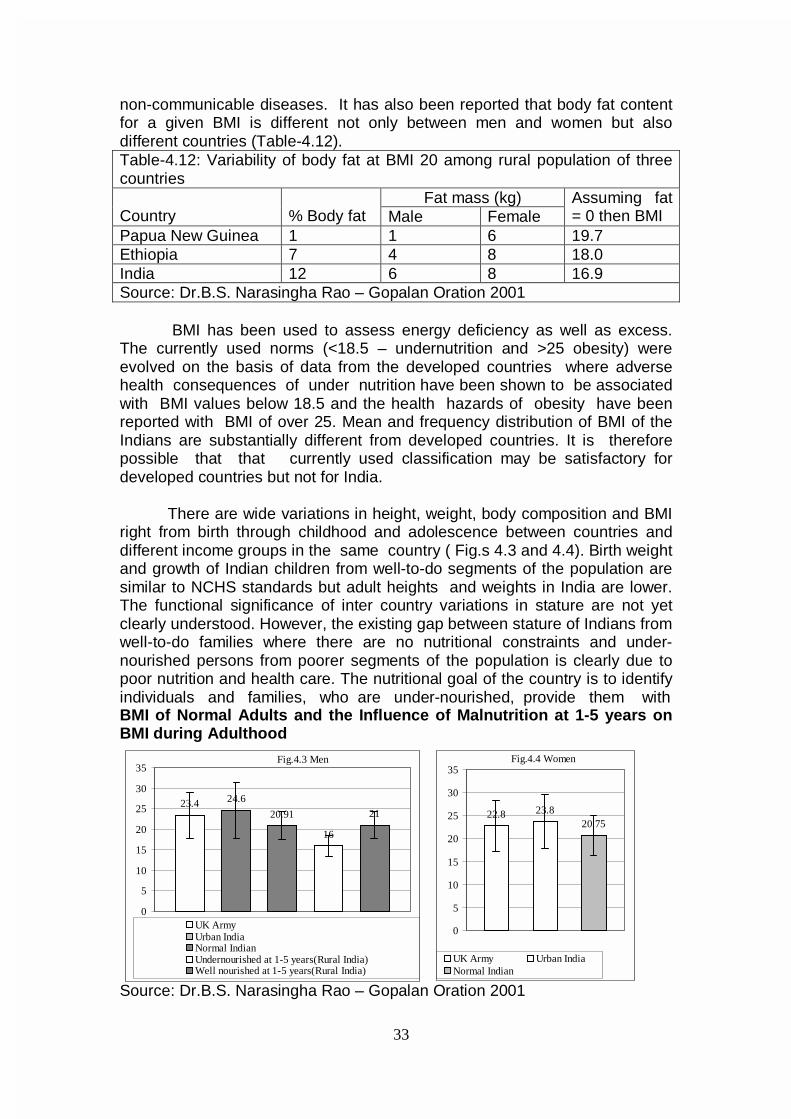
33
non-communicable diseases. It has also been reported that body fat content for a given BMI is different not only between men and women but also different countries (Table-4.12). Table-4.12: Variability of body fat at BMI 20 among rural population of three countries
Fat mass (kg) Country
% Body fat Male Female
Assuming fat = 0 then BMI
Papua New Guinea 1 1 6 19.7 Ethiopia 7 4 8 18.0 India 12 6 8 16.9 Source: Dr.B.S. Narasingha Rao – Gopalan Oration 2001
BMI has been used to assess energy deficiency as well as excess.
The currently used norms (<18.5 – undernutrition and >25 obesity) were evolved on the basis of data from the developed countries where adverse health consequences of under nutrition have been shown to be associated with BMI values below 18.5 and the health hazards of obesity have been reported with BMI of over 25. Mean and frequency distribution of BMI of the Indians are substantially different from developed countries. It is therefore possible that that currently used classification may be satisfactory for developed countries but not for India.
There are wide variations in height, weight, body composition and BMI
right from birth through childhood and adolescence between countries and different income groups in the same country ( Fig.s 4.3 and 4.4). Birth weight and growth of Indian children from well-to-do segments of the population are similar to NCHS standards but adult heights and weights in India are lower. The functional significance of inter country variations in stature are not yet clearly understood. However, the existing gap between stature of Indians from well-to-do families where there are no nutritional constraints and under-nourished persons from poorer segments of the population is clearly due to poor nutrition and health care. The nutritional goal of the country is to identify individuals and families, who are under-nourished, provide them with BMI of Normal Adults and the Influence of Malnutrition at 1-5 years on BMI during Adulthood
Source: Dr.B.S. Narasingha Rao – Gopalan Oration 2001
23.4 24.6
20.91
16
21
0
5
10
15
20
25
30
35
UK ArmyUrban IndiaNormal IndianUndernourished at 1-5 years(Rural India)Well nourished at 1-5 years(Rural India)
Fig.4.3 Men
22.8 23.820.75
0
5
10
15
20
25
30
35
UK Army Urban IndiaNormal Indian
Fig.4.4 Women
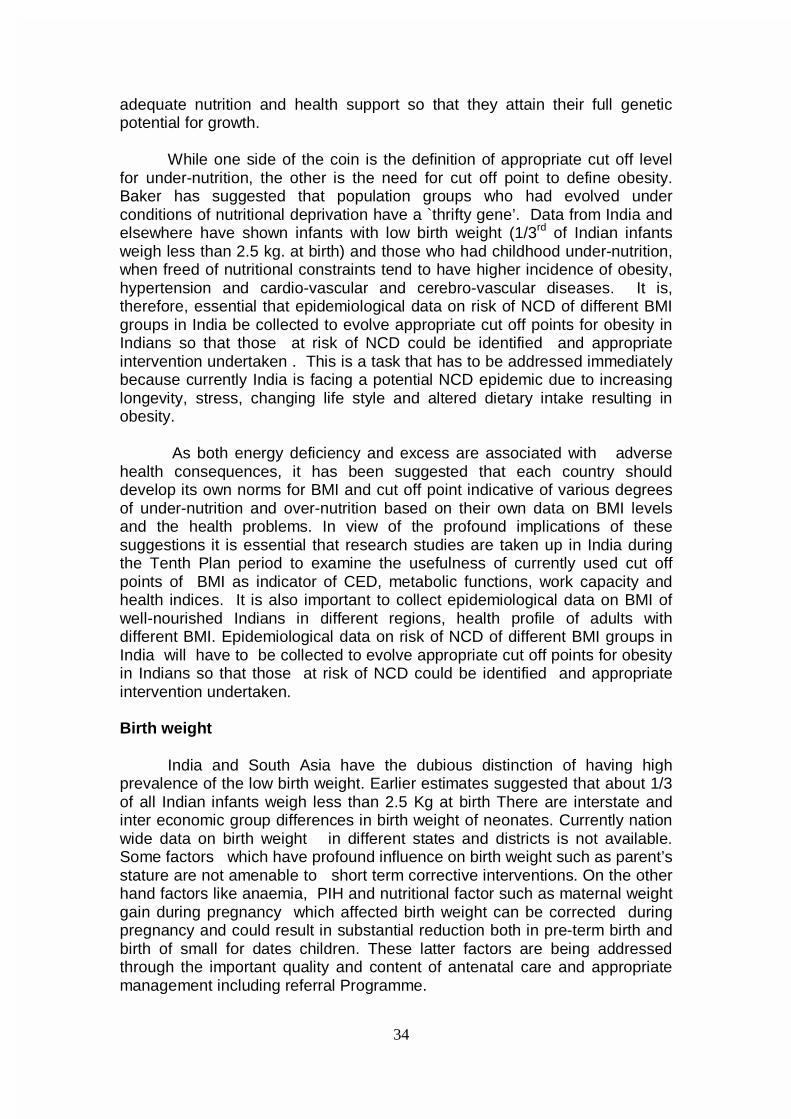
34
adequate nutrition and health support so that they attain their full genetic potential for growth.
While one side of the coin is the definition of appropriate cut off level
for under-nutrition, the other is the need for cut off point to define obesity. Baker has suggested that population groups who had evolved under conditions of nutritional deprivation have a `thrifty gene’. Data from India and elsewhere have shown infants with low birth weight (1/3rd of Indian infants weigh less than 2.5 kg. at birth) and those who had childhood under-nutrition, when freed of nutritional constraints tend to have higher incidence of obesity, hypertension and cardio-vascular and cerebro-vascular diseases. It is, therefore, essential that epidemiological data on risk of NCD of different BMI groups in India be collected to evolve appropriate cut off points for obesity in Indians so that those at risk of NCD could be identified and appropriate intervention undertaken . This is a task that has to be addressed immediately because currently India is facing a potential NCD epidemic due to increasing longevity, stress, changing life style and altered dietary intake resulting in obesity.
As both energy deficiency and excess are associated with adverse
health consequences, it has been suggested that each country should develop its own norms for BMI and cut off point indicative of various degrees of under-nutrition and over-nutrition based on their own data on BMI levels and the health problems. In view of the profound implications of these suggestions it is essential that research studies are taken up in India during the Tenth Plan period to examine the usefulness of currently used cut off points of BMI as indicator of CED, metabolic functions, work capacity and health indices. It is also important to collect epidemiological data on BMI of well-nourished Indians in different regions, health profile of adults with different BMI. Epidemiological data on risk of NCD of different BMI groups in India will have to be collected to evolve appropriate cut off points for obesity in Indians so that those at risk of NCD could be identified and appropriate intervention undertaken.
Birth weight
India and South Asia have the dubious distinction of having high prevalence of the low birth weight. Earlier estimates suggested that about 1/3 of all Indian infants weigh less than 2.5 Kg at birth There are interstate and inter economic group differences in birth weight of neonates. Currently nation wide data on birth weight in different states and districts is not available. Some factors which have profound influence on birth weight such as parent’s stature are not amenable to short term corrective interventions. On the other hand factors like anaemia, PIH and nutritional factor such as maternal weight gain during pregnancy which affected birth weight can be corrected during pregnancy and could result in substantial reduction both in pre-term birth and birth of small for dates children. These latter factors are being addressed through the important quality and content of antenatal care and appropriate management including referral Programme.
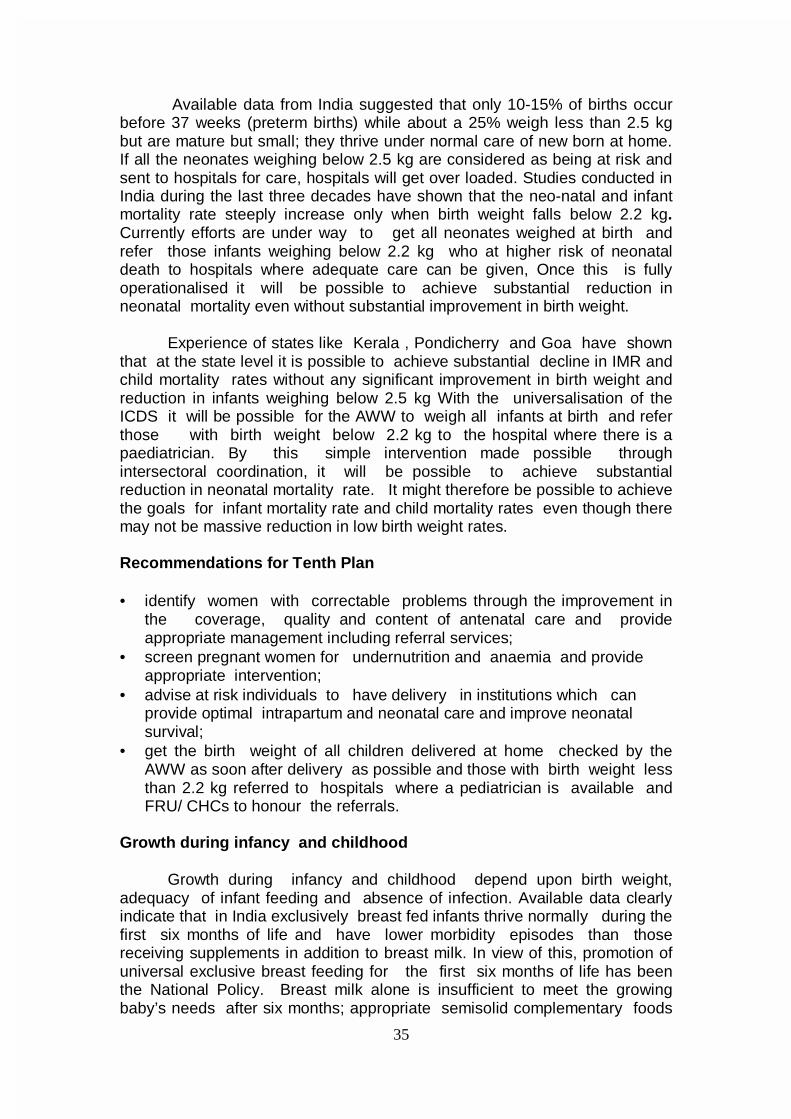
35
Available data from India suggested that only 10-15% of births occur
before 37 weeks (preterm births) while about a 25% weigh less than 2.5 kg but are mature but small; they thrive under normal care of new born at home. If all the neonates weighing below 2.5 kg are considered as being at risk and sent to hospitals for care, hospitals will get over loaded. Studies conducted in India during the last three decades have shown that the neo-natal and infant mortality rate steeply increase only when birth weight falls below 2.2 kg. Currently efforts are under way to get all neonates weighed at birth and refer those infants weighing below 2.2 kg who at higher risk of neonatal death to hospitals where adequate care can be given, Once this is fully operationalised it will be possible to achieve substantial reduction in neonatal mortality even without substantial improvement in birth weight.
Experience of states like Kerala , Pondicherry and Goa have shown
that at the state level it is possible to achieve substantial decline in IMR and child mortality rates without any significant improvement in birth weight and reduction in infants weighing below 2.5 kg With the universalisation of the ICDS it will be possible for the AWW to weigh all infants at birth and refer those with birth weight below 2.2 kg to the hospital where there is a paediatrician. By this simple intervention made possible through intersectoral coordination, it will be possible to achieve substantial reduction in neonatal mortality rate. It might therefore be possible to achieve the goals for infant mortality rate and child mortality rates even though there may not be massive reduction in low birth weight rates. Recommendations for Tenth Plan • identify women with correctable problems through the improvement in
the coverage, quality and content of antenatal care and provide appropriate management including referral services;
• screen pregnant women for undernutrition and anaemia and provide appropriate intervention;
• advise at risk individuals to have delivery in institutions which can provide optimal intrapartum and neonatal care and improve neonatal survival;
• get the birth weight of all children delivered at home checked by the AWW as soon after delivery as possible and those with birth weight less than 2.2 kg referred to hospitals where a pediatrician is available and FRU/ CHCs to honour the referrals.
Growth during infancy and childhood
Growth during infancy and childhood depend upon birth weight,
adequacy of infant feeding and absence of infection. Available data clearly indicate that in India exclusively breast fed infants thrive normally during the first six months of life and have lower morbidity episodes than those receiving supplements in addition to breast milk. In view of this, promotion of universal exclusive breast feeding for the first six months of life has been the National Policy. Breast milk alone is insufficient to meet the growing baby’s needs after six months; appropriate semisolid complementary foods
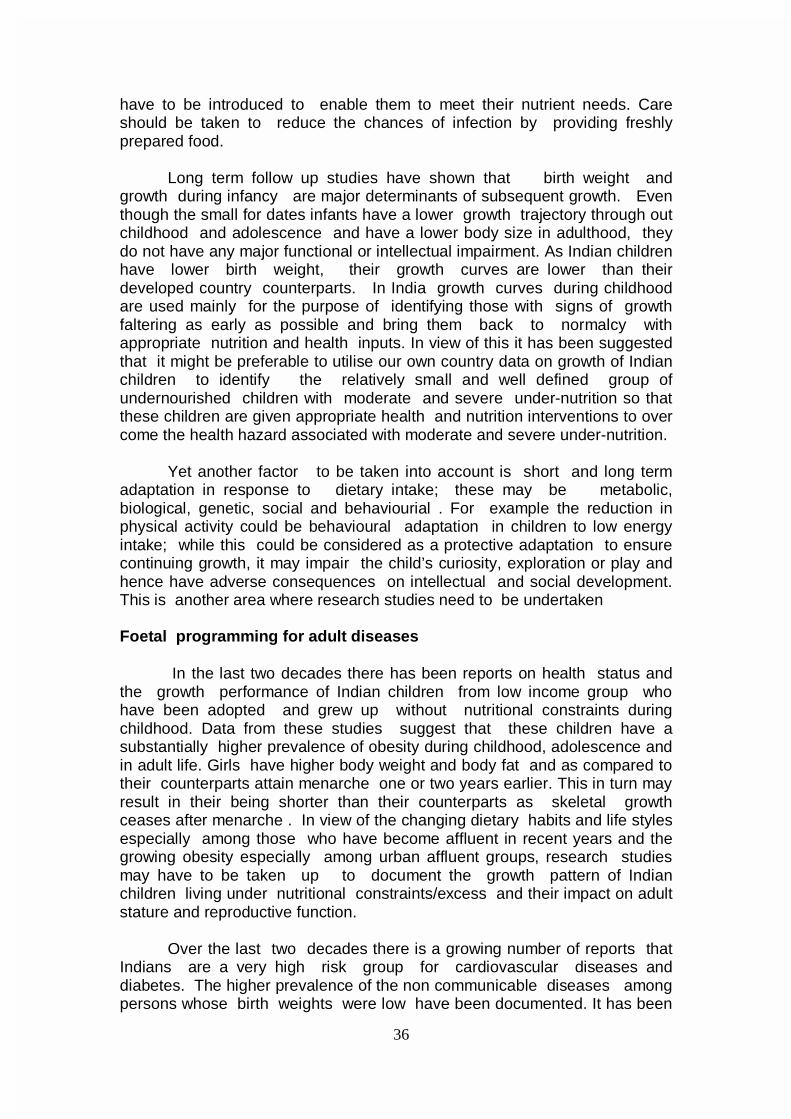
36
have to be introduced to enable them to meet their nutrient needs. Care should be taken to reduce the chances of infection by providing freshly prepared food.
Long term follow up studies have shown that birth weight and
growth during infancy are major determinants of subsequent growth. Even though the small for dates infants have a lower growth trajectory through out childhood and adolescence and have a lower body size in adulthood, they do not have any major functional or intellectual impairment. As Indian children have lower birth weight, their growth curves are lower than their developed country counterparts. In India growth curves during childhood are used mainly for the purpose of identifying those with signs of growth faltering as early as possible and bring them back to normalcy with appropriate nutrition and health inputs. In view of this it has been suggested that it might be preferable to utilise our own country data on growth of Indian children to identify the relatively small and well defined group of undernourished children with moderate and severe under-nutrition so that these children are given appropriate health and nutrition interventions to over come the health hazard associated with moderate and severe under-nutrition.
Yet another factor to be taken into account is short and long term adaptation in response to dietary intake; these may be metabolic, biological, genetic, social and behaviourial . For example the reduction in physical activity could be behavioural adaptation in children to low energy intake; while this could be considered as a protective adaptation to ensure continuing growth, it may impair the child’s curiosity, exploration or play and hence have adverse consequences on intellectual and social development. This is another area where research studies need to be undertaken Foetal programming for adult diseases
In the last two decades there has been reports on health status and the growth performance of Indian children from low income group who have been adopted and grew up without nutritional constraints during childhood. Data from these studies suggest that these children have a substantially higher prevalence of obesity during childhood, adolescence and in adult life. Girls have higher body weight and body fat and as compared to their counterparts attain menarche one or two years earlier. This in turn may result in their being shorter than their counterparts as skeletal growth ceases after menarche . In view of the changing dietary habits and life styles especially among those who have become affluent in recent years and the growing obesity especially among urban affluent groups, research studies may have to be taken up to document the growth pattern of Indian children living under nutritional constraints/excess and their impact on adult stature and reproductive function.
Over the last two decades there is a growing number of reports that
Indians are a very high risk group for cardiovascular diseases and diabetes. The higher prevalence of the non communicable diseases among persons whose birth weights were low have been documented. It has been
37
hypothesized that people who have lived under nutritional constraints over millennia have a “thrifty genes” which enable them to survive and sustain themselves with lower energy intake. Epidemiological studies should be initiated on dietary intake, nutritional status and health status during infancy, childhood, adolescence and adult life to define levels at which functional impairment in health status occur. It is important to look into both under nutrition and over-nutrition so that it will be possible to use these data for early detection and correction of both these nutritional problems and prevent health hazards associated with them.
38
CHAPTER - V IMPROVING NUTRITIONAL STATUS OF VULNERABLE GROUPS
India achieved self-sufficiency in food grains nearly two decades ago and famines no longer stalk the country. Achievement of food adequacy at the national level is a condition, necessary but not sufficient in itself, to ensure the achievement of household nutrition security. Today over 60 million tons of food grains are available with the FCI as buffer stock. Buffer stocks do help to combat acute transient food scarcity, caused by natural disasters like floods and droughts. These acute disasters are, no doubt, now being handled more expeditiously and efficiently than in the past, and several lives are being saved by timely action. Early warning systems are being built up and food can be rushed to areas of threatened distress fairly rapidly. What is proving more difficult, however is the task of combating chronic mild / moderate under-nutrition in large number of poor households. Tribal populations in some states and the poorest of the poor in all the states do not get even two meals a day. Within each household the nutritional needs women, adolescents and children are not fully met. It is suggested that programmes aimed at meeting the nutritional needs and improving the nutritional status of the vulnerable groups may be one of the major thrust areas during the Tenth Plan. Impact of Drought on Nutritional Status
In the past five decades, country has averted large-scale severe under-nutrition or famine; however drought does pose major threat to food security. Drought is due to failure of monsoon; its severity depends upon the extent of failure of monsoon and is usually measured in terms of crop failure. Monsoon failure results in fall in agricultural production and agro based industrial output. This, in turn results in increased unemployment, decreased purchasing power, reduced household food security, migration to urban areas, large scale movement or death of cattle and scarcity of drinking water; small and marginal farmers and landless agricultural workers are the worst affected persons. Over the years, the country has developed system for early recognition and management of transient food security in drought.
Drought Relief Operation during the Ninth Plan
During the Ninth Plan, Rajasthan, Andhra Pradesh and Gujarat were affected by drought. The National Institute of Nutrition conducted a survey in the drought affected districts in these three states to assess the impact of drought and the ongoing intervention programmes on the diet and nutritional status of the population.
All the villages surveyed experienced drop in rainfall, reduction in total
area under cultivation and crop failure. The extent of crop failure varied from village to village as also from crop to crop. Instances of migration were reported in almost all the villages of Rajasthan and Andhra Pradesh and in 17 out of the 30 villages in Gujarat. Of the various relief measures, Andhra Pradesh benefited only from additional ration through PDS. In the other two

39
States, other measures such as food for work, supply of drinking water, essential medicines and cattle feed were also in operation.
The evidence of drought in the form of dried up water tanks and
emaciated cattle was seen in all the districts surveyed; 26% of the households in Gujarat, 64% in Rajasthan and 13% in Andhra Pradesh reported cattle deaths due to scarcity of water and/or fodder. Only 4%, 10% and 33% of the households respectively in Gujarat, Rajasthan and Andhra Pradesh had adequate quantity of cattle feed. Households, which were food insecure, were 11.3% in Andhra Pradesh, 38% in Rajasthan and 55% in Gujarat.
Dietary intake of foodstuffs and nutrients in the drought affected
districts in 2000 and the intake in non-drought conditions from NNMB/INP surveys is indicated in the figures below (figures.5.1-5.6). In respect of Andhra Pradesh and Gujarat, the intake is also compared with the intake during the earlier drought in 1987.
MEAN INTAKE OF FOOD STUFFS MEAN INTAKE OF NUTRIENTS
(g/cu/day) AS PERCENT OF RDA (cu/day) AS PERCENT OF RDA
ANDHRA PRADESH
0
20
40
60
80
100
Prot.(g) E(kcal) Iron(mg) Vit.A(ug)
Perc
ent
Drt. '87 Rural Drt.,2000 Figure 5.1 Figure 5.2
Source: Report on Diet and Nutritional Situation in Drought Affected Areas of Andhra Pradesh, NIN
GUJARAT
0
20
40
60
80
100
120
140
Prot.(g) E(kcal) Iron(mg) Vit.A(ug)
Perc
ent
Drt. '87 Rural Drt.,2000
Figure 5.3 Figure 5.4 Source: Report on Diet and Nutritional Situation in Drought Affected Areas of Gujarat, NIN
0
20
40
60
80
100
120
C & M Pulses GLV M & MP
Perc
ent
Drt. '87 Rural Drt.,2000
0
20
40
60
80
100
120
C & M Pulses GLV M & MP
Perc
ent
Drt. '87 Rural Drt.,2000
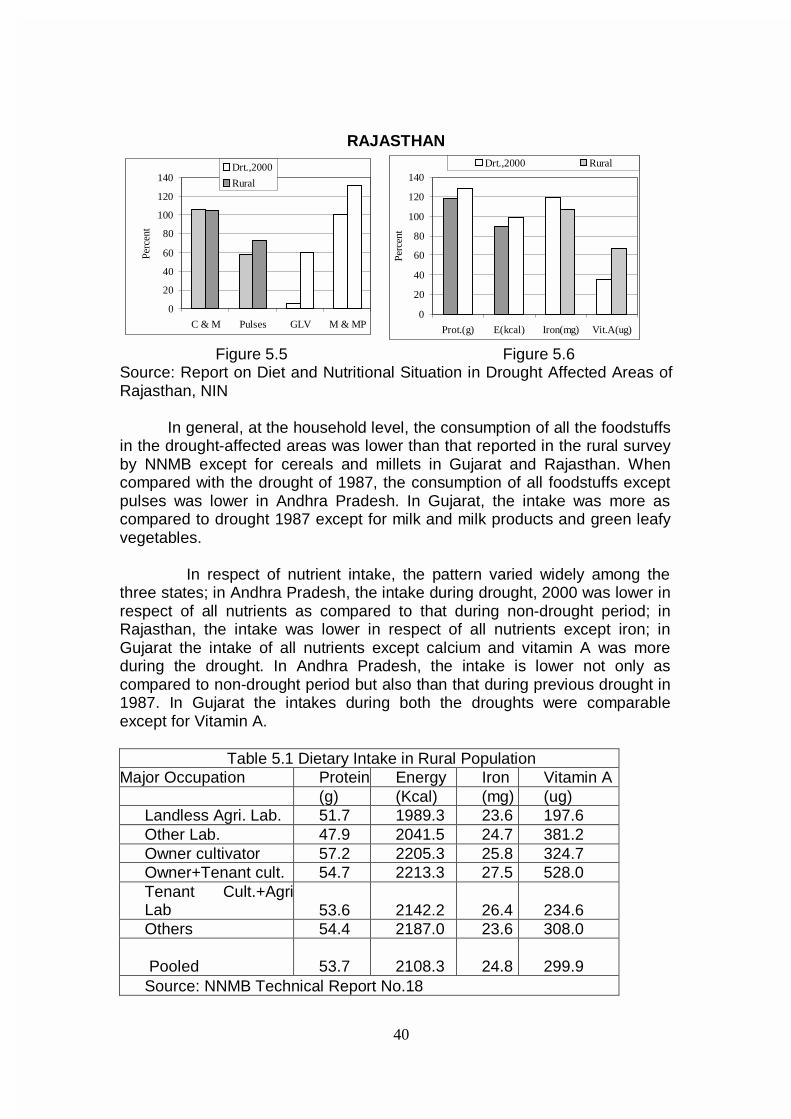
40
RAJASTHAN
0
20
40
60
80
100
120
140
Prot.(g) E(kcal) Iron(mg) Vit.A(ug)
Perc
ent
Drt.,2000 Rural
Figure 5.5 Figure 5.6
Source: Report on Diet and Nutritional Situation in Drought Affected Areas of Rajasthan, NIN
In general, at the household level, the consumption of all the foodstuffs in the drought-affected areas was lower than that reported in the rural survey by NNMB except for cereals and millets in Gujarat and Rajasthan. When compared with the drought of 1987, the consumption of all foodstuffs except pulses was lower in Andhra Pradesh. In Gujarat, the intake was more as compared to drought 1987 except for milk and milk products and green leafy vegetables.
In respect of nutrient intake, the pattern varied widely among the three states; in Andhra Pradesh, the intake during drought, 2000 was lower in respect of all nutrients as compared to that during non-drought period; in Rajasthan, the intake was lower in respect of all nutrients except iron; in Gujarat the intake of all nutrients except calcium and vitamin A was more during the drought. In Andhra Pradesh, the intake is lower not only as compared to non-drought period but also than that during previous drought in 1987. In Gujarat the intakes during both the droughts were comparable except for Vitamin A.
Table 5.1 Dietary Intake in Rural Population
Major Occupation Protein Energy Iron Vitamin A (g) (Kcal) (mg) (ug) Landless Agri. Lab. 51.7 1989.3 23.6 197.6 Other Lab. 47.9 2041.5 24.7 381.2 Owner cultivator 57.2 2205.3 25.8 324.7 Owner+Tenant cult. 54.7 2213.3 27.5 528.0 Tenant Cult.+AgriLab 53.6 2142.2 26.4 234.6 Others 54.4 2187.0 23.6 308.0
Pooled 53.7 2108.3 24.8 299.9
Source: NNMB Technical Report No.18
0
20
40
60
80
100
120
140
C & M Pulses GLV M & MP
Perc
ent
Drt.,2000
Rural
41
Surveys on nutritional status of the rural population conducted by
NNMB have shown that the intake of energy, vitamins and minerals are lower in agricultural laborers as compared to the other segments of the population (Table 5.1) and therefore, they are likely to be worst affected in drought. Among the agriculture families, the children and pregnant are likely to be most adversely affected.
In Rajasthan, there was no increase in prevalence of CED (BMI<18.5) in adults as compared to the non-drought period. However, there was an increase in the prevalence of under-nutrition in pre-school children (64.8%) as compared to non-drought period (46.7%). In Gujarat and Andhra Pradesh, prevalence of CED in children and adults was not more in the drought-affected districts than the prevalence reported under NNMB survey for the entire state. These data suggest that except in children in Rajasthan, the adverse consequences of drought on nutritional status were not significant. This might perhaps be due to the effective measures to provide minimum essential food stuff in the drought affected areas in these states.
Recommendations for the Tenth Plan
Droughts, floods, natural and man-made disasters lead to transient food insecurity. Of these, drought is the most common one. Monitoring of rainfall data provides early warning of drought and monitoring agricultural production provides information about impending food insecurity. Based on these data timely relief measures will be organized. Intensive monitoring of nutritional status especially of the most vulnerable segments of population (poorest of poor and tribal population) and vulnerable groups (pre-school children and tribal and lactating women) will provide the evidence regarding severity of the problem. Apart from the process indicators for monitoring the relief operations, monitoring the nutritional status of pre-school children will provide reliable indicators for assessing the out reach, adequacy and impact of relief measures.
Nutritional Status Of Tribal Population
Census 1991 showed that Scheduled Tribes constitute 8.08% of the total population of the country. The highest concentration of tribal population is found in the North Eastern States, UTs of Lakshadweep and Dadra and Nagar Haveli. High concentration of tribal population is present in the States of Chattisgarh, Jharkhand, Gujarat and Maharashtra.
The tribal population is not a homogeneous one. There are wide variations in the nutritional status, access to and utilisation of nutrition and health services among the tribal populations. The tribal populations in North Eastern States have high literacy levels, they access available facilities, and hence their nutritional and health status is better than national level. On the other hand, primitive tribes such as the Onges in Andaman have very little awareness or access to either nutrition or health care. Differential area-specific need assessment, strategies and programmes to improve access
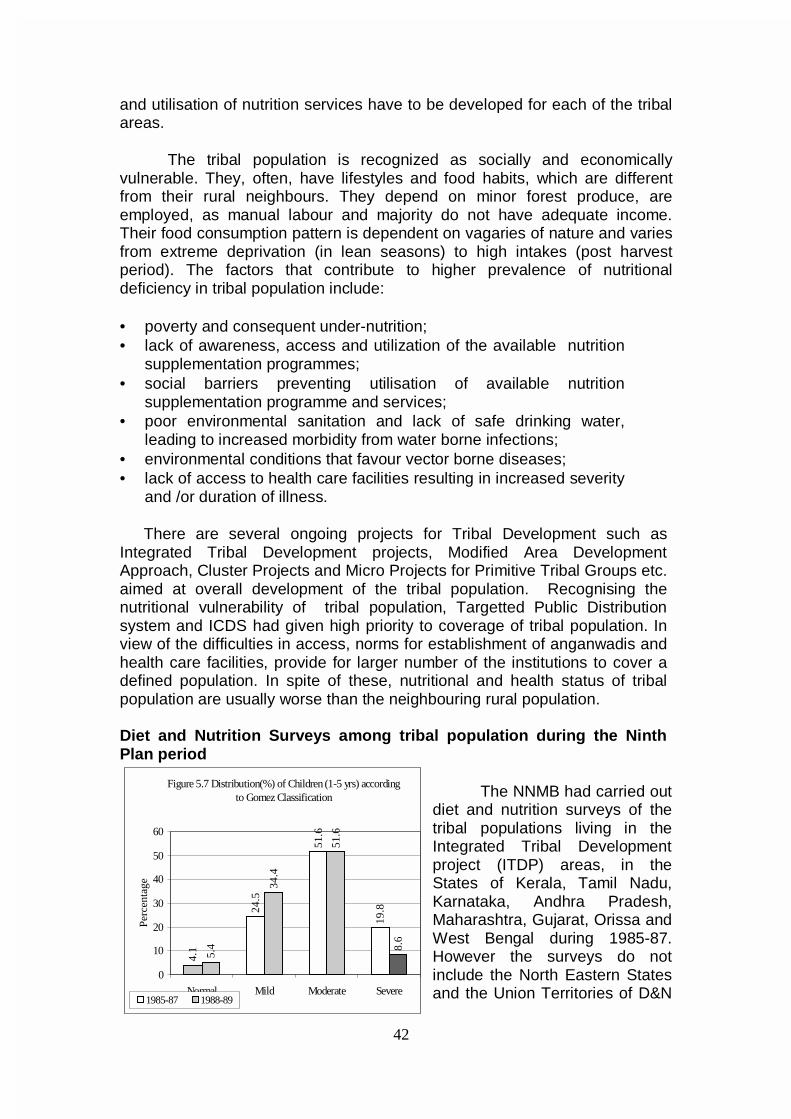
42
and utilisation of nutrition services have to be developed for each of the tribal areas.
The tribal population is recognized as socially and economically vulnerable. They, often, have lifestyles and food habits, which are different from their rural neighbours. They depend on minor forest produce, are employed, as manual labour and majority do not have adequate income. Their food consumption pattern is dependent on vagaries of nature and varies from extreme deprivation (in lean seasons) to high intakes (post harvest period). The factors that contribute to higher prevalence of nutritional deficiency in tribal population include:
• poverty and consequent under-nutrition; • lack of awareness, access and utilization of the available nutrition
supplementation programmes; • social barriers preventing utilisation of available nutrition
supplementation programme and services; • poor environmental sanitation and lack of safe drinking water,
leading to increased morbidity from water borne infections; • environmental conditions that favour vector borne diseases; • lack of access to health care facilities resulting in increased severity
and /or duration of illness.
There are several ongoing projects for Tribal Development such as Integrated Tribal Development projects, Modified Area Development Approach, Cluster Projects and Micro Projects for Primitive Tribal Groups etc. aimed at overall development of the tribal population. Recognising the nutritional vulnerability of tribal population, Targetted Public Distribution system and ICDS had given high priority to coverage of tribal population. In view of the difficulties in access, norms for establishment of anganwadis and health care facilities, provide for larger number of the institutions to cover a defined population. In spite of these, nutritional and health status of tribal population are usually worse than the neighbouring rural population.
Diet and Nutrition Surveys among tribal population during the Ninth Plan period
The NNMB had carried out diet and nutrition surveys of the tribal populations living in the Integrated Tribal Development project (ITDP) areas, in the States of Kerala, Tamil Nadu, Karnataka, Andhra Pradesh, Maharashtra, Gujarat, Orissa and West Bengal during 1985-87. However the surveys do not include the North Eastern States and the Union Territories of D&N
Figure 5.7 Distribution(%) of Children (1-5 yrs) according to Gomez Classification
4.1
24.5
51.6
19.8
5.4
34.4
51.6
8.6
0
10
20
30
40
50
60
Normal Mild Moderate Severe
Perc
enta
ge
1985-87 1988-89
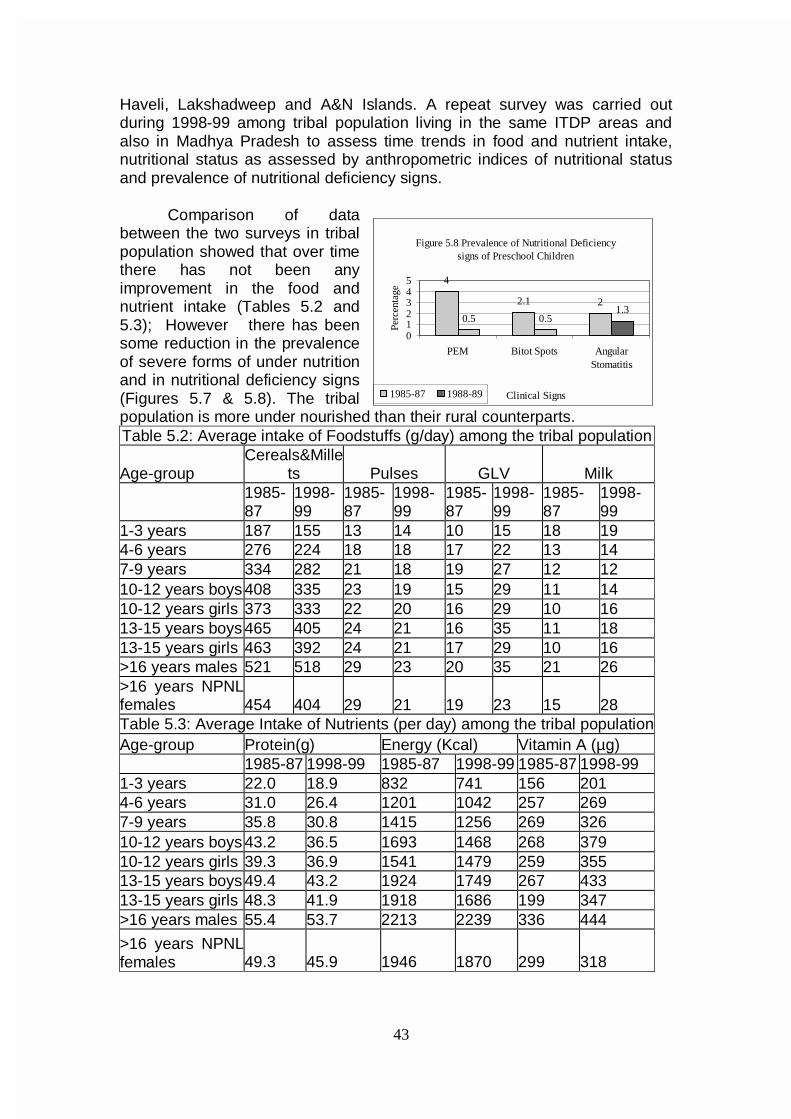
43
Haveli, Lakshadweep and A&N Islands. A repeat survey was carried out during 1998-99 among tribal population living in the same ITDP areas and also in Madhya Pradesh to assess time trends in food and nutrient intake, nutritional status as assessed by anthropometric indices of nutritional status and prevalence of nutritional deficiency signs.
Comparison of data between the two surveys in tribal population showed that over time there has not been any improvement in the food and nutrient intake (Tables 5.2 and 5.3); However there has been some reduction in the prevalence of severe forms of under nutrition and in nutritional deficiency signs (Figures 5.7 & 5.8). The tribal population is more under nourished than their rural counterparts. Table 5.2: Average intake of Foodstuffs (g/day) among the tribal population
Age-group Cereals&Mille
ts Pulses GLV Milk
1985-87
1998-99
1985-87
1998-99
1985-87
1998-99
1985-87
1998-99
1-3 years 187 155 13 14 10 15 18 19 4-6 years 276 224 18 18 17 22 13 14 7-9 years 334 282 21 18 19 27 12 12 10-12 years boys 408 335 23 19 15 29 11 14 10-12 years girls 373 333 22 20 16 29 10 16 13-15 years boys 465 405 24 21 16 35 11 18 13-15 years girls 463 392 24 21 17 29 10 16 >16 years males 521 518 29 23 20 35 21 26 >16 years NPNLfemales 454 404 29 21 19 23 15 28 Table 5.3: Average Intake of Nutrients (per day) among the tribal population Age-group Protein(g) Energy (Kcal) Vitamin A (µg) 1985-87 1998-99 1985-87 1998-99 1985-87 1998-99 1-3 years 22.0 18.9 832 741 156 201 4-6 years 31.0 26.4 1201 1042 257 269 7-9 years 35.8 30.8 1415 1256 269 326 10-12 years boys 43.2 36.5 1693 1468 268 379 10-12 years girls 39.3 36.9 1541 1479 259 355 13-15 years boys 49.4 43.2 1924 1749 267 433 13-15 years girls 48.3 41.9 1918 1686 199 347 >16 years males 55.4 53.7 2213 2239 336 444
>16 years NPNLfemales 49.3 45.9 1946 1870 299 318
Figure 5.8 Prevalence of Nutritional Deficiency signs of Preschool Children
4
2.1 2
0.5 0.51.3
012345
PEM Bitot Spots AngularStomatitis
Clinical SignsPe
rcen
tage
1985-87 1988-89
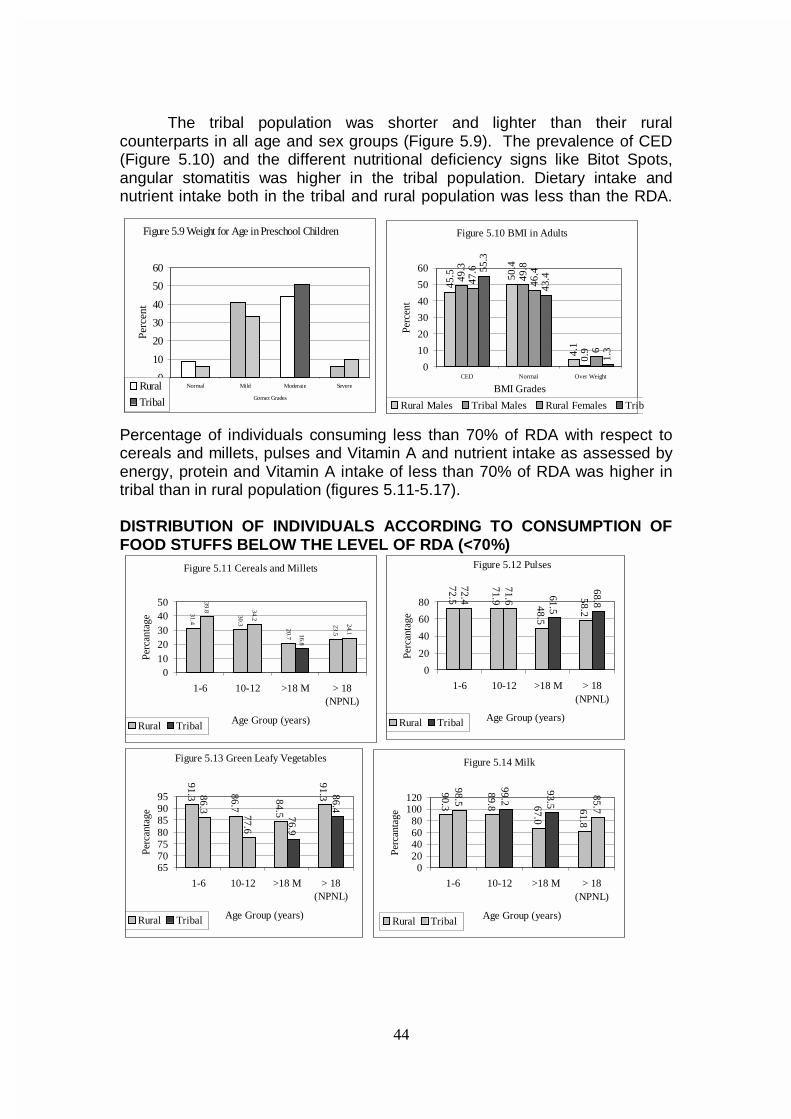
44
The tribal population was shorter and lighter than their rural counterparts in all age and sex groups (Figure 5.9). The prevalence of CED (Figure 5.10) and the different nutritional deficiency signs like Bitot Spots, angular stomatitis was higher in the tribal population. Dietary intake and nutrient intake both in the tribal and rural population was less than the RDA.
Percentage of individuals consuming less than 70% of RDA with respect to cereals and millets, pulses and Vitamin A and nutrient intake as assessed by energy, protein and Vitamin A intake of less than 70% of RDA was higher in tribal than in rural population (figures 5.11-5.17). DISTRIBUTION OF INDIVIDUALS ACCORDING TO CONSUMPTION OF FOOD STUFFS BELOW THE LEVEL OF RDA (<70%)
Figure 5.9 Weight for Age in Preschool Children
0
10
20
30
40
50
60
Normal Mild Moderate Severe
Gomez Grades
Perc
ent
Rural
Tribal
Figure 5.10 BMI in Adults
45.5 50
.4
4.1
49.3
49.8
0.9
47.6
46.4
6
55.3
43.4
1.3
0
10
20
30
40
50
60
CED Normal Over Weight
BMI Grades
Perc
ent
Rural Males Tribal Males Rural Females Trib
Figure 5.11 Cereals and Millets
31.4
30.3
20.7
23.5
39.8 34.2
16.8
24.1
01020304050
1-6 10-12 >18 M > 18(NPNL)
Age Group (years)
Perc
anta
ge
Rural Tribal
Figure 5.12 Pulses
72.5
71.9
48.5
58.2
72.4
71.6 61.5
68.8
0
20
40
60
80
1-6 10-12 >18 M > 18(NPNL)
Age Group (years)
Perc
anta
ge
Rural Tribal
Figure 5.13 Green Leafy Vegetables
91.3 86.7
84.5
91.386.3
77.6
76.9
86.4
65707580859095
1-6 10-12 >18 M > 18(NPNL)
Age Group (years)
Perc
anta
ge
Rural Tribal
Figure 5.14 Milk
90.3
89.8 67.0
61.8
98.5
99.2
93.5
85.7
020406080
100120
1-6 10-12 >18 M > 18(NPNL)
Age Group (years)
Perc
anta
ge
Rural Tribal
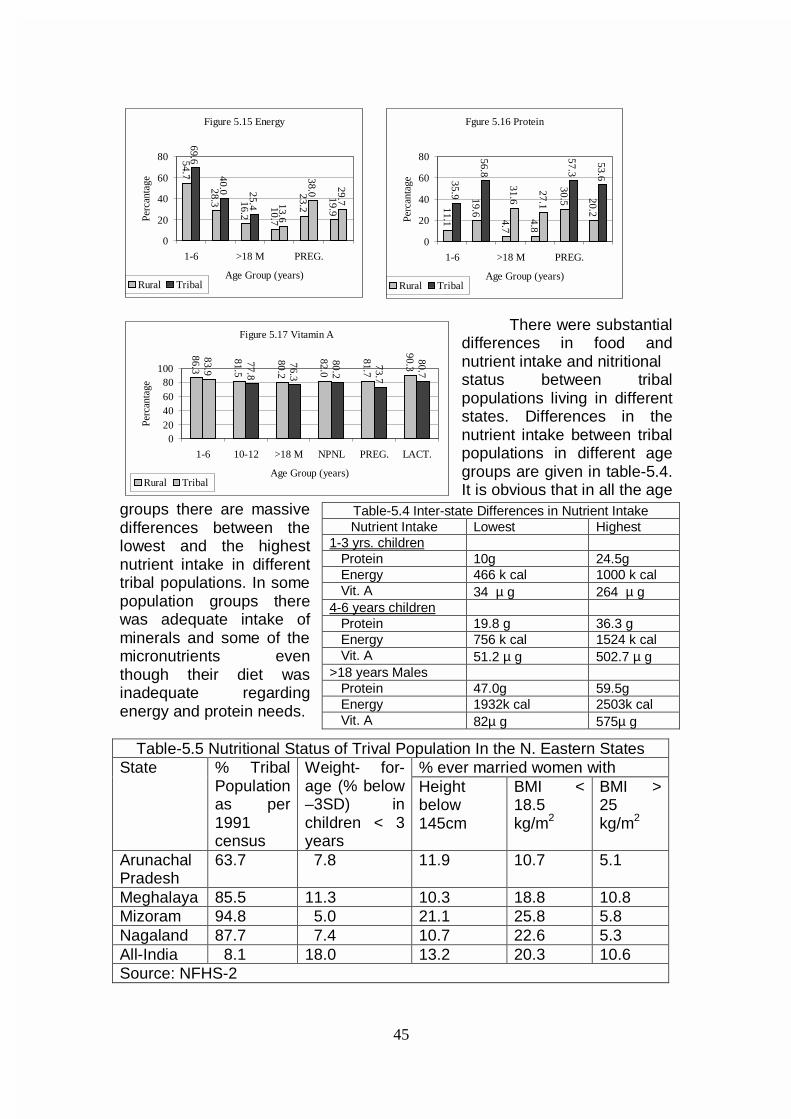
45
Figure 5.15 Energy
54.7
28.3 16.2
10.7
23.2
19.9
69.6
40.0 25.4 13.6
38.0 29.7
0
20
40
60
80
1-6 >18 M PREG.
Age Group (years)
Perc
anta
ge
Rural Tribal
There were substantial differences in food and nutrient intake and nitritional status between tribal populations living in different states. Differences in the nutrient intake between tribal populations in different age groups are given in table-5.4. It is obvious that in all the age
groups there are massive differences between the lowest and the highest nutrient intake in different tribal populations. In some population groups there was adequate intake of minerals and some of the micronutrients even though their diet was inadequate regarding energy and protein needs.
Table-5.5 Nutritional Status of Trival Population In the N. Eastern States
% ever married women with State % Tribal Population as per 1991 census
Weight- for-age (% below –3SD) in children < 3 years
Height below 145cm
BMI < 18.5 kg/m2
BMI > 25 kg/m2
Arunachal Pradesh
63.7 7.8 11.9 10.7 5.1
Meghalaya 85.5 11.3 10.3 18.8 10.8 Mizoram 94.8 5.0 21.1 25.8 5.8 Nagaland 87.7 7.4 10.7 22.6 5.3 All-India 8.1 18.0 13.2 20.3 10.6 Source: NFHS-2
Table-5.4 Inter-state Differences in Nutrient Intake Nutrient Intake Lowest Highest
1-3 yrs. children Protein 10g 24.5g Energy 466 k cal 1000 k cal Vit. A 34 µ g 264 µ g 4-6 years children Protein 19.8 g 36.3 g Energy 756 k cal 1524 k cal Vit. A 51.2 µ g 502.7 µ g >18 years Males Protein 47.0g 59.5g Energy 1932k cal 2503k cal Vit. A 82µ g 575µ g
Fgure 5.16 Protein
11.1
19.6
4.7
4.8
30.5 20.2
35.9
56.8
31.6
27.1
57.3
53.6
0
20
40
60
80
1-6 >18 M PREG.
Age Group (years)
Perc
anta
ge
Rural Tribal
Figure 5.17 Vitamin A
86.3
81.5
80.2
82.0
81.7
90.3
83.9
77.8
76.3
80.2
73.7
80.7
020406080
100
1-6 10-12 >18 M NPNL PREG. LACT.
Age Group (years)
Perc
anta
ge
Rural Tribal
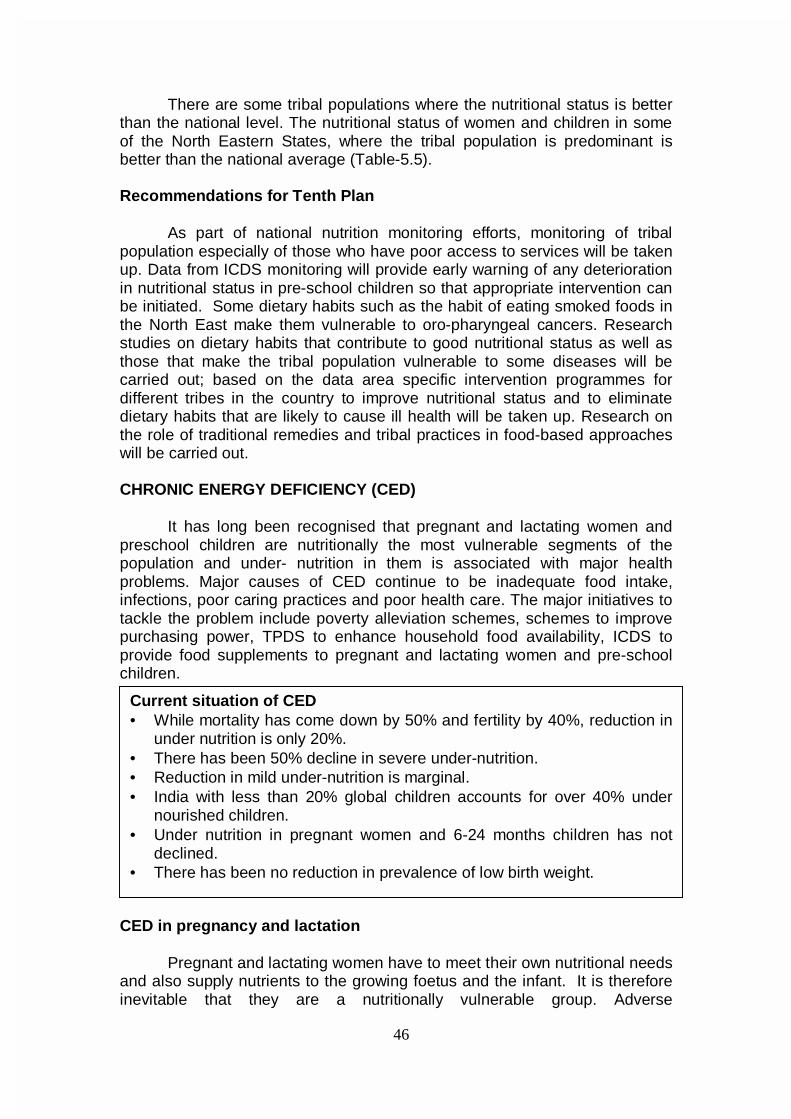
46
There are some tribal populations where the nutritional status is better
than the national level. The nutritional status of women and children in some of the North Eastern States, where the tribal population is predominant is better than the national average (Table-5.5).
Recommendations for Tenth Plan
As part of national nutrition monitoring efforts, monitoring of tribal
population especially of those who have poor access to services will be taken up. Data from ICDS monitoring will provide early warning of any deterioration in nutritional status in pre-school children so that appropriate intervention can be initiated. Some dietary habits such as the habit of eating smoked foods in the North East make them vulnerable to oro-pharyngeal cancers. Research studies on dietary habits that contribute to good nutritional status as well as those that make the tribal population vulnerable to some diseases will be carried out; based on the data area specific intervention programmes for different tribes in the country to improve nutritional status and to eliminate dietary habits that are likely to cause ill health will be taken up. Research on the role of traditional remedies and tribal practices in food-based approaches will be carried out. CHRONIC ENERGY DEFICIENCY (CED)
It has long been recognised that pregnant and lactating women and
preschool children are nutritionally the most vulnerable segments of the population and under- nutrition in them is associated with major health problems. Major causes of CED continue to be inadequate food intake, infections, poor caring practices and poor health care. The major initiatives to tackle the problem include poverty alleviation schemes, schemes to improve purchasing power, TPDS to enhance household food availability, ICDS to provide food supplements to pregnant and lactating women and pre-school children.
CED in pregnancy and lactation
Pregnant and lactating women have to meet their own nutritional needs and also supply nutrients to the growing foetus and the infant. It is therefore inevitable that they are a nutritionally vulnerable group. Adverse
Current situation of CED • While mortality has come down by 50% and fertility by 40%, reduction in
under nutrition is only 20%. • There has been 50% decline in severe under-nutrition. • Reduction in mild under-nutrition is marginal. • India with less than 20% global children accounts for over 40% under
nourished children. • Under nutrition in pregnant women and 6-24 months children has not
declined. • There has been no reduction in prevalence of low birth weight.
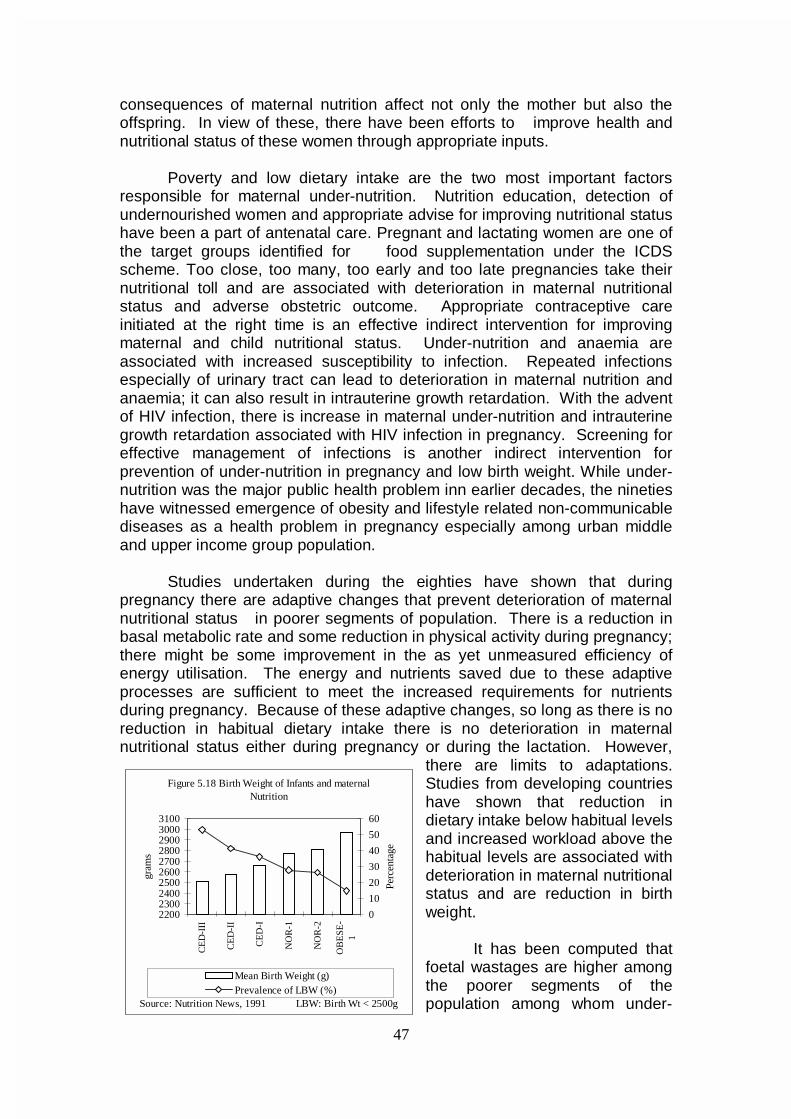
47
consequences of maternal nutrition affect not only the mother but also the offspring. In view of these, there have been efforts to improve health and nutritional status of these women through appropriate inputs.
Poverty and low dietary intake are the two most important factors responsible for maternal under-nutrition. Nutrition education, detection of undernourished women and appropriate advise for improving nutritional status have been a part of antenatal care. Pregnant and lactating women are one of the target groups identified for food supplementation under the ICDS scheme. Too close, too many, too early and too late pregnancies take their nutritional toll and are associated with deterioration in maternal nutritional status and adverse obstetric outcome. Appropriate contraceptive care initiated at the right time is an effective indirect intervention for improving maternal and child nutritional status. Under-nutrition and anaemia are associated with increased susceptibility to infection. Repeated infections especially of urinary tract can lead to deterioration in maternal nutrition and anaemia; it can also result in intrauterine growth retardation. With the advent of HIV infection, there is increase in maternal under-nutrition and intrauterine growth retardation associated with HIV infection in pregnancy. Screening for effective management of infections is another indirect intervention for prevention of under-nutrition in pregnancy and low birth weight. While under-nutrition was the major public health problem inn earlier decades, the nineties have witnessed emergence of obesity and lifestyle related non-communicable diseases as a health problem in pregnancy especially among urban middle and upper income group population.
Studies undertaken during the eighties have shown that during pregnancy there are adaptive changes that prevent deterioration of maternal nutritional status in poorer segments of population. There is a reduction in basal metabolic rate and some reduction in physical activity during pregnancy; there might be some improvement in the as yet unmeasured efficiency of energy utilisation. The energy and nutrients saved due to these adaptive processes are sufficient to meet the increased requirements for nutrients during pregnancy. Because of these adaptive changes, so long as there is no reduction in habitual dietary intake there is no deterioration in maternal nutritional status either during pregnancy or during the lactation. However,
there are limits to adaptations. Studies from developing countries have shown that reduction in dietary intake below habitual levels and increased workload above the habitual levels are associated with deterioration in maternal nutritional status and are reduction in birth weight.
It has been computed that
foetal wastages are higher among the poorer segments of the population among whom under-
Figure 5.18 Birth Weight of Infants and maternal Nutrition
2200230024002500260027002800290030003100
CE
D-I
II
CE
D-I
I
CE
D-I
NO
R-1
NO
R-2
OB
ESE
-1
gram
s
0
10
20
30
40
50
60
Perc
enta
ge
Mean Birth Weight (g)Prevalence of LBW (%)
LBW: Birth Wt < 2500gSource: Nutrition News, 1991
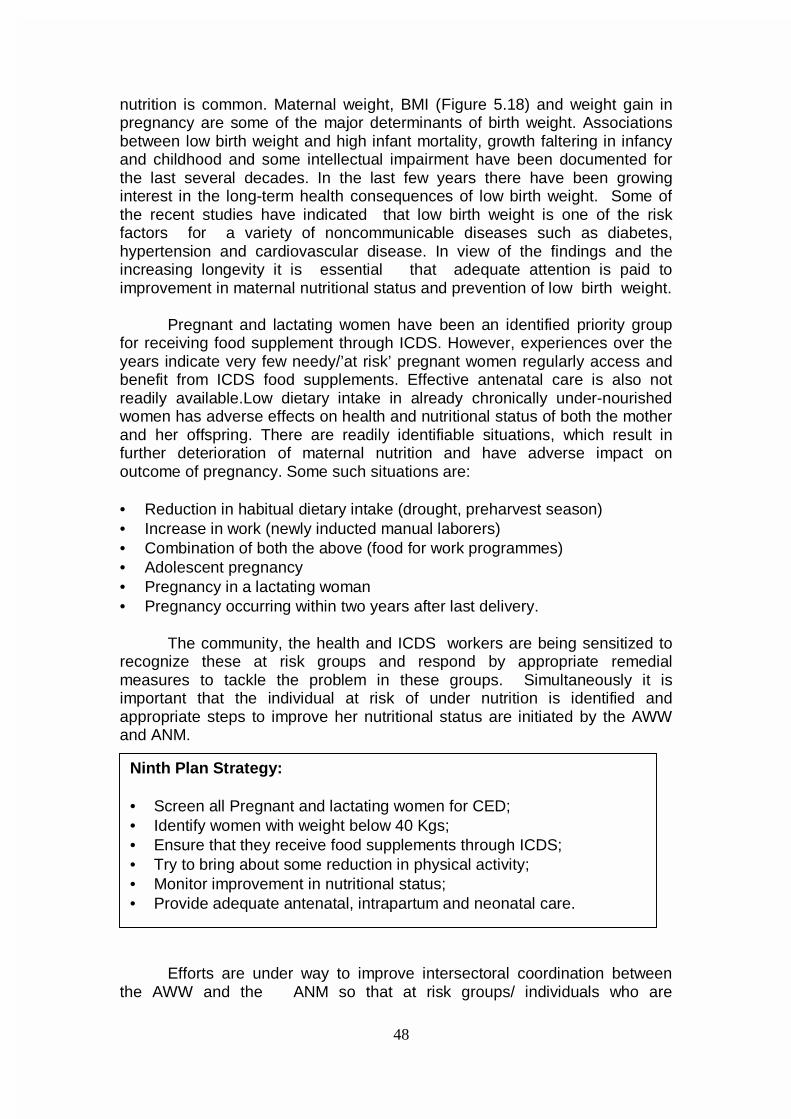
48
nutrition is common. Maternal weight, BMI (Figure 5.18) and weight gain in pregnancy are some of the major determinants of birth weight. Associations between low birth weight and high infant mortality, growth faltering in infancy and childhood and some intellectual impairment have been documented for the last several decades. In the last few years there have been growing interest in the long-term health consequences of low birth weight. Some of the recent studies have indicated that low birth weight is one of the risk factors for a variety of noncommunicable diseases such as diabetes, hypertension and cardiovascular disease. In view of the findings and the increasing longevity it is essential that adequate attention is paid to improvement in maternal nutritional status and prevention of low birth weight.
Pregnant and lactating women have been an identified priority group
for receiving food supplement through ICDS. However, experiences over the years indicate very few needy/’at risk’ pregnant women regularly access and benefit from ICDS food supplements. Effective antenatal care is also not readily available.Low dietary intake in already chronically under-nourished women has adverse effects on health and nutritional status of both the mother and her offspring. There are readily identifiable situations, which result in further deterioration of maternal nutrition and have adverse impact on outcome of pregnancy. Some such situations are:
• Reduction in habitual dietary intake (drought, preharvest season) • Increase in work (newly inducted manual laborers) • Combination of both the above (food for work programmes) • Adolescent pregnancy • Pregnancy in a lactating woman • Pregnancy occurring within two years after last delivery.
The community, the health and ICDS workers are being sensitized to recognize these at risk groups and respond by appropriate remedial measures to tackle the problem in these groups. Simultaneously it is important that the individual at risk of under nutrition is identified and appropriate steps to improve her nutritional status are initiated by the AWW and ANM.
Efforts are under way to improve intersectoral coordination between the AWW and the ANM so that at risk groups/ individuals who are
Ninth Plan Strategy: • Screen all Pregnant and lactating women for CED; • Identify women with weight below 40 Kgs; • Ensure that they receive food supplements through ICDS; • Try to bring about some reduction in physical activity; • Monitor improvement in nutritional status; • Provide adequate antenatal, intrapartum and neonatal care.
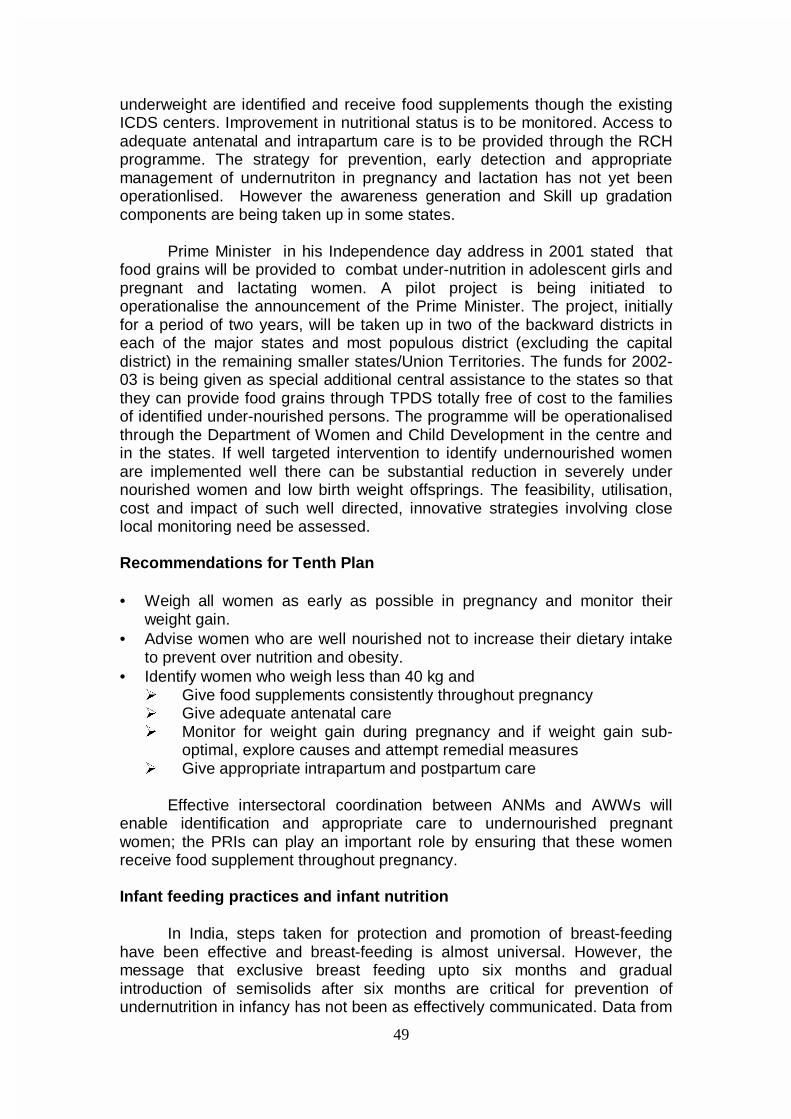
49
underweight are identified and receive food supplements though the existing ICDS centers. Improvement in nutritional status is to be monitored. Access to adequate antenatal and intrapartum care is to be provided through the RCH programme. The strategy for prevention, early detection and appropriate management of undernutriton in pregnancy and lactation has not yet been operationlised. However the awareness generation and Skill up gradation components are being taken up in some states.
Prime Minister in his Independence day address in 2001 stated that food grains will be provided to combat under-nutrition in adolescent girls and pregnant and lactating women. A pilot project is being initiated to operationalise the announcement of the Prime Minister. The project, initially for a period of two years, will be taken up in two of the backward districts in each of the major states and most populous district (excluding the capital district) in the remaining smaller states/Union Territories. The funds for 2002-03 is being given as special additional central assistance to the states so that they can provide food grains through TPDS totally free of cost to the families of identified under-nourished persons. The programme will be operationalised through the Department of Women and Child Development in the centre and in the states. If well targeted intervention to identify undernourished women are implemented well there can be substantial reduction in severely under nourished women and low birth weight offsprings. The feasibility, utilisation, cost and impact of such well directed, innovative strategies involving close local monitoring need be assessed. Recommendations for Tenth Plan • Weigh all women as early as possible in pregnancy and monitor their
weight gain. • Advise women who are well nourished not to increase their dietary intake
to prevent over nutrition and obesity. • Identify women who weigh less than 40 kg and ¾ Give food supplements consistently throughout pregnancy ¾ Give adequate antenatal care ¾ Monitor for weight gain during pregnancy and if weight gain sub-
optimal, explore causes and attempt remedial measures ¾ Give appropriate intrapartum and postpartum care
Effective intersectoral coordination between ANMs and AWWs will
enable identification and appropriate care to undernourished pregnant women; the PRIs can play an important role by ensuring that these women receive food supplement throughout pregnancy. Infant feeding practices and infant nutrition
In India, steps taken for protection and promotion of breast-feeding have been effective and breast-feeding is almost universal. However, the message that exclusive breast feeding upto six months and gradual introduction of semisolids after six months are critical for prevention of undernutrition in infancy has not been as effectively communicated. Data from
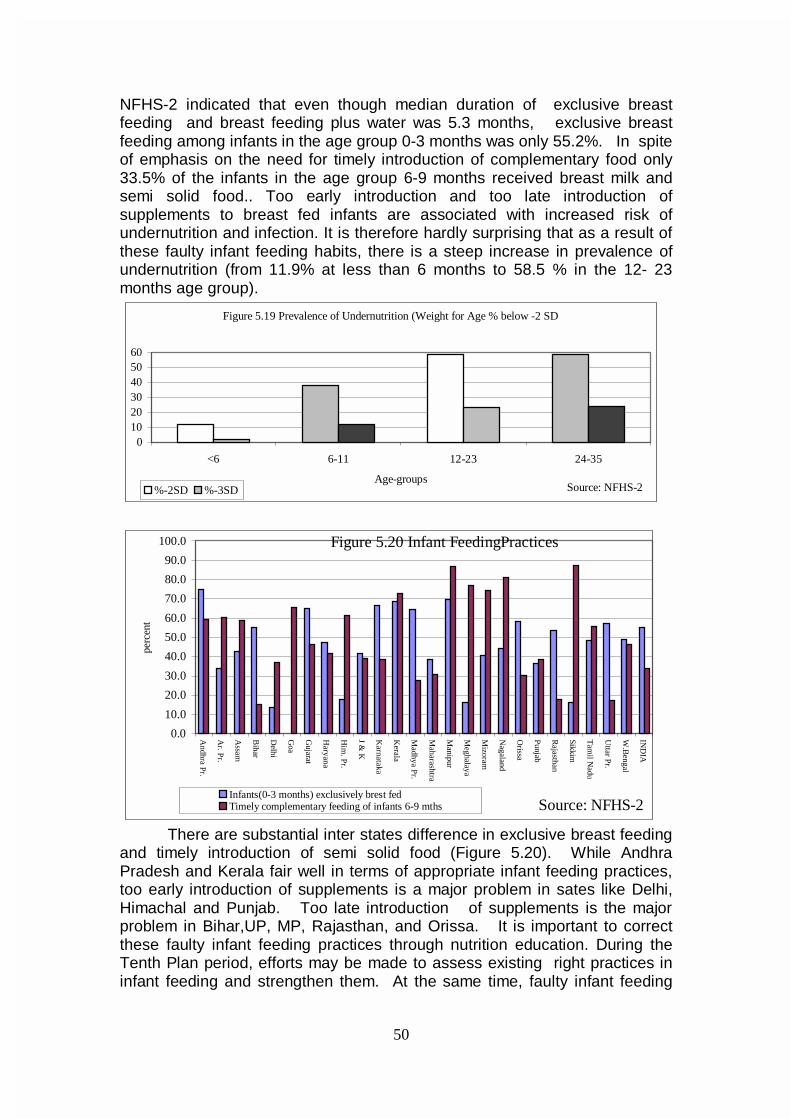
50
NFHS-2 indicated that even though median duration of exclusive breast feeding and breast feeding plus water was 5.3 months, exclusive breast feeding among infants in the age group 0-3 months was only 55.2%. In spite of emphasis on the need for timely introduction of complementary food only 33.5% of the infants in the age group 6-9 months received breast milk and semi solid food.. Too early introduction and too late introduction of supplements to breast fed infants are associated with increased risk of undernutrition and infection. It is therefore hardly surprising that as a result of these faulty infant feeding habits, there is a steep increase in prevalence of undernutrition (from 11.9% at less than 6 months to 58.5 % in the 12- 23 months age group).
Figure 5.19 Prevalence of Undernutrition (Weight for Age % below -2 SD
0102030405060
<6 6-11 12-23 24-35
Age-groups%-2SD %-3SD Source: NFHS-2
0.0
10.0
20.0
30.0
40.0
50.0
60.0
70.0
80.0
90.0
100.0
Andhra P
r.
Ar. P
r.
Assam
Bihar
Delhi
Goa
Gujarat
Haryana
Him
. Pr.
J & K
Karnataka
Kerala
Madhya P
r.
Maharashtra
Manipur
Meghalaya
Mizoram
Nagaland
Orissa
Punjab
Rajasthan
Sikkim
Tam
il Nadu
Uttar Pr.
W.B
engal
IND
IApe
rcen
t
Infants(0-3 months) exclusively brest fedTimely complementary feeding of infants 6-9 mths
Figure 5.20 Infant FeedingPractices
Source: NFHS-2
There are substantial inter states difference in exclusive breast feeding and timely introduction of semi solid food (Figure 5.20). While Andhra Pradesh and Kerala fair well in terms of appropriate infant feeding practices, too early introduction of supplements is a major problem in sates like Delhi, Himachal and Punjab. Too late introduction of supplements is the major problem in Bihar,UP, MP, Rajasthan, and Orissa. It is important to correct these faulty infant feeding practices through nutrition education. During the Tenth Plan period, efforts may be made to assess existing right practices in infant feeding and strengthen them. At the same time, faulty infant feeding
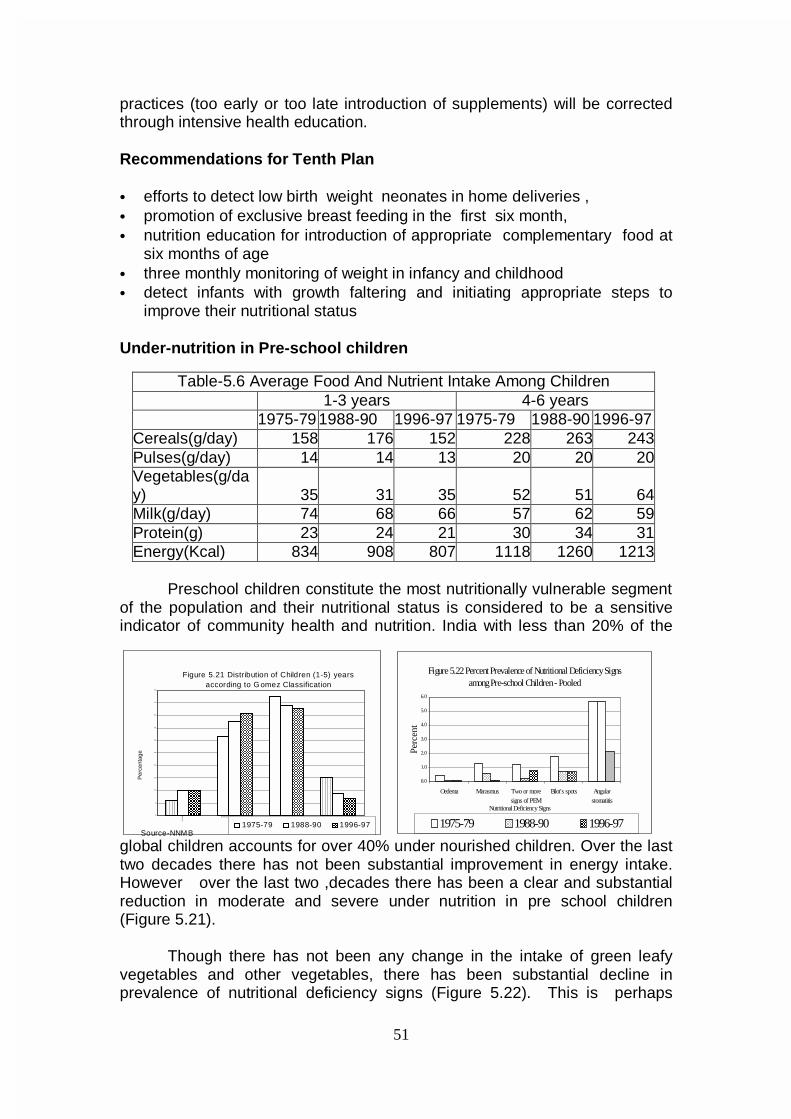
51
Figure 5.22 Percent Prevalence of Nutritional Deficiency Signs among Pre-school Children - Pooled
0.0
1.0
2.0
3.0
4.0
5.0
6.0
Oedema Marasmus Two or moresigns of PEM
Bilot's spots Angularstomatitis
Nutritional Deficiency Signs
Perc
ent
1975-79 1988-90 1996-97
Figure 5.21 Distribution of Children (1-5) years according to Gomez Classification
0
5
10
15
20
25
30
35
40
45
50
No
rma
l
Mild
Mod
erat
e
Se
vereNutri tional Grades
Per
cent
age
1975-79 1988-90 1996-97Source-NNMB
practices (too early or too late introduction of supplements) will be corrected through intensive health education.
Recommendations for Tenth Plan
• efforts to detect low birth weight neonates in home deliveries , • promotion of exclusive breast feeding in the first six month, • nutrition education for introduction of appropriate complementary food at
six months of age • three monthly monitoring of weight in infancy and childhood • detect infants with growth faltering and initiating appropriate steps to
improve their nutritional status Under-nutrition in Pre-school children
Preschool children constitute the most nutritionally vulnerable segment
of the population and their nutritional status is considered to be a sensitive indicator of community health and nutrition. India with less than 20% of the
global children accounts for over 40% under nourished children. Over the last two decades there has not been substantial improvement in energy intake. However over the last two ,decades there has been a clear and substantial reduction in moderate and severe under nutrition in pre school children (Figure 5.21).
Though there has not been any change in the intake of green leafy vegetables and other vegetables, there has been substantial decline in prevalence of nutritional deficiency signs (Figure 5.22). This is perhaps
Table-5.6 Average Food And Nutrient Intake Among Children 1-3 years 4-6 years 1975-79 1988-90 1996-97 1975-79 1988-90 1996-97 Cereals(g/day) 158 176 152 228 263 243 Pulses(g/day) 14 14 13 20 20 20 Vegetables(g/day) 35 31 35 52 51 64 Milk(g/day) 74 68 66 57 62 59 Protein(g) 23 24 21 30 34 31 Energy(Kcal) 834 908 807 1118 1260 1213
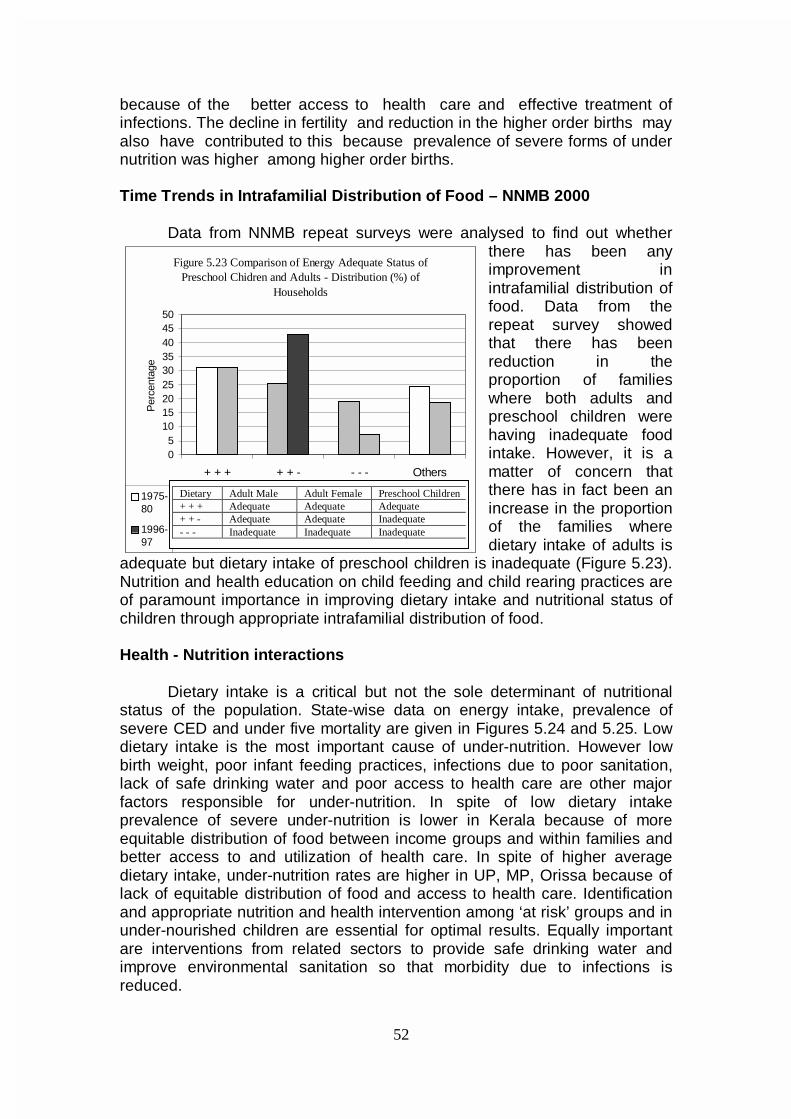
52
because of the better access to health care and effective treatment of infections. The decline in fertility and reduction in the higher order births may also have contributed to this because prevalence of severe forms of under nutrition was higher among higher order births. Time Trends in Intrafamilial Distribution of Food – NNMB 2000 Data from NNMB repeat surveys were analysed to find out whether
there has been any improvement in intrafamilial distribution of food. Data from the repeat survey showed that there has been reduction in the proportion of families where both adults and preschool children were having inadequate food intake. However, it is a matter of concern that there has in fact been an increase in the proportion of the families where dietary intake of adults is
adequate but dietary intake of preschool children is inadequate (Figure 5.23). Nutrition and health education on child feeding and child rearing practices are of paramount importance in improving dietary intake and nutritional status of children through appropriate intrafamilial distribution of food. Health - Nutrition interactions
Dietary intake is a critical but not the sole determinant of nutritional status of the population. State-wise data on energy intake, prevalence of severe CED and under five mortality are given in Figures 5.24 and 5.25. Low dietary intake is the most important cause of under-nutrition. However low birth weight, poor infant feeding practices, infections due to poor sanitation, lack of safe drinking water and poor access to health care are other major factors responsible for under-nutrition. In spite of low dietary intake prevalence of severe under-nutrition is lower in Kerala because of more equitable distribution of food between income groups and within families and better access to and utilization of health care. In spite of higher average dietary intake, under-nutrition rates are higher in UP, MP, Orissa because of lack of equitable distribution of food and access to health care. Identification and appropriate nutrition and health intervention among ‘at risk’ groups and in under-nourished children are essential for optimal results. Equally important are interventions from related sectors to provide safe drinking water and improve environmental sanitation so that morbidity due to infections is reduced.
Figure 5.23 Comparison of Energy Adequate Status of Preschool Chidren and Adults - Distribution (%) of
Households
05
101520253035404550
+ + + + + - - - - Others
Per
cent
age
1975-80
1996-97
Dietary Adult Male Adult Female Preschool Children + + + Adequate Adequate Adequate + + - Adequate Adequate Inadequate - - - Inadequate Inadequate Inadequate
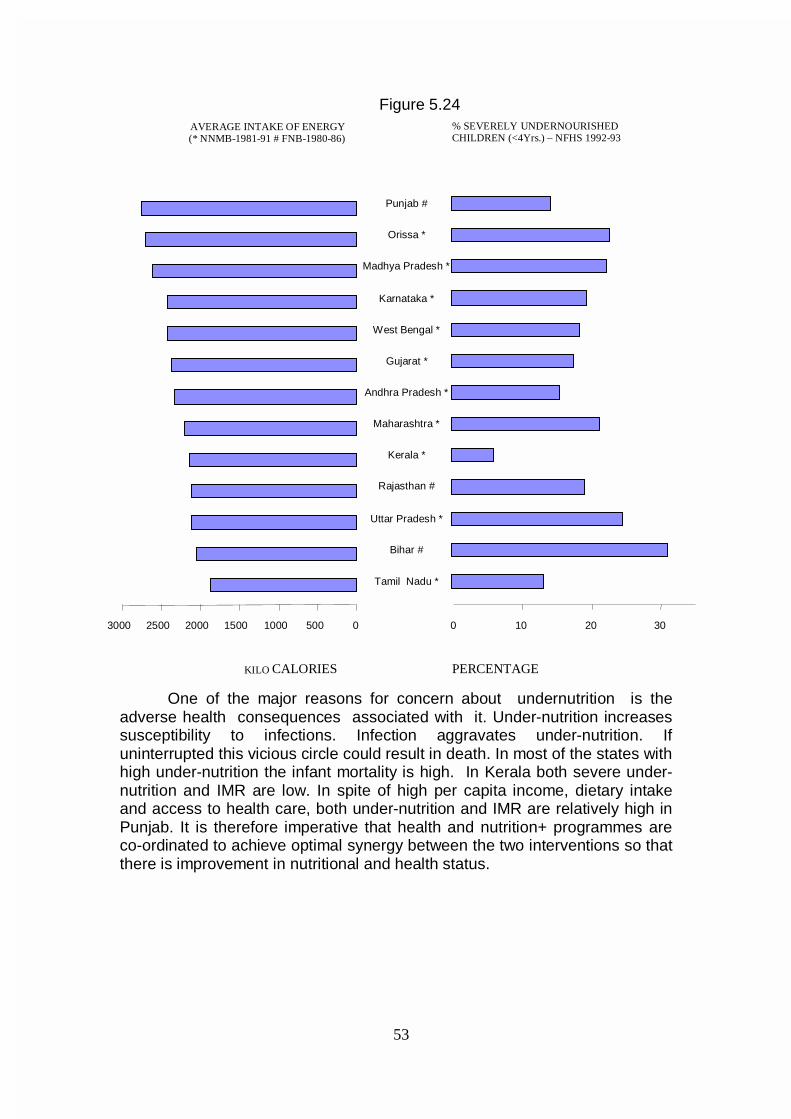
53
Figure 5.24
One of the major reasons for concern about undernutrition is the adverse health consequences associated with it. Under-nutrition increases susceptibility to infections. Infection aggravates under-nutrition. If uninterrupted this vicious circle could result in death. In most of the states with high under-nutrition the infant mortality is high. In Kerala both severe under-nutrition and IMR are low. In spite of high per capita income, dietary intake and access to health care, both under-nutrition and IMR are relatively high in Punjab. It is therefore imperative that health and nutrition+ programmes are co-ordinated to achieve optimal synergy between the two interventions so that there is improvement in nutritional and health status.
0 500 1000 1500 2000 2500 3000 Tamil Nadu *
Bihar # Uttar Pradesh *
Rajasthan # Kerala *
Maharashtra * Andhra Pradesh *
Gujarat * West Bengal *
Karnataka * Madhya Pradesh *
Orissa * Punjab #
AVERAGE INTAKE OF ENERGY (* NNMB-1981-91 # FNB-1980-86)
KILO CALORIES PERCENTAGE
0 10 20 30
% SEVERELY UNDERNOURISHED CHILDREN (<4Yrs.) – NFHS 1992-93
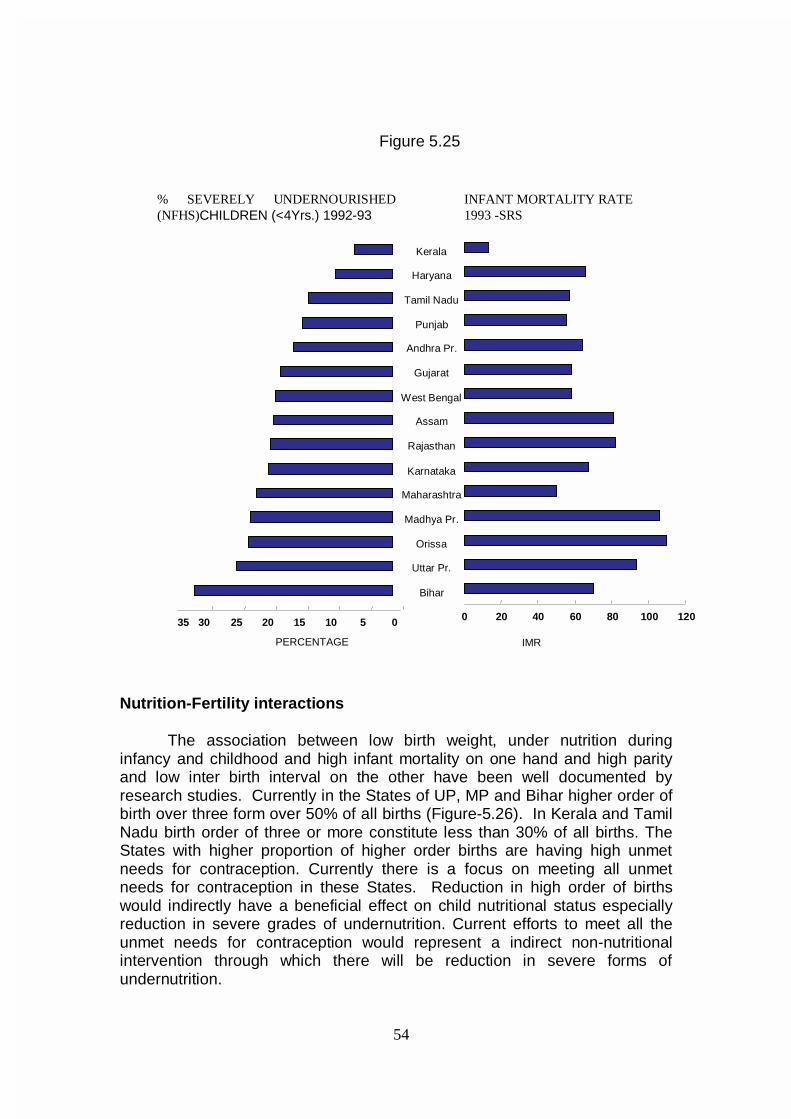
54
Figure 5.25
Nutrition-Fertility interactions
The association between low birth weight, under nutrition during infancy and childhood and high infant mortality on one hand and high parity and low inter birth interval on the other have been well documented by research studies. Currently in the States of UP, MP and Bihar higher order of birth over three form over 50% of all births (Figure-5.26). In Kerala and Tamil Nadu birth order of three or more constitute less than 30% of all births. The States with higher proportion of higher order births are having high unmet needs for contraception. Currently there is a focus on meeting all unmet needs for contraception in these States. Reduction in high order of births would indirectly have a beneficial effect on child nutritional status especially reduction in severe grades of undernutrition. Current efforts to meet all the unmet needs for contraception would represent a indirect non-nutritional intervention through which there will be reduction in severe forms of undernutrition.
Bihar Uttar Pr. Orissa
Madhya Pr. Maharashtra Karnataka Rajasthan
Assam West Bengal
Gujarat Andhra Pr.
Punjab Tamil Nadu
Haryana Kerala
% SEVERELY UNDERNOURISHED(NFHS)CHILDREN (<4Yrs.) 1992-93
0 5 10 15 20 25 30 35 PERCENTAGE
INFANT MORTALITY RATE 1993 -SRS
0 20 40 60 80 100 120 IMR
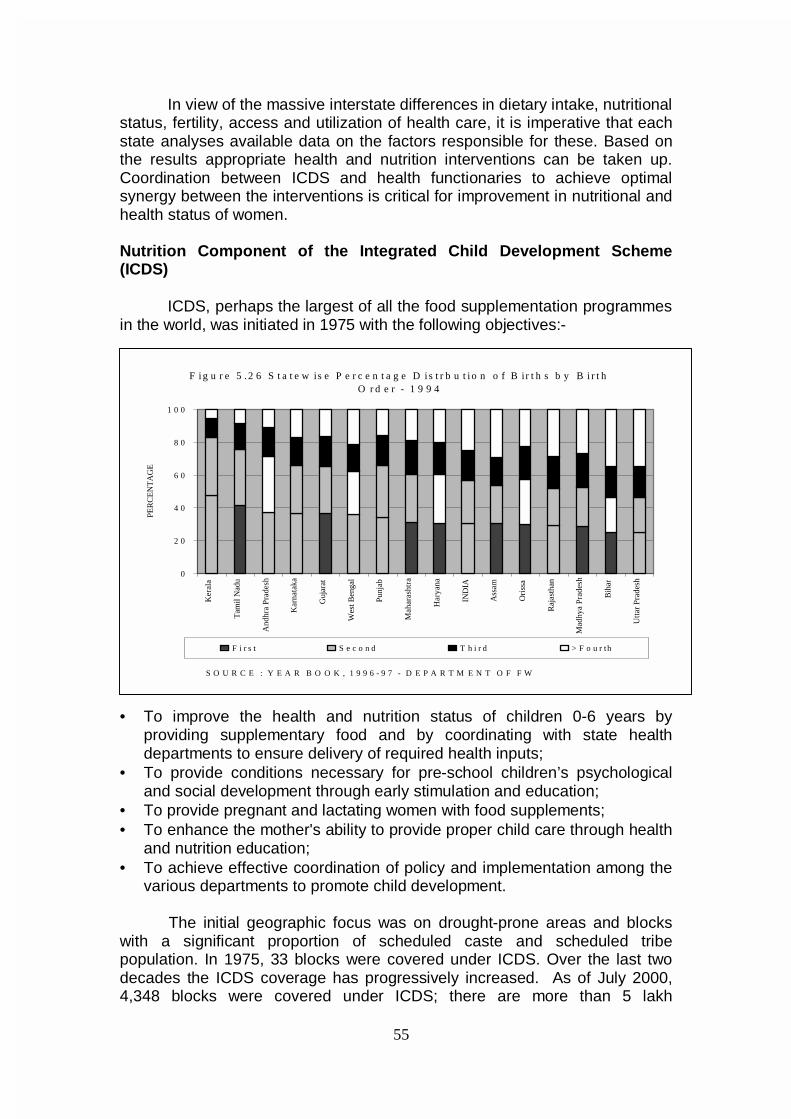
55
In view of the massive interstate differences in dietary intake, nutritional
status, fertility, access and utilization of health care, it is imperative that each state analyses available data on the factors responsible for these. Based on the results appropriate health and nutrition interventions can be taken up. Coordination between ICDS and health functionaries to achieve optimal synergy between the interventions is critical for improvement in nutritional and health status of women. Nutrition Component of the Integrated Child Development Scheme (ICDS)
ICDS, perhaps the largest of all the food supplementation programmes
in the world, was initiated in 1975 with the following objectives:-
• To improve the health and nutrition status of children 0-6 years by
providing supplementary food and by coordinating with state health departments to ensure delivery of required health inputs;
• To provide conditions necessary for pre-school children’s psychological and social development through early stimulation and education;
• To provide pregnant and lactating women with food supplements; • To enhance the mother's ability to provide proper child care through health
and nutrition education; • To achieve effective coordination of policy and implementation among the
various departments to promote child development. The initial geographic focus was on drought-prone areas and blocks with a significant proportion of scheduled caste and scheduled tribe population. In 1975, 33 blocks were covered under ICDS. Over the last two decades the ICDS coverage has progressively increased. As of July 2000, 4,348 blocks were covered under ICDS; there are more than 5 lakh
F i g u r e 5 .2 6 S t a t e w is e P e r c e n t a g e D i s t r b u t i o n o f B ir t h s b y B i r t h O r d e r - 1 9 9 4
0
2 0
4 0
6 0
8 0
1 0 0
Ker
ala
Tam
il N
adu
And
hra
Pra
desh
Kar
nata
ka
Guj
arat
Wes
t Ben
gal
Punj
ab
Mah
aras
htra
Har
yana
IND
IA
Ass
am
Ori
ssa
Raj
asth
an
Mad
hya
Pra
desh
Bih
ar
Utt
ar P
rade
sh
PER
CE
NT
AG
E
F i r s t S e c o n d T h i r d > F o u r th
S O U R C E : Y E A R B O O K , 1 9 9 6 - 9 7 - D E P A R T M E N T O F F W
56
anganwadis in the country. The number of beneficiaries rose from 5.7 million children 0-6 years of age and 1.2 million mothers in 1985 to 26.8 million children and 5.3 million mothers up to September 2000.
The emphasis was initially on providing cooked food through on the spot feeding in the anganwadi because of the belief that • This would ensure that the targeted child would get food supplements and
that food supplements would not be shared between other members of the family.
• The session would provide practical nutrition education to women on cooking and feeding young children.
However, there are disadvantages to on the spot cooked food feeding too;
• Children especially those in the age group 6-36 months can not consume
the entire amount of food provided because their stomach capacity is small
• Even if the older children do eat the food provided in the anganwadi, this acts mainly as a substitute to home food and not addition to the home food.
• The most needy segments may not be able to come to anganwadi and receive the food. Children in the critical 6- 36 month age group and women may not be able to come to the anganwadi daily for the food.
• Providing food supplements only to the children from BPL families or those with undernutrition is not possible as feeding one child and withholding food from another may be difficult when they are all together.
• Cooking food in the anganwadi, feeding the children and cleaning the vessels and the place occupy most of the time of the anganwadi workers and helpers; they do not have enough time for other important activities such as growth monitoring, nutrition education, or pre-school education.
• In any mass cooking and feeding monotony of the food provided and relatively poor quality of the preparations is a problem.
• Cooking under conditions of poor hygiene and keeping food over time may result in bacterial contamination of food;
• As there was no attempt in ensuring that all children are weighed and those with severer grade of under nutrition are identified moderate or severely undernourished children cannot get double the rations as envisaged in the ICDS guideline. As a result there is very little focussed attention on correction of undernutrition and prevention of health problems associated with moderate and severe undenutrition.
• Undernourished children even in the 3-6 year age group if given double rations as envisaged in the ICDS scheme cannot consume all the food at one sitting in the anganwadi.

57
Evaluation of Nutrition Component of ICDS
Nutrition Foundation of India (NFI) and National Institute of Public Cooperation and Child Development (NIPCCD) had conducted evaluation of nutrition component of ICDS. The evaluations have shown that the gains in terms of improvement in nutritional status from the ICDS programme have not been very impressive. (Figure 5.27)
The reasons for this include: • Inadequate coverage of
children below 3 years of age who are at greatest risk of malnutrition;
• Irregularity of food deliveries to anganwadis and hence irregular feeding and inadequate rations;
• Poor nutrition education of mothers and communities to encourage improved feeding practices in the home;
• Inadequate training of workers in nutrition, growth monitoring, and communication;
• Poor supervision; • Poor co-ordination and linkage
with health workers; • Lack of community ownership
and participation; • Even though the programme
envisages special targeting towards malnourished children, who are to be given double the quantity of the supplement, in practice most beneficiaries of supplementary feeding are not selected through nutritional screening.
NCAER also conducted a concurrent evaluation of ICDS in the late nineties. As per the data collected in the first phase of the evaluation, most of the anaganwadi centers are located close to the beneficiaries’ household. More than 90% of the centers had the functionaries in position with nearly 70% residing within the vicinity of the center. However, in majority of the states, record maintenance pertaining to growth monitoring and referral was found to be poor. Only 40%
Table-5.7 %AWCs weighing more than once
State Children with age <36 months >36 months All India 62.2 54.9 Andhra Pr. 74.0 65.6 Assam 58.3 56.4 Bihar 14.9 15.4 Gujarat 77.6 78.1 Haryana 84.5 72.9 Him. Pr. 88.4 80.9 J&K 26.6 25.7 Karnataka 72.9 72.2 Kerala 77.7 78.2 Madhya Pr. 78.4 74.9 Maharashtra 89.8 89.6 Orissa 97.1 96.0 Punjab 28.3 30.9 Rajasthan 51.2 49.4 Tamil Nadu 95.6 49.8 Uttar Pr. 18.7 15.2 West Bengal 49.3 48.7
F igu re 5 .27 P R E V A L E N C E O F M A L N U T R IT I O N ( 0-3 Y ea rs ) W eigh t f o r A g e- IA P C las sif ica tio n
0
5
1 0
1 5
2 0
2 5
3 0
3 5
4 0
4 5
G ra d e s - III & IV G ra d e - II G ra d e - I N o rma l
Perc
enta
ge
IC D S
N O N -IC D SS o urc e- N atio na l E v a lua tio n o f IC D S
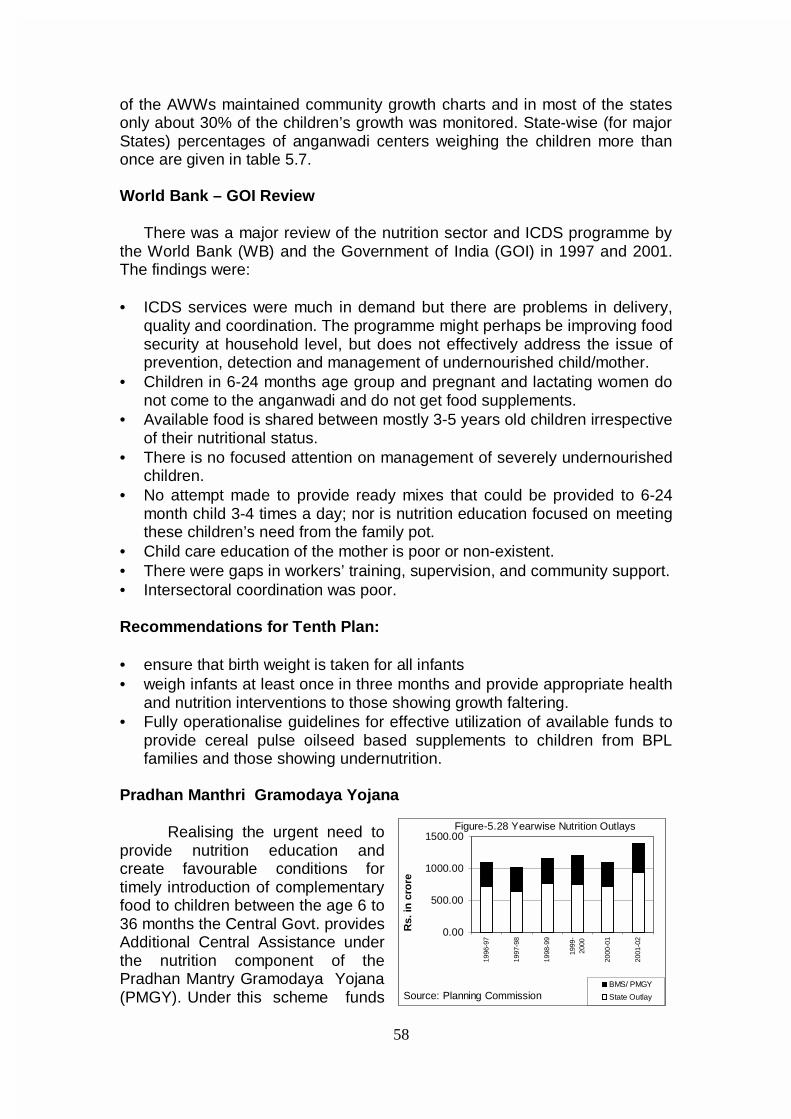
58
of the AWWs maintained community growth charts and in most of the states only about 30% of the children’s growth was monitored. State-wise (for major States) percentages of anganwadi centers weighing the children more than once are given in table 5.7. World Bank – GOI Review
There was a major review of the nutrition sector and ICDS programme by the World Bank (WB) and the Government of India (GOI) in 1997 and 2001. The findings were:
• ICDS services were much in demand but there are problems in delivery,
quality and coordination. The programme might perhaps be improving food security at household level, but does not effectively address the issue of prevention, detection and management of undernourished child/mother.
• Children in 6-24 months age group and pregnant and lactating women do not come to the anganwadi and do not get food supplements.
• Available food is shared between mostly 3-5 years old children irrespective of their nutritional status.
• There is no focused attention on management of severely undernourished children.
• No attempt made to provide ready mixes that could be provided to 6-24 month child 3-4 times a day; nor is nutrition education focused on meeting these children’s need from the family pot.
• Child care education of the mother is poor or non-existent. • There were gaps in workers’ training, supervision, and community support. • Intersectoral coordination was poor. Recommendations for Tenth Plan:
• ensure that birth weight is taken for all infants • weigh infants at least once in three months and provide appropriate health
and nutrition interventions to those showing growth faltering. • Fully operationalise guidelines for effective utilization of available funds to
provide cereal pulse oilseed based supplements to children from BPL families and those showing undernutrition.
Pradhan Manthri Gramodaya Yojana
Realising the urgent need to
provide nutrition education and create favourable conditions for timely introduction of complementary food to children between the age 6 to 36 months the Central Govt. provides Additional Central Assistance under the nutrition component of the Pradhan Mantry Gramodaya Yojana (PMGY). Under this scheme funds
0.00
500.00
1000.00
1500.00
1996
-97
1997
-98
1998
-99
1999
-20
00
2000
-01
2001
-02
Rs.
in c
rore
BMS/ PMGY
State OutlaySource: Planning Commission
Figure-5.28 Yearwise Nutrition Outlays
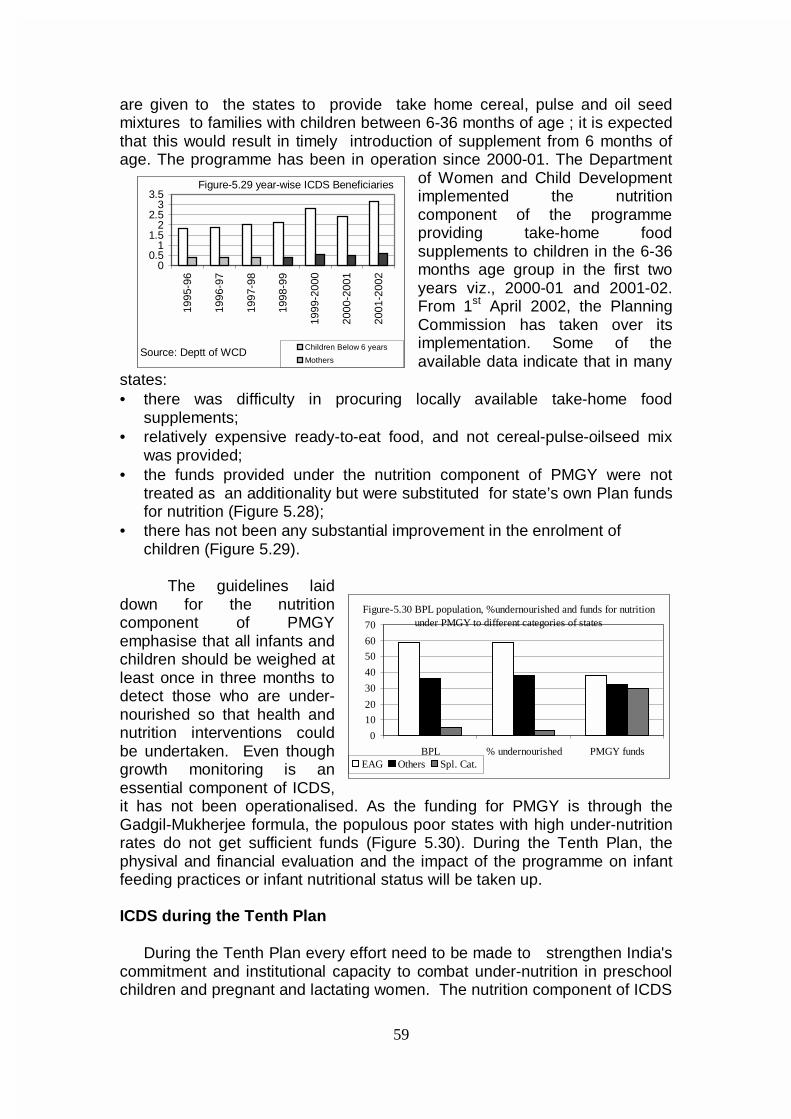
59
are given to the states to provide take home cereal, pulse and oil seed mixtures to families with children between 6-36 months of age ; it is expected that this would result in timely introduction of supplement from 6 months of age. The programme has been in operation since 2000-01. The Department
of Women and Child Development implemented the nutrition component of the programme providing take-home food supplements to children in the 6-36 months age group in the first two years viz., 2000-01 and 2001-02. From 1st April 2002, the Planning Commission has taken over its implementation. Some of the available data indicate that in many
states: • there was difficulty in procuring locally available take-home food
supplements; • relatively expensive ready-to-eat food, and not cereal-pulse-oilseed mix
was provided; • the funds provided under the nutrition component of PMGY were not
treated as an additionality but were substituted for state’s own Plan funds for nutrition (Figure 5.28);
• there has not been any substantial improvement in the enrolment of children (Figure 5.29).
The guidelines laid
down for the nutrition component of PMGY emphasise that all infants and children should be weighed at least once in three months to detect those who are under-nourished so that health and nutrition interventions could be undertaken. Even though growth monitoring is an essential component of ICDS, it has not been operationalised. As the funding for PMGY is through the Gadgil-Mukherjee formula, the populous poor states with high under-nutrition rates do not get sufficient funds (Figure 5.30). During the Tenth Plan, the physival and financial evaluation and the impact of the programme on infant feeding practices or infant nutritional status will be taken up. ICDS during the Tenth Plan
During the Tenth Plan every effort need to be made to strengthen India's commitment and institutional capacity to combat under-nutrition in preschool children and pregnant and lactating women. The nutrition component of ICDS
0
10
20
30
40
50
60
70
BPL % undernourished PMGY fundsEAG Others Spl. Cat.
Figure-5.30 BPL population, %undernourished and funds for nutrition under PMGY to different categories of states
00.5
11.5
22.5
33.5
1995
-96
1996
-97
1997
-98
1998
-99
1999
-200
0
2000
-200
1
2001
-200
2
Children Below 6 years
MothersSource: Deptt of WCD
Figure-5.29 year-wise ICDS Beneficiaries
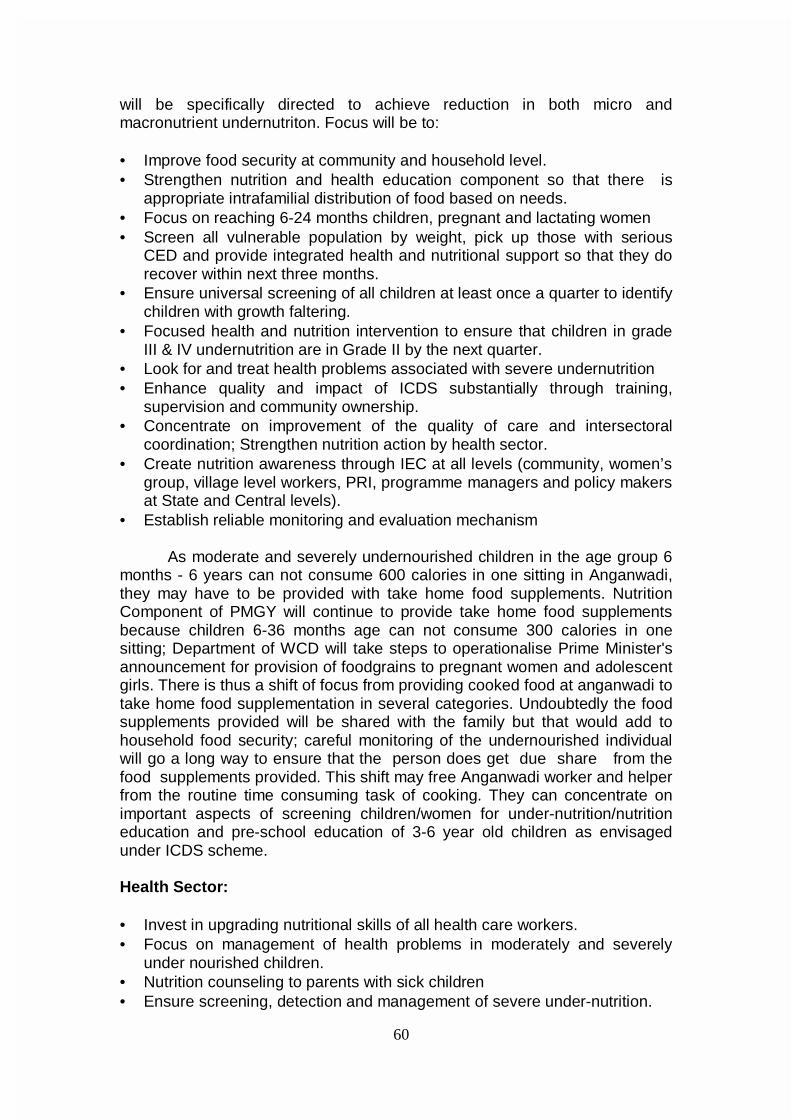
60
will be specifically directed to achieve reduction in both micro and macronutrient undernutriton. Focus will be to:
• Improve food security at community and household level. • Strengthen nutrition and health education component so that there is
appropriate intrafamilial distribution of food based on needs. • Focus on reaching 6-24 months children, pregnant and lactating women • Screen all vulnerable population by weight, pick up those with serious
CED and provide integrated health and nutritional support so that they do recover within next three months.
• Ensure universal screening of all children at least once a quarter to identify children with growth faltering.
• Focused health and nutrition intervention to ensure that children in grade III & IV undernutrition are in Grade II by the next quarter.
• Look for and treat health problems associated with severe undernutrition • Enhance quality and impact of ICDS substantially through training,
supervision and community ownership. • Concentrate on improvement of the quality of care and intersectoral
coordination; Strengthen nutrition action by health sector. • Create nutrition awareness through IEC at all levels (community, women’s
group, village level workers, PRI, programme managers and policy makers at State and Central levels).
• Establish reliable monitoring and evaluation mechanism
As moderate and severely undernourished children in the age group 6 months - 6 years can not consume 600 calories in one sitting in Anganwadi, they may have to be provided with take home food supplements. Nutrition Component of PMGY will continue to provide take home food supplements because children 6-36 months age can not consume 300 calories in one sitting; Department of WCD will take steps to operationalise Prime Minister's announcement for provision of foodgrains to pregnant women and adolescent girls. There is thus a shift of focus from providing cooked food at anganwadi to take home food supplementation in several categories. Undoubtedly the food supplements provided will be shared with the family but that would add to household food security; careful monitoring of the undernourished individual will go a long way to ensure that the person does get due share from the food supplements provided. This shift may free Anganwadi worker and helper from the routine time consuming task of cooking. They can concentrate on important aspects of screening children/women for under-nutrition/nutrition education and pre-school education of 3-6 year old children as envisaged under ICDS scheme. Health Sector: • Invest in upgrading nutritional skills of all health care workers. • Focus on management of health problems in moderately and severely
under nourished children. • Nutrition counseling to parents with sick children • Ensure screening, detection and management of severe under-nutrition.
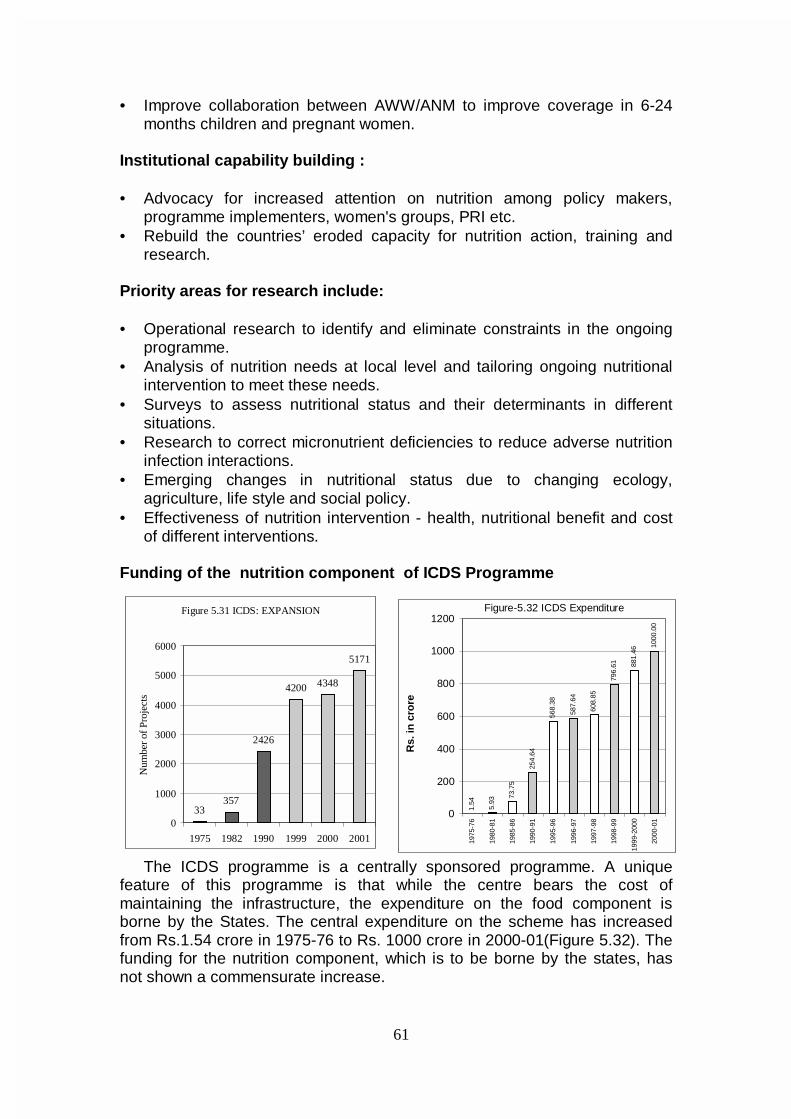
61
• Improve collaboration between AWW/ANM to improve coverage in 6-24
months children and pregnant women.
Institutional capability building : • Advocacy for increased attention on nutrition among policy makers,
programme implementers, women's groups, PRI etc. • Rebuild the countries’ eroded capacity for nutrition action, training and
research. Priority areas for research include: • Operational research to identify and eliminate constraints in the ongoing
programme. • Analysis of nutrition needs at local level and tailoring ongoing nutritional
intervention to meet these needs. • Surveys to assess nutritional status and their determinants in different
situations. • Research to correct micronutrient deficiencies to reduce adverse nutrition
infection interactions. • Emerging changes in nutritional status due to changing ecology,
agriculture, life style and social policy. • Effectiveness of nutrition intervention - health, nutritional benefit and cost
of different interventions. Funding of the nutrition component of ICDS Programme
The ICDS programme is a centrally sponsored programme. A unique feature of this programme is that while the centre bears the cost of maintaining the infrastructure, the expenditure on the food component is borne by the States. The central expenditure on the scheme has increased from Rs.1.54 crore in 1975-76 to Rs. 1000 crore in 2000-01(Figure 5.32). The funding for the nutrition component, which is to be borne by the states, has not shown a commensurate increase.
Figure 5.31 ICDS: EXPANSION
33357
2426
4200 4348
5171
0
1000
2000
3000
4000
5000
6000
1975 1982 1990 1999 2000 2001
Num
ber
of P
roje
cts
1.54
5.93
73.7
5
254.
64
568.
38
587.
64
608.
85
796.
61 881.
46
1000
.00
0
200
400
600
800
1000
1200
1975
-76
1980
-81
1985
-86
1990
-91
1995
-96
1996
-97
1997
-98
1998
-99
1999
-200
0
2000
-01
Rs.
in c
rore
Figure-5.32 ICDS Expenditure
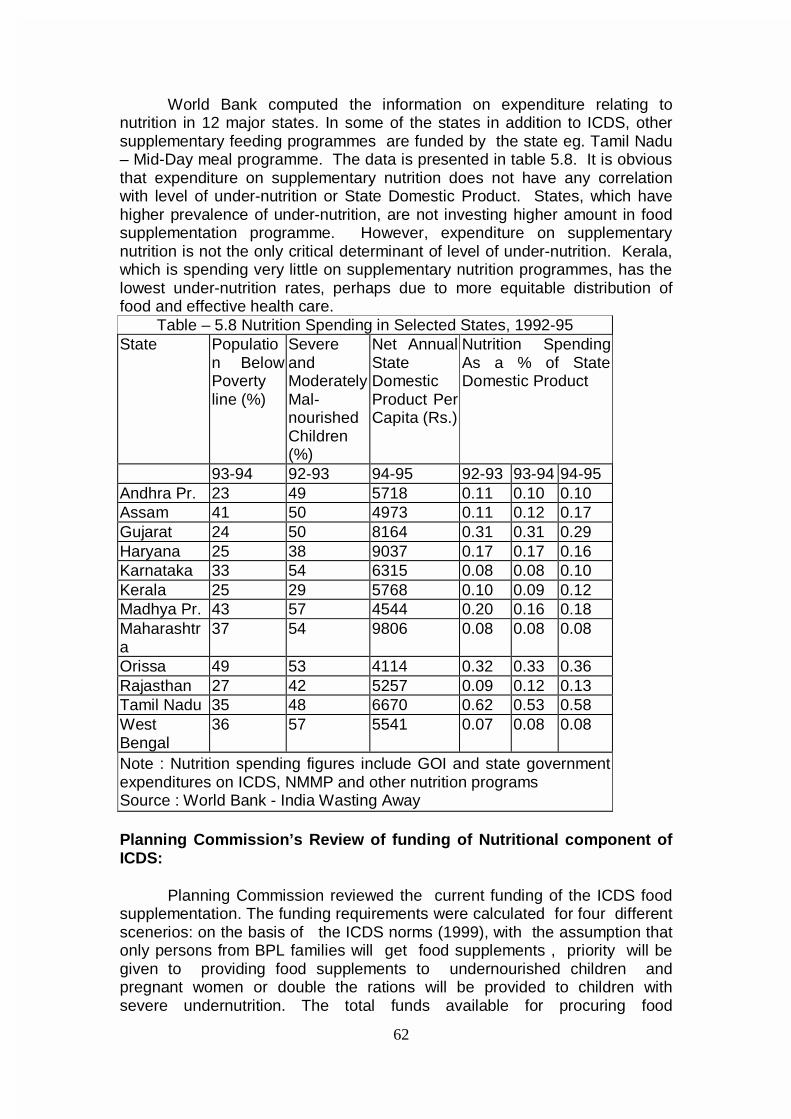
62
World Bank computed the information on expenditure relating to
nutrition in 12 major states. In some of the states in addition to ICDS, other supplementary feeding programmes are funded by the state eg. Tamil Nadu – Mid-Day meal programme. The data is presented in table 5.8. It is obvious that expenditure on supplementary nutrition does not have any correlation with level of under-nutrition or State Domestic Product. States, which have higher prevalence of under-nutrition, are not investing higher amount in food supplementation programme. However, expenditure on supplementary nutrition is not the only critical determinant of level of under-nutrition. Kerala, which is spending very little on supplementary nutrition programmes, has the lowest under-nutrition rates, perhaps due to more equitable distribution of food and effective health care.
Table – 5.8 Nutrition Spending in Selected States, 1992-95 State Populatio
n Below Poverty line (%)
Severe and Moderately Mal-nourished Children (%)
Net Annual State Domestic Product Per Capita (Rs.)
Nutrition Spending As a % of State Domestic Product
93-94 92-93 94-95 92-93 93-94 94-95 Andhra Pr. 23 49 5718 0.11 0.10 0.10 Assam 41 50 4973 0.11 0.12 0.17 Gujarat 24 50 8164 0.31 0.31 0.29 Haryana 25 38 9037 0.17 0.17 0.16 Karnataka 33 54 6315 0.08 0.08 0.10 Kerala 25 29 5768 0.10 0.09 0.12 Madhya Pr. 43 57 4544 0.20 0.16 0.18 Maharashtra
37 54 9806 0.08 0.08 0.08
Orissa 49 53 4114 0.32 0.33 0.36 Rajasthan 27 42 5257 0.09 0.12 0.13 Tamil Nadu 35 48 6670 0.62 0.53 0.58 West Bengal
36 57 5541 0.07 0.08 0.08
Note : Nutrition spending figures include GOI and state government expenditures on ICDS, NMMP and other nutrition programs Source : World Bank - India Wasting Away
Planning Commission’s Review of funding of Nutritional component of ICDS:
Planning Commission reviewed the current funding of the ICDS food supplementation. The funding requirements were calculated for four different scenerios: on the basis of the ICDS norms (1999), with the assumption that only persons from BPL families will get food supplements , priority will be given to providing food supplements to undernourished children and pregnant women or double the rations will be provided to children with severe undernutrition. The total funds available for procuring food
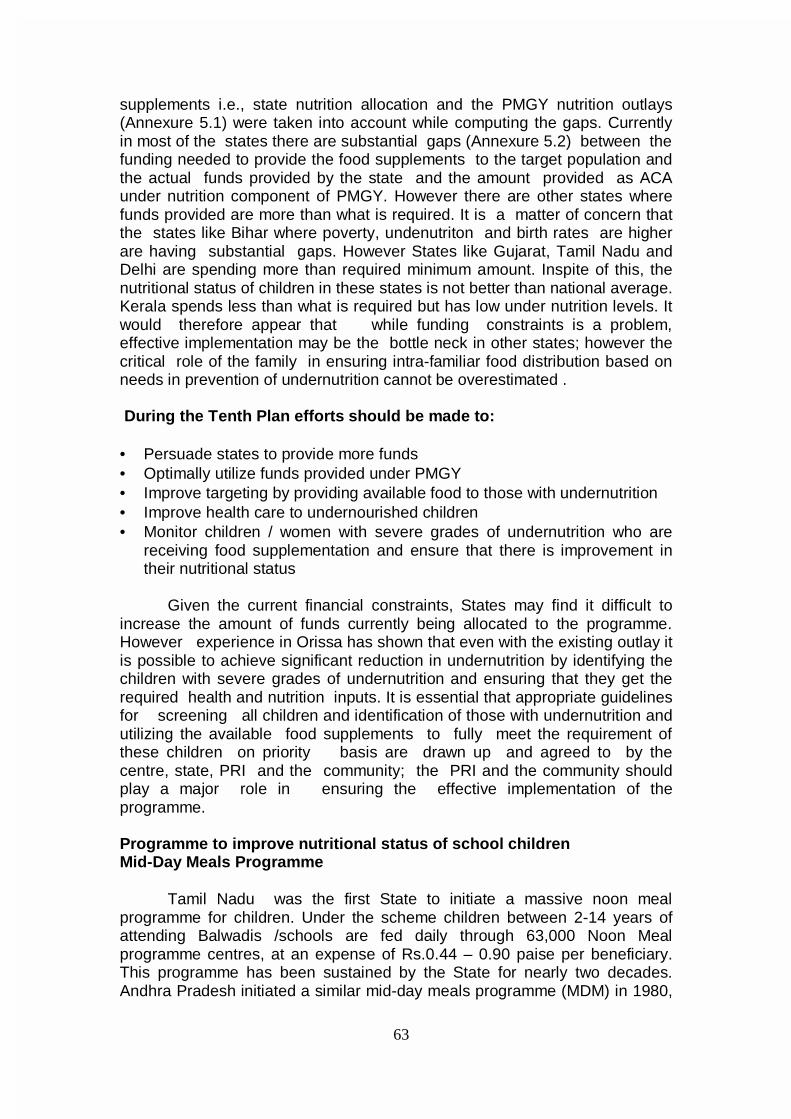
63
supplements i.e., state nutrition allocation and the PMGY nutrition outlays (Annexure 5.1) were taken into account while computing the gaps. Currently in most of the states there are substantial gaps (Annexure 5.2) between the funding needed to provide the food supplements to the target population and the actual funds provided by the state and the amount provided as ACA under nutrition component of PMGY. However there are other states where funds provided are more than what is required. It is a matter of concern that the states like Bihar where poverty, undenutriton and birth rates are higher are having substantial gaps. However States like Gujarat, Tamil Nadu and Delhi are spending more than required minimum amount. Inspite of this, the nutritional status of children in these states is not better than national average. Kerala spends less than what is required but has low under nutrition levels. It would therefore appear that while funding constraints is a problem, effective implementation may be the bottle neck in other states; however the critical role of the family in ensuring intra-familiar food distribution based on needs in prevention of undernutrition cannot be overestimated . During the Tenth Plan efforts should be made to:
• Persuade states to provide more funds • Optimally utilize funds provided under PMGY • Improve targeting by providing available food to those with undernutrition • Improve health care to undernourished children • Monitor children / women with severe grades of undernutrition who are
receiving food supplementation and ensure that there is improvement in their nutritional status
Given the current financial constraints, States may find it difficult to increase the amount of funds currently being allocated to the programme. However experience in Orissa has shown that even with the existing outlay it is possible to achieve significant reduction in undernutrition by identifying the children with severe grades of undernutrition and ensuring that they get the required health and nutrition inputs. It is essential that appropriate guidelines for screening all children and identification of those with undernutrition and utilizing the available food supplements to fully meet the requirement of these children on priority basis are drawn up and agreed to by the centre, state, PRI and the community; the PRI and the community should play a major role in ensuring the effective implementation of the programme. Programme to improve nutritional status of school children Mid-Day Meals Programme Tamil Nadu was the first State to initiate a massive noon meal programme for children. Under the scheme children between 2-14 years of attending Balwadis /schools are fed daily through 63,000 Noon Meal programme centres, at an expense of Rs.0.44 – 0.90 paise per beneficiary. This programme has been sustained by the State for nearly two decades. Andhra Pradesh initiated a similar mid-day meals programme (MDM) in 1980,
64
which was extended to cover all school children in grade 1to 5 in 1982-83. These programmes cater only to Balwadi/school children thereby excluding the poorest who cannot attend school. The National Programme for Nutritional Support to Primary Education (Mid-Day Meals Scheme)
The National Programme of Nutritional Support to Primary Education commonly known as Mid-Day Meals Scheme was launched in August, 1995 as a 100% centrally funded Centrally Sponsored Scheme. The objective of the programme is to give a boost to universalisation of Primary Education by increasing enrolment, retention and attendance and simultaneously improving nutritional status of students in primary classes. All students of primary classes (I-V) in the Government, Local Body and Government aided schools in the country are being covered in all States/UTs (except Lakshadweep). Private unaided schools and Non-Formal Education Centres are not covered under the programme. Currently, the scheme covers 9.9 crore children from 6.88 lakh schools from 544 districts in the country. Cent pecent Central assistance is being reimbursed for meeting the costs of food-grains (wheat and rice) supplied free of cost by Food Corporation of India and transportation charges to the District Authorities for movement of food-grains from FCI godowns to the schools at the rate of actual cost upto Rs.50 per quintal as applicable under Public Distribution System. Food-grains (wheat and rice) are allocated at the rate of 100 gram per child per school day where cooked/processed hot meal is being served and 3 kgs. per student per month where food-grains are being distributed subject to a minimum attendance of 80% by the students. The expenditure on kitchen sheds and labour charges is to be met from the funds available for works and employment generation under Poverty Alleviation Schemes (JRY/NRY) of the Ministry of Rural Areas and Employment and the Ministry of Urban Affairs and Employment.
The scheme is being implemented through Panchayats and Nagarpalikas. At present only 5 States, namely, Gujarat, Kerala, Orissa, Tamil Nadu, Madhya Pradesh (174 tribal blocks) and Union Territory of Pondicherry are providing cooked meal. The remaining States/UTs are distributing food-grains (wheat/rice). The programme is monitored by village, district and state level committees; the State Education Department is the nodal agency. Operations Research Group, New Delhi, an independent agency, evaluated the programme in collaboration with UNICEF for ten states of which two states provide hot cooked meals. In Assam, MP, UP and West Bengal, there has been a boost to enrolment; in Gujarat, Haryana J&K, Karnataka, Orissa and Rajasthan, the programme has made positive impact on attendance and retention particularly amongst girls. There is no data on nutritional impact of the programme.
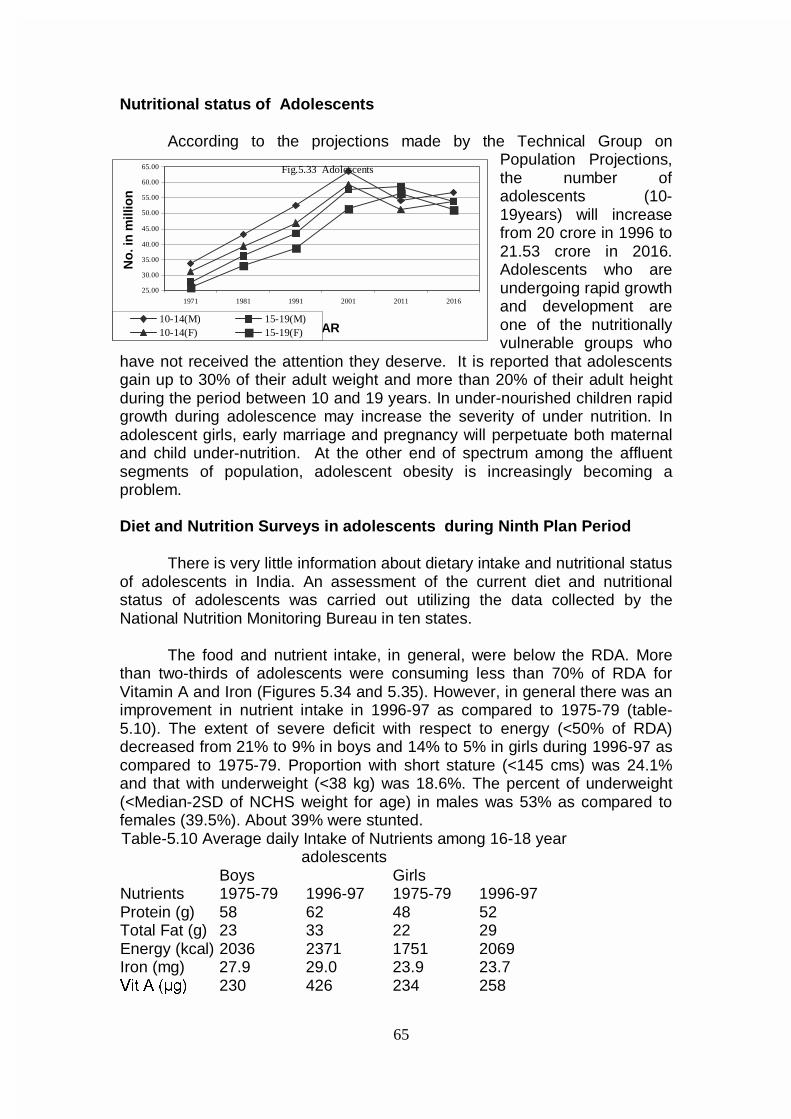
65
Nutritional status of Adolescents
According to the projections made by the Technical Group on Population Projections, the number of adolescents (10-19years) will increase from 20 crore in 1996 to 21.53 crore in 2016. Adolescents who are undergoing rapid growth and development are one of the nutritionally vulnerable groups who
have not received the attention they deserve. It is reported that adolescents gain up to 30% of their adult weight and more than 20% of their adult height during the period between 10 and 19 years. In under-nourished children rapid growth during adolescence may increase the severity of under nutrition. In adolescent girls, early marriage and pregnancy will perpetuate both maternal and child under-nutrition. At the other end of spectrum among the affluent segments of population, adolescent obesity is increasingly becoming a problem. Diet and Nutrition Surveys in adolescents during Ninth Plan Period
There is very little information about dietary intake and nutritional status of adolescents in India. An assessment of the current diet and nutritional status of adolescents was carried out utilizing the data collected by the National Nutrition Monitoring Bureau in ten states. The food and nutrient intake, in general, were below the RDA. More than two-thirds of adolescents were consuming less than 70% of RDA for Vitamin A and Iron (Figures 5.34 and 5.35). However, in general there was an improvement in nutrient intake in 1996-97 as compared to 1975-79 (table-5.10). The extent of severe deficit with respect to energy (<50% of RDA) decreased from 21% to 9% in boys and 14% to 5% in girls during 1996-97 as compared to 1975-79. Proportion with short stature (<145 cms) was 24.1% and that with underweight (<38 kg) was 18.6%. The percent of underweight (<Median-2SD of NCHS weight for age) in males was 53% as compared to females (39.5%). About 39% were stunted. Table-5.10 Average daily Intake of Nutrients among 16-18 year
adolescents Boys Girls Nutrients 1975-79 1996-97 1975-79 1996-97 Protein (g) 58 62 48 52 Total Fat (g) 23 33 22 29 Energy (kcal) 2036 2371 1751 2069 Iron (mg) 27.9 29.0 23.9 23.7 9LW $ ��J� 230 426 234 258
25.00
30.00
35.00
40.00
45.00
50.00
55.00
60.00
65.00
1971 1981 1991 2001 2011 2016
YEAR
No
. in
mill
ion
10-14(M) 15-19(M)10-14(F) 15-19(F)
Fig.5.33 Adolescents
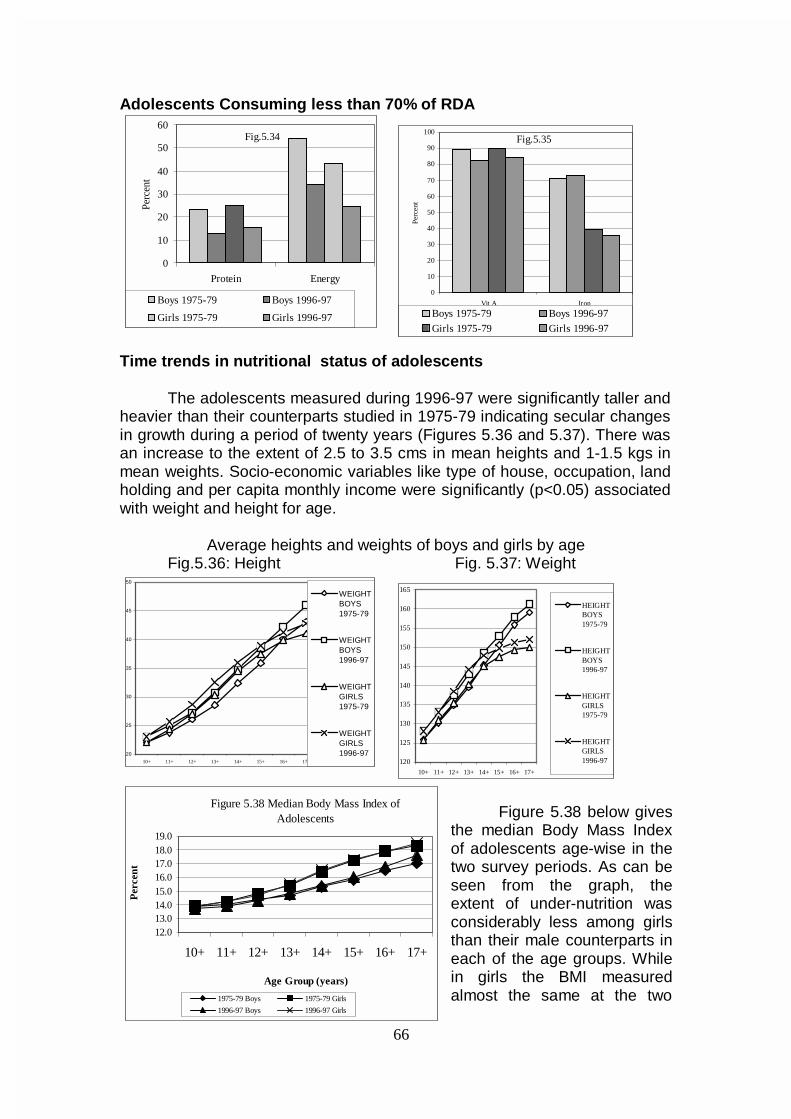
66
Adolescents Consuming less than 70% of RDA
Time trends in nutritional status of adolescents The adolescents measured during 1996-97 were significantly taller and heavier than their counterparts studied in 1975-79 indicating secular changes in growth during a period of twenty years (Figures 5.36 and 5.37). There was an increase to the extent of 2.5 to 3.5 cms in mean heights and 1-1.5 kgs in mean weights. Socio-economic variables like type of house, occupation, land holding and per capita monthly income were significantly (p<0.05) associated with weight and height for age.
Average heights and weights of boys and girls by age
Fig.5.36: Height Fig. 5.37: Weight
20
25
30
35
40
45
50
10+ 11+ 12+ 13+ 14+ 15+ 16+ 17+
WEIGHTBOYS1975-79
WEIGHTBOYS1996-97
WEIGHTGIRLS1975-79
WEIGHTGIRLS1996-97
Figure 5.38 below gives the median Body Mass Index of adolescents age-wise in the two survey periods. As can be seen from the graph, the extent of under-nutrition was considerably less among girls than their male counterparts in each of the age groups. While in girls the BMI measured almost the same at the two
0
10
20
30
40
50
60
Protein Energy
Perc
ent
Boys 1975-79 Boys 1996-97
Girls 1975-79 Girls 1996-97
Fig.5.34
Figure 5.38 Median Body Mass Index of Adolescents
12.013.014.015.016.017.018.019.0
10+ 11+ 12+ 13+ 14+ 15+ 16+ 17+
Age Group (years)
Per
cent
1975-79 Boys 1975-79 Girls
1996-97 Boys 1996-97 Girls
0
10
20
30
40
50
60
70
80
90
100
Vit A Iron
Perc
ent
Boys 1975-79 Boys 1996-97
Girls 1975-79 Girls 1996-97
Fig.5.35
120
125
130
135
140
145
150
155
160
165
10+ 11+ 12+ 13+ 14+ 15+ 16+ 17+
HEIGHTBOYS1975-79
HEIGHTBOYS1996-97
HEIGHTGIRLS1975-79
HEIGHTGIRLS1996-97
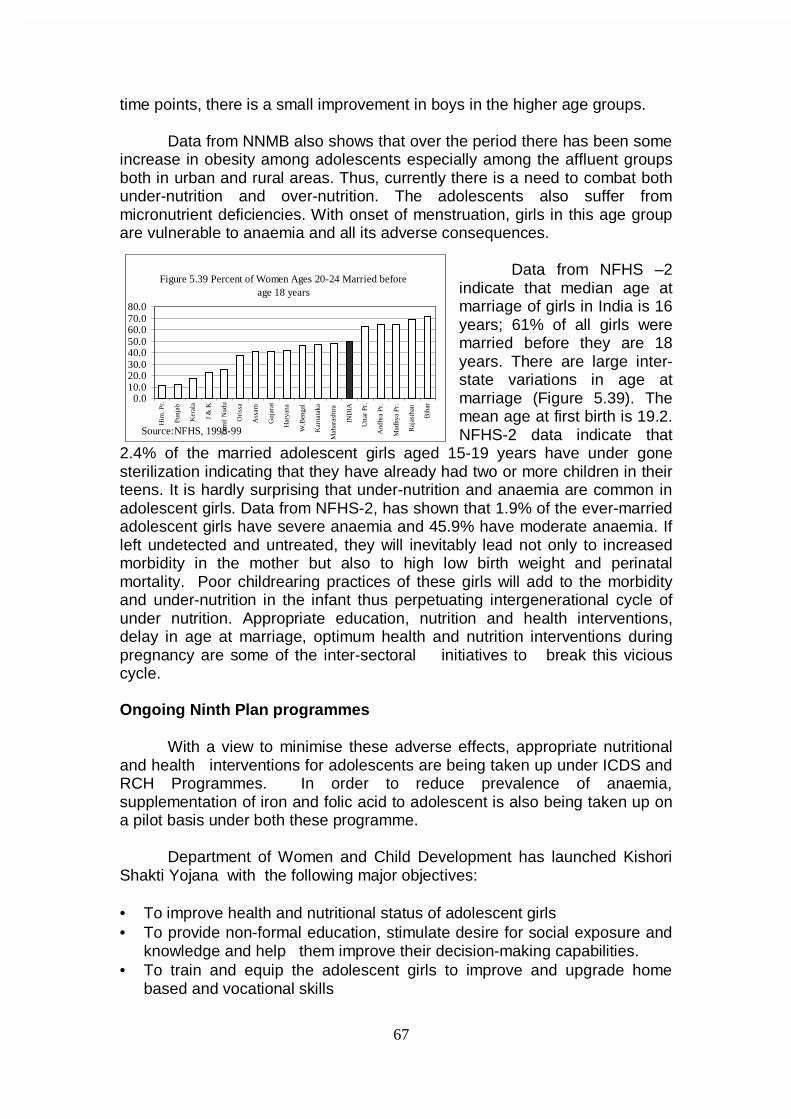
67
time points, there is a small improvement in boys in the higher age groups.
Data from NNMB also shows that over the period there has been some increase in obesity among adolescents especially among the affluent groups both in urban and rural areas. Thus, currently there is a need to combat both under-nutrition and over-nutrition. The adolescents also suffer from micronutrient deficiencies. With onset of menstruation, girls in this age group are vulnerable to anaemia and all its adverse consequences.
Data from NFHS –2
indicate that median age at marriage of girls in India is 16 years; 61% of all girls were married before they are 18 years. There are large inter-state variations in age at marriage (Figure 5.39). The mean age at first birth is 19.2. NFHS-2 data indicate that
2.4% of the married adolescent girls aged 15-19 years have under gone sterilization indicating that they have already had two or more children in their teens. It is hardly surprising that under-nutrition and anaemia are common in adolescent girls. Data from NFHS-2, has shown that 1.9% of the ever-married adolescent girls have severe anaemia and 45.9% have moderate anaemia. If left undetected and untreated, they will inevitably lead not only to increased morbidity in the mother but also to high low birth weight and perinatal mortality. Poor childrearing practices of these girls will add to the morbidity and under-nutrition in the infant thus perpetuating intergenerational cycle of under nutrition. Appropriate education, nutrition and health interventions, delay in age at marriage, optimum health and nutrition interventions during pregnancy are some of the inter-sectoral initiatives to break this vicious cycle. Ongoing Ninth Plan programmes
With a view to minimise these adverse effects, appropriate nutritional and health interventions for adolescents are being taken up under ICDS and RCH Programmes. In order to reduce prevalence of anaemia, supplementation of iron and folic acid to adolescent is also being taken up on a pilot basis under both these programme.
Department of Women and Child Development has launched Kishori
Shakti Yojana with the following major objectives:
• To improve health and nutritional status of adolescent girls • To provide non-formal education, stimulate desire for social exposure and
knowledge and help them improve their decision-making capabilities. • To train and equip the adolescent girls to improve and upgrade home
based and vocational skills
Figure 5.39 Percent of Women Ages 20-24 Married before age 18 years
0.010.020.030.040.050.060.070.080.0
Him
. Pr.
Punj
ab
Ker
ala
J &
K
Tam
il N
adu
Ori
ssa
Ass
am
Guj
arat
Har
yana
W.B
enga
l
Kar
nata
ka
Mah
aras
htra
IND
IA
Utta
r Pr
.
And
hra
Pr.
Mad
hya
Pr.
Raj
asth
an
Bih
arSource:NFHS, 1998-99
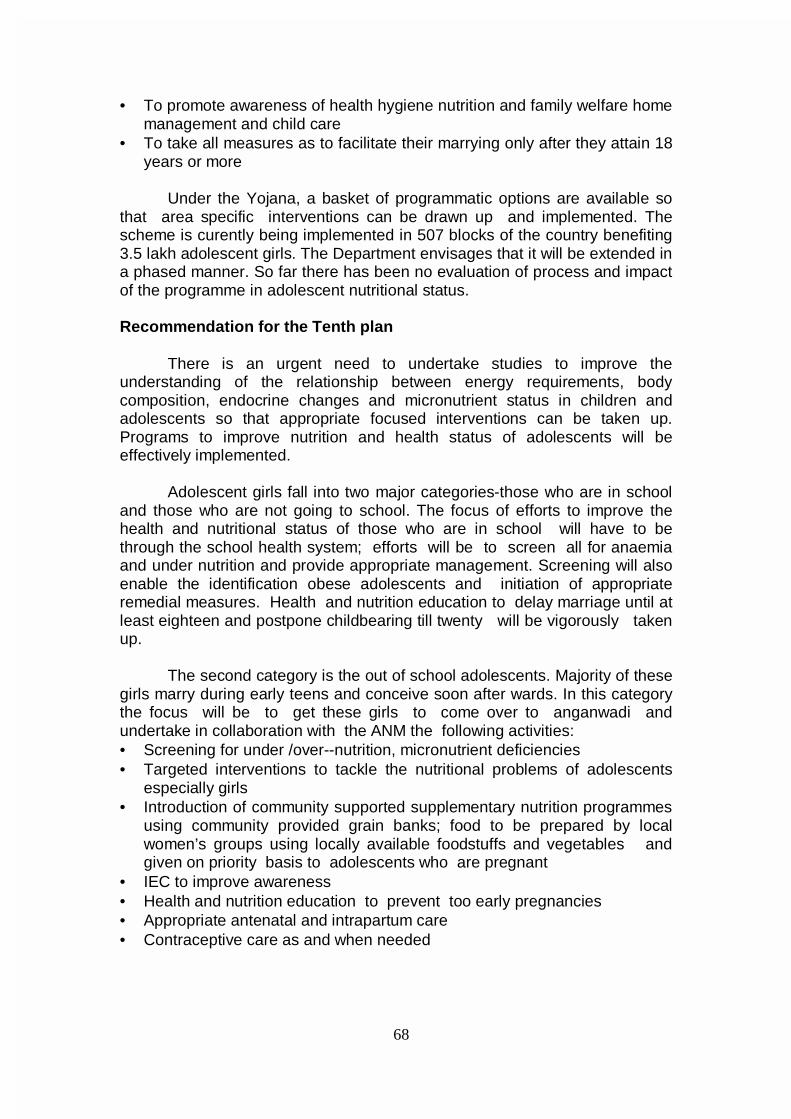
68
• To promote awareness of health hygiene nutrition and family welfare home
management and child care • To take all measures as to facilitate their marrying only after they attain 18
years or more Under the Yojana, a basket of programmatic options are available so
that area specific interventions can be drawn up and implemented. The scheme is curently being implemented in 507 blocks of the country benefiting 3.5 lakh adolescent girls. The Department envisages that it will be extended in a phased manner. So far there has been no evaluation of process and impact of the programme in adolescent nutritional status. Recommendation for the Tenth plan There is an urgent need to undertake studies to improve the understanding of the relationship between energy requirements, body composition, endocrine changes and micronutrient status in children and adolescents so that appropriate focused interventions can be taken up. Programs to improve nutrition and health status of adolescents will be effectively implemented. Adolescent girls fall into two major categories-those who are in school and those who are not going to school. The focus of efforts to improve the health and nutritional status of those who are in school will have to be through the school health system; efforts will be to screen all for anaemia and under nutrition and provide appropriate management. Screening will also enable the identification obese adolescents and initiation of appropriate remedial measures. Health and nutrition education to delay marriage until at least eighteen and postpone childbearing till twenty will be vigorously taken up. The second category is the out of school adolescents. Majority of these girls marry during early teens and conceive soon after wards. In this category the focus will be to get these girls to come over to anganwadi and undertake in collaboration with the ANM the following activities: • Screening for under /over--nutrition, micronutrient deficiencies • Targeted interventions to tackle the nutritional problems of adolescents
especially girls • Introduction of community supported supplementary nutrition programmes
using community provided grain banks; food to be prepared by local women’s groups using locally available foodstuffs and vegetables and given on priority basis to adolescents who are pregnant
• IEC to improve awareness • Health and nutrition education to prevent too early pregnancies • Appropriate antenatal and intrapartum care • Contraceptive care as and when needed
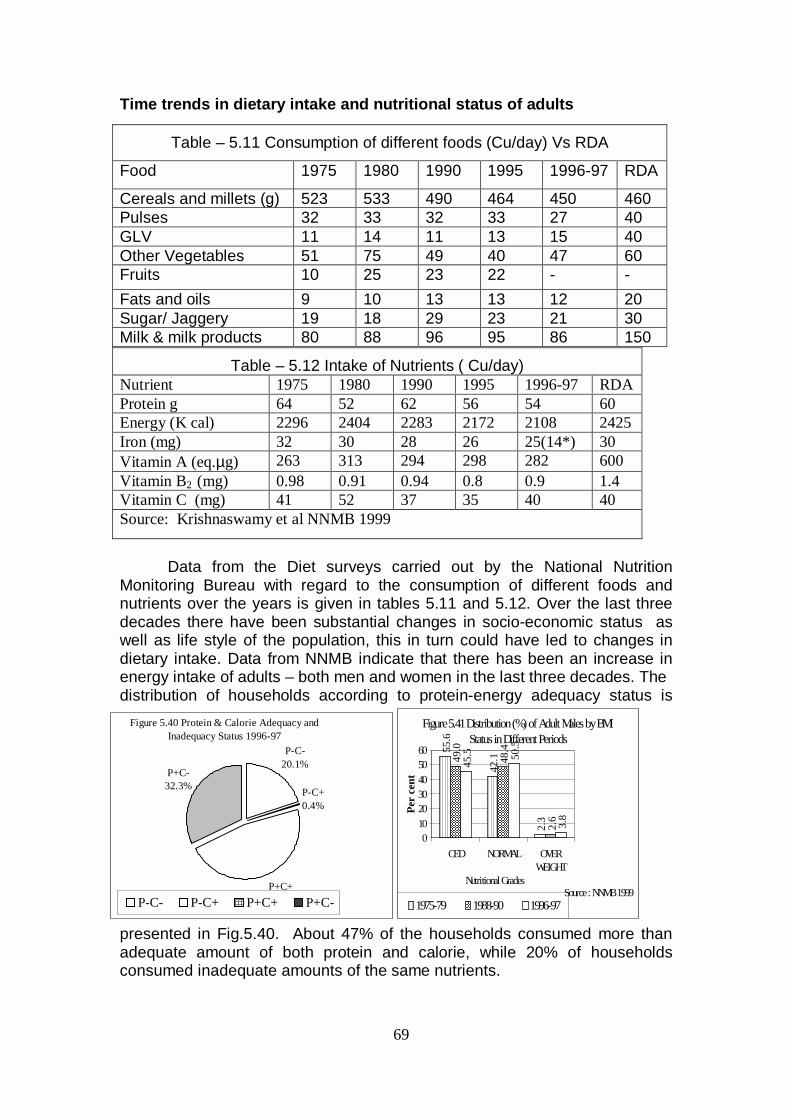
69
Figure 5.40 Protein & Calorie Adequacy and Inadequacy Status 1996-97
P-C-20.1%
P-C+0.4%
P+C+47.2%
P+C-32.3%
P-C- P-C+ P+C+ P+C-
Figure 5.41 Distribution (%) of Adult Males by BMI Status in Different Periods
55.6
42.1
2.3
49.0
48.4
2.6
45.5 50
.5
3.8
0102030405060
CED NORMAL OVERWEIGHT
Nutritional Grades
Per
cen
t
1975-79 1988-90 1996-97Source : NNMB 1999
Time trends in dietary intake and nutritional status of adults
Data from the Diet surveys carried out by the National Nutrition
Monitoring Bureau with regard to the consumption of different foods and nutrients over the years is given in tables 5.11 and 5.12. Over the last three decades there have been substantial changes in socio-economic status as well as life style of the population, this in turn could have led to changes in dietary intake. Data from NNMB indicate that there has been an increase in energy intake of adults – both men and women in the last three decades. The distribution of households according to protein-energy adequacy status is
presented in Fig.5.40. About 47% of the households consumed more than adequate amount of both protein and calorie, while 20% of households consumed inadequate amounts of the same nutrients.
Table – 5.11 Consumption of different foods (Cu/day) Vs RDA
Food 1975 1980 1990 1995 1996-97 RDA
Cereals and millets (g) 523 533 490 464 450 460 Pulses 32 33 32 33 27 40 GLV 11 14 11 13 15 40 Other Vegetables 51 75 49 40 47 60 Fruits 10 25 23 22 - -
Fats and oils 9 10 13 13 12 20 Sugar/ Jaggery 19 18 29 23 21 30 Milk & milk products 80 88 96 95 86 150
Table – 5.12 Intake of Nutrients ( Cu/day) Nutrient 1975 1980 1990 1995 1996-97 RDA Protein g 64 52 62 56 54 60 Energy (K cal) 2296 2404 2283 2172 2108 2425 Iron (mg) 32 30 28 26 25(14*) 30 Vitamin A (eq.µg) 263 313 294 298 282 600 Vitamin B2 (mg) 0.98 0.91 0.94 0.8 0.9 1.4 Vitamin C (mg) 41 52 37 35 40 40 Source: Krishnaswamy et al NNMB 1999
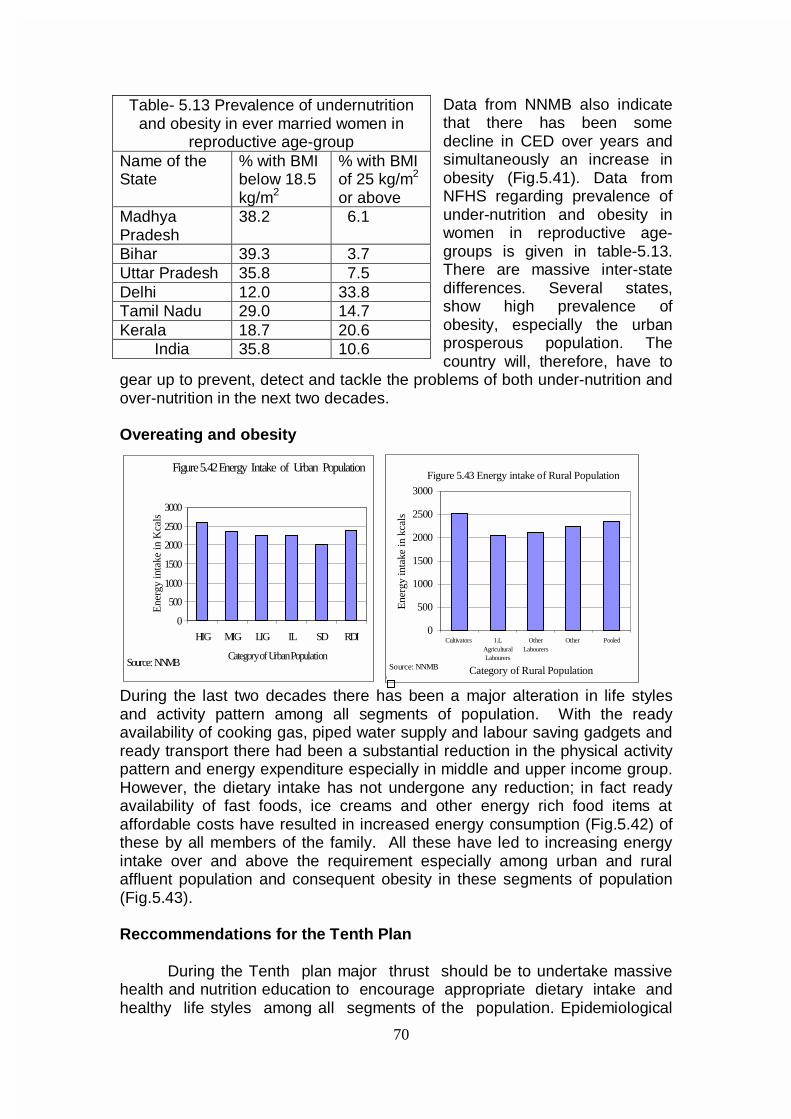
70
Data from NNMB also indicate that there has been some decline in CED over years and simultaneously an increase in obesity (Fig.5.41). Data from NFHS regarding prevalence of under-nutrition and obesity in women in reproductive age-groups is given in table-5.13. There are massive inter-state differences. Several states, show high prevalence of obesity, especially the urban prosperous population. The country will, therefore, have to
gear up to prevent, detect and tackle the problems of both under-nutrition and over-nutrition in the next two decades. Overeating and obesity
During the last two decades there has been a major alteration in life styles and activity pattern among all segments of population. With the ready availability of cooking gas, piped water supply and labour saving gadgets and ready transport there had been a substantial reduction in the physical activity pattern and energy expenditure especially in middle and upper income group. However, the dietary intake has not undergone any reduction; in fact ready availability of fast foods, ice creams and other energy rich food items at affordable costs have resulted in increased energy consumption (Fig.5.42) of these by all members of the family. All these have led to increasing energy intake over and above the requirement especially among urban and rural affluent population and consequent obesity in these segments of population (Fig.5.43).
Reccommendations for the Tenth Plan
During the Tenth plan major thrust should be to undertake massive
health and nutrition education to encourage appropriate dietary intake and healthy life styles among all segments of the population. Epidemiological
Table- 5.13 Prevalence of undernutrition and obesity in ever married women in
reproductive age-group Name of the State
% with BMI below 18.5 kg/m2
% with BMI of 25 kg/m2
or above Madhya Pradesh
38.2 6.1
Bihar 39.3 3.7 Uttar Pradesh 35.8 7.5 Delhi 12.0 33.8 Tamil Nadu 29.0 14.7 Kerala 18.7 20.6
India 35.8 10.6
Figure 5.42 Energy Intake of Urban Population
0
500
1000
1500
2000
2500
3000
HIG MIG LIG IL SD RDI
Category of Urban Population
Ene
rgy
inta
ke in
Kca
ls
Source: NNMB
Figure 5.43 Energy intake of Rural Population
0
500
1000
1500
2000
2500
3000
Cultivators I.LAgriculturalLabourers
OtherLabourers
Other Pooled
Category of Rural Population
Ene
rgy
inta
ke in
kca
ls
Source: NNMB
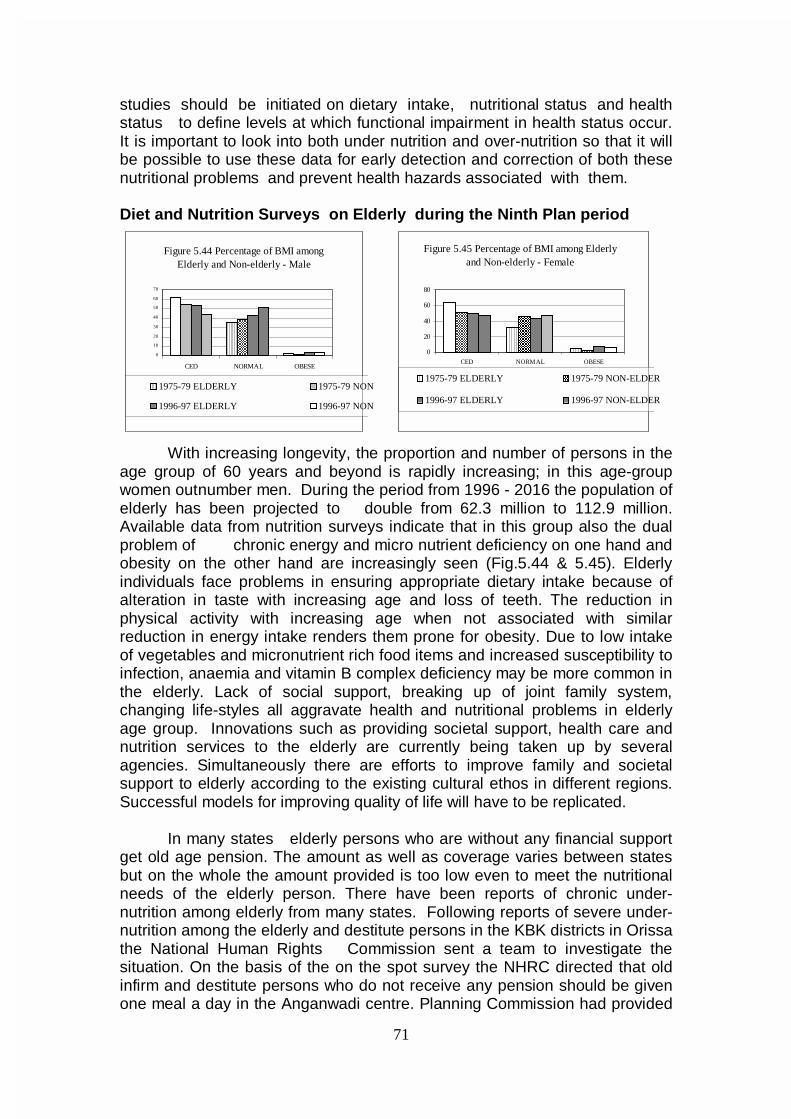
71
studies should be initiated on dietary intake, nutritional status and health status to define levels at which functional impairment in health status occur. It is important to look into both under nutrition and over-nutrition so that it will be possible to use these data for early detection and correction of both these nutritional problems and prevent health hazards associated with them. Diet and Nutrition Surveys on Elderly during the Ninth Plan period
With increasing longevity, the proportion and number of persons in the age group of 60 years and beyond is rapidly increasing; in this age-group women outnumber men. During the period from 1996 - 2016 the population of elderly has been projected to double from 62.3 million to 112.9 million. Available data from nutrition surveys indicate that in this group also the dual problem of chronic energy and micro nutrient deficiency on one hand and obesity on the other hand are increasingly seen (Fig.5.44 & 5.45). Elderly individuals face problems in ensuring appropriate dietary intake because of alteration in taste with increasing age and loss of teeth. The reduction in physical activity with increasing age when not associated with similar reduction in energy intake renders them prone for obesity. Due to low intake of vegetables and micronutrient rich food items and increased susceptibility to infection, anaemia and vitamin B complex deficiency may be more common in the elderly. Lack of social support, breaking up of joint family system, changing life-styles all aggravate health and nutritional problems in elderly age group. Innovations such as providing societal support, health care and nutrition services to the elderly are currently being taken up by several agencies. Simultaneously there are efforts to improve family and societal support to elderly according to the existing cultural ethos in different regions. Successful models for improving quality of life will have to be replicated. In many states elderly persons who are without any financial support get old age pension. The amount as well as coverage varies between states but on the whole the amount provided is too low even to meet the nutritional needs of the elderly person. There have been reports of chronic under-nutrition among elderly from many states. Following reports of severe under-nutrition among the elderly and destitute persons in the KBK districts in Orissa the National Human Rights Commission sent a team to investigate the situation. On the basis of the on the spot survey the NHRC directed that old infirm and destitute persons who do not receive any pension should be given one meal a day in the Anganwadi centre. Planning Commission had provided
Figure 5.45 Percentage of BMI among Elderly and Non-elderly - Female
0
20
40
60
80
CED NORMAL OBESE
1975-79 ELDERLY 1975-79 NON-ELDER
1996-97 ELDERLY 1996-97 NON-ELDER
Figure 5.44 Percentage of BMI among Elderly and Non-elderly - Male
0
10
20
30
40
50
60
70
CED NORMAL OBESE
1975-79 ELDERLY 1975-79 NON
1996-97 ELDERLY 1996-97 NON
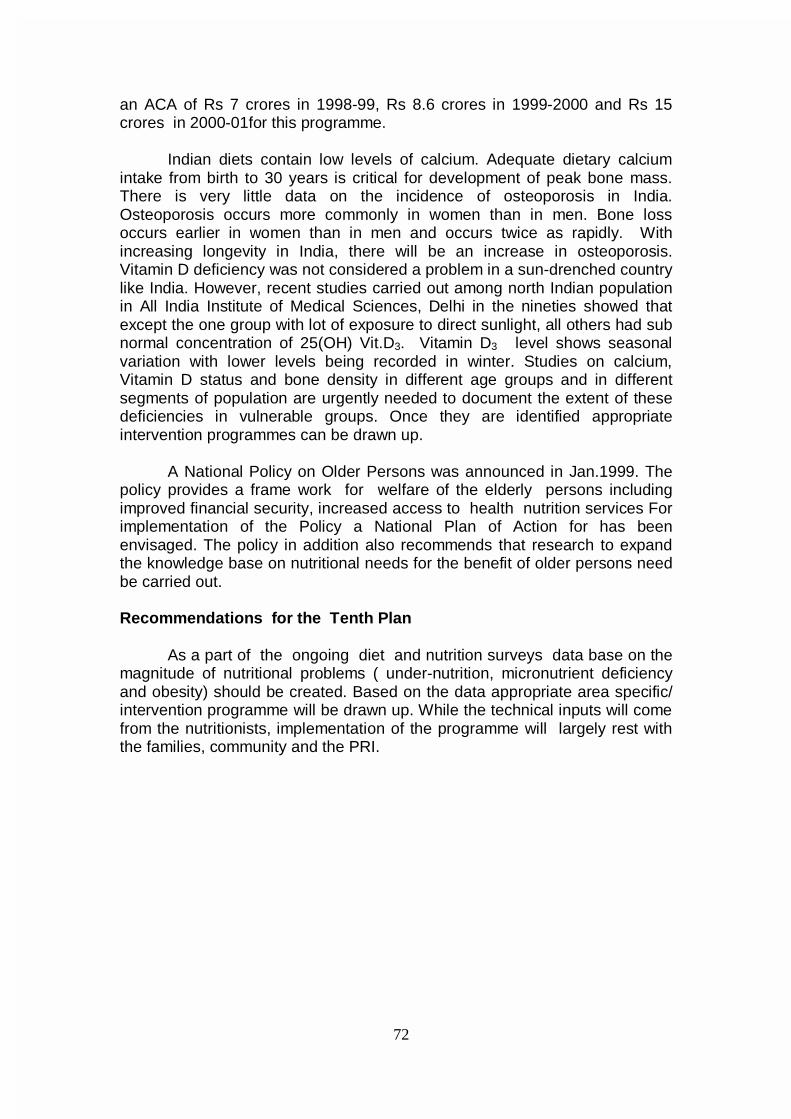
72
an ACA of Rs 7 crores in 1998-99, Rs 8.6 crores in 1999-2000 and Rs 15 crores in 2000-01for this programme.
Indian diets contain low levels of calcium. Adequate dietary calcium intake from birth to 30 years is critical for development of peak bone mass. There is very little data on the incidence of osteoporosis in India. Osteoporosis occurs more commonly in women than in men. Bone loss occurs earlier in women than in men and occurs twice as rapidly. With increasing longevity in India, there will be an increase in osteoporosis. Vitamin D deficiency was not considered a problem in a sun-drenched country like India. However, recent studies carried out among north Indian population in All India Institute of Medical Sciences, Delhi in the nineties showed that except the one group with lot of exposure to direct sunlight, all others had sub normal concentration of 25(OH) Vit.D3. Vitamin D3 level shows seasonal variation with lower levels being recorded in winter. Studies on calcium, Vitamin D status and bone density in different age groups and in different segments of population are urgently needed to document the extent of these deficiencies in vulnerable groups. Once they are identified appropriate intervention programmes can be drawn up.
A National Policy on Older Persons was announced in Jan.1999. The policy provides a frame work for welfare of the elderly persons including improved financial security, increased access to health nutrition services For implementation of the Policy a National Plan of Action for has been envisaged. The policy in addition also recommends that research to expand the knowledge base on nutritional needs for the benefit of older persons need be carried out. Recommendations for the Tenth Plan As a part of the ongoing diet and nutrition surveys data base on the magnitude of nutritional problems ( under-nutrition, micronutrient deficiency and obesity) should be created. Based on the data appropriate area specific/ intervention programme will be drawn up. While the technical inputs will come from the nutritionists, implementation of the programme will largely rest with the families, community and the PRI.
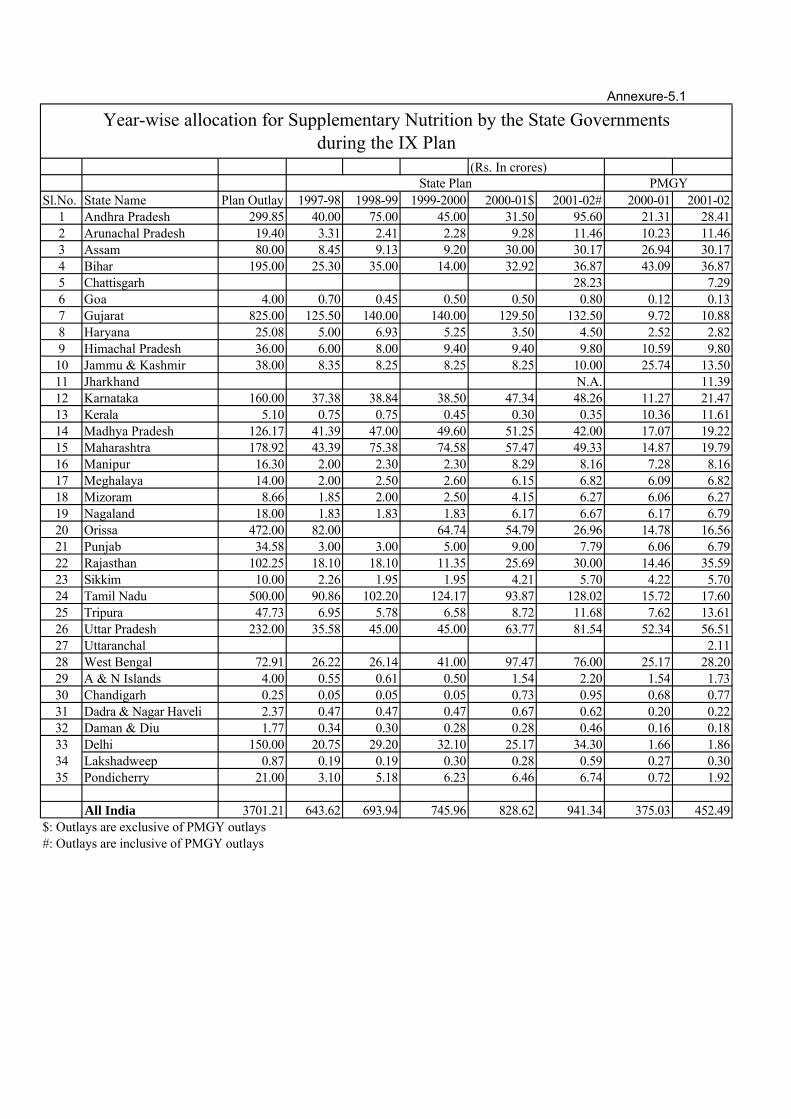
Annexure-5.1
(Rs. In crores)
Sl.No. State Name IX Plan Outlay 1997-98 1998-99 1999-2000 2000-01$ 2001-02# 2000-01 2001-021 Andhra Pradesh 299.85 40.00 75.00 45.00 31.50 95.60 21.31 28.412 Arunachal Pradesh 19.40 3.31 2.41 2.28 9.28 11.46 10.23 11.463 Assam 80.00 8.45 9.13 9.20 30.00 30.17 26.94 30.174 Bihar 195.00 25.30 35.00 14.00 32.92 36.87 43.09 36.875 Chattisgarh 28.23 7.296 Goa 4.00 0.70 0.45 0.50 0.50 0.80 0.12 0.137 Gujarat 825.00 125.50 140.00 140.00 129.50 132.50 9.72 10.888 Haryana 25.08 5.00 6.93 5.25 3.50 4.50 2.52 2.829 Himachal Pradesh 36.00 6.00 8.00 9.40 9.40 9.80 10.59 9.8010 Jammu & Kashmir 38.00 8.35 8.25 8.25 8.25 10.00 25.74 13.5011 Jharkhand N.A. 11.3912 Karnataka 160.00 37.38 38.84 38.50 47.34 48.26 11.27 21.4713 Kerala 5.10 0.75 0.75 0.45 0.30 0.35 10.36 11.6114 Madhya Pradesh 126.17 41.39 47.00 49.60 51.25 42.00 17.07 19.2215 Maharashtra 178.92 43.39 75.38 74.58 57.47 49.33 14.87 19.7916 Manipur 16.30 2.00 2.30 2.30 8.29 8.16 7.28 8.1617 Meghalaya 14.00 2.00 2.50 2.60 6.15 6.82 6.09 6.8218 Mizoram 8.66 1.85 2.00 2.50 4.15 6.27 6.06 6.2719 Nagaland 18.00 1.83 1.83 1.83 6.17 6.67 6.17 6.7920 Orissa 472.00 82.00 64.74 54.79 26.96 14.78 16.5621 Punjab 34.58 3.00 3.00 5.00 9.00 7.79 6.06 6.7922 Rajasthan 102.25 18.10 18.10 11.35 25.69 30.00 14.46 35.5923 Sikkim 10.00 2.26 1.95 1.95 4.21 5.70 4.22 5.7024 Tamil Nadu 500.00 90.86 102.20 124.17 93.87 128.02 15.72 17.6025 Tripura 47.73 6.95 5.78 6.58 8.72 11.68 7.62 13.6126 Uttar Pradesh 232.00 35.58 45.00 45.00 63.77 81.54 52.34 56.5127 Uttaranchal 2.1128 West Bengal 72.91 26.22 26.14 41.00 97.47 76.00 25.17 28.2029 A & N Islands 4.00 0.55 0.61 0.50 1.54 2.20 1.54 1.7330 Chandigarh 0.25 0.05 0.05 0.05 0.73 0.95 0.68 0.7731 Dadra & Nagar Haveli 2.37 0.47 0.47 0.47 0.67 0.62 0.20 0.2232 Daman & Diu 1.77 0.34 0.30 0.28 0.28 0.46 0.16 0.1833 Delhi 150.00 20.75 29.20 32.10 25.17 34.30 1.66 1.8634 Lakshadweep 0.87 0.19 0.19 0.30 0.28 0.59 0.27 0.3035 Pondicherry 21.00 3.10 5.18 6.23 6.46 6.74 0.72 1.92
All India 3701.21 643.62 693.94 745.96 828.62 941.34 375.03 452.49$: Outlays are exclusive of PMGY outlays#: Outlays are inclusive of PMGY outlays
PMGYState Plan
Year-wise allocation for Supplementary Nutrition by the State Governments during the IX Plan
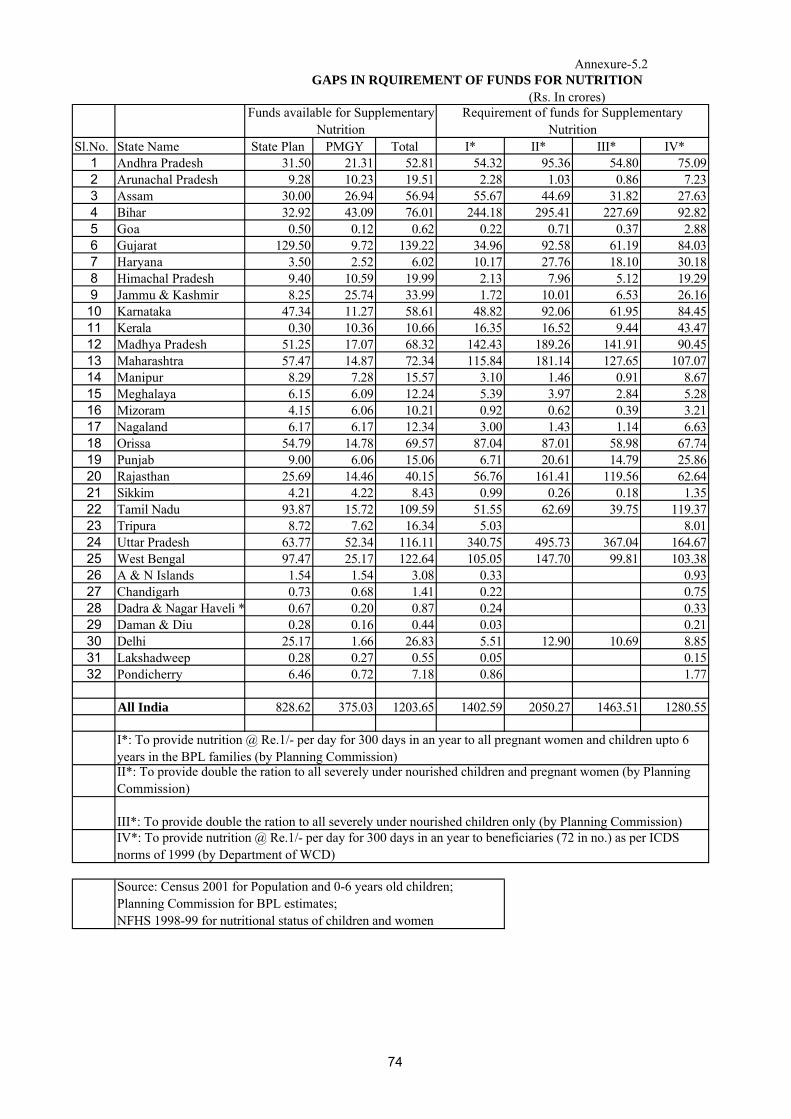
Annexure-5.2
(Rs. In crores)
Sl.No. State Name State Plan PMGY Total I* II* III* IV*1 Andhra Pradesh 31.50 21.31 52.81 54.32 95.36 54.80 75.092 Arunachal Pradesh 9.28 10.23 19.51 2.28 1.03 0.86 7.233 Assam 30.00 26.94 56.94 55.67 44.69 31.82 27.634 Bihar 32.92 43.09 76.01 244.18 295.41 227.69 92.825 Goa 0.50 0.12 0.62 0.22 0.71 0.37 2.886 Gujarat 129.50 9.72 139.22 34.96 92.58 61.19 84.037 Haryana 3.50 2.52 6.02 10.17 27.76 18.10 30.188 Himachal Pradesh 9.40 10.59 19.99 2.13 7.96 5.12 19.299 Jammu & Kashmir 8.25 25.74 33.99 1.72 10.01 6.53 26.16
10 Karnataka 47.34 11.27 58.61 48.82 92.06 61.95 84.4511 Kerala 0.30 10.36 10.66 16.35 16.52 9.44 43.4712 Madhya Pradesh 51.25 17.07 68.32 142.43 189.26 141.91 90.4513 Maharashtra 57.47 14.87 72.34 115.84 181.14 127.65 107.0714 Manipur 8.29 7.28 15.57 3.10 1.46 0.91 8.6715 Meghalaya 6.15 6.09 12.24 5.39 3.97 2.84 5.2816 Mizoram 4.15 6.06 10.21 0.92 0.62 0.39 3.2117 Nagaland 6.17 6.17 12.34 3.00 1.43 1.14 6.6318 Orissa 54.79 14.78 69.57 87.04 87.01 58.98 67.7419 Punjab 9.00 6.06 15.06 6.71 20.61 14.79 25.8620 Rajasthan 25.69 14.46 40.15 56.76 161.41 119.56 62.6421 Sikkim 4.21 4.22 8.43 0.99 0.26 0.18 1.3522 Tamil Nadu 93.87 15.72 109.59 51.55 62.69 39.75 119.3723 Tripura 8.72 7.62 16.34 5.03 8.0124 Uttar Pradesh 63.77 52.34 116.11 340.75 495.73 367.04 164.6725 West Bengal 97.47 25.17 122.64 105.05 147.70 99.81 103.3826 A & N Islands 1.54 1.54 3.08 0.33 0.9327 Chandigarh 0.73 0.68 1.41 0.22 0.7528 Dadra & Nagar Haveli * 0.67 0.20 0.87 0.24 0.3329 Daman & Diu 0.28 0.16 0.44 0.03 0.2130 Delhi 25.17 1.66 26.83 5.51 12.90 10.69 8.8531 Lakshadweep 0.28 0.27 0.55 0.05 0.1532 Pondicherry 6.46 0.72 7.18 0.86 1.77
All India 828.62 375.03 1203.65 1402.59 2050.27 1463.51 1280.55
GAPS IN RQUIREMENT OF FUNDS FOR NUTRITION
I*: To provide nutrition @ Re.1/- per day for 300 days in an year to all pregnant women and children upto 6 years in the BPL families (by Planning Commission)
Source: Census 2001 for Population and 0-6 years old children; Planning Commission for BPL estimates; NFHS 1998-99 for nutritional status of children and women
II*: To provide double the ration to all severely under nourished children and pregnant women (by Planning Commission)
III*: To provide double the ration to all severely under nourished children only (by Planning Commission)IV*: To provide nutrition @ Re.1/- per day for 300 days in an year to beneficiaries (72 in no.) as per ICDS norms of 1999 (by Department of WCD)
Funds available for Supplementary Nutrition
Requirement of funds for Supplementary Nutrition
74
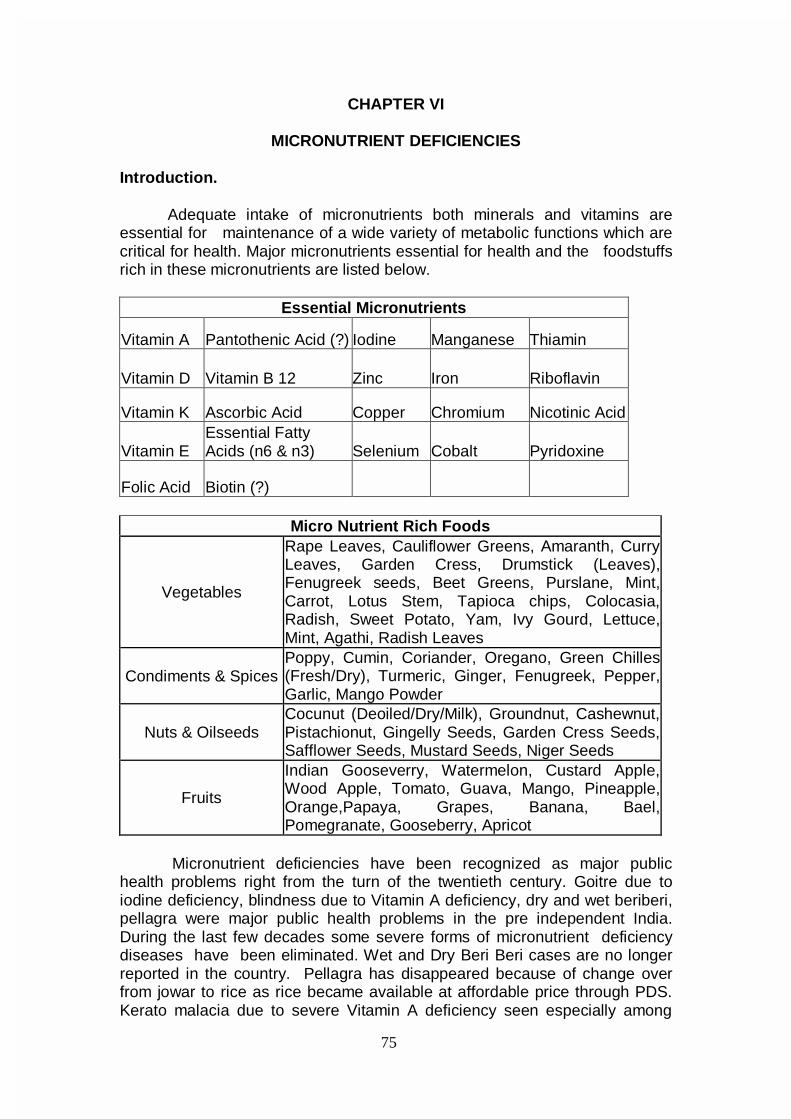
75
CHAPTER VI
MICRONUTRIENT DEFICIENCIES Introduction. Adequate intake of micronutrients both minerals and vitamins are essential for maintenance of a wide variety of metabolic functions which are critical for health. Major micronutrients essential for health and the foodstuffs rich in these micronutrients are listed below.
Essential Micronutrients
Vitamin A Pantothenic Acid (?) Iodine Manganese Thiamin
Vitamin D Vitamin B 12 Zinc Iron Riboflavin
Vitamin K Ascorbic Acid Copper Chromium Nicotinic Acid
Vitamin E Essential Fatty Acids (n6 & n3) Selenium Cobalt Pyridoxine
Folic Acid Biotin (?)
Micro Nutrient Rich Foods
Vegetables
Rape Leaves, Cauliflower Greens, Amaranth, Curry Leaves, Garden Cress, Drumstick (Leaves), Fenugreek seeds, Beet Greens, Purslane, Mint, Carrot, Lotus Stem, Tapioca chips, Colocasia, Radish, Sweet Potato, Yam, Ivy Gourd, Lettuce, Mint, Agathi, Radish Leaves
Condiments & Spices Poppy, Cumin, Coriander, Oregano, Green Chilles (Fresh/Dry), Turmeric, Ginger, Fenugreek, Pepper, Garlic, Mango Powder
Nuts & Oilseeds Cocunut (Deoiled/Dry/Milk), Groundnut, Cashewnut, Pistachionut, Gingelly Seeds, Garden Cress Seeds, Safflower Seeds, Mustard Seeds, Niger Seeds
Fruits
Indian Gooseverry, Watermelon, Custard Apple, Wood Apple, Tomato, Guava, Mango, Pineapple, Orange,Papaya, Grapes, Banana, Bael, Pomegranate, Gooseberry, Apricot
Micronutrient deficiencies have been recognized as major public
health problems right from the turn of the twentieth century. Goitre due to iodine deficiency, blindness due to Vitamin A deficiency, dry and wet beriberi, pellagra were major public health problems in the pre independent India. During the last few decades some severe forms of micronutrient deficiency diseases have been eliminated. Wet and Dry Beri Beri cases are no longer reported in the country. Pellagra has disappeared because of change over from jowar to rice as rice became available at affordable price through PDS. Kerato malacia due to severe Vitamin A deficiency seen especially among
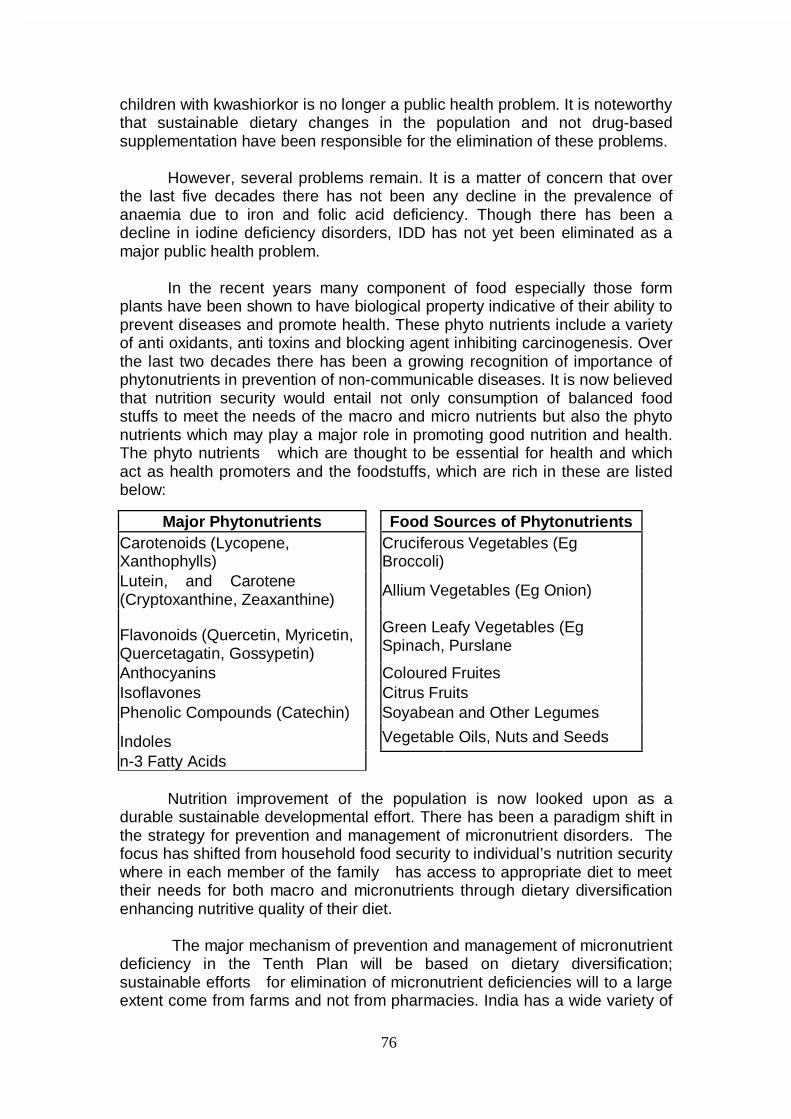
76
children with kwashiorkor is no longer a public health problem. It is noteworthy that sustainable dietary changes in the population and not drug-based supplementation have been responsible for the elimination of these problems.
However, several problems remain. It is a matter of concern that over
the last five decades there has not been any decline in the prevalence of anaemia due to iron and folic acid deficiency. Though there has been a decline in iodine deficiency disorders, IDD has not yet been eliminated as a major public health problem.
In the recent years many component of food especially those form plants have been shown to have biological property indicative of their ability to prevent diseases and promote health. These phyto nutrients include a variety of anti oxidants, anti toxins and blocking agent inhibiting carcinogenesis. Over the last two decades there has been a growing recognition of importance of phytonutrients in prevention of non-communicable diseases. It is now believed that nutrition security would entail not only consumption of balanced food stuffs to meet the needs of the macro and micro nutrients but also the phyto nutrients which may play a major role in promoting good nutrition and health. The phyto nutrients which are thought to be essential for health and which act as health promoters and the foodstuffs, which are rich in these are listed below:
Nutrition improvement of the population is now looked upon as a durable sustainable developmental effort. There has been a paradigm shift in the strategy for prevention and management of micronutrient disorders. The focus has shifted from household food security to individual’s nutrition security where in each member of the family has access to appropriate diet to meet their needs for both macro and micronutrients through dietary diversification enhancing nutritive quality of their diet. The major mechanism of prevention and management of micronutrient deficiency in the Tenth Plan will be based on dietary diversification; sustainable efforts for elimination of micronutrient deficiencies will to a large extent come from farms and not from pharmacies. India has a wide variety of
Major Phytonutrients Food Sources of Phytonutrients Carotenoids (Lycopene, Xanthophylls)
Cruciferous Vegetables (Eg Broccoli)
Lutein, and Carotene (Cryptoxanthine, Zeaxanthine)
Allium Vegetables (Eg Onion)
Flavonoids (Quercetin, Myricetin, Quercetagatin, Gossypetin)
Green Leafy Vegetables (Eg Spinach, Purslane
Anthocyanins Coloured Fruites Isoflavones Citrus Fruits Phenolic Compounds (Catechin) Soyabean and Other Legumes
Indoles Vegetable Oils, Nuts and Seeds n-3 Fatty Acids
77
plants rich in micronutrients and phyto chemicals; most of them are inexpensive, traditionally used in Indian diet and are culturally acceptable. During the Tenth Plan major thrust has to be given for promoting dietary diversification. Adequate intake of micronutrients achieved through consumption of variety of inexpensive plant foods will go along way in prevention of a many micronutrient deficiencies. In addition steps to eliminate IDD as a public health problem through universal salt iodisation will be vigorously pursued. Multi pronged strategy will be followed to reduce the prevalence of anaemia and associated health hazards. IRON DEFICIENCY ANAEMIA
Nutritional anaemia due to iron and folate deficiency is a major global
public health problem; India is one of the countries with the highest prevalence of anaemia. Low dietary intake and poor iron and folic acid intake are major factors responsible for high prevalence of anaemia in India. Poor bioavailability of iron in phytate fibre rich Indian diet aggravates the situation. Anaemia due to deficiency of other micronutrients like copper, zinc, pyridoxine and vitamin B12 are rare in India.
In order to reduce the prevalence of anaemia and associated health
problems Government of India has initiated programmes for management and control of anaemia. India is among the first of the developing countries to take up a National Anaemia Prophylaxis Programme to prevent anaemia in pregnant women and children. Screening for anaemia and iron – folate therapy in appropriate doses and routes for prevention and management of anaemia in these vulnerable groups have been is incorporated as an essential component of antenatal care and paediatric practice. Studies to investigate stability, safety and efficacy of iron and ioidine fortified salt for improving the haemoglobin status of the entire population are underway. In spite of all these efforts anaemia continues to be a major problem affecting all segments of population and there has not been any substantial decline in the adverse consequences of anaemia. Magnitude Of Nutritional Anaemia
In view of the public health importance of anaemia WHO and ICMR
have conducted studies to define the magnitude of the anaemia in different segments of the ppopulation indifferent regions. Data from these studies indicate that prevalence of anaemia is highest in Africa and South Asia. It is noteworthy that unlike South Asia, prevalence of anaemia in the neighbouring East Asian Countries is very low. The very high incidence of anaemia in South Asia might to a large extent be due to predominantly vegetarian diet with high phytate and low iron content. Prevalence of anaemia in children, men, women and pregnant women in developed, developing countries and in urban and rural parts of India is given in Tables 6.1 1nd 6.2.
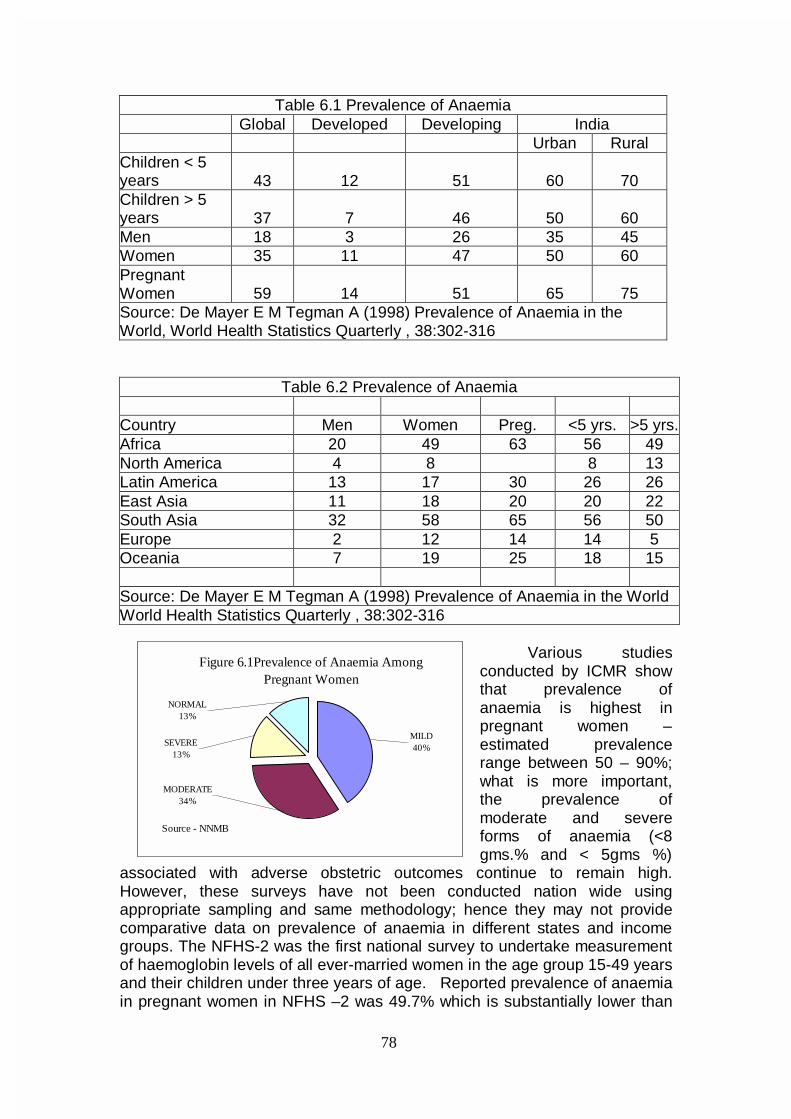
78
Table 6.1 Prevalence of Anaemia Global Developed Developing India Urban Rural Children < 5 years 43 12 51 60 70 Children > 5 years 37 7 46 50 60 Men 18 3 26 35 45 Women 35 11 47 50 60 Pregnant Women 59 14 51 65 75 Source: De Mayer E M Tegman A (1998) Prevalence of Anaemia in the World, World Health Statistics Quarterly , 38:302-316
Table 6.2 Prevalence of Anaemia Country Men Women Preg. <5 yrs. >5 yrs. Africa 20 49 63 56 49 North America 4 8 8 13 Latin America 13 17 30 26 26 East Asia 11 18 20 20 22 South Asia 32 58 65 56 50 Europe 2 12 14 14 5 Oceania 7 19 25 18 15 Source: De Mayer E M Tegman A (1998) Prevalence of Anaemia in the World World Health Statistics Quarterly , 38:302-316
Various studies conducted by ICMR show that prevalence of anaemia is highest in pregnant women – estimated prevalence range between 50 – 90%; what is more important, the prevalence of moderate and severe forms of anaemia (<8 gms.% and < 5gms %)
associated with adverse obstetric outcomes continue to remain high. However, these surveys have not been conducted nation wide using appropriate sampling and same methodology; hence they may not provide comparative data on prevalence of anaemia in different states and income groups. The NFHS-2 was the first national survey to undertake measurement of haemoglobin levels of all ever-married women in the age group 15-49 years and their children under three years of age. Reported prevalence of anaemia in pregnant women in NFHS –2 was 49.7% which is substantially lower than
Figure 6.1Prevalence of Anaemia Among Pregnant Women
NORMAL13%
SEVERE13%
MODERATE 34%
MILD40%
Source - NNMB
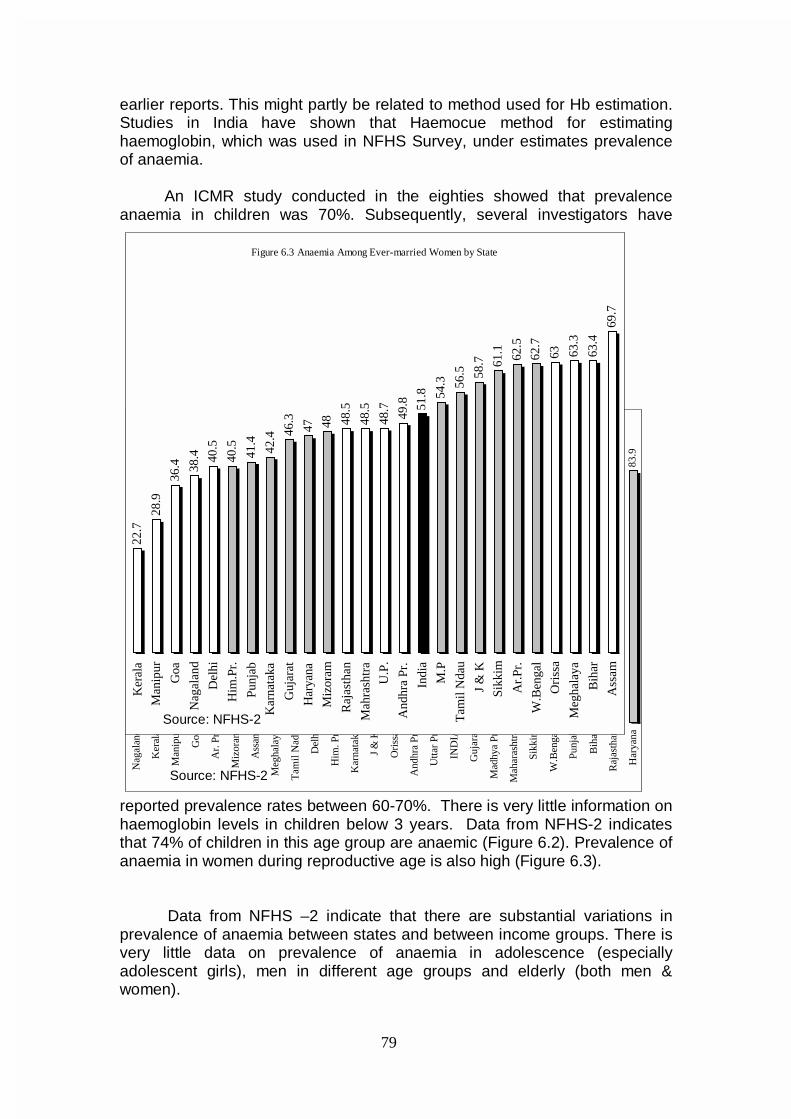
79
earlier reports. This might partly be related to method used for Hb estimation. Studies in India have shown that Haemocue method for estimating haemoglobin, which was used in NFHS Survey, under estimates prevalence of anaemia. An ICMR study conducted in the eighties showed that prevalence anaemia in children was 70%. Subsequently, several investigators have
reported prevalence rates between 60-70%. There is very little information on haemoglobin levels in children below 3 years. Data from NFHS-2 indicates that 74% of children in this age group are anaemic (Figure 6.2). Prevalence of anaemia in women during reproductive age is also high (Figure 6.3).
Data from NFHS –2 indicate that there are substantial variations in prevalence of anaemia between states and between income groups. There is very little data on prevalence of anaemia in adolescence (especially adolescent girls), men in different age groups and elderly (both men & women).
Figure 6.2 Anaemia Among Children in 6-36 months age-group
43.7
43.9
45.2
53.4
54.5 57
.2
63.2 67
.6
69.0
69.0
69.9
70.6
71.1
72.3
72.3
73.9
74.3
74.5
75.0
76.0
76.5 78
.3 80.0
81.3
82.3
83.9
Nag
alan
d
Ker
ala
Man
ipur
Goa
Ar.
Pr.
Miz
oram
Ass
am
Meg
hala
ya
Tam
il N
adu
Del
hi
Him
. Pr.
Kar
nata
ka
J &
K
Ori
ssa
And
hra
Pr.
Utta
r Pr
.
IND
IA
Guj
arat
Mad
hya
Pr.
Mah
aras
htra
Sikk
im
W.B
enga
l
Punj
ab
Bih
ar
Raj
asth
an
Har
yana
Source: NFHS-2
Figure 6.3 Anaemia Among Ever-married Women by State
22.7
28.9
36.4 38
.4 40.5
40.5
41.4
42.4 46
.3
47 48 48.5
48.5
48.7
49.8 51
.8 54.3 56
.5 58.7 61
.1 62.5
62.7
63 63.3
63.4
69.7
Ker
ala
Man
ipur
Goa
Nag
alan
d
Del
hi
Him
.Pr.
Punj
ab
Kar
nata
ka
Guj
arat
Har
yana
Miz
oram
Raj
asth
an
Mah
rash
tra
U.P
.
And
hra
Pr.
Indi
a
M.P
Tam
il N
dau
J &
K
Sikk
im
Ar.
Pr.
W.B
enga
l
Ori
ssa
Meg
hala
ya
Bih
ar
Ass
am
Source: NFHS-2
80
In view of the current high prevalence and the proposed efforts to reduce the prevalence of anaemia, it is essential that an institutional mechanism is set up to monitor time trends in prevalence of anaemia at least at state level from a representative sample population from the Tenth Plan period so that data will be available to plan interventions and also monitor their impact.
Ongoing interventions
In view of the fact that in India anaemia is due to (a) lack of adequate food intake (cereals and pulses) and intake of iron and folate rich vegetables (b) poor bioavailability of iron and (c) high hookworm infestation/malaria, intervention strategies have attempted to address each of these.
Applied Nutrition Programme promoted home based production of
protective foods such as vegetables and fruits and nutrition education to improve consumption of these by pregnant, nursing mothers and children. Special Nutrition Programme and Tamil Nadu Integrated Nutrition Programme provided supplementary food to children, pregnant and lactating women with a view to improve dietary intake of both cereals and vegetables. The Integrated Child Development Services Scheme initiated in 1975, is perhaps the single largest food supplementation programme in the world. The package of services provided through ICDS includes food supplementation to improve protein and energy intake, iron and folic acid distribution to improve haemoglobin status and nutrition and health education to women for improving maternal and child nutritional status. Evaluation of the nutrition component of the programme carried out by the Nutrition Foundation of India and the National Institute of Public Co-operation and Child Development (NIPCCD) indicate that the gains in terms of improvement in nutritional status from the Programme have not been impressive. There is inadequate coverage of children below 3 years and poor nutrition education to encourage improved feeding practices in the home. In most situations there is no effort to include iron folate rich vegetables in the supplementary food provided in ICDS. Distribution of Iron and folate tablets through the ICDS net work to the pregnant women, adolescents and children have not resulted in substantial improvement in coverage or improvement in haemoglobin status.
There is an urgent need to augment health and nutrition education to
improve over all dietary intake and promote consumption of iron and folate rich foodstuffs such as green leafy vegetables as a part of the ongoing programmes on ICDS and the NACCP. Measures to promote exclusive breast feeding by education of the community through ongoing health and nutrition programme need be continued. Current research efforts to evolve genetically modified plants with high iron including genetic engineering of cereals have to be supported and evaluated. Anaemia in pregnancy Realizing the magnitude of the problem of anaemia in pregnant women and the adverse consequences associated with it obstetricians made
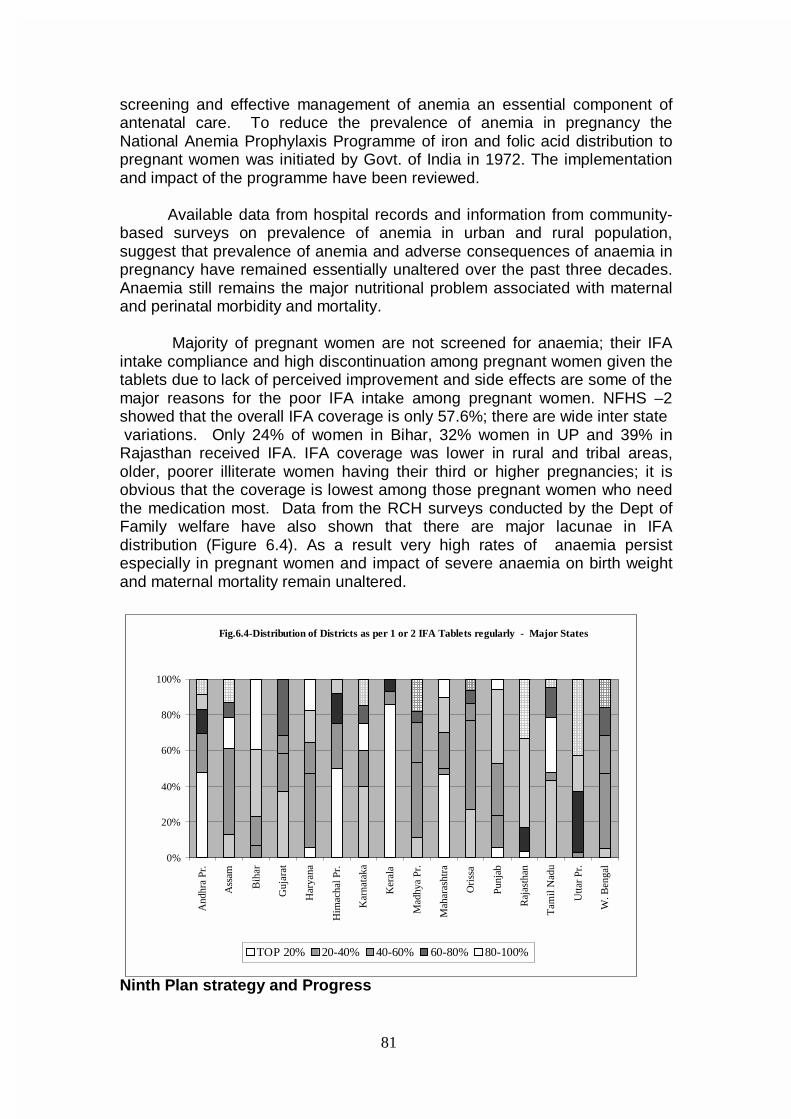
81
screening and effective management of anemia an essential component of antenatal care. To reduce the prevalence of anemia in pregnancy the National Anemia Prophylaxis Programme of iron and folic acid distribution to pregnant women was initiated by Govt. of India in 1972. The implementation and impact of the programme have been reviewed.
Available data from hospital records and information from community-based surveys on prevalence of anemia in urban and rural population, suggest that prevalence of anemia and adverse consequences of anaemia in pregnancy have remained essentially unaltered over the past three decades. Anaemia still remains the major nutritional problem associated with maternal and perinatal morbidity and mortality.
Majority of pregnant women are not screened for anaemia; their IFA
intake compliance and high discontinuation among pregnant women given the tablets due to lack of perceived improvement and side effects are some of the major reasons for the poor IFA intake among pregnant women. NFHS –2 showed that the overall IFA coverage is only 57.6%; there are wide inter state variations. Only 24% of women in Bihar, 32% women in UP and 39% in Rajasthan received IFA. IFA coverage was lower in rural and tribal areas, older, poorer illiterate women having their third or higher pregnancies; it is obvious that the coverage is lowest among those pregnant women who need the medication most. Data from the RCH surveys conducted by the Dept of Family welfare have also shown that there are major lacunae in IFA distribution (Figure 6.4). As a result very high rates of anaemia persist especially in pregnant women and impact of severe anaemia on birth weight and maternal mortality remain unaltered.
Ninth Plan strategy and Progress
Fig.6.4-Distribution of Districts as per 1 or 2 IFA Tablets regularly - Major States
0%
20%
40%
60%
80%
100%
And
hra
Pr.
Ass
am
Bih
ar
Guj
arat
Har
yana
Him
acha
l Pr.
Kar
nata
ka
Ker
ala
Mad
hya
Pr.
Mah
aras
htra
Ori
ssa
Punj
ab
Raj
asth
an
Tam
il N
adu
Utta
r Pr
.
W. B
enga
l
TOP 20% 20-40% 40-60% 60-80% 80-100%
82
Ninth Plan operational strategy for prevention and management of anaemia in the general population included fortification of common foods with iron to increase dietary intake of iron and improve haemoglobin status of the entire population including children, adolescent girls and women prior to pregnancy; health and nutrition education to improve consumption of iron and folate rich foodstuffs such as green leafy vegetables and horticulture interventions to improve availability of green leafy vegetables in urban and rural areas at affordable costs throughout the year.
Currently there are no screening programmes for detection of anaemia in preschool and school children. IFA distribution to children is erratic and coverage very low. In view of the high prevalence of anaemia in school children weekly or biweekly IFA to all school children has been suggested. Weekly regimen was advocated in view of the fact that the mucosal cells are shed once a week and therefore absorption of medicinal iron tablets might be higher in the once a week regimen. It is also convenient to administer the drug once a week. With bi-weekly regimen a lower dose can be administered with lesser side effects than weekly large dose. Daily regimens have also been tried. Available data indicates that daily regimen is most effective when supervised. Weekly and bi-weekly regimens are not as effective as daily regimen in prevention of anaemia. Universal supplementation with medicinal iron does not identify the children with severe grades of anaemia who require higher dose of iron. Screening for hookworm and other causes of anaemia are not carried out and therefore severe anemia and associated health hazards continue to remain unaffected.
There is no programme for screening adolescents especially girls for
anaemia. Under the RCH programme pilot studies on iron supplementation to adolescent girls as part of the adolescent health care in selected blocks is being carried out. Similar efforts are underway through ICDS in selected blocks. There is no data on the extent of coverage and impact of iron supplementation under these programmes. There has been training programmes to improve screening of pregnant women for anaemia and initiating appropriate therapy. However, the programme is yet to be operationalised. The Department of Family Welfare is now strengthening logistics of supply in all the States, so that serious shortages in iron and folic acid tablets and problems of the quality of tablets at the peripheral level do not recur.
In view of the fact that iron deficiency is widespread and affects all segments of the population and that massive dietary changes to improve iron intake/absorption are neither feasible nor affordable, food fortification with iron has been investigated. As the prevalence is higher in poorer segments of the population, it is important that fortification with iron should be through foodstuffs which are affordable and utilized in adequate quantity by all including the poorest segments of the population. Using these criteria salt appears to be the most suitable substance for iron fortification. Fortification of salt with iron was developed by the National Institute of Nutrition. Department of Food, Government of India helped in conduct of a multi-centred study in
83
Hyderabad, Madras, Calcutta and Delhi to test the efficacy of iron enriched salt. The study unequivocally established the efficacy of iron fortified salt. Tamil Nadu Salt corporation was manufacturing and supplying iron fortified salt to children in Mid Day Meal Scheme using the UNICEF gifted plant and with subsidy from the Department of Food.
In view of the Government of India’s policy for Universal Iodisation of
Salt marketing of salt with iron alone is not appropriate. Considerable work was done in fortifying salt with iodine and iron. It is reported that technology for large scale production of double fortified salt is now available. Results of initial studies in school children showed that there was substantial improvement in iron and iodine status of children receiving the double fortified salt. Subsequent studies with iron and iodine fortified salt in tribal population did not show a significant improvement in the haemoglobin status.
Health education and horticultural intervention are receiving attention,
though the outreach and achievements in terms of changed consumption pattern are still far from satisfactory. Strategies for prevention, detection and management of anaemia in the Tenth Plan In view of widespread prevalence of iron and folate deficiency in Indian dietaries major efforts have to be made to increase iron and folate content of diet and wherever possible to improve bioavailability. This when sustained would result in substantial reduction in prevalence of anaemia. The major intervention strategies required for prevention of anaemia in all age groups are (a) Improved dietary intake to meet RDA for all macro and micronutrient: Increasing the dietary intake so that it meets the calorie needs will result in increase in dietary intake of iron by one third. If efforts directed to achieve this were combined with the health education to improve green leafy vegetable intake, substantial proportion of the deficiency of both iron and folate would be reduced. Foods rich in ascorbic acid should be included in the diet. Current research efforts to evolve genetically modified plants with high iron including genetic engineering of cereals have to be supported and evaluated. (b) Dietary diversification to include iron folate rich foods as well as food stuffs that promote iron absorption: This aspect is dealt with extensively under the chapter on dietary diversification. (c) Food fortification including introduction of iron and iodine fortified salt or in specific areas iron fortified atta. (d) There is an urgent need to augment health and nutrition education to improve over all dietary intakes and promote consumption of iron and folate rich foodstuffs such as green leafy vegetables as a part of the ongoing programmes on ICDS and the NACCP. Measures to promote exclusive breast-feeding by education of the community through ongoing health and nutrition programme need be continued. (e) Among vulnerable groups screening for and management of anaemia have to be attempted. Screening the vulnerable population groups is an essential prerequisite for detection and management of anaemia especially in pregnancy.
84
Management of anaemia depends upon the severity and chronicity of the anaemia, the physiological status of the individual and the time available for correction of anaemia. Strategy for different age groups Infants
To prevent anaemia in infants, exclusive breast feeding for six months need be encouraged because of the high bio availability of iron in breast milk. When supplementary feeding is introduced, green leafy vegetables should be introduced along with cereal/pulse /oilseed mix. Breast feeding should be continued as long as possible; continued breast feeding upto 24 months is desirable. Screening all infants for anaemia is not feasible however screening should be carried out in pre term, low birth weight infants and those with growth faltering and repeated episodes of infection; anaemic infants should receive appropriate treatment. Preschool children
There is no programme for screening for anaemia in all preschool children. It is not possible to screen these children in the settings where ongoing programmes exist. Therefore advocacy with regard to dietary diversification and use of double fortified salt as and when it is comes into the market are suggested as measures to improve the dietary intake of iron and folate and prevent anaemia. All growth retarded children and those with repeated infections detected by the AWW may have to examined by ANM and the PHC medical officer and Hb estimation carried out; those found to be anemic may be provided with appropriate treatment. School children
Studies carried out in India have reported high prevalence of worm infestations in the children 5-15 years of age. The association between hookworm infestation and anaemia is well established. In endemic areas, screening all anaemic children for hookworm infestation and treating them maybe essential. Children giving history of passing worms may be treated with broad spectrum antihelminthics. Improvement of sanitation and IEC to not walk barefoot are essential.
Operational research to assess the feasibility of at least once a year screening for detection and correction of anaemia in school children as a part of school health check up needs to be explored. Currently there is no mechanism to cover out of school children among whom anemia is likely to be more prevalent. Efforts may have to be made to explore mechanism for prevention, detection and management of anaemia in this group. Adolescents
This is an important group. Nutrition education to increase dietary intake is important in this group who are future mothers. Their screening is not possible; once or twice weekly supplementation as is being carried out in some blocks should be continued. Wherever possible attempts should be made to screen them for anaemia and provide appropriate care. Adolescents
85
who are pregnant should receive very high priority for screening and management of anaemia. Pregnant women
The strategy proposed under the RCH programme should be fully operationalised. The programme components aimed at the control of anaemia in pregnancy includes: a) fortification of common food stuffs with iron to increase dietary intake of iron and improve hemoglobin status of the entire population including girls and women prior to pregnancy, b) screening of all pregnant women using a reliable method of hemoglobin estimation for detection of anemia, c) oral iron folate prophylactic therapy for all non-anemic pregnant women (hemoglobin more than 11 g/dl) d) iron folate oral medication at the maximum tolerable dose throughout pregnancy for women with hemoglobin level between 8 and 11 g/dl, e) parenteral iron therapy for women with hemoglobin level between 5 and 8 g/dl if they do not have any obstetric or systemic complication, f) hospital admission and intensive personalised care for women with hemoglobin less than 5 g/dl , g) screening and effective management of obstetric and systemic problems in all anemic pregnant women, and h) improvement in health care delivery systems and health education to the community to promote utilisation of available care. Elderly people
This is an important vulnerable group. There is very little information on the prevalence of anaemia in them. Research studies to assess the extent of the problem in this group need to be undertaken on a priority basis. Based on the findings it will be possible to mount an appropriate intervention programme. Other groups of population In India anaemia affects all the segments of population. In view of this it is essential to take steps to improve iron intake in all through out their life. One feasible method of improving iron intake on a sustained basis is fortification of common foods such as salt with iron and make it accessible to all. Fortification of Salt with Iron and iodine
It is imperative that studies on double fortified salt manufactured through different technologies are evaluated for their efficacy, acceptability and cost effectiveness in appropriate research setting. Based on the results of the study, decisions regarding double fortification of salt and its supply perhaps through PDS system to improve haemoglobin level could be taken up. Besides salt, research on feasibility, efficacy and cost effectiveness of research on fortifying food items like atta with iron can be taken up. Monitoring and Surveillance
In view of the current high prevalence and the proposed efforts to reduce the prevalence of anaemia it is essential that an institutional mechanism is set up to monitor time trends in prevalence of anaemia at
86
least at state level from a representative sample population from the Tenth Plan period so that data will be available to plan interventions and also monitor their impact. The following measures are suggested: • Strengthening routine reporting under RCH Programme should include
%of pregnant women in whom haemoglobin estimation has been done, % anaemic, %given IFA tablets, compliance in IFA intake and the % given parenteral iron therapy.
• As a part of RCH evaluation by District Surveys, appropriate questions regarding haemoglobin estimation, IFA coverage and completeness of taking IFA tablets be included.
• PRIs, Women Self Help Groups and AWW can be requested to monitor intake of IFA tablets.
• As and when large scale surveys are done e.g. NFHS, information on screening for anaemia in pregnancy, coverage with IFA may be collected; in addition Hb estimation of the various members of the family may be undertaken so that there is an impact evaluation of ongoing interventions.
Research priorities in Anaemia Basic Research Double fortified Salt: • Technology development and cost • Testing of stability, packaging, shelf life, bio-availability Clinical and Applied Research • Short medium and long term trials for efficacy of double fortified salt
prepared by different technologies • Clinical trials of various formulations of oral and parenteral iron therapy • Magnitude of anaemia in pregnancy in different regions in urban and rural
setting. • Current research efforts to evolve genetically modified plants with high iron
including genetic engineering of cereals have to be supported and evaluated.
Operational Research • Screening for anaemia as a part of anaemia in pregnancy • Effective management and follow up of anaemic pregnant women • Appropriate management and follow up with haemoglobin between 8-
11g/dl • Referral of women with Hb<5gms/dl to FRUs • Referral of women with Hb between 5 and 8g/dl for parenteral therapy • Monitoring improvement in Hb after appropriate intervention Operationalisation of management of anaemia in childhood • Screening of children as a part of school health check up
87
• Effective management of anaemia in children-role of oral iron therapy with or without deworming
Operational research for Prevention of anaemia • Horticultural interventions to improve availability of greens • Use of double fortified salt – packaging, quality control, transport, storage,
supply through TPDS, desirability and feasibility of providing subsidy to neutralize the cost differential between fortified and unfortified salt, awareness generation, legal framework
• Ensuring continued intake of IFA among adolescent girls, prior to pregnancy, during pregnancy & among elderly
Intersectoral Coordination / Involvement of the Community • AWWs who have access to children below the age of 6 years, pregnant
and lactating women and adolescents to screen under nourished children and adolescents for anaemia and distribute IFA tablets to them.
• They can monitor IFA intake by pregnant women. • Horticulture and food processing aimed at improving availability of and
access to iron rich food is discussed under dietary diversification. • Community ownership of the programme and behavioral changes within
the household is necessary for achieving improvement in haemoglobin status of the population. This includes involvement not only of the mothers and members of the household but also the community leaders. The school teacher can play an important role in involvement of the community. Community involvement in preparing micronutrient rich complimentary foods need to be promoted especially in the Mahila Mandals, women’s self help groups.
IODINE DEFICIENCY DISORDERS Iodine Deficiency Disorder (IDD) has been recognized as a major public health problem. Unlike other micronutrient deficiencies, IDD is due to deficiency of iodine in water, soil and foodstuffs and affects all socioeconomic groups living in defined geographic areas. The WHO/UNICEF/ICCIDD has defined indicators for IDD prevalence and criteria for classifying IDD as a significant public health problem. Magnitude
Estimates by WHO suggests that approximately 1.4 billion population are at risk for IDD globally, of which 600 million have goiter and over 20 million suffer from irreversible brain damage. Iodine deficiency is a major health problem in India too. An estimated 167 million people are at risk of Iodine deficiency disorders (IDD) in India of which 54 million have goiter and over 8 million have neurologic handicaps.
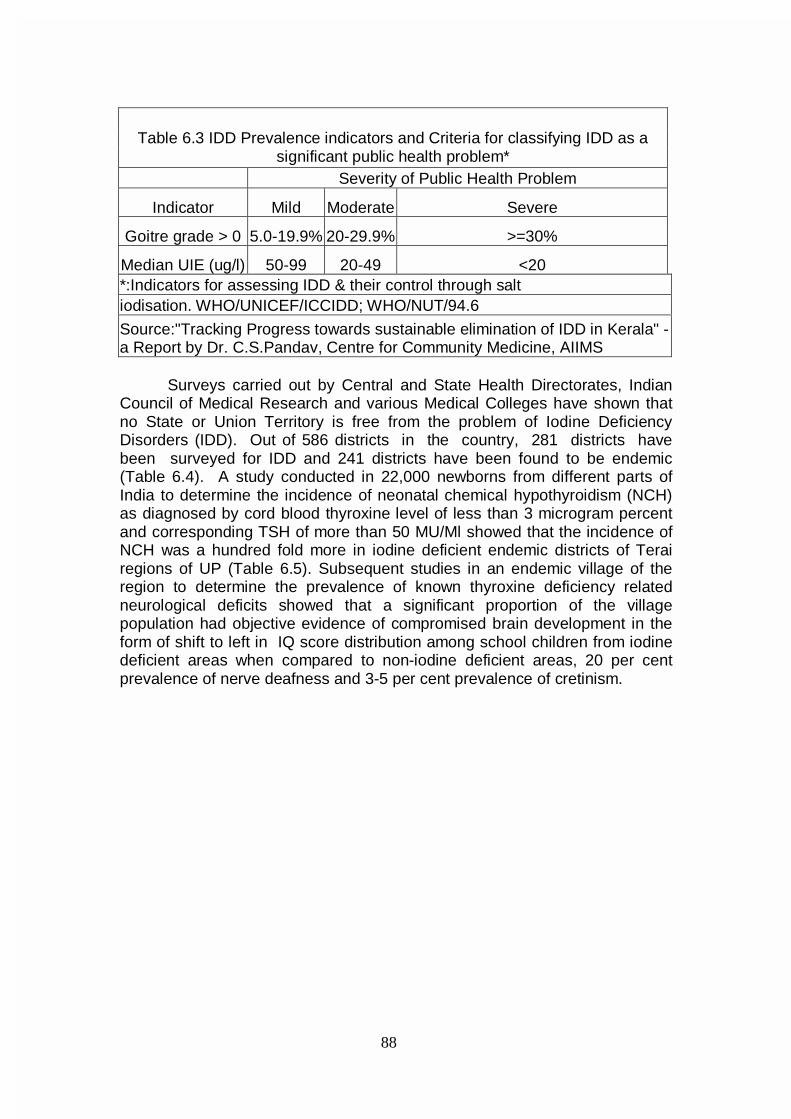
88
Surveys carried out by Central and State Health Directorates, Indian
Council of Medical Research and various Medical Colleges have shown that no State or Union Territory is free from the problem of Iodine Deficiency Disorders (IDD). Out of 586 districts in the country, 281 districts have been surveyed for IDD and 241 districts have been found to be endemic (Table 6.4). A study conducted in 22,000 newborns from different parts of India to determine the incidence of neonatal chemical hypothyroidism (NCH) as diagnosed by cord blood thyroxine level of less than 3 microgram percent and corresponding TSH of more than 50 MU/Ml showed that the incidence of NCH was a hundred fold more in iodine deficient endemic districts of Terai regions of UP (Table 6.5). Subsequent studies in an endemic village of the region to determine the prevalence of known thyroxine deficiency related neurological deficits showed that a significant proportion of the village population had objective evidence of compromised brain development in the form of shift to left in IQ score distribution among school children from iodine deficient areas when compared to non-iodine deficient areas, 20 per cent prevalence of nerve deafness and 3-5 per cent prevalence of cretinism.
Table 6.3 IDD Prevalence indicators and Criteria for classifying IDD as a
significant public health problem* Severity of Public Health Problem
Indicator Mild Moderate Severe
Goitre grade > 0 5.0-19.9% 20-29.9% >=30%
Median UIE (ug/l) 50-99 20-49 <20 *:Indicators for assessing IDD & their control through salt iodisation. WHO/UNICEF/ICCIDD; WHO/NUT/94.6
Source:"Tracking Progress towards sustainable elimination of IDD in Kerala" - a Report by Dr. C.S.Pandav, Centre for Community Medicine, AIIMS

89
Table 6.4Prevalence of Iodine Deficiency Disorders & Status of National Iodine Deficiency Disorders Programme in different States/UTs of India
Sl.No. State IDD Cell
Total No. of dist.
No. of dist. Surveyed
No. of dist. endemic
Ban notific-ation issued
1. Andhra Pradesh 23 10 9 Partial
2. Arunachal Pradesh 10 10 10 Complete Yes
3. Assam 23 18 18 Complete Yes 4. Bihar 55 22 21 Complete Yes 5. Goa 2 2 2 Complete Yes 6. Gujarat 25 16 8 Complete Yes 7. Haryana 19 9 8 Complete Yes 8. Himachal Pradesh 12 10 10 Complete No 9. Jammu & Kashmir 15 14 11 Complete No
10. Karnataka 27 17 6 Complete Yes 11. Kerala 20 14 11 No Ban Yes 12. Madhya pradesh 61 16 16 Complete Yes 13. Maharashtra 35 29 21 Partial Yes 14. Mizoram 8 4 4 Complete Yes 15. Manipur 9 8 8 Complete Yes 16. Meghalaya 7 2 2 Complete Yes 17. Nagaland 8 7 7 Complete Yes 18. Orissa 30 4 4 Complete Yes 19. Punjab 17 3 3 Complete Yes 20. Rajasthan 31 3 3 Complete Yes 21. Sikkim 4 4 4 Complete Yes 22. Tamil Nadu 29 12 12 Complete Yes 23. Tripura 4 3 3 Complete Yes 24. Uttar Pradesh 83 34 29 Complete Yes 25. West Bengal 18 5 5 Complete Yes
26. Andaman & Nicobar Islands 2 2 2 Complete Yes
27. Chandigarh 1 1 1 Complete Yes 28. D & N Haveli 1 1 1 Complete Yes 29. Delhi 1 1 Complete Yes 30. Daman & Diu 1 1 1 Complete Yes 31. Lakshadweep 1 Complete No 32. Pondicherry 4 Complete No
Total No. of dist. 586 281 241 Source: Surveys carried out by Central and State Health Dte.s,ICMR and variouMedical Colleges
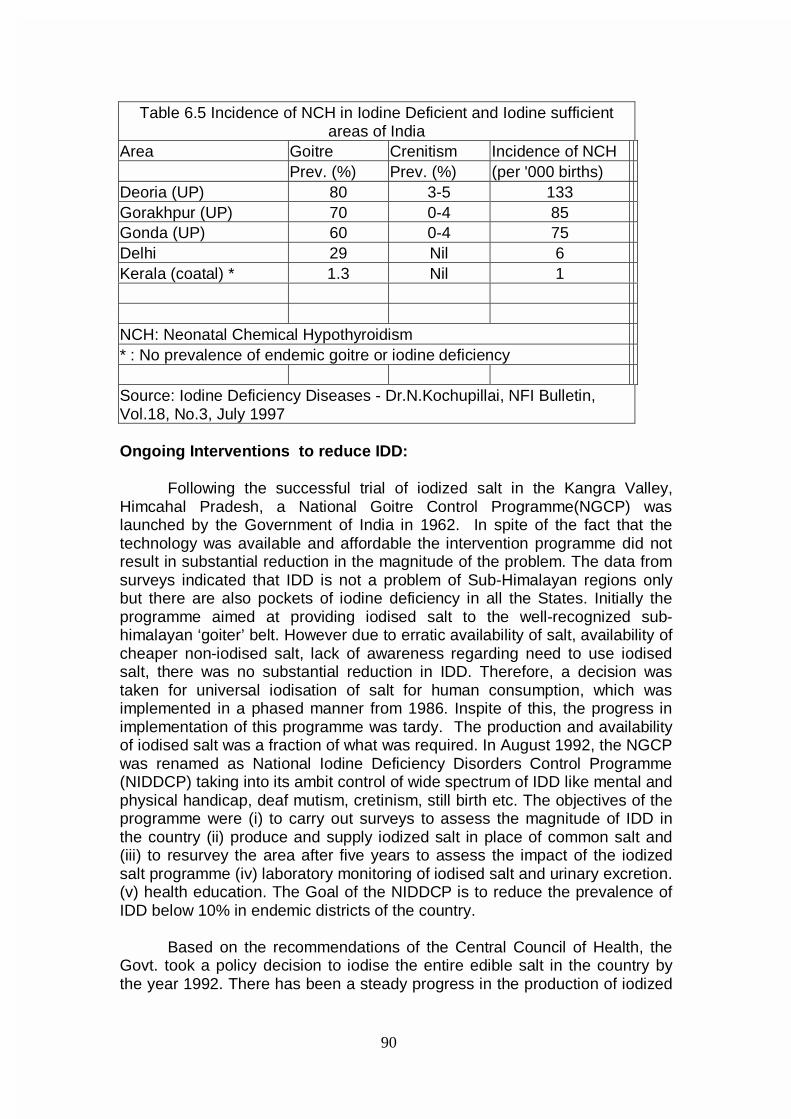
90
Ongoing Interventions to reduce IDD: Following the successful trial of iodized salt in the Kangra Valley, Himcahal Pradesh, a National Goitre Control Programme(NGCP) was launched by the Government of India in 1962. In spite of the fact that the technology was available and affordable the intervention programme did not result in substantial reduction in the magnitude of the problem. The data from surveys indicated that IDD is not a problem of Sub-Himalayan regions only but there are also pockets of iodine deficiency in all the States. Initially the programme aimed at providing iodised salt to the well-recognized sub-himalayan ‘goiter’ belt. However due to erratic availability of salt, availability of cheaper non-iodised salt, lack of awareness regarding need to use iodised salt, there was no substantial reduction in IDD. Therefore, a decision was taken for universal iodisation of salt for human consumption, which was implemented in a phased manner from 1986. Inspite of this, the progress in implementation of this programme was tardy. The production and availability of iodised salt was a fraction of what was required. In August 1992, the NGCP was renamed as National Iodine Deficiency Disorders Control Programme (NIDDCP) taking into its ambit control of wide spectrum of IDD like mental and physical handicap, deaf mutism, cretinism, still birth etc. The objectives of the programme were (i) to carry out surveys to assess the magnitude of IDD in the country (ii) produce and supply iodized salt in place of common salt and (iii) to resurvey the area after five years to assess the impact of the iodized salt programme (iv) laboratory monitoring of iodised salt and urinary excretion. (v) health education. The Goal of the NIDDCP is to reduce the prevalence of IDD below 10% in endemic districts of the country. Based on the recommendations of the Central Council of Health, the Govt. took a policy decision to iodise the entire edible salt in the country by the year 1992. There has been a steady progress in the production of iodized
Table 6.5 Incidence of NCH in Iodine Deficient and Iodine sufficient areas of India
Area Goitre Crenitism Incidence of NCH Prev. (%) Prev. (%) (per '000 births) Deoria (UP) 80 3-5 133 Gorakhpur (UP) 70 0-4 85 Gonda (UP) 60 0-4 75 Delhi 29 Nil 6 Kerala (coatal) * 1.3 Nil 1 NCH: Neonatal Chemical Hypothyroidism * : No prevalence of endemic goitre or iodine deficiency Source: Iodine Deficiency Diseases - Dr.N.Kochupillai, NFI Bulletin, Vol.18, No.3, July 1997
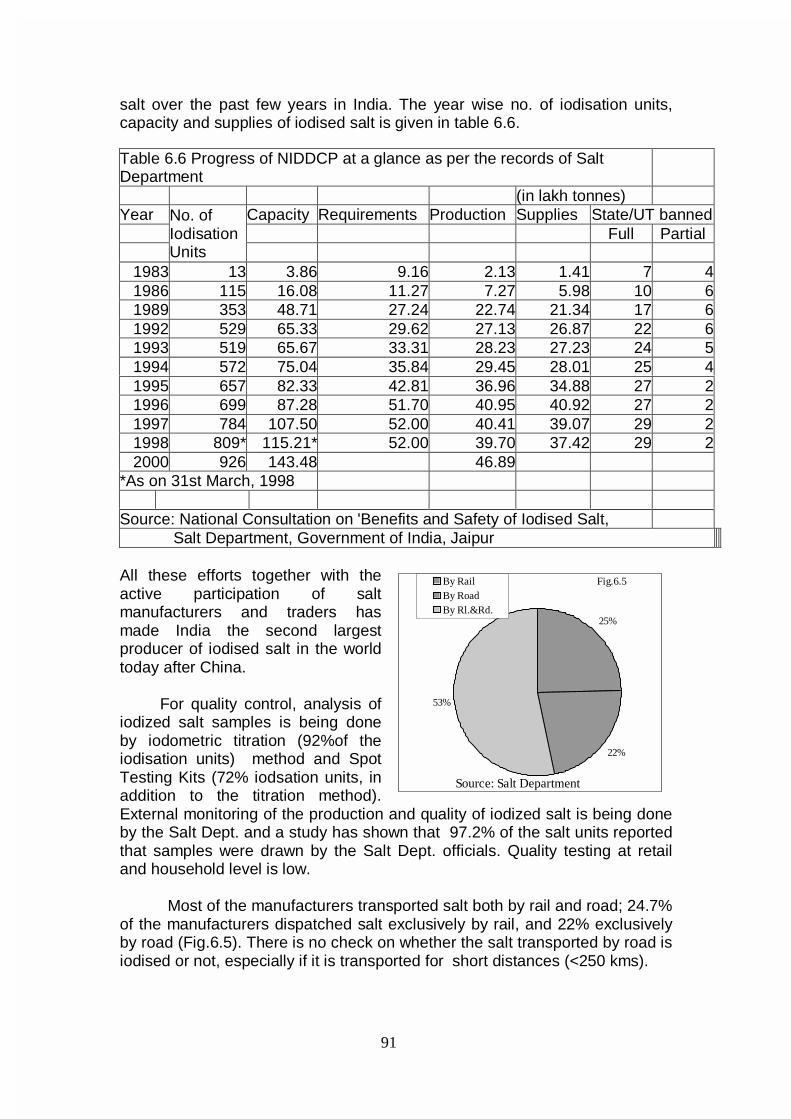
91
salt over the past few years in India. The year wise no. of iodisation units, capacity and supplies of iodised salt is given in table 6.6.
All these efforts together with the active participation of salt manufacturers and traders has made India the second largest producer of iodised salt in the world today after China. For quality control, analysis of iodized salt samples is being done by iodometric titration (92%of the iodisation units) method and Spot Testing Kits (72% iodsation units, in addition to the titration method). External monitoring of the production and quality of iodized salt is being done by the Salt Dept. and a study has shown that 97.2% of the salt units reported that samples were drawn by the Salt Dept. officials. Quality testing at retail and household level is low. Most of the manufacturers transported salt both by rail and road; 24.7% of the manufacturers dispatched salt exclusively by rail, and 22% exclusively by road (Fig.6.5). There is no check on whether the salt transported by road is iodised or not, especially if it is transported for short distances (<250 kms).
Table 6.6 Progress of NIDDCP at a glance as per the records of Salt Department (in lakh tonnes) Year Capacity Requirements Production Supplies State/UT banned Full Partial
No. of Iodisation Units
1983 13 3.86 9.16 2.13 1.41 7 4 1986 115 16.08 11.27 7.27 5.98 10 6 1989 353 48.71 27.24 22.74 21.34 17 6 1992 529 65.33 29.62 27.13 26.87 22 6 1993 519 65.67 33.31 28.23 27.23 24 5 1994 572 75.04 35.84 29.45 28.01 25 4 1995 657 82.33 42.81 36.96 34.88 27 2 1996 699 87.28 51.70 40.95 40.92 27 2 1997 784 107.50 52.00 40.41 39.07 29 2 1998 809* 115.21* 52.00 39.70 37.42 29 2 2000 926 143.48 46.89
*As on 31st March, 1998 Source: National Consultation on 'Benefits and Safety of Iodised Salt, Salt Department, Government of India, Jaipur
25%
22%
53%
By RailBy RoadBy Rl.&Rd.
Source: Salt Department
Fig.6.5
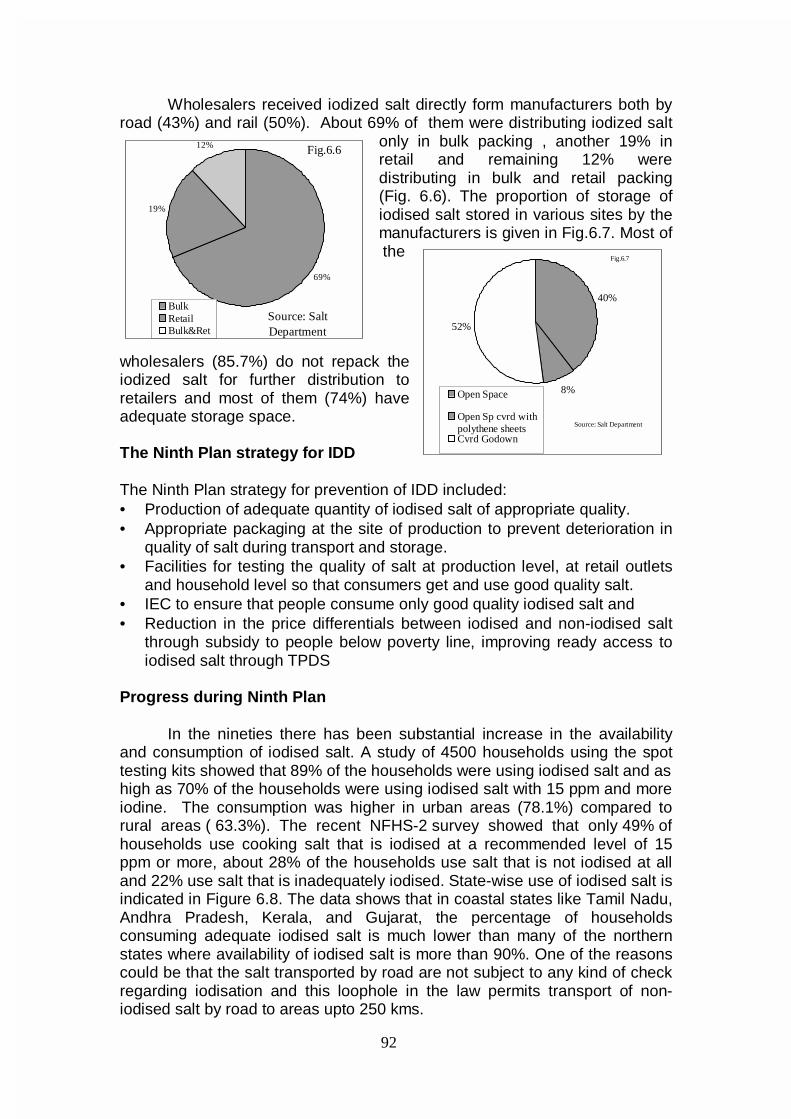
92
Wholesalers received iodized salt directly form manufacturers both by road (43%) and rail (50%). About 69% of them were distributing iodized salt
only in bulk packing , another 19% in retail and remaining 12% were distributing in bulk and retail packing (Fig. 6.6). The proportion of storage of iodised salt stored in various sites by the manufacturers is given in Fig.6.7. Most of the
wholesalers (85.7%) do not repack the iodized salt for further distribution to retailers and most of them (74%) have adequate storage space. The Ninth Plan strategy for IDD The Ninth Plan strategy for prevention of IDD included: • Production of adequate quantity of iodised salt of appropriate quality. • Appropriate packaging at the site of production to prevent deterioration in
quality of salt during transport and storage. • Facilities for testing the quality of salt at production level, at retail outlets
and household level so that consumers get and use good quality salt. • IEC to ensure that people consume only good quality iodised salt and • Reduction in the price differentials between iodised and non-iodised salt
through subsidy to people below poverty line, improving ready access to iodised salt through TPDS
Progress during Ninth Plan In the nineties there has been substantial increase in the availability and consumption of iodised salt. A study of 4500 households using the spot testing kits showed that 89% of the households were using iodised salt and as high as 70% of the households were using iodised salt with 15 ppm and more iodine. The consumption was higher in urban areas (78.1%) compared to rural areas ( 63.3%). The recent NFHS-2 survey showed that only 49% of households use cooking salt that is iodised at a recommended level of 15 ppm or more, about 28% of the households use salt that is not iodised at all and 22% use salt that is inadequately iodised. State-wise use of iodised salt is indicated in Figure 6.8. The data shows that in coastal states like Tamil Nadu, Andhra Pradesh, Kerala, and Gujarat, the percentage of households consuming adequate iodised salt is much lower than many of the northern states where availability of iodised salt is more than 90%. One of the reasons could be that the salt transported by road are not subject to any kind of check regarding iodisation and this loophole in the law permits transport of non-iodised salt by road to areas upto 250 kms.
69%
19%
12%
BulkRetailBulk&Ret
Fig.6.6
Source: Salt Department
40%
8%
52%
Open Space
Open Sp cvrd withpolythene sheetsCvrd Godown
Fig.6.7
Source: Salt Department
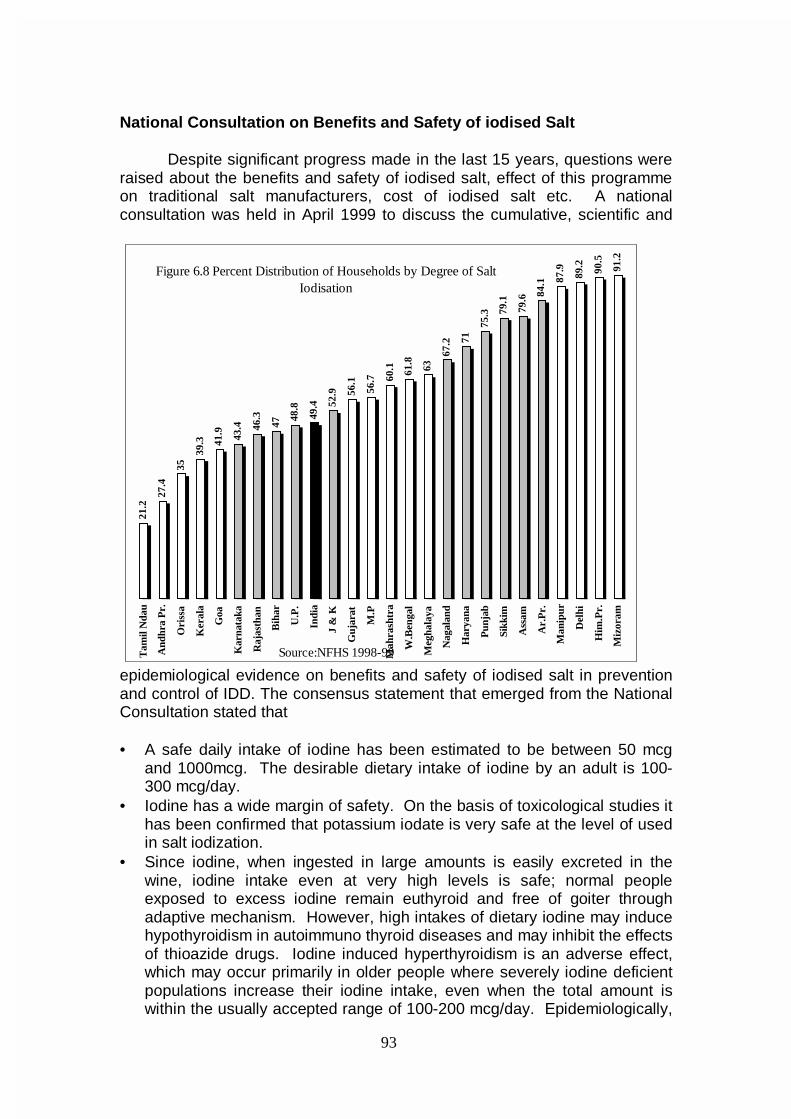
93
National Consultation on Benefits and Safety of iodised Salt Despite significant progress made in the last 15 years, questions were raised about the benefits and safety of iodised salt, effect of this programme on traditional salt manufacturers, cost of iodised salt etc. A national consultation was held in April 1999 to discuss the cumulative, scientific and
epidemiological evidence on benefits and safety of iodised salt in prevention and control of IDD. The consensus statement that emerged from the National Consultation stated that • A safe daily intake of iodine has been estimated to be between 50 mcg
and 1000mcg. The desirable dietary intake of iodine by an adult is 100-300 mcg/day.
• Iodine has a wide margin of safety. On the basis of toxicological studies it has been confirmed that potassium iodate is very safe at the level of used in salt iodization.
• Since iodine, when ingested in large amounts is easily excreted in the wine, iodine intake even at very high levels is safe; normal people exposed to excess iodine remain euthyroid and free of goiter through adaptive mechanism. However, high intakes of dietary iodine may induce hypothyroidism in autoimmuno thyroid diseases and may inhibit the effects of thioazide drugs. Iodine induced hyperthyroidism is an adverse effect, which may occur primarily in older people where severely iodine deficient populations increase their iodine intake, even when the total amount is within the usually accepted range of 100-200 mcg/day. Epidemiologically,
21.2
27.4
35
39.3 41
.9 43.4 46
.3
47
48.8
49.4 52
.9 56.1
56.7 60
.1 61.8
63
67.2 71
75.3 79
.1
79.6 84
.1 87.9
89.2 90.5
91.2
Tam
il N
dau
And
hra
Pr.
Ori
ssa
Ker
ala
Goa
Kar
nata
ka
Raj
asth
an
Bih
ar
U.P
.
Indi
a
J &
K
Guj
arat
M.P
Mah
rash
tra
W.B
enga
l
Meg
hala
ya
Nag
alan
d
Har
yana
Pun
jab
Sikk
im
Ass
am
Ar.
Pr.
Man
ipur
Del
hi
Him
.Pr.
Miz
oram
Source:NFHS 1998-99
Figure 6.8 Percent Distribution of Households by Degree of Salt Iodisation
94
iodine induced hyperthyrodism represents a transient increase in the incidence of hyperthyroidism which disappears in due course with the correction of iodine deficiency. From a public health point of view, the benefits of correcting iodine deficiency through universal iodisation of salt greatly outweigh the risk of iodine induced hyperthyroidism.
• The daily intake of upto 1 mg is entirely safe. In India, daily consumption of 10 gms of salt containing 15 parts per million of iodine would add a maximum of only 150 mcg of iodine, the likelihood of exceeding an intake of 1 mg/day is negligible.
Impact of Universal Iodisation of salt A countrywide study of over 14,000 school children to assess the iodine nutritional status and goiter prevalence among them was carried out during 1997-2000. This study showed following widespread availability of iodised salt there was normalization of urinary iodine excretion indicating adequate iodine intake in 95% of the school children with remarkable decline in goitre prevalence from pre salt iodisation levels. The most dramatic impact of the programme was seen in those districts/states, which were worse affected in the pre salt iodisation phase. Concurrently urine iodisation excretion studies in the same regions showed marked improvements of iodines intake by the people. A small study on comparison of IQ score in iodine deficient area before and after salt iodisation among children below 10 years and 11-14 years showed significant increase in IQ scores after iodisation of salt showing that use of iodised salt is reducing mental and physical developmental retardation (Dr.Kochupillai– personal communication).
In October 2000, the central government lifted the ban on sale of non-iodised salt for human consumption. However all the states and Union territories, except Kerala and Gujarat have issued ban notification on sale of non iodised salt for human consumption in their entire territories under the PFA Act. There is a partial ban in Andhra Pradesh and Maharashtra.
Recommendations for the 10th Plan • It is imperative that only iodised salt is made available for human
consumption. This is an essential requirement in order to enable the children of the 21st century to attain their full intellectual potential and take their rightful place in a knowledge based society.
• Ensure adequate level of salt iodisation at source. This could be done by a technically competent person under the administrative control of the Salt Commissioner, whose certification of adequacy of iodisation achieved should be a mandatory pre-requisite for getting priority rail rakes for transportation of salt.
• At wholesale and retail level, quality control is to be achieved by checking iodine content of salts available through wholesale/retail outlets. Quality check at consumer households can be achieved through home/anganwadi/school based testing by multi-purpose health functionaries, anganwadi workers, health inspectors, school children as
95
well as functionaries of the Panchayati-Raj by utilizing the salt iodine test kit.
• At the site of transportation and distribution, ensure that the salt is packed in ½-1 kg consumer poly pack to prevent deterioration in quality during transportation.
• IEC to ensure that people consume only good quality iodised salt voluntarily.
• One of the major apprehensions of universal use of iodised salt is its high cost. Price differentials between iodised and non-iodised salt should be reduced through subsidy to people below poverty line and ready access to iodised salt should be improved through TPDS.
• Adequate monitoring and evaluation of the programme need be done through studies on goitre prevalence among school children (6-11 years of age), urinary iodine excretion status, thyroid status of school children, neonatal thyroid status by appropriate screening techniques.
• Role of goitrogens need be investigated in areas wherever adequate iodised salt is available and used and IDD prevalence continues to be high.
VITAMIN A DEFICIENCY
Vitamin A is an important micronutrient for maintaining normal growth,
regulating cellular proliferation and differentiation , controlling developmental genetic programmes, for maintaining visual and reproductive functions. Vitamin A cannot be synthesized by humans and so must be consumed as an essential nutrient in the diet. Over the last two decades there has been a marked decline in blindness due to Vitamin A deficiency; but dietary intake of Vitamin A has remained sub-optimal in the poorer segments of the population and clinical deficiency signs are being reported even today in pregnant and lactating women and children. Magnitude of the problem
Vitamin A deficiency is not evenly spread throughout the country. Even
within a state, there are pockets where prevalence is high and others where prevalence is lower. Available data from National Nutrition Monitoring Bureau’s repeat surveys have shown that there has not been any alteration in the dietary intake of preschool children. Clinical manifestations include blindness due to keratomalacia, Bitot’s spots and night blindness. Prevalence of Vitamin A deficiency in pregnancy and lactation is between 1-5%. Blindness due to vitamin A deficiency was mainly seen in severely undernourished children between 1-3 years of age in the sixties and seventies; it is however rare now. Bitot spot is seen in children and prevalence tends to increase with increasing age in childhood. Both in children and in pregnant women, night blindness is a well recognized symptom. In the sixties paediatricians in major hospitals noted that prevalence of night blindness and Bitot’s spot in pre-school children ranged between 5-10% in most areas. Severe forms of PEM and Keratomalacia were common
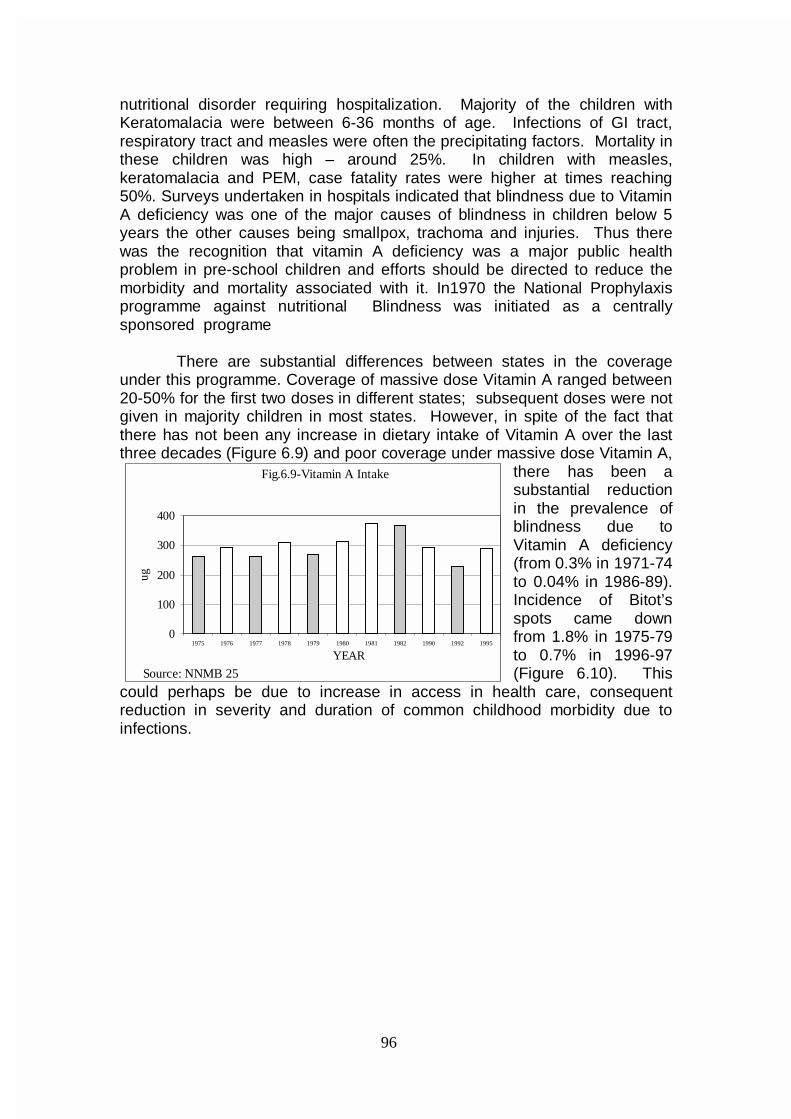
96
nutritional disorder requiring hospitalization. Majority of the children with Keratomalacia were between 6-36 months of age. Infections of GI tract, respiratory tract and measles were often the precipitating factors. Mortality in these children was high – around 25%. In children with measles, keratomalacia and PEM, case fatality rates were higher at times reaching 50%. Surveys undertaken in hospitals indicated that blindness due to Vitamin A deficiency was one of the major causes of blindness in children below 5 years the other causes being smallpox, trachoma and injuries. Thus there was the recognition that vitamin A deficiency was a major public health problem in pre-school children and efforts should be directed to reduce the morbidity and mortality associated with it. In1970 the National Prophylaxis programme against nutritional Blindness was initiated as a centrally sponsored programe
There are substantial differences between states in the coverage under this programme. Coverage of massive dose Vitamin A ranged between 20-50% for the first two doses in different states; subsequent doses were not given in majority children in most states. However, in spite of the fact that there has not been any increase in dietary intake of Vitamin A over the last three decades (Figure 6.9) and poor coverage under massive dose Vitamin A,
there has been a substantial reduction in the prevalence of blindness due to Vitamin A deficiency (from 0.3% in 1971-74 to 0.04% in 1986-89). Incidence of Bitot’s spots came down from 1.8% in 1975-79 to 0.7% in 1996-97 (Figure 6.10). This
could perhaps be due to increase in access in health care, consequent reduction in severity and duration of common childhood morbidity due to infections.
Fig.6.9-Vitamin A Intake
0
100
200
300
400
1975 1976 1977 1978 1979 1980 1981 1982 1990 1992 1995
YEAR
ug
Source: NNMB 25
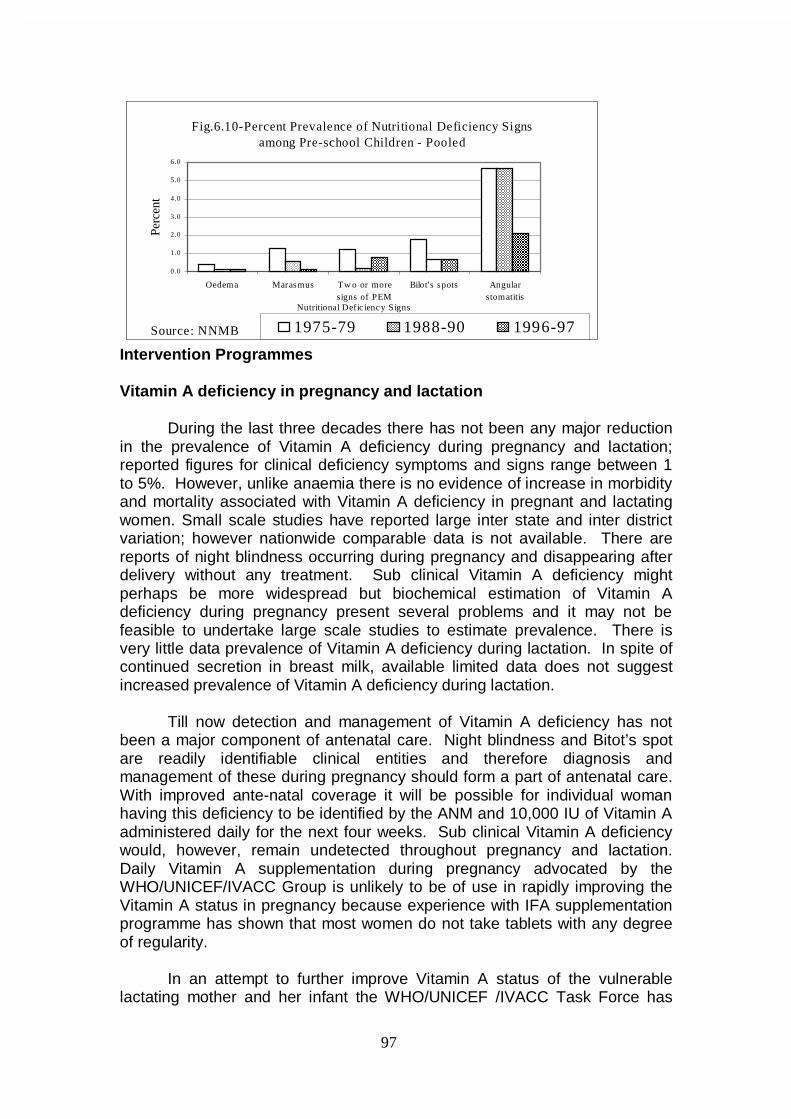
97
Fig.6.10-Percent Prevalence of Nutritional Deficiency Signs among Pre-school Children - Pooled
0.0
1.0
2.0
3.0
4.0
5.0
6.0
Oedema Marasmus Tw o or moresigns of PEM
Bilot's spots Angularstomatitis
Nutritional Defic ienc y Signs
Perc
ent
1975-79 1988-90 1996-97Source: NNMB
Intervention Programmes Vitamin A deficiency in pregnancy and lactation During the last three decades there has not been any major reduction in the prevalence of Vitamin A deficiency during pregnancy and lactation; reported figures for clinical deficiency symptoms and signs range between 1 to 5%. However, unlike anaemia there is no evidence of increase in morbidity and mortality associated with Vitamin A deficiency in pregnant and lactating women. Small scale studies have reported large inter state and inter district variation; however nationwide comparable data is not available. There are reports of night blindness occurring during pregnancy and disappearing after delivery without any treatment. Sub clinical Vitamin A deficiency might perhaps be more widespread but biochemical estimation of Vitamin A deficiency during pregnancy present several problems and it may not be feasible to undertake large scale studies to estimate prevalence. There is very little data prevalence of Vitamin A deficiency during lactation. In spite of continued secretion in breast milk, available limited data does not suggest increased prevalence of Vitamin A deficiency during lactation.
Till now detection and management of Vitamin A deficiency has not been a major component of antenatal care. Night blindness and Bitot’s spot are readily identifiable clinical entities and therefore diagnosis and management of these during pregnancy should form a part of antenatal care. With improved ante-natal coverage it will be possible for individual woman having this deficiency to be identified by the ANM and 10,000 IU of Vitamin A administered daily for the next four weeks. Sub clinical Vitamin A deficiency would, however, remain undetected throughout pregnancy and lactation. Daily Vitamin A supplementation during pregnancy advocated by the WHO/UNICEF/IVACC Group is unlikely to be of use in rapidly improving the Vitamin A status in pregnancy because experience with IFA supplementation programme has shown that most women do not take tablets with any degree of regularity. In an attempt to further improve Vitamin A status of the vulnerable lactating mother and her infant the WHO/UNICEF /IVACC Task Force has
98
recommended that a single dose of 200,000 IU Vitamin A may be administered to the lactating women within 8 weeks of delivery. While considering this recommendation the finding reported by the National Family Health Survey have to be taken into account. The National Family Health Survey has shown that 32.8% of mothers have introduced supplements to the breast fed infants by three months of age and 51.6% by six months of age. Under these circumstances it is possible that the quantity of breast milk ingested may be low in at least about a third of infants, so they may not get adequate quantity of Vitamin A through breast milk in spite of massive dose of Vitamin A administered to the lactating mothers. Administration of massive dose Vitamin A to lactating women would result in a transient sharp rise in serum Vitamin A level during lactation. The data from the National Family Health Survey have shown that inter birth interval was less than 12 months in 2% and between 13-17 months in 9.8% of women. If massive dose Vitamin A is administered to all lactating women within the first eight weeks of delivery those who conceive within the first three months (2% of pregnancies) will incur the risk of exposure to potentially teratogenic levels of Vitamin A. It would therefore appear that routine supplementation with massive dose vitamin A in the post partum period may not be the appropriate method to improve the Vitamin A status of the pregnant and the lactating women in India. Over these years, there have been horticultural interventions to improve the availability of green leafy vegetables at affordable costs both in urban and rural population. The earlier efforts to improve the Vitamin A status of the pre school children with nutrition education aimed at increasing the consumption of yellow fruits such as papaya and mango did not yield good dividends because these were not available at affordable cost. Advocacy for use of green leafy vegetables are the chief source of micronutrient including Vitamin A, iron and folic acid is more likely to be sustainable. Efforts to promote cultivation and consumption of micro nutrient rich vegetables might therefore be the most appropriate strategy for improving the Vitamin A status of the entire community. Interventions in childhood
Studies undertaken in the 1960s by the National Institute of Nutrition clearly demonstrated that Vitamin A deficiency in childhood is mainly due to inadequate dietary intake of the nutrient. Increased requirement of the Vitamin A due to repeated infection aggravated the magnitude and severity of the deficiency. Association between measles, severe PEM and keratomalacia was confirmed . In view of the serious nature of the problem of blindness due to Vitamin A deficiency it was felt that urgent remedial measures in the form of specific nutrient supplementation covering the entire population of susceptible children should be undertaken. Clinical studies undertaken by NIN demonstrated the safety and efficacy of massive dose Vitamin A administration to children between 6 months and 36 months of age. National Institutes of Nutrition carried out operational research studies and showed the
99
feasibility of carrying out such supplementation programme with available meager health infrastructure in urban and rural areas. In 1970 the National Prophylaxis Programme against nutritional blindness was initiated as a Centrally Sponsored Scheme. All children between ages of one to 3 years were to receive 6 monthly massive dose of Vitamin A. In addition all children with measles and kwashiorkor should also receive massive dose. A five year long field trial of this programme showed that when the massive dose Vitamin A is administered according to schedule, the incidence of corneal xerophthalmia was reduced by about 80%. Other initiatives during the period include ¾ Applied nutrition programmes where the focus was on nutrition education
and home garden to improve availability of yellow fruits and green leafy vegetables.
¾ Special nutrition programme and ICDS to improve dietary intake in preschool children, pregnant and lactating women.
¾ Improved maternal and child health services through primary health care institutions. During the last twenty five years the massive dose Vitamin A programme
had been implemented in all the states and union territories. The major bottle neck during the seventies was lack of infrastructure at the peripheral level to ensure timely administration of the massive dose. In the eighties there was considerable improvement in the infrastructure. The lack of adequate doses of Vitamin A came in the way of improved coverage. Poor orientation of the functionaries who were providing the services to the population, lack of supervision and lack of intersectoral coordination between the health functionaries and the ICDS functionaries persisted throughout the period and has been one of the factors responsible for the poor coverage. It is a matter of serious concern that coverage was lower in high risk group of children from poorer communities in rural areas and urban slums.
In the Eighth Plan Period (1992-97), there was considerable improvement in the availability of the infrastructure for delivery of massive dose Vitamin A to all children in urban and rural areas. However, coverage figures for the massive dose Vitamin A remained suboptimal. In an attempt to improve coverage especially in the vulnerable 6 months to 23 months age group Govt. of India took a decision to link up Vitamin A administration to the ongoing immunization programme. Under the revised regimen a dose of 100,000 IU is to be given to all infants at 9 months along with measles vaccine and a next dose of 200,000 IU is to be administered along with booster dose of DPT and OPV. Subsequently the children are to receive three doses of 200,000 IU of Vitamin A every 6 months until 36 months of age. The reported coverage figures under the modified regimen indicate that there has been some improvement in coverage with the first dose. However coverage for subsequent doses is low.
100
Lack of sustained supply of Vitamin A has been one of the reasons for the poor coverage. In India where over 24 million births occur every year the supply of Vitamin A between the years 1989-90 and 1994-95 was about 52 million doses. The total number of doses administered ranged from 31-38 million The Government is making efforts to augment the supplies so that coverage could be substantially increased. Progress in the Ninth Plan
Ninth Plan strategy for control of vitamin A deficiency included:
• Continuing providing the first dose with measles vaccination.
• Improving the coverage subsequent doses of massive dose Vitamin A.
• Ensuring adequate availability of Vitamin A • Health education to improve consumption of foods rich in B-carotene
and backed up by efforts to improve their availability at affordable cost.
The target for the Ninth Plan is to control Vitamin A deficiency so that the incidence of blindness due to Vitamin A deficiency becomes less than 1/10,000 not only at the national level but also in every State.
In an attempt to improve coverage for second and subsequent doses of Vitamin A, some States like Orissa had linked administration of Vitamin A with pulse polio immunisation campaign. It is reported that the State took precautions to prevent overdosing by stopping Vitamin A administration in preceding 6 months. The State reported improved coverage. Similar attempts in other states have not been successful.
This strategy may not be appropriate because, then special efforts are required to be made to ensure that only children between 1-3 years receive Vitamin A and 0-5 years old children receive polio. This may not be easy as PPI is a
• massive campaign covering over 12 crore children and the booths are manned by persons who are not health professionals.
• Second dose of Vit. A for the year has to be administered through alternative strategy
National consultation
Vitamin A prophylaxis in children was provided as a national programme primarily for prevention of blindness in children caused due to vitamin A deficiency. Subsequently, several studies have shown that in areas where vitamin A deficiency is common, vitamin A prophylaxis reduces childhood mortality largely by decreasing case fatality related to common diseases such as diarrhea and measles.
There was a National Consultation on Benefits and Safety of Administration of Vitamin A to Pre-School Children and Pregnant and Lactating Women in 2000; the Indian Academy of Paediatrics (IAP) also had a consultation on Vitamin A administration in children. The major conclusions of the IAP consultations were:
101
• There is an unambiguous evidence of appreciable secular decline in clinical Vitamin A deficiency in under five children in the country.
• Recent data indicates that Vitamin A supplementation in infancy does not have any beneficial effect on growth, morbidity and mortality.
• Linking Vitamin A administration to the pulse polio program is inappropriate as the routine programme may be destabilized. There would be difficulties in keeping adequate record of Vitamin A dosing with possibility of toxicity or side effects due to multiple dosing within six months and a negative impact on Vitamin A administration through the routine services. The change strategy that all nutrition and health workers would have to be instructed to discontinue routine Vitamin A administration and establish systems for distribution of Vitamin A supplies would become immobilized. When pulse polio programme ceases to exist, re-initiation of routine Vitamin A administration would have obvious implications in terms of retraining logistics and supplies.
In view of this it might be preferable to use the sustainable strategy for improving Vit.A status of children such as:
• Administration of massive dose of Vit.A through AWW twice a year say April and October every year
• Nutrition education by AWW to improve intake of green/yellow vegetables
Interventions for 10th Plan
In India, the magnitude of clinical Vitamin A deficiency has declined significantly but in some parts it still exist as a public health problem. Diet surveys have shown that the intake of Vitamin A is on an average significantly lower than the recommended daily allowance in young children, adolescent girls and pregnant women. It is important to note that in these vulnerable sub groups multiple nutritional problems coexist including inadequate intake of energy as well as of micronutrients other than Vitamin A.
The need is for broad based dietary diversification programmes aimed to improve the overall nutritional status of the population particularly the vulnerable categories of children, adolescent and women. Nevertheless, because Vitamin A prophylaxis is in existence for number of years and as dietary intakes of Vitamin A are still low in large segments of the population the existing massive dose Vitamin A supplementation programme in 9-36 months old children should be continued and its implementation strengthened.
Strategies for prevention, detection and management of Vitamin A deficiency in children during the 10th Plan
Infancy
Colostrum feeding is to be encouraged. Exclusive breast feeding for the first six months should be promoted unless there are clear cut reasons to introduced supplements. At six months introduced complimentary feeding including mashed greens and yellow/orange fruits/vegetables. 100,000 IU of massive dose Vitamin A should be given at 9 months along with measles vaccines and there should be early detection and prompt treatment of infections.
102
Childhood
• Ensure adequate intake of Vitamin A rich food throughout childhood.
• Early detection and prompt treatment of infections.
• Massive dose Vitamin A administration at 18,24,30 & 36 months of age. In order to improve coverage without too many logistic problems it is suggested that these four doses are to be administered by Anganwadi worker during April & October each year (Pre summer/Pre winter period).
Sick Children
• All children with xerophthalmia should be given two doses of synthetic vitamin A as per present schedule of the Government of India under the RCH programme.
• All Children suffering from measles should also be given one dose of Vitamin A, if they have not received it during the previous one month.
• All cases of severe Protein Energy Malnutrition (based on weight for age criteria or clinical signs) should be given one additional dose of Vitamin A.
Pregnancy and Lactation
• Increase dietary intake of Vitamin A, beta carotene rich food
• Identify women with night blindness, bitot spots during pregnancy and treat them with 10,000 IU of Vitamin A daily for the next four weeks.
Research studies
Basic
• Identify Vitamin A rich food stuffs – conventional as well as non-conventional
• Functional decompensation associated with Vitamin A deficiency in various stages in different age, physiological status groups .
Epidemiological
• Time trends in prevalence of sub clinical and clinical Vitamin A deficiency in different regions.
Clinical
• Investigation of the reasons for large variation in the serum Vitamin A level at 1-6 months after massive dose Vitamin A administration.
• Infection - immunity and Vitamin A interactions.
• Clinical – biochemical correlation between serum Vitamin A levels and Bitot’s spots and night blindness in childhood and during pregnancy.
Operational Research
• Alternate strategy to improve coverage for 2-5th dose of massive dose Vitamin A administration in children.
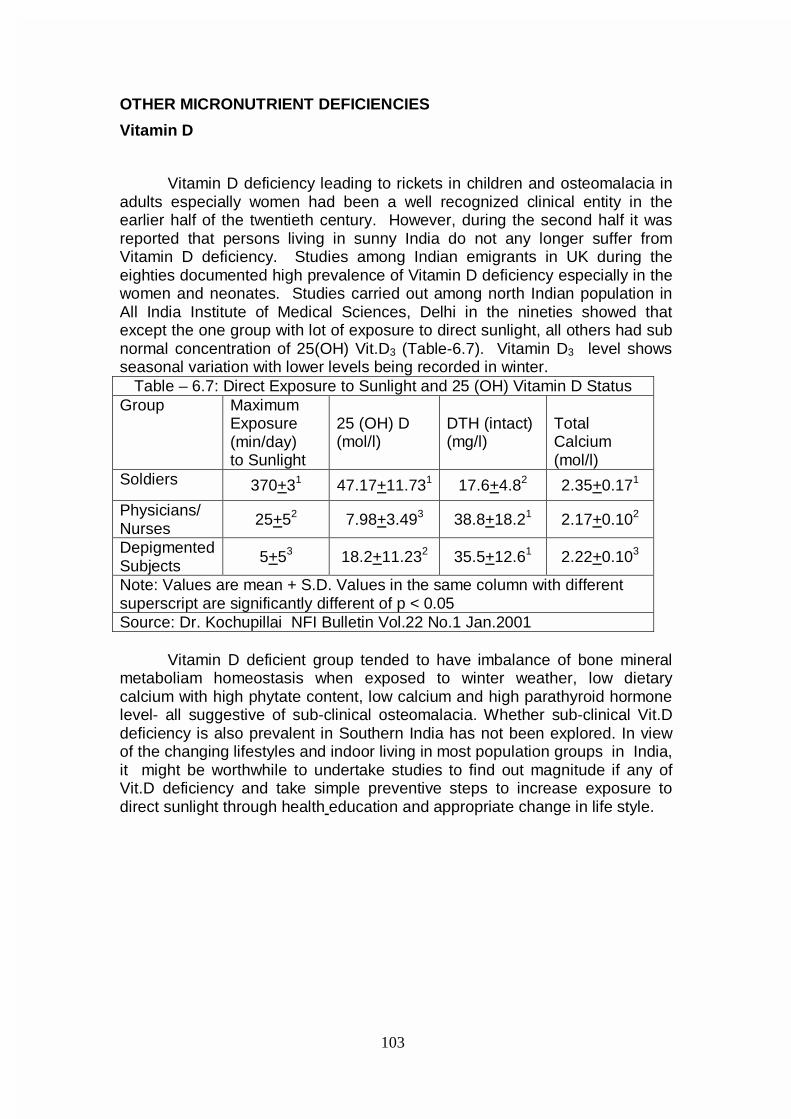
103
OTHER MICRONUTRIENT DEFICIENCIES
Vitamin D
Vitamin D deficiency leading to rickets in children and osteomalacia in adults especially women had been a well recognized clinical entity in the earlier half of the twentieth century. However, during the second half it was reported that persons living in sunny India do not any longer suffer from Vitamin D deficiency. Studies among Indian emigrants in UK during the eighties documented high prevalence of Vitamin D deficiency especially in the women and neonates. Studies carried out among north Indian population in All India Institute of Medical Sciences, Delhi in the nineties showed that except the one group with lot of exposure to direct sunlight, all others had sub normal concentration of 25(OH) Vit.D3 (Table-6.7). Vitamin D3 level shows seasonal variation with lower levels being recorded in winter.
Table – 6.7: Direct Exposure to Sunlight and 25 (OH) Vitamin D Status Group Maximum
Exposure (min/day) to Sunlight
25 (OH) D (mol/l)
DTH (intact) (mg/l)
Total Calcium (mol/l)
Soldiers 370+31 47.17+11.731 17.6+4.82 2.35+0.171
Physicians/ Nurses
25+52 7.98+3.493 38.8+18.21 2.17+0.102
Depigmented Subjects
5+53 18.2+11.232 35.5+12.61 2.22+0.103
Note: Values are mean + S.D. Values in the same column with different superscript are significantly different of p < 0.05 Source: Dr. Kochupillai NFI Bulletin Vol.22 No.1 Jan.2001
Vitamin D deficient group tended to have imbalance of bone mineral metaboliam homeostasis when exposed to winter weather, low dietary calcium with high phytate content, low calcium and high parathyroid hormone level- all suggestive of sub-clinical osteomalacia. Whether sub-clinical Vit.D deficiency is also prevalent in Southern India has not been explored. In view of the changing lifestyles and indoor living in most population groups in India, it might be worthwhile to undertake studies to find out magnitude if any of Vit.D deficiency and take simple preventive steps to increase exposure to direct sunlight through health education and appropriate change in life style.
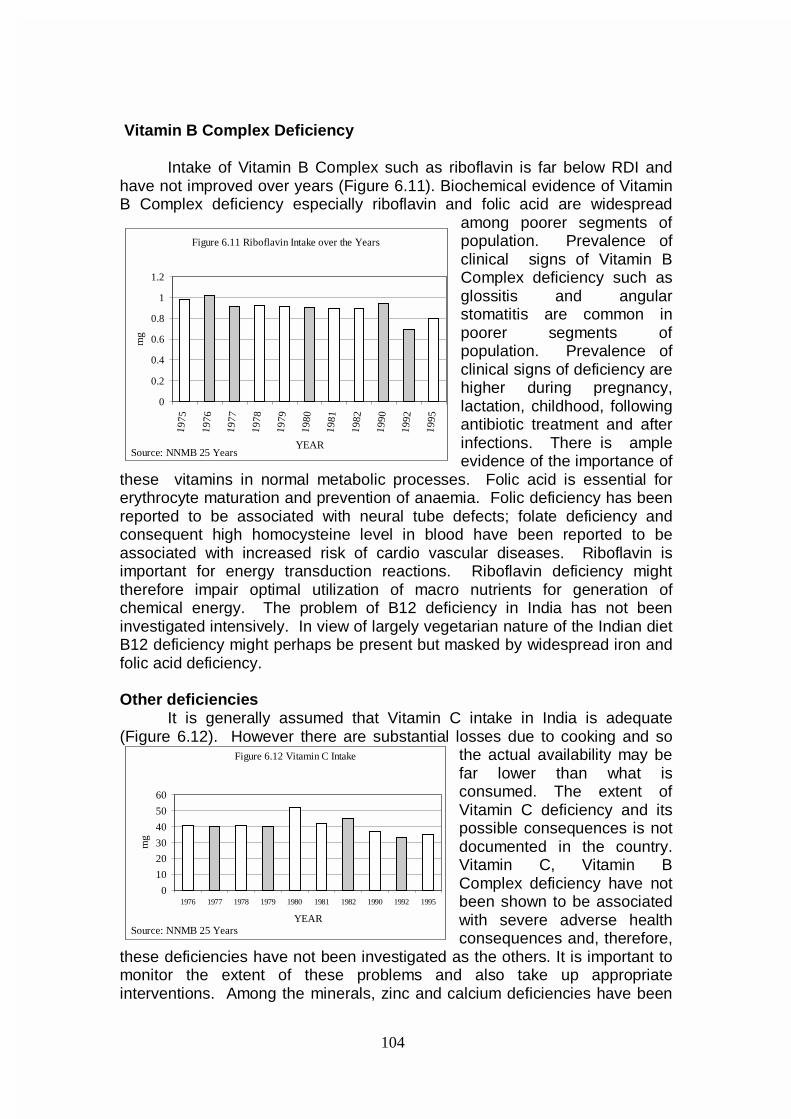
104
Vitamin B Complex Deficiency Intake of Vitamin B Complex such as riboflavin is far below RDI and have not improved over years (Figure 6.11). Biochemical evidence of Vitamin B Complex deficiency especially riboflavin and folic acid are widespread
among poorer segments of population. Prevalence of clinical signs of Vitamin B Complex deficiency such as glossitis and angular stomatitis are common in poorer segments of population. Prevalence of clinical signs of deficiency are higher during pregnancy, lactation, childhood, following antibiotic treatment and after infections. There is ample evidence of the importance of
these vitamins in normal metabolic processes. Folic acid is essential for erythrocyte maturation and prevention of anaemia. Folic deficiency has been reported to be associated with neural tube defects; folate deficiency and consequent high homocysteine level in blood have been reported to be associated with increased risk of cardio vascular diseases. Riboflavin is important for energy transduction reactions. Riboflavin deficiency might therefore impair optimal utilization of macro nutrients for generation of chemical energy. The problem of B12 deficiency in India has not been investigated intensively. In view of largely vegetarian nature of the Indian diet B12 deficiency might perhaps be present but masked by widespread iron and folic acid deficiency. Other deficiencies
It is generally assumed that Vitamin C intake in India is adequate (Figure 6.12). However there are substantial losses due to cooking and so
the actual availability may be far lower than what is consumed. The extent of Vitamin C deficiency and its possible consequences is not documented in the country. Vitamin C, Vitamin B Complex deficiency have not been shown to be associated with severe adverse health consequences and, therefore,
these deficiencies have not been investigated as the others. It is important to monitor the extent of these problems and also take up appropriate interventions. Among the minerals, zinc and calcium deficiencies have been
Figure 6.11 Riboflavin Intake over the Years
0
0.2
0.4
0.6
0.8
1
1.2
1975
1976
1977
1978
1979
1980
1981
1982
1990
1992
1995
YEAR
mg
Source: NNMB 25 Years
Figure 6.12 Vitamin C Intake
0
10
20
30
40
50
60
1976 1977 1978 1979 1980 1981 1982 1990 1992 1995
YEAR
mg
Source: NNMB 25 Years
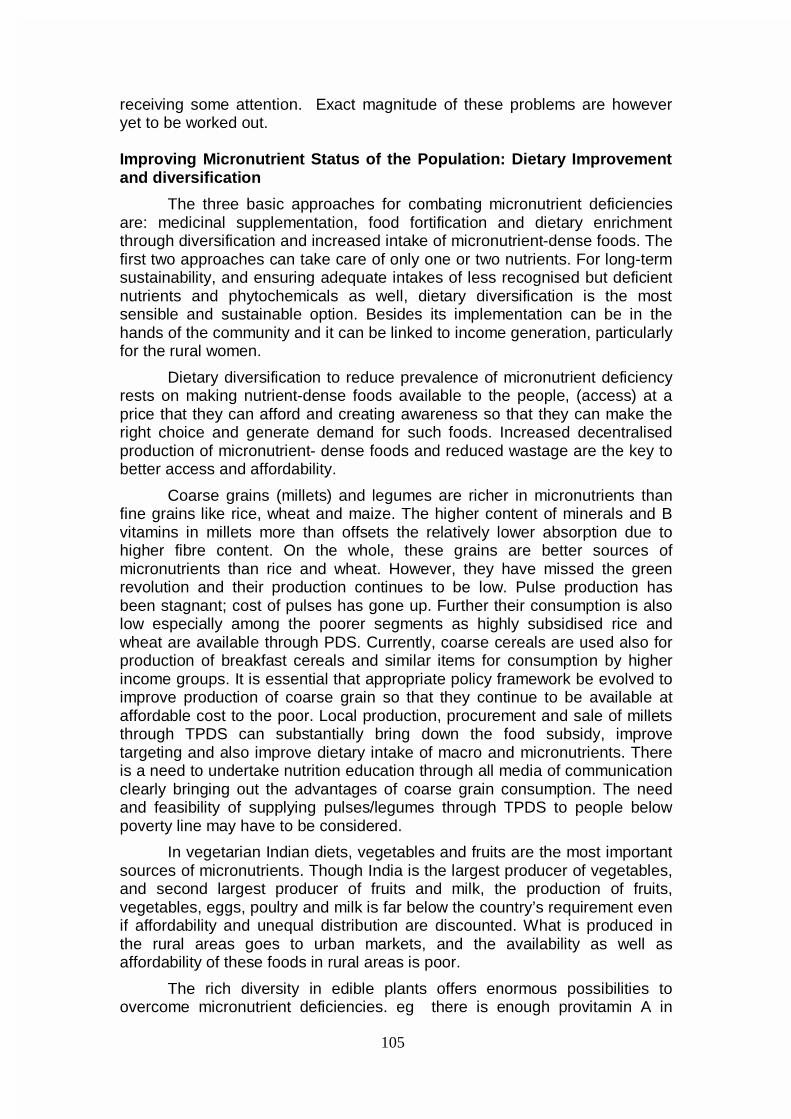
105
receiving some attention. Exact magnitude of these problems are however yet to be worked out. Improving Micronutrient Status of the Population: Dietary Improvement and diversification
The three basic approaches for combating micronutrient deficiencies are: medicinal supplementation, food fortification and dietary enrichment through diversification and increased intake of micronutrient-dense foods. The first two approaches can take care of only one or two nutrients. For long-term sustainability, and ensuring adequate intakes of less recognised but deficient nutrients and phytochemicals as well, dietary diversification is the most sensible and sustainable option. Besides its implementation can be in the hands of the community and it can be linked to income generation, particularly for the rural women.
Dietary diversification to reduce prevalence of micronutrient deficiency rests on making nutrient-dense foods available to the people, (access) at a price that they can afford and creating awareness so that they can make the right choice and generate demand for such foods. Increased decentralised production of micronutrient- dense foods and reduced wastage are the key to better access and affordability.
Coarse grains (millets) and legumes are richer in micronutrients than fine grains like rice, wheat and maize. The higher content of minerals and B vitamins in millets more than offsets the relatively lower absorption due to higher fibre content. On the whole, these grains are better sources of micronutrients than rice and wheat. However, they have missed the green revolution and their production continues to be low. Pulse production has been stagnant; cost of pulses has gone up. Further their consumption is also low especially among the poorer segments as highly subsidised rice and wheat are available through PDS. Currently, coarse cereals are used also for production of breakfast cereals and similar items for consumption by higher income groups. It is essential that appropriate policy framework be evolved to improve production of coarse grain so that they continue to be available at affordable cost to the poor. Local production, procurement and sale of millets through TPDS can substantially bring down the food subsidy, improve targeting and also improve dietary intake of macro and micronutrients. There is a need to undertake nutrition education through all media of communication clearly bringing out the advantages of coarse grain consumption. The need and feasibility of supplying pulses/legumes through TPDS to people below poverty line may have to be considered.
In vegetarian Indian diets, vegetables and fruits are the most important sources of micronutrients. Though India is the largest producer of vegetables, and second largest producer of fruits and milk, the production of fruits, vegetables, eggs, poultry and milk is far below the country’s requirement even if affordability and unequal distribution are discounted. What is produced in the rural areas goes to urban markets, and the availability as well as affordability of these foods in rural areas is poor.
The rich diversity in edible plants offers enormous possibilities to overcome micronutrient deficiencies. eg there is enough provitamin A in
106
nature to meet the vitamin A requirement of the country at low cost. Research using state of the art methodology is needed to examine the bioavailability of β carotene from plant products and the conversion ratio. Some nutrients like iron and riboflavin may pose greater challenge without the inclusion of animal foods. Iron requirement of 30 mg is based on availability of 3% from cereal – pulse-based foods. Inclusion of promoters like vitamin C in the diet through vitamin C - rich fruits, can enhance iron absorption and reduce the dietary requirement for iron. This strategy merits exploration. Vitamin C-rich fruits like tomatoes, guava and Indian gooseberry are cheap in certain seasons and should be promoted to the fullest extent.
The micronutrient content of fruits and vegetables vary widely. Agriculture/horticulture scientists, planners, extension workers and farmers need to be sensitised to grow fruits and vegetables which are rich in micronutrients (GLV, yellow orange vegetables and fruits, citrus fruits, beans etc). Fortunately major increases have occurred in the production of nutritious fruits like papaya, guava, and banana. This is an encouraging trend. But due to bad planning, glut occurs during some seasons and the grower does not get much profit.
Green leafy vegetables are inexpensive and very rich in
micronutrients. Apart from the conventional varieties, less conventional ones grow wild during rainy season, and people can be encouraged to use them. Precious greens from vegetables like carrot, radish, turnip cauliflower which are discarded can be easily utilised if people are educated about their edibility and value. Identification and promotion of such unfamiliar sources of micronutrient-rich foods is needed.
Plant breeding techniques to increase the micronutrient content of
staples offers enormous possibilities and is more cost effective than bio-engineered foods. Plant breeding techniques have been more successful in improving the trace mineral content (iron, zinc) of staples like maize, rice and wheat, but not for vitamins. Such strains also show better growth without depleting the soil, since they are able to extract otherwise unavailable bound form of the trace elements.
GM foods have raised possibilities and hopes are high, but it may take
a while before the safety of these foods is established beyond doubt and stringent regulatory procedures may make them expensive. Golden rice, rich in β carotene and iron, has evoked lot of interest. However, it may not enter the food basket in the immediate future. Apart from safety, the acceptability of a golden coloured rice needs to be seen.
Milk, eggs, meat, fish have gone beyond the reach of the poor. While there is good scope for increasing the production of milk, meat and eggs, livestock programmes are capital intensive, labour intensive and have long gestation periods. They can be made viable through proper planning of integrating crop and livestock systems. Poultry and fish may offer better possibility. Back- yard poultry needs to be promoted to increase homestead production of eggs and chicken and generate employment for farm- women. Breeds suitable for back yard poultry have been developed in India. Fish are
107
very efficient converters of feed to meat. Apart from being rich in micronutrients like vitamins A, D and Calcium, fish meat is low in cholesterol and contains long chain n-3 PUFA (polyunsaturated fatty acids), which are good for heart and brain.
Though horticulture can be economically beneficial, its perishability, lack of price stability, and need for constant care discourage farmers from diversifying into horticulture. Seasonal glut can ruin the farmers if outlets for their sale to other areas or value addition through food processing are not available.
Decentralised, storage and processing centres need to be established in every block. Technologies such as zero energy cooling chambers, solar dryers, fermentation and pickling etc. need to be promoted not only at household level but also in these food- processing centres. These can generate employment for women. Decentralised food processing centres can do the primary processing, but they have to be linked to larger food industries for further value addition. Better decentralised cold chain is needed for storage, but power shortage, and investment for developing infrastructure are major bottlenecks.
In the area of food technology, processing without loss of micronutrients particularly vitamins is a big challenge. A recent study from Coimbatore has shown that shade drying of GLV results in loss of 70% beta carotene. On the other hand drying in a properly designed solar drier with an ultraviolet filter resulted in loss of only 20% (Bamji unpublished). Solar dryers are expensive and beyond the reach of individual small farmers, but community processing units can acquire them and dry excess fruits and vegetables for sale during lean season. Culturally acceptable processed foods do sell even in villages, as convenience foods.
Recommendations to improve dietary diversification during 10th Plan • The problem of micronutrient malnutrition in the country can be solved
only through a coordinated effort of agriculture, nutrition and health sectors, with community involved right from the beginning in a bottom up approach and given participatory intensive nutrition education.
• India has vast diverse plant resource. Preservation, promotion and cultivation of vast variety of locally acceptable, conventional and unconventional grains, legumes/pulses, fruits and vegetables is essential. These should be backed with appropriate storage, processing and marketing facilities.
• Despite all the constraints, diet of the poor can be improved by the inclusion of less expensive and seasonal fruits and vegetables, and homestead production of fruits and vegetables rich in micronutrients, and poultry, milk and perhaps fish. There should be awareness at all levels about nutrition and nutritive value of foods.
• Human nutrition should be strong component in the syllabus of agriculture universities, teachers training institutions and school education. Agriculture and horticulture research and production should have a strong nutritional bias. Agriculture and Nutrition Training Institutes (like the Industrial Training
108
Institutes-ITI,), may help in generating right kind of human resource locally.
• Feeding programmes such as ICDS, and mid-day meal programme could consider incorporating locally produced millets, fruits, vegetables, eggs and milk. This may provide the incentive for increased local production. Technical support for this kind of approach is very essential.
• India is currently undergoing demographic, economic, social, educational, agricultural and health transition. It is important therefore, to strengthen, streamline and effectively utilise the existing mechanisms for monitoring the programmes. Nutritional monitoring should be extended throughout the country.
• Research is important to update and expand information available on micronutrient content of foodstuffs. Efforts should be made to identify phytochemicals and study their implication in health and nutrition.
109
CHAPTER VII
NUTRITION MONITORING AND SURVEILLANCE Monitoring Nutritional Status
The National Nutrition Policy 1993 envisaged "nutritional surveillance of the country's population especially children and mothers will be the responsibility of National Institute of Nutrition / National Nutrition Monitoring Bureau, who in turn may involve the National Institute of Health and Family Welfare, Central Health Education Bureau, home science/medical colleges and the NGOs. There shall be a mechanism to utilise services of food and nutrition science, and medical graduates trained every year to manage national nutrition programmes. NNMB /NIN should be accountable to the Department of Women and Child Development in so far as nutrition surveillance is concerned.
The paucity of reliable comparable data from all parts of the country is a definite obstacle towards realistic disaggregated problem definition. This calls for a nationwide monitoring system. To achieve this, it is necessary to restructure and strengthen existing National Nutrition Monitoring Bureau and to develop a mechanism for generating nationwide disaggregated data within a short period for use by the centre and the states for taking corrective action wherever necessary. This would ensure regular monitoring and surveillance system and develop reliable database in the country not only to assess the impact of ongoing nutrition and development programs but also to serve as an early warning system for initiating prompt action." Monitoring nutritional status of children through ICDS reporting – Ninth Plan experience There is an urgent need to establish and sustain a universal efficient system of collecting, collating, analyzing and utilizing the ICDS data to arrive at local focused intervention and for monitoring their impact. Both ICDS and the health functionaries regularly file monthly progress report, which are collated and reported. However the existing monitoring systems are functioning sub-optimally. There are lacunae at the levels of collection, reporting and collation. There are delays in analysis and reporting. The reports of the health and family welfare programme by the respective workers, and the monthly progress reports sent by the ICDS workers are not utilized for district level monitoring and midcourse correction of the ongoing programmes. These problems have to be resolved and a good monitoring system need be operationalised.
As part of efforts to monitor the Nutritional component of the PMGY initiative, Planning Commission in collaboration with the Dept of WCD has drawn up a proforma for assessment and reporting of nutritional status of under-five children. The DWCD has incorporated this proforma as a part of the monthly ICDS reporting format. Both DWCD and Planning Commission have requested the State DWCD Secretaries to ensure that the data is
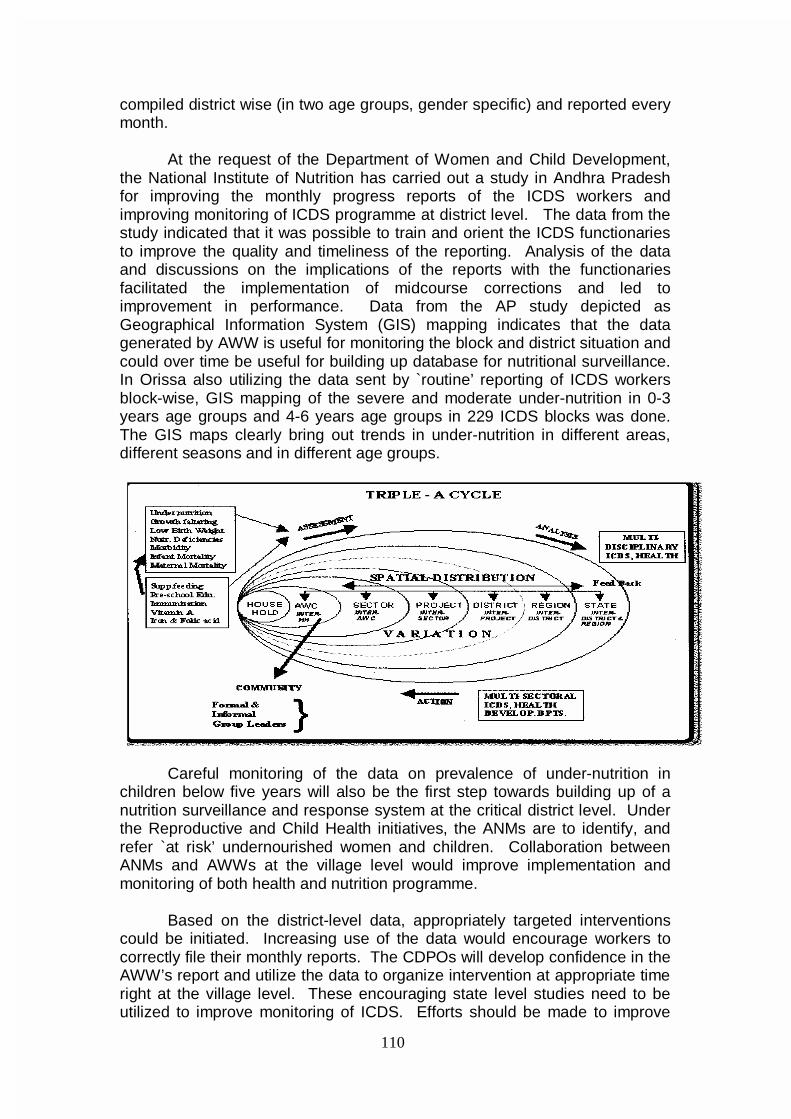
110
compiled district wise (in two age groups, gender specific) and reported every month.
At the request of the Department of Women and Child Development,
the National Institute of Nutrition has carried out a study in Andhra Pradesh for improving the monthly progress reports of the ICDS workers and improving monitoring of ICDS programme at district level. The data from the study indicated that it was possible to train and orient the ICDS functionaries to improve the quality and timeliness of the reporting. Analysis of the data and discussions on the implications of the reports with the functionaries facilitated the implementation of midcourse corrections and led to improvement in performance. Data from the AP study depicted as Geographical Information System (GIS) mapping indicates that the data generated by AWW is useful for monitoring the block and district situation and could over time be useful for building up database for nutritional surveillance. In Orissa also utilizing the data sent by `routine’ reporting of ICDS workers block-wise, GIS mapping of the severe and moderate under-nutrition in 0-3 years age groups and 4-6 years age groups in 229 ICDS blocks was done. The GIS maps clearly bring out trends in under-nutrition in different areas, different seasons and in different age groups.
Careful monitoring of the data on prevalence of under-nutrition in
children below five years will also be the first step towards building up of a nutrition surveillance and response system at the critical district level. Under the Reproductive and Child Health initiatives, the ANMs are to identify, and refer `at risk’ undernourished women and children. Collaboration between ANMs and AWWs at the village level would improve implementation and monitoring of both health and nutrition programme.
Based on the district-level data, appropriately targeted interventions
could be initiated. Increasing use of the data would encourage workers to correctly file their monthly reports. The CDPOs will develop confidence in the AWW’s report and utilize the data to organize intervention at appropriate time right at the village level. These encouraging state level studies need to be utilized to improve monitoring of ICDS. Efforts should be made to improve
111
quality of weight measurement and reporting of under-nutrition in all ICDS blocks. Once, good quality data on a regular basis become available at block and district level it should be used as an instrument for: • Monitoring ICDS activities in terms of reduction in under-nutrition. • Planning appropriate interventions based on the data • Assessment of impact of ongoing nutrition interventions • Building up database for nutritional surveillance in vulnerable groups It is expected that this would result in an improvement in taking weights of children at anganwadi. Currently it is estimated that only about 20% of the children under five are weighed; improvement in coverage for taking weight will result in better detection of growth faltering, focused interventions for improvement in nutrition and health status of the children with severe grades of under-nutrition. During the 10th Plan period, it might be possible to screen all under fives at least once or twice a year to identify all under-nourished children in the community and initiate targeted intervention and follow up all those with severe grades of under nutrition and enable the districts to respond appropriately to the local situation regarding under-nutrition. If the State DWCD can ensure that during the year 2001 at least 90% of all children under-five age group are weighed and data on nutritional status reported at least twice perhaps in the months of April and October and compile the data at district level a district based nutrition monitoring system can be built up. National Nutrition Monitoring Bureau (NNMB)
The Indian Council Of Medical Research established the National Nutrition Monitoring Bureau (NNMB) in 1972 to provide information on nutritional status of all age groups of both sexes. NNMB has the following objectives: • To collect, on a continuous basis, on representative segments of
population in each of the States, data on dietary pattern and nutritional status adopting standardized and uniform procedures and techniques, and
• To periodically evaluate the ongoing national nutrition programmes, to identify their strengths and weaknesses and to recommend appropriate corrective measures.
The NNMB: • is involved in continuous collection of data on actual intakes of families,
and individuals belonging to different physiological and age groups, in different states;
• assesses intra-family distribution of food and nutrients; • generates data periodically on diet and nutritional status of socially
vulnerable groups of population like the tribals living in the integrated tribal development project areas, and the population at-risk physiologically like elderly population and adolescents;
112
• organizes repeat surveys to assess time trends in diet and nutritional situation (repear surveys were conducted in 1988-90 and in 1996-97, in the same villages in all the States that were surveyed during 1975-79).
Problems in NNMB survey
The NNMB undertakes surveys only in 10 states and in the last survey, only 8 states were covered. The nutrition surveys have not been conducted on a representative sample in each of the states and, therefore, estimates of under-nutrition worked out on the basis of NNMB surveys may not be representative of nutrition status in the entire states. However, as NNMB keeps using the same sample for repeat surveys, it provides valuable information on time trends in prevalence of under nutrition over the last three decades. In the last survey NNMB has used the NSSO sampling frame and if this practice is continued it will be possible that the NNMB surveys will provide state specific data. It might be possible to build in a comparison of the data between the NNMB survey information on dietary intake with the data from NSSO consumer survey data on dietary intake computed on the basis of expenditure on food.
Food and Nutrition Board The Food and Nutrition Board of Department of Women and Child Development (WCD) conducted nutrition survey in 1993-94 in 187 districts of the country. The report was published in 1998. This was a one-time effort; the sample covered was not derived from a representative sample of the district and, therefore, data from this survey also may not provide representative information on nutritional status of the under-five children either at the district level or at the state level. The sample size was inadequate for assessment of clinical deficiency signs. National Family Health Survey (NFHS) The National Family Health Survey (NFHS) has undertaken height and weight measurement in a representative sample of children and women at state level. NFHS (I&II) provides valid state level estimates of under nutrition and comparable state level estimates at two time points i.e. 1992-93 & 1998-99. The data, however, is inadequate to provide district-wise estimation. National Sample Survey Organization (NSSO) Every five years the information on expenditure on food at family level is collected on a statistically adequate and representative sample all over the country. This information is used to calculate poverty levels based on expenditure on calories. The disadvantages are that this does not provide information on dietary consumption at the family and individual level and does not assess nutritional status; the survey is done only once in 5 years. However, if coupled with the NNMB survey, the data may provide excellent insights into changing dietary patterns in India.

113
Nationwide coverage under NNMB during the 10th Plan
Approach Paper to the Tenth Plan has given high priority to monitoring of nutritional and health status. The Approach Paper indicates, “Over the next few decades, the country will be undergoing rapid demographic, developmental, economic, ecological, life style, nutrition and health transition. It is, therefore, imperative to set up a mechanism for monitoring health and nutritional status of the population so that emerging problems are identified and expeditiously corrected.”
The Working Group on Improving Nutritional Status of the Population with Special Focus on Vulnerable Groups and the Working Group on Improving Micronutrient Nutritional Status of the Population constituted by the Planning Commission as a part of the Tenth Plan formulation exercise have recommended that “there is an urgent need to ensure nutrition monitoring through out the country”. The Working Group on Nutritional Status of the Population with Special Focus on Vulnerable Groups have recommended “NNMB should be expanded to cover all states and union Territories in the country and its scope enlarged to include nutrition monitoring, mapping, surveillance and training”.
In the eight states where NNMB is operating the current arrangement may continue. In the other states efforts may be made to set up contractual units based in medical colleges or home science colleges or ICMR permanent Units. The coordinator will be a staff of the institution with a good track record of work in nutrition. They will be requested to recruit contract staff to carry out the survey in the defined population according to the protocol already drawn up. Proforma currently being used in NNMB survey will be used by all. The identified investigators in home science/ medical colleges will be responsible for getting personnel on contract to carry out the survey as per the protocol. They will also be responsible for completing the data entry and sending the forms, as well as computerized data and answering rectifications as and when required. NNMB central Coordinating unit will continue to have the responsibility of • Preparing the sample frame for all the states • Training of the master trainers • Quality control checks • Analysis and report writing
This would be a cost effective mechanism for undertaking national level monitoring of nutritional status of the population so that data on time trends, interstate differences and nutritional problems in pockets suffering from natural / manmade food scarcity situation could be obtained in a time bound manner. Hiring contractual staff would eliminate the earlier problems of large turn over of staff at the doctor and nutritionist level resulting in inability to carry out the survey in spite of other staff being in position. As this will be contractual project the problems of long-term employment of a large number of supportive staff will not arise. The nutritionist and doctors will move out as
114
and when they find appropriate jobs but newer ones will move in. This will ensure that large number of persons belonging to these two categories will gain exposure to the concepts of nutrition and health monitoring and this would stand them in good stead. As they rise in the hierarchy and reach positions in medical and home science colleges they will be potentially suitable to take over as coordinators. Food and Nutrition Board of the Department of WCD has a very good infrastructure with a technical wing at the center, four regional offices in Delhi, Mumbai, Kolkata and Chennai and 43 field units located in the States and UTs. Currently, they are being used for nutrition education, training and creating awareness among the pubic. As FNB has a very good infrastructure, they can also be used in monitoring. The field units can be asked to collect the data maintained at the anganwadi centers on the nutritional status, collate them and prepare district-wise report which can be handed over to the states’ chief secretaries. They can also do a random check of the AWCs to ensure that all the children get weighed at least four times a year. Recommendations for Tenth Plan
Efforts need to be made to improve coverage and quality of weight measurement and reporting of under-nutrition in all ICDS blocks. Currently it is estimated that only about 20% of the children under five are weighed; improvement in coverage for taking weight will result in better detection of growth faltering, focused interventions for improvement in nutrition and health status of the children with severe grades of under-nutrition. During the Tenth Plan period, it might be possible to screen all under fives at least four times a year to identify all under-nourished children in the community and initiate targeted intervention and follow up all those with severe grades of under nutrition and enable the districts to respond appropriately to the local situation regarding under-nutrition. Once, good quality data on a regular basis become available at block and district level it will be used for
☛ Monitoring ICDS activities in terms of reduction in under-nutrition ☛ Assessment of impact of ongoing nutrition interventions ☛ Planning appropriate midcourse correction in the ongoing ICDS
programme ☛ Building up database for nutritional surveillance in vulnerable groups
During the Tenth Plan efforts will be made to extend nutrition surveys to all states using appropriate sample population. Nutrition Surveillance Nutrition Surveillance may be defined as watching over nutritional status in order to make decisions, which will lead to improvement in nutritional status of populations. The terms ‘nutrition surveillance’ and ‘nutrition monitoring’ are often used synonymously, but this is not correct. Nutrition monitoring refers to repeated measurements of changes in the nutritional status at regular intervals, of populations or individuals over a period of time.
115
Surveillance should never exist in isolation from action. The nutrition surveillance system (NSS) provides information on nutrition, their spatial distribution, causes, and changes in prevalence/incidence over time, the actions initiated and their effects. Nutrition surveillance is important for early identification of regions and sub-segments of population with nutritional problems for initiating immediate remedial measures and this in turn will promote optimal nutrition status. Nutrition surveillance will also prompt performance appraisal of the ongoing intervention programmes and assessment of contributory factors. The Government of India’s National Nutrition Policy, 1993 recommends development and establishment of such a national surveillance system in the country by the year 2000 AD. However, the National Nutrition Surveillance System is yet to be developed. The advantages of NSS are • Entire population especially the vulnerable groups will be under
surveillance. • It provides information on various process and impact indicators at various
levels at regular intervals for initiating appropriate action. • It enables preparation of Action Plans on Nutrition for implementation by
the district officials. • At-risk groups and areas can be identified. • It can provide timely warning signals about the impending nutrition
problems. • It will help in better programme management as it helps to identify workers
who are performing poorly. • Intervention programmes can be evaluated on a continuous basis by
assessing the extent of achievement against the goals. • It enables mapping of the extent of under-nutrition at sector/project/district
levels. Such an information will enable demarcation of most nutritionally vulnerable ‘villages/sectors/projects’.
• It will assist in enhancing the interaction between departments concerning maternal and child health and child development.
• It confers accountability at all levels and enables better management of limited resources available by focusing them to the needy areas.
Currently there are three monitoring systems, which provide the
essential core information that could be developed into full-fledged nutrition surveillance if appropriate coordination is achieved. These are the nutrition monitoring through ICDS System, the NNMB-NSSO data bases and the Pilot project on Food insecurity and vulnerability under the Dept of Food and Public Distribution.
Food Insecurity and Vulnerability Information and Mapping System (FIVIMS)
FIVIMS is essentially a network of information and mapping system
that assembles, analyses and disseminates the information about people who are food insecure. The concept originated from the proposal made by the
116
Latin American countries at World Food Summit in 1996 for use of hunger maps. Development of FIVIMS at national level is part of the commitments adopted at the World Food Summit (Rome 1996), attended by the then Prime Minister. The purpose of FIVIMS is to facilitate different user groups’ access to more comprehensive information, to enhance food security policy formulation, to improve the design and targeting of interventions directed at food insecurity and to facilitate monitoring of progress in achieving these goals through providing focused and precise information about nature and extent of food insecurity and vulnerability and the underlying causes.
An FIVIMS Cell is established in the Department of Food and Public
Distribution (Annexure 7.1). The Department has selected three States viz., Himachal Pradesh, Orissa and Rajasthan for introduction of FIVIMS in pilot project to be initiated with FAO’s technical and financial assistance. The project envisages that an FIVIMS cell will be created at national, state and district level for creation and updation of data relating to identification of food insecure and vulnerable people in the three states. A comprehensive database with maps for each block relating to health, malnutrition, calorie intake, food insecurity etc. will be generated for each state. This comprehensive database with the maps will then be utilized by policy makers both at the central and state level to identify food insecure and vulnerable people for reorienting respective policy interventions and programmes for removing food insecurity. For example, the allocation of food grains to the States can be revised with particular attention to some districts in the States found to be inhabited by people suffering from undernutriton, low calorie intake, under-weight children as per the FIVIMS data generated. Surveillance of nutritional status during the Tenth Plan
The FIVIMS, NNMB along with the ICDS and FNB infrastructure can
provide most suitable net work for nutrition surveillance.The state NNMB units will carry out periodic supervision of randomly selected projects to ensure quality of data being collected by the ICDS functionaries. Since NNMB is at present in operation only in 10 states it should be expanded to cover all the states. NNMB will carry out regular surveys on dietary consumption, assessment of macro and micro nutrient nutritional status and morbidity profile of all segments of these population with special stress on nutritionally at risk groups. Later additional parameters may be added to ongoing NNMB activities to have more specific data on NSS. Over time it may be desirable to integrate data on rainfall, food production, food distribution, vital statistics and disease surveillance and other developmental indicators related to early warning system.
NNMB will be involved in orientation and training of staff of ICDS/FNB
involved in nutrition surveillance. For this purpose, a network of institutions such as NIPCCD, NIN, Medical Colleges, Home Science Colleges and Agricultural Universities will be developed. Necessary training modules will be developed and printed in different languages providing guidelines for the functionaries. The NNMB will be responsible to bring out periodic reports and disseminate information to planners and policy makers both at the
117
Government of India level and the State Govts. This would help in development of `timely warning’ component of NSS. The state units of the NNMB will be sending the data on nutrition surveillance for compilation and necessary action. Monitoring Intersectoral Coordination Nutrition is a multifaceted discipline; multisectoral co-ordination is essential for ensuring improvement in nutritional status of the population. The National Nutrition Policy envisaged that there is a need for integrating nutritional concerns of all developmental programmes, so that nutritional outcomes of various programmes can be maximized.
A National Nutrition Policy was formulated by the Department of Women and Child Development (WCD) and adopted by the Govt. of India in 1993. The implementation strategy as indicated in the National Nutrition Policy envisaged that each Central Ministry will implement the measures for which it has direct or nodal responsibility. An Inter- Ministerial Co-ordination Committee will function in the Ministry of Human Resource Development under the chairmanship of Secretary, Department of Women and Child Development, to oversee and review the implementation of nutrition intervention measures. Sectoral Ministries/ Depts. concerned like Health and Family Welfare, Education, Agriculture, Food and Civil supplies etc., will be represented in Interministerial co-ordination Committee. A National Nutrition Plan of Action was drawn up in 1995. There are 14 sectors identified under the Plan of Action on Nutrition. The Ministry/Department-wise action points as laid down in the National Plan of Action on nutrition is indicated in Annexure 7.2.
Inter-Ministerial Co-ordination Committee constituted in 1993 under the Chairmanship of Secretary, Dept. of Women and Child Development held five
meetings till July 1997. In Nov. 1997, a Food and Nutrition Council under theChairmanship of Minister of Human Resource Development was
established by amalgamating the existing Food and Nutrition Board and the Inter-Ministerial Committee. The Food and Nutrition Council has met twice so
far – on 23rd Dec.1997 and 24th Jan. 2000 and reviewed the ongoing programmes.
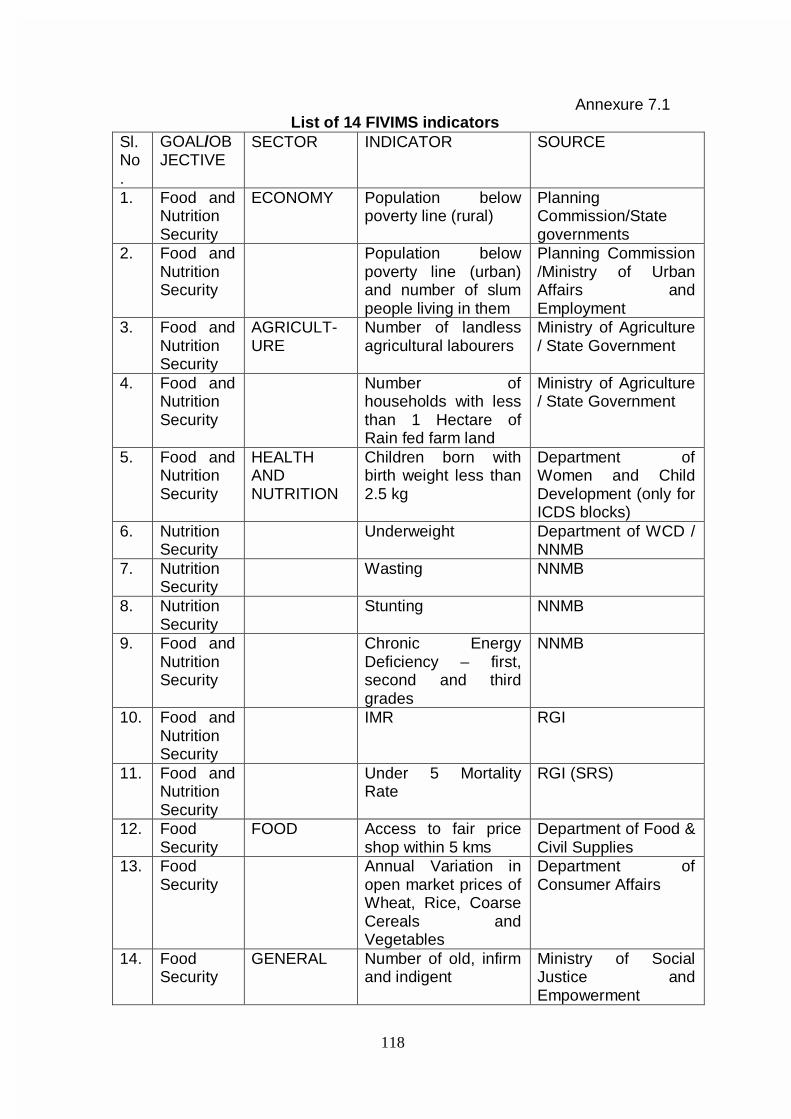
118
Annexure 7.1 List of 14 FIVIMS indicators
Sl. No.
GOAL/OBJECTIVE
SECTOR INDICATOR SOURCE
1. Food and Nutrition Security
ECONOMY Population below poverty line (rural)
Planning Commission/State governments
2. Food and Nutrition Security
Population below poverty line (urban) and number of slum people living in them
Planning Commission /Ministry of Urban Affairs and Employment
3. Food and Nutrition Security
AGRICULT-URE
Number of landless agricultural labourers
Ministry of Agriculture / State Government
4. Food and Nutrition Security
Number of households with less than 1 Hectare of Rain fed farm land
Ministry of Agriculture / State Government
5. Food and Nutrition Security
HEALTH AND NUTRITION
Children born with birth weight less than 2.5 kg
Department of Women and Child Development (only for ICDS blocks)
6. Nutrition Security
Underweight Department of WCD / NNMB
7. Nutrition Security
Wasting NNMB
8. Nutrition Security
Stunting NNMB
9. Food and Nutrition Security
Chronic Energy Deficiency – first, second and third grades
NNMB
10. Food and Nutrition Security
IMR RGI
11. Food and Nutrition Security
Under 5 Mortality Rate
RGI (SRS)
12. Food Security
FOOD Access to fair price shop within 5 kms
Department of Food & Civil Supplies
13. Food Security
Annual Variation in open market prices of Wheat, Rice, Coarse Cereals and Vegetables
Department of Consumer Affairs
14. Food Security
GENERAL Number of old, infirm and indigent
Ministry of Social Justice and Empowerment
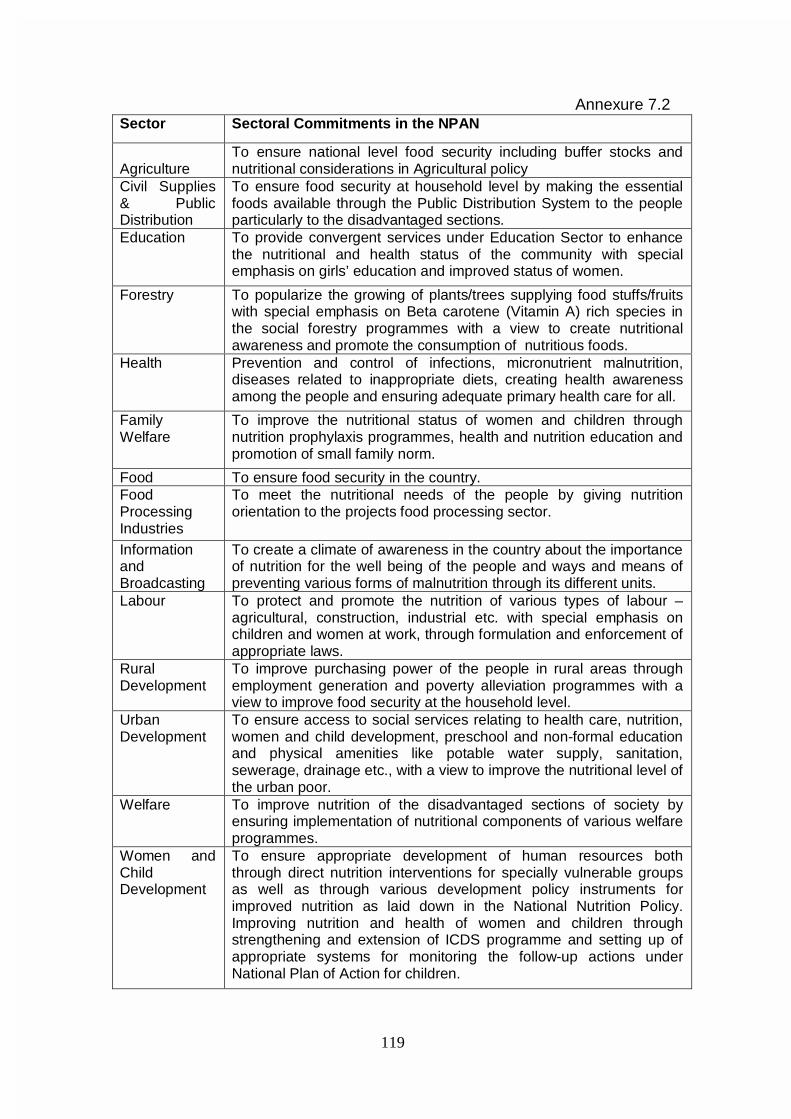
119
Annexure 7.2
Sector Sectoral Commitments in the NPAN
Agriculture
To ensure national level food security including buffer stocks and nutritional considerations in Agricultural policy
Civil Supplies & Public Distribution
To ensure food security at household level by making the essential foods available through the Public Distribution System to the people particularly to the disadvantaged sections.
Education To provide convergent services under Education Sector to enhance the nutritional and health status of the community with special emphasis on girls’ education and improved status of women.
Forestry To popularize the growing of plants/trees supplying food stuffs/fruits with special emphasis on Beta carotene (Vitamin A) rich species in the social forestry programmes with a view to create nutritional awareness and promote the consumption of nutritious foods.
Health Prevention and control of infections, micronutrient malnutrition, diseases related to inappropriate diets, creating health awareness among the people and ensuring adequate primary health care for all.
Family Welfare
To improve the nutritional status of women and children through nutrition prophylaxis programmes, health and nutrition education and promotion of small family norm.
Food To ensure food security in the country. Food Processing Industries
To meet the nutritional needs of the people by giving nutrition orientation to the projects food processing sector.
Information and Broadcasting
To create a climate of awareness in the country about the importance of nutrition for the well being of the people and ways and means of preventing various forms of malnutrition through its different units.
Labour To protect and promote the nutrition of various types of labour – agricultural, construction, industrial etc. with special emphasis on children and women at work, through formulation and enforcement of appropriate laws.
Rural Development
To improve purchasing power of the people in rural areas through employment generation and poverty alleviation programmes with a view to improve food security at the household level.
Urban Development
To ensure access to social services relating to health care, nutrition, women and child development, preschool and non-formal education and physical amenities like potable water supply, sanitation, sewerage, drainage etc., with a view to improve the nutritional level of the urban poor.
Welfare To improve nutrition of the disadvantaged sections of society by ensuring implementation of nutritional components of various welfare programmes.
Women and Child Development
To ensure appropriate development of human resources both through direct nutrition interventions for specially vulnerable groups as well as through various development policy instruments for improved nutrition as laid down in the National Nutrition Policy. Improving nutrition and health of women and children through strengthening and extension of ICDS programme and setting up of appropriate systems for monitoring the follow-up actions under National Plan of Action for children.
120
CHAPTER VIII RECOMMENDATIONS
During the Tenth Plan there will be focused and comprehensive
interventions aimed at improving the nutritional status of the individuals; this in turn will enable the country to achieve rapid reduction in severer forms of undernutrition and ill health and lead to improvement in nutritional and health status of the population. To achieve this objective coordinated multi sectoral interventions for increasing food production, effective processing and distribution, improvement in purchasing power , generating awareness, ensuring optimum utilisation of well targeted interventions for prevention, detection and management of macro and micronutrient deficiencies are needed. As food supplementation programmes cannot prevent under-nutrition, they can be used to combat under-nutrition during calamities. There should be a paradigm shift from • Household food security and freedom from hunger to nutrition security for
the family and the individual; • Untargeted supplementation to screening of all the persons from
vulnerable groups, identification of those with various grades of under nutrition and appropriate management;
• Lack of focused interventions on the prevention of over-nutrition to the promotion of appropriate lifestyles and dietary intakes for the prevention and management of over-nutrition and obesity.
Tenth Plan should initiate interventions aimed at achieving the following long-term objectives
Adequate food availability by • Ensuring production and availability of cereals, pulses and vegetables to
meet the nutritional needs. • Making them available at affordable cost through out the year to urban
and rural population through reduction in post harvest losses and appropriate processing.
• More cost effective and efficient targeting of the PDS to address macro and micronutrient deficiencies ( such as providing coarse grains, pulses and iodised salt to BPL families through TPDS)
• Improving purchasing power by appropriate programmes including food for work programmes
Prevention of undernutrition through nutrition education aimed at • Ensuring appropriate infant feeding practices (universal colostrums
feeding, exclusive breast feeding upto six months, introduction of semisolids at six months)
• Promoting appropriate intra-family distribution of food based on requirements.
• Dietary diversification to meet the nutritional needs of the family. • Improving awareness about ongoing programmes to improve nutritional
status and how to access them.
121
Operationalizing universal screening of vulnerable groups for macro and micro nutrient deficiencies • All infants and preschool children for under-nutrition • All children with severe undernutrition for anaemia • All pregnant women for undernutrition Initiating appropriate nutrition interventions for management of undernutrition through • Targeted food supplementation and health care for those with under
nutrition. • Effective monitoring of these individuals and their families. • Utilisation of the PRI for effective intersectoral coordination and
convergence of services, improving community participation in planning, monitoring of the ongoing interventions for prevention and management of undernutrition and utilizing the existing ICDS and health infrastructure to provide nutrition education.
Promotion of appropriate dietary intake and life styles for prevention and management of obesity and prevention and management of diet related chronic diseases. Prevention, early detection and appropriate management of micronutrient deficiencies and associated health hazards. • Nutrition education to achieve dietary diversification and balanced intake
of all micronutrients • Universal access to double fortified salt • Screening of ¾ All children with severe undernutrition for micronutrient deficiencies ¾ All pregnant women for micronutrient deficiencies ¾ All school children for micronutrient deficiencies
• Appropriate intervention for treatment of micronutrient deficiencies Establishment of Nutrition monitoring and surveillance to identify and tackle emerging nutritional problems with appropriate intervention programmes. Recommendations of the Steering Committee regarding Newer Strategies for Rapid Reduction in Severe Grades of Undernutrtition The Tenth Plan should evolve a new strategy to achieve substantial reduction in the severe grades of under-nutrition and associated health hazards associated without massive increase in the cost. For prevention of under-nutrition • Nutrition education through all modes of communication with special
focus on
122
¾ inter-personal communication by anganwadi workers and ANMs to promote
¾ universal breastfeeding; ¾ exclusive breastfeeding for first six months; ¾ continuing breastfeeding up to two years; ¾ introduction of semi solid supplements from family pot at sixth month; ¾ giving the complimentary feeds to children at least 4-5 times a day; ¾ improving intra-familial distribution of food based on needs and
providing pre-school children, pregnant and lactating women some more food from the family pot; and
¾ introducing green leafy vegetables at least twice a week in the family meal.
• Provision of take-home food supplements to children in the 6-36 months age group from BPL families (utilising PMGY funds also) as they cannot consume 300 Kcal food at one sitting at the anganwadi.
• Administration of massive dose Vitamin A in April and October to the children at 18, 24, 30 and 36 months by the anganwadi workers under the supervision of the ANMs.
• Organise immunisation, maternal and child care at the anganwadi on a fixed date at least once a month so that the health care needs of these vulnerable groups are met.
• The anganwadi workers can keep iron and folic acid tablets and ORS for distribution as and when required in the village and also monitor the regularity of intake.
• Promotion of universal use of iodised salt and organization of testing salt for adequacy of iodisation at home level.
The anganwadi workers and the ANMs should be trained by appropriate agencies including Food and Nutrition Board and Home Sciences colleges so that they learn and communicate the right nutrition and health education messages to the population on a sustained basis. This is a very important but neglected area which does not require any additional financial inputs and could play the most critical role in reducing the prevalence of under nutrition. For detection and management of undernutrition • Ensure that all children in the age group of 0-6 years are weighed at least
four times in a year and children suffering from grade III and grade IV under-nutrition are identified. Those with grade III and grade IV under- nutrition should be provided with double rations (as envisaged in the ICDS guidelines) as take-home food supplements continuously with the instruction that they should be fed these preparations at least four times a day. In addition, appropriate health care should be provided to them by the ANMs and PHC doctors.
• Weigh all pregnant and lactating women, identify those with body weight
less than 40 kg and provide them with food grains for the remaining period of pregnancy/lactation or until they cross the cut off point.
123
• Weigh all adolescent girls at least four times in a year, identify those with weight less than 35 kg and provide foodgrains for the next three months or until they weigh more than 35 kg
• Organise antenatal and child health clinics for screening vulnerable
population, early detection and effective treatment of anaemia, Vitamin A deficiency and iodine deficiency disorders.
Goals Set for the Tenth Plan The Tenth Plan has set specific nutrition goals to be achieved by 2007. In view of the massive inter-state/inter-district differences in the availability and access to the nutrition-related services and in nutritional status of the population , the state specific goals to be achieved by 2007 have been evolved based on the current level of these indices and the Tenth Plan goals for the country has been derived from the state specific goals. The progress achieved in terms of the process and impact indicators should be reviewed annually, and if, necessary goals may be reset at the time of the mid-term appraisal. The country should achieve the following goals by 2007: Breast-Feeding And Complementary Feeding • Enhance early initiation of breast-feeding (colostrum feeding) from the
current level of 15.8 per cent (as per NFHS-2) to 50 per cent. • Enhance exclusive breastfeeding rate for children up to the age of six
months from the current rate of 55.2 per cent (as per NFHS-2) to 80 per cent.
• Enhance complementary feeding rate at six months from the current level of 33.5 per cent (as per NFHS-2) to 75 per cent.
Under-nutrition • All infants delivered at home should be weighed soon after birth by the
anganwadi workers. Those weighing less than 2.2 kg should be referred to a hospital with a paediatrician to improve neonatal survival. Compiled data will provide information on prevalence of low birth weight.
• Weigh all pre-school children at least four times a year to identify children showing mild, moderate and severe degrees of under-nutrition.
• Health and nutrition education to all to improve intra-familial distribution of food based on need and provide appropriate health care.
• Focused intervention to children with severe under-nutrition (doubling the ration, appropriate health care and monitoring).
• Bring down the prevalence of under-weight in children under three years from the current level of 47 per cent as per NFHS-2 to 40 per cent.
• Reduce prevalence of severe under-nutrition in children in the 0-6 years age group by 50 per cent.
124
Iron Deficiency Anaemia • High priority to research and development on double fortified salt and
making it available to all at affordable cost to reduce prevalence of anaemia in all age and sex groups.
• Screening of children for anaemia and appropriate treatment. • Universal screening of pregnant women for anaemia and appropriate
treatment • Reduce prevalence of moderate/severe anaemia by 50 per cent. Vitamin A deficiency • Achieve universal coverage for each of the five doses of Vitamin A
under the National Prophylaxis Programme for Nutritional Blindness. • Reduce prevalence of night blindness to below 1.0 per cent and that of
Bitot Spots to below 0.5 per cent in children between six months to six years of age.
• Eliminate Vitamin A deficiency as a public health problem. Iodine Deficiency Disorders • Achieve universal access to iodised salt. • Generate district-wise data on iodised salt consumption • Reduction in prevalence of IDD in the country to less than 10 per cent by
2010. Others • Generate data on the health status of Indians in relation to
anthropometric indices especially BMI - both for under- and over-nutrition.
• Intensify health and nutrition education for change in dietary habits and life style; monitor impact in terms of reduction in obesity and diet related
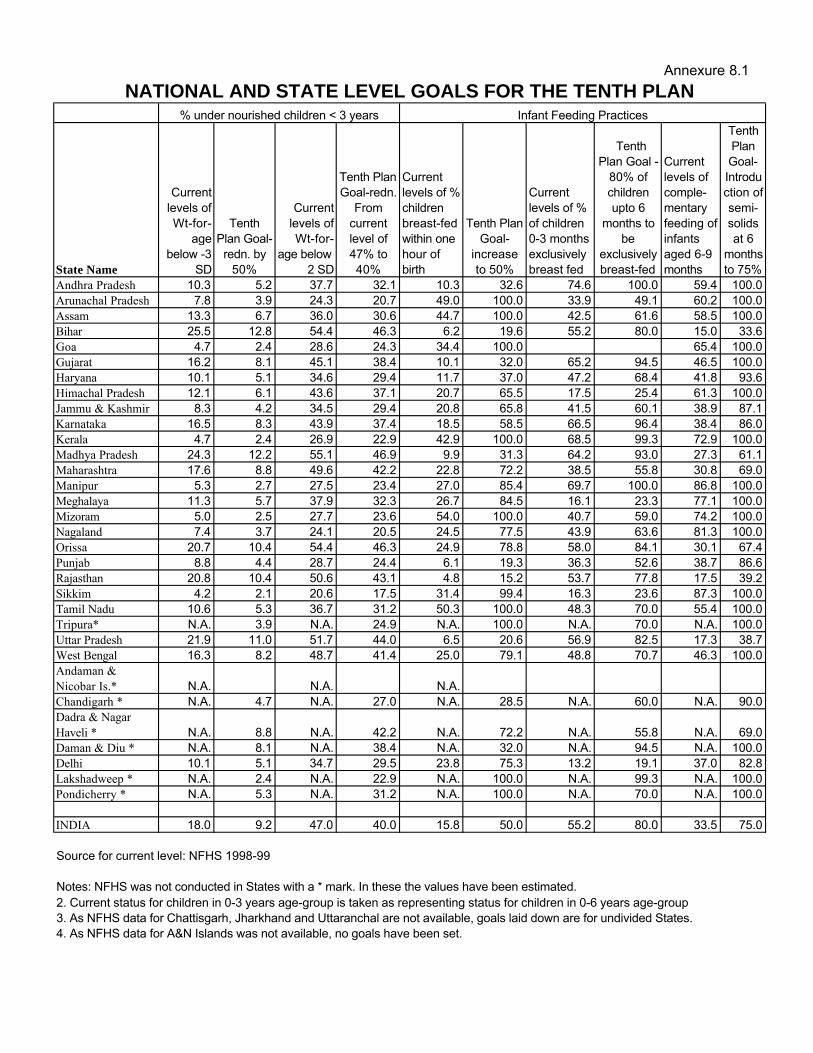
Annexure 8.1
State Name
Current levels of Wt-for-
age below -3
SD
Tenth Plan Goal-
redn. by 50%
Current levels of Wt-for-
age below -2 SD
Tenth Plan Goal-redn.
From current level of 47% to 40%
Current levels of % children breast-fed within one hour of birth
Tenth Plan Goal-
increase to 50%
Current levels of % of children 0-3 months exclusively breast fed
Tenth Plan Goal -
80% of children upto 6
months to be
exclusively breast-fed
Current levels of comple-mentary feeding of infants aged 6-9 months
Tenth Plan Goal-Introduction of semi-solids at 6
months to 75%
Andhra Pradesh 10.3 5.2 37.7 32.1 10.3 32.6 74.6 100.0 59.4 100.0Arunachal Pradesh 7.8 3.9 24.3 20.7 49.0 100.0 33.9 49.1 60.2 100.0Assam 13.3 6.7 36.0 30.6 44.7 100.0 42.5 61.6 58.5 100.0Bihar 25.5 12.8 54.4 46.3 6.2 19.6 55.2 80.0 15.0 33.6Goa 4.7 2.4 28.6 24.3 34.4 100.0 65.4 100.0Gujarat 16.2 8.1 45.1 38.4 10.1 32.0 65.2 94.5 46.5 100.0Haryana 10.1 5.1 34.6 29.4 11.7 37.0 47.2 68.4 41.8 93.6Himachal Pradesh 12.1 6.1 43.6 37.1 20.7 65.5 17.5 25.4 61.3 100.0Jammu & Kashmir 8.3 4.2 34.5 29.4 20.8 65.8 41.5 60.1 38.9 87.1Karnataka 16.5 8.3 43.9 37.4 18.5 58.5 66.5 96.4 38.4 86.0Kerala 4.7 2.4 26.9 22.9 42.9 100.0 68.5 99.3 72.9 100.0Madhya Pradesh 24.3 12.2 55.1 46.9 9.9 31.3 64.2 93.0 27.3 61.1Maharashtra 17.6 8.8 49.6 42.2 22.8 72.2 38.5 55.8 30.8 69.0Manipur 5.3 2.7 27.5 23.4 27.0 85.4 69.7 100.0 86.8 100.0Meghalaya 11.3 5.7 37.9 32.3 26.7 84.5 16.1 23.3 77.1 100.0Mizoram 5.0 2.5 27.7 23.6 54.0 100.0 40.7 59.0 74.2 100.0Nagaland 7.4 3.7 24.1 20.5 24.5 77.5 43.9 63.6 81.3 100.0Orissa 20.7 10.4 54.4 46.3 24.9 78.8 58.0 84.1 30.1 67.4Punjab 8.8 4.4 28.7 24.4 6.1 19.3 36.3 52.6 38.7 86.6Rajasthan 20.8 10.4 50.6 43.1 4.8 15.2 53.7 77.8 17.5 39.2Sikkim 4.2 2.1 20.6 17.5 31.4 99.4 16.3 23.6 87.3 100.0Tamil Nadu 10.6 5.3 36.7 31.2 50.3 100.0 48.3 70.0 55.4 100.0Tripura* N.A. 3.9 N.A. 24.9 N.A. 100.0 N.A. 70.0 N.A. 100.0Uttar Pradesh 21.9 11.0 51.7 44.0 6.5 20.6 56.9 82.5 17.3 38.7West Bengal 16.3 8.2 48.7 41.4 25.0 79.1 48.8 70.7 46.3 100.0Andaman & Nicobar Is.* N.A. N.A. N.A.Chandigarh * N.A. 4.7 N.A. 27.0 N.A. 28.5 N.A. 60.0 N.A. 90.0Dadra & Nagar Haveli * N.A. 8.8 N.A. 42.2 N.A. 72.2 N.A. 55.8 N.A. 69.0Daman & Diu * N.A. 8.1 N.A. 38.4 N.A. 32.0 N.A. 94.5 N.A. 100.0Delhi 10.1 5.1 34.7 29.5 23.8 75.3 13.2 19.1 37.0 82.8Lakshadweep * N.A. 2.4 N.A. 22.9 N.A. 100.0 N.A. 99.3 N.A. 100.0Pondicherry * N.A. 5.3 N.A. 31.2 N.A. 100.0 N.A. 70.0 N.A. 100.0
INDIA 18.0 9.2 47.0 40.0 15.8 50.0 55.2 80.0 33.5 75.0
Source for current level: NFHS 1998-99
Notes: NFHS was not conducted in States with a * mark. In these the values have been estimated.
NATIONAL AND STATE LEVEL GOALS FOR THE TENTH PLAN
2. Current status for children in 0-3 years age-group is taken as representing status for children in 0-6 years age-group
% under nourished children < 3 years
3. As NFHS data for Chattisgarh, Jharkhand and Uttaranchal are not available, goals laid down are for undivided States.4. As NFHS data for A&N Islands was not available, no goals have been set.
Infant Feeding Practices