˘ ˇ ˆ˘ ˙ ˆ - ilo.org · how can one measure the progress of the decent work agenda? more...
TRANSCRIPT

����������� ������������������������������������������

1
A Review on Labour MarketInformation/Decent Work
Indicators in Indonesia
Diah Widarti
International Labour Organization
JakartaDecember 2005

Review on Labour Market Information/Decent Work Indicators in Indonesia
2
Copyright@International Labour Organization 2005
First published 2005
Publications of the International Labour Office enjoy copyright under Protocol 2 of the Universal Copyright Convention.Nevertheless, short excerpts from them may be reproduced without authorization, on condition that the source isindicated. For rights of reproduction or translation, application should be made to the Publications Bureau (Rights andPermissions), International Labour Office, CH-1211 Geneva 22, Switzerland. The International Labour Office welcomessuch applications.
Libraries, institutions and other users registered in the United Kingdom with the Copyright Licensing Agency, 90 TottenhamCourt Road, London W1T 4LP [Fax: (+44) (0)20 7631 5500; email: [email protected]], in the United States with theCopyright Clearance Center, 222 Rosewood Drive, Danvers, MA 01923 [Fax: (+1) (978) 750 4470; email:[email protected]] or in other countries with associated Reproduction Rights Organizations, may make photocopies inaccordance with the licences issued to them for this purpose.
ILOInternational Labour Organization, 2005
“A Review On Labour Market Information/Decent Work Indicators In Indonesia”
ISBN 92-2-118405-X (print)ISBN 978-92-2-118405-1 (pdf)
The designations employed in ILO publications, which are in conformity with United Nations practice, and the presentationof material therein do not imply the expression of any opinion whatsoever on the part of the International Labour Officeconcerning the legal status of any country, area or territory or of its authorities, or concerning the delimitation of itsfrontiers.
The responsibility for opinions expressed in signed articles, studies and other contributions rests solely with theirauthors, and publication does not constitute an endorsement by the International Labour Office of the opinions expressedin them.
Reference to names of firms and commercial products and processes does not imply their endorsement by the InternationalLabour Office, and any failure to mention a particular firm, commercial product or process is not a sign of disapproval.ILO publications can be obtained through major booksellers or ILO local offices in many countries, or direct from ILOPublications, International Labour Office, CH-1211 Geneva 22, Switzerland or from the ILO Office in Jakarta, MenaraThamrin, Level 22, Jl. MH Thamrin Kav. 3, Jakarta 10250. Catalogues or lists of new publications are available free ofcharge from the above address, or by email: [email protected] ; [email protected]. Visit our website: www.ilo.org/publns; www.un.or.id/ilo
Printed in Indonesia

3
The Medium Term Development Plan for Indonesia has a strong focus on providing employment,combating poverty and improving people’s livelihoods. As such it echoes the wording of the Basic Act from1945, which in article 27 states that “every citizen is entitled to get decent employment and life”.
As part of the United Nations System and in support to the achievement of the Millennium DevelopmentGoals, the International Labour Organisation’s global mandate is to promote Decent Work. In line withIndonesia’s medium term strategy, promoting Decent Work for the ILO means to “promote opportunities forall women and men to obtain decent and productive work in conditions of freedom, equity, security andhuman dignity”..
In Indonesia, the ILO is supporting its constituents (the Government through the Ministry of Manpowerand Transmigration, the Labour Unions and the Employers’ Organisation) to promote Decent Work, build onfour major pillars: Fundamental Principles and Rights at Work, Employment, Social Protection and SocialDialogue.
How can one measure the progress of the Decent Work Agenda? More importantly, what kind ofindicators that are available in Indonesian context and represent the four pillars of decent work? Who arethe responsible agencies for maintaining labour market information and decent work data base? What is theexisting mechanism for coordination to update the data base? These are the issues explored in this workingpaper.
This working paper has been prepared in an effort to determine a set of Decent Work Indicators forIndonesia. The paper has been prepared by Ms. Diah Widarti and covers the issues raised above in terms ofmeasuring, maintaining, coordinating and using such Decent Work Indicators as a basis for policy development.I trust that it will be a useful contribution to adequately measure progress on Decent Work for the womenand men of Indonesia.
Jakarta, December 2005
Alan BoultonDirectorILO Jakarta Office
FOREWORD

Review on Labour Market Information/Decent Work Indicators in Indonesia
4

5
TABLE OF CONTENTS
FOREWORD 3TABLE OF CONTENTS 5GLOSSARY 6
CHAPTER 1INTRODUCTION 91.1. Background 91.2. Concept and Indicators 91.3. Objectives 121.4. Methodology 121.5. Organization of the Report 13
CHAPTER 2DATA COLLECTION AND DISSEMINATION IN INDONESIA 152.1. Legislation 152.2. Responsible Agencies 172.3. Source and System of Data Collection 182.4. Characteristic of Data 262.5. Dissemination 28
CHAPTER 3DECENT WORK INDICATORS: DATA QUALITY AND AVAILABILITY 293.1. Consistency and Comparability 293.2. Advantages and Disadvantages 303.3. Decent Work Indicators: Data Gaps 303.4. Implications of Regional Autonomy on Data Collection 38
CHAPTER 4EXISTING MECHANISM OF COORDINATION FOR LABOURMARKET INFORMATION/DECENT WORK INDICATORS 414.1. Existing Mechanism of Coordination of LMI/DWI in the MOMT 414.2. Linkages 434.3. Challenges 43
CHAPTER 5CONCLUSION AND RECOMMENDATION 475.1. Conclusion 475.2. Recommendation 47
REFERENCES 49

Review on Labour Market Information/Decent Work Indicators in Indonesia
6
GLOSSARY
List of Abbreviations and Terms in Bahasa (Italic)
APBN State Budget and Expenditure (Anggaran Pendapatan dan Belanja Negara)BALITFO Board of Research, Development and Information
(Badan Penelitian, Pengembangan dan Informasi)BAPPEDA Regional Development Planning Board
(Badan Perencanaan Pembangunan Daerah)BAPPENAS National Development Planning Agency
(Badan Perencanaan Pembangunan Nasional)BPS Central Board of Statistics (Badan Pusat Statistik)CLA Collective Labour AgreementDesa VillageDG Directorate GeneralDKD Regional Manpower Council (Dewan Ketenagakerjaan Daerah)DKN National Manpower Council (Dewan Ketenagakerjaan Nasional)DPBH Directory of Incorporated Establishment
(Direktori Perusahaan Berbadan Hukum, DPBH)DPD Regional Wage Council (Dewan Pengupahan Daerah)DPN National Wage Council (Dewan Pengupahan Nasional)DWI Decent Work IndicatorsGDP Gross Domestic ProductHPH Rights for Forest Exploitation (Hak Penebangan Hutan)ILO International Labour OrganisationIPK Permit for Woods Collection (Izin Pengumpulan Kayu)ISCO International Standard Classification of OccupationJAMSOSTEK Manpower Social Insurance (Jaminan Sosial Tenaga kerja)Kabupaten DistrictKecamatan Sub-districtKILM Key Indicators of Labour Market (Indikator Kunci Pasar Kerja)LFP Labour Force ParticipationLMI Labour Market InformationMOMT Ministry of Manpower and Transmigration
(Departemen Tenaga Kerja dan Transmigrasi)NGO Non-governmental OrganisationPEP Program, Evaluation and Reporting (Program, Evaluasi and
Pelaporan)PMT Backward Community Settlement
(Pemukiman Masyarakat Tertinggal)PODES Village Potential Survey (Survai Potensi Desa)

7
PTKD Regional Manpower Planning (Perencanaan Tenaga kerja Daerah)PTKN National Manpower Planning (Perencanaan Tenaga kerja NasionalPUSDATIN NAKER Centre of Manpower Data and Information
(Pusat Data dan Informasi Tenaga Kerja)SAKERDA Regional Labour Force Survey (Survai Tenaga Kerja Daerah)SAKERNAS National Labour Force Survey (Survai Tenaga Nasional)SH Hotel Establishment Survey (Survai Hotel)SIBS Large and Medium Manufacturing Survey
(Survai Industri Besar-Sedang)SKKR Small and Household Cottage Industry Survey
(Survai Industri Kecil dan Kerajinan Rumahtangga)SPSI All Indonesian Trade Unions (Serikat Pekerja Seluruh Indonesia)STKU Quarterly Establishment Survey (Survai Triwulanan Kegiatan
Usaha)SUB Employee Wage Survey (Survai Upah Buruh)SUPAS Intercensal Population Survey (Survai Penduduk Antar Sensus)SUSENAS National Socio-economic Survey (Survai Sosial Economi Nasional)SUSI Small and Household-Establishment Integrated Survey
(Survai Usaha Kecil dan Rumah Tangga Terpadu)UN United NationsUNDP United Nations Development Programme

Review on Labour Market Information/Decent Work Indicators in Indonesia
8

9
1.1. Background
Decent work is a broad concept with many aspects. Some of its aspects are much more readily measuredthan other aspects, which may be reflected in availability of the statistics. Decent work is a fundamentaldimension of the quality of life. This is because work is a major part of life in terms of total time, socialintegration and individual self-esteem. Productive work is the main source of income for the vast majority ofpeople and the driving force for sustainable development. Therefore, the promotion of decent work for allwomen and men everywhere is the central objective of the International Labour Organization (ILO), whichdescribes decent work as “opportunities for women and men to obtain decent and productive work inconditions of freedom, equity, security and human dignity”.1 Although the relative importance of specificaspects of decent work varies from country to country and from person to person, the concept and the basicelements of decent work are universal. It is believed that decent work is an important contributor to sustainabledevelopment, in addition to being an important objective in its own right.
1.2. Concept and Definition of Decent Work2
The concept of “decent work” was launched in 1999, in the Report of the Director-General to theInternational Labour Conference meeting in its 87th Session. The idea both conveys the broad and variousdimensions associated with work today and summarize them in a phrase that everyone can understand.
Decent work is elaborated in employment, social protection, workers’ rights and social dialoguecomponents. Decent work applies not just to workers in the formal economy but also to un-regulated wageworkers, the self-employed and home workers (see Ghai, 2003).
EmploymentEmployment here covers work that has both quantitative and qualitative dimensions. An important
attribute of decent work is that workers should benefit from “remunerative” employment, which is oneelement in the “quality” of work. It refers to sufficient opportunities for work, remuneration (in cash and inkind), and includes safety at work and healthy working conditions. The range of elements covered byconditions of work may include night work, hours of work, weekly rest and paid leave.
Social securitySocial security and income security are crucial components associated to each society’s capacity and
level of development. Social security serves to meet people’s urgent subsistence needs and to provideprotection against unexpected events, and as such is an important aspect of decent work.
CHAPTER 1
INTRODUCTION
1 See Anker, R. 2001. “ILO Multi-country database.” ILO, Geneva.2 This section mainly from the article on Decent Work Indicators by Ghai, D. 2003.

Review on Labour Market Information/Decent Work Indicators in Indonesia
10
There are two types of indicator commonly used to assess adequacy of social security, namely (1)public expenditure on social security as a proportion of GDP, and (2) coverage of workers in social securityscheme. The first indicator measures the public resources that go into social necessities without mentioningabout the effectiveness with which these resources are used, nor does it take into account private schemesfor social protection. Nevertheless, it gives an approximate picture of the coverage of social security.
The other measure of social security provides information on the proportion of relevant categories ofworkers protected against different emergencies. Most industrial and transition countries provide protectionagainst these risks for the majority of their working population, in most developing countries howevercoverage is limited to workers in the formal economy (except for health services).
Fundamental Rights At WorkThe component of the fundamental rights of workers covers freedom of association, non-discrimination
at work, and the absence of forced labour and child labour. The workers’ rights that are of central concernto the ILO since its inception are forced labour, child labour under very bad conditions, discrimination atwork and freedom of association. The ILO has developed and adopted a series of international standardsdefining these rights and their violation, and elaborating on conditions and guidelines to protect and promotethem.
Forced labourModern forced labour can take many forms including slavery-type situations, bonded labour, and prison
labour. It can also take the type of compulsory work required for educational, community and state projects.However, provided such labour is imposed with the consent of the people following democratic procedures,it is generally considered acceptable and is quite common. The first ILO Convention on Forced Labour No.29 was adopted in 1930. The Abolition of Forced Labour Convention, 1957 (No.105), prohibits all forms offorced labour for certain purposes, including political coercion, economic development and as means ofracial, social or religious discrimination. Conventions No. 29 and No. 105 apply to workers in all categories.
Child labourAlthough the ILO has been concerned with child labour issue for a long time, it has only recently
attracted a great deal of attention on the part of governments, international agencies, civil society organizationsand the media. The very first child labour convention, namely Convention (No.5): the Minimum Age (Industry)Convention was adopted in 1919 in the first year of the existence of organization. The Convention definedthe minimum age for work at 14 years and prohibited the use of child labour in all industrial enterprises. TheMinimum Age Convention, No. 138, adopted in 1973, continued to link the minimum age for entering thelabour force with the minimum school-leaving age. In 1999, the member States adopted the Convention No.182 on the Worst Forms of Child Labour that calls for the prohibition and elimination “as a matter ofurgency” of abuse of children in slavery, prostitution, pornography, illicit drug trafficking and in workendangering their health, safety and morals.
Child labour is quite widespread in developing countries. It is estimated that the number of child labourreached at 206 million in 2000 (ILO, 2002). Labour force participation of children may be used to measurechild labour. The non-enrolment rate in secondary schools has also been suggested as a complementarymeasure of participation in labour force by children (Mehran, 2000; Kucera 2001). This generally varies withthe level of per capita income.
Discrimination at workDiscrimination at work concerns inequality of treatment and opportunity to individuals in their own
right or as members of a social group. The ILO’s Convention No. 111 of 1958 on Discrimination (Employmentand Occupation) identifies discriminatory acts as in any distinction, exclusion or preference made on thebasis of race, colour, sex, religion, political opinion, national extraction or social origin, which has the effectof nullifying or impairing equality of opportunity or treatment in employment or occupation (Article 1, para.1(a)).

11
Discrimination is mostly referred to gender, but discrimination may be referred to other bases. Tomeasure gender discrimination, one may use four indicators such as (a) the labour force participation rateor employment-to-female working age population ratio (b) the unemployment rate (c) differences in earnings(and other benefits) and (d) distribution of skilled jobs. These indicators show disparities between womenand men. Such disparities can occur for any reasons that include discrimination, poor-educational back-ground, low skills and productivity (see Anker, 1998). Thus they must be regarded as indirect and approximateindicators of discrimination at work. Employment-to-working population ratios show disparities in workopportunities by sex. The opportunities for men in paid job are generally much greater than those forwomen. Unemployment rates for men and women are another indicator of gender disparities in workopportunities.
Freedom of associationThe ILO has long been concerned with the rights of workers and employers to establish their independent
organizations in order to defend their interests, to organize joint activities and to participate in negotiationsand discussions affecting these interests (ILO, 2000a; ILO, 2000b). Freedom of association as a fundamentalhuman right is retained in key United Nations documents such as the Charter of the United Nations and theUniversal Declaration of Human Rights.
A number of indicators have been suggested to assess achievement of freedom of association. One ofthe indicators that can assess the achievement of freedom of association is the number or proportion ofworkers belonging to organizations concerned with work-related matters. In industrial countries, the mostcommonly used indicator refers to the proportion of the labour force or wage employees who are membersof trade unions, termed as “union density”. In general, the higher the union density, the stronger thedefence of workers’ interests in negotiations with employers and the government, and the greater theparticipation by workers in matters affecting their work. However, according to Jose (2002), union density isnot a direct reflection of freedom of association. The extent of trade unionism depends upon historicaltraditions, political systems and industrial structures and relations. As shown by Ghai (2003) countries thatenjoy equal level of freedom of association display great differences in trade union density. The relevance ofunion density as an indicator of freedom of association is even more limited in developing countries becauseof the small size of the labour force in the formal economy. This is because the majority of the workers indeveloping countries are agricultural workers, self-employed and employees in the informal economy, aswell as unpaid family workers with jobs that are in lower ladder, more insecure and weaker influence thanthose of other segments of the working population. Thus they have greater need for organizations of theirown for representation, negotiation and the promotion of joint activities.
Social dialogueThe component of social dialogue reflects the condition in which workers exercise their rights to
present their views, defend their interests and are involved in discussions to negotiate work-related matterswith employers and authorities.3 The social dialogue that is closest to relevant parties usually takes place intheir immediate working environment. It can occur among the workers themselves and between theirrepresentative associations and the representatives of the groups for which they work.
Collective bargainingSocial dialogue can promote equity, efficiency and adjustment and therefore may sustain economic
progress. It may take place at one of three levels, between employers and employees in relation to termsand conditions of employment; between the management and workers over the functioning of an enterprise;and between social partners and public authorities on social and economic policy. Clearly, the right tofreedom of association is closely linked to social dialogue (Ghai, 2003). The indicator used for social dialogueis union members as a proportion of all employees, or the trade union density in a country. In most countriessuch dialogue takes the form of collective bargaining between the unions and the employers’ organizations,whether at enterprise, industrial or national level, irrespective of whether the enterprise is private, cooperativeor state-owned.
3 See D. Ghai. 2003. Decent Work: Concept and Indicators. ILR, Geneva.

Review on Labour Market Information/Decent Work Indicators in Indonesia
12
Indicators that can be used to measure the right to collective bargaining are the one that is relating tolegal and administrative requirements and another is the outcomes in terms of collective bargaining. Withregard to the first indicator, Conventions No. 87 and No. 98 elaborate the international norms on theprinciples and procedures of collective bargaining, and the Collective Bargaining Convention, 1981 (No.154), supplements the older Conventions 8. Ratification rates of the relevant ILO Conventions can thereforeprovide one indicator of collective bargaining. A more effective indicator would be based on examination ofthe national legislation and evaluation of the various criteria pertinent to collective bargaining. Reports bythe ILO and other organizations, such as the ICFTU and human rights bodies, could be additional sources ofinformation. A second type of indicator is based on the extent of collective bargaining that takes place. Thisis generally measured by the proportion of employees covered by collective bargaining agreements.
Economic democracyAnother aspect of social dialogue involves workers’ participation in the functioning of their enterprise,
whether in the formal or the informal economy. Workers’ participation may cover a broad field, ranging fromrepresentation on the governing boards and management committees to playing an active role in theadministration of training and human resource development programmes. There are no simple measures ofeconomic democracy. The ILO provides no specific guidance on worker participation, though the Cooperationat the Level of the Undertaking Recommendation, 1952 (No. 94), and the Consultation (Industrial andNational Levels) Recommendation, 1960 (No. 113), sketch out a framework for this purpose. The mostappropriate approach to developing indicators in this field should be through detailed country-by-countryexamination of laws, institutions, procedures and practices relating to the various aspects of workers’participation mentioned above. A similar approach, though even more difficult to implement, would beneeded to assess worker participation in economic undertakings in developing countries. This would examinenot only the formal economy but also patterns and mechanisms of participation in other types of employmentrelations.
1.3. Objectives
Overall ObjectiveTo provide information and knowledge to policy makers and the social partners so they can develop
effective labour market policies.
Immediate ObjectiveTo review labour market information mechanism in Indonesia as the basis to enhance the mechanism
of coordination of data collection for DWI database
1.4. MethodologyTo achieve the objective the method used is to conduct· Reviews on documents of labour market information in Indonesia· Visits to the relevant agencies to examine the existing linkage within the MOMT and between central
and regional offices on labour market information in particular of decent work indicators.· Interviewing the concerned parties

13
1.5. Organization of the ReportThe report consists of five chapters. The first chapter, an introductory part, presents background,
concept and indicators, objectives, methodology and organization of the report. The second chapter dealswith data collection and dissemination in Indonesia including the legislation that regulates data collectionand dissemination as well as the agencies that are responsible. The third chapter discusses decent workindicators in terms of data quality and availability. Chapter four deals with the existing mechanism of labourmarket information particularly decent work indicator within the Ministry of Manpower and Transmigration.The last chapter draws conclusions and recommendations.

Review on Labour Market Information/Decent Work Indicators in Indonesia
14

15
The chapter discusses data collection and dissemination in Indonesia regarding labour and employmentparticularly related to decent work indicators. The discussion concerns the legislation concerning data collectionand the agencies that are responsible for such functions. The last section deals with sources and system ofcollection and dissemination, followed by the section on sources and data characteristics.
2.1. Legislation
Act on Statistics in IndonesiaThe Act of Republic of Indonesia No. 16, 1997 on Statistics stipulates that statistical activities should do thefollowing:(a) Supporting national development;(b) Developing a reliable, effective and efficient national statistics system;(c) Increasing public awareness of the significance and function of statistics; and(d) Supporting the development of science and technology.
To implement statistical activities the government appointed the Central Board of Statistics (BadanPusat Statistik, from here on this agency would be referred to as BPS), which is under and directly responsibleto the President. This agency has regional representatives vertically.
The BPS is responsible for basic statistics collection.4 Basics Statistics are statistics utilized for a broadrange of both government and community purposes, which have cross sectoral characteristics. Basic statisticsare on a national and macro scale, and will be the responsibility of BPS. The coverage of basics statisticsincludes statistics in economic field, social welfare area and others, which either have been developed or willbe developed by the BPS.
The Act states that data collection methods of the statistics are collected by census, survey, compilationof administrative products; and other methods in keeping with developments of science and technology.The census referred here to be conducted every ten years and consist of a population census, agriculturalcensus, and economic census. While for surveys to be conducted periodically or at any time in order toobtain detailed data.
Compilation of administrative products to be collected by utilizing various documents from administrativerecords and to be owned by government institutions yet will be available for public utilization unless prevailinglegislation specifies otherwise. However, even though the Act states that “… every individual will have anequal opportunity to access the compilation of administrative products owned by a non government institution,an organization, an individual or another part of the community but must maintain regard for the legallyprotected rights of an individual or an institution……” sometimes the information is not freely shared nordisseminated within a timely manner to all that may require or request access.
CHAPTER 2
DATA COLLECTION ANDDISSEMINATION IN INDONESIA
4 Statistics, as stipulated in the Indonesian Act No. 16 of 1997, are distinguished into basic statistics, sectoral statistics and administrativerecords. Basic Statistics can be obtained through censuses, surveys, compilation of administration products, or other methodsregarding to science and technology development. It can be conducted periodically, continually or at other time reference which isdefined by the Chief of BPS regarding to the data requirements, and can be managed centralized, decentralized, de-concentration(funded by central office but implemented in the regions), or the combination of them regarding to the quality of the data.

Review on Labour Market Information/Decent Work Indicators in Indonesia
16
Regarding sectoral statistics, Article 12 of the Act No. 16/1997 stipulates that a government institutionwill collect sectoral statistics in accordance with the scope of its duties and functions, either independentlyor in cooperation with the BPS. When collecting sectoral statistics, the government institution will obtaindata by survey, compilation of administrative products; and other methods in keeping with developments inscience and technology. Sectoral statistics must be collected in cooperation with the BPS when the statisticscan only be obtained by census and need to be collected on a national scale. The results of sectoral statisticsactivity when carried out by a government institution on its own must be submitted to the BPS.
Fundamental PrinciplesIn carrying out its mandate on official statistics the Indonesian government follows 10 principles in
accordance with the Fundamental Principles of Official Statistics of the United Nations Statistical Commission,5namely
1. Relevance, impartiality and equal accessOfficial statistics provide an indispensable element in the information system of a society, serving thegovernment, the economy and the public with data about the economic, demographic, social andenvironmental situation. To this end, official statistics that meet the test of practical utility are to becompiled and made available on an impartial basis by official statistical agencies to honour citizens’entitlement to public information.
2. Professional standards and ethicsTo retain trust in official statistics, the statistical agencies need to decide according to strictly professionalconsiderations, including scientific principles and professional ethics, on the methods and proceduresfor the collection, processing, storage and presentation of statistical data.
3. Accountability and transparency.To facilitate a correct interpretation of the data, the statistical agencies are to present informationaccording to scientific standards on the sources, methods and procedures of the statistics
4. Prevention of misuse.The statistical agencies are entitled to comment on erroneous interpretation and misuse of statistics.
5. Sources for official statisticsData for statistical purposes may be drawn from all types of sources, be they statistical surveys oradministrative records. Statistical agencies are to choose the source with regard to quality, timeliness,costs and the burden on respondents.
6. ConfidentialityIndividual data collected by statistical agencies for statistical compilation, whether they refer to naturalor legal persons, are to be strictly confidential and used exclusively for statistical purposes.
7. LegislationThe laws, regulations and measures under which the statistical systems operate are to be made public.
8. National coordinationCoordination among statistical agencies within countries is essential to achieve consistency and efficiencyin the statistical system.
9. Use of international standardsThe use by statistical agencies in each country of international concepts, classifications and methodspromotes the consistency and efficiency of statistical systems at all official levels.
10. International cooperationBilateral and multilateral cooperation in statistics contributes to the improvement of systems of officialstatistics in all countries.
Unfortunately, both in the fundamental principles and its practice there is no mention of the timelinessof release.
5 See Badan Pusat Statistik website www.bps.go.id

17
2.2. Responsible AgenciesAs reflected in the previous chapter, decent work is reflected through four components, namely (1)
Rights at work (2) Employment, (3) Social protection and (4) Social dialogue.
Looking at those components and the indicators covered in each, one may conclude that there are twoimportant agencies that are concerned in the collection and dissemination of labour market informationincluding decent work indicators that is the BPS and the Ministry of Manpower and Transmigration (MOMT).
Macro employment indicators may be provided by the BPS as this agency collects and disseminateslabour force and employment-related issues. Meanwhile specific indicators such as social dialogue andsocial protection due to their special issues are obtained from the administrative records collected by theMOMT.
Central Board of Statistics6
The BPS, being a non-department government agency established by the laws and regulations7, is aninstitution responsible for data collection and dissemination directly responsible to the President.
The function of BPS is as the following.To provide data to the government, and public. The data is derived from its comprehensive statisticalactivities, comprises of periodic information on structure and growth of economy, social change, anddevelopment. Those statistics may be derived from its own researches and surveys as well as fromother government Ministry as secondary data.To assist statistics divisions of government Ministries and other institutions, in developing statisticalsystem, needed to setup work program and periodic reporting scheme.To develop and promote standards to be incorporated in the implementation of statistical techniquesand methods, and to provide necessary services in the field of education and training in statistics.To establish cooperation with international institutions and other countries for the benefit of Indonesia’sstatistical development.
With its functions, BPS collects various data and information including employment.
Ministry of Manpower and TransmigrationThe working unit within the MOMT that is responsible for data collection and dissemination is the
Centre for Manpower Data and Information (PUSDATIN NAKER). This centre is under the jurisdiction of theBoard of Research, Development and Information for Manpower and Transmigration.
The function of the centre by regulation is to carry out the management, presentation, disseminationand service of manpower data and information (covering data and information on training, placement,labour standards supervision, industrial relation, labour productivity and manpower planning as well asgeneral employment issues) through its activities:
Formulation of programs of management, presentation, dissemination and service of manpower dataand informationCollection, establishment of database, and manpower data and information processingAnalysis, presentation, dissemination and service of manpower data and informationCoordination of program implementation in the management, presentation, dissemination and serviceof manpower data and information
6 According to the previous Act No. 7 of 1960 on Statistics, it was named Central Bureau of Statistics (CBS), which then was latelychanged to Central Board of Statistics.
7 Law Number 16, 1997 on Statistics and other legislations; Government Regulation Number 51, 1999 on Statistics Undertakings;Presidential Decree Number 166, 2000 on Status, Task, Function, Authority, and Organizational Structure of the Non-MinistrialGovernment Institution; Presidential Decree Number 178, 2000 on Organizational Structure and Task of the Non-Ministrial GovernmentInstitution; Presidential Decree Number 163, 1998 on College for Statistics; Executive Act Number 001, 2001 on The Organizationand Task of the BPS; Executive Act Number 101, 1998 on The Organization and Task of College for Statistics.

Review on Labour Market Information/Decent Work Indicators in Indonesia
18
Services provided by the Centre of Manpower Information are aimedTo provide data and information either in off-line or on-line manner for policy makers, technical operatorsand publicTo facilitate information service to government and public as well as other usersTo increase the facilitation of data and information transaction in on line manner,To integrate manpower data and information, andTo develop network of management for information in the central (internal and cross- sector) andregions.
2.3. Source and System of CollectionEmployment and labour-related data in Indonesia are originated from censuses, surveys, or administrative
records. The details of those undertakings are as the following.8
CensusCensus is a data collection method which is conducted by enumerating all population units throughout
the country to obtain the characteristics of the population in a certain time. Census in Indonesia includespopulation census, agriculture census and economic census. Data on employment is included in populationcensus.
Population censuses in Indonesia are conducted every ten years to collect general information on thepopulation with one block focusing on the labour force and employment structure. Between census years,an inter-censal population survey (SUPAS) is conducted to meet the needs for more frequent data. Forcomparability with census data, SUPAS adopts the same questions included in the sample census.
Agricultural Census (ST)The Agricultural Census uses both households and establishments as units of enumeration. Since
economic activities of the majority of the population are in agriculture, data are mainly collected fromhouseholds, although some are also collected from establishments. With many different sub-sectors anddifferent commodities, data collection in the agricultural census is highly complex. Moreover, regular householdagricultural activities must be separated from economic activities in agriculture for living and only the latterneed to be included in the agricultural census. Data collection from agricultural establishments is alsocomplex, but much easier than from agricultural households, since the definition of agricultural establishmentis clearer and the number of such establishments is manageable.
The agricultural census was conducted in 1963, 1973, 1983, 1993 and 2003. Agriculture provides thelargest employment opportunities in Indonesia although that of low living standard. The agricultural censuswas organized into several data collection phases aiming at capturing activities of sub-sectors and coveringareas important to government programs. The Census basically consists of two parts. First is the completedata collection covering agricultural establishments, village cooperative units and the “Village PotentialSurvey” (separate section is presented). The second part is the “sample census” of agricultural households,land-holding farmers and the “sub-sector agricultural households”.
Employment data are differentiated by gender, education, whether administrative staff/field workers/factory workers, whether managers/assistants/ regular employees, and whether permanent or temporaryworkers (monthly or daily workers). As part of the cost structure, wages and salaries and other incomecomponents are collected by type of employee. Similar employment data are collected in other establishmentcensuses covering (1) Industrial plants (2) Wild Animal Culture and Nature Tourism (3) Possesses Rights forForest Exploitation (HPH) and Permission for Woods Collection (IPK) (4) Big and Small Cattle and (5)Fishery.
8 This section is heavily based on Hananto Sigit, 2000. “Employment data in Indonesia.”

19
SurveysSurvey is a data collection method which is conducted by enumerating a sample to predict the
characteristics of the population. Survey can be either ad-hoc or regular in nature. Ad-hoc surveys areespecially conducted to capture and monitor the social and economic impacts of the economic crisis inresponse to concerted efforts to minimize these impacts.
Regular surveys are distinguished into three categories, namely household, establishment and communitydata surveys depending on their unit of enumeration.
Household surveysIn the household surveys respondents are individual household members. This type of survey exists in
the undertaking of the population census, the inter-censal population survey (SUPAS), the national labourforce survey (SAKERNAS), and the national socio-economic survey (SUSENAS).
Detailed individual data in terms of demographic, socio-economic and employment characteristics aswell as general information on either the establishment or the place of work are available in householdsurveys. Information on the worker’s household is also present in such surveys.
BPS conducts four types of household surveys in regular manner; they are population census, SUPAS,SAKERNAS, and SUSENAS. Although these surveys used the same basic concepts and definitions ofemployment in which one would expect that the results would be comparable, in fact employment data fromthese sources are not comparable. Censuses and SUPAS are designed with the same objective that is tocollect general population data and to produce comparable results. Their data however are not comparablewith those of SAKERNAS and SUSENAS.
SAKERNAS and SUSENAS data are not comparable because they are derived from different types ofsurvey. SUSENAS is a multi-purpose survey, with information collected in many different fields organized intwo questionnaires, one questionnaire as a core and another questionnaire as a module. The methodologyand implementation of the SUSENAS is very complex. The quality of employment data is greatly affected bythe collection of other information. SAKERNAS, on the other hand, is a survey specifically designed forcollecting employment data. Thus it should produce the most reliable data. It has been consistently undertakenin August of every year since 1994.
SUSENAS provides a rich source of data because it contains far more information. It is even richerthan the census or inter-censal population survey. However, it suffers from high variability in the informationcollected. Another shortcoming relates to employment data contained in the core questionnaire is thatquestions are limited and are placed following other more dominant questions. Thus despite the benefitsderived from the large size of the sample, SUSENAS employment data suffer more from a higher level ofinstability of the data compared to SAKERNAS. One serious weakness of both surveys is that they cannot beused for short-term comparisons. Maintaining consistency of the questionnaire, the methodology and fieldworkwould undoubtedly enhance one’s confidence in conducting serial analysis.
Population CensusThe Population Census in Indonesia is conducted every ten years. Thus far, five censuses have been
undertaken in 1961, 1971, 1980, 1990 and 2000. The past five censuses collected general information onpopulation which allows analysis of the population structure and general socio-economic characteristics. Inpopulation census, some important information relates to “economic activities” of the population, that islabour force and employment characteristics are also collected, using the “labour force approach”. The mainobjective is to provide benchmark data on the labour force and employment every ten years. The questionsare less elaborate than those collected in SAKERNAS and SUSENAS, but all important employment questionsneeded to analyze the labour force and employment structure are included in the census.
Before 2000 data collection in the population census was carried out in two parts. First, the so-calleda “complete census” that was done to collect basic information such as the names of household members,age, sex and family relationship to household heads as well as housing characteristics and facilities. Its mainobjective was to produce basic information on the population at the lowest administrative level (villages)

Review on Labour Market Information/Decent Work Indicators in Indonesia
20
and to use the information as a frame for sample selection of households that were to be interviewed in the“sample census”. The second part, the “sample census” some detailed questions on each household memberwere asked.
Both parts of the census covered all provinces. Fieldwork of the “complete census” was done inSeptember-October, while that of the “sample census” was conducted in October.9 In the 2000 census thetime reference was moved to July in order to improve international comparison, as most countries collectmid-year population in their censuses. In the sample census labour force and employment data are collected,with the sample covering 4-5 percent of households. In 1990, the sample covered approximately 200,000household. With such a large sample, the information can provide aggregate data down to the regencylevel. In fact, population censuses are the only source of data which provides employment information forregencies. Detailed tabulations and refined classifications of the data can be provided at higher levels ofadministrative regions (i.e. provincial and national levels). Such tabulations include the structure of theworking age population, characteristics of employment, job seekers, and characteristics of each segment ofthe labour force, as well as general socio-economic characteristics of the population.
The 2000 Population Census is a special case as it was designed to use the limited budget provided bythe government optimally in the aftermath of the economic crisis. The budget was not enough to financethe two-stage data collection used in previous censuses. To retain the main objective of the census that isthe provision of data for smaller regions, a complete census was necessary otherwise it could not beconsidered a census. However, funds were inadequate for conducting a reasonable “sample census” fordetailed information. A compromise then was formulated whereby selected information were included in thecomplete census. Therefore, in addition to the basic questions on family structure, the 2000 Census includesone or two questions on fertility, education, migration, labour force and employment.
Inter-censal population survey (SUPAS)SUPAS is conducted regularly halfway between censuses. Its objective is to provide population data
which could be linked to those from the censuses. The survey has so far been conducted in 1976, 1985,1995 and the 2005 SUPAS is underway. The fact is that the Indonesian population changes so rapidly thatdecennial census will not be able to capture these changes appropriately. However, Indonesia cannot affordto conduct a census every five years, mean while more frequent data are necessary to follow the rapidchanges in fertility and mortality as well as migration and labour force characteristics. Thus with this underlyingbackground, SUPAS is to be conducted.
Although the sample in SUPAS is large, this is still smaller than the number of households interviewedin a typical “sample census”. However, SUPAS still allows the provision of information for smaller regionswhich are comparable to those produced by the census. Accordingly, aggregate population trend data areavailable every five years. To maintain its conformity with census data, SUPAS fieldwork is typically conductedin September-October. Questions in SUPAS are similar to those in the “sample census”. Labour force andemployment data collected in SUPAS are also the same as those in the census, thus allowing the measurementof the structure and characteristics of employment and the labour force every five years. In addition, thelarge sample of households covered in the population census and the inter-censal population survey makethem possible in providing employment statistics for smaller administrative regions down to regencies/municipalities.
National labour force survey (SAKERNAS)SAKERNAS was conducted for the first time in 1976, with the specific purpose of collecting data on
labour force and employment. This survey was designed to improve the weaknesses of employment datacollected in the 1971 population census. SAKERNAS employed a rigid labour force approach using tworeference periods: “current” and “usual”. Since the labour force approach was used for the first time in thatyear, a comprehensive pilot test by BPS, in close cooperation with MOMT and the ILO, preceded theimplementation of the survey. The survey was then conducted once a year in 1977 and 1978, and wasdesigned to obtain serial data to be linked with data from population censuses and SUPAS. It was stoppedfor a few years and was then resumed annually until 1985. Beginning in 1986, the survey was conductedquarterly to capture the seasonal fluctuations in employment. With the understanding that the Indonesianeconomy is predominantly agriculture in that employment was most likely to be greatly influenced by
9 The census date was October 31 of the relevant year.

21
agricultural seasons, sectoral employment and other related characteristics would depict the peak andtrough seasons in agriculture. SAKERNAS fieldwork is done every year in February, May, August and November.The sample was approximately 20,500 households every quarter in 1992. Quarterly estimates could bemerged to produce average information for the year with a total sample of 82,000 households.
Quarterly surveys were conducted for 8 years until 1993, but results showed that seasonal fluctuationscould not be clearly depicted by the quarterly data, which seemed to be caused by the small size of thesample. With around 20,000 households, only national figures could be produced. With seasons differentfrom region to region, averaging at the national level would produce the same results for every quarter.Without a substantial increase in the sample which would allow the production of regional data, suchquarterly surveys would not be useful in describing seasonality at the national level. It was recognized thatthe construction of average figures for the year that were taken from the quarterly survey was not valuable.This was due to the fact that data did not represent yearly figures with a certain point in time as thereference, but rather an average of four quarterly figures that were not matching with other figures. Anothershortcoming of the quarterly version of SAKERNAS was the limited number of questions included that theywere only items that are expected to be affected by seasonality. This fact made results difficult to comparewith those of other survey. Due to these weaknesses, the quarterly survey was terminated.
In 1994 SAKERNAS was conducted yearly with a more detailed questionnaire using a reduced samplesize of 65,500 households. Due to budget constraints, in 1998 the sample was again reduced to 49,200households. In 1999, the SAKERNAS sample was reduced to about 20,000 households and was expected togenerate detailed information at only national levels and only aggregate data for provinces. A complete setof labour force and employment data is collected in SAKERNAS.
Up to 1999 SAKERNAS was carried out in August on yearly basis. Thus, the survey since then has beendone annually. However, starting this year, the implementation for twice a year survey began. The Augustemployment figures from SAKERNAS would be compared to the employment figures from SUSENAS thatwas conducted in February annually. In this way SUSENAS would manifest employment conditions in thefirst semester while SAKERNAS would reflect situation in the second semester.
Prior to 1998 the working age population was defined as those who were aged 10 years and above.Since 1998 the definition was changed to 15 years and above. The working population is classified into twoparts, namely that in the “labour force” and that “not in the labour force”. The labour force consists of thoseworking (“employed”) or looking for work (“unemployed”). For the “employed”, detailed characteristics oftheir work are collected, including hours worked, branch of economic activity, occupation, status inemployment, additional works, wages and salaries, and whether also looking for work. For the “unemployed”the questions include methods and duration of job search, whether looking for part-time or full-time work,whether previously working and terminated from their work during the crisis and for what causes, andwhether recently found a job. Socio-demographic data that are collected include age, gender, education andmarital status.
National socio economic survey (SUSENAS)SUSENAS is a multi-purpose household survey. The first SUSENAS was designed and launched in 1963
by the Statistical Research and Development Center (StRDC).10 The main objective of SUSENAS was tocollect data on demographic and socio-economic household characteristics. After 1963 the survey wasconducted regularly in 1964/1965, 1967, 1969 and 1970 with samples between 16,000-24,000 households.In all these surveys, labour force data were collected together with demographic and socio-economic dataas well as consumption expenditure. The survey temporarily stopped in 1971 with the termination of StRDCand resumed again in 1976 with the funding from the government.
In 1976 SUSENAS was conducted on quarterly basis to collect data on detailed consumption expenditure.To get seasonal consumption fluctuation the survey was implemented in four quarterly rounds. Labour forceand employment data were only collected in the fourth quarter of 1976, where the sample was enlarged to78,000 households compared to only 17,000 households in each of the previous quarters. This quarterlysurvey was repeated in 1978 with a sample of only 6,300 households per quarter.
10 A United Nations organization created to assist statistical development in BPS

Review on Labour Market Information/Decent Work Indicators in Indonesia
22
The 1978 SUSENAS included more topics, including labour force and other demographic, socio-culturaland health data, as well as data on consumption expenditure and income. In 1979 and 1980 the survey wasconducted twice each year with samples between 54,000-102,000 households to accommodate new modules.The new modules included fertility, handicraft/cottage industry, agriculture and livestock. Labour force datawere only collected in the second semester of 1980.
In 1981 SUSENAS was again conducted in quarterly basis using a sample of 15,000 households perquarter and with no questions on the labour force. Labour and employment was incorporated again in 1982with a separate sample of 60,000 households. Since then the labour force module was taken out of SUSENASand fully integrated with SAKERNAS. Consequently, the biannual 1998 SUSENAS and the yearly SUSENAS of1985-87 and 1989-91 did not contain any labour force module.
Beginning in 1992, SUSENAS was organized into two questionnaires namely a new core and a module.The design of the new SUSENAS makes it possible to link modules through the core questions. For example,through the labour force and expenditure categories in the core, labour force characteristics in the modulecould be linked to the structure of expenditure in the module. It was considered important to includeselected basic items on expenditure, causes of deaths, health, breast feeding, immunization, education,channels of communication, fertility level, family planning methods, housing materials and facilities, as wellas economic activities. The economic activities incorporated basic questions on the labour force andemployment. Some limited questions enabling the construction of labour force structure, those working andthose looking for work. For the employed the questions asked are hours worked by industry and by statusin employment.
In 1992 the sample size for the core questions was 65,600 households, which enabled estimation atnational and provincial levels. From 1993 until recently it was enlarged to 202,000 households to enableestimation at the regency/municipality levels, while the sample size for the module is 65,600 households allalong. With different modules, there must be a frame for sample selection for the module data collection.This is provided by households interviewed with the core questions comprising selected questions from themodules. From this frame a sub-sample of the core households is selected for a particular module. Accordingly,modules can be interconnected through the core questions. Therefore, from SUSENAS of 1992 through1995 only limited data on employment are available. Despite the benefits obtained from a multipurposesurvey, where a very rich information base can be obtained, the system became very complicated. Thelabour force and employment module tended to be less accurate compared to the specialized labour forcesurvey. Moreover this system made it impossible to design the same questionnaire as the one used inSAKERNAS.
After the 1997 economic crisis, SUSENAS was redesigned to simplify its operation. Only three moduleswere included. The first module, consumption expenditure is collected every three years. The second module,general information for the welfare indicators is conducted every year. The third module that was collectedevery year covers labour force and employment and is designed to be comparable to the data from SAKERNAS.
Establishment surveysBPS conducts several establishment surveys that contain data on employment. Most of these surveys
usually collect data on production cost, input and output structure, capital formation, as well as informationon business operation. Employment data are usually collected as part of the information on cost structure.Participation in the government development programs may be asked from small and householdestablishments. This is because there have been many government programs like credits and technicalassistance provided to such establishments. Establishment surveys that are currently conducted and containingemployment data include:
1. Economic Census (Sensus Ekonomi, SE)2. Directory of Incorporated Establishment (Direktori Perusahaan Berbadan Hukum, DPBH)3. Quarterly Establishment Survey (Survai Triwulanan Kegiatan Usaha, STKU)4. Small and Household Cottage Industry Survey (Survey Industri Kecil dan Kerajinan Rumahtangga,
SKKR)5. Small and Household-Establishment Integrated Survey (Survai Usaha Terintegrasi, SUSI)6. Large and Medium Manufacturing Survey (Survai Industri Besar-Sedang, SIBS)7. Hotel Establishment Survey (Survai Hotel, SH)8. Employee Wage Survey (Survai Upah Buruh, SUB)

23
Some employment data may be obtained from those surveys above. In the case of economic census,three economic censuses were done so far in 1976, 1986 and most recently in 1996 with the aim to collectdata on all economic establishments outside agriculture. Agricultural establishment data are collectedseparately in the agricultural census and surveys. The 1996 Census was conducted in stages starting in thebeginning of 1996 and attempted to integrate all establishment data collections in BPS. A limited set ofinformation was collected from all establishments, including large, medium, small and micro establishments.
Like in many other establishment surveys, employment data were collected as part of informationnormally collected from establishments including: identification and location, main activity, type of product,establishment status, value of assets, value of production, total earnings, and number of workers differentiatedbetween permanent and temporary workers.
The unit of enumeration in establishment surveys is an economic establishment.11 The respondent isusually the relevant officers who will fill out the questionnaire. Usually only cost accounting and relatedeconomic data referring to the establishment are collected. Although individual information on employeescannot be collected group characteristics of employees may be included in the survey. For example, informationon the number of employees classified by gender, education and permanent/temporary workers may beavailable.
Employee data can be related to information on establishment cost, capital and output. These data canbe segregated by gender, marital status, age group, education, and occupation group. Relating employmentdata to other costs of production makes the analysis of cost structure possible in order to see whetherlabour is fairly paid. In addition data from these surveys can be used to produce more detailed employmentdata such as in terms of sub sector and job classification. With household surveys on the other hand it mayprovide full coverage of all sectors but the sub-sectoral breakdown is limited to the 2-digit ISIC level,meanwhile occupation breakdown of the household surveys allows 3-digit ISCO level.12 Several importantestablishment surveys in relation to employment are presented below.
Large and medium manufacturing survey (SIBS)This survey is conducted every year. This survey is still routinely conducted every year. It collects more
information than what is needed for the directory. The survey covers all large and medium manufacturingestablishments.
Detailed information on the establishment includes production cost, outputs and services performed,power generation, investments, capital and assets. As part of production costs, expenditure for employeesis collected in detail, separating between production and non-production workers. Components of expendituresinclude wages/salaries, pension contributions, insurance and other allowances. Coverage depends a gooddeal on the completeness of the directory, which is updated regularly to add new establishment and removethose that closed down.13 The survey produces information for smaller sub-sectors of the manufacturingsector, up to the five-digit ISIC level. The response rate is about 85-90 percent. As the survey covers asubstantial number of establishments and the long questionnaire to be filled out, publication lags considerablybehind.
Hotel establishment survey (SH)14
The hotel establishment surveys are carried out monthly covering all provinces in Indonesia. There aretwo types of hotel surveys conducted, first the one covering stock taking and the second one concerningroom occupancy. The stock taking survey aims at constructing a hotel directory covering all classified andnon-classified hotels. This survey has been conducted every year since 1978. Stock taking survey collectsdata on the number of rooms and beds, room rates, and distance from airport, bus terminals and train
11 Establishment is defined as the smallest economic unit conducting a business activity by financing the production of goods andservices and selling them for profit or for earning.
12 However, one should bear in mind that 2 and 3 digit occupation classification data are not very reliable and seldom used. This isbecause both the interviewers and respondents are not able to interpret appropriately the detailed occupational classification.
13 A new system of directory updating was applied for Java in 1991 and outside Java in 1992. It checks the list of establishments withrecent sources from other Ministries, and the unmatched establishments are checked in the field to make sure they exist.
14 Collection of statistics for the hotel sector is based on recommendations of the World Tourism Organization (WTO) which relies on“accommodation statistics.”

Review on Labour Market Information/Decent Work Indicators in Indonesia
24
stations, as well as hotel facilities. In the past three years employment data have been grouped into moredetailed classifications by gender, citizenship, type and level of education, as well as by status (paid/unpaid).The room occupancy rate survey started in 1980 and covers all classified hotels and a sample of non-classified hotels with at least 10 rooms. This survey is conducted monthly to collect data on number ofrooms, beds, number of rooms occupied, foreign and domestic guests. It is useful to calculate occupationrate, average length of stay, number of foreign and domestic guests and average number of guests perroom. Like the large and medium manufacturing survey, these hotel surveys are continuously undertaken,and are also meant to support the updating of the directory of incorporated establishments. All hotels,including the non-classified ones (hotel melati), are included in the directory since the operation of hotelsmust be legal and licensed by the tourism office of the provincial governments.
Employee Wage Survey (Survai Upah Buruh)The employee wage survey began in 1979 in order to collect detailed information on wage development
and structure, including distribution by occupation. However, the coverage in terms of economic sectors islimited. It covers only non-oil and gas mining, manufacturing, hotels and land transportation. It was simplifiedin 1992 by dropping the question on wage by occupation and dropping the land transportation sub-sector aswell. Only average and median wage of workers under the rank of supervisor were collected. The samplesize was also reduced. The survey is conducted quarterly to enable to monitor changes in wages. Threeprovinces (Bengkulu, East-Timor and Central-Sulawesi) were not covered in this survey. Fieldwork wasundertaken quarterly in March, June, September and December every year. Only 35 establishments wereincluded in the sample of non-oil and gas mining industry, while for the manufacturing industry 667 largeand 342 medium establishments were included. Small establishments were not represented. Wage datacollected were the payments to production workers lower than a supervisor. Wages were broken down byestablishment size, gender, sub sector and capital ownership whether it is foreign, domestic or governmentowned.
Community Data SurveysCommunity data surveys provide village data collected from village officials. Similarly to establishment
surveys, employment data in community data surveys are collected indirectly through local informants.These informants provide data for particular small administrative areas (villages or sub-districts) as theunits of enumeration. Accordingly detailed household and individual employment cannot be collected. Infact community data are confined to far more aggregated information than those obtained from establishmentsurveys. Only one survey is conducted regularly by BPS, the “Village Potential Survey”.
Village Potential Survey (Potensi Desa/PODES)PODES was first introduced in 1976. Since 1980 the survey has been regularly conducted as part of a
big data collection effort, such as censuses and SUPAS and usually carried out one year prior to the bigundertaking. It is more efficient financially to conduct PODES as part of a larger national data collectionsince during mapping or listing all villages are visited. Nevertheless, in mid 1994 and 1995 Core PODESundertaking was carried out without being integrated in the census. This PODES at that time was intendedto determine the backward villages.
PODES covers all villages. In 1990, for example, there were 67,515 villages. The 1993 PODES wasconducted as part of the agricultural census and in 1996 as part of the economic census. The 2006 PODESwas conducted as part of the economic census of 2006, conducted in April 2005. The coverage of 2006PODES (as the part of the 2006 Economic Census is all villages/kelurahan or similar in Indonesia includingtransmigration settlement units and backward community settlements Pemukiman Masyarakat Tertinggal(PMT). Respondents of PODES are village heads, staffs assigned for responding to the questionnaire orrelevant resource persons. The method of PODES data collection is based on complete enumeration throughdirect interview by interviewers.
Employment data in the PODES however, is very limited. Such employment-related information onlyincludes percentages of households engaged in agriculture, manufacturing, trade, services, and others.
25
Administrative recordsAnother source of employment data is administrative records. The Ministry of Manpower and
Transmigration (MOMT) keeps records of employment and labour related data, but usually many of the dataare not processed and published. The types of data are usually depending on the function of the workingunits. For example, “job vacancies” and “job seekers” are data that are reported by the Directorate ofManpower Placement as an effort to facilitate labour market function. The Ministry also keeps records ofemployment created through government labour intensive projects (public works programs). The recordsare only kept for internal use.
The MOMT keeps records on Indonesian working abroad. Unfortunately as many Indonesian who workoverseas are illegal, the MOMT can not provide reliable data on overseas workers.
Regarding the registered job openings and people seeking work, the coverage of this segment of thelabour market is small, since not all establishments offering job openings register with MOMT. In fact, mostof them usually advertise their job vacancies publicly to reach a wider pool of job seekers. Although thelaw15 stipulates that company should report if there would be any employment change meaning the potentialjob vacancies with the MOMT, in reality only mass recruitment is usually reported to the Ministry and not allcompanies comply with the regulation. Another problem with this source of data is that not all documentsare processed, limiting further their usefulness for market-wide analysis. Moreover, companies generally shyaway from MOMT, because of its complex bureaucracy. Also highly qualified job seekers seldom registerwith MOMT; they prefer to apply directly to the desired companies.
The MOMT has been running different employment-related development programs and by law theyare required to maintain the records. Although the degree of availability and consistency of the MOMT suchdata are not systematically processed to generate regular statistics, if such data are processed, maintainedand recorded properly they would be very useful to policy makers and other users.
15 See the Act No. 7 of 1981 on “Obligation of Manpower Reporting in Enterprises”

Review on Labour Market Information/Decent Work Indicators in Indonesia
26
2.4. Characteristics of DataFrequency
In line with the Indonesian government legislations, Population Census and Inter-censal PopulationSurveys are conducted every ten years. Other surveys such as SAKERNAS (1976, 1986, to 1993) are heldquarterly or SAKERNAS (from 1994 onward) and SUSENAS are on yearly basis. Starting this year, 2005 theSAKERNAS is conducted on semester basis.
CoveragePopulation censuses (PC)
In the 1971 population census the number of household selected for “sample census” were about 3.8percents of the population. Those who were living in East Timor and isolated areas in Papua were excluded.In 1980 and 1990 the same information were collected from 5 percent of total households or about 2 millionhouseholds.
Intercensal populaton survey (SUPAS)In the first intercensal population survey which was held in 1976, there were about 60,733 households
included covering 26 provinces. The second SUPAS which was held in 1985 covered about 125,400 households.The third SUPAS which was held in 1995 covered about 206,848 households from all geographical areas inIndonesia.
National labour force survey (SAKERNAS)The SAKERNAS began in 1976. As the first labour force survey conducted by BPS, this survey was a
baseline, especially in questionnaire design which was mostly used for another similar surveys. The followingSAKERNAS were conducted in 1977, 1978, and 1986 to 1994. East Timor was excluded from the first twosurveys. The number of households which were covered in each period of the survey varied as follows:
1976 covered about 95,400 households1977 and 1978 SAKERNAS covered about 71,550 households1986 to 1993 SAKERNAS covered about 65,490 households1994 SAKERNAS covered about 65,524 households1997 SAKERNAS covered about 65,664 households1998 SAKERNAS covered about 49,248 households1999 SAKERNAS covered about 48.576 household
National socio-economic survey (SUSENAS)SUSENAS basically aims to collect data on socio-economic condition of people in Indonesia. However,
the information regarding labour force were also collected, especially in the 1982 SUSENAS when labourforce was intended to be the main module. In 1982 SUSENAS were conducted in all provinces (27) andcovered 60,400 households. Started from 1992 onward (at least until 1995) the number of householdsselected was enlarged to 206,076 in the hope that from this large survey, parameters for smaller areas(regency instead of province) can be estimated.
TimelinessAs SAKERNAS is the most important survey for employment and labour data, it is clear that the
timeliness of this survey is very crucial. The time lag between data collection and publication of the SAKERNASsurvey is about six months, sometimes beyond this duration.

27
To monitor the dynamic of employment and particularly unemployment, timeliness and frequency ofdata generation are necessary. This is the reason that this year BPS begins to conduct SAKERNAS onsemester basis. It is also important for BPS to shorten this time lag in order to make use the best of it.
VariablesTable 2.2. provides information of the variables collected in the census or survey. Despite the richness
of the variables gathered in the surveys or censuses, tabulations by age and sex are limited.
Table 2.2. Variables Collected in Population Census, Inter-censal Population Census,National Labour Force Survey and National Social Economic Survey
VARIABLE POP CENSUS SUPAS SAKERNAS SUSENAS
Sex + + + +Marital status + + + +Relation to household head + + +* +Educational attainment + + + +Main activity status during + + + +previous weekWorking at least one hour during + + + +previous weekTemporarily not working during + + + +previous weekHas ever worked + + + -Workdays/work hours of all jobs + + + +Occupation of the main job + + +* +Industrial class of the main job + + + +Employment status of the main job + + + +Work hours of the main job + + + -Work hours of the main job + + + -Workdays of the main job - - + -Average wages/salaries - - + -Seeking work + + + +Availability for work - + + -Steps taken in seeking work - + + -Length of time in seeking work - + + -Type of job sought (part/full time) - + + -Additional jobs + + +* -Workdays/work hours of all - + - -additional jobIndustrial class of the main + + - -additional jobReason for not seeking work + + - -Has worked during the + + - -previous yearIndustrial class of job during + + - -previous year
Note : *). Not Covered Before NLFS 1994 (Quarterly NLFS)Source: www.bps.go.id

Review on Labour Market Information/Decent Work Indicators in Indonesia
28
2.5. Dissemination
Generally, BPS publishes the results of their undertaking and the publications will be sent to relevantagencies particularly to government ministries. Nonetheless, the time period between data collection anddissemination is rather lengthy. It would have been much more useful if this period can be shortened. Publicmay access to the BPS publications from the library or purchase publications from the BPS book store.Limited tabulations are also presented in the BPS website www.bps.go.id. Special tabulation may be obtainedby request with fee.
The Centre of Manpower Data and Information of the MOMT maintains a website www.nakertrans.go.idthat allows people who needs data and information to access them. Apart from that, the MOMT has issuedseveral publications such as the following.
Profile of Human Resource in Indonesia (annual)Employment Situation in Indonesia (annual)Brief Information on Indonesia’s Labour Market
Although the Centre has produced the annual booklets that cover most of the administrative recordskept in the MOMT, somehow on ad hoc basis different working units in the MOMT also produces their ownpublications. The distribution of the MOMT publications is usually limited for other government offices, butby request other agencies may obtain their publication.

29
This chapter reviews the quality of employment and labour data in Indonesia as well as the availabilityof data particularly on decent work indicators. To assess such issues one needs to look at data quality interms of consistency, comparability, availability and timelyness as well as its advantages and disadvantages.The last part presents the implications of decentralization on data collection and dissemination.
3.1. Consistency and Comparability16
Different sources of employment data might result in generating data that are lack of comparability.Using the same sources of data certainly will be more beneficial in the sense that consistency and comparabilityof the statistics may be maintained. Comparisons of employment statistics sourced from different sourcesusually lead to more problems. For instance, employment data from household surveys cannot be associateddirectly with those from establishment surveys. The most determining factor is that the definition of work isdifferent in those two types of surveys. In household surveys a person is considered “working” if he worksfor at least one hour in a week. Thus a person who works for at least one hour prior to the enumeration maybe categorized as an employed person. While in establishment surveys “employed person” is of a personthat is not only defined as working in the company but also that person is on the list of company’s payroll fora certain period of time.
One should bear in mind that establishment surveys only cover persons working in establishment.Therefore, those who are working in non-establishments would not be captured in establishment surveys,yet they are captured in household surveys. Apart from that, economic sectors in establishment surveys aredetermined based on what are the types of product/output. In household surveys on the other hand,economic sectors depend on how the respondents perceive it. Thus sectoral employment levels in householdsurveys are generally higher than their corresponding sectors in establishment surveys. Moreover, a personwho works in more than one establishment may be registered more than once in an establishment survey.Meanwhile, an employed person in household surveys is determined by his/her main job.
Despite the above conceptual differences, it is not impossible to reconcile data from these sources.The best way if one of wishes to reconcile, one should start from the beginning at the planning stage.Improvement and simplification of the methodology used in both household and establishment surveys, isneeded to produce directly linkable data. It is worthwhile to look at this aspect of data consistency to makethe data more useful and applicable.
CHAPTER 3
DECENT WORK INDICATORS: DATAQUALITY AND DATA AVAILABILITY
16 This section is mainly based on Hananto Sigit, 2000. Employment Data in Indonesia.

Review on Labour Market Information/Decent Work Indicators in Indonesia
30
3.2. Advantages and DisadvantagesEstablishment household, and community data surveys have different characteristics among others in
terms of type of respondents and type of information collected. Consequently such surveys have their ownadvantages and disadvantages.
In establishment surveys information is provided by the person(s) assigned by the establishment toresponse to the questionnaire. The answers are mainly based on establishment records. Therefore, theconcepts and definitions used in this type of survey should match to those already applied in the establishments.Hence, in this type of survey one cannot ask questions directly related to individual workers. In establishmentsurveys one should not comply with the definitions and concepts of the “labour force approach”. This isdifferent from household surveys, where specific employment questions are intended to individual householdmembers based on the “labour force approach”.
Establishment surveys contain limited data on employees that may be linked to information onestablishments’ cost, capital and output. The advantages of these surveys are that they can be utilized toproduce more detailed sub-sectoral employment and job classifications. By merging employment data fromestablishment surveys with those from household surveys one most likely can obtain more detailed sub-sectoral and occupational classifications. Detailed individual data and worker’s household are available inhousehold surveys.
Changing methodology and scope causes a serious disadvantage of both establishment and establishmentand household survey that they may not be used for short term comparison. Nevertheless, maintainingconsistency of the questionnaire and methodology and if necessary adjustment be made so that the datashould be comparable is one way to overcome the problem. These would certainly improve the results formaking serial analysis.
Last but not least, administrative records are very helpful and indispensable in providing quick indicatorsfor some aspects of the labour market that are not provided by the above surveys. Even though these typesof data frequently are incomplete, they remain useful.
3.3. Decent Work Indicators: Data GapsAs we may understand that the DWIs are constructed from the available employment and labour data.
Table 3.1 below demonstrates the source and repository of the data for the Decent Work Indicators. Sevenout of the 24 indicators are obtained from the MOMT that are originated from government records such asinsurance records, or industrial relations reports within the MOMT. The rest, 17 of the Decent Work Indicatorsare obtained from the BPS mainly from the Population Census, SAKERNAS and to a little extent fromSUSENAS (Table 3.1.). It should be noted that as long as it available the indicators are expressed by age andsex.
DWI-1 Non School Participation Rate of Children 7-151990 Not available1999 National Socio-economic Survey BPS2003 National Socio-economic Survey BPS2004 National Socio-economic Survey BPS
DWI-2 Female Share of Employment in ISCO-21990 Population Census BPS
Table 3.1. Source and Repository of DWI
Title of Indicators and Information RepositoryAgency Responsiblefor Data Collectionand Dissemination
No. Year
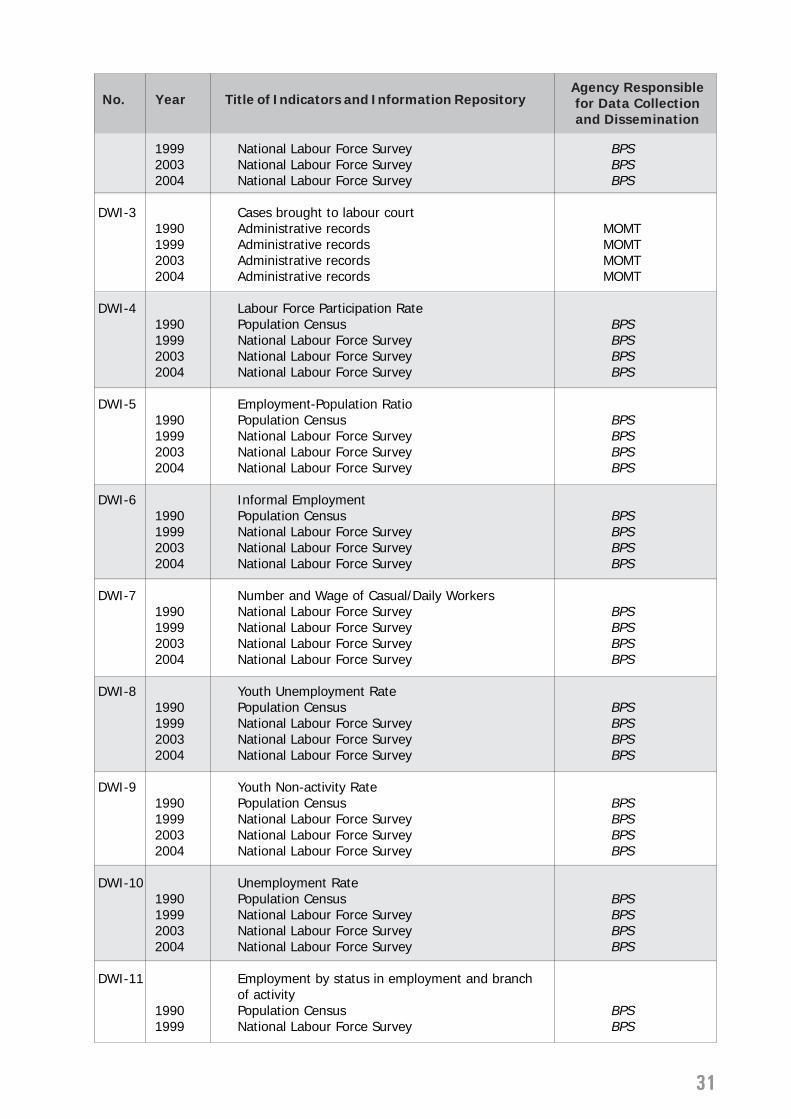
31
1999 National Labour Force Survey BPS2003 National Labour Force Survey BPS2004 National Labour Force Survey BPS
DWI-3 Cases brought to labour court1990 Administrative records MOMT1999 Administrative records MOMT2003 Administrative records MOMT2004 Administrative records MOMT
DWI-4 Labour Force Participation Rate1990 Population Census BPS1999 National Labour Force Survey BPS2003 National Labour Force Survey BPS2004 National Labour Force Survey BPS
DWI-5 Employment-Population Ratio1990 Population Census BPS1999 National Labour Force Survey BPS2003 National Labour Force Survey BPS2004 National Labour Force Survey BPS
DWI-6 Informal Employment1990 Population Census BPS1999 National Labour Force Survey BPS2003 National Labour Force Survey BPS2004 National Labour Force Survey BPS
DWI-7 Number and Wage of Casual/Daily Workers1990 National Labour Force Survey BPS1999 National Labour Force Survey BPS2003 National Labour Force Survey BPS2004 National Labour Force Survey BPS
DWI-8 Youth Unemployment Rate1990 Population Census BPS1999 National Labour Force Survey BPS2003 National Labour Force Survey BPS2004 National Labour Force Survey BPS
DWI-9 Youth Non-activity Rate1990 Population Census BPS1999 National Labour Force Survey BPS2003 National Labour Force Survey BPS2004 National Labour Force Survey BPS
DWI-10 Unemployment Rate1990 Population Census BPS1999 National Labour Force Survey BPS2003 National Labour Force Survey BPS2004 National Labour Force Survey BPS
DWI-11 Employment by status in employment and branchof activity
1990 Population Census BPS1999 National Labour Force Survey BPS
Title of Indicators and Information RepositoryAgency Responsiblefor Data Collectionand Dissemination
No. Year

Review on Labour Market Information/Decent Work Indicators in Indonesia
32
2003 National Labour Force Survey BPS2004 National Labour Force Survey BPS
DWI-12 Share of female wage employment in agriculture,industry & service
1990 Population Census BPS1999 National Labour Force Survey BPS2003 National Labour Force Survey BPS2004 National Labour Force Survey BPS
DWI-13 Labour Productivity1990 Population Census & National Accounts BPS1999 National Labour Force Survey & National Accounts BPS2003 National Labour Force Survey & National Accounts BPS2004 National Labour Force Survey & National Accounts BPS
DWI-14 Per Capita Earnings1990 National Accounts BPS1999 National Accounts BPS2003 National Accounts BPS2004 National Accounts BPS
DWI-15 Social Security Coverage1990 Insurance records MOMT1999 Insurance records MOMT2003 Insurance records MOMT2004 Insurance records MOMT
DWI-16 % Social Assistance to GDP1990 Not available1993 Government Record Ministry of Finance1999 Not available2000 Government Record Ministry of Finance2003 Not available2004 Not available2005 Government Record Ministry of Finance
DWI-17 Occupational Injuries1990 Administrative records MOMT1999 Administrative records MOMT2003 Administrative records MOMT2004 Administrative records MOMT
DWI-18 Excessive Weekly Hours of work (>45 hrs)1990 Population Census BPS1999 National Labour Force Survey BPS2003 National Labour Force Survey BPS2004 National Labour Force Survey BPS
DWI-19 Low pay rate1990 Not available BPS1999 National Labour Force Survey BPS2003 National Labour Force Survey BPS2004 National Labour Force Survey BPS
Title of Indicators and Information RepositoryAgency Responsiblefor Data Collectionand Dissemination
No. Year

33
DWI-20 Trade Union Membership1990 Administrative reports MOMT1999 Administrative reports MOMT2003 Administrative reports MOMT2004 Administrative reports MOMT
DWI-21 Number of enterprise belonging to employerorganization
1990 Administrative records MOMT1999 Administrative records MOMT2003 Administrative records MOMT2004 Administrative records MOMT
DWI-22 Collective bargaining coverage rate1990 Administrative records MOMT1999 Administrative records MOMT2003 Administrative records MOMT2004 Administrative records MOMT
DWI-23 Strikes and lockouts1990 Administrative records MOMT1999 Administrative records MOMT2003 Administrative records MOMT2004 Administrative records MOMT
DWI-24 Economic Growth1990 National Accounts BPS1999 National Accounts BPS2003 National Accounts BPS2004 National Accounts BPS
Title of Indicators and Information RepositoryAgency Responsiblefor Data Collectionand Dissemination
No. Year
Ideally there should be a balance between data needs and available resources. Yet, this is not alwaysthe case. Data must be thoroughly selected to serve the most urgent needs. Data must be produced inefficient manner in order to come up with the most relevant statistics to meet as required.
3.3.1. EmploymentEmployment and its aspects have long concerned the government of Indonesia, particularly with the
launching of the Decent Work National Action Plan in 2003. As mentioned in the previous chapter, decentwork covers not only employment creation, but also the components such as rights at work, social protectionand social dialogue. This is the reason why decent work indicators are critical to be maintained and up datedin order to monitor the progress of decent work.
3.3.1.1. Structural changesAs dictated by the DW agenda, employment, as one of the four pillars of decent work, is a very
important component. Therefore, one would agree that data on employment must be able to support theneeds to monitor its structural changes aside from its other characteristics. Monitoring structural change ismost useful particularly during the periods of economic turmoil. Employment data are also necessary toreflect short-term fluctuations. The experience of Indonesia during the 1997 economic downturn demonstrated

Review on Labour Market Information/Decent Work Indicators in Indonesia
34
that having reliable data was crucial. This is because reliable data is the basis of developing good developmentprogram. Using reliable employment data series one can see the change in employment structure, the shiftfrom one branch of economic activity to another. Also it may answer the question whether modern sectorsufficiently growing to absorb enough workers in order to reduce underemployment in both formal andinformal sector. The success of employment creation in the future is expected to drastically change thecomposition of employment status and occupation. With this in mind, it is obvious that the need for structuralemployment statistics will become higher in the future. Employment statistics need to depict at least thesestructural changes, namely in terms of branch of activity, occupation, and status in employment. In brief,employment data must therefore be maintained with further development and improvement in sustainablemanner.
3.3.1.2. Short-term trendsAs the Indonesia’s economy is dominated by agriculture, employment statistics also need to reflect
seasonal movements in such sector. Some policy questions should be answered such as is work intensity inagriculture different during peak and low seasons; does agricultural employment decline during low seasons;what sectors can absorb agricultural workers; what is the composition of formal/informal employment; areseasonal patterns different by gender, education and other characteristics of individual workers and whataspects of employment are influenced by seasonal movements.
Employment data are necessary to monitor closely the impacts of economic upheavals. It has becomeurgent to monitor the employment situation to get the answer of the level of work intensity and productivity;real wages; movement of workers from the more affected urban areas to rural areas to settle for employmentwithin the family; what sectors were hardest hit; how do households and communities respond to employmentdeterioration. During economic recoveries, such indicators are needed to address questions in the oppositedirection, such as how many people gained new employment, do people go back to same economic activity.
3.3.1.3. Unemployment and underemploymentWith the labour force approach one may classify working age population18 into employed, unemployed
and not in the labour force. The latter is then to be grouped into those still in education, households caretakers and others. In Indonesia the unemployed persons are classified into first time job seekers and thosewho are already in employment but looking for work.
Increasing unemployment level may reflect the impacts of economic crises as many people lost theirjobs. Likewise, in such economic turmoil may be manifested in increasing underemployment. Openunemployment is an important indicator to look at particularly in developed economy. In developing economieslike Indonesia apart from open unemployment, the measure of underemployment is critical as it shows thatalthough people having jobs but the jobs might not be productive.
Tracking demand and supply of labour in the modern sector is useful in understanding the mechanismof wage determination in the modern sector, which in turn influences earning levels in the informal sector.The labour market for the whole economy cannot be understood without knowing the modern labourdemand and supply.
Data on unemployment are presented in unemployment rates by age group and sex, both for generaland youth. In addition to that, data on employment to population ratio is also provided. This is due to thefact that in many countries like Indonesia it is a much better measure of employment slack.
Expressing youth unemployment rate only to illustrate unemployment among youth is not sufficient.Youth unemployment rate should be accompanied by the ratio of youth to adult, youth share in employmentand youth non-activity rate to give a better picture of youth employment. Youth non-activity rate shows thelevel of youth that are not active in the labour force. It means that the percentage of those in the age groupof 15 to 24, who are either still in school, keeping households or doing others not classified by the first twoactivities to the total youth population are classified as youth non-activity rate.

35
3.3.1.4. Informal sectorThe importance of the informal sector in providing employment for the excess supply of labour in
Indonesia can not be denied. The sector is believed to provide a “safety net” for employment by absorbingagricultural workers who migrate to urban areas or by providing jobs for those who could not find jobs in theformal sector. The informal sector has been a main part of the Indonesian economy for a long time and itseems will remain the same for a long time to come. In fact, it is difficult to measure the informal sector overtime. One should keep in mind that the indicator might be fluctuating over time. In addition, one shouldbear in mind that when it comes to decent work, informal is not always a negative sign. Something can beinformal and decent while something formal can be indecent.
Currently two sources of data are available to measure informal sector employment. The first is fromhousehold employment surveys such as SAKERNAS and SUPAS. The second comes from establishmentsurveys. Estimates of informal employment in household surveys can be approached through status inemployment as proxy. Self employed (except professionals), own account, casual workers and unpaid workersare considered as informal sector workers, meanwhile employers and employees (except agricultural labourers)are grouped as formal workers.
3.3.1.5. Wages and remunerationRemuneration is the aspect of working conditions that has the most direct impact on the day-to-day
lives of workers. Since its early days, the question of decent wage levels and fair labour remunerationpractices have been at the centre of the ILO’s action and the ILO has advocated labour standards seeking toguarantee and protect workers’ right in respect of wages. Already its original Constitution (1919) referred tothe “provision of an adequate living wage” as one of the most urgently required reforms.
Wages have obviously very different implications for employers and workers. Wages are mainly a costto employers but also a way of motivating workers. To workers, wages represent their standard of living, anincentive to acquire skills and finally a source of work satisfaction. Collective bargaining at enterprise leveland branch level, combined with national tripartite social dialogue are the best way of determining wagesand solving potential conflicts. Coordinated wage bargaining is therefore an important tool to achieve lowinflation, combined with high employment and competitiveness.
Social dialogue on wages is envisaged in various ILO instruments special attention being paid to therole of social partners in fixing of minimum wage. Minimum Wage Fixing Convention (No. 131) andRecommendation (No. 135) provide for extensive participation of employers and workers both in thedetermination of the groups of wage earners to be covered by the minimum wage fixing system and in theestablishment, operation and modification of the minimum wage fixing machinery.
ILO instruments also deal with the issue of wage protection: Protection of Wages Convention (No. 95)and Recommendation (No. 85). They also deal with protection of workers’ claims in case of their employer’sbankruptcy or judicial liquidation: Protection of Workers’ Claims (Employer’s Insolvency) Convention (No.173) and Recommendation (No. 180). Naturally, effective functioning of protective measure based on theseinstruments can be hardly imagined without social partners’ involvement.
Wage/salary/income data is important to be collected as wage/income reflects one’s welfare. Wagedata may be obtained from establishment surveys or household surveys. As establishment surveys in Indonesiaonly covers selected branches of economic sectors and only includes certain occupations of formal workers,the level of wage originated from such surveys would not reflect the general picture of workers’ income.
Wage/salary/income originated from household surveys reflects more of the real situation of wagelevel in the country. This is because the coverage of SAKERNAS, as a household survey is bigger. It includesworking household members in the sample, although it also covers unpaid workers.
Wage rate is considered as one of the indicators of decent work. Ideally, data on wages should reflectits sufficiency relative to workers’ living cost. It actually should be interpreted as “…what is the distributionof workers by wage rate?. What is the percentage of workers that receive low average wage...?”. Twoindicators on wages are presented. First, the number and wages of casual workers and secondly, thedistribution of workers that receives lowly pay rate. The recent data enables one to distinguish betweenthose casual workers employed in agriculture and those casual workers employed in non agricultural activities.

Review on Labour Market Information/Decent Work Indicators in Indonesia
36
3.3.1.6. Hours workedHours worked may reflect whether workers work normal hours or not. Excessive hours worked surely
is not acceptable without health concerns or overtime rewards. Hours worked could also be of time relatedunderemployment as well. The data are expressed in number of workers by hours worked. The latter isbroken down into 12 categories of hours worked, namely 1-4, 5-9, 10-14, 15-19, 20-24, 25-34, 35-44, 45-54, 55-59, 60-74 and 75+. These categories hopefully may serve ones’ purposes for employment analysis.
As normal working hours in Indonesia is in the range of 40 to 45 hours per week, therefore those whowork for more than 45 hours per week are considered employed with excessive working hours.
3.3.2. Social ProtectionData on social protection is essential in monitoring the DW condition. DWI on social protection is
reflected in the coverage of social security and the percentage of public social assistance to the GrossDomestic Product (GDP).
3.3.2.1. Coverage of social securityThis indicator is obtained from the MOMT that collects the information from the workers’ insurance
records that is under the jurisdiction of JAMSOSTEK, state-owned manpower insurance. However, in the lastfew years the flow of this information has not been very smooth.
The data available in the MOMT is usually presented in the number of firms participated in the socialsecurity scheme and coverage of workers in the scheme. As the scheme only covers formal workers only,the inclusion of those working in the informal sector can not be represented.
3.3.2.2. Percentage of social assistance to the GDPThis type of indicator may be obtained from the Ministry of Finance’s reports. Unfortunately this
information is not always available for public. There were three points of years where this information wasavailable in the expected form. The unavailability of such information in the past stemmed from the fact thatthe budget expenditure on “social assistance” was combined with other expenditure. It was only in the 2005APBN that expenditure on “social assistance” was separated, which allows one to obtain the data on percentageof social assistance to the GDP. As this indicator is imperative, it is wise if this format of government budgetexpenditure can be maintained.
3.3.3. Social DialogueThe component of social dialogue to be represented in four indicators, namely membership of trade
unions, number of enterprises belongs to employers’ association, coverage of company regulations andCLA, and strikes and lockouts. These four indicators are deemed sufficient to reflect the extent of socialdialogue in the work place.
3.3.3.1. Membership of trade unionThis type of data may be obtained from the MOMT as the Ministry compiles the reports from trade
unions. During the old regime under Suharto, the government only acknowledged one trade union, namely,“All Indonesian Trade Unions” (Serikat Pekerja Seluruh Indonesia/SPSI). The Indonesian government thenratified the ILO Convention No. 87 concerning Freedom of Association and Protection of the Right to Organizein 1998. Since then the number of trade unions has been on the increase. This indicator manifests not onlyfreedom of workers but also representing the extent of social dialogue at work.

37
The compilation of the membership of trade union is relatively new in Indonesia. In response to therapid increase of number of trade unions the government (MOMT) until now is still verifying their validity.Therefore the use of trade union membership as one of the indicators on social dialogue at work should beinterpreted with caution.
3.3.3.2. Number of enterprises belongs to employers’ associationILO Convention No. 87 not only concerns with freedom of association of employees/labourers but also
that of employers. There are two main employers’ organization in Indonesia, KADIN and APINDO. The latteris more a reflection of employers’ organization as it concerns more with interests of employers and labour.
The data is compiled by the MOMT which is based on the reports from employers’ organization.However, the data is presented in the form of accumulated number of enterprises. The reason is there ishardly any change in the figure of membership from year to year.
3.3.3.3. Coverage of company regulations and collective labour agreementsThis data is obtained from the MOMT that is based on the reports from companies. The Indonesian
Manpower Act No. 13 of 2003 obliges enterprise to formulate company regulation. However, enterprise thathas participated in collective labour agreement (CLA) is not required to have company regulation. Suchcompany regulation and agreements are essential to protect both workers’ and employers’ rights. Thereforecontinuity and consistency in the collection of such data are very important to be maintained in order tomonitor decent work status in Indonesia.
3.3.3.4. Strikes and lockoutsThe MOMT collects data on strikes and lockouts (there is no separation between strikes and lockouts).
There is an obligation for enterprise to report to the MOMT if they wish to conduct strike. The data aremaintained by the DG of Industrial Relations of the MOMT and regularity is well maintained.
3.3.4. Rights at WorkThere are three DWI under the rights at work, namely non-school participation of children aged 7-15
years old, percentage of women working in ISCO-2, and cases brought to labour court.
3.3.4.1. Non-school participation of children aged 7-15The official schooling age in Indonesia is seven years old. The government has been introducing nine
years compulsory education in Indonesia that applies to children aged 7 to 15. Even though it is not entirelytrue, children of this age bracket that do not participate in education school are considered to be in thelabour force. Such assumption gives the rough level of the extent of child labour.
Non-school participation of children may be obtained from the SUSENAS. The SUSENAS, a nationalsocial economic survey conducted each year, asks in its survey a question regarding education aimed atpopulation aged 5 and above. Children aged 7-15 if they are still in school would equal to those pupils inprimary and junior high school.

Review on Labour Market Information/Decent Work Indicators in Indonesia
38
3.3.4.2. Percentage of women working in ISCO-2 (ISCO-1968)17
Women in developing countries are generally working in feminine types and lower ranked occupations.This is particularly true in Indonesia. The proportion of women working in occupational major group such as“administrative and managerial workers” is usually very low. If one assumes that low proportion of womenin such occupation as an indicator of women being denied to access to high level employment and nothaving fair treatment, this indicator is useful to monitor the rights at work of women.
The second major group in the International Standard Classification of Occupations of 1968 refers to“administrative and managerial workers”. This major group includes (1) legislative officials and governmentadministrators, and (2) managers. The data may be obtained from SAKERNAS, population census, evenfrom SUSENAS. The share of women working in ISCO-2 (ISCO-rev.2, 1968) would provide an indicator ofinequality at work.
3.3.4.3. Cases brought to the committee of labour dispute settlementWhen dispute occurs and mutual agreement is not to be reached, a case can be brought to labour
court. As labour court does not yet exist in Indonesia, labour disputes are brought to committee for laboursettlements. Such a committee is called “National Committee for Labour Dispute Settlement (P4) at nationallevel, while in the regions such committee is called the Regional Committee for Labour Dispute Settlement(P4D).
In the past during centralized governance, the flow of information was relatively good, as there was anobligation for the regions to report to its central office. This included the number of cases brought to labourdispute committee in the region. Since the decentralization, the flow of data has been very lagging, if noneat all. Some regions might not send the reports to the central MOMT.
The data on this indicator is presented in the number of dispute case (also referred to as dismissalcase) and the number of workers dismissed (as decided by the committee). It should be kept in mind thatnumber of cases is not a good measure. It could be viewed as positive if case can be brought likewise fewcases brought forward could indicate tight control and not a positive sign.
To maintain the series of good DWI, one needs to ensure that regional committees report regularly tothe central office in that way consistency and continuity of data could be obtained.
3.4. Implications of Regional Autonomy on Data CollectionSince the implementation of the Act on Regional Autonomy No. 22 of 1999, which then revised by the
Act No. 32 of 2004, regions have the rights to carry out their own activities, except in certain fields.18
Technical ministries including the MOMT therefore no longer have vertical coordination with their relatedoffices in the regions. The management of regional offices was transferred to the regional governments.Although regional autonomy might bring betterment to the regions, but to a certain extents some activitieswill suffer. For example, maintaining the continuity and consistency of data flow particularly regardingadministrative records that are entirely dependent on the regions’ willingness to regularly sending theinformation is very crucial. As DWI is originated from censuses, surveys and administrative records, thediscussion will highlight such impacts.
17 Similar major group of occupation in ISCO-1988 would be group ISCO-1 that includes legislator, manager and other high rankingoccupations.
18 These fields cover foreign politics, defense, security, justice, monetary and national fiscal as well as religion (see the Act No. 32 of2004).

39
Labour Market Information at Regional LevelIdeally BPS should also be able to provide labour market information at regional levels. The publications
of the results of censuses, intercensal population surveys, SAKERNAS and SUSENAS provide employmentinformation tables at the provincial level, unfortunately not at the district level. Regional offices except thatof BPS generally do not yet have the expertise to produce similar tables at the district level. They lack readilyavailable labour market information that may help them negotiate minimum wage levels, assess skill shortageand surpluses in their region, and feed basic labour market information to employers and job seekers as wellas to education and training providers. It is therefore very crucial that the BPS and employment-concernedgovernment agencies should make attempts to focus on producing estimates at the provincial and districtlevel.
Apart from that, in the aftermath of the financial crisis and, followed with the implementation ofregional autonomy, the budget of CBS and thus the sample size of the SAKERNAS survey were drasticallyreduced. Beginning in 2000, BPS was not able to produce its usual tables even at the provincial level.Tabulations for provinces were replaced by those tables of the island level. With the improving economicsituation of the country, the sample size returns to normal.
An attempt to obtain labour market information data at district levels was pursued by the MOMT in1990. The MOMT allocated part of its budget on a pilot basis for labour force survey to several provinces inthree or four of its district offices to produce a district level of information. Such labour force survey wasreferred to as SAKERDA (regional labour force survey). A ccollaboration with BAPPENAS as well as BPS wasdone, although the major player was the MOMT. This initiative was discontinued due to budget constraintapart from lack of technical expertise. The MOMT should concentrate on data analysis, and should leavedata production, processing and publication to the competent authority that is BPS district office, under thesupervision and coordination of the national BPS.
Data Collection through Censuses and SurveysUntil now, the production of statistics is still highly centralized. BPS still continues to produce national
and regional statistics. As SAKERNAS is the only source of employment data that maintain its continuity andconsistency, its undertaking should always be maintained if not improved. However, because the number ofsample applied in SAKERNAS is relatively small, employment data could not be used for lower administrativelevels such as district levels.
With regional autonomy is taking place the needs of regional employment data particularly in order tomonitor DWI seems very substantial. Data at both provincial and district levels could be relied on if thesurveys are based on larger sample. It is recommended that the government needs to consider expandingthe SAKERNAS to the extent that it may capture the labour market down to district levels. The availability ofregional data would be very useful to the regional government in planning and implementing its variousdevelopment programs.
Data Collected through Administrative RecordsAdministrative records are maintained by the technical ministries. Data on employment and labour are
maintained by the MOMT. In the past the flow of data from the regions to the MOMT was relatively smootheven though timeliness sometimes could not be maintained, particularly for outer islands.
Since the regional autonomy took place, some technical ministries such as MOMT no longer have itsregional offices. Employment and labour related issues are taken care by the Office of Employment underthe auspices of the regional government. In many cases this employment office does not send their data orinformation to the central MOMT as they are not obliged to do so. Apart from that some of the ManpowerOffices in the regions are being managed by person that do not have employment and labour background.Thus it is not surprising that the officials do not have good knowledge of importance of employment andlabour-related data. Lack of awareness of data value and no obligation to send data to the central are thechallenges that one has to face in attempting to establish good and reliable DWI.

Review on Labour Market Information/Decent Work Indicators in Indonesia
40
ConclusionSo far the chapter has reviewed data consistency, comparability, and data gap to formulate DWI. There
is a need to increase awareness on the importance of data particularly to the regional government levels. Inthis way even though regional government is not obliged to send their information data to central office,with increasing awareness they would do it voluntarily.
The availability of rich data collected by the BPS should also be combined with the strength of the BPSand the MOMT in terms of analytical capacity. It seems that analysis is rather weak in both institutions.There is a need to be an increase focus on regular and routine analysis.

41
The current chapter reviews the mechanism of coordination for data collection and disseminationwithin the MOMT as well as outside the MOMT. The MOMT is the technical government ministry responsiblefor employment and labour including decent work indicators. To understand the existing mechanism ofcoordination for the LMI including DWI in the MOMT, one needs to understand the locale of the working unitresponsible for the LMI within the MOMT, to identify who are the main partners of the MOMT in datacollection, types of data collected and the main users. Then it is followed by reviewing the internal linkagebetween different working units within the ministry and the external linkage concerning labour marketincluding decent work indicators.
4.1. Existing Mechanism of Coordination of LMI/DWIin the MOMT
This section presents the locale of the agency responsible for the data collection, working partners,type of data collected, main users and the existing both internal and external linkages of the MOMT.
4.1.1. Locale of the Responsible Agency for DWI in the MOMT
Under its jurisdiction, the MOMT has responsibilities that are reflected in the existence of its nine (9)first echelon working units. One of these first echelon working units in the MOMT is the Board of Research,Development and Information.
According to the Presidential Decree this Board is assigned to conducting applied research anddevelopment and to manage data and information on manpower and transmigration (see Chapter 2 for thedetailed function). The Minister of Manpower’s Instruction No. 1 of 2001 stipulates that the Board of Research,Development and Information is the agency that manages the Ministry’s website: www.nakertrans.go.id.There are two centres of information within this Board, one is the centre of manpower information and theother one is the centre of transmigration information. As labour market information vis-à-vis decent workindicators is mainly related to employment and labour-related issues, therefore by legislation the agencyresponsible for management and dissemination of manpower information is the Centre of ManpowerInformation.
CHAPTER 4
EXISTING MECHANISM OFCOORDINATION FOR LABOUR MARKETINFORMATION/DECENT WORK INDICATORS

Review on Labour Market Information/Decent Work Indicators in Indonesia
42
4.1.2. Main Users of LMI and DWI
Main usersThere are four main users of LMI including DWI namely (1) job seekers (2) employers (3) trade unions
and (4) policy makers and labour market analysts. All users of LMI have something in common. They needinformation on labour market including decent work condition. However, the types of information users areinterested in, might be different from one user to another. The table below briefly show the types of datarequired by users.
Information needs of DWI usersThe table below briefly shows users have different needs of information. Job seekers might have
interests on job vacancies and occupation perspective, while employers might be more interested in lookingat legislated minimum wage, or collective labour agreements.
Table 4.1: Type of Information Needed by Users
USERS
Job Seekers
Employers
Trade Unions
Policy makers and labourmarket analysts
INFORMATION NEEDS
Vacancies for job seekers byOccupation and experience required,Industry and locationSalary and other benefits and career prospects.Employment opportunities in other regions and abroadCareer guidance and counselling for studentsPromising occupations: length of education and training, level ofdifficulty, salary, career prospects. Special training e. g. computerskills and language
Economic performanceMinimum wagesSkillsLabour MarketMarket wage for unskilled, semi skilled and skilled labourMinimum wage and workers cost of livingCollective bargainingCompany regulations
Minimum WagesAverage wagesMembership of trade unionsCompany regulations and Collective labour agreements (CLA)Strikes (location, frequency, duration, working hours lost, materialloss)
Trend of labour marketTrend of DWIEmployment OpportunitiesUnemployment, andOther employment and labour-related information

43
4.2. Linkages
4.2.1. Internal Linkage
To achieve its objective, which is to manage the MOMT’s data collection and dissemination, the Centreof Manpower Information maintains a strong and close linkage with other working units within the Ministry.The main working partners of the Centre of Manpower Information within the MOMT are all working unitsinvolved in data/information.
Structurally, each first echelon working unit such as Directorate General or Board has an organicstructure termed as the PEP (Program, Evaluasi dan Pelaporan). This PEP is obliged to compile data andrecords from that can be from the regions (provinces/districts) or administrative reports from its constituents.19
In the past PEP received administrative data from provincial levels that acquired such administrativedata from district levels. Those administrative data and information compiled by PEP would then be deliveredto the Centre of Manpower Information. The latter will manage and process those data and information intopresentable format.
To re-affirm the mandate of the Centre of Manpower Information, the MOMT has also established“Team of Information Management” chaired by the Chairman of Board of Research, Development andInformation (BALITFO), with the membership from all the secretariats (normally represented by the PEP) ofeach first level echelon. The team has a mandate to implement the tasks through a decree issued by theChairman of the Board of Research and Information. The Centre of Manpower Information is not only incharge of data management in the MOMT. Its mandate includes data management for the MOMT’s website.
Although in the past data were not systematically generated, such data still contained consistency andregularity. With the implementation of the regional autonomy, however, the regions do not have the obligationto send data and information to the central government. In summary, the MOMT is no longer receivingregular data from the regions. This has been a disadvantage as the MOMT could not monitor the DWI inregular and consistent manner and data reliability is also questionable.
Types of data compiled by the Centre of Manpower InformationThe types of data compiled by the Centre of Manpower Information reflect the tasks and functions of
each directorate generals within the MOMT. It is understood that each directorate general has its specificfunctions and tasks. Consequently, the data and information gathered by each directorate general wouldreflect its responsibility. For example, data on manpower placement and employment service are compiledby the directorate general of domestic manpower placement. Meanwhile, data on strikes and lockouts aredrawn together by the directorate general of industrial relations (Table 4.2.).
19 PEP should write the reports of all the implementation of programme and activities of its respective first echelon working unit. ThePEP thus acts as the liaison point with the Centre of Manpower Information.

Review on Labour Market Information/Decent Work Indicators in Indonesia
44
Method of data/information deliveryThe method of data/information delivery from each directorate general to the Centre of Manpower
Information may vary. The delivery can be done through email, office courier, or data might be presented inthe forms of either quarterly or annual reports. Occasionally however, staffs of the Centre of ManpowerInformation may pick up the data themselves, for instance data on remittance of the Indonesian workingabroad.
The frequency of data collection by the Centre of Manpower Information is normally on quarterly andyearly basis.
4.2.2. External LinkageIn carrying out its tasks and function, the centre of manpower information establishes a strong and
close relationship with the BPS. This stems from the fact that by legislation the BPS is the only agency in thecountry that collects and disseminates basic and general data and information including of those of labourand employment.
When the MOMT is to conduct survey it has to coordinate with the BPS for its expertise and legality.Likewise, when the BPS conducts its undertakings such as censuses or surveys, BPS will seek views and
DIRECTORATE GENERAL
DG of Domestic Placement
DG of Labour Standards
DG of Industrial Relations
DG of Overseas Placement
DG of Training andProductivity
TYPES OF DATA
Registered Job seekers
Registered job vacanciesRegistered job placementForeign workersWork AccidentsProvincial Minimum wage
Minimum wageMinimum Living NeedsCoverage of Social SecurityCompany regulation and CLAStrikes and lockoutsNumber of Trade Unions andmembershipEmployers’ organization and numberof employers belong to employers’association
Number of people working overseas bydestination and by place of originRemittance of workers
Job seeker training *
Apprenticeship trainingNumber of instructors
ORIGIN OF DATA
Companies’ report based on ActNo. 7 of 1981
Report from labour inspectorReport from the respectivedirectorate
Report from the respectivedirectorateReport from the respectivedirectorate
Report from the respectivedirectorate
Report from the respectivedirectorateBy trade
By province
Table 4.2: Types of Employment and Labour-Related Data Collected by theDirectorate Generals within the Ministry of Manpower and Transmigration
Note: * Since the regional autonomy took place most of the vocational training centres weretransferred to the regional governments.

45
feed back from the relevant technical ministries through meetings and discussions. Such meetings anddiscussions may range the formulation of questionnaire, types of variables to be included and presentationof the results and others. In the case of labour force surveys the most relevant ministry to be sought forinputs would be the MOMT. Normally some representatives from the MOMT will attend the meetings andraise their views and suggestion on the relevant issues for the usefulness of the surveys/censuses to users.
A collaboration work is also established between the Centre of Manpower Information and the BPSbased on the Minister of Manpower and Transmigration’s decree. Such collaboration includes the MOMT’spublication namely “Employment Information Brief” and the “Profile of Indonesian Human Resource”.
Aside from the linkage with BPS, relationships with other government ministries/agencies are alsomaintained although mostly in ad-hoc manner. For example, the Centre of Manpower Information buildscooperation with Bank of Indonesia.
Besides this, external linkages are also present through a number of working teams or committees. Forexample, several working teams or committees that currently exist are the Manpower Planning Team, theWage Council, Training Commission and others. These teams or working committees normally comprise ofrepresentatives of tripartite plus, and to a certain extent also include relevant technical agencies, and existat the national and regional levels. For instance, the so-called “Regional Manpower Planning Team” issupposed to exist in every provincial and district levels. The team normally led by representative of manpoweroffice in the region, and comprises of representatives of regional development agency, statistic office, otherrelevant technical offices (industry, trade, agriculture and others) as well as employers and trade unions.
With the existence of several working committee on labour and employment-related issues might bean advantage as they may be used as the means of data collection and updating. The Manpower PlanningTeam is particularly very relevant to be considered.
Existing linkages to the ILO for data reportsThe MOMT also maintains an external linkage. It is generated by its obligation for data reporting to the
ILO. The existing reporting system to the ILO is based on the mandate of each working unit in the organizationof the MOMT.
According to the legislation on the MOMT organization structure, the Centre of Administration forForeign Relations20 is the agency that is supposed to conduct foreign relation (bilateral or multilateral).Because of its mandate, this centre by regulation is responsible for providing data or information required byinternational agency such as the ILO.
To provide data reports to the ILO thus far is carried out through coordination of the Centre ofAdministration for Foreign Relation with other relevant working units in the MOMT. The report to the ILO isusually submitted every year.
4.3. ChallengesThe previous chapter (Chapter 3, Section 3.4.) touches upon the MOMT’s challenges in sustaining data
collection in reliable manner particularly after the regional autonomy took place. What should one do toovercome this challenge?
With the decentralization policy, the agency in the regions that is responsible for employment andlabour matters is the Office of Manpower. This office is under the auspices of the respective regionalgovernment. Unfortunately, the organization structure of manpower office differs from one region to another.In some regions the portfolio of employment and labour matters is managed at the office level (dinas), insome other regions its portfolio is only managed at the lower level, sub-dinas. There is no standardizedorganization structure of manpower office in each region. The office that manages solely labour andemployment matters means that the office has its own portfolio and a higher authority level. In other cases,the labour and employment portfolio is merged with others thus downgrading the importance of labour and
20 This centre of administration of foreign relations is under the supervision of the Secretariat General of the MOMT

Review on Labour Market Information/Decent Work Indicators in Indonesia
46
employment issues.
Along with the process of decentralization the re-structuring regional government organization hasalso taken place. This included re-structuring its government personnel. It was fortunate, if officials wererelocated to similar fields of responsibility. Unfortunately this was not always the case. For example, someformer manpower officials were relocated to different fields or different ministries. Likewise, some officialswith no background of labour and employment technical skills were relocated to manpower offices. As aconsequence, a number of the current manpower offices are being managed by officials who do not haveany employment and labour-related background. Such circumstance to a certain extent has caused adverseimpacts on the operation of the office as well on the implementation of their tasks and functions.
During the centralized government the central manpower offices, like other technical ministries, hadinvested in human development substantially. The regular provision of technical skills for officials in thecentral offices was regularly conducted in order to enhance the working performance of the implementingofficials. Similarly, regular and frequent skill training for officials in the regions was also carried out by thecentral offices. Socialization on various issues and policies on labour and employment was regularly conductedin order to reach similar perceptions and standard level of competency.
Considering the current situation it seems that the obvious challenge concerning the updating oflabour market information vis-à-vis decent work indicator is the needs of improving the skills. Thus, to raisethe awareness of the manpower officials not only with regard to labour and employment problems but theultimate knowledge of the importance of data is indeed imperative. From there on, knowledge of theimportance of LMI and DWI as well as the need of monitoring such indicators should well be introduced,which then technical skills could also be delivered.
ConclusionAlthough structurally the working unit that has the mandate of data collection and dissemination in the
MOMT is well placed, some problems seem to appear. Such problems are particularly related to theconsequences of the implementation of regional autonomy, as regional governments do not oblige to reportto the central offices.
Some remedies need to be taken up in order to sustain the information flow. Such steps may coverawareness raisings, capacity building and strengthening the existing regional councils or committees.Recommendation of the mechanism of coordination in particular related to the labour market informationand decent work indicators is presented in separate chapter.

47
5. 1. ConclusionLabour market information is involved with data on labour supply and demand as well as the
characteristics of employment and unemployment. Decent work indicators, on the other hand cover morethan labour market information, as DW includes other labour related information that are not usually coveredin LMI such as social dialogue, social protection and rights at work. Decent work is the ultimate goals of theILO. Thus, to large extent, DWI reflects more employment and labour issues than LMI.
The MOMT is the technical ministry that is responsible for producing LMI and DWI, the relevant agencyfor this is the Centre of Manpower Information. The Centre is by function is responsible for data collectionand dissemination.
The existing system of coordination of data collection for potential LMI and DWI data base is relativelygood. Although the existing system is well established, the skills of regional officials in charge are lacking.Thus, efforts are required to enhance their skills.
The establishment of a set of 24 DWI in Indonesia is feasible. Some indicators are easily establishedwhile some indicators require extra efforts. DW indicators are obtained from census, surveys as well asadministrative records that originated from the BPS and from the technical ministry particularly the MOMT.
Since the implementation of regional autonomy the flow of data from the regions is not as smooth asit was in the past. Consequently, the sustainability of maintaining DWI particularly those data that are drawnfrom administrative records suffers. There should be attempts to recover this situation.
5.2. RecommendationAs the existing mechanism of the coordination is structurally well placed, what seem lacking are
sufficient skills of those who manage data collection and dissemination particularly in the regions. Thus, tosustain the coordination system from the relevant working unit or agencies to the MOMT concerning datacollection of LMI and DWI may be undertaken through the following agenda.
Capacity building of the relevant officials should be put as a high priority. This is particularly true withthe new organization structure of the regional offices. There is also high possibility that some officialsare lacking technical expertise in labour and employment field, thus the needs of skills upgrading inmaintaining LMI and DWI data base are critical.Skills are needed in the area of management of LMI and DWI database. Technical skills in methodologycovering concept and definition, methods of data collection, labour market analysis and formulation ofdecent work indicators and other technical knowledge are also important. In this regard, technicalassistance from the ILO as a UN agency specialized in labour, employment and social issues would bevery beneficial.Technical assistance from the ILO would be useful in order to support the development of labour forcesurvey that allows employment analysis down to lower government administrative levels such askabupaten and kecamatan. Good quality and large sample would be very valuable as the basis formaking sound and good employment policies.
CHAPTER 5
CONCLUSION ANDRECOMMENDATION

Review on Labour Market Information/Decent Work Indicators in Indonesia
48
Strengthening the working relationship between manpower office, regional planning agency (BAPPEDA)and the statistics office in the region should be attempted.A regional working team needs to be considered. Such a team should discus and work on employmentand labour issues including LMI and DWI. Its membership may cover representatives of the mainworking partners namely manpower office, regional development planning agency and statistic officeas well as other representatives from the technical offices (industry, agriculture, trade and others) anduniversity.There is a possibility that some regions have already had a Regional Manpower Planning Team (TimPerencanaan Tenaga Kerja Daerah/PTKD). As the PTKD team normally consists of the suggestedrepresentatives, therefore the region might consider including LMI and DWI management in the agendaof the PTKD team.

49
Anker, Richard. 1998. “Gender and Jobs: Sex segregation of occupations in the world”. Geneva, ILO.
Anker, Richard. 2001. “ILO Multi-country databases, ILO, Geneva
BPS, 1976. “Population of Indonesia, Results of the 1975 Intercensal Population Survey”, Jakarta, Indonesia.
BPS, 1986. “Population of Indonesia, Results of the 1985 Intercensal Population Survey”, Jakarta, Indonesia.
BPS, 1996. “Population of Indonesia, Results of the 1995 Intercensal Population Survey”, Jakarta, Indonesia.
BPS, 1993. “Several manuals and questionnaires for the Agricultural Census and Surveys.” Jakarta, Indonesia
BPS, 1993. “Survai Pendapatan Petani 1990, results of survey.” Jakarta, Indonesia
BPS, 1994. “Statistik Industri Kecil 1993, results from SKKR.” Jakarta, Indonesia.
BPS, 1994. “Statistik Industri/Kerajinan Rumahtangga, results from SKKR.” Jakarta, Indonesia.
BPS, 1995. “Struktur Ongkos Usaha Tani Padi dan Palawija, 1993.” Jakarta, Indonesia.
BPS, 1996. “Pedoman Pelaksanaan Lapangan Direktori Perusahaan, Sensus Ekonomi.” Jakarta Indonesia.
BPS, 1996. “Pedoman Teknis Kantor Statistik Propinsi dan Kabupaten/Kotamadya, Sensus Ekonom.” JakartaIndonesia.
BPS, 1996. Various publications of the results from the agricultural census and surveys covering differentsub-sectors and subjects. Jakarta, Indonesia.
BPS, 1998. Laporan Survai Dampak Krisis Pada Tingkat Kecamatan di Seluruh Indonesia, in cooperationwith Forsd Foundation and the World Bank, Jakarta Indonesia.
BPS, 1998. Profil Usaha Kecil dan Menengah Tidak Berbadan Hukum, Sektor Industri Kecil dan Rumahtangga1998, Indonesia, Jakarta, Indonesia. Also publications for other sectors.
BPS, 1998. Several manuals and questionnaires on different subjects from the Crisis Impact Survey, Jakarta,Indonesia.
BPS, 1998. Statistik Upah Triwulanan, and several quarterly publications for several years, Jakarta Indonesia.
BPS, 1998. Survai Usaha Terintegrasi, Panduan Pengawas/Pemeriksa (PMS), Jakarta, Indonesia, September1998. Also other publications on manual for Heads of Provincial and Regency/Municipality StatisticsOffices.
BPS, 1999. Keadaan Angkatan Kerja di Indonesia, August, 1999, Jakarta Indonesia.
BPS, 1999. Laporan Survai Dampak Krisis Pada Tingkat Kecamatan di Seluruh Indonesia1998, cooperationbetween and Ford Foundation and World Bank.
BPS, 1999. Several publications on results of the Crisis Impact Surveys, Jakarta, Indonesia.
BPS, 1999. Statistik Kesejahteraan Rakyat 1999, Jakarta, Indonesia, February 1999. Also previous publicationsof SUSENAS for the years 1992-1998.
BPS, 1999. Survai Angkatan Kerja Nasional (SAKERNAS), 1999, Pedoman Pencacah, Jakarta, Indonesia.Also previous interviewers manual for several years.
BPS, 1999. Survai Usaha Terintegrasi 1999 (SUSI99), Pedoman Pengawas/Pemeriksa, Jakarta, IndonesiaJuni 1999. Also publications on interviewers manual and manual for Heads of Provincial and Regency/Municipality Statistics Offices.
Ghai, Dharam. 2003. “Social security: Learning from global experience to reach the poor”, in Journal ofHuman Development (New York), Vol. 4, No. 1, pp. 125-150.
REFERENCES

Review on Labour Market Information/Decent Work Indicators in Indonesia
50
Ghai, Dharam. 2003. “Decent Work: Concept and Indicators.” International Labour Review Vol. 142 No. 2.Geneva.
ILO, 1990. Surveys of Economically Active Population, Employment, Unemployment and Underemployment,an ILO manual on concepts and methods, ILO-Geneva, 1990.
ILO, 1998. Employment Challenges of the Indonesian Economic Crisis, UNDP, Jakarta, Indonesia, June1998.
ILO. 2000a. Report of the Director-General: Your voice at work – Global Report under the Follow up to theILO Declaration on Fundamental Principles and Rights at Work. International Labour Conference, 88thSession, Geneva.
ILO. 2000b. Organization, bargaining and dialogue for development in a globalizing world. Document of theGoverning Body’s Working Party on the Social Dimension of Globalization, GB.279/WP/SDG/2. Geneva.November.
ILO. 2001. The size of the working poor population in developing countries. Employment Paper No. 2001/16. Employment Sector. Geneva.
ILO. 2002. Report of the Director-General: A future without child labour – Global Report under the Follow-up to the ILO Declaration on Fundamental Principles and Rights at Work. International Labour Conference,90th Session, Geneva.
ILO. 2004. “Yearbook of Labour Statistics.” Geneva.
ILO. 2005. “Yearbook of Labour Statistics.” Geneva.
Jose, A.V. (ed.). 2002. Organized labour in the 21st century. Geneva, International Institute or LabourStudies.
Kucera, David. 2001. The effects of core worker rights on labour costs and foreign direct investment:Evaluating the “conventional wisdom”. Discussion Paper No. 130. International Institute of LabourStudies. Geneva
Merhan, Farhad. 2000. “ILO labour force participation rates for 10-14 years old versus UNESCO schoolenrolment ratios”, in Bulletin of Labour Statistics, No. 3, pp. xi-xx. Geneva
Ministry of Manpower and the ILO Jakarta. “The Ratified Eight ILO Core Conventions and Seven GeneralConventions.” Jakarta. Indonesia
Republic of Indonesia. “Act No. 7 of 1960 on Statistics.” Jakarta. Indonesia
Republic of Indonesia. “Act No. 7 of 1981 on “Obligation of Manpower Reporting in Enterprises.” Jakarta.Indonesia
Republic of Indonesia. “Act No. 16 of 1997 on Statistics.” Jakarta. Indonesia
Republic of Indonesia. “Act No 101 of 1998 on The Organization and Task of College for Statistics.” Jakarta.Indonesia
Republic of Indonesia. “Presidential Decree No. 163 of 1998 on College for Statistics.” Jakarta. Indonesia
Republic of Indonesia. “Act No. 22 of 1999 on Regional Autonomy.” Jakarta. Indonesia
Republic of Indonesia. “Government Regulation No. 51 of 1999 on Statistics Undertakings.” Jakarta. Indonesia
Republic of Indonesia. “Presidential Decree No. 166 of 2000 on Status, Task, Function, Authority, andOrganizational Structure of the Non-Ministrial Government Institution.” Jakarta. Indonesia
Republic of Indonesia. “Presidential Decree No. 178 of 2000 on Organizational Structure and Task of theNon-Ministrial Government Institution.” Jakarta. Indonesia
Republic of Indonesia. “Act No. 001 of 2001 on the Organization and Task of the BPS.” Jakarta. Indonesia
Republic of Indonesia. “Act No. 13 of 2003 on Manpower.” Jakarta. Indonesia
Republic of Indonesia. “Act No.32 of 2004 on Regional Government.” Jakarta. Indonesia
Sigit, Hananto. BPS, 1991. Pelatihan Petugas Pengumpul Data Statistik Distribusi 1991, Pedoman PencacahanStatistik Perhotelan, Jakarta, Indonesia.
Sigit, Hananto. 2000. “Employment Data in Indonesia: A Review of Existing Source.” STAT Project USAIDReport No. 5. Jakarta. Indonesia