iucrjjournals.iucr.org/m/issues/2014/06/00/fc5004/fc5004sup1.pdf · hours in air and the copper was...
TRANSCRIPT

IUCrJ (2014). 1, 382-386, doi:10.1107/S2052252514020181 Supporting information
IUCrJ Volume 1 (2014)
Supporting information for article:
Location of Cu2+ in CHA zeolite investigated by X-ray diffraction using the Rietveld/maximum entropy method
Casper Welzel Andersen, Martin Bremholm, Peter Nicolai Ravnborg Vennestrøm, Anders Bank Blichfeld, Lars Fahl Lundegaard and Bo Brummerstedt Iversen

IUCrJ (2014). 1, 382-386, doi:10.1107/S2052252514020181 Supporting information, sup-1
S1. Materials preparation
The CHA zeolite was prepared from a reaction synthesis gel with the following composition:
1.0 SiO2 : 0.033 Al2O3 : 0.5 TMAdaOH : 0.5 HF : 3 H2O
in a method very similar to the one reported earlier where TMAdaOH is the template N,N,N-
trimethyladamantammonium hydroxide (Diaz-Cabanas & A. Barrett, 1998, Eilertsen et al., 2012).
The same preparation was also used in the study reported by Giordanino et al. (2013) For the specific
synthesis, a gel was made using aluminum isopropoxide (> 98 %, Aldrich), tetraethyl orthosilicate (>
99 %, Aldrich), template solution (25 wt. %, Sacchem INC), and hydrofluoric acid (48 wt. %, > 99.99
%, Sigma-Aldrich). To obtain the CHA zeolite the gel was crystallized for 3 days at 150°C in
autoclaves under rotation (approx. 30 rpm). The template was removed by calcination at 580°C for 3
hours in air and the copper was then introduced by aqueous Cu2+
ion-exchange using copper(II)acetate
and further calcined at 500°C in air for 3 hours in order to remove residual acetate ligands. The
expected Si/Al-ratio is approx. 15. From chemical analysis the Si/Al-ratio is found to be 15.5(8).
Zeolite powders were loaded into glass capillaries and dehydrated in air for 1 hour by a slow ramp to
300°C and sealed at the same temperature. The result from the dehydration technique can be seen in
Figure S1, where the dehydration of Cu-SSZ-13 (Cu-CHA), Cu-ZSM-5, and Cu-BEA samples are
shown before and after. From this a qualitative check may now be performed based on coloration to
see whether the sample is dehydrated or not.
Figure S1 Pictures of different Cu ion-exchanged zeolite samples hydrated (left) and dehydrated
(right). Notice the blue color of the dehydrated samples, especially the Cu-SSZ-13 (Cu-CHA) zeolite.

IUCrJ (2014). 1, 382-386, doi:10.1107/S2052252514020181 Supporting information, sup-2
S2. Rietveld refinements
The chosen unit cell is hexagonal with space group 𝑅3̅m. Furthermore, the occupancies of all sites are
fixed. For the T site (Si/Al) the occupancy was calculated using the relative concentration Si/Al =
15.5(8). Isotropic thermal vibration parameters, Uiso, for the oxygen atoms were refined as a single
parameter. It was attempted to refine all sites using anisotropic thermal vibration, but the refinement
only became physically correct if the anisotropy was limited to the T site. The Lorentzian peak profile
parameter Y was fixed to 0. Furthermore, Bérar-Baldinozzi asymmetry was applied (Berar &
Baldinozzi, 1993).
Figure S2 Rietveld refinement of H-CHA.
5 10 15 20 25 30 35 40 45
0
2
H-CHA
Inte
nsity (
A.U
.)
2 (°)
Yobs
Ycalc
Yobs-Ycalc
Bragg
30 35 40 45
0.04
0.05
0.06
0.07

IUCrJ (2014). 1, 382-386, doi:10.1107/S2052252514020181 Supporting information, sup-3
Figure S3 Rietveld refinement of Cu-CHA using only the framework.
5 10 15 20 25 30 35 40 45
0
5
10
Cu-CHA - Framework
Inte
nsity (
A.U
.)
2
Yobs
Ycalc
Yobs-Ycalc
Bragg
30 35 40 45
0.06
0.07
0.08
0.09
0.10
0.11

IUCrJ (2014). 1, 382-386, doi:10.1107/S2052252514020181 Supporting information, sup-4
Figure S4 Rietveld refinement of Cu-CHA using the framework and Cu2+
sites A’ and B.
5 10 15 20 25 30 35 40 45
0
5
10
Cu-CHA - A' + B
Inte
nsity (
A.U
.)
2 (°)
Yobs
Ycalc
Yobs-Ycalc
Bragg
30 35 40 45
0.06
0.07
0.08
0.09
0.10
0.11

IUCrJ (2014). 1, 382-386, doi:10.1107/S2052252514020181 Supporting information, sup-5
Figure S5 Rietveld refinement of Cu-CHA using the framework and Cu2+
sites A and B.
5 10 15 20 25 30 35 40 45
0
5
10
Cu-CHA - A + B
Inte
nsity (
A.U
.)
2 (°)
Yobs
Ycalc
Yobs-Ycalc
Bragg
30 35 40 45
0.06
0.07
0.08
0.09
0.10
0.11

IUCrJ (2014). 1, 382-386, doi:10.1107/S2052252514020181 Supporting information, sup-6
Figure S6 Rietveld refinement of Cu-CHA using the framework and Cu2+
sites A, A’, and B.
5 10 15 20 25 30 35 40 45
0
5
10
Cu-CHA - A + A' + B
Inte
nsity (
A.U
.)
2 (°)
Yobs
Ycalc
Yobs-Ycalc
Bragg
30 35 40 45
0.06
0.07
0.08
0.09
0.10
0.11

IUCrJ (2014). 1, 382-386, doi:10.1107/S2052252514020181 Supporting information, sup-7
Figure S7 Structural models of Cu-CHA using the framework and Cu2+
sites B (lime) and (left) A’
(orange) or (right) A (cyan).
Figure S8 Structural model of Cu-CHA using the framework and Cu2+
sites A (cyan), A’ (orange),
and B (lime). Notice sites A and A’ have been depicted in separate double 6-rings.
IUCrJ (2014). 1, 382-386, doi:10.1107/S2052252514020181 Supporting information, sup-8
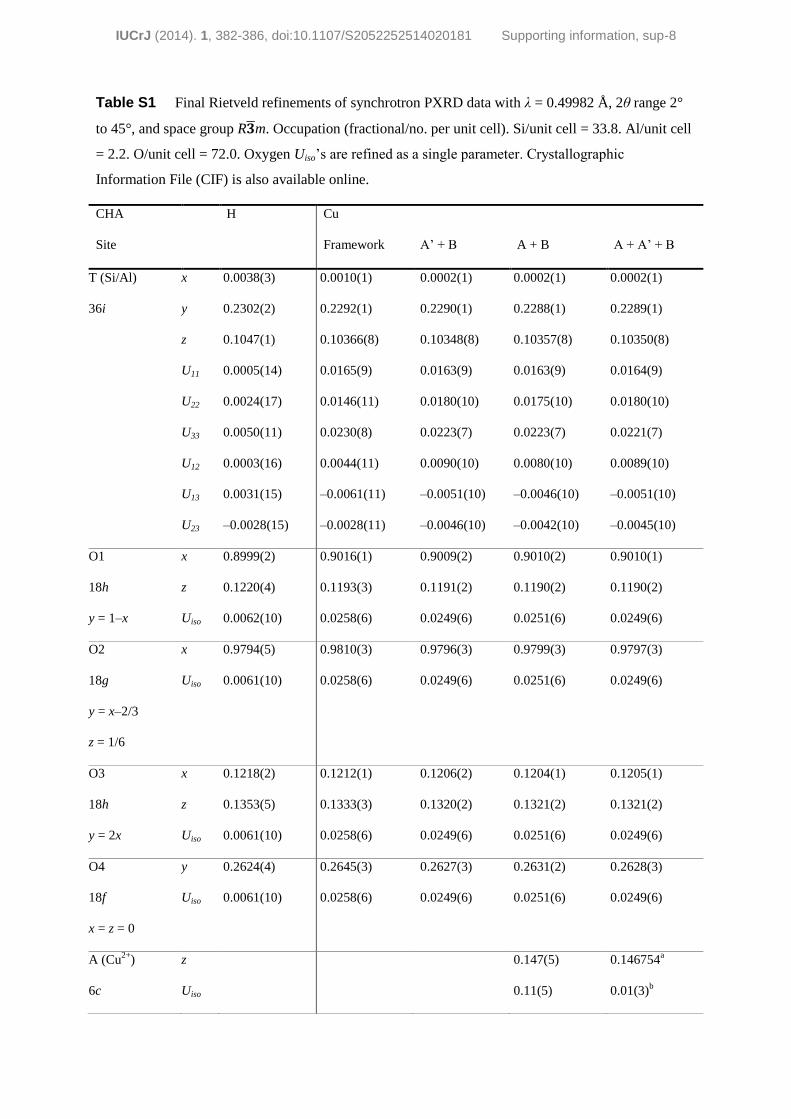
Table S1 Final Rietveld refinements of synchrotron PXRD data with λ = 0.49982 Å, 2θ range 2°
to 45°, and space group R�̅�m. Occupation (fractional/no. per unit cell). Si/unit cell = 33.8. Al/unit cell
= 2.2. O/unit cell = 72.0. Oxygen Uiso’s are refined as a single parameter. Crystallographic
Information File (CIF) is also available online.
CHA H Cu
Site Framework A’ + B A + B A + A’ + B
T (Si/Al)
36i
x
y
z
U11
U22
U33
U12
U13
U23
0.0038(3)
0.2302(2)
0.1047(1)
0.0005(14)
0.0024(17)
0.0050(11)
0.0003(16)
0.0031(15)
–0.0028(15)
0.0010(1)
0.2292(1)
0.10366(8)
0.0165(9)
0.0146(11)
0.0230(8)
0.0044(11)
–0.0061(11)
–0.0028(11)
0.0002(1)
0.2290(1)
0.10348(8)
0.0163(9)
0.0180(10)
0.0223(7)
0.0090(10)
–0.0051(10)
–0.0046(10)
0.0002(1)
0.2288(1)
0.10357(8)
0.0163(9)
0.0175(10)
0.0223(7)
0.0080(10)
–0.0046(10)
–0.0042(10)
0.0002(1)
0.2289(1)
0.10350(8)
0.0164(9)
0.0180(10)
0.0221(7)
0.0089(10)
–0.0051(10)
–0.0045(10)
O1
18h
y = 1–x
x
z
Uiso
0.8999(2)
0.1220(4)
0.0062(10)
0.9016(1)
0.1193(3)
0.0258(6)
0.9009(2)
0.1191(2)
0.0249(6)
0.9010(2)
0.1190(2)
0.0251(6)
0.9010(1)
0.1190(2)
0.0249(6)
O2
18g
y = x–2/3
z = 1/6
x
Uiso
0.9794(5)
0.0061(10)
0.9810(3)
0.0258(6)
0.9796(3)
0.0249(6)
0.9799(3)
0.0251(6)
0.9797(3)
0.0249(6)
O3
18h
y = 2x
x
z
Uiso
0.1218(2)
0.1353(5)
0.0061(10)
0.1212(1)
0.1333(3)
0.0258(6)
0.1206(2)
0.1320(2)
0.0249(6)
0.1204(1)
0.1321(2)
0.0251(6)
0.1205(1)
0.1321(2)
0.0249(6)
O4
18f
x = z = 0
y
Uiso
0.2624(4)
0.0061(10)
0.2645(3)
0.0258(6)
0.2627(3)
0.0249(6)
0.2631(2)
0.0251(6)
0.2628(3)
0.0249(6)
A (Cu2+
)
6c
z
Uiso
0.147(5)
0.11(5)
0.146754a
0.01(3)b

IUCrJ (2014). 1, 382-386, doi:10.1107/S2052252514020181 Supporting information, sup-9
x = y = 0 occ 0.025(3) /
0.15(2)
0.008(2) /
0.05(1)
A’ (Cu2+
)
18h
y = 2x
x
z
Uiso
occ
0.040(3)
0.150(4)
0.10(5)
0.013(1) /
0.22(2)
0.039027a
0.149914a
0.01(3)b
0.008(1) /
0.14(2)
B (Cu2+
)
36i
x
y
z
Uiso
occ
0.997(3)
0.413(3)
0.069(2)
0.16(3)
0.022(1) /
0.80(4)
0.996(4)
0.413(3)
0.068(3)
0.16(3)
0.021(1) /
0.76(4)
0.997(3)
0.412(3)
0.068(2)
0.16(3)
0.022(1) /
0.79(4)
Reflections 1099 1101 1101 1101 1101
a (Å) 13.5799(2) 13.5693(1) 13.5692(2) 13.5693(1) 13.5692(2)
c (Å) 14.7472(3) 14.8156(2) 14.8156(3) 14.8156(2) 14.8156(3)
V (Å3) 2355.22(5) 2362.46(4) 2362.44(7) 2362.45(3) 2362.44(7)
wRp (%) 3.42 2.97 2.67 2.68 2.67
Rp (%) 2.12 2.19 1.99 1.98 1.98
χ2 1.08 1.16 1.04 1.05 1.04
S2 (MEM) 2.14 2.29 2.03 2.01 2.03
χopt2 (MEM) 1.51 0.66 1.6 1.5 1.6
aNot refined.
bRefined as a single parameter.
Table S2 Selected distances [Å] and angles [°].
Distances/Angles
H Cu
Framework A’ + B A + B A + A’ + B
T–O1 1.639(3) 1.622(2) 1.613(2) 1.611(2) 1.612(2)
T–O2 1.605(7) 1.610(4) 1.603(4) 1.605(4) 1.604(4)
T–O3 1.586(6) 1.611(3) 1.614(3) 1.613(3) 1.613(3)
T–O4 1.612(3) 1.611(2) 1.600(2) 1.604(2) 1.601(2)

IUCrJ (2014). 1, 382-386, doi:10.1107/S2052252514020181 Supporting information, sup-10
<T–O> 1.610(10) 1.613(6) 1.608(6) 1.608(6) 1.608(6)
A–O1 2.362(13) 2.363(3)
A’–O1 2.075(56) 2.081(2)
A’–O3 1.925(82) 1.934(4)
B–O2 1.917(36) 1.929(45) 1.919(36)
O4–T–O3 114.2(3) 112.7(2) 111.6(1) 111.7(1) 111.7(1)
O4–T–O2 108.1(1) 108.08(7) 109.30(7) 108.94(7) 109.17(7)
O4–T–O1 108.3(2) 109.6(1) 109.3(1) 109.4(1) 109.3(1)
O3–T–O2 107.9(3) 106.7(2) 107.5(2) 107.5(2) 107.5(1)
O3–T–O1 110.8(3) 108.9(2) 108.9(2) 108.8(2) 108.9(2)
O2–T–O1 107.3(2) 110.9(1) 110.2(1) 110.5(1) 110.3(1)
T–O1–T 151.7(2) 148.8(1) 149.2(2) 149.2(1) 149.3(1)
T–O2–T 151.5(1) 148.14(8) 148.92(7) 148.56(8) 148.79(7)
T–O3–T 144.9(4) 146.4(2) 147.9(2) 147.9(2) 147.8(2)
T–O4–T 146.6(1) 144.92(6) 146.67(6) 146.17(6) 146.50(6)
O1–A’–O3 81.6(26) 81.5(1)
S3. MEM
The unit cell for all samples was divided into 90x90x120 pixels in the a, b, and c direction,
respectively, giving a grid size of ~0.15 Å. The relatively large grid size is chosen to lower the
calculation time. A test calculation at high resolution with a grid size of ~0.05 Å showed no change in
the conclusions drawn from the relatively low resolution calculations.
It is assumed the experimental errors on the absolute scale observed structure factors, |Fobs(H⃗⃗ i)|, are
random with a Gaussian distribution, giving the goodness-of-fit/stopping criteria:
𝜒2 =1
𝑁𝐹∑(
|𝐹𝑜𝑏𝑠(�⃗⃗� 𝑖) − 𝐹𝑀𝐸𝑀(�⃗⃗� 𝑖)|
𝜎 (𝐹𝑜𝑏𝑠(�⃗⃗� 𝑖)))
2𝑁𝐹
𝑖=1
(3.2)
NF is the number of observed structure factors Fobs(H⃗⃗ ), FMEM(H⃗⃗ ) denotes the structure factors
calculated for the current estimate of the EDD, and σ(Fobs(H⃗⃗ )) is the standard deviation of Fobs(H⃗⃗ ).
Normally the criterion for MEM convergence is χ2 = 1, but the actual optimal χ
2 value depends on the
Rietveld refinement program used and the quality of the data. The reason is the standard deviation
determination, which differs with each program. To ensure the optimum χ2 value, and the optimal

IUCrJ (2014). 1, 382-386, doi:10.1107/S2052252514020181 Supporting information, sup-11
MEM EDD, Residual Density Analysis (RDA) has been performed according to Bindzus and Iversen
(2012), (Meindl & Henn, 2008).
S3.1. Residual Density Analysis
The fractal dimension distributions for different χ2 aims of MEM electron density distributions
(EDDs) of H-CHA data are shown in Figure S9. Coefficients of determination, R2, from these fits are
shown in Figure S10, giving χopt2 = 1.51.
Figure S9 Fractal dimension distributions calculated from MEM residual densities, ρres, computed
by the inverse Fourier transformation of the difference Fobs(H⃗⃗ )-FMEM(H⃗⃗ ). S2 is the max. goodness-of-
fit defined by the prior.
-1 0 1 2 3
1.0
1.5
2.0
2.5
3.0
Fractal dimension distributions for H-CHA
df
res
2
aim
1.0
1.1
1.2
1.3
1.4
1.5
1.6
2.0
2.1 = S2
0.6 0.8 1.0
1.0
1.5
2.0

IUCrJ (2014). 1, 382-386, doi:10.1107/S2052252514020181 Supporting information, sup-12
Figure S10 Coefficients of determination, R2, obtained by fitting the fractal dimension distributions
shown in Figure S9 to a parabolic function, f(x) = c1x2+c2. In the inset further R
2 are shown, based on
df(ρres)’s calculated around χ
aim2 = 1.50.
S3.2. MEM EDDs
To be able to compare the MEM EDDs, the isosurface level of electron density (ED) for all MEM
EDD figures is set to 0.55 e/Å3. The MEM EDD of H-CHA is shown in Figure S11 and Figure S12. It
is clear that no extra ED is found outside of the framework. The small densities found in the second
EDD in Figure S11 belong to the framework of the next unit cell. The MEM EDD shows that the
structural model for H-CHA is complete. It also shows how effective the dehydration technique is.
Since no ED is found outside the framework, any ED found outside the framework of the metal
loaded CHA zeolites must be due to guest species.
1.0 1.2 1.4 1.6 1.8 2.0
0.5
0.6
0.7
0.8
0.9
1.0
R2
2
aim
H-CHA
1.45 1.50 1.55
0.9825
0.9840
0.9855

IUCrJ (2014). 1, 382-386, doi:10.1107/S2052252514020181 Supporting information, sup-13
Figure S11 MEM EDDs of H-CHA with the framework as a prior. The density max is ρmax = 290
e/Å3.

IUCrJ (2014). 1, 382-386, doi:10.1107/S2052252514020181 Supporting information, sup-14
Figure S12 MEM EDD contour maps of H-CHA with the framework as a prior. The (001) and (100)
planes at z = 1/2 and x = 2/3, respectively, are shown. The contour map scale goes from 0 e/Å2 (blue)
to 1 e/Å2 (red), the contour lines are logarithmic by 10
N/5, where N = [-1;2].
(001)
1 e/Å2
0 e/Å2
(100)
IUCrJ (2014). 1, 382-386, doi:10.1107/S2052252514020181 Supporting information, sup-15
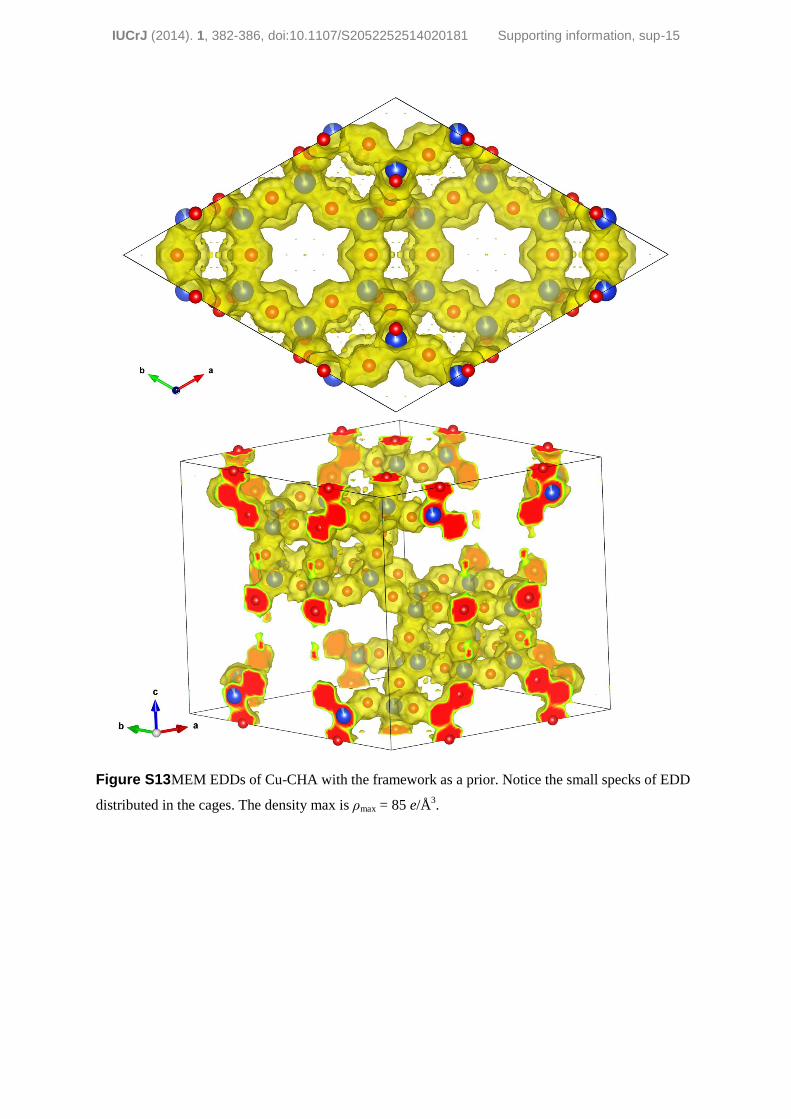
Figure S13 MEM EDDs of Cu-CHA with the framework as a prior. Notice the small specks of EDD
distributed in the cages. The density max is ρmax = 85 e/Å3.

IUCrJ (2014). 1, 382-386, doi:10.1107/S2052252514020181 Supporting information, sup-16
Figure S14 MEM EDD contour maps of Cu-CHA with the framework as a prior. The (001) and
(100) planes at z = 1/2 and x = 2/3, respectively, are shown. The contour map scale goes from 0 e/Å2
(blue) to 1 e/Å2 (red), the contour lines are logarithmic by 10
N/5, where N = [-1;2].
(001)
1 e/Å2
0 e/Å2
(100)
IUCrJ (2014). 1, 382-386, doi:10.1107/S2052252514020181 Supporting information, sup-17
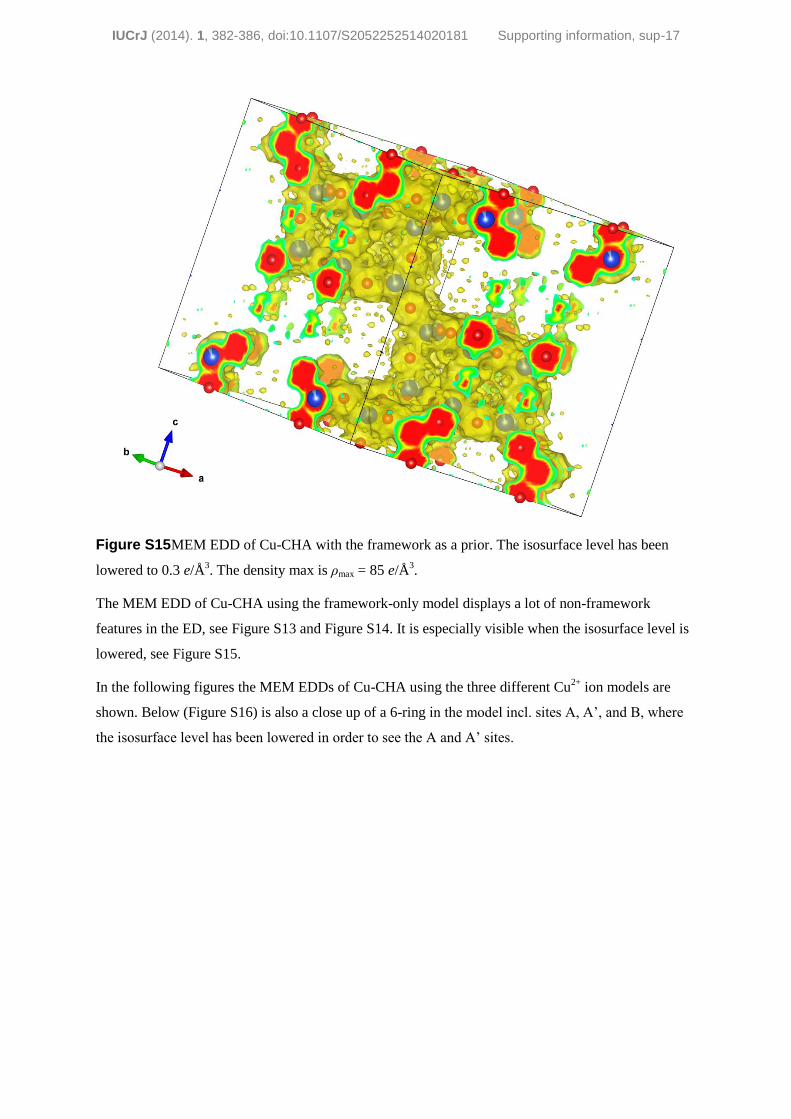
Figure S15 MEM EDD of Cu-CHA with the framework as a prior. The isosurface level has been
lowered to 0.3 e/Å3. The density max is ρmax = 85 e/Å
3.
The MEM EDD of Cu-CHA using the framework-only model displays a lot of non-framework
features in the ED, see Figure S13 and Figure S14. It is especially visible when the isosurface level is
lowered, see Figure S15.
In the following figures the MEM EDDs of Cu-CHA using the three different Cu2+
ion models are
shown. Below (Figure S16) is also a close up of a 6-ring in the model incl. sites A, A’, and B, where
the isosurface level has been lowered in order to see the A and A’ sites.

IUCrJ (2014). 1, 382-386, doi:10.1107/S2052252514020181 Supporting information, sup-18
Figure S16 MEM EDD close up of a 6-ring. Taken from the EDD of Cu-CHA with the framework
and Cu2+
sites A, A’, and B. The isosurface level has been lowered.

IUCrJ (2014). 1, 382-386, doi:10.1107/S2052252514020181 Supporting information, sup-19
Figure S17 MEM EDDs of Cu-CHA with the framework and Cu2+
sites A’ and B as a prior. The
density max is ρmax = 88 e/Å3.

IUCrJ (2014). 1, 382-386, doi:10.1107/S2052252514020181 Supporting information, sup-20
Figure S18 MEM EDD contour maps of Cu-CHA with the framework and Cu2+
sites A’ and B as a
prior. The (001) and (100) planes at z = 1/2 and x = 2/3, respectively, are shown. The contour map
scale goes from 0 e/Å2 (blue) to 1 e/Å
2 (red), the contour lines are logarithmic by 10
N/5, where N = [-
1;2].
(001)
(100)
1 e/Å2
0 e/Å2
IUCrJ (2014). 1, 382-386, doi:10.1107/S2052252514020181 Supporting information, sup-21
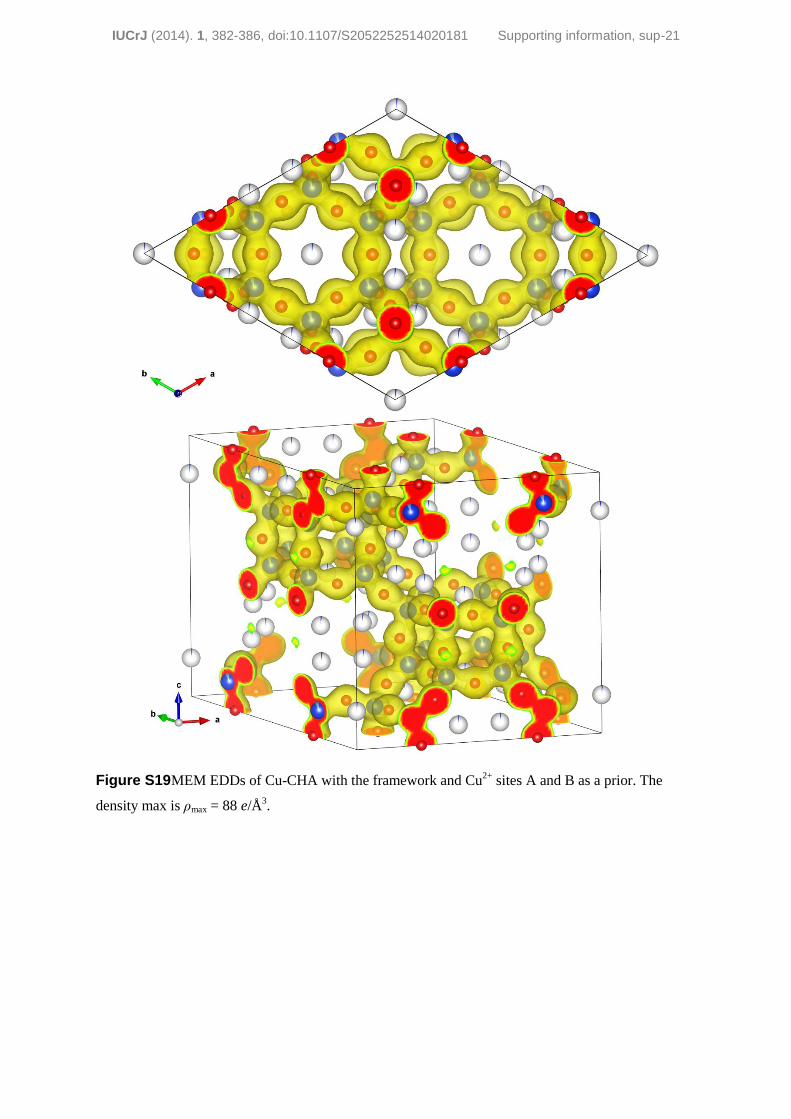
Figure S19 MEM EDDs of Cu-CHA with the framework and Cu2+
sites A and B as a prior. The
density max is ρmax = 88 e/Å3.

IUCrJ (2014). 1, 382-386, doi:10.1107/S2052252514020181 Supporting information, sup-22
Figure S20 MEM EDD contour maps of Cu-CHA with the framework and Cu2+
sites A and B as a
prior. The (001) and (100) planes at z = 1/2 and x = 2/3, respectively, are shown. The contour map
scale goes from 0 e/Å2 (blue) to 1 e/Å
2 (red), the contour lines are logarithmic by 10
N/5, where N = [-
1;2].
(001)
(100)
1 e/Å2
0 e/Å2
IUCrJ (2014). 1, 382-386, doi:10.1107/S2052252514020181 Supporting information, sup-23
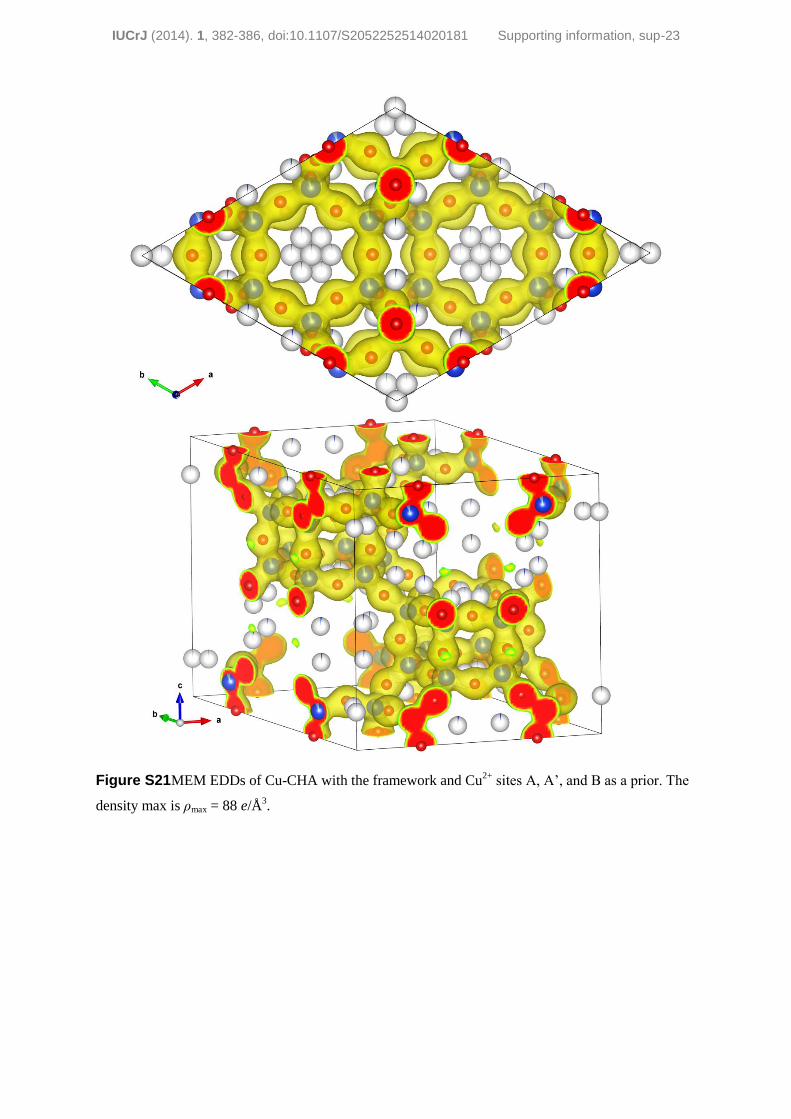
Figure S21 MEM EDDs of Cu-CHA with the framework and Cu2+
sites A, A’, and B as a prior. The
density max is ρmax = 88 e/Å3.
IUCrJ (2014). 1, 382-386, doi:10.1107/S2052252514020181 Supporting information, sup-24
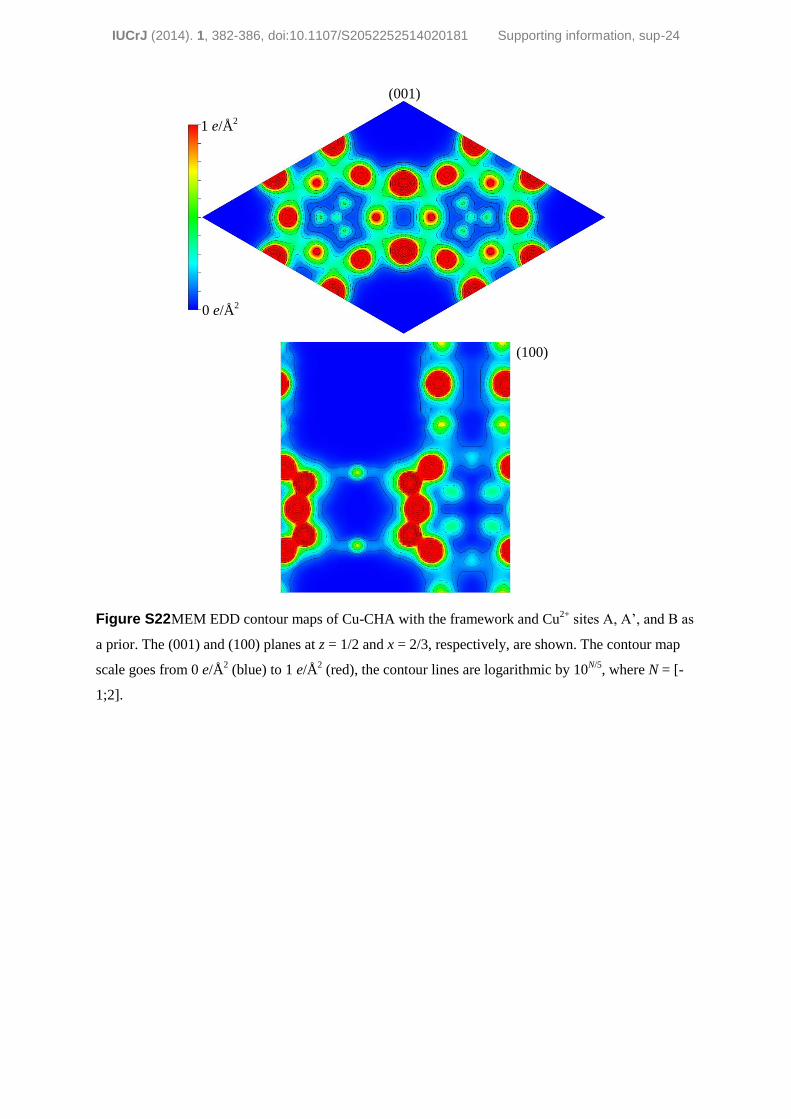
Figure S22 MEM EDD contour maps of Cu-CHA with the framework and Cu2+
sites A, A’, and B as
a prior. The (001) and (100) planes at z = 1/2 and x = 2/3, respectively, are shown. The contour map
scale goes from 0 e/Å2 (blue) to 1 e/Å
2 (red), the contour lines are logarithmic by 10
N/5, where N = [-
1;2].
(001)
(100)
1 e/Å2
0 e/Å2

IUCrJ (2014). 1, 382-386, doi:10.1107/S2052252514020181 Supporting information, sup-25
Figure S23 Standard difference Fourier maps obtained using only the framework atoms in the
Rietveld model. As can be see the maps are noisy and cannot be used to precisely locate the Cu
atoms.
S4. DFT
All density functional theory (DFT) calculations were performed using a real space grid-based
projector augmented wave method (GPAW) (Mortensen et al., 2005, Enkovaara et al., 2010)
interfaced using the atomic simulation environment (ASE) (Bahn & Jacobsen, 2002). For all
calculations, periodic boundary conditions were used and the RPBE functional applied. Additionally,
for all calculations only the Γ-point of the Brillouin zone was sampled using 0.1 eV Fermi smearing,
which was found sufficient based on convergence tests.
Initially the CHA unit cell with the R3̅m space group was obtained from the IZA structure database
(IZA-SC, 2007) and was optimized using a 0.15 Å grid spacing, where the number of grid points was
kept constant. First, the purely siliceous unit cell was optimized based on the volume, whereupon both
a and c parameters were varied independently. In all cases all atomic positions in the unit cell were
allowed to relax and a force threshold of 0.03 eV/Å was applied. The obtained unit cell based on this
optimization routine with lattice constants a = 13.87 Å and c = 15.12 Å was used as the basis for all
further calculations.
In the optimized unit cell Al was isomorphously substituted with Si (all T-sites are initially equivalent
by symmetry, so the choice of Si when only one Al is introduced is irrelevant). Cu as well as O and H,
when needed, were also introduced and due to the presence of Cu, the calculations were done
applying spin polarization. The grid spacing was increased to 0.20 Å in order to increase calculation
speed. Besides this, all parameters remained the same as stated for the optimization of the unit cell.
IUCrJ (2014). 1, 382-386, doi:10.1107/S2052252514020181 Supporting information, sup-26
In the case of replacing only one Si with an Al atom and introducing a single Cu atom, the Cu atom
can be coordinated to any of the oxygen atoms surrounding the Al. Thus, a calculation was made for
each of the possible Cu coordinations, where the atom positions were allowed to relax to an energy
minimum. This procedure was followed for all cases after introduction of the Cu moieties in the unit
cell.
When a single Al and a single Cu was introduced only two stable locations could be found, which
corresponds to the Cu in the plane of the 6R and in the plane of the 8R. However, the site in the 6R
was found to be 0.26 eV more favorable than the site in the 8R. The magnetic moment converged to a
value of zero, indicating that this type of Cu species corresponds to the Cu ion in oxidation state +1,
and is therefore considered less relevant for this specific study.
Similarly, Cu with an OH-ligand was also introduced, which has recently been suggested from
spectroscopic investigations as a relevant Cu species in dehydrated zeolites (Giordanino et al., 2013).
This leads to a Cu complex where Cu is in oxidation state +2, as also witnessed by the converged non-
zero magnetic moment. Again all possible initial locations were attempted, but after relaxation of the
atom positions only two stable sites were found. These correspond to the [Cu(OH)]+ complex located
in the plane of the 8R and one where the [Cu(OH)]+ complex is moved slightly out of the 6R and into
the large CHA cage in between the 6R and the 8R. In this case the most stable configuration is the
[Cu(OH)]+ complex in the 8R, being 0.08 eV more favored than the other.
When two Al atoms are isomorphously substituted for Si into the unit cell many options exist for the
location of the second Al atom, which is expected to obey Löwensteins rule (no Al-O-Al bridges). All
options of locating the second Al atom as a next-nearest-neighboring atom were attempted in
combination with the various possibilities of locating a Cu atom coordinated to the O-atoms
surrounding the Al. After relaxation of the atomic positions, two cases stood out being most stable (by
more than 0.5 eV than the second most stable configuration). These are the configurations where both
Al atoms are located in a 6R; either diagonally across the 6R or separated by a single Si T-atom.
Again the +2 oxidation state of Cu was confirmed by the non-zero magnetic moment.
The most stable configurations found as mentioned in the text above is given in Figure 2 in the main
text. Furthermore, chosen distances and angles are given in Table S3.

IUCrJ (2014). 1, 382-386, doi:10.1107/S2052252514020181 Supporting information, sup-27
Table S3 Selected distances [Å] and angles [°] for DFT calculations.
Distances/Angle
s
A–O1 2.005
A’–O1 2.104
A’–O3 1.964
B–O2 1.796
O1–A’–O3 77.2
S5. References
Bahn, S. R. & Jacobsen, K. W. (2002). Computing in Science & Engineering 4, 56-66.
Berar, J.-F. & Baldinozzi, G. (1993). Journal of Applied Crystallography 26, 128-129.
Bindzus, N. & Iversen, B. B. (2012). Acta Crystallogr. Sect. A 68, 750-762.
Diaz-Cabanas, M.-J. & A. Barrett, P. (1998). Chem. Commun. 17, 1881-1882.
Eilertsen, E. A., Arstad, B., Svelle, S. & Lillerud, K. P. (2012). Micropor. Mesopor. Mat. 153, 94-99.
Enkovaara, J., Rostgaard, C., Mortensen, J. J., Chen, J., Dułak, M., Ferrighi, L., Gavnholt, J., Glinsvad, C., Haikola, V.,
Hansen, H. A., Kristoffersen, H. H., Kuisma, M., Larsen, A. H., Lehtovaara, L., Ljungberg, M., Lopez-Acevedo, O., Moses, P.
G., Ojanen, J., Olsen, T., Petzold, V., Romero, N. A., Stausholm-Møller, J., Strange, M., Tritsaris, G. A., Vanin, M., Walter, M.,
Hammer, B., Häkkinen, H., Madsen, G. K. H., Nieminen, R. M., Nørskov, J. K., Puska, M., Rantala, T. T., Schiøtz, J.,
Thygesen, K. S. & Jacobsen, K. W. (2010). Journal of Physics: Condensed Matter 22, 253202.
Giordanino, F., Vennestrom, P. N. R., Lundegaard, L. F., Stappen, F. N., Mossin, S., Beato, P., Bordiga, S. & Lamberti, C.
(2013). Dalton T. 42, 12741-12761.
IZA-SC (2007). Database of zeolite structures: Http://www.Iza-structure.Org/databases/.
Meindl, K. & Henn, J. (2008). Acta Crystallogr. Sect. A 64, 404-418.
Mortensen, J. J., Hansen, L. B. & Jacobsen, K. W. (2005). Phys Rev B 71, 035109.