* email of correspondence: [email protected] · 2 days ago · * email of correspondence:...
TRANSCRIPT
1
High affinity of Skp to OmpC revealed by single-molecule detection
Sichen Pan, Chen Yang, Xin Sheng Zhao*
Beijing National Laboratory for Molecular Sciences, State Key laboratory for Structural
Chemistry of Unstable and Stable Species, and Department of Chemical Biology, College of
Chemistry and Molecular Engineering, Peking University, Beijing 100871, China.
Biomedical Pioneering Innovation Center (BIOPIC), Peking University, Beijing 100871,
China.
* Email of correspondence: [email protected]
Abstract
Outer membrane proteins (OMPs) are essential to Gram-negative bacteria, and they need
molecular chaperones to prevent from aggregation in periplasm during the OMPs biogenesis.
Seventeen kilodalton protein (Skp) is the major protein for this purpose. Here we used single-
molecule detection (SMD) to study the stoichiometry modulation of Skp in binding with outer
membrane protein C (OmpC) from Escherichia coli. To accomplish our task, we developed
the tool of portion selectively chosen fluorescence correlation spectroscopy (pscFCS). We
found that Skp binds OmpC with high affinity. The half concentration for Skp to form homo-
trimer Skp3 (C1/2) was measured to be 250 nM. Under the Skp concentrations far below C1/2
OmpC can recruit Skp monomers to form OmpC·Skp3. The affinity of the process is in pico-
.CC-BY-NC-ND 4.0 International licenseauthor/funder. It is made available under aThe copyright holder for this preprint (which was not peer-reviewed) is the. https://doi.org/10.1101/2020.04.03.022855doi: bioRxiv preprint
2
molar range, indicating that the trimerization of Skp in OmpC·Skp3 complex is induced by
OmpC-Skp interaction even though free Skp3 is rarely present. In the concentration range that
Skp3 is the predominant form, OmpC may directly interact with Skp3. Under micro-molar
concentrations of Skp, the formation of OmpC·(Skp3)2 was observed. Our results suggest that
the fine-tuned modulation of Skp composition stoichiometry plays an important role in the
safe-guarding and quality control mechanism of OMPs in the periplasm.
Introduction
Outer membrane (OM) in Gram-negative bacteria is crucial for bacterial survival because it
separates the periplasm and the external environment and protects cells from toxic
molecuels1. Meanwhile, most outer membrane proteins (OMPs) adopt a porin-like β-barrel
conformation to take nutrients and excrete toxic waste products. As OMPs are synthesized in
cytoplasm in unfolded state and have to transport through aqueous periplasm to fold in OM,
several periplasmic quality control factors such as survival protein A (SurA), seventeen
kilodalton protein (Skp) and serine endoprotease DegP are involved to protect OMPs from
mis-folding and aggregation2-5. Recent study from our group identifies Skp to be the major
protein to prevent OMPs from aggregation6. Accumulation of periplasmic OMPs and other
survival stress will stimulate the σE response7, which downregulates OMPs expression and
upregulates chaperone expression8. Crystallographic analysis reveals that Skp exists as a
homo-trimer with a “jelly-fish” shape, and the trimeric core is composed of inter-subunit β-
sheets and the tentacles of hairpin-shaped α-helices9,10. The crystallographic structure makes
people believe that Skp3 is the basic unit to interact with OMPs. Lyu et al. shows that the N-
.CC-BY-NC-ND 4.0 International licenseauthor/funder. It is made available under aThe copyright holder for this preprint (which was not peer-reviewed) is the. https://doi.org/10.1101/2020.04.03.022855doi: bioRxiv preprint
3
terminus of OMPs enters Skp3 firstly through the tentacles and Skp3 engulfs entire OMPs via
the electrostatic and hydrophobic interactions11. The tentacles are remarkably flexible, which
modulate the size of cavity to accommodate OMPs with different sizes12,13. Meanwhile, only
the β-barrel domains of OMPs are captured in the binding cavity14 and the encapsulated
domains populate a dynamic conformational ensemble15,16. The global lifetime of OMP·Skp3
complex is hours to ensure OMPs’ searching for low-energy conformations in the cavity15,17.
Recently, the dynamic equilibrium between Skp and Skp3 has attracted attention. Sandlin et
al. shows that dynamic equilibrium exists between Skp monomer and Skp3 at micro-molar
physiological concentration18, which is significantly larger than the reported nano-molar
affinity of Skp to OMPs19. It is therefore speculated that Skp monomer may be involved in the
chaperone activity18. Moreover, two Skp3 are found to bind large OMPs13. These studies raise
questions on what is the exact composition stoichiometry of Skp in OMPs-Skp complex at
low Skp concentration where Skp monomer is the predominant form and under what
concentrations these complexes form. Couple obstacles hinder people from getting answers
for these questions. Firstly, OMPs are prone to aggregation at ensemble level, which will
bring side effect to the experimental phenomenon. Secondly, there are many subpopulations
in solution. For example, OMPs are in equilibrium among freely existent (apo-) state and
complex formed with chaperones (bound-) state20, and Skp has equilibrium between Skp and
Skp318. These equilibria will blur the information at ensemble level.
To overcome above problems, subpopulation needs to be separately resolved by, for example,
electrophoresis, chromatography, or single-molecule detection (SMD)6,21-23 . Unlike other
.CC-BY-NC-ND 4.0 International licenseauthor/funder. It is made available under aThe copyright holder for this preprint (which was not peer-reviewed) is the. https://doi.org/10.1101/2020.04.03.022855doi: bioRxiv preprint

4
separation methods which perturb the molecular interaction and the equilibrium of
subpopulations, SMD yields a statistical analysis of individual molecule via ultrahigh
spatiotemporal resolution. Furthermore, SMD may prepare and investigate OMP samples
under monomeric form, so that the interference of OMP aggregation can be completely
removed6,24. Here we developed an easy-to-implement SMD method named the portion
selectively chosen fluorescence correlation spectroscopy (pscFCS), which takes advantages of
single-molecule fluorescence resonance energy transfer (smFRET) and fluorescence
correlation spectroscopy (FCS) to get diffusion time of specific subpopulation. We used
pscFCS as well as fluorescent sodium dodecyl sulfate polyacrylamide gel electrophoresis
(SDS-PAGE) to examine the formation and composition stoichiometry of the complexes of
Skp and outer membrane protein C (OmpC). We found that under pico-molar concentrations
of Skp, OmpC induced the trimerization of Skp to form OmpC·Skp3. Under micro-molar
concentrations of Skp, additional Skp3 can bind OmpC·Skp3 to form OmpC·(Skp3)2. Our
results provided new information to help better understanding the role of Skp in the safe-
guarding and quality control mechanism of OMPs.
Results
Development of pscFCS for specific subpopulation
OMPs biogenesis is a complex system, consisting of different subpopulations including
OMPs of different states and chaperones of different kinds. To resolve specific subpopulation,
we developed pscFCS which utilizes smFRET and FCS24. We measured smFRET histogram
.CC-BY-NC-ND 4.0 International licenseauthor/funder. It is made available under aThe copyright holder for this preprint (which was not peer-reviewed) is the. https://doi.org/10.1101/2020.04.03.022855doi: bioRxiv preprint
5
and chose the fluorescence traces of specific subpopulation (SI methods). Figure 1a shows
that under SMD condition the desired fluorescence traces within certain smFRET efficiency
portion were selected and the unselected parts of the traces were replaced by random Poisson
noise at the experimental level. Figure 1b shows the smFRET histogram before and after the
selection on the generated fluorescence traces from Monte-Carlo simulation. In the simulation
6 distinguished molecules diffused freely through focus volume, where 4 molecules (labelled
as molecule 1 to 4) had theoretical smFRET efficiency of 0.11 and 2 molecules (labelled as
molecule 5 and 6) had theoretical smFRET efficiency of 0.33. The fluorescence traces of
smFRET efficiency within the portion of 0.3-0.5, which covered mostly the smFRET
efficiency contributed by molecules 5 and 6, were chosen to recalculate the smFRET
histogram. The recalculated smFRET histogram only had the smFRET signals from molecule
5 and molecule 6, and removed the contributions of molecule 1 to 4. The synthesized traces of
donor channel and acceptor channel were added together to calculate FCS curves, which
cancelled the effect of the dynamics between the donor and acceptor and yielded a more
accurate diffusion time (Supplementary Figs. S1 and S2). The FCS curve was cut off at 10 μs
in the short time edge and was fitted by the 2-dimensional diffusion (2D) model to derive the
apparent diffusion time of specific species (SI methods and Supplementary Figs. S3-S8),
𝐺(𝑡) = !"($)"(&)'!"(&)'!
= 1 + ("()*+ ,#$$⁄ )
(1)
where I is the fluorescence intensity, 𝜏.// is the apparent diffusion time and 𝐺$ is inverse
of the number of fluorescent molecules in the focus volume. Obviously, the peak threshold on
photon counts in picking up the selected bursts would generate a bias on the apparent
.CC-BY-NC-ND 4.0 International licenseauthor/funder. It is made available under aThe copyright holder for this preprint (which was not peer-reviewed) is the. https://doi.org/10.1101/2020.04.03.022855doi: bioRxiv preprint
6
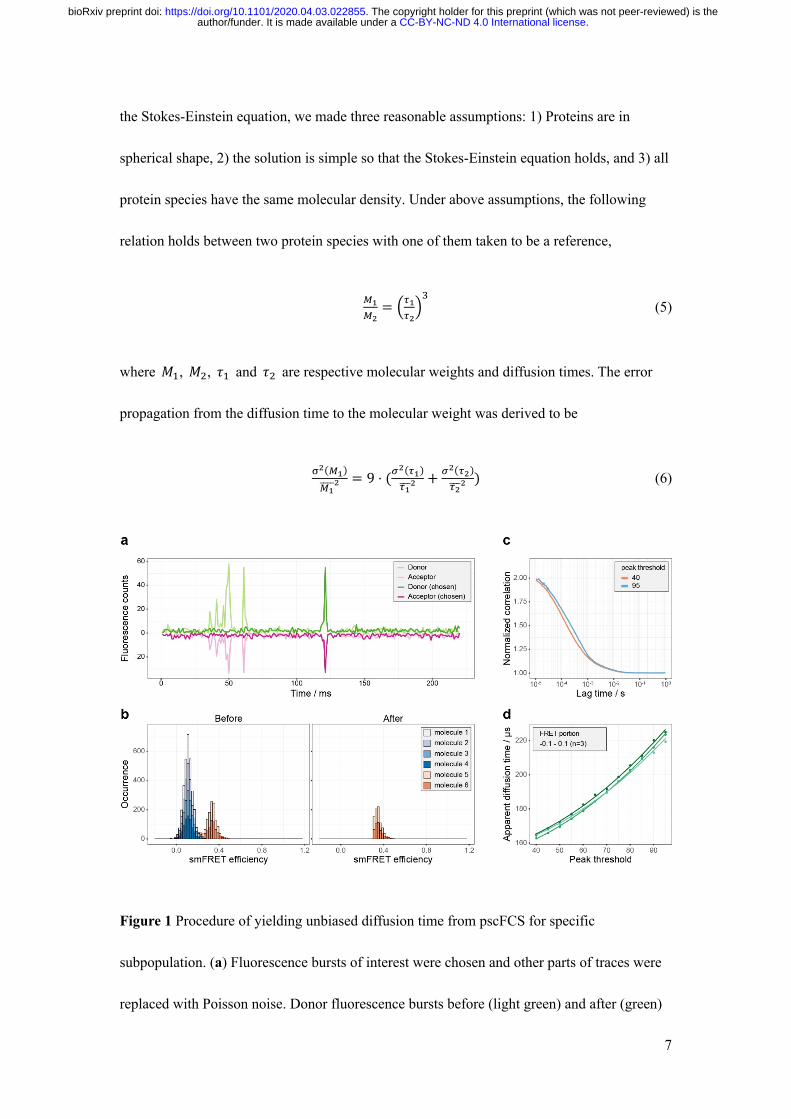
diffusion time. Taking Cy3B dye in solution as a real example, the FCS curves of two
thresholds are shown in Fig. 1c and the relation between the apparent diffusion time and the
peak threshold of three parallel experiments are shown in Fig. 1d. We empirically found that
the relation between the apparent diffusion time and the peak threshold can be fitted by
𝜏.// = t+ 𝑎𝑥0 (2)
where 𝑥 is the peak threshold, t and a are fitting parameters. To correct the bias, an
extrapolation procedure was implemented by using equation (2), and t is taken to be the
unbiased diffusion time. As a test, the unbiased diffusion time of Cy3B measured by pscFCS
was 151±2 μs (n=3, Fig. 1d). While the diffusion time of Cy3B measured by conventional
FCS was 162±8 μs (n=5, Supplementary Fig. S9). The relative error was 6.8%, which is
sufficient for our goal of identifying the composition stoichiometry of OmpC-Skp complex.
According to the Stokes-Einstein equation, the diffusion coefficient 𝐷 of spherical particles
through a liquid with low Reynolds number is
𝐷 = 1%23456
(3)
where 𝜂 is the dynamic viscosity and 𝑅 is the hydrodynamic radius. 𝐷 is related to the
diffusion time 𝜏 in FCS by
𝜏 = 7&'!
89 (4)
where 𝜔:; is the laser beam waist in the 𝑥𝑦 plane. To get molecular weight from D by using
.CC-BY-NC-ND 4.0 International licenseauthor/funder. It is made available under aThe copyright holder for this preprint (which was not peer-reviewed) is the. https://doi.org/10.1101/2020.04.03.022855doi: bioRxiv preprint
7
the Stokes-Einstein equation, we made three reasonable assumptions: 1) Proteins are in
spherical shape, 2) the solution is simple so that the Stokes-Einstein equation holds, and 3) all
protein species have the same molecular density. Under above assumptions, the following
relation holds between two protein species with one of them taken to be a reference,
<(<!= 0,(
,!1= (5)
where 𝑀), 𝑀0, 𝜏) and 𝜏0 are respective molecular weights and diffusion times. The error
propagation from the diffusion time to the molecular weight was derived to be
>!(<()
<(????! = 9 ⋅ (@
!(,(),(???!
+ @!(,!),!???!
) (6)
Figure 1 Procedure of yielding unbiased diffusion time from pscFCS for specific
subpopulation. (a) Fluorescence bursts of interest were chosen and other parts of traces were
replaced with Poisson noise. Donor fluorescence bursts before (light green) and after (green)
.CC-BY-NC-ND 4.0 International licenseauthor/funder. It is made available under aThe copyright holder for this preprint (which was not peer-reviewed) is the. https://doi.org/10.1101/2020.04.03.022855doi: bioRxiv preprint
8
chosen were plotted. Acceptor fluorescence bursts multiplied by -1 before (light magenta) and
after (magenta) chosen were plotted. (b) the smFRET histogram of the original traces showed
two efficiency peaks at the position of 0.11 and 0.33. After selection of smFRET efficiency
portion of 0.3-0.5, the recalculated smFRET histogram showed only smFRET efficiency
peaks from molecule 5 and 6. (c) The peak threshold affected appearance of FCS curve and
apparent diffusion time. With larger peak thresholds, the apparent diffusion time of Cy3B was
larger. (d) Apparent diffusion time showed a non-linear relationship to peak threshold for
Cy3B. Dots and lines represent experimental data and fitted curves. Data are shown of three
independent experiments.
Formation of OmpC·Skp3 complexes in pM range of Skp concentration
The “jellyfish”-like architecture of Skp3 consists of three subunits (Fig. 2a). We first studied
the homo-trimerization of Skp by FCS (SI methods and Supplementary Figs. S10 and S11).
The dissociation constant 𝐾 was measured to be (4.6±2.7)×104 nM2, corresponding to that
the half trimerization concentration (𝐶)/0) of Skp is (2.5±0.7)×102 nM (Supplementary Fig.
S12). Our measured 𝐶)/0 is smaller than but on the same order of magnitude with the
reported 𝐶)/0 of (4.4±1.3)×102 nM under the most similar temperature and salt
concentration18, confirming that free Skp is not negligible at a physiological concentration.
To investigate the affinity of Skp to OMPs, we designed intramolecular smFRET
experiments, where double mutant OmpC G8C-D335C was labelled by fluorescent dyes
AF555 and AF647 and incubated with various concentrations of Skp. Because smFRET
.CC-BY-NC-ND 4.0 International licenseauthor/funder. It is made available under aThe copyright holder for this preprint (which was not peer-reviewed) is the. https://doi.org/10.1101/2020.04.03.022855doi: bioRxiv preprint
9
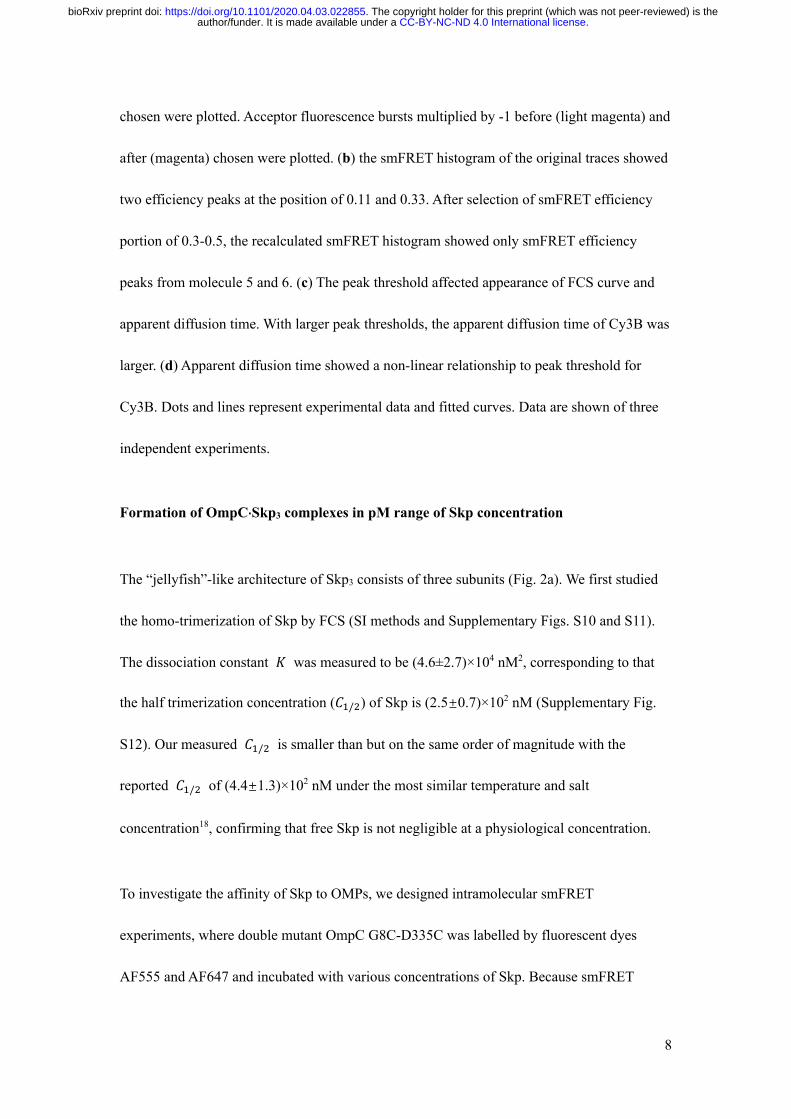
efficiency reflects the conformational changes of OmpC between apo-state and bound-
state6,25, different apparent smFRET efficiencies (Eapp) correspond to different species. Figure
2b shows smFRET histogram of OmpC G8C-D335C in presence of certain Skp
concentrations. When Skp was absent, only the Eapp=0.78 peak was observed. At Skp
concentration of 0.23 nM, an smFRET efficiency peak at Eapp=0.13 was observed besides the
0.78 peak. When Skp was 1.8 nM, only the 0.13 peak remained (more results in
Supplementary Fig. S13). The 0.78 peak was assigned to apo-OmpC and the 0.13 peak to
bound-OmpC as previously observed6. The peak at Eapp=0 (zero peak) was due to missing or
inactivated acceptors and was disregarded.
To determine the composition stoichiometry of OmpC-Skp complexes, we used pscFCS to
compare the diffusion time of apo- and bound-OmpC in the same smFRET histogram (Fig.
2c). The stoichiometric ratio 𝑟 = Skp: OmpC was derived to be
𝑟 = (?,)*+,-,#$*@=− 1) × <./$0
<12$ (7)
and was determined to be 2.8±0.4 with the apo-OmpC molecule as the inner reference,
indicating that OmpC was already bound by Skp3 even though the concentration of Skp in
solution was extremely lower than 𝐶)/0.
To accurately quantify the affinity of Skp to OmpC, we conducted colocalization
measurement using total internal reflection fluorescence (TIRF) microscope where OmpC
G8C-AF555 was immobilized on surface and incubated with freely diffusing Skp D128C-
AF647. The concentration of Skp generating half occupation of OmpC (𝐾B) for the reaction
.CC-BY-NC-ND 4.0 International licenseauthor/funder. It is made available under aThe copyright holder for this preprint (which was not peer-reviewed) is the. https://doi.org/10.1101/2020.04.03.022855doi: bioRxiv preprint
10
OmpC ⋅ Skp=C3CDOmpC + 3Skp (8)
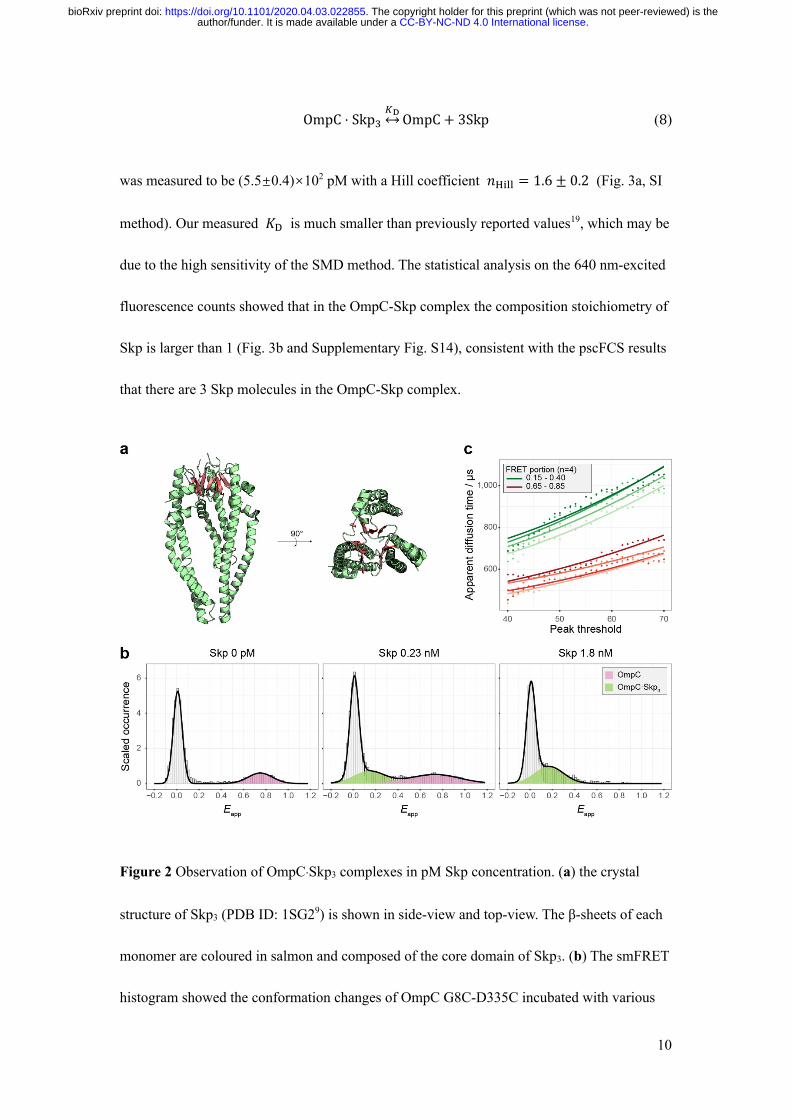
was measured to be (5.5±0.4)×102 pM with a Hill coefficient 𝑛DEFF = 1.6 ± 0.2 (Fig. 3a, SI
method). Our measured 𝐾B is much smaller than previously reported values19, which may be
due to the high sensitivity of the SMD method. The statistical analysis on the 640 nm-excited
fluorescence counts showed that in the OmpC-Skp complex the composition stoichiometry of
Skp is larger than 1 (Fig. 3b and Supplementary Fig. S14), consistent with the pscFCS results
that there are 3 Skp molecules in the OmpC-Skp complex.
Figure 2 Observation of OmpC·Skp3 complexes in pM Skp concentration. (a) the crystal
structure of Skp3 (PDB ID: 1SG29) is shown in side-view and top-view. The β-sheets of each
monomer are coloured in salmon and composed of the core domain of Skp3. (b) The smFRET
histogram showed the conformation changes of OmpC G8C-D335C incubated with various
.CC-BY-NC-ND 4.0 International licenseauthor/funder. It is made available under aThe copyright holder for this preprint (which was not peer-reviewed) is the. https://doi.org/10.1101/2020.04.03.022855doi: bioRxiv preprint
11
concentrations of Skp. These smFRET histograms exhibited two smFRET peaks positioned at
0.13 (green) and 0.73 (pink), which represented bound- and apo-OmpC respectively. Zero-
efficiency peak was resulted from missing or inactivated acceptors. All histograms were
normalized and fitted by Gaussian distribution. (c) pscFCS at different peak thresholds of the
bound- (green, FRET portion 0.15 - 0.40) and apo- (red, FRET portion 0.65 - 0.85) OmpC
were treated. The positive bias on the apparent diffusion time caused by the peak threshold
was corrected by equation (2). The diffusion times of 549±27 μs for the bound- and 422±26
μs for the apo-OmpC were derived. Dots and lines represent experimental data and fitted
curves. Data are shown of four independent experiments.
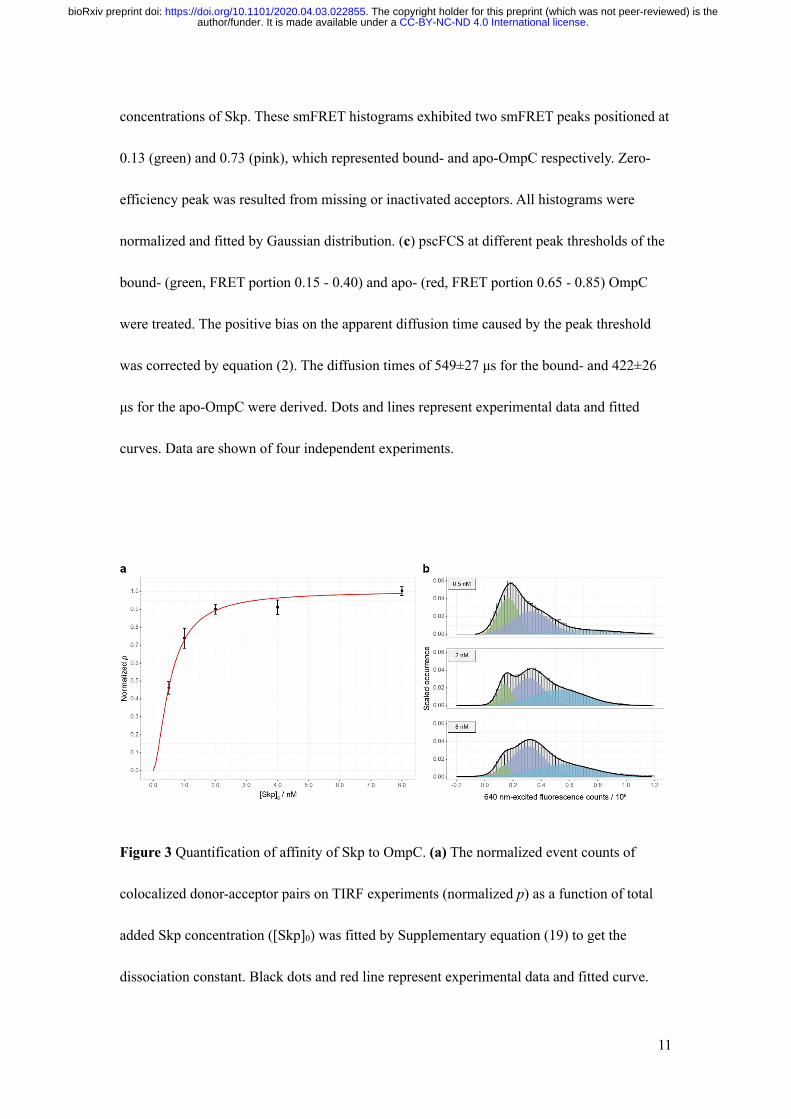
Figure 3 Quantification of affinity of Skp to OmpC. (a) The normalized event counts of
colocalized donor-acceptor pairs on TIRF experiments (normalized p) as a function of total
added Skp concentration ([Skp]0) was fitted by Supplementary equation (19) to get the
dissociation constant. Black dots and red line represent experimental data and fitted curve.
.CC-BY-NC-ND 4.0 International licenseauthor/funder. It is made available under aThe copyright holder for this preprint (which was not peer-reviewed) is the. https://doi.org/10.1101/2020.04.03.022855doi: bioRxiv preprint
12
Data are shown as mean±s.d. of six imaging area. (b) 640 nm-excited fluorescence counts
histogram exhibited three peaks respectively positioned at 0.15×10⁵ (green), 0.31×10⁵
(indigo) and 0.56×10⁵ (azure), which demonstrated that the composition stoichiometry of Skp
in the OmpC-Skp complex is larger than 1. All histograms were normalized and fitted by
Gaussian distribution.
Formation of OmpC·(Skp3)2 at Skp concentrations in μM magnitude
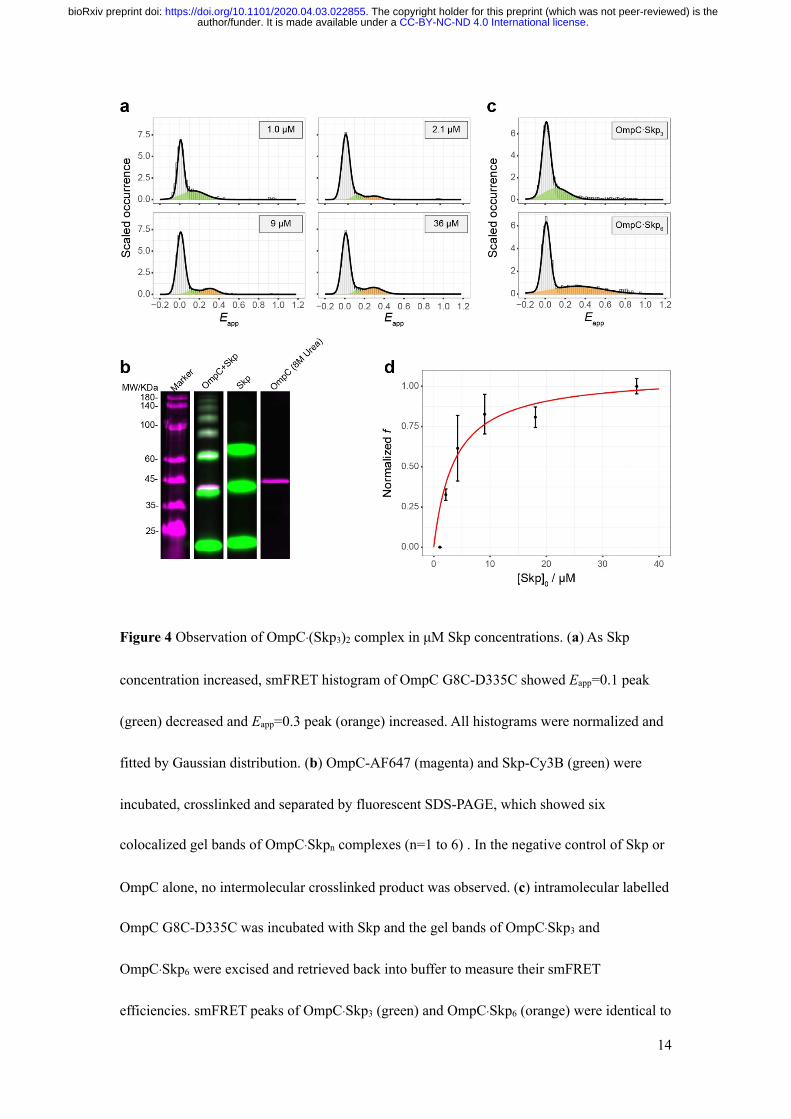
As is shown in Fig. 4a and Supplementary Fig. S13, when intramolecular labelled OmpC
G8C-D335C was incubated with micro-molar of Skp, the Eapp=0.3 peak (orange) appeared in
the smFRET histogram besides previously seen 0.1 peak (green). The phenomenon was
checked among different OmpC double mutants (Supplementary Figs. S15-S17). Previous
study points out that Skp3 is multivalent13, so an intuitive hypothesis was that the
conformational change of OmpC under micro-molar of Skp was due to the composition
stoichiometry change of the OmpC-Skp complexes. To verify the hypothesis, OmpC
incubated with micro-molar of Skp was amine-crosslinked and separated in SDS-PAGE (Fig.
4b). When OmpC G8C-AF647 and Skp D128C-Cy3B was mixed, six co-localized gel bands
of Cy3B and AF647 from 60 kD to 180 kD were observed. As shown in Fig. 4b, the control
experiments showed that when only Skp was present Skp3 could be crosslinked
intramolecularly but not intermolecularly, and when only OmpC was present in 8 M urea
buffer and crosslinked, no intermolecular crosslinked product was observed. The six
colocalized gel bands were assigned from OmpC·Skp to OmpC·Skp6 respectively according to
their molecular weight (40.2 kD for His-tagged OmpC G8C-AF647 and 18.8 kD for His-
.CC-BY-NC-ND 4.0 International licenseauthor/funder. It is made available under aThe copyright holder for this preprint (which was not peer-reviewed) is the. https://doi.org/10.1101/2020.04.03.022855doi: bioRxiv preprint
13
tagged Skp D128C-Cy3B). The determined molecular weights of the assigned bands were
slightly larger than the theoretical molecular weights due to the association of DSS molecules
(Supplementary Table S1). Because of the false negative and false positive possibilities,
crosslinked products do not necessarily represent the real species in solution, but it suggests
the possible existence of OmpC·Skp6 in the solution. Then, the intramolecular labelled OmpC
G8C-D335C and Skp was crosslinked (Supplementary Fig. S18) and the gel bands of
OmpC·Skp3 and OmpC·Skp6 were excised and retrieved back into buffer to measure their
smFRET efficiencies (Fig. 4c). The histogram showed that the retrieved OmpC·Skp3 had an
Eapp peak at 0.1 and the retrieved OmpC·Skp6 had an Eapp peak at 0.3, consistent with the
observed peaks under in situ condition (Fig. 4a). The result confirmed the hypothesis that the
conformational change of OmpC under micro-molar of Skp was due to the composition
stoichiometry change of the OmpC-Skp complexes. By fitting the variation of the peak area in
the smFRET histogram under in situ condition against the Skp concentration, the dissociation
constant 𝐾BG for the reaction
OmpC ⋅ (Skp=)0C34
CDOmpC ⋅ Skp= + Skp= (9)
was measured to be 𝐾BG =1.2±0.4 μM (Fig. 4d, SI method).
Interestingly, the pscFCS determined that the hydrodynamic radius of OmpC·(Skp3)2 was
comparable to the hydrodynamic radius of OmpC·Skp3 (Supplementary Fig. S19 and
Supplementary Table S2), indicating that OmpC·(Skp3)2 adopts an “inter-locked”
configuration (see discussion section for the detail).
.CC-BY-NC-ND 4.0 International licenseauthor/funder. It is made available under aThe copyright holder for this preprint (which was not peer-reviewed) is the. https://doi.org/10.1101/2020.04.03.022855doi: bioRxiv preprint
14
Figure 4 Observation of OmpC·(Skp3)2 complex in μM Skp concentrations. (a) As Skp
concentration increased, smFRET histogram of OmpC G8C-D335C showed Eapp=0.1 peak
(green) decreased and Eapp=0.3 peak (orange) increased. All histograms were normalized and
fitted by Gaussian distribution. (b) OmpC-AF647 (magenta) and Skp-Cy3B (green) were
incubated, crosslinked and separated by fluorescent SDS-PAGE, which showed six
colocalized gel bands of OmpC·Skpn complexes (n=1 to 6) . In the negative control of Skp or
OmpC alone, no intermolecular crosslinked product was observed. (c) intramolecular labelled
OmpC G8C-D335C was incubated with Skp and the gel bands of OmpC·Skp3 and
OmpC·Skp6 were excised and retrieved back into buffer to measure their smFRET
efficiencies. smFRET peaks of OmpC·Skp3 (green) and OmpC·Skp6 (orange) were identical to
.CC-BY-NC-ND 4.0 International licenseauthor/funder. It is made available under aThe copyright holder for this preprint (which was not peer-reviewed) is the. https://doi.org/10.1101/2020.04.03.022855doi: bioRxiv preprint
15
that under in situ condition respectively. All histograms were normalized and fitted by
Gaussian distribution. (d) The normalized fraction of [OmpC·(Skp3)2] over
[OmpC·Skp3]+[OmpC·(Skp3)2] (normalized f) as a function of [Skp]0 was fitted by
Supplementary equation (21). Black dots and red line represent experimental data and fitted
curve. Data are shown as mean±s.d. of three experiments.
Discussion
We made thorough study on the equilibrium constants of Skp homo-trimerization and the
complex formation between OmpC and Skp. Skp D128C was used for fluorescent dye
labelling. Although the residue D128 is at trimeric core of Skp3 structure, our previous study11
shows that the Skp mutation and dye labelling does not perturb its chaperone activity, and
labelled Skp D128C had a minimal self-quenching effect. Since OmpC is unfolded, the
mutation and dye labelling do not vary its property6. The C1/2 of Skp homo-trimerization was
250 nM, which is comparable with previous measurement18, suggesting that Skp monomer
cannot be neglected in its biological function as chaperones. When OMP polypeptide was
synthesized by ribosome in the cytoplasm, the polypeptide would be secreted to periplasm
through SecYEG/SecA translocon in unfolded state and safeguarded by chaperones including
Skp31,26-29. Many articles showed that OMP×Skp3 has a dissociation constant of nano-molar
range19,30,31. Most their experiments, however, were performed at ensemble level of OMPs,
where chaperones had to compete with OMPs self-aggregation. In our smFRET experiments,
.CC-BY-NC-ND 4.0 International licenseauthor/funder. It is made available under aThe copyright holder for this preprint (which was not peer-reviewed) is the. https://doi.org/10.1101/2020.04.03.022855doi: bioRxiv preprint
16
monodisperse OmpC was prepared which removed the side effect of aggregation6, and it was
a better mimic of the situation in living cells. With SMD, we were able to resolve individual
subpopulations, and we showed high affinity (𝐾B = (5.5 ± 0.4) × 100pM) and positive
cooperativity (𝑛DEFF = 1.6 ± 0.2) of Skp to form OmpC·Skp3 (Fig. 2 and Fig. 3). Because the
immobilized OmpC was limited in phase space compared to freely diffusing OmpC, the
affinity in TIRF experiment could be slightly weaker than that in smFRET experiment in
solution32, but it still resulted in high affinity of Skp towards its client, providing strong
evidence to support the proposed unique chaperone function of Skp to dissolve aggregated
OmpC6. The high affinity of Skp to OmpC is perhaps a result of multiple, non-specific and
transient interactions11,15. Additionally, Skp has a broad substrate spectrum33. We speculate
that the high affinity of Skp to OmpC is likely to be prevalent among its other substrates.
The reaction rate of Skp binding OmpC is nearly diffusion limited30. The association rate
constant could be estimated by
𝑘* = 4π(𝐷H + 𝐷I)(𝑅H + 𝑅I) (10)
where 𝐷 is the diffusion coefficient, and 𝑅 is the radius of molecules. The radius of Skp3 in
solution is 3.3 nm34, and the radius of Skp is 2.3 nm derived from our FCS data. According to
equations (3) and (10), the association rate constant of Skp to OmpC is 𝑘JK/* =6.7×10⁹ M-1s-1,
and Skp3 to OmpC is 𝑘JK/5* =6.6×10⁹ M-1s-1. When the equilibrium between Skp and Skp3 is
considered, the apparent reaction rate constants are defined as 𝑘JK/* [Skp] and 𝑘JK/5
* [Skp=].
The apparent reaction rate constant of Skp is several orders of magnitude larger than that of
.CC-BY-NC-ND 4.0 International licenseauthor/funder. It is made available under aThe copyright holder for this preprint (which was not peer-reviewed) is the. https://doi.org/10.1101/2020.04.03.022855doi: bioRxiv preprint

17
Skp3 in low Skp concentrations. With the increase of the Skp concentration, the apparent
reaction rate constant of Skp3 becomes progressively predominant (Supplementary Fig. S20).
Therefore, in the Skp low concentration range, the induced Skp trimerization by OmpC
should be dominant, while the direct reaction between Skp3 and OmpC will become the major
route when the concentration of Skp3 exceeds certain amount. At even higher Skp
concentrations, OmpC·(Skp3)2 can form.
Periplasm is lack of ATP as energy source. The OMPs folding free energy of -18 to -32
kcal·mol-1 acts as an energy sink in the OMPs biogenesis31. Our results revealed that the free
energy of Skp3 binding to OmpC is -20 kcal·mol-1, which supports the ideas that Skp3 is a
superior holdase17 and de-aggregation agency6 to OMPs. Since the binding energy is so large,
the release of the substrates from Skp may need the help of LPS35,36, DegP2,37 or BAM
system38,39, ensuring the direction of OMPs transportation towards the final destination.
We observed the formation of OmpC·(Skp3)2, but the hydrodynamic radius of OmpC·(Skp3)2
was similar to that of OmpC·Skp3 according our pscFCS results (Supplementary Table S2).
This experimental result strongly suggests that the orientation of the two Skp3 in
OmpC·(Skp3)2 is via the “inter-locked” pattern13. Our data showed that the intramolecular
smFRET efficiency of OmpC is higher in OmpC·(Skp3)2 than that in OmpC·Skp3, indicating
that OmpC is compressed tighter in OmpC·(Skp3)2 than in OmpC·Skp3, that also causes the
reduction of the complex radius and is consistent with the “inter-locked” model. SANS study
reveals that the gyration radius of apo-state Skp3 in solution is larger than Skp3 bound to
OmpA or OmpW34. OmpA and OmpW are both small OMPs with 8 b-strands. It is reasonable
.CC-BY-NC-ND 4.0 International licenseauthor/funder. It is made available under aThe copyright holder for this preprint (which was not peer-reviewed) is the. https://doi.org/10.1101/2020.04.03.022855doi: bioRxiv preprint
18
that the complex is larger when Skp3 binds to larger OMPs such as OmpC (16 b-strands).
When apo-state Skp3 in solution was used as reference, we found that indeed the
hydrodynamic radius of OmpC·Skp3 is larger than that of Skp3.
The physiological concentration of Skp is around 2.1-3.9 μM at stationary phase growth in
LB6,18, which is near the dissociation constant 𝐾BG = 1.2 ± 0.4µM for second Skp3. The sE
response will downregulate OMPs expression and upregulate expression level of chaperones
and proteases40. Although the whole OMPs biogenesis landscape will be much complicated in
vivo, we speculate that the upregulated Skp will increase the population of OMP·(Skp3)2,
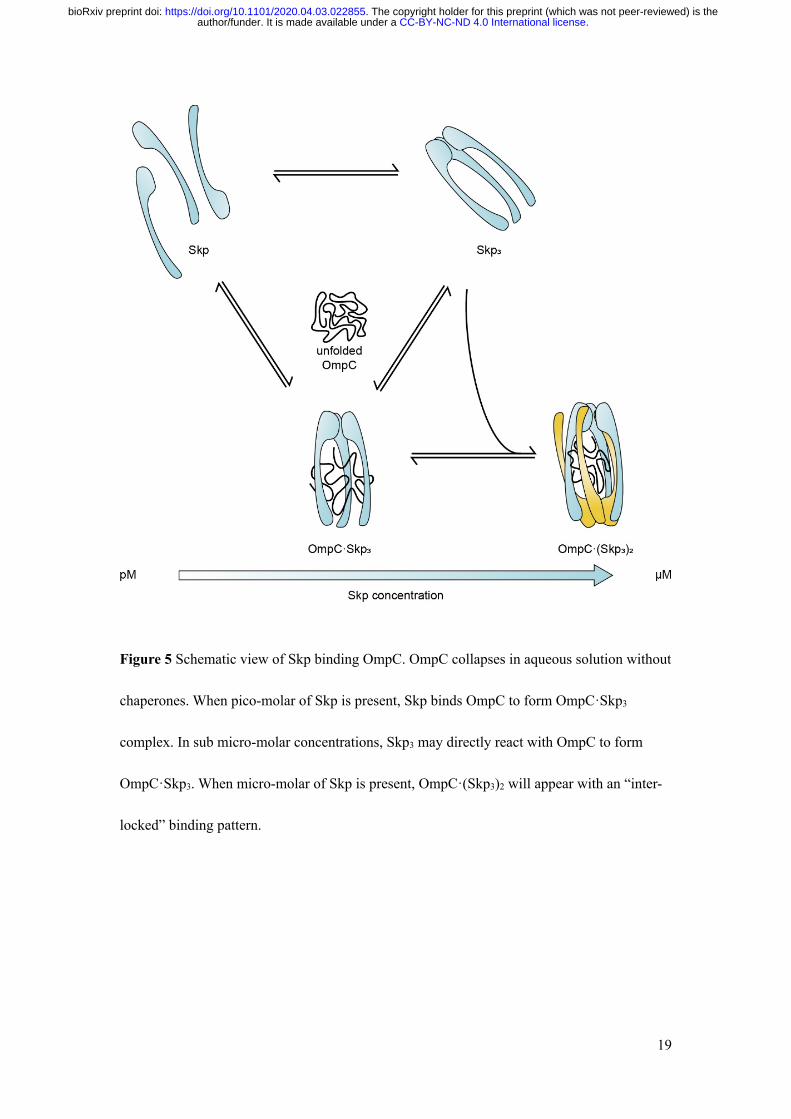
which may enhance the protection of OMPs from aggregation to help the cell survival. Figure
5 presents a diagram how the composition stoichiometry in the OmpC-Skp complex is
proceeded as the Skp concentration varies. The fine-tuned modulation of different complex
forms may play a distinct role in the OMPs biogenesis under different situations. Our results
provide new insight regarding the mechanism of Skp’s chaperone function in OMPs
biogenesis.
.CC-BY-NC-ND 4.0 International licenseauthor/funder. It is made available under aThe copyright holder for this preprint (which was not peer-reviewed) is the. https://doi.org/10.1101/2020.04.03.022855doi: bioRxiv preprint
19
Figure 5 Schematic view of Skp binding OmpC. OmpC collapses in aqueous solution without
chaperones. When pico-molar of Skp is present, Skp binds OmpC to form OmpC·Skp3
complex. In sub micro-molar concentrations, Skp3 may directly react with OmpC to form
OmpC·Skp3. When micro-molar of Skp is present, OmpC·(Skp3)2 will appear with an “inter-
locked” binding pattern.
.CC-BY-NC-ND 4.0 International licenseauthor/funder. It is made available under aThe copyright holder for this preprint (which was not peer-reviewed) is the. https://doi.org/10.1101/2020.04.03.022855doi: bioRxiv preprint
20
Methods
Protein expression, purification and mutagenesis
The pET28a vectors carrying relevant Skp, including N-terminal His-tag, were transformed
into E.coli. BL21(DE3) pLysS cells (TransGen Biotech). Cells were grown in LB medium
containing 50 μg/mL kanamycin at 37 °C with shaking (220 r.p.m.) until the culture reached
an OD600 of ~0.6 (after ~3 h). The culture was induced with 0.5 mM IPTG, expressed for 4 h
and harvested by centrifugation. The cell pellet was resuspended in 80 mL buffer A (50 mM
PB, 500 mM NaCl and 10 mM imidazole, pH=8.0) and lysed by ultrasonication. The
supernatant was collected by centrifugation at 20,000 g for 30 min, filtered by 0.22 μm
syringe filter and loaded on Ni-NTA (5 mL) column (GE Healthcare) equilibrated with buffer
A. The column was washed extensively by buffer A and eluted with a gradient (25%, 100%)
of buffer B (50 mM PB, 500 mM NaCl and 250 mM imidazole, pH=8.0). Protein fractions
were dialyzed against buffer C (50 mM PB and 100 mM NaCl, pH=7.0) by desalting column
(GE Healthcare), and concentrated by centrifugal filter units (Merck Amicon). Aliquots were
snap-frozen in liquid nitrogen and stored in -80 °C. For the purification of OmpC, the
plasmids including N-terminal His-tag were transformed into E.coli. BL21(DE3) cells
(TransGen Biotech) and 8 M urea was included in buffers A-C to prevent aggregation. For
immobilization, an AviTag (GLNDIFEAQKIEWHE) was introduced to the C-terminus of
OmpC G8C. Skp concentration was determined by BCA protein assay kit (PIERCE),
according to manufacturer’s instructions. Skp monomer was taken in the calculation of the
Skp concentrations. OmpC concentration was determined by using molar extinction
.CC-BY-NC-ND 4.0 International licenseauthor/funder. It is made available under aThe copyright holder for this preprint (which was not peer-reviewed) is the. https://doi.org/10.1101/2020.04.03.022855doi: bioRxiv preprint
21
coefficient of 65,210 M-1cm-1 at 280 nm.
Fast Mutagenesis System (TransGen Biotech) with plasmids pET28a-skp and pET28a-ompC
as templates was used to construct the site-directed cysteine mutants of Skp and OmpC. For
intramolecular smFRET assays, OmpC G8C-L139C, OmpC G8C-I232C and OmpC G8C-
D335C were generated. For TIRF colocalization assays, OmpC G8C with AviTag on C-
terminus and Skp D128C were generated. Skp D128C was also used in FCS for homo-
trimerization assay. The protein expression and purification were the same as described
above.
Fluorescent dye labelling
Labelling of site-directed cysteine mutants of Skp and OmpC was performed as follows. 10-
fold molar excess of tris-2-carboxyethyl-phosphinie (TCEP) was used in proteins of 100 μM
at 27 °C for 30 min to reduce cysteine residues. 5-fold molar excess of maleimide
fluorescent dyes Cy3B (GE Healthcare), AF555 (Life Technology) or AF647 (Life
Technology) was added and the solution was kept in the dark at 27 °C for 3 h. Excess dyes
was removed by HiTrap desalting column (GE Healthcare) in buffer C. 4 M urea was
included in the labelling and eluting buffer for Skp to disassemble trimers and expose
cysteine residues. 8 M urea was included in the labelling and eluting buffer for OmpC to
prevent aggregation. The absorbance of Cy3B (130,000 M-1cm-1), AF555 (158,000 M-1cm-1)
and AF647 (239,000 M-1cm-1) was used to determine the fluorescent dye concentration. For
all samples, the extent of labelling was near 90%.
.CC-BY-NC-ND 4.0 International licenseauthor/funder. It is made available under aThe copyright holder for this preprint (which was not peer-reviewed) is the. https://doi.org/10.1101/2020.04.03.022855doi: bioRxiv preprint
22
Biotinylation of dye-labelled OmpC
The bioitinylation of OmpC was performed by enzyme BirA, which can specifically
recognize AviTag’s lysine side chain and attach biotin. Biotinylation reaction was performed
in accordance with the instructions provided by the BirA enzyme kit (GeneCopoeiaTM).
Reaction was conducted including 40 μM dye-labelled OmpC with AviTag, 50 μM D-Biotin,
10 mM ATP, 10 mM MgOAc and 45 U/μL BirA in buffer C containing 4 M urea at 30 °C for
1 hour. After reaction aliquots were snap-frozen in liquid nitrogen and stored in -80 °C.
Monte-Carlo simulation for Brownian motion
Monte-Carlo simulation was performed as described previously41,42 and simplified by putting
6 diffusing molecules into the volume. Each fluorescence trace was tracked and calculated to
obtain smFRET histogram where contribution from each molecule was known. Then all
fluorescence traces were added to simulate the signals, which was used to select fluorescence
bursts of certain subpopulation in pscFCS, and the generated Boolean array was used in each
fluorescence trace to test the contribution of 6 molecules by checking selected fluorescence
bursts and recalculating smFRET histogram.
FCS experiments for homo-trimerization of Skp
Homo-trimerization titration of Skp was carried out with a home-built inverted fluorescence
confocal microscope based on a TE2000-U microscope (Nikon) equipped with a 532 nm
solid-state laser (MLL-III-532-20mW, LD&TEC) as previously described25,43. The laser was
.CC-BY-NC-ND 4.0 International licenseauthor/funder. It is made available under aThe copyright holder for this preprint (which was not peer-reviewed) is the. https://doi.org/10.1101/2020.04.03.022855doi: bioRxiv preprint
23
filtered to 100 μW and focused inside the sample solution through an oil immersion objective
(NA 1.45, 60×, Nikon). The fluorescence was separated from the excitation light by a
dichromic mirror (zt532 rdc, Chroma). After being focused through a 50 μm pinhole, the
fluorescence was separated by a polarizing beam splitter (PBS) (Daheng, China) into reflected
s-polarized and transmitted p-polarized beams. The beams were focused on two avalanche
photon diodes (APD) (SPCM-AQRH-14, Perkin-Elmer Optoelectronics) respectively for FCS
measurement. For each sample, 30 nM of Skp D128C-Cy3B was added in various
concentrations of Skp denatured by 4 M urea. The solution was diluted 100-fold in buffer C
and incubated in the dark at 24 °C for 30 min to assemble. The final concentration of Skp
D128C-Cy3B was 300 pM. 40 μL of solution was sealed between a Secure-Seal™
hybridization chamber gasket (Life Technology) and a cover glass. Experiments were
conducted at 23 °C. Surface adsorption of proteins was prevented by 0.02% (v/v) tween 20
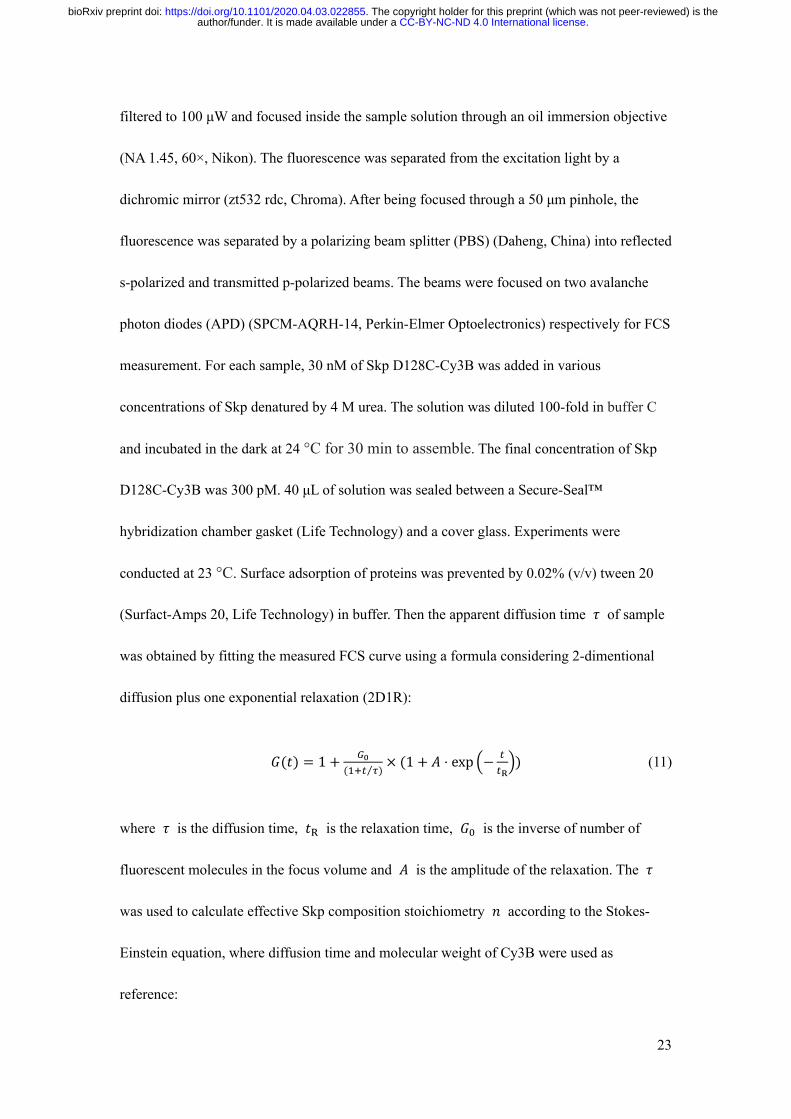
(Surfact-Amps 20, Life Technology) in buffer. Then the apparent diffusion time 𝜏 of sample
was obtained by fitting the measured FCS curve using a formula considering 2-dimentional
diffusion plus one exponential relaxation (2D1R):
𝐺(𝑡) = 1 + ("()*+ ,⁄ )
× (1 + 𝐴 ⋅ exp 0− ++61) (11)
where 𝜏 is the diffusion time, 𝑡L is the relaxation time, 𝐺$ is the inverse of number of
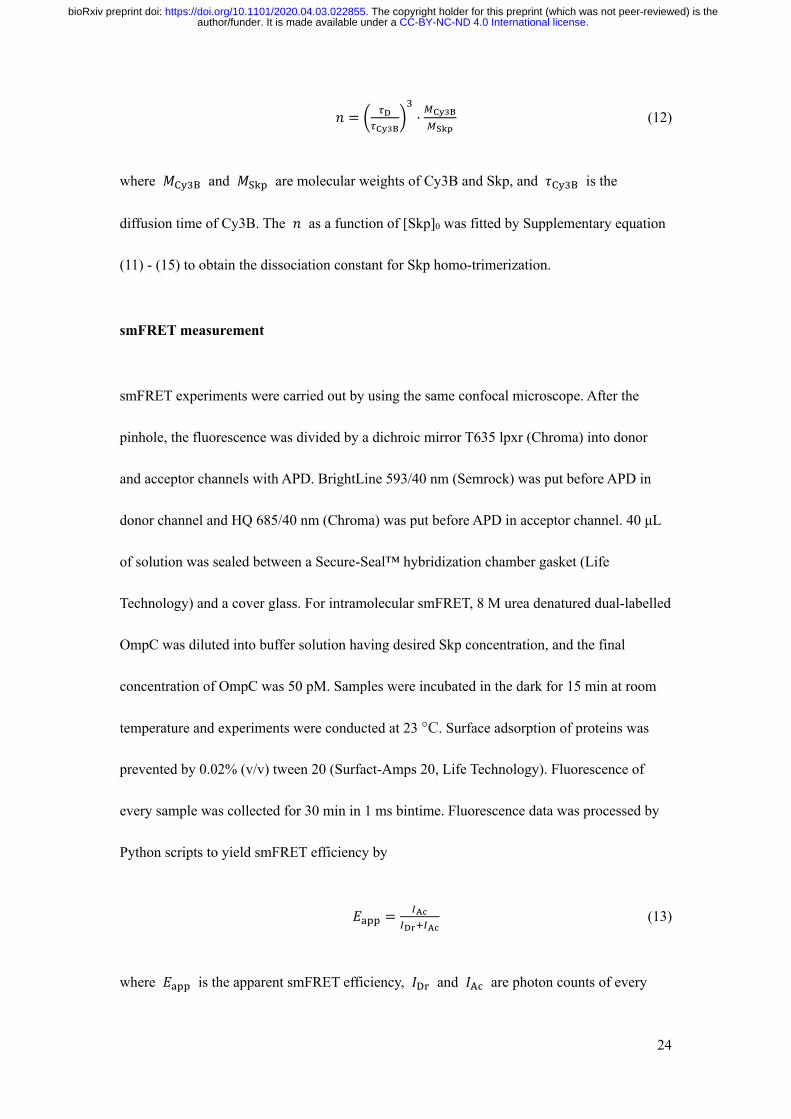
fluorescent molecules in the focus volume and 𝐴 is the amplitude of the relaxation. The 𝜏
was used to calculate effective Skp composition stoichiometry 𝑛 according to the Stokes-
Einstein equation, where diffusion time and molecular weight of Cy3B were used as
reference:
.CC-BY-NC-ND 4.0 International licenseauthor/funder. It is made available under aThe copyright holder for this preprint (which was not peer-reviewed) is the. https://doi.org/10.1101/2020.04.03.022855doi: bioRxiv preprint
24
𝑛 = ? ,3,0'5%
@=⋅ <0'5%
<12$ (12)
where 𝑀M;=I and 𝑀JK/ are molecular weights of Cy3B and Skp, and 𝜏M;=I is the
diffusion time of Cy3B. The 𝑛 as a function of [Skp]0 was fitted by Supplementary equation
(11) - (15) to obtain the dissociation constant for Skp homo-trimerization.
smFRET measurement
smFRET experiments were carried out by using the same confocal microscope. After the
pinhole, the fluorescence was divided by a dichroic mirror T635 lpxr (Chroma) into donor
and acceptor channels with APD. BrightLine 593/40 nm (Semrock) was put before APD in
donor channel and HQ 685/40 nm (Chroma) was put before APD in acceptor channel. 40 μL
of solution was sealed between a Secure-Seal™ hybridization chamber gasket (Life
Technology) and a cover glass. For intramolecular smFRET, 8 M urea denatured dual-labelled
OmpC was diluted into buffer solution having desired Skp concentration, and the final
concentration of OmpC was 50 pM. Samples were incubated in the dark for 15 min at room
temperature and experiments were conducted at 23 °C. Surface adsorption of proteins was
prevented by 0.02% (v/v) tween 20 (Surfact-Amps 20, Life Technology). Fluorescence of
every sample was collected for 30 min in 1 ms bintime. Fluorescence data was processed by
Python scripts to yield smFRET efficiency by
𝐸.// ="78
"39*"78 (13)
where 𝐸.// is the apparent smFRET efficiency, 𝐼BN and 𝐼HO are photon counts of every
.CC-BY-NC-ND 4.0 International licenseauthor/funder. It is made available under aThe copyright holder for this preprint (which was not peer-reviewed) is the. https://doi.org/10.1101/2020.04.03.022855doi: bioRxiv preprint
25
identified fluorescence burst. Statistics of smFRET efficiency yielded smFRET histogram and
the histogram was fitted by Gaussian distributions.
pscFCS measurement for stoichiometry
pscFCS experiments were performed as the same of smFRET experiments except that the
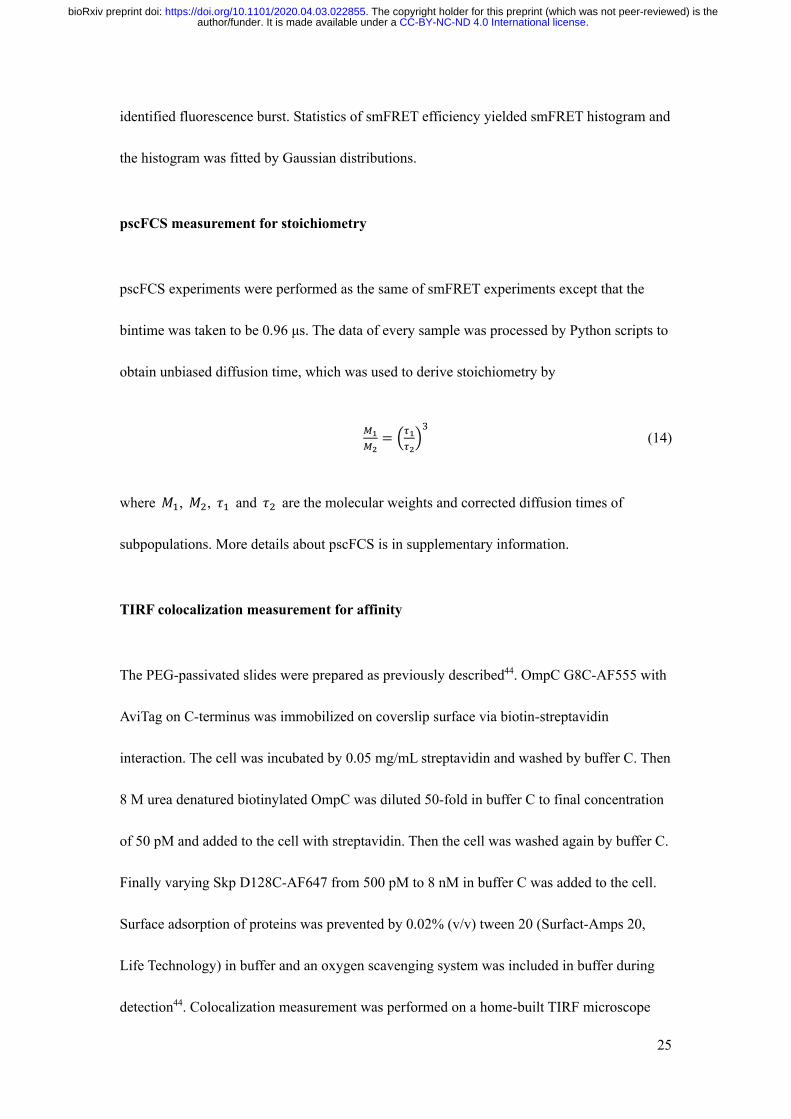
bintime was taken to be 0.96 μs. The data of every sample was processed by Python scripts to
obtain unbiased diffusion time, which was used to derive stoichiometry by
<(<!= 0,(
,!1= (14)
where 𝑀), 𝑀0, 𝜏) and 𝜏0 are the molecular weights and corrected diffusion times of
subpopulations. More details about pscFCS is in supplementary information.
TIRF colocalization measurement for affinity
The PEG-passivated slides were prepared as previously described44. OmpC G8C-AF555 with
AviTag on C-terminus was immobilized on coverslip surface via biotin-streptavidin
interaction. The cell was incubated by 0.05 mg/mL streptavidin and washed by buffer C. Then
8 M urea denatured biotinylated OmpC was diluted 50-fold in buffer C to final concentration
of 50 pM and added to the cell with streptavidin. Then the cell was washed again by buffer C.
Finally varying Skp D128C-AF647 from 500 pM to 8 nM in buffer C was added to the cell.
Surface adsorption of proteins was prevented by 0.02% (v/v) tween 20 (Surfact-Amps 20,
Life Technology) in buffer and an oxygen scavenging system was included in buffer during
detection44. Colocalization measurement was performed on a home-built TIRF microscope
.CC-BY-NC-ND 4.0 International licenseauthor/funder. It is made available under aThe copyright holder for this preprint (which was not peer-reviewed) is the. https://doi.org/10.1101/2020.04.03.022855doi: bioRxiv preprint

26
using alternating laser excitation (ALEX) between 532 nm and 640 nm at 23 °C44. Emitted
fluorescence from the molecules on surface was separated by filters and collected by a dual-
view EMCCD with frame frequency of 10 Hz. Colocalized fluorescence spots of donor and
acceptor excited by 532 nm laser were counted as described before44. Traces of monomeric
OmpC bound by Skp were selected to yield 640 nm-excited fluorescence counts histogram
and apparent smFRET efficiency histogram. Apparent smFRET efficiency was calculated by
equation (13).
Cross-linked fluorescent SDS-PAGE and retrieved single-molecule FRET
For the cross-linked fluorescent SDS-PAGE analysis, samples were prepared by 50-fold
dilution of OmpC G8C-AF647 into 0.6 μM of Skp with 0.3 μM of Skp D128C-Cy3B in
buffer C, and the final concentration of OmpC G8C-AF647 was 45 nM. Then the sample was
incubated at room temperature in the dark for 15 min before adding cross linker DSS (Thermo
Fisher) with a final concentration of 20 μM. The sample was incubated for another 30 min,
separated by SDS-PAGE and fluorescent imaged by Typhoon FLA 9500 (GE Healthcare). For
the retrieved smFRET experiments, samples were incubated and cross-linked as the same
procedures as described above. Then 1 M glycine was added to a final concentration of 10
mM to quench the cross-linking reaction. The sample was concentrated by centrifugal filter
units and separated by SDS-PAGE. The corresponding gel bands were excised and lysed in
200 μL buffer C at 4 °C, 220 rpm shaking overnight. Then the sample was centrifugated and
the supernatant was purified by centrifugal filter units with 10-fold volume of buffer C.
Finally, the sample was diluted in buffer C to single-molecule concentration to carry out the
.CC-BY-NC-ND 4.0 International licenseauthor/funder. It is made available under aThe copyright holder for this preprint (which was not peer-reviewed) is the. https://doi.org/10.1101/2020.04.03.022855doi: bioRxiv preprint
27
smFRET experiments.
Data Availability
The datasets and code in the study are available from the corresponding author on reasonable
request.
References
1 Ruiz, N., Kahne, D. & Silhavy, T. J. Advances in understanding bacterial outer-membrane biogenesis. Nat Rev Microbiol 4, 57-66, doi:10.1038/nrmicro1322 (2006).
2 Sklar, J. G., Wu, T., Kahne, D. & Silhavy, T. J. Defining the roles of the periplasmic chaperones SurA, Skp, and DegP in Escherichia coli. Genes Dev 21, 2473-2484, doi:10.1101/gad.1581007 (2007).
3 Wagner, J. K., Heindl, J. E., Gray, A. N., Jain, S. & Goldberg, M. B. Contribution of the periplasmic chaperone Skp to efficient presentation of the autotransporter IcsA on the surface of Shigella flexneri. J Bacteriol 191, 815-821, doi:10.1128/JB.00989-08 (2009).
4 Entzminger, K. C., Chang, C., Myhre, R. O., McCallum, K. C. & Maynard, J. A. The Skp chaperone helps fold soluble proteins in vitro by inhibiting aggregation. Biochemistry 51, 4822-4834, doi:10.1021/bi300412y (2012).
5 McMorran, L. M., Bartlett, A. I., Huysmans, G. H., Radford, S. E. & Brockwell, D. J. Dissecting the effects of periplasmic chaperones on the in vitro folding of the outer membrane protein PagP. J Mol Biol 425, 3178-3191, doi:10.1016/j.jmb.2013.06.017 (2013).
6 Li, G. et al. Single-Molecule detection reveals different roles of Skp and SurA as chaperones. ACS Chem Biol 13, 1082-1089, doi:10.1021/acschembio.8b00097 (2018).
7 Mecsas, J., Rouviere, P. E., Erickson, J. W., Donohue, T. J. & Gross, C. A. The activity of sigma E, an Escherichia coli heat-inducible sigma-factor, is modulated by expression of outer membrane proteins. Genes Dev 7, 2618-2628, doi:10.1101/gad.7.12b.2618 (1993).
.CC-BY-NC-ND 4.0 International licenseauthor/funder. It is made available under aThe copyright holder for this preprint (which was not peer-reviewed) is the. https://doi.org/10.1101/2020.04.03.022855doi: bioRxiv preprint
28
8 Johansen, J., Eriksen, M., Kallipolitis, B. & Valentin-Hansen, P. Down-regulation of outer membrane proteins by noncoding RNAs: unraveling the cAMP-CRP- and sigmaE-dependent CyaR-ompX regulatory case. J Mol Biol 383, 1-9, doi:10.1016/j.jmb.2008.06.058 (2008).
9 Korndorfer, I. P., Dommel, M. K. & Skerra, A. Structure of the periplasmic chaperone Skp suggests functional similarity with cytosolic chaperones despite differing architecture. Nat Struct Mol Biol 11, 1015-1020, doi:10.1038/nsmb828 (2004).
10 Walton, T. A. & Sousa, M. C. Crystal structure of Skp, a prefoldin-like chaperone that protects soluble and membrane proteins from aggregation. Mol Cell 15, 367-374, doi:10.1016/j.molcel.2004.07.023 (2004).
11 Lyu, Z. X., Shao, Q., Gao, Y. Q. & Zhao, X. S. Direct observation of the uptake of outer membrane proteins by the periplasmic chaperone Skp. PLoS One 7, e46068, doi:10.1371/journal.pone.0046068 (2012).
12 Holdbrook, D. A. et al. A spring-loaded mechanism governs the clamp-like dynamics of the Skp chaperone. Structure 25, 1079-1088 e1073, doi:10.1016/j.str.2017.05.018 (2017).
13 Schiffrin, B. et al. Skp is a multivalent chaperone of outer-membrane proteins. Nat Struct Mol Biol 23, 786-793, doi:10.1038/nsmb.3266 (2016).
14 Walton, T. A., Sandoval, C. M., Fowler, C. A., Pardi, A. & Sousa, M. C. The cavity-chaperone Skp protects its substrate from aggregation but allows independent folding of substrate domains. Proc Natl Acad Sci U S A 106, 1772-1777, doi:10.1073/pnas.0809275106 (2009).
15 Burmann, B. M., Wang, C. & Hiller, S. Conformation and dynamics of the periplasmic membrane-protein-chaperone complexes OmpX-Skp and tOmpA-Skp. Nat Struct Mol Biol 20, 1265-1272, doi:10.1038/nsmb.2677 (2013).
16 Horne, J. E. et al. Rapid mapping of protein interactions using tag-transfer photocrosslinkers. Angew Chem Int Ed Engl 57, 16688-16692, doi:10.1002/anie.201809149 (2018).
17 Thoma, J., Burmann, B. M., Hiller, S. & Muller, D. J. Impact of holdase chaperones Skp and SurA on the folding of beta-barrel outer-membrane proteins. Nat Struct Mol Biol 22, 795-802, doi:10.1038/nsmb.3087 (2015).
18 Sandlin, C. W., Zaccai, N. R. & Fleming, K. G. Skp trimer formation is insensitive to salts in the physiological range. Biochemistry 54, 7059-7062,
.CC-BY-NC-ND 4.0 International licenseauthor/funder. It is made available under aThe copyright holder for this preprint (which was not peer-reviewed) is the. https://doi.org/10.1101/2020.04.03.022855doi: bioRxiv preprint
29
doi:10.1021/acs.biochem.5b00806 (2015).
19 Qu, J., Mayer, C., Behrens, S., Holst, O. & Kleinschmidt, J. H. The trimeric periplasmic chaperone Skp of Escherichia coli forms 1:1 complexes with outer membrane proteins via hydrophobic and electrostatic interactions. J Mol Biol 374, 91-105, doi:10.1016/j.jmb.2007.09.020 (2007).
20 Knowles, T. J., Scott-Tucker, A., Overduin, M. & Henderson, I. R. Membrane protein architects: the role of the BAM complex in outer membrane protein assembly. Nat Rev Microbiol 7, 206-214, doi:10.1038/nrmicro2069 (2009).
21 Hoffmann, A. et al. Quantifying heterogeneity and conformational dynamics from single molecule FRET of diffusing molecules: recurrence analysis of single particles (RASP). Phys Chem Chem Phys 13, 1857-1871, doi:10.1039/c0cp01911a (2011).
22 Sisamakis, E., Valeri, A., Kalinin, S., Rothwell, P. J. & Seidel, C. A. Accurate single-molecule FRET studies using multiparameter fluorescence detection. Methods Enzymol 475, 455-514, doi:10.1016/S0076-6879(10)75018-7 (2010).
23 Holmstrom, E. D. et al. Accurate transfer efficiencies, distance distributions, and ensembles of unfolded and intrinsically disordered proteins from single-molecule FRET. Methods Enzymol 611, 287-325, doi:10.1016/bs.mie.2018.09.030 (2018).
24 Wang, P., Yang, L., Liu, P., Gao, Y. Q. & Zhao, X. S. Single-molecule detection reveals knot sliding in TrmD denaturation. Chem Eur J 19, 5909-5916, doi:10.1002/chem.201203809 (2013).
25 Wu, S. et al. Interaction between bacterial outer membrane proteins and periplasmic quality control factors: a kinetic partitioning mechanism. Biochem J 438, 505-511, doi:10.1042/BJ20110264 (2011).
26 Plummer, A. M. & Fleming, K. G. From chaperones to the membrane with a BAM! Trends Biochem Sci 41, 872-882, doi:10.1016/j.tibs.2016.06.005 (2016).
27 Horne, J. E. & Radford, S. E. A growing toolbox of techniques for studying beta-barrel outer membrane protein folding and biogenesis. Biochem Soc Trans 44, 802-809, doi:10.1042/BST20160020 (2016).
28 Harms, N. et al. The early interaction of the outer membrane protein phoe with the periplasmic chaperone Skp occurs at the cytoplasmic membrane. J Biol Chem 276, 18804-18811, doi:10.1074/jbc.M011194200 (2001).
29 Schafer, U., Beck, K. & Muller, M. Skp, a molecular chaperone of gram-negative
.CC-BY-NC-ND 4.0 International licenseauthor/funder. It is made available under aThe copyright holder for this preprint (which was not peer-reviewed) is the. https://doi.org/10.1101/2020.04.03.022855doi: bioRxiv preprint
30
bacteria, is required for the formation of soluble periplasmic intermediates of outer membrane proteins. J Biol Chem 274, 24567-24574 (1999).
30 Costello, S. M., Plummer, A. M., Fleming, P. J. & Fleming, K. G. Dynamic periplasmic chaperone reservoir facilitates biogenesis of outer membrane proteins. Proc Natl Acad Sci U S A 113, E4794-4800, doi:10.1073/pnas.1601002113 (2016).
31 Moon, C. P., Zaccai, N. R., Fleming, P. J., Gessmann, D. & Fleming, K. G. Membrane protein thermodynamic stability may serve as the energy sink for sorting in the periplasm. Proc Natl Acad Sci U S A 110, 4285-4290, doi:10.1073/pnas.1212527110 (2013).
32 Hiller, S. Chaperone-bound clients: the importance of being dynamic. Trends in Biochemical Sciences 44, 517-527, doi:10.1016/j.tibs.2018.12.005 (2019).
33 Jarchow, S., Luck, C., Gorg, A. & Skerra, A. Identification of potential substrate proteins for the periplasmic Escherichia coli chaperone Skp. Proteomics 8, 4987-4994, doi:10.1002/pmic.200800288 (2008).
34 Zaccai, N. R. et al. Deuterium labeling together with contrast variation small-angle neutron scattering suggests how Skp captures and releases unfolded outer membrane proteins. Methods Enzymol 566, 159-210, doi:10.1016/bs.mie.2015.06.041 (2016).
35 Bulieris, P. V., Behrens, S., Holst, O. & Kleinschmidt, J. H. Folding and insertion of the outer membrane protein OmpA is assisted by the chaperone Skp and by lipopolysaccharide. J Biol Chem 278, 9092-9099, doi:10.1074/jbc.M211177200 (2003).
36 Burmann, B. M., Holdbrook, D. A., Callon, M., Bond, P. J. & Hiller, S. Revisiting the interaction between the chaperone Skp and lipopolysaccharide. Biophys J 108, 1516-1526, doi:10.1016/j.bpj.2015.01.029 (2015).
37 Rizzitello, A. E., Harper, J. R. & Silhavy, T. J. Genetic evidence for parallel pathways of chaperone activity in the periplasm of Escherichia coli. J Bacteriol 183, 6794-6800, doi:10.1128/JB.183.23.6794-6800.2001 (2001).
38 Wu, T. et al. Identification of a multicomponent complex required for outer membrane biogenesis in Escherichia coli. Cell 121, 235-245, doi:10.1016/j.cell.2005.02.015 (2005).
39 Schiffrin, B. et al. Effects of periplasmic chaperones and membrane thickness on BamA-catalyzed outer-membrane protein folding. J Mol Biol 429, 3776-3792, doi:10.1016/j.jmb.2017.09.008 (2017).
.CC-BY-NC-ND 4.0 International licenseauthor/funder. It is made available under aThe copyright holder for this preprint (which was not peer-reviewed) is the. https://doi.org/10.1101/2020.04.03.022855doi: bioRxiv preprint
31
40 Rhodius, V. A., Suh, W. C., Nonaka, G., West, J. & Gross, C. A. Conserved and variable functions of the sigmaE stress response in related genomes. PLoS Biol 4, e2, doi:10.1371/journal.pbio.0040002 (2006).
41 Wu, Z., Bi, H., Pan, S., Meng, L. & Zhao, X. S. Determination of equilibrium constant and relative brightness in fluorescence correlation spectroscopy by considering third-order correlations. J Phys Chem B 120, 11674-11682, doi:10.1021/acs.jpcb.6b07953 (2016).
42 Meng, L., He, S. & Zhao, X. S. Determination of equilibrium constant and relative brightness in FRET-FCS by including the third-order correlations. J Phys Chem B 121, 11262-11272, doi:10.1021/acs.jpcb.7b09229 (2017).
43 Chen, X., Zhou, Y., Qu, P. & Zhao, X. S. Base-by-base dynamics in DNA hybridization probed by fluorescence correlation spectroscopy. J Am Chem Soc 130, 16947-16952, doi:10.1021/ja804628x (2008).
44 Peng, S. J., Sun, R. R., Wang, W. J. & Chen, C. L. Single-molecule photoactivation FRET: a general and easy-to-implement approach to break the concentration barrier. Angew Chem Int Edit 56, 6882-6885, doi:10.1002/anie.201702731 (2017).
Acknowledgements
We thank Ms. S. Peng and Prof. C. Chen of Tsinghua University for their kind assistance with
the TIRF experiment. The project was supported by NSFC (21521003 and 21233002) and
NKBRSF (2012CB917304).
Authors Contributions
S.C.P. and X.S.Z. conceived this study. S.C.P. performed simulation, crosslinked SDS-PAGE
experiments and single-molecule fluorescence experiments. C.Y. performed biotinylated
sample preparation. S.C.P. and X.S.Z analysed experimental results and wrote the paper. All
authors reviewed the manuscript.
.CC-BY-NC-ND 4.0 International licenseauthor/funder. It is made available under aThe copyright holder for this preprint (which was not peer-reviewed) is the. https://doi.org/10.1101/2020.04.03.022855doi: bioRxiv preprint

32
Competing interests
The authors declare no competing interests.
.CC-BY-NC-ND 4.0 International licenseauthor/funder. It is made available under aThe copyright holder for this preprint (which was not peer-reviewed) is the. https://doi.org/10.1101/2020.04.03.022855doi: bioRxiv preprint