+ chapter 17 database design using the rea data model copyright © 2012 pearson education, inc....
TRANSCRIPT
Copyright © 2012 Pearson Education, Inc. publishing as Prentice Hall
+
Chapter 17
Database Design Using the REA Data Model
17-1
Learning Objectives
Discuss the steps for designing and implementing a database system.
Use the REA data model to design an AIS database.
Draw an REA diagram of an AIS database.
Read an REA diagram and explain what it reveals about the business activities and policies of the organization being modeled.
Copyright © 2012 Pearson Education, Inc. publishing as Prentice Hall
17-2
Copyright 2012 © Pearson Education, Inc. publishing as Prentice Hall
+Database Design Process
17-3

Copyright 2012 © Pearson Education, Inc. publishing as Prentice Hall
+The System Analysis Process
Systems analysis initial planning to determine the need for and feasibility of developing a new system.
judgments about the proposal’s technological and economic feasibility. identify user information needs define the scope of the proposed new system gather information about the expected number of users and transaction volumes to make
preliminary decisions about hardware and software requirements.
Conceptual design developing the different schemas for the new system at the conceptual, external, and internal levels.
Physical design translating the internal- level schema into the actual database structures that will be implemented in
the new system new applications are developed
Implementation and Conversion Includes all the activities associated with transferring data from existing systems to the new
database AIS testing the new system training employees
Maintaining the new system.
17-4
Copyright 2012 © Pearson Education, Inc. publishing as Prentice Hall
+Data Modeling
Process of defining an Information System so it represents an organizations requirements.
Occurs at two stages of the Design Process: System Analysis Conceptual Design
Data Models: Data Flow Diagrams (Chapter 3) Flow Charts (Chapter 3) Entity-Relationship Diagrams (Chapter 8/17)
17-5

Copyright 2012 © Pearson Education, Inc. publishing as Prentice Hall
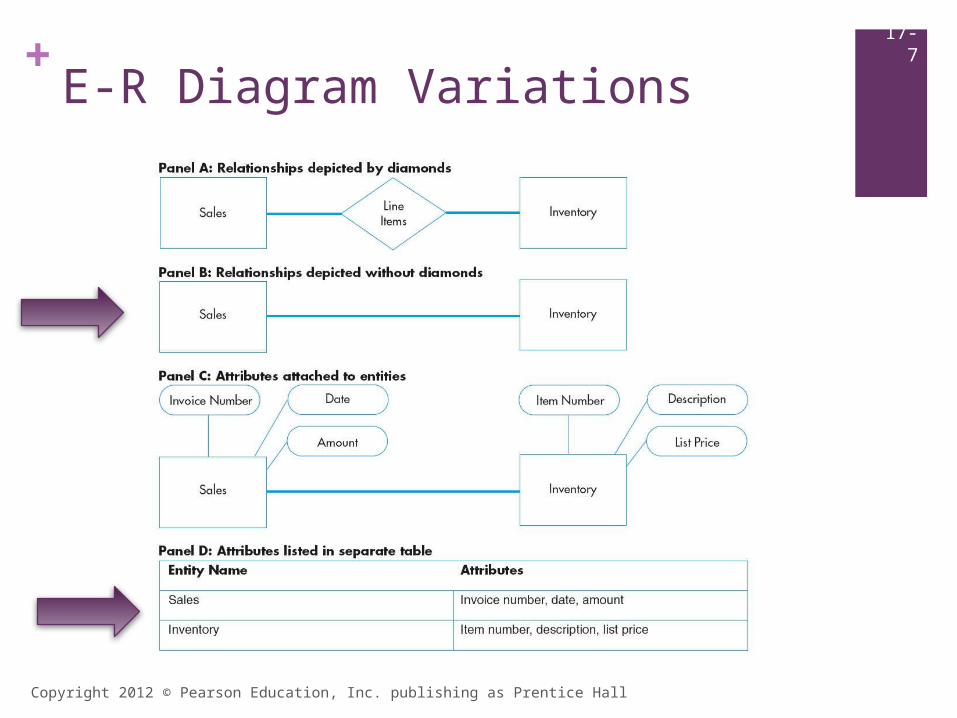
+Entity Relationship Diagrams
Used to graphically represent a database schema
Depicts Entities Anything an Organization wants to collect information
about
Relationships between Entities
17-6
+
Copyright 2012 © Pearson Education, Inc. publishing as Prentice Hall
E-R Diagram Variations17-
7
Copyright 2012 © Pearson Education, Inc. publishing as Prentice Hall
+Resources-Events-AgentsAn AIS E-R Diagram
Developed for designing AIS Categorizing Entities into:
Resources Organization Acquires and Uses (Give/Get) Things that have economic value
Events Business Activities Management wants to Manage and Control Typically the Activities that comprise an Business Cycle
Agents People and Organizations that participate in Events
17-8
+
Copyright 2012 © Pearson Education, Inc. publishing as Prentice Hall
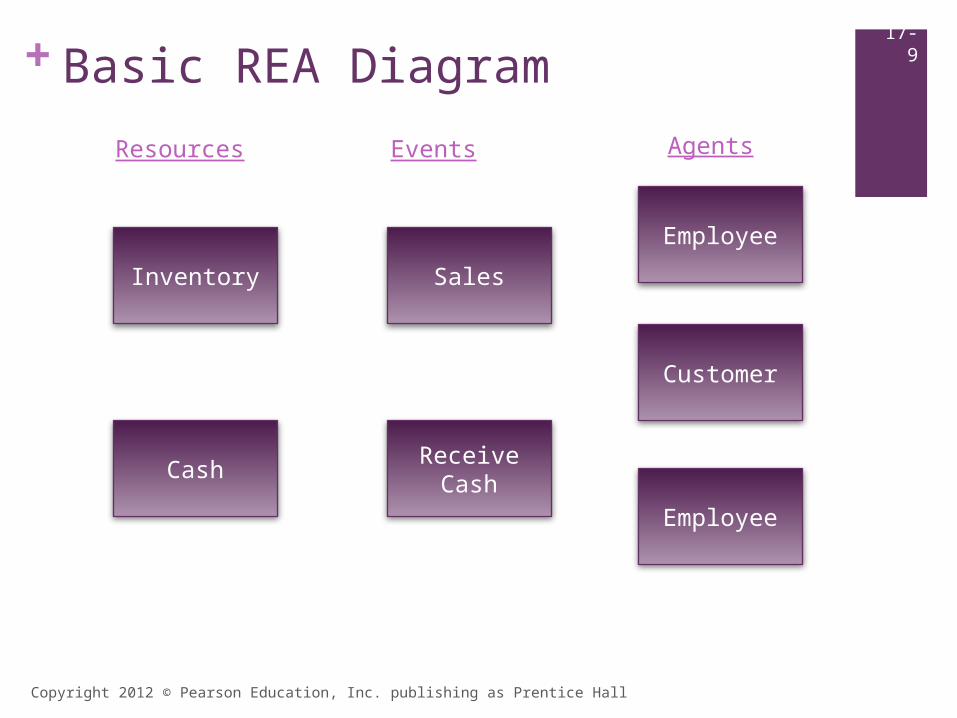
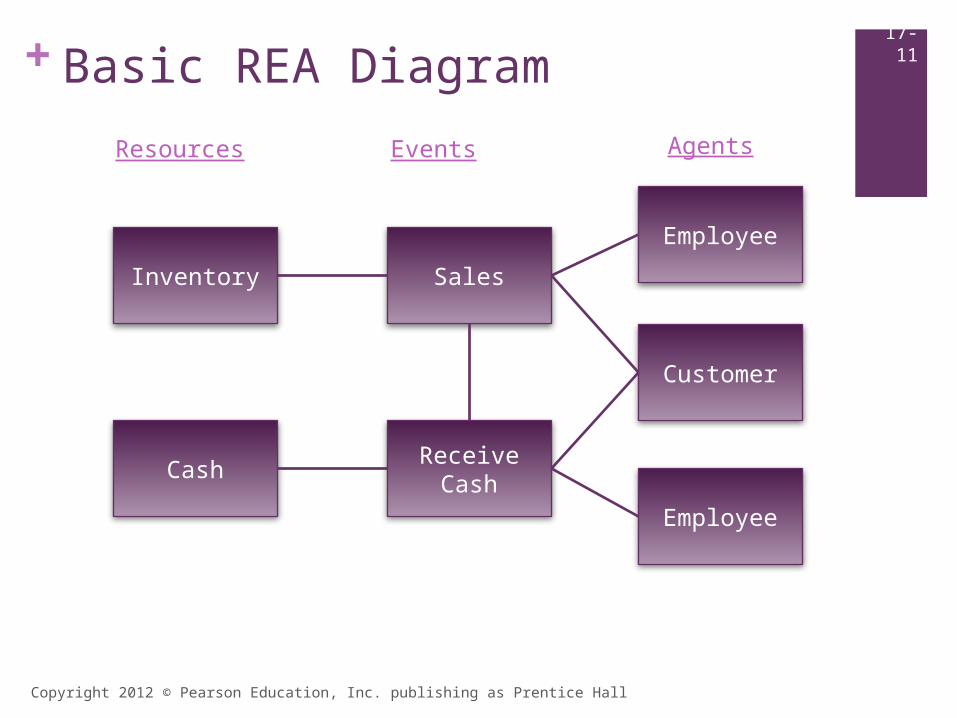
Basic REA Diagram17-
9
Inventory
Cash
Resources
Sales
ReceiveCash
Events
Customer
Employee
Employee
Agents
Copyright 2012 © Pearson Education, Inc. publishing as Prentice Hall
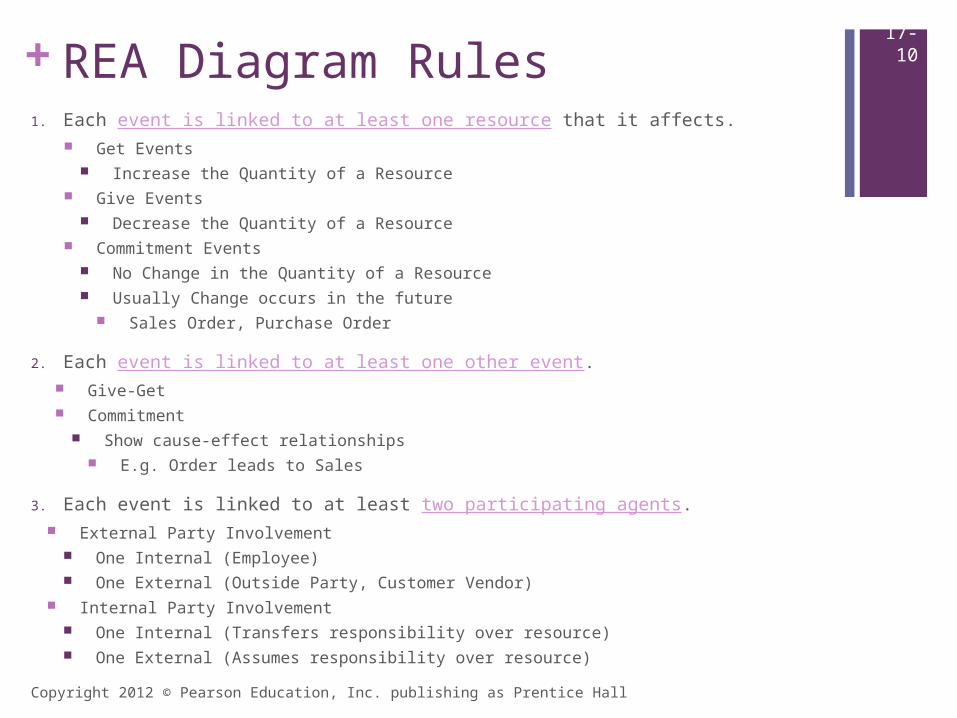
+REA Diagram Rules1. Each event is linked to at least one resource that it affects.
Get Events Increase the Quantity of a Resource
Give Events Decrease the Quantity of a Resource
Commitment Events No Change in the Quantity of a Resource Usually Change occurs in the future
Sales Order, Purchase Order
2. Each event is linked to at least one other event. Give-Get Commitment
Show cause-effect relationships E.g. Order leads to Sales
3. Each event is linked to at least two participating agents. External Party Involvement
One Internal (Employee) One External (Outside Party, Customer Vendor)
Internal Party Involvement One Internal (Transfers responsibility over resource) One External (Assumes responsibility over resource)
17-10
+
Copyright 2012 © Pearson Education, Inc. publishing as Prentice Hall
Basic REA Diagram17-11
Inventory
Cash
Resources
Sales
ReceiveCash
Events
Customer
Employee
Employee
Agents
+
Copyright 2012 © Pearson Education, Inc. publishing as Prentice Hall
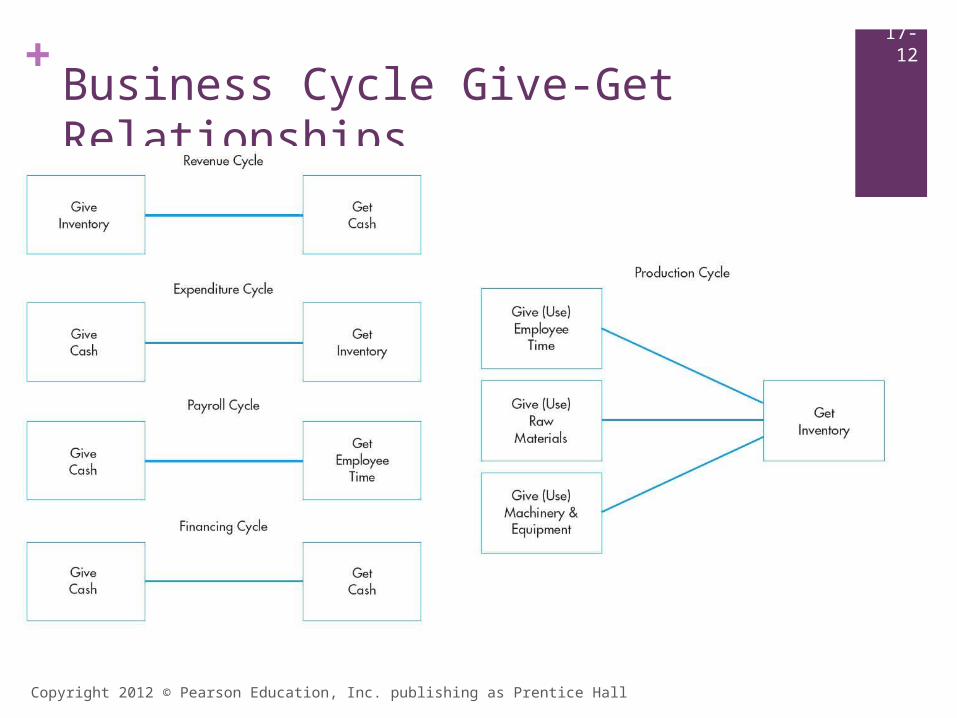
Business Cycle Give-Get Relationships
17-12
Copyright 2012 © Pearson Education, Inc. publishing as Prentice Hall
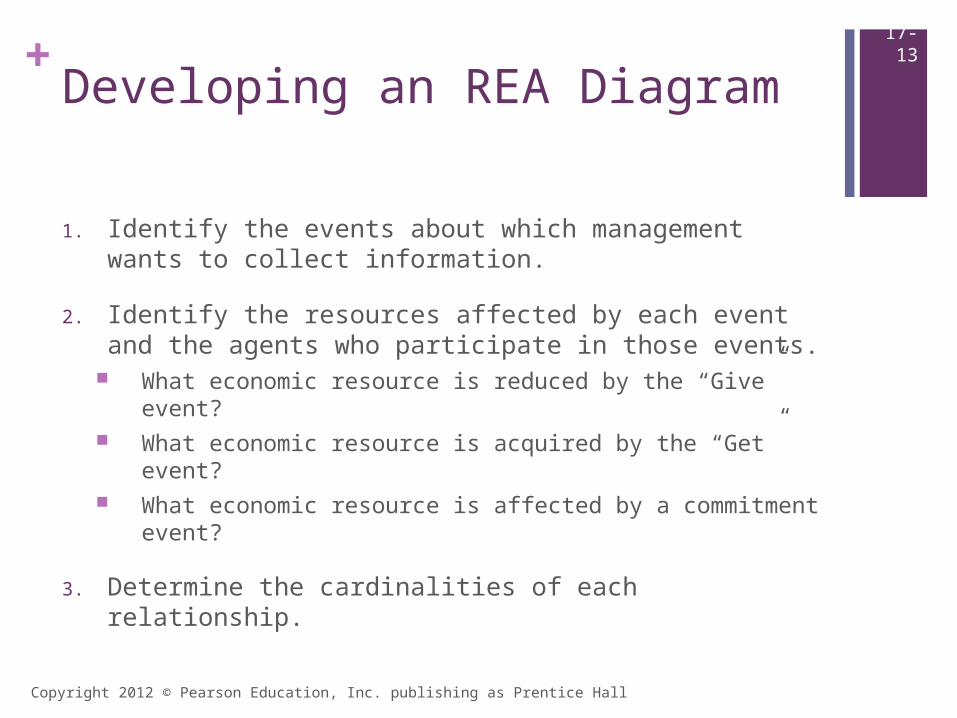
+Developing an REA Diagram
1. Identify the events about which management wants to collect information.
2. Identify the resources affected by each event and the agents who participate in those events.
What economic resource is reduced by the “Give” event? What economic resource is acquired by the “Get” event? What economic resource is affected by a commitment
event?
3. Determine the cardinalities of each relationship.
17-13

+Revenue Cycle Activities
1. Sales order entry Commitment
2. Shipping/Fill Order Give
3. Billing Information
Processing
4. Cash collections Get
Copyright © 2012 Pearson Education, Inc. publishing as Prentice Hall
12-14

Copyright 2012 © Pearson Education, Inc. publishing as Prentice Hall
+REA Diagram Guidelines
Resources on the Left
Agents on the Right
Events in the Middle Event Order should correspond to Timing of Event from Top-
to-Bottom
17-15
+
Copyright 2012 Pearson Education, Inc. publishing as Prentice Hall
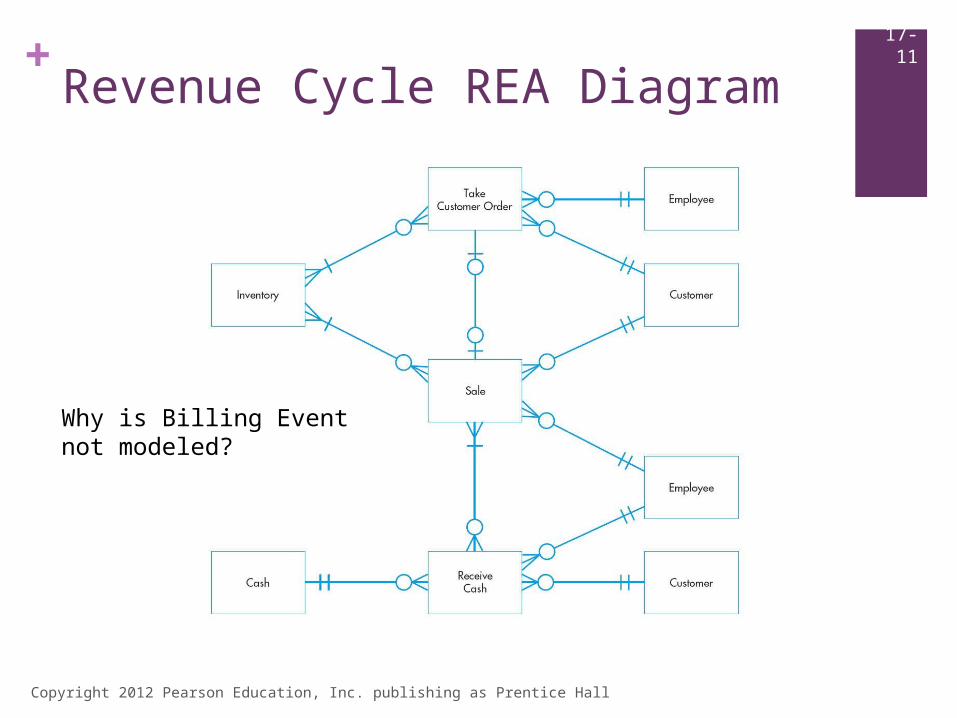
Revenue Cycle REA Diagram17-11
Why is Billing Eventnot modeled?
Copyright 2012 © Pearson Education, Inc. publishing as Prentice Hall
+Cardinalities
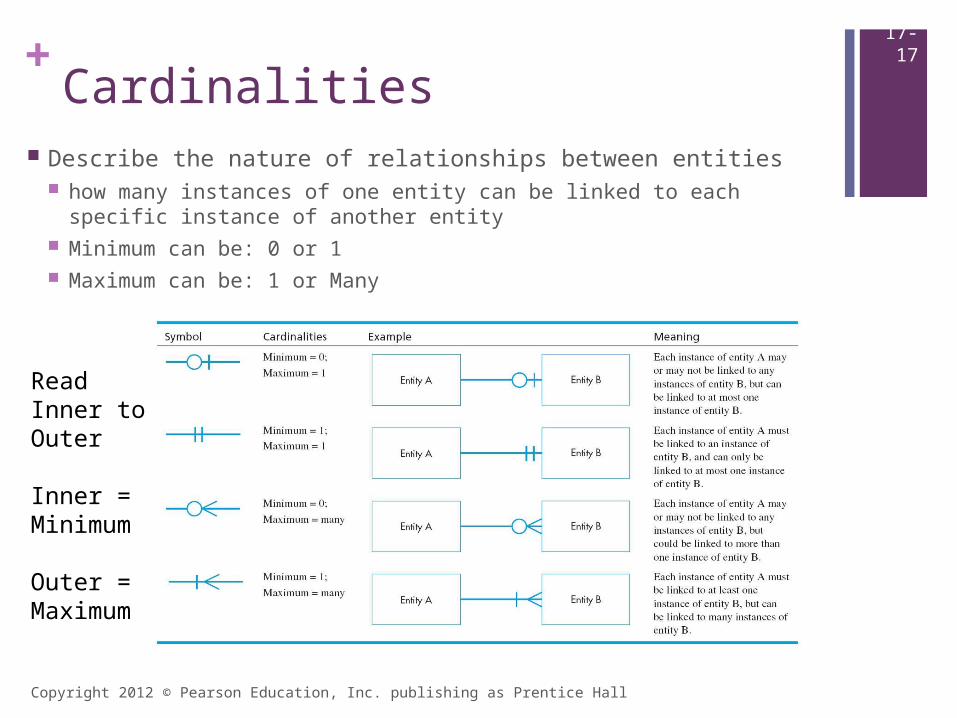
Describe the nature of relationships between entities how many instances of one entity can be linked to each specific
instance of another entity Minimum can be: 0 or 1 Maximum can be: 1 or Many
17-17
Read Inner to Outer
Inner = Minimum
Outer = Maximum
Copyright 2012 © Pearson Education, Inc. publishing as Prentice Hall
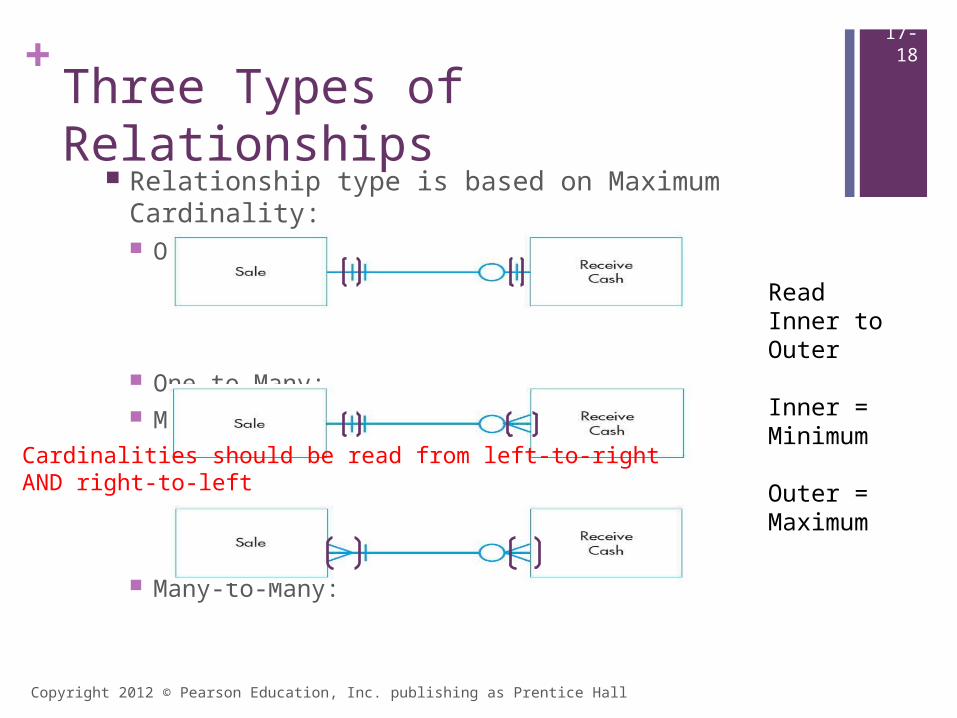
+Three Types of Relationships
Relationship type is based on Maximum Cardinality: One-to-One:
One-to-Many: Many-to-One
Many-to-Many:
17-18
Read Inner to Outer
Inner = Minimum
Outer = Maximum
Cardinalities should be read from left-to-right AND right-to-left
Copyright 2012 © Pearson Education, Inc. publishing as Prentice Hall
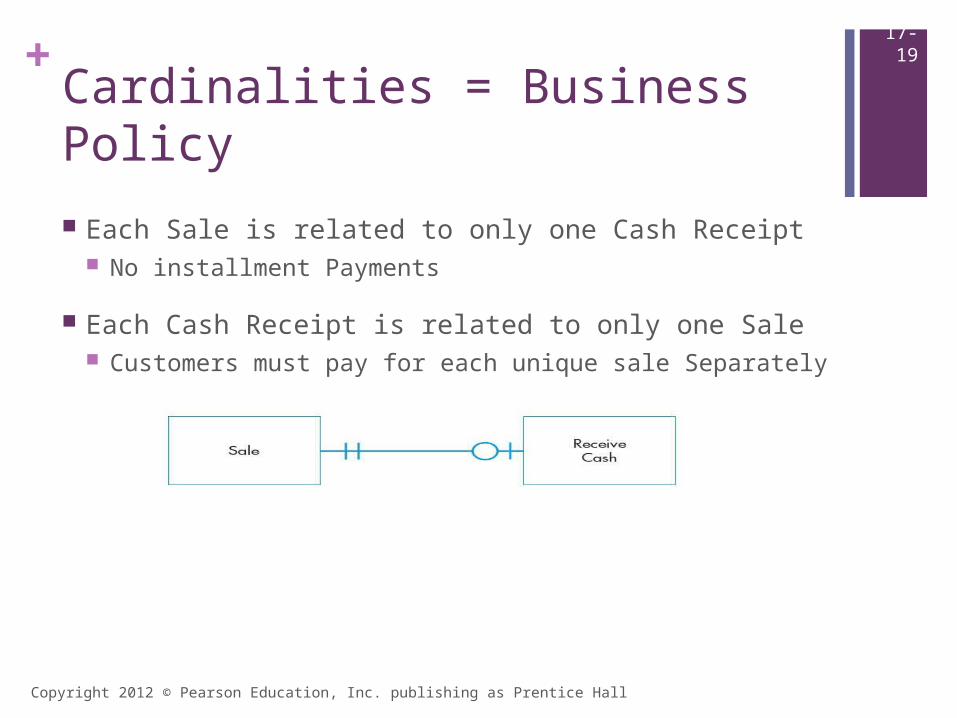
+Cardinalities = Business Policy
Each Sale is related to only one Cash Receipt No installment Payments
Each Cash Receipt is related to only one Sale Customers must pay for each unique sale Separately
17-19
+
Copyright 2012 © Pearson Education, Inc. publishing as Prentice Hall
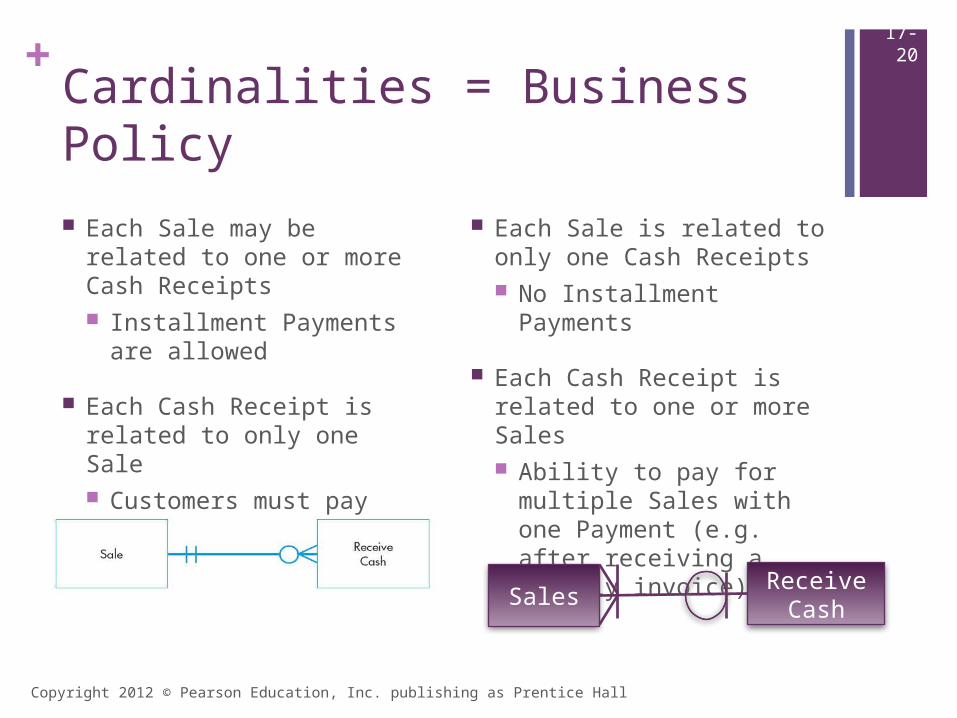
Cardinalities = Business Policy
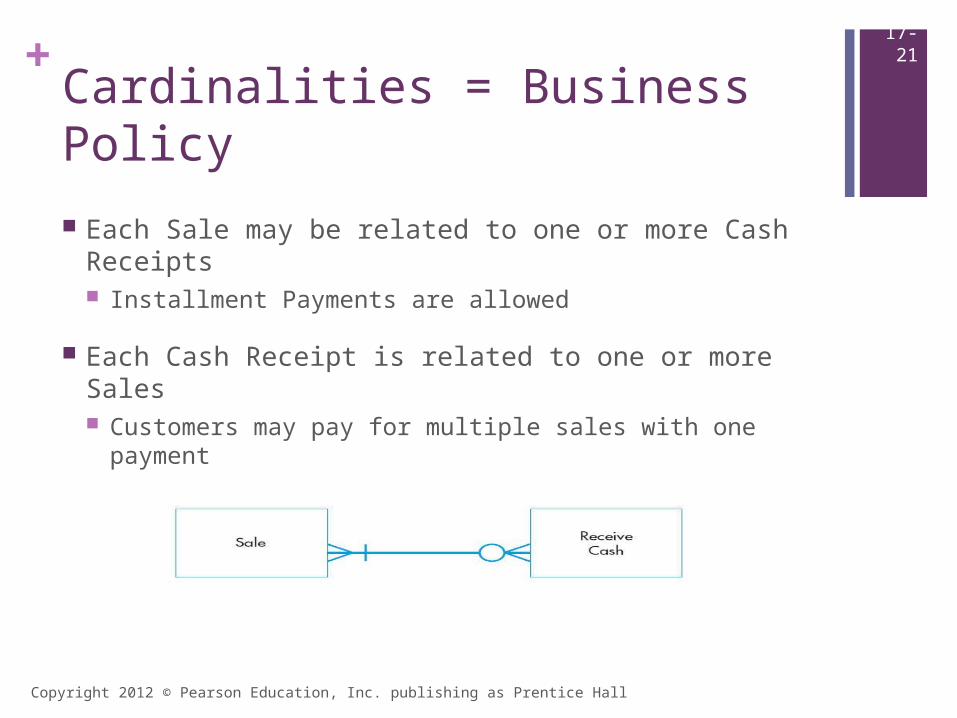
Each Sale may be related to one or more Cash Receipts Installment Payments are
allowed
Each Cash Receipt is related to only one Sale Customers must pay for
each unique sale Separately
Each Sale is related to only one Cash Receipts No Installment Payments
Each Cash Receipt is related to one or more Sales Ability to pay for multiple
Sales with one Payment (e.g. after receiving a monthly invoice)
17-20
SalesReceive
Cash
Copyright 2012 © Pearson Education, Inc. publishing as Prentice Hall
+Cardinalities = Business Policy
Each Sale may be related to one or more Cash Receipts Installment Payments are allowed
Each Cash Receipt is related to one or more Sales Customers may pay for multiple sales with one payment
17-21
+
Copyright 2012 © Pearson Education, Inc. publishing as Prentice Hall
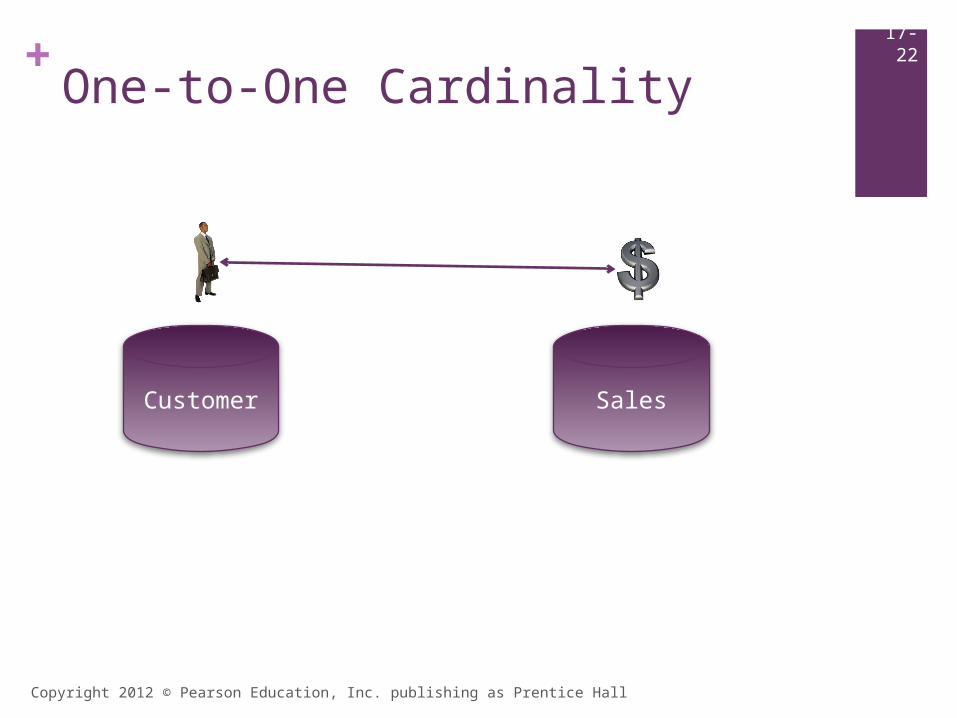
One-to-One Cardinality17-22
Customer Sales
+
Copyright 2012 © Pearson Education, Inc. publishing as Prentice Hall
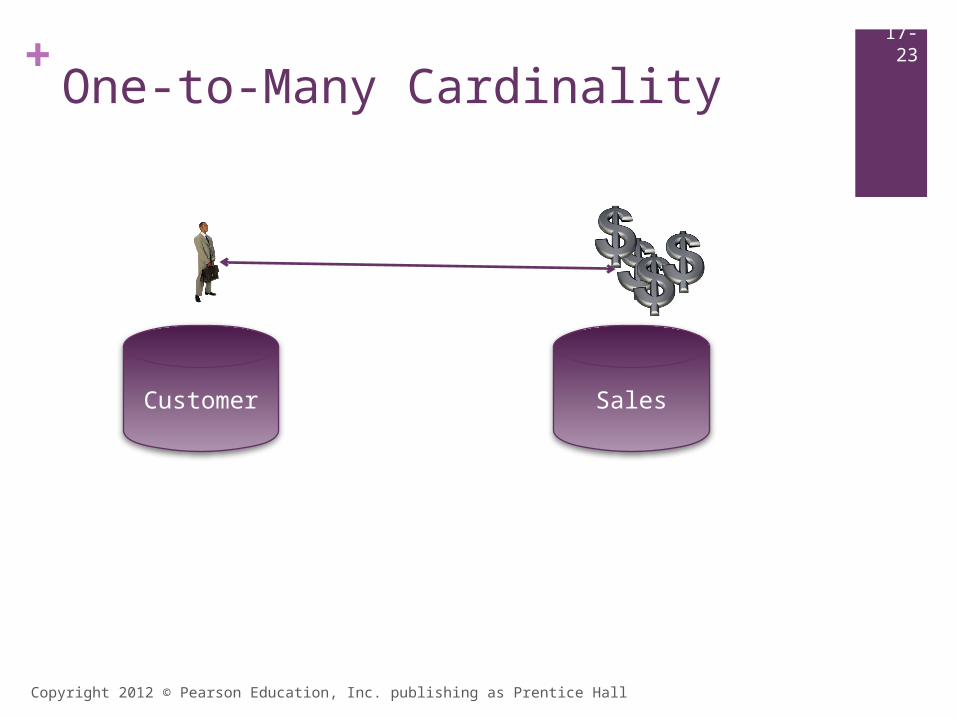
One-to-Many Cardinality17-23
Customer Sales

+
Copyright 2012 © Pearson Education, Inc. publishing as Prentice Hall
Many-to-Many Cardinality17-24
Customer Sales

+
Copyright 2012 Pearson Education, Inc. publishing as Prentice Hall
Revenue Cycle REA Diagram17-11
Agent:Event is 0:N (min:max)
This allows for an Agent to be related with multiple events (e.g. a Customer can have many Orders/Sales/Payments) Note: the optional minimum cardinality, this denotes that an Agent does NOT have to be related to an Event
Event:Agent is 1:1
This means that each event can only be related to one agent (and only one)
+
Copyright 2012 Pearson Education, Inc. publishing as Prentice Hall
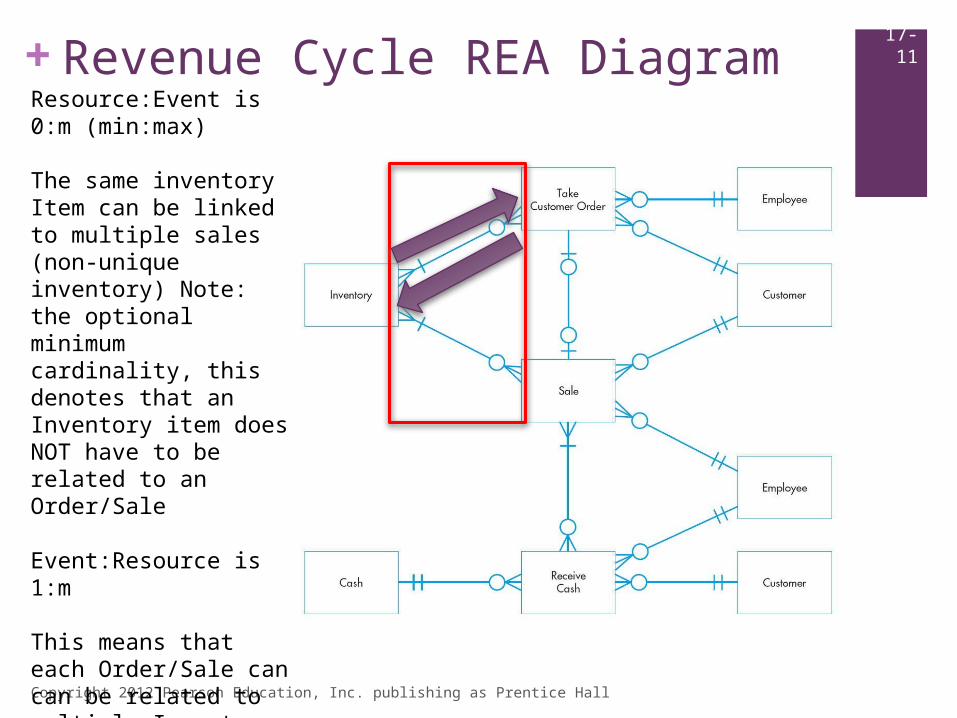
Revenue Cycle REA Diagram17-11
Resource:Event is 0:m (min:max)
The same inventory Item can be linked to multiple sales (non-unique inventory) Note: the optional minimum cardinality, this denotes that an Inventory item does NOT have to be related to an Order/Sale
Event:Resource is 1:m
This means that each Order/Sale can can be related to multiple Inventory items, but must be related to at least one
+
Copyright 2012 Pearson Education, Inc. publishing as Prentice Hall
Revenue Cycle REA Diagram17-11
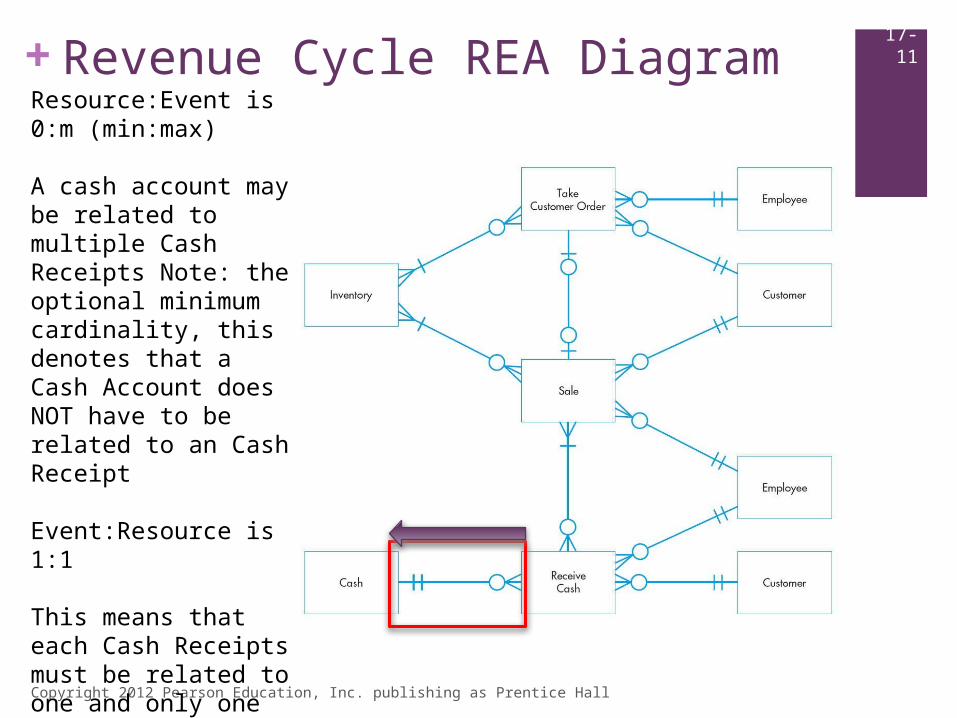
Resource:Event is 0:m (min:max)
A cash account may be related to multiple Cash Receipts Note: the optional minimum cardinality, this denotes that a Cash Account does NOT have to be related to an Cash Receipt
Event:Resource is 1:1
This means that each Cash Receipts must be related to one and only one Cash Account.
+
Copyright 2012 Pearson Education, Inc. publishing as Prentice Hall
Revenue Cycle REA Diagram17-11
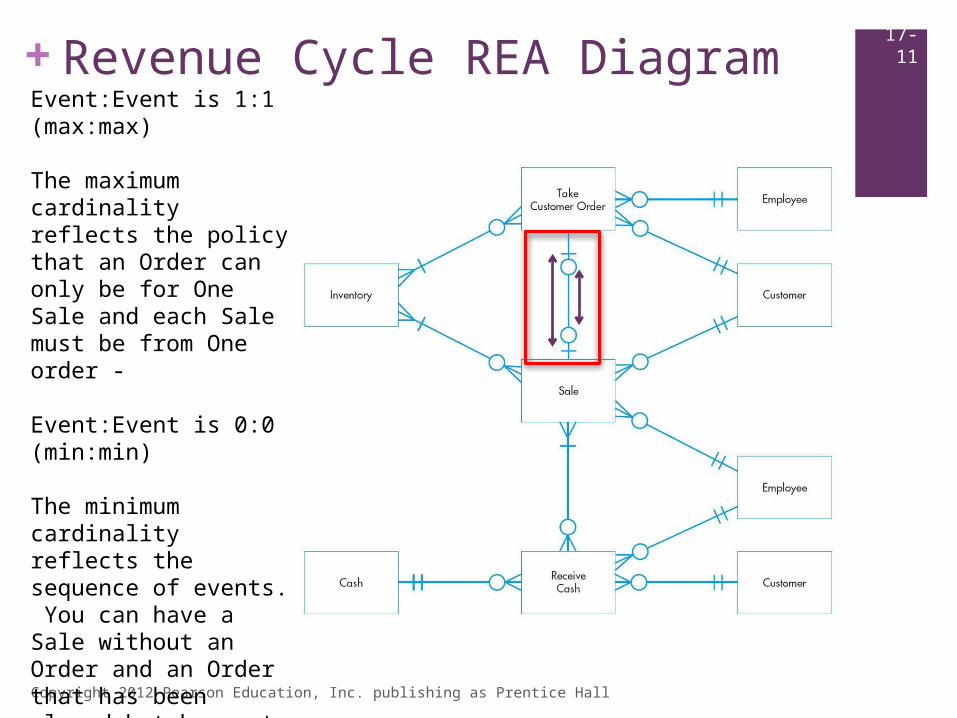
Event:Event is 1:1 (max:max)
The maximum cardinality reflects the policy that an Order can only be for One Sale and each Sale must be from One order -
Event:Event is 0:0 (min:min)
The minimum cardinality reflects the sequence of events. You can have a Sale without an Order and an Order that has been placed but has not resulted in a Sale
+
Copyright 2012 Pearson Education, Inc. publishing as Prentice Hall
Revenue Cycle REA Diagram17-11
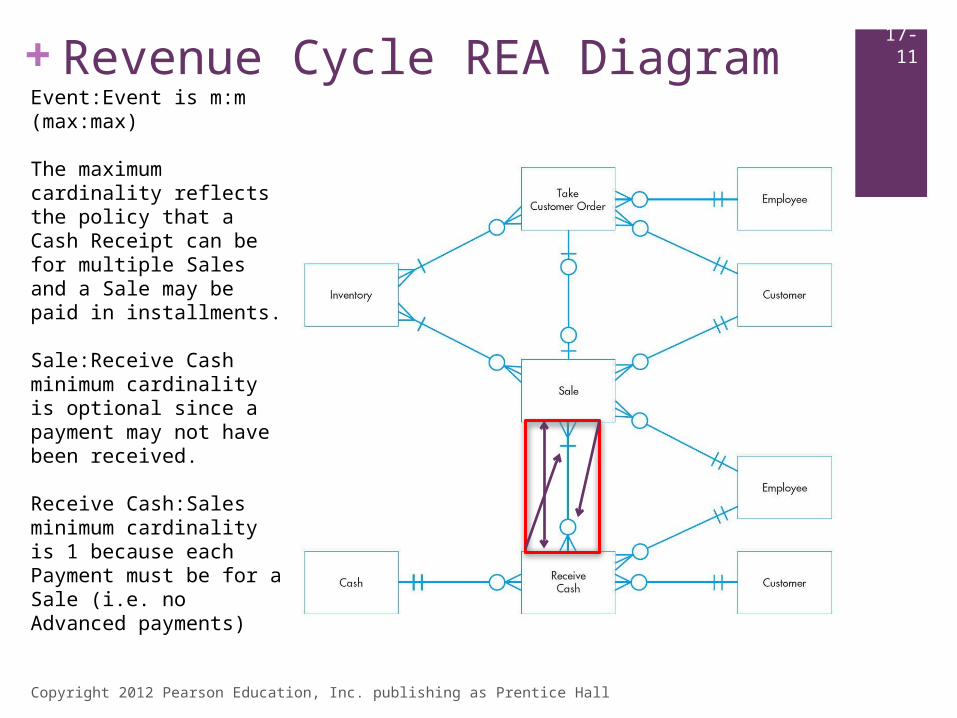
Event:Event is m:m (max:max)
The maximum cardinality reflects the policy that a Cash Receipt can be for multiple Sales and a Sale may be paid in installments.
Sale:Receive Cash minimum cardinality is optional since a payment may not have been received.
Receive Cash:Sales minimum cardinality is 1 because each Payment must be for a Sale (i.e. no Advanced payments)
Copyright 2012 Pearson Education, Inc. publishing as Prentice Hall
+
Let’s Practice
Problem 5
30
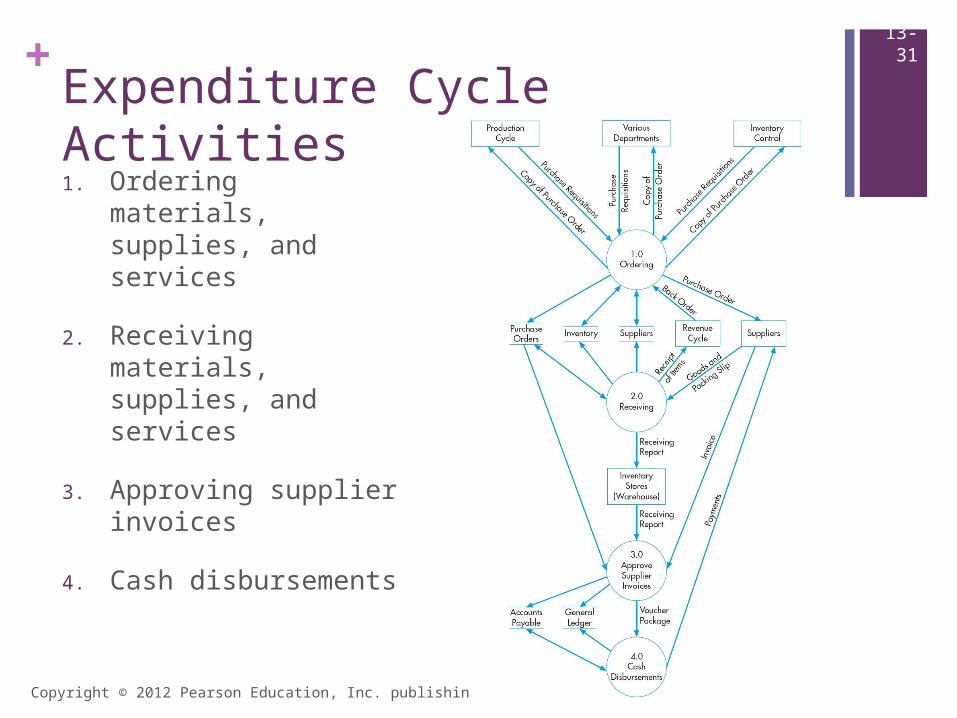
+Expenditure Cycle Activities
1. Ordering materials, supplies, and services
2. Receiving materials, supplies, and services
3. Approving supplier invoices
4. Cash disbursements
Copyright © 2012 Pearson Education, Inc. publishing as Prentice Hall
13-31

Copyright 2012 © Pearson Education, Inc. publishing as Prentice Hall
+Fred’s Train Shop
Develop a data model of Fred’s Train Shop’s expenditure cycle activities related to the acquisition of office equipment and other fixed assets. Fred sometimes orders multiple pieces of equipment. Vendors usually ship the entire order, but sometimes are out of stock of some items. In such cases, they immediately ship to Fred what they have in stock, and then send a second shipment when they obtain the other items. Conversely, several orders placed within a short time period with the same vendor might be filled with one delivery. Assume that Fred makes installment payments for most fixed-asset acquisitions, but occasionally pays for some equipment in full at the time of purchase.
17-32
Copyright 2012 © Pearson Education, Inc. publishing as Prentice Hall
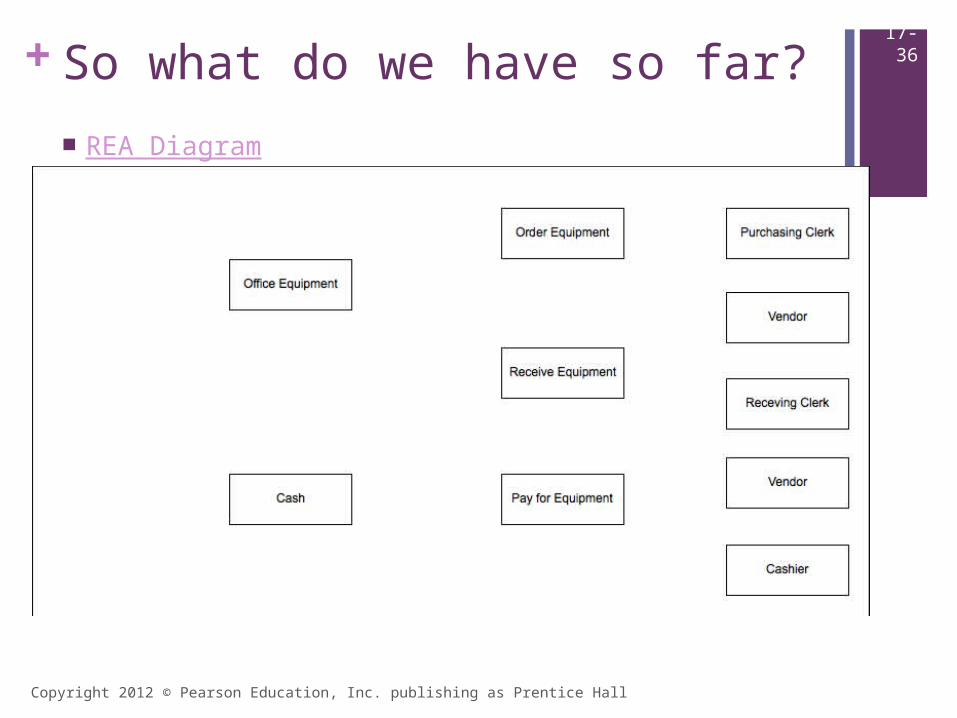
+Identify Events
Order Office Equipment
Receive Office Equipment
Pay for Equipment
17-33
Copyright 2012 © Pearson Education, Inc. publishing as Prentice Hall
+Identify Resources / Give - Get
Office Equipment (Get)
Cash (Give)
Order:Receive Commitment
Receive:Pay (Get)
17-34
Copyright 2012 © Pearson Education, Inc. publishing as Prentice Hall
+Identify Agents
Internal Employee
Purchasing Clerk Receiving Clerk Cashier
External Supplier/Vendor
17-35
Copyright 2012 © Pearson Education, Inc. publishing as Prentice Hall
+So what do we have so far?
REA Diagram
17-36
Copyright 2012 © Pearson Education, Inc. publishing as Prentice Hall
+Identify Cardinalities
Event:Agent
Agent:Event
Event:Resource
Resource:Event
Event:Event (x 2, i.e. both ways)
17-37