-chapter 12personalsiteofannchong.weebly.com/uploads/1/9/0/7/...of the attitude measurement scales...
TRANSCRIPT
-chapter 12Measurement Scales
'- .. ,:' .
I !!,.f~j~~~~l~~t~~~&"~;i",.,. ... Aff~r+~adir1gthis chapter, you shotJld u~derstand •...
1 The nature of attitudes and their relationship to behavior.
2 The critical decisions involved in selecting an appropriate measurement scale.
3 The characteristics and use of rating, ranking. sorting. and other preference scales.

,,
" I
II
IIII
>bringingresearchtolife MI_~
'~;slli~~~~P~'f~~!~3:;'ry~\.=~a1o;o,~efli~~=~::':II~!~~O:>~~t~@""".;C"",,,r;<>.,.~::a~::::::~~! ~:::l:~er one question to my .expectations' and'FUllyillerexpecta'. ," .'.
"Itcok-marketlng researchin college and didn'tliket~'so you talk fast, straight, and plainly unless we' both .;ecide we need to get technical. If the phone-rings,
ore it and keep talking. When you answer my oneestion, I'll put you off the plane in the first Florida
itythat has a commercial flight back to ... to ... ". "This is Palm Beach, Jean-Claude," says theeward.
"What I don't like is that you are going to holderything up so you can develop a scale for the worktowhoeverperf0nnspetfer~ We-re.~l(m~tsH
.~:~~:~~::. :::i~!:e~h=~ ~i~::!i~:~:U::k:::, ~~~::e~eJ~~~:~t~::~i~v;:~!~~~::~;~~~l;':i,':"":;Why can't you use some of the scales our marketing "I can accept that: Good." TlleIiIanaier;$Cri~~1.e~~hiS .
. . ~.., - - -.-:people have been using? Why do you have to reinvent signature on the contract, "You'll receive this contractthe wheel?" The manager is looking toward Myra. in three pays; after it hasweaded its ~~kp~ftJi~;papei
"Our research staff agrees with us that it would be pushers. Meantime, we'll Settle for ahantl~h~~tNi2einappropriate to adapt surveys developed for use in our . job, So far, Myra.You seem'to have goti~!l~9.~icks:tartConsumer products line," says Myra smoothly. with MindWriter. Congratulations, Jason., "OK. Computers are not the same as toaster ovens "Turn the plane around and put these-folks out where1~~~::;::2~~E~:~:u:~~:nc:u::~:::~;~{!:~jf~~~~~5flI~l~:;i:.·~,.,~<·:;.",':.,.,ey continually referred to the need for your product ""Yot1dolookpaIe," saysMyra,syinpaU;ietically:
rvice to 'meet expectations' or 'exceed expectations.' ."Fais gaffe, tu m'fais mall"he irhih~~sunderhis
e hundredth time we heard this we realized ... " breath.
292 >part III TheSourcesandCollectionofData
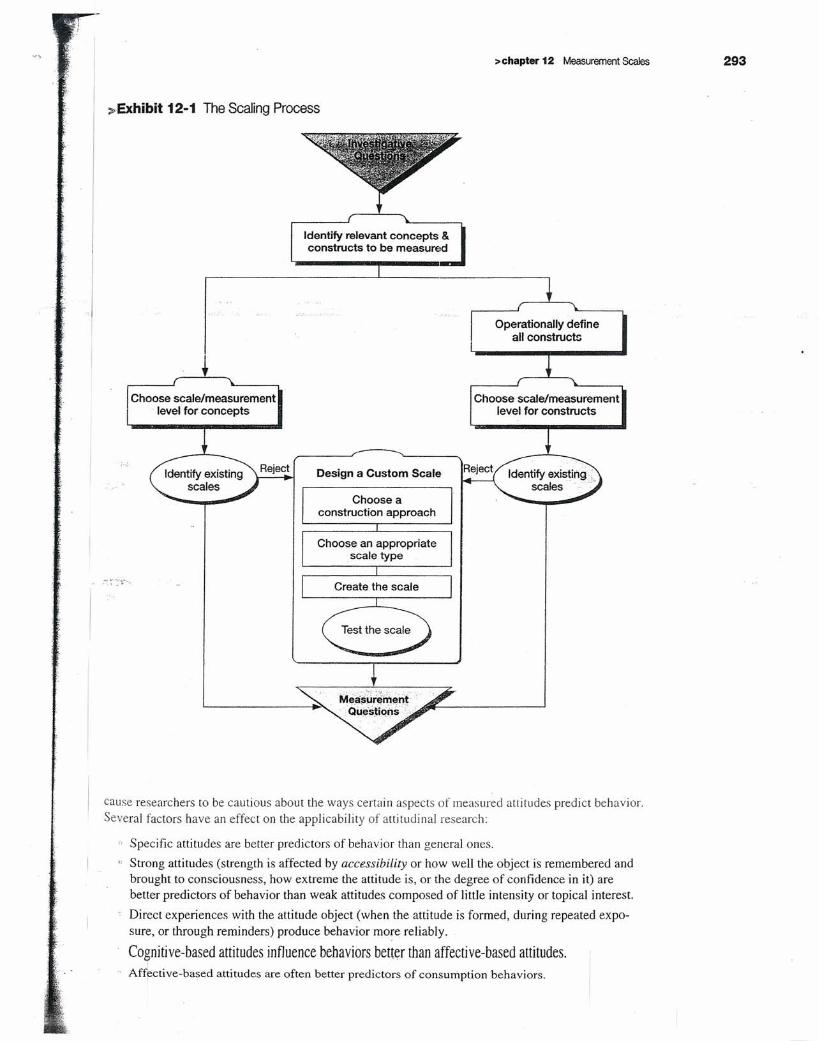
This chapter covers procedures that will help you understand measurement scales so that you mightselect or design measures that are appropriate for your research. We concentrate here on the prob-lems of measuring more complex constructs, like attitudes. Conceptually, we start this process byrevisiting the research process (see Exhibit 12-1) to understand where the act of scaling fits in theprocess.
Scales in business research are generally constructed to measure behavior, knowledge, and attitudes.Attitude scales are among the most difficult to construct, so we will use attitudes to develop your un-derstanding of scaling.
> The Nature of AttitudesJason is properly concerned about attitude measurement for the MindWriter study. But what is anattitude? There are numerous definitions, but one seems to capture the essence: An attitude is a learned,stable predisposition to respond to oneself, other persons, objects, or issues in a consistently favorableor unfavorable way.' Important aspects of this definition include the learned nature of attitudes, theirrelative permanence, and their association with socially significant events and objects. Because anattitude is a predisposition, it would seem that the more favorable one's attitude is toward a productor service, the more likely that the product or service will be purchased. But, as we will see, that is notalways the case.
Let's use Myra as an example to illustrate the nature of attitudes:
1. She is convinced that MindWriter has great talent, terrific products, and superior opportunitiesfor growth.
2. She loves working at MindWriter.3. She expects to stay with the firm and work hard to achieve rapid promotions for greater visibil-
ity and influence.
The first statement is an example ofa cognitively based attitude. It represents Myra'smemories,evaluations, and beliefs about the properties of the object. A belief is an estimate (probability) aboutthe truth of something. In this case, it is the likelihood that the characteristics she attributes to her workenvironment are true. The statement "I think the cellular market will expand rapidly to incorporateradio and video" is also derived from cognition and belief. The second statement above is an affectivelybased attitude. It represents Myra's feelings, intuition, values, and emotions toward the object. "I lovethe Yankees" and "I hate corn flakes" are other examples of emotionally oriented attitudes. Finally,researchers recognize a third component, conative or behaviorally based attitudes. The concludingstatement reflects Myra's expectations and behavioral intentions toward her firm and the instrumentalbehaviors necessary to achieve her future goals.
The Relationship between Attitudesand BehaviorThe attitude-behavior relationship is not straightforward, although there may be close linkages.Attitudes and behavioral intentions do not always lead to actual behaviors; and although attitudesand behaviors are expected to be consistent with each other, that is not always the case. Moreover,behaviors can influence attitudes. For example, marketers know that a positive experience with aproduct or service reinforces a positive attitude or makes a customer question a negative attitude.This is one reason that restaurants where you have a bad dining experience may give you a couponfor a free meal on your next visit. They know a bad experience contributes mightily to formation ofnegative attitudes.
Business researchers treat attitudes as hypothetical constructs because of their complexity and thefact that they are inferred from the measurement data, not actually oJserved. These qualifications
I
>chapter 12 MeasurementScales 293
~Exhibit12-1 The Scaling Process
Identify relevant concepts &constructs to be measured
Operationally defineall constructs
Choose scale/measurementlevel for concepts
Choose scale/measurementlevel for constructs
= ~--:~-.-.
Design a Custom Scale
Choose aconstruction approach
Choose an appropriatescale type
Create the scale
cause researchers to be cautious about the ways certain aspects of measured attitudes predict behavior.Several factors have an effect on the applicability of attitudinal research:
.' Specific attitudes are better predictors of behavior than general ones.Strong attitudes (strength is affected by accessibility or how well the object is remembered andbrought to consciousness, how extreme the attitude is, or the degree of confidence in it) arebetter predictors of behavior than weak attitudes composed of little intensity or topical interest.
Direct experiences with the attitude object (when the attitude is formed, during repeated expo-sure, or through reminders) produce behavior more reliably.
Cognitive-based attitudes influence behaviors better than affective-based attitudes.Affective-based attitudes are often better predictors of consumption behaviors.
294 >part III The Sources and Collection of Data
• Using multiple measurements of attitude or several behavioral assessments across time andenvironments improves prediction .
• The influence of reference groups (interpersonal support, urges of compliance, peer pressure) andthe individual's indination to conform to these influences improves the attitude-behavior Iinkage.'
Researchers measure and analyze attitudes because attitudes offer insights about behavior. Manyof the attitude measurement scales used have been tested for reliability and validity, but often we craftunique scales that don't share those standards. An example is an instrument that measures attitudesabout a particular tourist attraction, product, or candidate, as well as the person's intention to visit,buy, or vote. Neither the attitude nor the behavioral intent instrument, alone or together, is effective inpredicting the person's actual behavior if it has not been designed carefully. Nevertheless, managersknow that the measurement of attitudes is important because attitudes reflect past experience and shapefuture behavior.
Attitude ScalingAttitude scaling is the process of assessing an attitudinal disposition using a number that represents aperson's score on an attitudinal continuum ranging from an extremely favorable disposition to an ex-tremely unfavorable one. Scaling is the "procedure for the assignment of numbers (or other symbols)to a property of objects in order to impart some of the characteristics of numbers to the properties inquestion.") Procedurally, we assign numbers to indicants of the properties of objects. Thus, one as-signs a number scale to the various levels of heat and cold and calls it a thermometer. To measure thetemperature of the air, you know that a property of temperature is that its variation leads to an expan-sion or contraction of mercury. A glass tube with mercury provides an indicant of temperature change
by the rise or fall of the mercury in the tube. Similarly,your attitude toward your university could be measuredon numerous scales that capture indicators of the differ-ent dimensions of your awareness, feelings, or behavioralintentions toward the school.
34 The percent of workers who areconsidered truly loyal.
I > Selecting a Measurement ScaleSelecting and constructing a measurement scale requires the consideration of several factors that influ-ence the reliability, validity, and practicality of the scale:
• Research objectives.
• Response types.o Data properties.
• Number of dimensions.
• Balanced or unbalanced.
• Forced or unforced choices.
• Number of scale points.
• Rater errors.
Research ObjectivesResearchers' objectives are too numerous to list (including, but not limited to, studies of attitude,attitude change, persuasion, awareness, purchase intention, cognition and action, actual and repeatpurchase). Researchers, however, face two general types of scaling objectives:
• To measure characteristics of the participants who participate in the smdy.• To use participants "' judge, of the objects or indicants presented to ttem.
>chapter 12 Measurement Scales 295
Assume you are conducting a study of customers concerning their attitudes toward a change in corpo-rate identity (a company logo and peripherals). With the first study objective, your scale would measurethe customers' orientation as favorable or unfavorable. You might combine each person's answers toform an indicator of overall orientation. The emphasis in this first study is on measuring attitudinaldifferences among people. With the second objective, you might use the same data, but you are nowinterested in how satisfied people are with different design options. Each participant is asked to choosethe object he or she favors or the preferred solution. Participants judge which object has more of somecharacteristic or which design solution is closest to the company's stated objectives.
Response TypesMeasurement scales fall into one of four general types: rating, ranking, categorization, and sorting. A
, rating scale is used when participants score an object or indicant without making a direct comparisonto another object or attitude. For example, they may be asked to evaluate the styling of a new automo-bile on a 7-point rating scale. Ranking scales constrain the study participant to making comparisonsand determining order among two or more properties (or their indicants) or Objects. Participants maybe asked to choose which one of a pair of cars has more attractive styling. A choice scale requires thatparticipants choose one alternative over another. They could also be asked to rank-order the importanceof comfort, ergonomics, performance, and price for the target vehicle. Categorization asks partici-pants to put themselves or property indicants in groups or categories. Asking auto show attendees toidentify their gender or ethnic background or to indicate whether a particular prototype design wouldappeal to a youthful or mature driver would require a category response strategy. Sorting requires thatp~cipan1;s sort cards (representing concepts or constructs) into piles using criteria established by theresearcher. The cards might contain photos or images or verbal statements of product features such asva.t16usdescriptors of the car's performance.
[lata PropertiesDecisions about the choice of measurement scales are often made with regard to the data propertiesgenerated by each scale. In Chapter 11, we said that we classify scales in increasing order of power;scales are nominal, ordinal, interval, or ratio. Nominal scales classify data into categories without indi-cating order, distance, or unique origin. Ordinal data show relationships of more than and less than buthave no distance or unique origin. Interval scales have both order and distance but no unique origin.Ratio scales possess all four properties' features. The assumptions underlying each level of scale deter-mine how a particular measurement scale's data will be analyzed statistically.
r~;i(\jrnberof DimensionsMeasurement scales are either unidimensional or multidimensional. With a unidimensional scale, oneseeks to measure only one attribute of the participant or object. One measure of an actor's star power ishis or her ability to "carry" a movie. It is a single dimension. Several items may be used to measure thisdimension and by combining them into a single measure, an agent may place clients along a linear con-
I tinuum of star power. A multidimensional scale recognizes that an object might be better describedwith several dimensions than on a unidimensional continuum. The actor's star power variable mightbe better expressed by three distinct dimensions-ticket sales for last three movies, speed of attractingfinancial resources, and column-inch/amount-of- TV coverage of the last three films.
I Bolanced or UnbalancedA balanced rating scale has an equal number of categories above and below the midpoint. Generally,rating scales should be balanced, with an equal number of favorable and unfavorable response choices.However,!scales may be balanced with or without an indifference or rriidpoint option. A balanced scale
I
296
.. !..-,....',
>part III The SourcesandCollectionofData
might take the form of "very good-good-average-poor-very poor." An unbalanced rating scalehas an unequal number of favorable and unfavorable response choices. An example of an unbalancedscale that has only one unfavorable descriptive term and four favorable terms is "poor-fair-good-very good-excellent." The scale designer expects that the mean ratings will be near "good" and thatthere will be a symmetrical distribution of answers around that point, but the scale does not allow par-ticipants who are unfavorable to express the intensity of their attitude.
The use of an unbalanced rating scale can be justified in studies in which researchers know in ad-vance that nearly all participants' scores will lean in one direction or the other. Raters are inclined toscore attitude objects higher if the objects are very familiar and if they are ego-involved.' Brand-loyalcustomers are also expected to respond favorably. When researchers know that one side of the scale isnot likely to be used, they try to achieve precision on the side that will most often receive the partici-pant's attention. Unbalanced scales are also considered when participants are known to be either "easyraters" or "hard raters." An unbalanced scale can help compensate for the error of leniency created bysuch raters .
Forced or Unforced ChoicesAn unforced-choice rating scale provides participants with an opportunity to express no opinionwhen they are unable to make a choice among the alternatives offered. A forced-choice rating scalerequires that participants select one of the offered alternatives. Researchers often exclude the responsechoice "no opinion." "undecided." "don't know," "uncertain." or "neutral" when they know that mostparticipants have an attitude on the topic. It is reasonable in this circumstance to constrain participantsso that they focus on alternatives carefully and do not idly choose the middle position. However •.whenmany participants are clearly undecided and the scale does not allow them to express their uncertainty,the forced-choice scale biases results. Researchers discover such bias when a larger percentage ofparticipants express an attitude than did so in previous studies on the same issue. Some of this bias isattributable to participants providing meaningless responses or reacting to questions about which theyhave no attitudes (see Chapter 13). This affects the statistical measures of the mean and median, whichshift toward the scale's midpoint, making it difficult to discern attitudinal differences throughout theinstrument.' Understanding neutral answers is a challenge for researchers. In a customer satisfactionstudy that focused on the overall satisfaction question with a company in the electronics industry. anunforced scale was used. Study results, however, revealed that 75 percent of those in the "neutral" par-ticipant group could be converted to brand loyalists if the company excelled (received highly favorableratings) on only 2 of the 26 other scaled questions in the study." Thus. the participants in the neutralgroup weren't truly neutral, and a forced-choice scale would have revealed the desired information.
Number of Seals PointsWhat is the ideal number of points for a rating scale? Academics and practitioners often have dogmaticreactions to this question. but the answer is more practical: A scale should be appropriate for its purpose.For a scale to be useful. it should match the stimulus presented and extract information proportionate tothe complexity of the attitude object, concept. or construct A product that requires little effort or thoughtto purchase. is habitually bought. or has a benefit that fades quickly (low-involvement products) can bemeasured generally with a simple scale. A 3-point scale (better than average-average-worse thanaverage) is probably sufficient for a deodorant. a fast-food burger, gift-wrapping, or a snack. There islittle support for choosing a scale with 5 or more points in this instance. But when the product is com-plex, plays an important role in the consumer's life, and is costly (e.g .• financial services. luxury goods,automobiles, and other high-involvement products), a scale with 5 to II points should be considered.
As we noted in Chapter I I, the characteristics of reliability and validity are important factors af-fecting measurement decisions. First, as the number of scale points increases. the reliability of themeasure increases.' Second. in some studies. scales with 11 points may produce more valid resultsthan 3-, 5-, or 7-point scales.' Third, some constructs require greater measurement sensitivity and theopportunity to extract more variance. which additional scale points provide. Fourth. a larger number of
I
>chapter 12 MeasurementScales 297
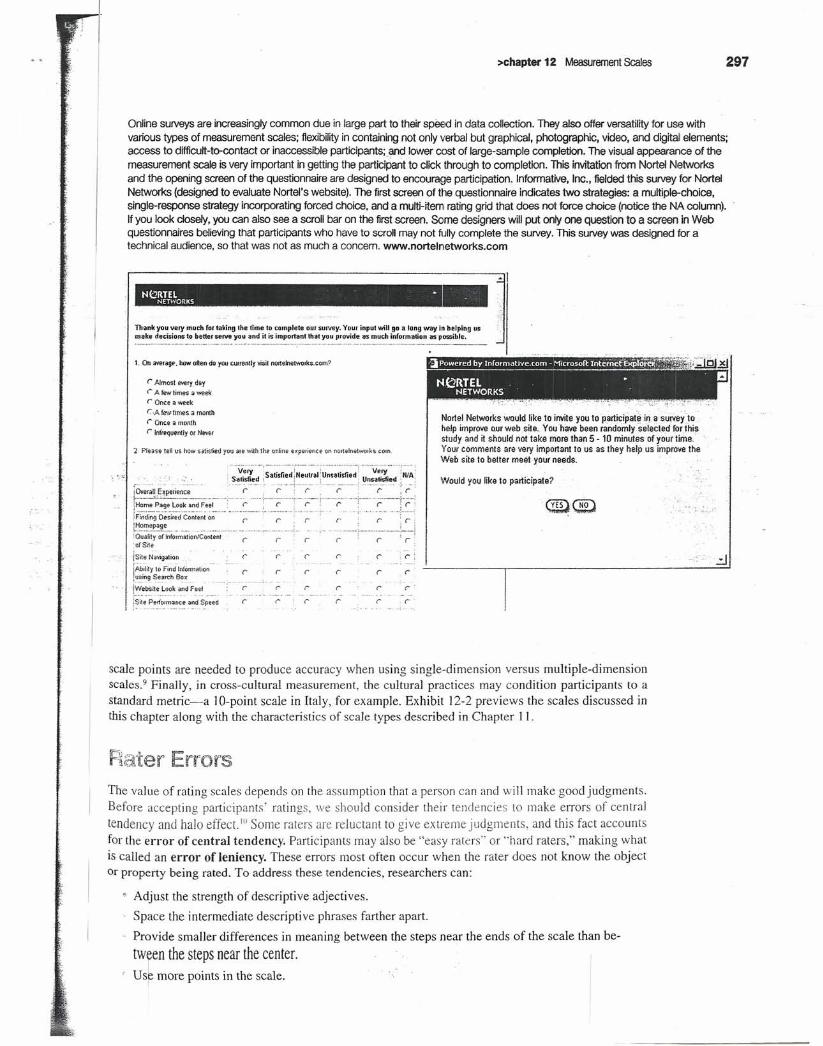
Online surveys are increasingly common due in large part to their speed in data collection. They also offer versatility for use withvarious types of measurement scales; flexibility in containing not only verbal but graphical, photographic, video, and digital elements;access to difficult-ta-contact or inaccessible participants; and lower cost of large-sample completion. The visual appearance of themeasurement scale is very important in getting the partiCiPantto click through to completion. This invitation from Nortel Networksand the opening screen of the questionnaire are designed to encouraqe participation. Informative, Inc., fielded this survey for NortelNetworks (designed to evaluate Nortel's website). The first screen of the questionnaire indicates two strategies: a multiple-choice,single-response strategy incorporating forced choice, and a multi-item rating grid that does not force choice (notice the NA column).If you look closely, you can also see a scroll bar on the first screen. Some designers will put only one question to a screen in Webquestionnaires believing that partiCipants who have to sera" may not fully complete the survey. This survey was designed for atechnical audience, so that was not as much a concem. www.nortelnetworks.com
•. 1N<::!RTEL •
NETWORKS -Thank you very much for taking the time to complete our survey. Your input will go Cl long way in helping usmake decisions to better serve you and it is important that you provide as much information as possible.
1. On average. how often do you cuuently visit ncrtelnetworks.ccm? 'iPowered by rntcrmenve.com - Microsoft IntelRef"&iPt~ " ~.1
N~RTEL • aNETWORKS .
- - - - . - -. -r Almost every. dayr A few times a weekr Once a week
C.A f~N times a monthr- Once a monthr Infrequenlly or NE?\ow
Nortel Networks would like to invite you to participat~ irj Cl' s~{Veyto 'help improve our websits. You have been randomlysJllecledforlhi$study and ~ should not take more than 5· 10 minuies of your time,'Your comments are very important to us as they help us improve theWeb site to belter meet your needs.
2 Please tell us hOW"satisfied you ale ':'.tilh the online experience on nonelnetworks.ccm.
"_._._ _ .. _-- -.-_ _._._., .."_.,,._-
Very S· f diN I:U . fi d' Very , 'Satisfied r atrs le ! eutra i nsans le : Unsatisfied ~NlA,
jO\;erall Experience rj~~~~~~~e_~~~~~.~_~~C~.~~;'---"r""'-"'-"'T'--"-""'-'-'---"---"--+"-'1Finding Desired Content on r r r"L~~~pa9..!.. ._.. . . .._.._.....__.._.__.__,!Quality oflnfotmationlContenf' r'ofSi!e1
{Site Navigationt···
"
,Ability 10 Find lnfcrrnancnIusing Search Box
'IW~~i;~'L:)Oka~d'Feel
fSi;~Pe~:~;~~n~eand'S~~dI ;- .. - ------.-- _ .
'; ';~; Would you like to partiCipate?
r: . r i r: l··········_-.--_··---·--1
r r r r r'"r: r r , ., ..::.lr
"
r r r
r r rr: r: c
r rr: r r
r r:
r r r
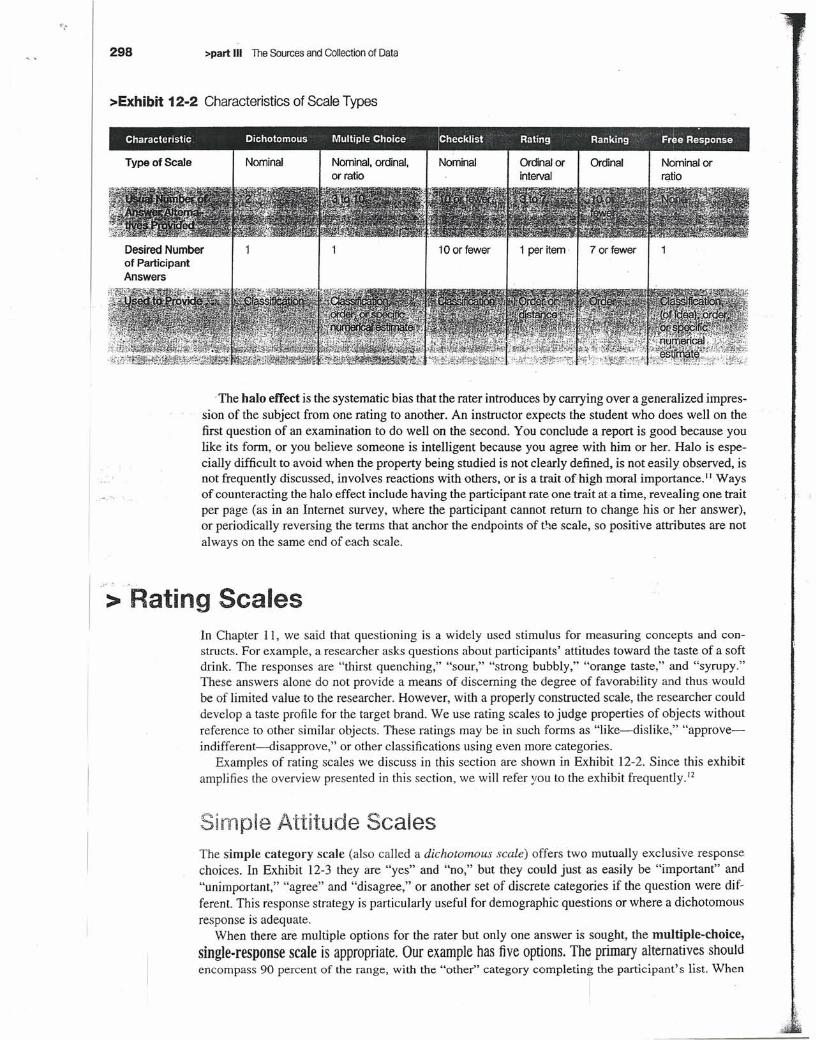
scale points are needed to produce accuracy when using single-dimension versus multiple-dimensionscales.? Finally, in cross-cultural measurement, the cultural practices may condition participants to astandard metric-a JO-point scale in Italy, for example. Exhibit 12-2 previews the scales discussed inthis chapter along with the characteristics of scale types described in Chapter I I.
~Xater ErrorsThe value of rating scales depends on the assumption that a person can and will make good judgments.Before accepting participants' ratings, we should consider their tendencies to make errors of centraltendency and halo effect. 10 Some raters are reluctant to give extreme Judgments, and this fact accountsfor the error of central tendency. Participants may also be "easy raters" or "hard raters," making whatis called an error of leniency. These errors most often occur when the rater does not know the objectOr property being rated. To address these tendencies, researchers can:
Adjust the strength of descriptive adjectives.
Space the intermediate descriptive phrases farther apart.
Provide smaller differences in meaning between the steps near the ends of the scale than be-tween the steps near the center.us~ more points in the scale.
298 spart III The Sources and Collection of Data
>Exhibit 12-2 Characteristics of Scale Types
'~', ....
'The halo effect is the systematic bias that the rater introduces by carrying over a generalized impres-sion of the subject from one rating to another. An instructor expects the student who does well on thefirst question of an examination to do well on the second, You conclude a report is good because youlike its form, or you believe someone is intelligent because you agree with him or her. Halo is espe-cially difficult to avoid when the property being studied is not clearly defined, is not easily observed, isnot frequently discussed, involves reactions with others, or is a trait of high moral importance. I I Waysof counteracting the halo effect include having the participant rate one trait at-a time.irevealing one traitper page (as in an Internet survey, where the participant cannot return to change his or her answer),or periodically reversing the terms that anchor the endpoints of the scale, so positive attributes are notalways on the same end of each scale .
. i" '.
> Rating ScalesIn Chapter 11, we said that questioning is a widely used stimulus for measuring concepts and con-structs. For example, a researcher asks questions about participants' attitudes toward the taste of a softdrink. The responses are "thirst quenching," "sour," "strong bubbly," "orange taste," and "syrupy."These answers alone do not provide a means of discerning the degree of favorability and thus wouldbe of limited value to the researcher. However, with a properly constructed scale, the researcher coulddevelop a taste profile for the target brand. We use rating scales to judge properties of objects withoutreference to other similar objects. These ratings may be in such forms as "like-dislike," "approve-indifferent--disapprove," or other classifications using even more categories.
Examples of rating scales we discuss in this section are shown in Exhibit 12-2. Since this exhibitamplifies the overview presented in this section, we will refer you to the exhibit frequently. 12
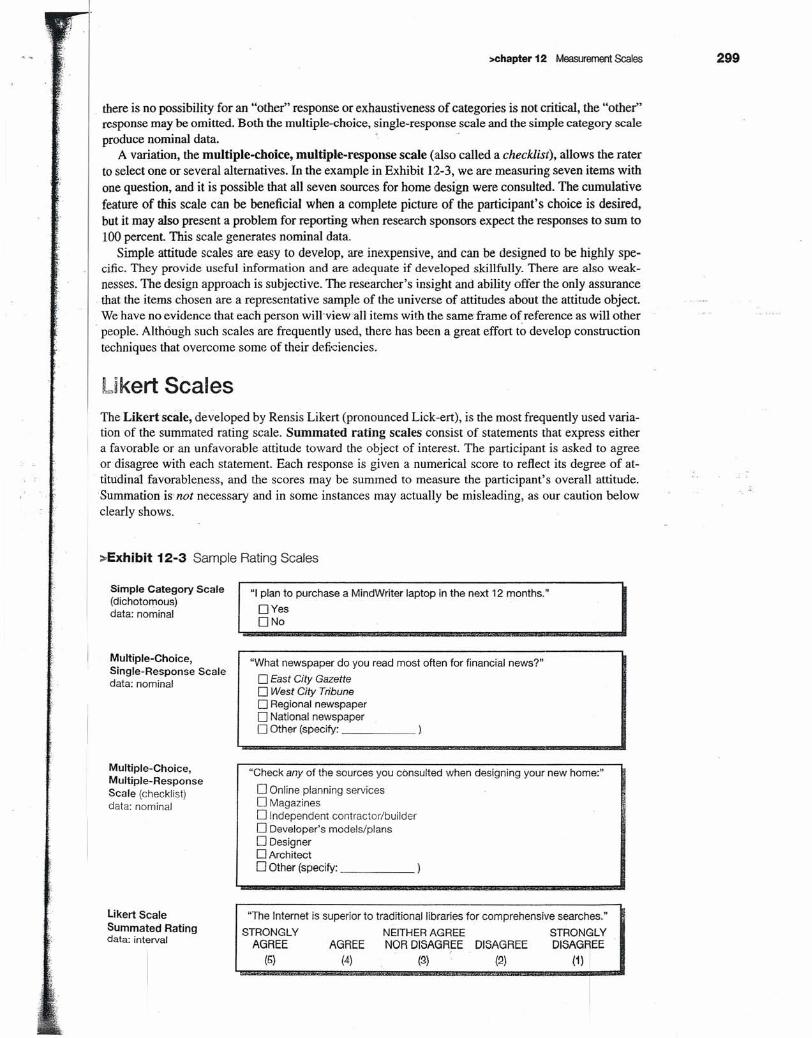
Simple Attitude ScalesThe simple category scale (also called a dichotomous scale) offers two mutually exclusive responsechoices. In Exhibit 12-3 they are "yes" and "no," but they could just as easily be "important" and"unimportant," "agree" and "disagree," or another set of discrete categories if the question were dif-ferent. This response strategy is particularly useful for demographic questions or where a dichotomousresponse is adequate.
When there are multiple options for the rater but only one answer is sought, the multiple-choice,single-response scale is appropriate. Our example has five options. The primary alternatives shouldencompass 90 percent of the range, with the "other" category completing the participant's list. When
I
·~' .
>chapter 12 Measurement Scales 299
. there is no possibility for an "other" response or exhaustiveness of categories is not critical, the "other"response may be omitted. Both the multiple-choice, single-response scale and the simple category scaleproduce nominal data.
A variation, the multiple-choice, multiple-response scale (also called a checklist), allows the raterto select one or several alternatives. In the example in Exhibit 12-3, we are measuring seven items withone question, and it is possible that all seven sources for home design were consulted. The cumulativefeature of this scale can be beneficial when a complete picture of the participant's choice is desired,but it may also present a problem for reporting when research sponsors expect the responses to sum to100 percent This scale generates nominal data.
Simple attitude scales are easy to develop, are inexpensive, and can be designed to be highly spe-cific. They provide useful information and are adequate if developed skillfully. There are also weak-nesses. The design approach is subjective. The researcher's insight and ability offer the only assurancethat the items chosen are a representative sample of the universe of attitudes about the attitude object.We have no evidence that each person will "view all items with the same frame of reference as will otherpeople. Although such scales are frequently used, there has been a great effort to develop constructiontechniques that overcome some of their deficiencies.
Likert ScalesThe Likert scale, developed by Rensis Likert (pronounced Lick-ert), is the most frequently used varia-tion of the summated rating scale. Summated rating scales consist of statements that express eithera favorable or an unfavorable attitude toward the object of interest. The participant is asked to agreeor disagree with each statement. Each response is given a numerical score to reflect its degree of at-titudinal favorableness, and the scores may be summed to measure the participant's overall attitude.Summation is-not necessary and in some instances may actually be misleading, as our caution belowclearly shows.
>Exhibit 12-3 Sample Rating Scales
Simple Category Scale(dichotomous)data: nominal
Multiple-Choice,Single-Response Scaledata: nominal
Multiple-Choice,Multiple-ResponseScale (checklist)data: nominal
Likert ScaleSummated Ratingdata: interval
"I plan to purchase a MindWriter laptop in the next 12 months."
DYesONo
"What newspaper do you read most often for financial news?"
o East City Gazetteo West City Tribuneo Regional newspapero National newspaperoOther (specify: _
"Check any of the sources you consulted when designing your new home:"
o Online planning serviceso Magazineso Independent contractor/buildero Developer's models/planso DesigneroArchitecto Other (specify: _
"The Internet is superior to traditional libraries for comprehensive searches."
STRONGLY NEITHER AGREE STRONGLYAGREE AGREE NOR DISAGREE DISAGREE DISAGIlEE
(5) (4) (g) (!l) (1)
300 >part III The Sources and Collection of Data
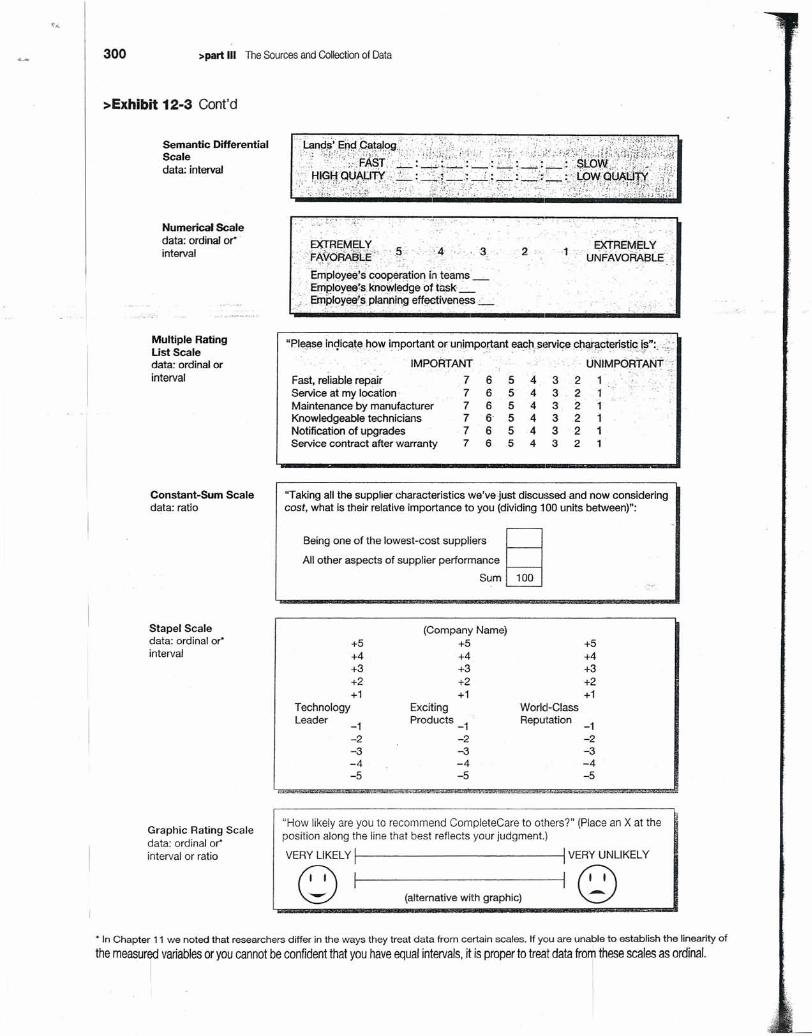
>Exhibit 12-3 Cont'd
Semantic DifferentialScaledata: interval
Numerical Scaledata: ordinal or"interval
Multiple RatingList Scaledata: ordinal orinterval
Constant-Sum Scaledata: ratio
Stapel Scaledata: ordinal or"interval
Graphic Rating Scaledata: ordinal or"interval or ratio
EXTREMELY-lUNFAVORA!3li=-
* In Chapter 11 we noted that researchers differ in the ways they treat data from certain scales. If you are unable to establish the linearity of
the measured variables or you cannot be confident that you have equal intervals, it is proper to treat data from these scales as ordinal.
I . I
Employel1~i cooperation in teams_- _-Erriploye~:s knolN1~ge of tusk .: _
.~,~.,'EmpJoy~s.planning·effectiveness--_·: __....;.. . ".>'-," . ," :!~.~... ,..,' ,.' .. -.
- IMPORTANT UNIMPORTANT-'" '. - -;,.
Fast, reliable repair 7 6 5 4 3 2 1Service at my location -
c.,7 6 5 4 3 2 1
Maintenance by manufacturer 7 6 5 4 3 2 1Knowledgeable technicians 7 6 5 4 3 2 1Notification of upgrades 7 6 5 4 3 2 1Service contract after warranty 7 6 5 4 3 2 1
UTaking all the supplier characteristics we've just discussed-and now consideringcost, what is their relative importance to you (dividing 100 units between)":
Being one of the lowest-cost suppliers ~
All other aspects of supplier performance
Sum 100
(Company Name)+5+4+3+2+1
+5+4+3+2+1
TechnologyLeader -1
-2-3-4-5
+5+4+3+2+1
World-ClassReputation -1
-2-3-4-5
ExcitingProducts -1
-2-3-4-5
"How likely are you to recommend CompleteCare to others?" (Place an X at theposition along the line that best reflects your judgment)
VERY LIKELY If--------------II VERY UNLIKELYto 11'0~ (alternative with graphic) 'd
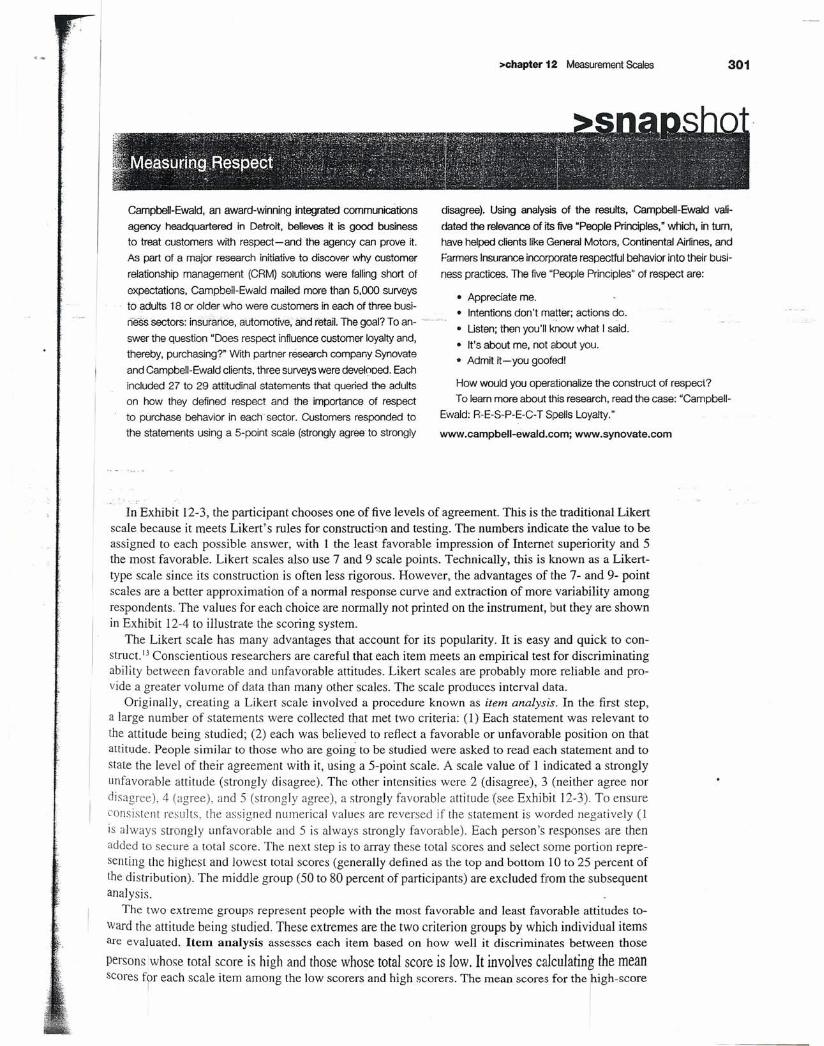
Campbell-Ewald, an award-winning integrated communicationsagency headquartered in Detroit, believes it is good businessto treat customers with respect-and the agency can prove it.As part of a major research initiativeto discover why customerrelationship management (CRM) SOlutionswere falling short ofexpectations, Campbeil-Ewald mailed more than 5,000 surveys
. to adults 18 or older who were customers in each of three busi-neSs sectors: insurance, automotive, and retail.The goal? To an-swer the question "Does respect influence customer loyaltyand,thereby, purchasing?" With partner research company Synovateand Campbell-Ewald clients, three surveys were develnoed. Eachincluded 27 to 29 attitudinal statements that queried the adultson how they defined respect and the importance of respectto purchase behavior in each sector. Customers responded tothe statements using a 5-point scale (strongly agree·to strongly
>chapter 12 Measurement Scales 301
(jisagree). Using analysis of the results, Campbell-Ewald vali-dated the relevance of its five "People Principles: which, in turn,have helped clients likeGeneral Motors, Continental Air1ines,andFarmers Insurance incorporate respectful behavior into their busi-ness practices, The five "People Principles" of respect are:
• Appreciate me.• Intentions don't matter; actions do.• Listen; then you'll know what I said.• It's about me, not about you.• Admit it-you goofed!
How would you operationalize the construct of respect?To leam more about this research, read the case: "Campbell-
Ewald: R-E-S-P-E-C-T Spells Loyalty."
www.campbell-ewald.com; www.synovate.com
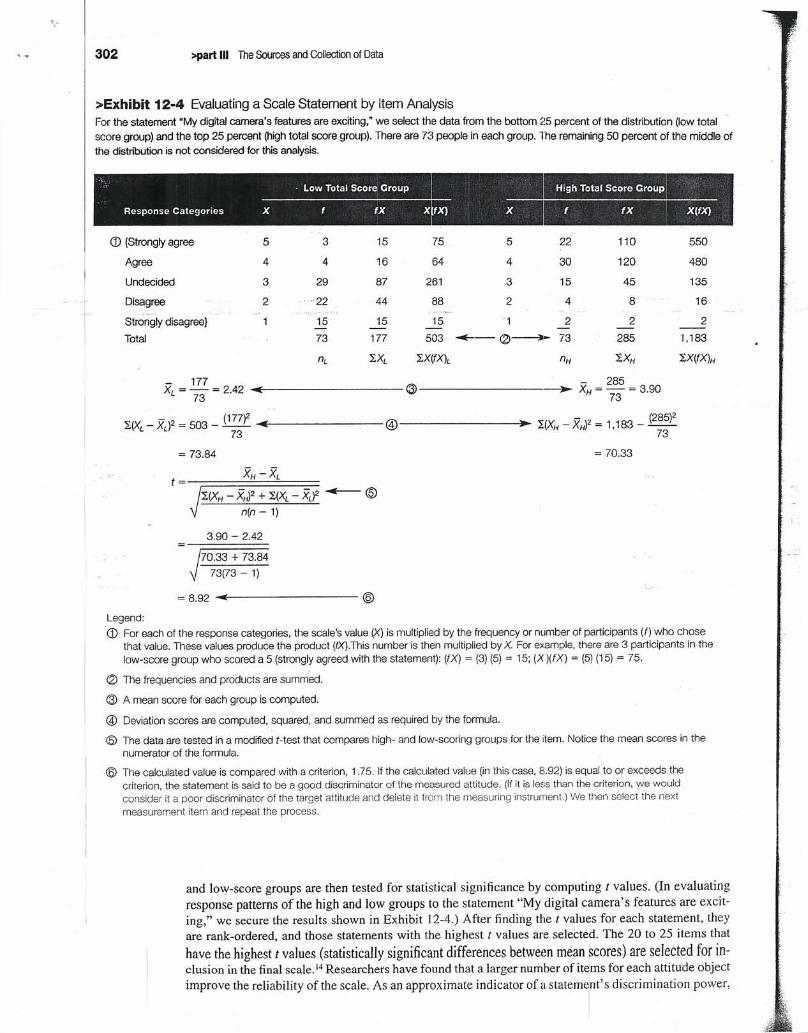
In Exhibit 12-3, the participant chooses one of five levels of agreement. This is the traditional Likertscale because it meets Likert's rules for construction and testing. The numbers indicate the value to beassigned to each possible answer, with I the least favorable impression of Internet superiority and 5the most favorable. Likert scales also use 7 and 9 scale points. Technically, this is known as a Likert-type scale since its construction is often less rigorous. However, the advantages of the 7- and 9- pointscales are a better approximation of a normal response curve and extraction of more variability amongrespondents. The values for each choice are normally not printed on the instrument, but they are shownin Exhibit 12-4 to illustrate the scoring system.
The Likert scale has many advantages that account for its popularity. It is easy and quick to con-struct. JJ Conscientious researchers are careful that each item meets an empirical test for discriminatingability between favorable and unfavorable attitudes. Likert scales are probably more reliable and pro-vide a greater volume of data than many other scales. The scale produces interval data.
Originally, creating a Likert scale involved a procedure known as item analysis. In the first step,a large number of statements were collected that met two criteria: (1) Each statement was relevant tothe attitude being studied; (2) each was believed to reflect a favorable or unfavorable position on thatattitude. People similar to those who are going to be studied were asked to read each statement and tostate the level of their agreement with it, using a 5-point scale. A scale value of 1 indicated a stronglyunfavorable attitude (strongly disagree). The other intensities were 2 (disagree), 3 (neither agree nordisagree), 4 (agree), and 5 (strongly agree), a strongly favorable attitude (see Exhibit 12-3). To ensureconsistent results, the assigned numerical values are reversec! jf the statement is worded negatively (1is always strongly unfavorable and 5 is always strongly favorable). Each person's responses are thenac!ded to secure a total score. The next step is to array these total scores and select some portion repre-senting the highest and lowest total scores (generally defined as the top and bottom 10 to 25 percent ofthe distribution). The middle group (50 to 80 percent of participants) are excluded from the subsequentanalysis.
The two extreme groups represent people with the most favorable and least favorable attitudes to-ward the attitude being studied. These extremes are the two criterion groups by which individual itemsare evaluated. Item analysis assesses each item based on how well it discriminates between those
persons whose total score is high and those whose total score is low. It involves calculating the meanscores fpr each scale item among the low scorers and high scorers. The mean scores for the righ-score
302 >part III The Sources and Collection of Data
>Exhibit 12-4 Evaluating a Scale Statement by Item AnalysisFor the statement "My digital camera's features are exciting," we select the data from the bottom ,~5percent of the distribution (Iow totalscore group) and the top 25 percent (high total score group). There are 7a people in each group. The remaining 50 percent of the middle ofthe distribution is not considered for this analysis .
. Low Total Score Group
Response Categories X f rx X
CD {Strongly agree 5 3 15 75 5 22 110 550
Agree 4 4 16 64 4 30 120 480
Undecided 3 29 87 261 3 15 45 135
Disagree 2 '22 44 88 2 4 8 16
Strongly disagree} 15 15 15 1 2 2 2- - - - --
Total 73 177 503 ~- ~----,)I.73 285 1.183
nL IXL IX(fX)L nH IXH IX(fX)H
- 177 - ~5XL =73"= 2.42 ...•••••f----------®--------~ XH= 73" = 3.90
I(XL - Xd2 = 503 - (177)2 ...••(---------- @---------'.~ ~'(XH - XH)2 = 1,183 _ (285)273 73
= 70,33= 73,84
XH-XLt=~============I(XH - XH)2 + I(XL - XJ2 ~ @
n(n - 1)
3,90 - 2.42
70,33 + 73.8473(73 - 1)
= 8.92 _••••f--------- ®Legend:CD For each of the response categories, the scale's value (X) is multiplied by the frequency or number of participants (f) who chose
that value, These values produce the product (fX),This number is then multiplied by X For example, there are 3 participants in thelow-score group who scored a 5 (strongly agreed with the statement): (fX) = (3) (5) = 15; (X )(fX) = (5) (15) = 75,
<2l The frequencies and products are summed,
(3) A mean score for each group is computed.
@ Deviation scores are computed, squared, and summed as required by the formula,
® The data are tested in a modified Hest that compares high- and low-scoring groups for the item, Notice the mean scores in thenumerator of the formula,
® The calculated value is compared with a criterion, 1,75, If the calculated value (in this case, 8,92) is equal to or exceeds thecriterion, the statement is said to be a good discriminator of the measured attitude, (If it is less than the criterion, we wouldconsider it a poor discriminator of the target attitude and delete it from the measuring instrument.) We then select the nextmeasurement item and repeat the process,
and low-score groups are then tested for statistical significance by computing t values. (In evaluatingresponse patterns of the high and low groups to the statement "My digital camera's features are excit-ing," we secure the results shown in Exhibit 12-4.) After finding the t values for each statement, theyare rank-ordered, and those statements with the highest t values are selected, The 20 to 25 items thathave the highest t values (statistically significant differences between mean fcores) are selected for in-clusion in the final scale.!" Researchers have found that a larger number of items for each attitude objectimprove the reliability of the scale. As an approximate indicator of a statem1nt's discrimination power,
>chapter 12 MeasurementScales
on eauthority also suggests using only those statements whose t value is 1.75 or greater, provided therear 25 or more subjects in each group. 15
Although item analysis is helpful in weeding out attitudinal statements that do not discriminate well,th summation procedure causes problems for researchers. The following example on website bannera s shows that the same summated score can mean different things:
1. This banner ad provides the relevant information I expect.
2. I would bookmark this site to use in the future.
3. This banner ad is annoying.
4. I would click for deeper links to discover more details.
If a 5-point scale is used, the maximum favorable score would be 20 (assuming 5 is assigned to thes90ngly agree response and question ~, a negation, is reverse-scored). Approximately one-half ofthle statements are worded favorably and the-other half unfavorably to safeguard against: halo effects:TIle problem of summation arises because different patterns are concealed by the same total score. Oneparticipant could find the website's ad relevant, worth returning to, and somewhat pleasing but notdesire deeper information, whereas another could find the ad annoying but have favorable attitudes onthe other three questions, thereby producing the same total score.
Semantic Differential ScalesThe semantic differential (SD) scale measures the psychological meanings of an attitude object usingbiipolar adjectives. Researchers use this scale for studies such as brand and institutional image. Themethod consists of a set of bipolar rating scales, usually with 7 points, by which one or more partici-pants rate one or more concepts on each scale item. The SD scale is based on the proposition that anobject can have several dimensions of connotative meaning. The meanings are located in multidimen-sional property space, called semantic space. Connotative meanings are suggested or implied mean-ings, in addition to the explicit meaning of an object. For example, a roaring fire in a fireplace mayconnote romantic as well as its more explicit meaning of burning flammable material within a brickkiln. One restaurant trying to attract patrons on slow Tuesday evenings offered a special Tuesday menuand called it "down home cooking." Yankee pot roast, stew, and chicken pot pie, although not its usualcuisine, carried the connotative meaning of comfort foods and brought patrons into the restaurant, mak:-ing Tuesday one of the busiest nights of the week. Advertisers, salespeople, and product and packagedesigners have long known that they must use words, shapes, associations, and images to activate aperson's connotative meanings.
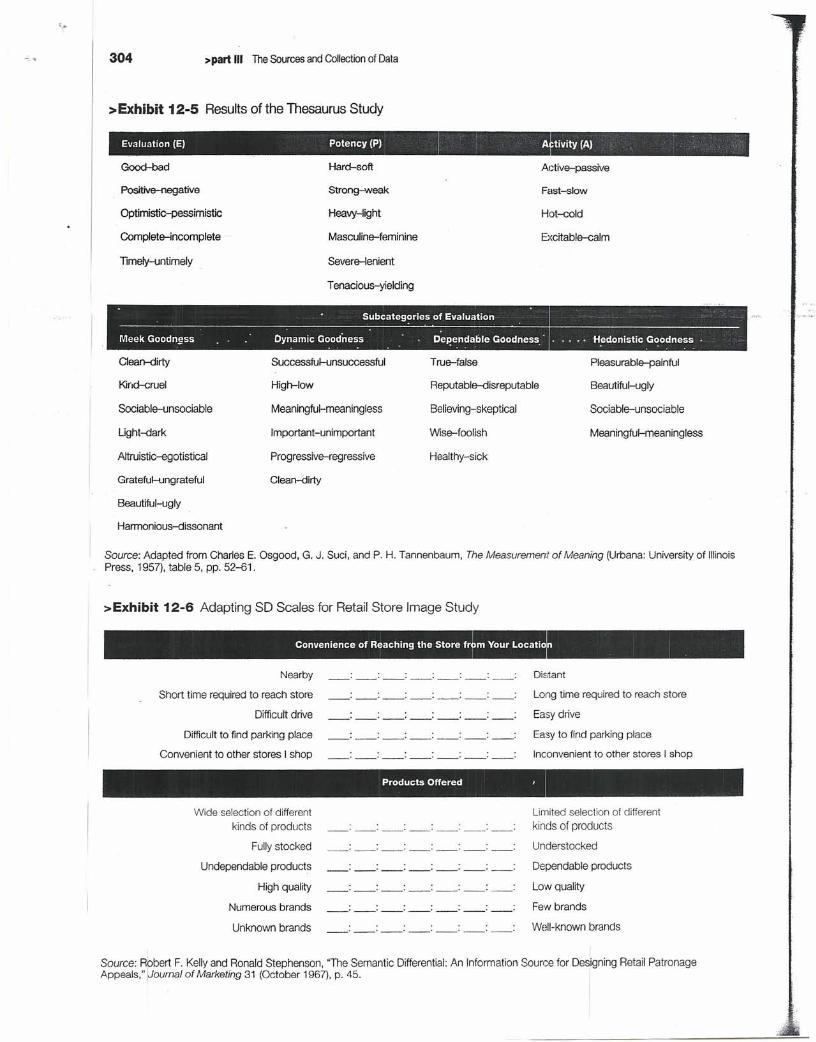
Osgood and his associates developed the semantic differential method to measure the psychologi-cal meanings of an object to an individual. 16 They produced a list of 289 bipolar adjective pairs, whichwere reduced to 76 pairs and formed into rating scales for attitude research. Their analysis allowed!hem to conclude that semantic space is multidimensional rather than unidimensional. Three factorspontributed most to meaningful judgments by participants: (I) evaluation, (2) potency, and (3) activ-ity. These concepts from the historical thesaurus study (Exhibit 12-5) illustrate the wide applicabilityof the technique to persons, abstract concepts, events, institutions, and physical objects. 17
Researchers have followed a somewhat different approach to SD scales than did the original studyadvocates. They have developed their own adjectives or phrases and have focused on the evaluativedimension more often (which might help explain the popularity of the Likert scale). The positive ben-efit is that the scales created have been adapted to specific management questions. One study explored aretail store image using 35 pairs of words or phrases classified into eight groups. These word pairs wereespecially created for the study. Excerpts from this scale are presented in Exhibit 12-6. Other categoriesof scale items were "general characteristics of the company," "physical characteristics of the store,"I"prices charged by the store," "store personnel," "advertising by the store," and "your friends and thestore." Since the scale pairs are closely associated with the characteristics of the store and its use, onecould develop image profiles of various stores.
The semantic differential has several advantages. It is an efficient and easy way to secure attitudesfrom a larg1esample. These attitudes may be measured in both direction and intensity. The total set ofresponses provides a comprehensive picture of the meaning of an object and a measure of the person
I
303
Results of thethesaurus studyare shown inExhibit 12-5.
304 >part III The Sources and Collection of Data
>Exhibit 12-5 Results of the Thesaurus Study
GoocI-bad
Evaluation (E) Potency (P)
Hard-soft
Positive--negative
Optimistic-pessimistic
Complete-incomplete
Time/y-untimely
I 'Cfean-<lirty
Strong-weak
Heavy-light
Masculine-feminine
Severe-lenient
Tenacious-yielding
.... ...
Kind-cruel High-Iow
Successful-unsuccessful
Reputable-disreputable
Sociable-unsociable
True-false
Meaningful-meaningless
Ught--<:!ark
Believing-skeptical
Important-unimportant
Healthy-sickAltruistic-egotisticai
Wise-foolish
Grateful-ungrateful Clean-dirty
Progressive-regressive
Beautiful-ugly
Harmonious--<:!issonant
tivity (A) ,
Active-passive
Fast-slow
Hot-cold
Excltable-calm
. •• ., Hedonistic Goodness .. .Pleasurable-painful
Beautiful-ugly
Sociable-unsociable
Meaningful-meaningless
Source: Adapted from Charles E. Osgood, G. J, Suci, and P. H, Tannenbaum, The Measurement of Meaning (Urbana: University of IllinoisPress, 1957), table 5, pp, 52-61,
>Exhibit 12-6 Adapting SO Scales for Retail Store Image Study
IConvenience of Reaching the Store from Your Location
I
Nearby
Short time required to reach store
Difficult drive
Difficult to find parking place
Convenient to other stores I shop
. ,---'---'---'---'---'---'---
. ...---'---'---'---'---'---'---, ,---'---'---'---'---'---'---
. . . . . .---'---'---'---'---'---'---. '---'---'---'---'---'---'---
Distant
Long time required to reach store
Easy drive
Easy to find parking place
Inconvenient to other stores I shop
Products Offered I
Wide selection of differentkinds of products
Fully stocked
Undependable products
High quality
Numerous brands
Unknown brands
. .---'---'---'---'---'---'---'
. ....---'---'---'---'---'---'---
Limited selection of differentkinds of products
Understocked
Dependable products
Low quality
Few brands
Well-known brands
Source: Robert F, Kelly and Ronald Stephenson, "The Semantic Differential: An Information Source for Designing Retail PatronageAppeals," !Journal of Marketing 31 (October 1967), p. 45, I
schapter 12 MeasurementScales
;;,-Exhibit 12-7 Steps in Constructing an SD Scale
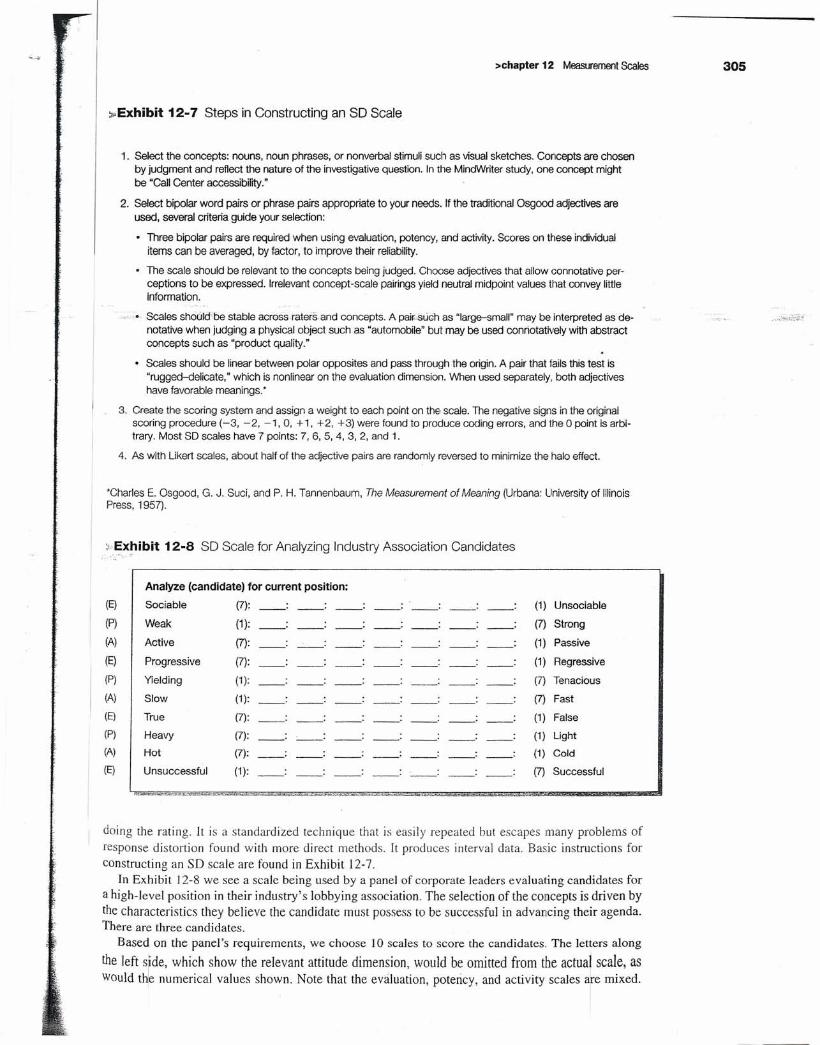
1. Select the concepts: nouns. noun phrases. or nonverbal stimuli such as visual sketches. Concepts are chosenby judgment and reflect the nature of the investigative question. In the MindWriter study. one concept mightbe ·Call Center accessibility:
2. Select bipolar word pairs or phrase pairs appropriate to your needs. If the traditional Osgood adjectives areused. several criteria guide your selection:
• Three bipolar pairs are required when using evaluation. potency. and activity. Scores on these indMdualitems can be averaged. by factor, to improve their reliability.
• The scale should be relevant to the concepts being judged. Choose adjectives that allow connotative per-ceptions to be expressed. Irrelevant concept-scale pairings yield neutral midpoint values that convey littleinformation.
Scales snoukfbe stable across.raters.and concepts. A pair-such as "large-small" may be interpreted as de-notative when judging a physical object such as "automobile" but may be used conriotatively with abstractconcepts such as "procuct quality."
• Scales should be linear between polar opposites and pass through the origin. A pair that fails this test is"rugged-delicate." which is nonlinear on the evaluation dimension. When used separately, both adjectiveshave favorable meanings:
3. Create the scoring system and assign a weight to each point on the scale. The negative signs in the originalscoring procedure (-3. -2. -1, O. + 1. +2. +3) were found to produce coding errors. and the 0 point is arbi-trary. Most SD scales have 7 points: 7, 6, 5, 4, 3, 2, and 1.
4. As with Likert scales. about half of the adjective pairs are randomly reversed to minimize the halo effect.
'Charles E. Osgood, G, J, Suci, and P. H. Tannenbaum, The Measurement of Meaning (Urbana: University of IllinoisPress. 1957),
;;Exhibit 12-8 SD Scale for Analyzing Industry Association Candidatesc
Analyze (candidate) for current position:
(E) Sociable (7): -- -- : -- -- : -- -- (1 ) Unsociable
(P) Weak (1): -- -- -- -- (7) Strong
(A) Active (7): -- : -- -- (1) Passive
(E) Progressive (7): -- (1) Regressive
(P) Yielding (1): -- -- (7) Tenacious
(Al Slow (1): -- -- -- (7) Fast
(El True (7): -- -- (1) False
(P) Heavy (7): -- -- -- (1) Light
(A) Hot (7): -- : -- : -- : -- : -- : (1) Cold
(E) Unsuccessful (1): -- (7) Successful
~_~.~.£.....-.;o-2£ ~!-D:'~~".=.~ •.••=_""",J:''''''-''* ~-, ~.. ~_ ~"oe=!' ~ ~ .i<=.Y~
doing the rating. It is a standardized technique that is easily repeated but escapes many problems of
response distortion found with more direct methods. It produces interval data, Basic instructions for
constructing an SD scale are found in Exhibit 12-7,In Exhibit 12-8 we see a scale being used by a panel of corporate leaders evaluating candidates for
a high-level position in their industry's lobbying association. The selection of the concepts is driven by
the characteristics they believe the candidate must possess to be successful in advancing their agenda.There are three candidates.
Based on the panel's requirements, we choose IO scales to score the candidates, The letters along
the left side, which show the relevant attitude dimension, would be omitted from the actual scale, aswould t~e numerical values shown. Note that the evaluation, potency, and activity scales le mixed.
305
306 >part III The Sources andCollection of Data
:>Exhibit 12-9 Graphic Representation of SD Analysis
EvaluationSociable Unsociableet \.3: ~ .
~''-i ",.----.--1
'":;.----.--1
\ ',,---...l '
Ee ,'----.. -
'>----------11....'...'Ll .~,.----\
Progressive Regressive
True False
Successful UnsuccessfulPotency ,.
1---. WeakStrong
Tenacious Yielding
Heavy Light
,1. Activi.ty.;.:ACtive Passive
Fast Slow
Hot Cold
Jones. •SmithWilliams .-------.
I·:
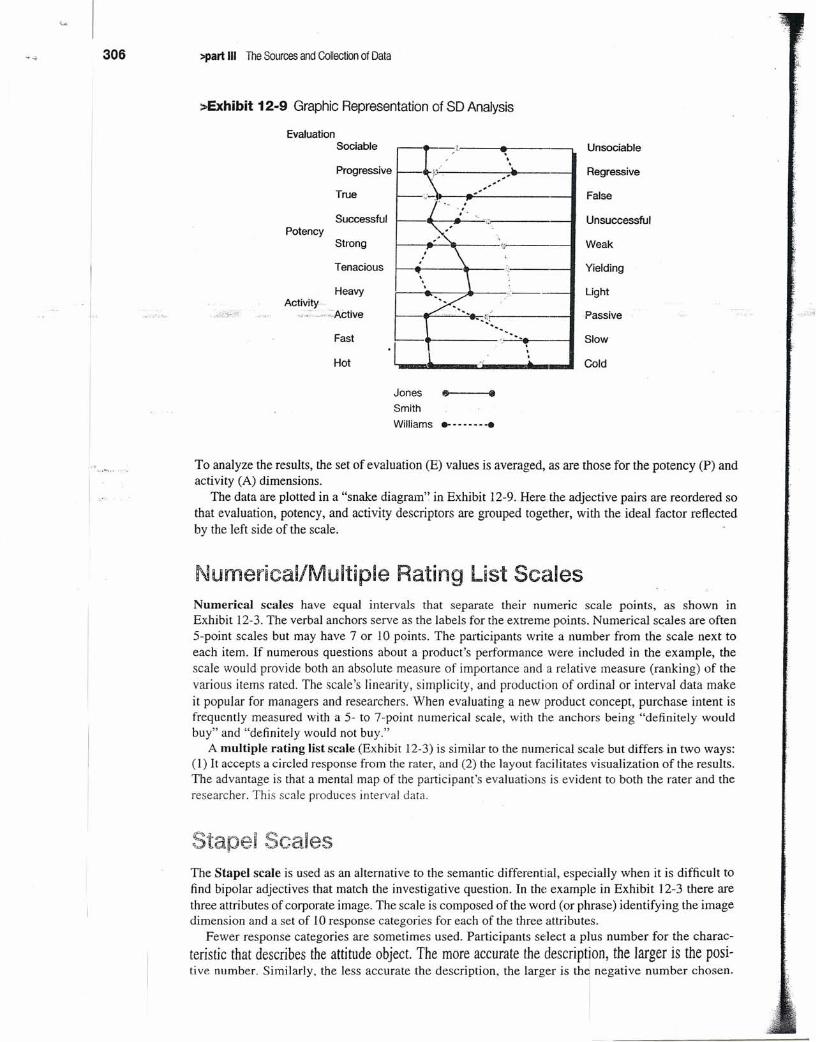
To analyze the results, the set of evaluation (E) values is averaged, as are those for the potency (P) andactivity (A) dimensions.
The data are plotted in a "snake diagram" in Exhibit 12-9. Here.the adjective pairs are reordered sothat evaluation, potency, and activity descriptors are grouped together, with the ideal factor reflectedby the left side of the scale.
Numerical/Multiple Rating List ScalesNumerical scales have equal intervals that separate their numeric scale points, as shown inExhibit 12-3, The verbal anchors serve as the labels for the extreme points. Numerical scales are often5-point scales but may have 7 or 10 points. The participants write a number from the scale next toeach item. If numerous questions about a product's performance were included in the example, thescale would provide both an absolute measure of importance and a relative measure (ranking) of thevarious items rated, The scale's linearity, simplicity, and production of ordinal or interval data makeit popular for managers and researchers, When evaluating a new product concept, purchase intent isfrequently measured with a 5- to 7-point numerical scale, with the anchors being "definitely wouldbuy" and "definitely would not buy,"
A multiple rating list scale (Exhibit 12-3) is similar to the numerical scale but differs in two ways:(1) It accepts a circled response from the rater, and (2) the layout facilitates visualization of the results.The advantage is that a mental map of the participant's evaluations is evident to both the rater and theresearcher. This scale produces interval data.
Staoel ScalesThe StapeI scale is used as an alternative to the semantic differential, especially when it is difficult tofind bipolar adjectives that match the investigative question. In the example in Exhibit 12-3 there arethree attributes of corporate image. The scale is composed of the word (or phrase) identifying the imagedimension and a set of 10 response categories for each of the three attributes,
Fewer response categories are sometimes used. Participants select a plus number for the charac-teristic that describes the attitude object. The more accurate the description, the larger is the posi-tive number. Similarly. the less accurate the description, the larger is thl negative number chosen.
~.
>chapter 12 MeasurementScales 307
Ratings range from +5 to -5, with participants selecting a number that describes the store veryaccurately to very inaccurately. Like the Likert, SD, and numerical scales, Stapel scales usuallyproduce interval data.
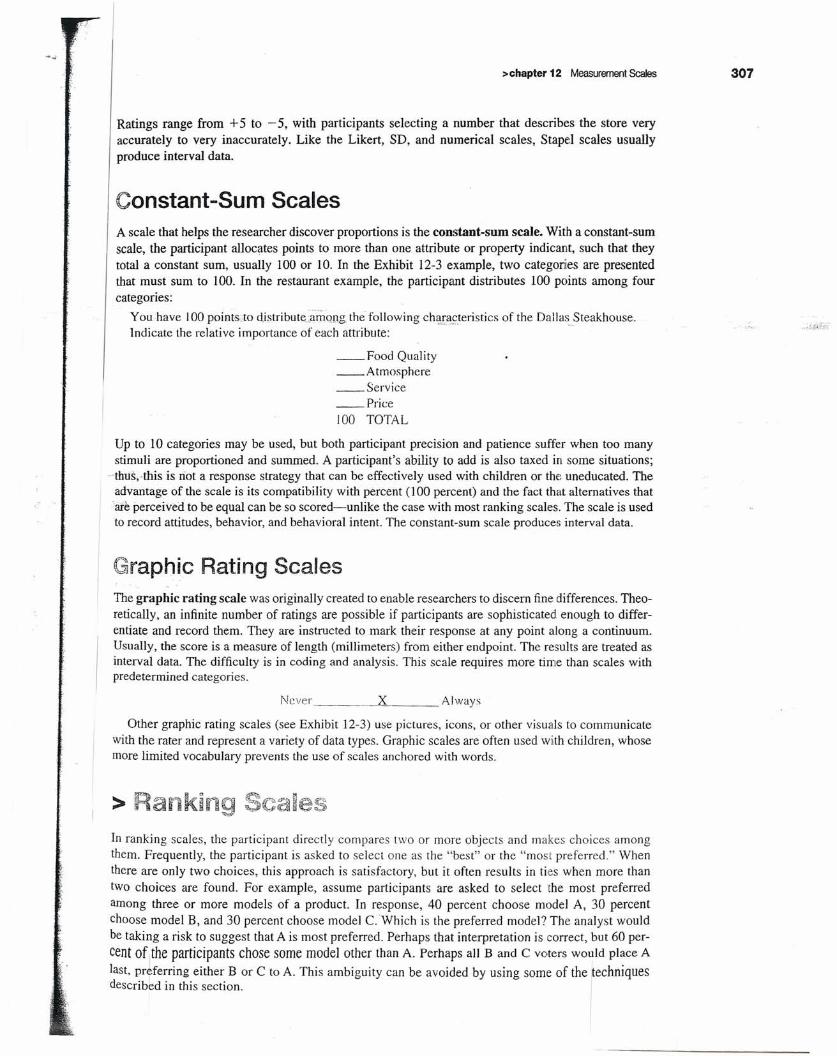
Constant-Sum ScalesA scale that helps the researcher discover proportions is the constant-sum scale. With a constant-sumscale, the participant allocates points to more than one attribute or property indicant, such that theytotal a constant sum, usually 100 or 10. In the Exhibit 12-3 example, two categories are presentedthat must sum to 100. In the restaurant example, the participant distributes 100 points among fourcategories:
You have 100 points-to distribute,;.among the following ch~~~teristics of the Dallas Steakhouse.Indicate the relative importance of each attribute: .
__ Food Quality__ Atmosphere__ Service__ Price100 TOTAL
Up to 10 categories may be used, but both participant precision and patience suffer when too manystimuli are proportioned and summed. A participant's ability to add is also taxed in some situations;
-tbus.this is riot a response strategy that can be effectively used with children or the uneducated. Theadvantage of the scale is its compatibility with percent (lOO percent) and the fact that alternatives thatare perceived to be equal can be so scored-unlike the case with most ranking scales. The scale is usedto record attitudes, behavior, and behavioral intent. The constant-sum scale produces interval data.
Graphic Rating ScalesThe graphic rating scale was originally created to enable researchers to discern fine differences. Theo-retically, an infinite number of ratings are possible if participants are sophisticated enough to differ-entiate and record them. They are instructed to mark their response at any point along a continuum.Usually, the score is a measure of length (millimeters) from either endpoint. The results are treated asinterval data. The difficulty is in coding and analysis. This scale requires more time than scales withpredetermined categories.
Never -----'XCL. A Iways
Other graphic rating scales (see Exhibit 12-3) use pictures, icons, or other visuals to communicatewith the rater and represent a variety of data types. Graphic scales are often used with children, whosemore limited vocabulary prevents the use of scales anchored with words.
> Ranking ScalesIn ranking scales, the participant directly compares two or more objects and makes choices amongthem. Frequently, the participant is asked to select one as the "best" or the "most preferred." Whenthere are only two choices, this approach is satisfactory, but it often results in ties when more thantwo choices are found. For example, assume participants are asked to select the most preferredamong three or more models of a product. In response, 40 percent choose model A, 30 percentchoose model B, and 30 percent choose model Ci Which is the preferred model? The analyst wouldbe taking a risk to suggest that A is most preferred. Perhaps that interpretation is correct, but 60 per-cent of Ithe participants chose some model other than A. Perhaps all Band C voters would pl~ce Alast. preferring either B or C to A. This ambiguity can be avoided by using some of the techniquesdescribbd in this section.
I
~;08 >part 1/1 TheSourcesandCollectionofData
>Exhibit 12-10 Ranking Scales
Paired-ComparisonScaledata: ordinal
,"For,each pair of two-seat sports cars listed, place-a check beside the one:';:you would most prefer if you had to choose betWe,en"thetwQJ;' '.' • '.
,- -, - . ;,' ,- .,-" ','. -"
·L~~~~~'". . .... ,....:.., .. "'" ...
. ,.
_._. Chevrolet Corvette Z06,_._ Dodge Vip;erSFtT10.,
'_' DqdgeViperSRTiO_ I3MW.z4.M C.otJP~/
. .. ".. . '.- ;~ ••L
,--::
Forced Ranking Scaledata: ordinal
"Rank the radar detection features in your order of preference; Place thenumber 1 next to the most preferred, 2 by the second choice; and so forth. "
_ User programming_ Cordless capability
Small size_ Long-range warning
Minimal false alarms
Comparative Scaledata: ordinal
ABOUT THE SAMESUPERIOR
"Compared to your previous hair dryer's performance, the new one is":
INFERIOR
2 3 4 5
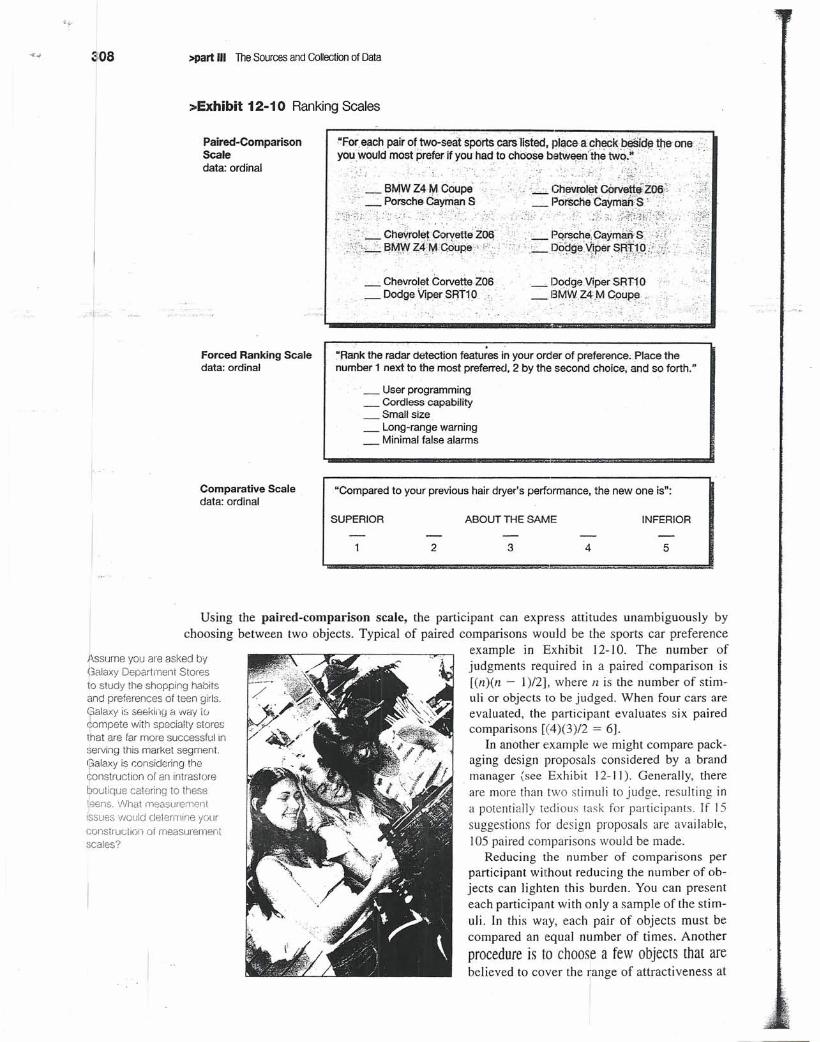
Using the paired-comparison scale, the participant can express attitudes unambiguously bychoosing between two objects. Typical of paired comparisons would be the sports car preference
example in Exhibit 12-10. The number ofjudgments required in a paired comparison is[(n)(n - I )/2], where n is the number of stim-uli or objects to be judged, When four cars areevaluated, the participant evaluates six pairedcomparisons [(4)(3)/2 = 6].
In another example we might compare pack-aging design proposals considered by a brandmanager (see Exhibit 12-11), Generally, thereare more than two stimuli to judge, resulting ina potentially tedious task for participants. If 15suggestions for design proposals are available,105 paired comparisons would be made.
Reducing the number of comparisons perparticipant without reducing the number of ob-jects can lighten this burden. You can presenteach participant with only a sample of the stim-uli. In this way, each pair of objects must becompared an equal number of times. Anotherprocedure is to choose a few objects that arebelieved to cover the rnge of attractiveness at
Assume you are asked byGalaxy Department Storesto study tile shopping habitsand preferences of teen girls,(0alaxy is S88kiilQ 8 vvay tocompete with specialty storesthat are far more successful inserving this market segment.'palaxy is c:onsidering theconstruction of an intrastoreboutique catering to theseleens, vvhat measurementissues would determine yourconstruction of measurementscales?
>chapter 12 MeasurementScales 309
:;.Exhibit 12-11 Response Patterns of 200 Heavy Users' Paired Comparisons on FiveAlternative Package Designs
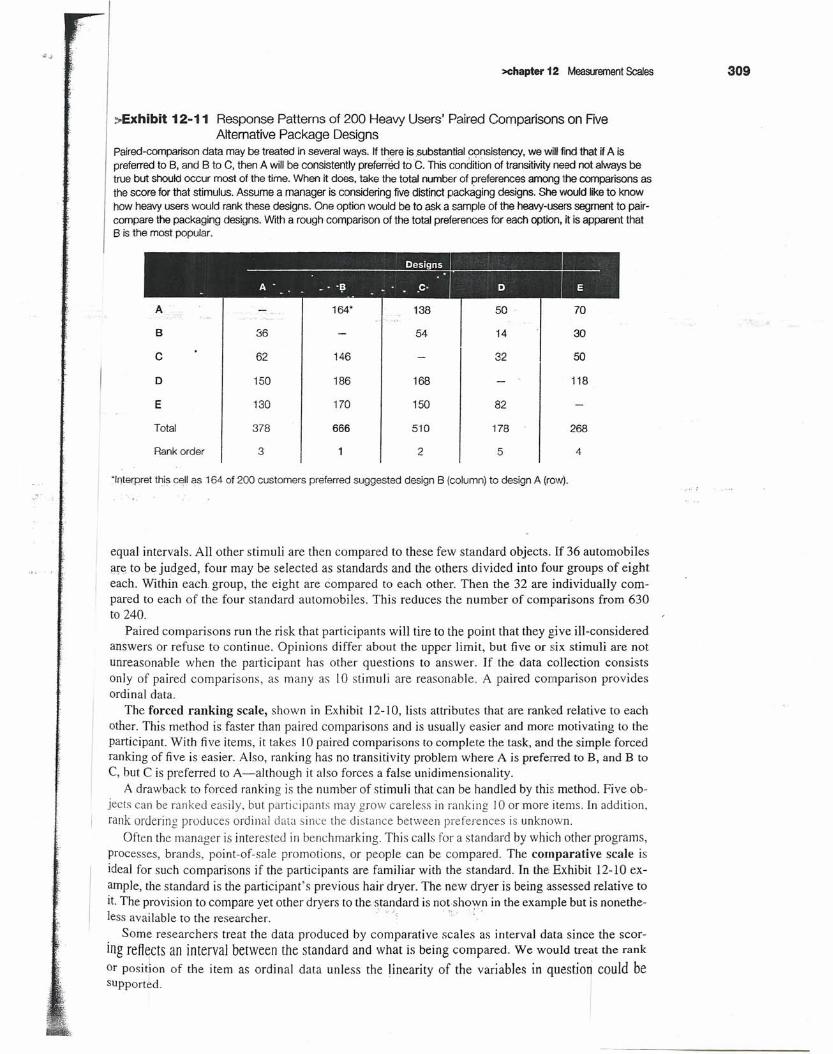
Paired-comparison data may be treated in several ways. If there is .substantial consistency, we will find that if A ispreferred to B, and B to C, then A will be consistently preferiEkt to C. This condition of transitMty need not always betrue but should occur most of the time. When it does, take the total number of preferences among the comparisons asthe score for that stimulus. Assume a manager is considering five distinct packaging designs. She would Uketo knowhow heavy users would rank these designs. One option would be to ask a sample of the heavy-users segment to pair-compare the packaging designs. With a rough comparison of the total preferences for each option, it is apparent that8 is the most popular.
A 164' 138 50 70B 36 54 14 30C 62 146 32 500 150 186 168 118E 130 170 150 82Total 378 666 510 178 268Rank order 3 2 5 4
'Interpret this cell as 164 of 200 customers preferred suggested design 8 (column) to design A (row).
equal intervals. All other stimuli are then compared to these few standard objects. If 36 automobilesare to be judged, four may be selected as standards and the others divided into four groups of eighteach. Within each. group, the eight are compared to each other. Then the 32 are individually com-pared to each of the four standard automobiles. This reduces the number of comparisons from 630to 240.
Paired comparisons run the risk that participants will tire to the point that they give ill-consideredanswers or refuse to continue. Opinions differ about the upper limit, but five or six stimuli are notunreasonable when the participant has other questions to answer. If the data collection consistsonly of paired comparisons, as many as 10 stimuli are reasonable. A paired comparison providesordinal data.
The forced ranking scale, shown in Exhibit 12-10, lists attributes that are ranked relative to eachother. This method is faster than paired comparisons and is usually easier and more motivating to theparticipant. With five items, it takes 10 paired comparisons to complete the task, and the simple forcedranking of five is easier. Also, ranking has no transitivity problem where A is preferred to B, and B toC, but e is preferred to A-although it also forces a false unidimensionality.
A drawback to forced ranking is the number of stimuli that can be handled by this method. Five ob-jects can be ranked easily, but participants may grow careless in ranking 10 or more items. In addition,rank ordering produces ordinal data since the distance between preferences is unknown.
Often the manager is interested in benchmarking. This calls for a standard by which other programs,processes, brands, point-of-sale promotions, or people can be compared. The comparative scale isideal for such comparisons if the participants are familiar with the standard. In the Exhibit 12-10 ex-ample, the standard is the participant's previous hair dryer. The new dryer is being assessed relative toit. The provision to compare yet other dryers to the standard is not-shown in the example but is nonethe-less available to the researcher. " '. , , " . ..
Some researchers treat the data produced by comparative scales as interval data since the scor-ing refteets an interval between the standard and what is being compared. We would treat the rank
IOr positron of the item as ordinal data unless the linearity of the variables in question could besupported.
310 >part /11 The Sources and Collection of Data
~:;~ ~~ ,"'- :".,\ -•••.- -,' -,.;~ ,--~~*\ <~"'~~r~!!·<·.!,·f~~-;~~:'..~~;:'~:~~/~':~~ ~1;'
;~,Paired Comparison Incr:eases ~ospitality'',"~~:. •. • • ¥ ~ I ' ~-
":"";..,,_ -;'1.,:. _ - .' , - .. :: ", <, '.;'
Should Northwest Airlines, Marriott, or Alaskan Airlines attempt
to attract the business of Americans with disabilities? If so, what
would it take to capture the segment? Eric Upp, executive direc-
tor of the Open Doors Organization (000), an advocacy organi-
zation for those with disabilities, sponsored a study to find out
High on his agenda was providing an incentive to the travel in-
dustry to make accommodations to attract the 22 million adults, ,<. ,"" .. ,_,',-:' .• :'0-
with disabilities who have traveled in the last two years on 63 mil-
lion trips-and who may want to travel more. "We now estimate
that Americans with disabilities currently spent $13.2 billion in
travel expenditures and that amount ',:ould at least double [to
$27,2 billion] if travel businesses were more attuned to the needs
of those with disabilities."
000 hired Harris Interactive, a global market research and
consulting firm best known for The Harris Poll and for pioneer-
ing the Internet method to conduct scientifically accurate mar-
ket research. Harris Interactive conducted a hybrid study via
both online and phone surveys to' determine the magnitude of
. the disability travel segment, its purchasing power, and the ac-
commodations the' segment needed to increase travel. "Those
with disabilities can't all be reached with one method," explained
Laura Ught, project director with Harris Interactive. "The nature of
their physical limitation might preclude one method or the other."
> Sorting
And how did the firm evaloote all the possible accommodations-
from Braille safety cards on airplanes to a designated person to
handle problems in a hotel? Harris Interactive used its proprietary
COMPASS™ methodoloUY, which uses paired comparisons as
Cl measurement tool. "COMPASSTM saves the participant time
and energy, • explained U9ht. "Even with a long list, COMPASSTM
can be done quickly.;' In the 000 study, COMPASSTM was used
twice: once to measure 17 possible airline accommodations and
once to measure 23 possible hotel accommodations. By hav-
ing each participant evaluate only a portion of the large number
of accommodation pairs rather than the full list (136 for airline
accommodatrons and 263 for hotel accommodations). each
question was answered in under four minutes. By using this pro-
cess with all members of the sample, Harris Interactive is able to
rank-order the items and measure the magnitude of difference
between items. This makes it easier for Delta, Marriott, or Alas-
kan Airlines to make the ri9ht choices about accommodations for
those with disabilities .
www.opendoorsnfp.org; www.harrisjnteractlve.com
To learn rnore about this research, read the case "OpenDoors: Extending Hospitality to Travelers with Disabilities."
Q-sorts require sorting of a deck of cards into piles that represent points along a continuum. Theparticipant-or judge-groups the cards based on his or her response to the concept written on thecard. Researchers using Q-sort resolve three special problems: item selection, structured or unstruc-tured choices in sorting, and data analysis. The basic Q-sort procedure involves the selection of a set ofverbal statements, phrases, single words, or photos related to the concept being studied. For statisticalstability, the number of cards should not be less than 60; and for convenience, not be more than 120.After the cards are created, they are shuffled, and the participant is instructed to sort the cards into aset of piles (usually 7 to 11), each pile representing a point on the judgment continuum. The left-mostpile represents the concept statements, which are "most valuable," "favorable," "agreeable," and soforth. The right-most pile contains the least favorable cards. The researcher asks the participant tofill the center, or neutral, pile with the cards about which the participant is indecisive. In the case of astructured sort, the distribution of cards allowed in each pile is predetermined. With an unstructuredsort, only the number of piles will be determined. Although the distribution of cards in most structuredsorts resembles a normal distribution, there is some controversy about analyzing the data as ranking(ordinal data) versus interval data.
The purpose of sorting is to get a conceptual representation of the sorter's attitude toward the at-titude object and to compare the relationships between people. The relative [ranking of concepts allowsresearchers to derive clusters of individuals possessing similar preferencfs. By researchers varying
?.:'
, (
>chapter 1~~MeasurementScales 311
.,:.....:"'<:::' . <":~.'~-.
tons, he finds a question tllafs~mstocapturElthe'~eoc dataoase,flClmes,'addre:>SeS.andPhOnenci:·'·'. the rePair process: Are customer~'proble~s r~SOIVoo?Trans-'and &ocu~torrt~;~iare 'cl1QSenatrariddrn#6·"', .... ·Sl'!' ~h8.ve .
latedinto an assertion for the scale, the statement becomes had recentservlc~, Jason cfioosesthe del$y~.~~yr\,i<lfehtfOrr11S"Resolutionof problemthat prompted service/repair."He.contin-. method for reliabilitytesting (see Chapter 11)" dasonadminis-ues to laboroverthe wording of the verbal anchors.Appropriate ters the expectation scale followed by the ildrX$r.i6;li'~caIe.toversions of the investigativequestion are constructed, and then half of the partictpants and the numerical sc~i~iolI6wed by
.'. the scalesare added. the expectation scale to the other half: Each half sample ex- .... After co~sultingwith MindWriter's research staff, Myra and periences a time delay. No ·order-of-presentati9r:~e~ects~re
-Jason discussthe advantagesof the scales. Myra suggests it is found..Subsequently,Jason correlatesthe num?~Cal$GltiSf!:lctionunlikelythat CompleteCarewould meet none of the customers' scores with the expectation scores arid ~lotsth~;~GJt~~sh~wn .expectations.And. with errors of leniency,"none" should be re-in Exhibit 12-13. . ..placed by the term "few" so that the low end of the scafewould On the problem re:solutionquestion, the partlclpants' scores
. be more relevant.Jason has read a Marketing News article that from the satisfactionscaJeand those from the expectation scale
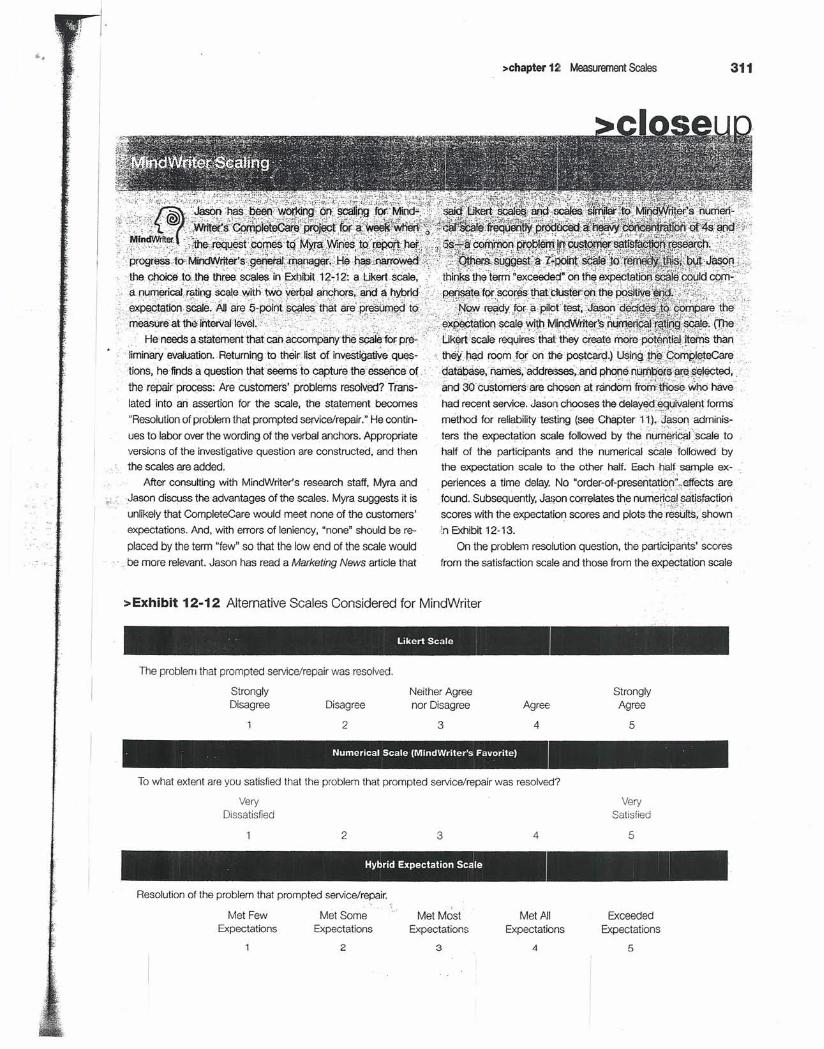
>Exhibit 12-12 Alternative Scales Considered for MindWriter
Likert Scale
The problemthat prompted service/repairwas resolved.
StronglyDisagree Agree
4
StronglyAgree
5
NeitherAgreenor DisagreeDisagree
2 3
. Numerical Scale (MindWriter's Favorite)
To what extentare you satisfiedthat the problemthat prompted service/repairwas resolved?
VeryDissatisfied
VerySatisfied
2 4 53
Resolutionof the problem that prompted service/repair.
Met FewExpectations
Met SomeExpectations
2
Met MostExpectations
3
Met AllExpectations
4
ExceededExpectations
5
312 >part III TheSourcesandCollectionofData
'. ! '",
•
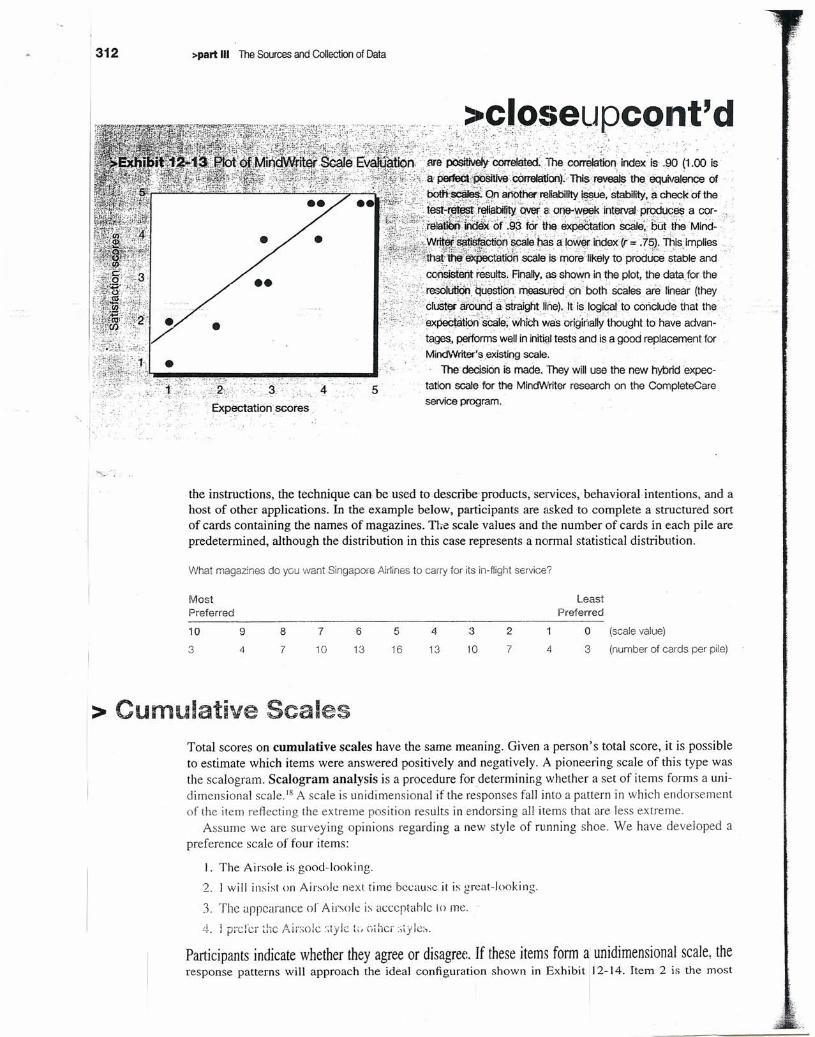
',"~':, conSist~ttesul~~.Finally.as shown intheplot. the data for the
·;;V~Lj,;'!i:~~~~:~itra%~I~:I~~s~:~~~e~6~~U~:ei~S~~~, ,~.:';/;~~pe<$ti9iiscale;'whith'~a:sOrigi(jaliythought to have advan-
taoes, performswellininiticlltests and is a good replacement forMi~Vriter's ,existingscale. ,
~ decisionis made. They willuse the new hybridexpec-, tation sCalefor the MindWriterresearch on the CompleteCare
serviceprogram,
"j
~~ .:".::.".!<
,i.'~~J;::;3,' ,f, 4'. '.'~pectatioriscores .:
: .. - ,". " ..
the instructions, the technique can be used todescribeproducts, services.ibehavioral.intentions, and ahost of other applications. In the example below, participants are asked -to complete a structured sortof cards containing the names of magazines. The scale values and the number of cards in each pile arepredetermined, although the distribution in this case represents a normal statistical distribution,
What magazines do you want Singapore Airlines to carry for its in-flight service?
Most LeastPreferred Preferred
10 9 8 7 6 5 4 3 2 0 (scale value)
3 4 7 10 13 16 13 10 7 4 3 (number of cards per pile)
> Cumulative ScalesTotal scores on cumulative scales have the same meaning. Given a person's total score, it is possibleto estimate which items were answered positively and negatively. A pioneering scale of this type wasthe scalogram, Scalogram analysis is a procedure for determining whether a set of items forms a uni-dimensional scale." A scale is unidimensional if the responses fall into a pattern in which endorsementof the item reflecting the extreme position results in endorsing aJJ items that are less extreme,
Assume we are surveying opinions regarding a new style of running shoe. We have developed apreference scale of four items:
I. The Airsole is good-looking,
2, I will insist on Airsoie next time because it is great-looking,
3, The appearance or Airsole is acceptable to me.
4. i prefer the Airxolc ~;tyjc t.. other :iiyle:"I_
Participants indicate whether they agree or disagree. If these items form a unidimensional scale, theresponse patterns will approach the ideal configuration shown in Exhibit 112-14. Item 2 is the most
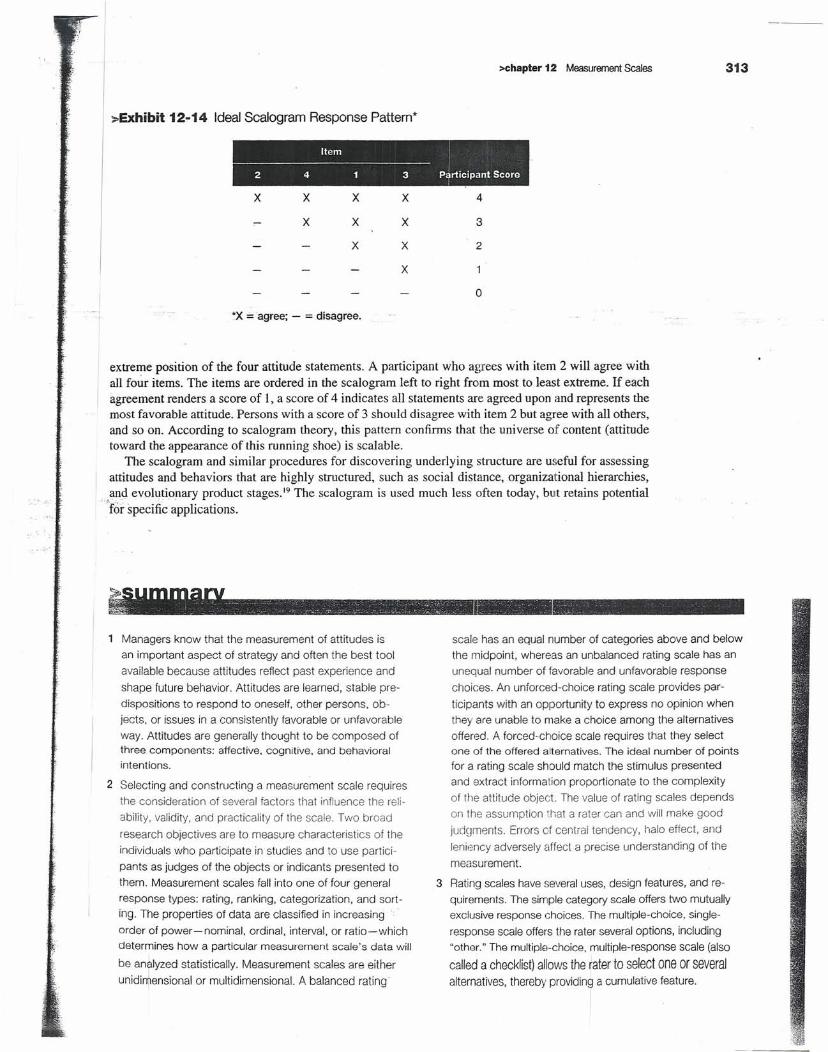
::.Exhibit 12-14 Ideal Scalogram Response Pattern*
>chapter 12 Measurement Scales
Item 12 4 1 3 P rticipant Score
I
x X X X 4
X X X 3
X X 2
X
0
,. ~X= agree; - = disagree.
extreme position of the four attitude statements. A participant who agrees with item 2 will agree withall four items. The items are ordered in the scalogram left to right from most to least extreme. If eachagreement renders a score of 1, a score of 4 indicates all statements are agreed upon and represents themost favorable attitude. Persons with a score of 3 should disagree with item 2 but agree with all others,and so on. According to scalogram theory, this pattern confirms that the universe of content (attitudetoward the appearance of this running shoe) is scalable.
The scalogram and similar procedures for discovering underlying structure are useful for assessingattitudes and behaviors that are highly structured, such as social distance, organizational hierarchies,and evolutionary product stages. 19 The scalogram is used much less often today, but retains potential
'fo~specific' applications.
-Managers know that the measurement of attitudes isan important aspect of strategy and often the best toolavailable because attitudes reflect past experience andshape future behavior, Attitudes are learned, stable pre-dispositions to respond to oneself, other persons. ob-jects, or issues in a consistently favorable or unfavorableway, Attitudes are generally thought to be composed ofthree components: affective, cognitive, and behavioralintentions.
2 Selecting and constructing a measurement scale requiresthe consideration of several factors that influence the reli-ability, validity, and practicality of the scale, Two broadresearch objectives are to measure characteristics of theindividuals who participate in studies and to use partici-pants as judges of the objects or indicants presented tothem. Measurement scales fall into one of four generalresponse types: rating, ranking, categorization, and sort-ing. The properties of data are classified in increasingorder of power-nominal, ordinal, interval, or ratio-whichdetermines how a particular measurement scale's data will
be analyzed statistically, Measurement scales are eitherunidi~ensional or multidimensional. A balanced rating
scale has an equal number of categories above and belowthe midpoint, whereas an unbalanced rating scale has anunequal number of favorable and unfavorable responsechoices. An unforced-choice rating scale provides par-ticipants with an opportunity to express no opinion whenthey are unable to make a choice among the alternativesoffered, A forced-choice scale requires that they selectone of the offered alternatives, The ideal number of pointsfor a rating scale should match the stimulus presentedand extract information proportionate to the complexityof the attitude object. The value of rating scales dependson the assumption that a rater can and will make goodjud~Jments, Errors of central tendency, halo effect, andleniency adversely affect a precise understanding of themeasurement.
3 Rating scales have several uses, design features, and re-quirements, The simple category scale offers two mutuallyexclusive response choices, The multiple-choice, single-response scale offers the rater several options, including"other," The multiple-choice, multiple-response scale (also
called a checklist) allows the rater to select one or severalalternatives, thereby providing a cumulative feature.
313
314 »part III TheSourcesandCollectionof Data
The Ukert scale consists of a series of statements, andthe participant is asked to agree or disagree with eachstatement. Summation is possible with this scale althoughnot necessary and in some instances undesirable.
The semantic differential (SD) scale measures the psy-chological meanings of an attitude object. Researchersuse this scale for studies of brand and institutional image.The method consists of a set of bipolar rating scales, usu-ally with 7 points, by which one or more participants rateone or more concepts on each scale item. The Stapelscale is used as an alternative to the semantic differential,especially when it is difficult to find bipolar adjectives thatmatch the investigative question. Participants select a plus
.. number for the characteristic that-describes the attitudeobject. Ratings range from +5 to -5, and participants se-lect a number that describes the object very accurately tovery inaccurately.
Numerical scales have equal intervals that separate theirnumeric scale paints. Verbal anchors serve as the labelsfor the extreme points. Numerical scales are often 5-pointscales but may have 7 or 10 points. A multiple rating listscale is similar to the numerical scale but accepts a circledresponse from the rater, and the layout allows visualization
_,~ofthe results.A scale that helps the researcher discover proportions
is the constant-sum scale. The participant distributes100 points among up to 10 categories. The graphic ratingscale was originally created to enable researchers to discernfine differences. Raters check their response at any point
along a continuum. Other graphic rating scales use pictures,icons, or other visuals to communicate with children orothers whose limited vocabulary prevents the use of scalesanchored with words.
Ranking scales allow the participant to compare two ormore objects and make choices among them. Frequently,the participant is asked to select one as the "best" or the"most preferred.n When there are only two choices, as withthe paired-comparison scale, the participant can expressattitudes unambiguously by choosing between two objects.The forced ranking scale lists attributes that are rankedrelative to each other, This method is faster than pairedcomparisons and more user-friendly..Often the researcheris interested in benchmarking: This calls for a standard bywhich training programs, processes, brands, point-of-salepurchases, or pecole can be compared. The comparativescale is ideal for such comparisons if the participants arefamiliar with the standard.
Q-sorts are a form of scaling that requires sorting of adeck of cards into piles that represent points along a con-tinuum. The purpose of sorting is to get a conceptual repre-sentation of the sorter's attitude toward the attitude objectand to compare the relationships between people. Given aperson's total score. it is possible to estimate which itemswere answered positively and.negatively on cumulativescales. A pioneering cumulative scale was the scalogram,a procedure for determining whether a set of items forms aunidimensional scale.
attitude 292 item analysis 301
balanced rating scale 295 Likert scale 299
multidimensional scale 295 scalogram analysis 312
semantic differential (SD) scale 303
categorization 295
comparative scale 309
constant-sum scale 307
-rating scale 295
scaling 294
multiple-choice, multiple-responsescale 299 simple category scale 298
cumulative scale 312 multiple-choice, single-responsescale 298
error of central tendency 297
error of leniency 297
forced-choice rating scale 296
I forced ranking scale 309
graphic rating scale 307
halo effec, (error) 298
numerical scale 306
multiple rating list scale 306
sorting 295
Stapel scale 306
summated rating scale 299
paired-comparison scale 308
Q-sort 310
ranking scale 295
unbalanced rating scale 296
unforced-choice rating scale 296
unidimensional scale 295
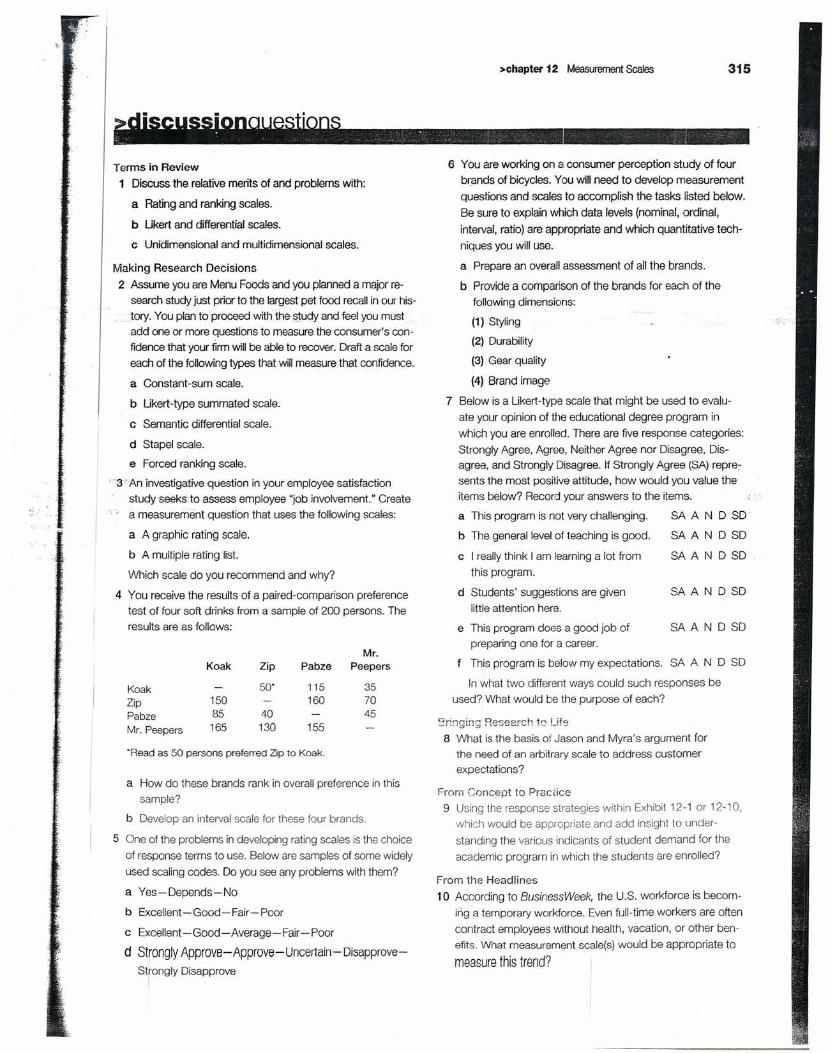
~:
Terms in Review1 Discuss the relative merits of and problems with:
a Rating and ranking scales.
b Ukert and differential scales.
c Unidimensional and multidimensional scales.
Making Research Decisions2 Assume you are Menu Foods and you planned a major re-
search study just prior to the largest pet food recall in our his-tory. You plan to proceed withthe~tudy and feel you mustadd one or more questions to measure the consumer's con-fidence that your firm will be able to recover. Draft a scale foreach of the following types that will measure that confidence.
a Constant-sum scale.
b Ukert-type summated scale.
e Semantic differential scale.
d Stapel scale.
e Forced ranking scale.
'3 .An investigative question in your employee satisfactionstudy seeks to assess employee "job involvement." Createa measurement question that uses the following scales:
a A graphic rating scale.
b A multiple rating list.
Which scale do you recommend and why?
4 You receive the results of a paired-comparison preferencetest of four soft drinks from a sample of 200 persons. Theresults are as follows:
Mr.Koak Zip Pabze Peepers
Koak 50* 115 35Zip 150 160 70Pabze 85 40 45Mr. Peepers 165 130 155
*Readas 50 persons preferredZip to Koak.
a How do these brands rank in overall preference in thissample?
b Develop an interval scale for these four brands.
5 One of the problems in developing rating scales is the choiceof response terms to use. Below are samples of some widelyused scaling codes. Do you see any problems with them?
a Yes-Depends-No
b Excellent-Good-Fair-Poor
c Excellent-Good-Average-Fair-Poor
d Strongly Approve-Approve - Uncertain - Disapprove-
Strongly DisapproveI
>chapter 12 MeasurementScales 315
6 You are working on a consumer perception study of fourbrands of bicycles. You will need to develop measurementquestions and scales to accomplish the tasks listed below.Be sure to explain which data levels (nominal, ordinal,interval, ratio) are appropriate and which quantitative tech-niques you will use.
a Prepare an overall assessment of all the brands.
b Provide a comparison of the brands for each of thefollowing dimensions:
(1) Styling
(2) Durability
(3) Gear quality
(4) Brand image
7 Below is a Likert-type scale that might be used to evalu-ate your opinion of the educational degree program inwhich you are enrolled. There are five response categories:Strongly Agree, Agree, Neither Agree nor Disagree, Dis-agree, and Strongly Disagree. If Strongly Agree (SA) repre-sents the most positive attitude, how would you value theitems below? Record your answers to the items.
a This program is not very challenging. SA AND SD·
b The general level of teaching is good. SA AND SO
c I really think I am learning a lot from SA AND SOthis program.
SA AND SOd Students' suggestions are givenlittle attention here.
e This program does a good job of SA AND SDpreparing one for a career.
This program is below my expectations. SA AND SO
In what two different ways could such responses beused? What would be the purpose of each?
!3ringing Research to Ltf9
8 What is the basis of Jason and Myra's argument forthe need of an arbitrary scale to address customerexpectations?
From Concept to Practice9 Using the response strategies within Exhibit 12-1 or 12-10,
which would be appropriate and add insight to under-standing the various indicants of student demand for theacademic program in which the students are enrolled?
From the Headlines10 According to BusinessWeek, the U.S. workforce is becom-
ing a temporary workforce. Even full-time workers are oftencontract employees without health, vacation, or other ben-efits. What measurement scale(s) would be appropriate to
measure this trend?
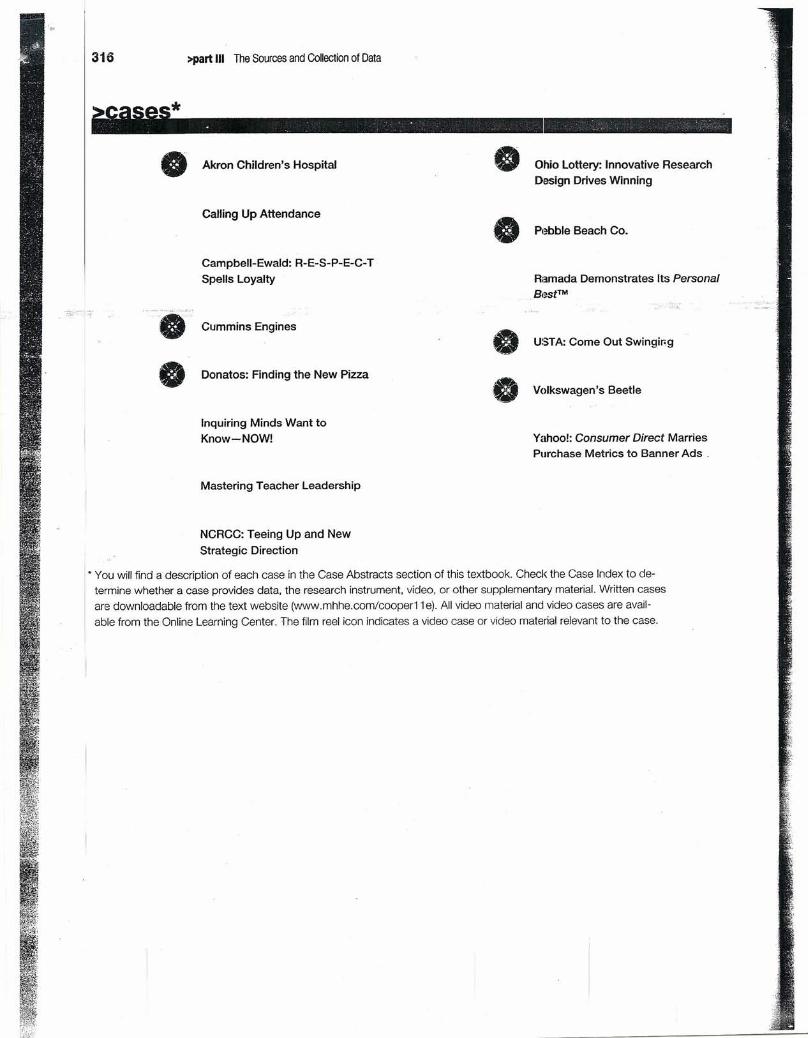
316 >part III The Sources and Collection of Data
e Akron Children's Hospital Ohio Lottery: Innovative ResearchDesign Drives Winning
Calling Up Attendance• PIIDble Beach Co.
Campbell-Ewald: R-E-S-P-E-C- TSpells Loyalty Ramada Demonstrates Its Personal
BI~stTM
8 Cummins Engines e USTA: Come Out Swingir;g
• Donatos: Finding the New Pizza e Volkswagen's Beetle
Inquiring Minds Want toKnow-NOW! Yahoo!: Consumer Direct Marries
Purchase Metrics to Banner Ads .
Mastering Teacher Leadership
NCRCC: Teeing Up and NewStrategic Direction
* You will find a description of each case in the Case Abstracts section of this textbook. Check the Case Index to de-termine whether a case provides data, the research instrument, video, or other supplementary material. Written cases
are downloadable from the text website (www.mhhe.com/cooper11e). All video material and video cases are avail-
able from the Online Learning Center. The film reel icon indicates a video case or video material relevant to the case.