: ccnc flaws:
TRANSCRIPT

Why Community Care of North Carolina is Failing Patients, Taxpayers, and Policymakers
CCNC Flaws

CCNC Flawswhy CommuNity Care oF North CaroliNa is FailiNg
PatieNts, taxPayers, aNd PoliCymakers
JoNathaN iNgram katheriNe restrePo
oCtober 2013
Contents
3 Executive Summary 4 Introduction CCNC Flaw #1: Medicaid Patients are Denied the Right to Choose 5 CCNC Flaw #2: There Is No Competition or Accountability in
Medicaid 6 CCNC Flaw #3: Nobody Agrees Whether or How Much Savings were
Achieved, and Policymakers Cannot Accurately Budget for Medicaid Spending
CCNC Consultants Cannot Agree on Savings 7 CCNC Flaw #4: Health Care Costs and Utilization are Rising 8 Primary Care Visits Have Increased in the CCNC Model 9 Use of prescription drugs has increased in the CCNC model Emergency room visits have increased in the CCNC model10 CCNC Flaw # 5: Funding Scheme Makes it Impossible to Know if it
Actually Saves Taxpayer Dollars Elderly and disabled CCNC Medicaid patients cost more than those in
traditional Old Medicaid11 North Carolina spends more per person on Medicaid than any other
state in the region Conclusion12 End Notes16 About the Authors17 About the John Locke Foundation
This is a joint publication of the Florida-based Foundation for Government Accountability and the North Carolina-based John Locke Foundation. It appears as Policy Brief #6 for the Foundation for Government Accountability’s Medicaid Cure initiative, and as a Policy Report for the John Locke Foundation.The views expressed in this report are solely those of the author and do not necessarily reflect those of the staff or board of the John Locke Foundation. For more information, call 919-828-3876 or visit www.JohnLocke.org.
©2013 by the John Locke Foundation.

3CCNC FLAWS
P O L I C Y R E P O R T
Executive Summary
The current debate over the long-term sustainability of North Carolina’s Medicaid program pits defenders of the status-quo Community Care of North Carolina (CCNC) model against reformers touting Governor Pat McCrory’s proposed Partnership for a Healthy North Carolina.
The Partnership embraces a Medicaid reform approach already up and running in states such as Florida, Kansas, and Louisiana. In these states, patient choice, competition among privately-run plans, innovation, and accountability have resulted in Medicaid patients who are healthier and happier with their care and millions of dollars in annual taxpayer savings.
CCNC is a non-profit collection of regional networks that provide certain care coordination services to Medicaid patients. Designers of the program hoped that assigning primary care providers to Medicaid patients would result in better-coordinated patient care that would reduce unnecessary utilization and better manage conditions.
CCNC has failed to keep its promises of improved patient health and lower costs. In fact, the majority of North Carolina’s widely-tracked Medicaid patient health outcomes have been in decline, while Medicaid spending has dramatically grown. Several design flaws have contributed to CCNC’s poor record, including:
• A one-size-fits-all government-centered system that denies patients meaningful choices and ignores patients’ individual health needs and concerns
• The absence of any competition among plans to drive innovation, better customer service, or greater accountability
• Wildly varying assessments among several state-hired consultants of the level of savings achieved
• A funding scheme that limits policymakers’ ability to accurately predict and budget for Medicaid spending
These and other flaws continue to burden patients, taxpayers, and policymakers, and have sparked a movement within Raleigh to fundamentally restructure North Carolina’s Medicaid program to make it a truly pro-patient, pro-taxpayer health care safety net.
This report identifies and explains CCNC’s flaws and shows how the Partnership for a Healthy North Carolina is a far more effective approach to not only improve patient health, but also rein in Medicaid spending and save taxpayer dollars.

4
J O H N LO C K E F O U N D AT I O N
C C N C F L AW S
IntroduCtIon
North Carolina’s Old Medicaid system is broken. Costs are skyrocketing, patients lack choice and control over their health future, access to providers is limited, and health outcomes are poor.1 In April 2013, Governor Pat McCrory put forth a plan to redesign North Carolina’s broken Old Medicaid system.2 McCrory’s plan, the Partnership for a Healthy North Carolina, builds upon pro-patient, pro-taxpayer Medicaid reforms already succeeding in states such as Florida, Kansas, and Louisiana.3 In those states, these reforms have increased patients’ access to quality care, improved patients’ health outcomes, created greater budget predictability, and saved taxpayers’ money.4
Rather than embrace the proven structural Medicaid reforms of the Partnership, some have argued that North Carolina should instead maintain the current Community Care of North Carolina (CCNC) Medicaid model.5
CCNC is a non-profit collection of 14 regional networks that currently provide some care coordination services to Medicaid patients.6 Today, nearly 86 percent of North Carolina’s Medicaid program runs through CCNC or its sister program, Carolina ACCESS.7 The Medicaid program pays a small administrative fee on a per member per month basis for care coordination, but all medical services are billed fee-for-service.8 The administrative fee ranges from $3 to $13 per member per month and varies by eligibility category, with higher management fees paid for elderly, blind, and disabled patients.9 In 2010, 97 percent of North Carolina’s Medicaid spending was billed fee-for-service.10
In the mid-1990s, the North Carolina Department of Health and Human Services began looking for ways to create greater budget predictability and control over its Medicaid program.11 The Department rolled out the CCNC model to connect Medicaid patients with a “medical home,” hoping assigned primary care providers who were coordinating patients’ care would be able to reduce unnecessary utilization and manage medical conditions more efficiently.12 This care coordination was expected to reduce hospital costs, primarily by treating patients with non-urgent conditions in less-expensive settings.13
Although CCNC’s goals of improving health and reducing costs are worthy, the current CCNC model has numerous design flaws that make it extremely difficult to achieve those goals.
CCnC Flaw #1: MedICaId PatIents are denIed the rIght to Choose
In the CCNC model, patients are linked to a primary care physician to serve as their medical home.14 Although patients can generally choose their own primary care physician, all benefits are structured in the same one-size-fits-all Old Medicaid model. Patients with diabetes, autism, chronic kidney disease, and Alzheimer’s, for example, are all treated the same and forced into the same, non-personalized Medicaid plan.
This one-size-fits-all approach ignores patients’ individual health needs and concerns. The Partnership for a Healthy North Carolina, on the other hand, utilizes comprehensive care entities (CCEs) that are able to customize benefits and care for patients.
Under the Partnership, public and private CCEs submit competing bids to the state to provide all Medicaid services available to patients. The state then contracts with several of these CCEs to provide the highest level of service and benefits at the lowest cost to taxpayers.
These entities operate statewide, serving both rural and urban areas, and all use the same vendor to reimburse medical providers. Medicaid patients are empowered to choose a health plan from among these CCEs that best meets their specific health needs and concerns. The plans compete for patients based on value. If patients are unhappy with their plans, they can choose new plans that provide them with better value based on their individual circumstances.

5CCNC FLAWS
P O L I C Y R E P O R T
Medicaid patients are able to select plans based on cost, quality and access to care—and CCEs are paid a fixed monthly rate for each enrolled individual, which is risk-adjusted for that individual’s health status.
This framework shifts the risk of waste, fraud, and abuse from the state and taxpayer back to the entities that are actually managing and coordinating patients’ care. This payment arrangement also provides CCEs with financial incentives to prioritize all patients’ health and to identify and treat health conditions earlier. Risk-adjusted rates prevent plans from cherry-picking healthy patients, instead creating a financial incentive for CCEs to compete for sicker patients and manage their care more effectively. Rates are adjusted for inflation to help ensure providers remain profitable and costs are predictable year after year.
Other states are implementing this choice-based Medicaid model with great success. In Florida’s Medicaid Reform Pilot, for example, patients may choose from up to 35 customized benefit packages offered by 14 different health plans.15 The benefits of this plan customization are particularly evident for patients with very complicated health challenges. Florida’s Reform Pilot features plans developed specifically for medically fragile children, plans customized to best manage HIV/AIDS, and other specialty plans.16 Likewise, Kansas offers programs that are specifically designed to help manage HIV/AIDS and other complicated conditions such as schizophrenia as part of its KanCare Medicaid reform.17
These packages include benefits and services not typically covered by Old Medicaid. The Florida Reform Pilot plans have coverage for over-the-counter drugs, preventive dental, vision benefits, respite care, wellness therapy, and nutritional counseling included among the value-added extra benefits.18,19 With KanCare, individuals can choose plans that offer additional dental benefits, smoking cessation programs, GED programs, Weight Watchers membership, and Boys and Girls Clubs membership, among other benefits.20
By contracting with multiple CCEs, the Partnership for a Healthy North Carolina can enable those CCEs to vary provider networks, drug formularies, benefit packages, optional services and other plan features. This ensures that patients have meaningful choices over their health plans and enables CCEs to compete on value by tailoring their benefits to best meet the needs and desires of their patients. The CCNC medical home model lacks these pro-patient provisions.
CCnC Flaw #2: there Is no CoMPetItIon or aCCountabIlIty In MedICaId
Because North Carolina Medicaid patients do not have the ability to choose their plans, there is no competition or accountability in the state’s Medicaid marketplace. And there is no incentive for primary care physicians, medical homes, and CCNC networks to improve patient health or satisfaction.
It is no surprise, then, that North Carolina’s Medicaid safety net is deteriorating in some critical areas.21 North Carolina measures its performance with the Healthcare Effectiveness Data and Information Set (HEDIS), the same set of metrics used by more than 90 percent of health plans in the United States.22
More than half of the 53 performance measures have worsened since 2010—approximately 55 percent.23 Worse yet, in some areas the performance of North Carolina’s Old Medicaid system has been on a downward spiral for the past several years.24 Nearly half of the regularly-tracked performance measures have declined since 2008.25 Compared to 2008, patients today are less likely to be prescribed appropriate medication for persistent asthma; less likely to receive recommended screenings for breast, cervical, and colorectal cancers; less likely to have preventive care visits; less likely to receive appropriate immunizations; and less likely to receive follow-up care after being hospitalized for mental illness.26 Although some performance measures have improved, such as access to dental care, many others continue to decline. When it comes to improving patient health, CCNC is holding the state back.

6
J O H N LO C K E F O U N D AT I O N
C C N C F L AW S
Medicaid patients in states that have a choice of private health plans are experiencing something much different. Competition among private plans has resulted in those plans constantly striving to innovate and to improve patient health and customer service. Florida’s Reform Pilot health plans outperform Old Medicaid in 22 of 33 regularly-tracked performance measures.27 Better yet, 94 percent of Florida’s measures have improved since 2008.28 Of the 19 performance measures that Florida and North Carolina both track, Florida’s Reform Pilot plans outperform North Carolina in 63 percent, including multiple measures for proper diabetes management, immunizations, and follow-up care following hospitalizations for mental illnesses.29
Florida’s experience also shows that when Medicaid patients are given a choice among a wide array of competing private health plans, they are more satisfied with the plans. For 83 percent of patient-satisfaction measures, Florida’s Reform Pilot plans meet or exceed national benchmarks not just for Medicaid, but for commercial insurance as well.30 In 2012, the Florida agency overseeing the Medicaid Reform Pilot received just six complaints for every 10,000 patients.31 The plans also successfully resolved these complaints quickly, as no unresolved grievances were filed during the entire year.32
State contracts with private plans further improve accountability, as they link significant financial incentives and penalties to quality and performance. In Kansas, for example, KanCare withholds three to five percent of health plans’ total payments as a performance incentive.33 In order to receive the withheld funds, plans must meet numerous standards to improve health outcomes, coordinate care, pay claims promptly, support members in their communities, promote wellness and healthy lifestyles, and lower the overall cost of care.34,35 KanCare also has additional penalties if plans fail to meet quality benchmarks or fail to adequately report progress.36
CCnC Flaw #3: nobody agrees whether or how MuCh savIngs were aChIeved, and PolICyMakers Can-not aCCurately budget For MedICaId sPendIng
CCNC claims to have saved the state billions of dollars, yet these calculations and claims have been subject to intense scrutiny by care management experts for severe methodological flaws.37-40 The State of North Carolina has hired three different consultants to review the CCNC program and estimate the savings it has produced. Although the three consultants all had the same three years of data, they all came up with wildly different savings numbers for each of those three years.CCNC consultants cannot agree on savingsSavings estimates in millions
Source: Community Care of North Carolina

7CCNC FLAWS
P O L I C Y R E P O R T
Mercer, the first consultant, found that between 2005 and 2009 CCNC saved North Carolina’s Medicaid program somewhere between $708 and $758 million.41 Annual savings ranged from a low of $77 million to a high of $194 million.42 Treo Solutions, the next consultant, found that between 2007 and 2009, CCNC had saved nearly $1.5 billion.43 Milliman, the most recent consulting group hired to analyze the program, found that CCNC had saved nearly $1 billion between 2007 and 2010.44
Whereas estimated CCNC savings vary by up to hundreds of millions, the Partnership for a Healthy North Carolina produces savings that are reliably predictable. Because the savings are achieved through capitated payments, the state is only at risk for enrollment changes once the capitated rates are set by contract. This means that the savings are immediately bankable, and lawmakers will know just what to expect from one year to the next.
In Louisiana, for example, savings were built directly into the capitated rates set by the state.45 State policymakers knew the Bayou Health reform would save 3.5 percent per member per month for all of the Medicaid patients enrolled.46 In Florida, capitated rates in the five-county Reform Pilot have been substantially lower than costs for similar populations in the state’s Old Medicaid system.47 These capitated rates have also remained flat for five years.48 Because these savings are built into the capitated rates through multi-year contracts, lawmakers now have more predictability and stability in the budgeting process.
According to the North Carolina Department of Health and Human Services, the Partnership for a Healthy North Carolina is expected to save the state upwards of 8 percent each year.49 This represents annual savings of more than $1 billion.50
CCnC Flaw #4: health Care Costs and utIlIzatIon are rIsIng
CCNC Does Not Significantly Reduce the Rate of Hospital Admissions
CCNC’s savings have been subject to widespread scrutiny. The CCNC model assumes improved access to primary care, greater usage of prescription drugs, and better coordinated care for chronic conditions will reduce emergency room visits and inpatient hospital admissions.51 The additional costs to provide better primary care are expected to be more than offset by lower hospital costs, leading to the supposed savings.52
An analysis by Ariel Linden, a professor of health management and policy at the University of Michigan, calls into question CCNC’s savings assumptions, however. Professor Linden independently reviewed admissions data for North Carolina’s Medicaid program then compared it to admissions data for South Carolina, a comparable neighboring state.53,54 Linden calls this a classic “natural experiment,” as North Carolina implemented the CCNC model and neighboring South Carolina did not.55
In his review, Linden focused on conditions related to avoidable hospital admissions, such as asthma and diabetes.56 He found no statistically significant difference in the change of admission levels or admission trends between North Carolina and South Carolina for any of the conditions studied.57 This led Linden to question how CCNC’s consultants found such massive cost savings given there was no evidence of significantly reduced hospital care utilization.58
A review of hospital discharge data provided to the federal government by the North Carolina Department of Health and Human Services also reveals little change in hospitalization of Medicaid patients following the implementation of CCNC’s medical home model.59 In 2011, the state reported nearly 235,000 hospital discharges for Medicaid patients.60 That was up from 169,000 in 2000.61
8
J O H N LO C K E F O U N D AT I O N
C C N C F L AW S
Of course, enrollment in the Medicaid program increased dramatically over that same time period.62 But even when comparing hospitalization rates, rather than the total number of hospitalizations, there was little change. Medicaid patients were only slightly less likely to be hospitalized in 2011 than they were in 2000, but North Carolina’s population as a whole saw a similar rate of decline, as did South Carolina’s Medicaid program.63 In fact, South Carolina’s Medicaid program, which had a lower hospitalization rate to begin with, saw its rate of hospitalization decline faster than North Carolina’s program.64 The average hospital stay also remained relatively stable at 4.3 days in 2011, compared to 4.2 days in 2000, meaning the program would not see significant savings resulting from shorter hospital visits.65,66 Nor could the program achieve savings from reduced costs per visit, as average hospital costs and charges for Medicaid increased during that same time.67,68
CCNC has defended itself against this evidence by claiming that this state-reported admissions data is not as robust as the claims data its consultants received.69 The extensive collection of admissions data, considered a gold standard for health researchers, is compiled and maintained by the federal Agency for Healthcare Research and Quality (AHRQ), an agency within the U.S. Department of Health and Human Services responsible for evaluating research methods.70 North Carolina’s data was provided to AHRQ by the North Carolina Department of Health and Human Services, the department which operates the state’s Medicaid program.71
Even the data provided in CCNC’s own reports highlight why attributing the modest admissions changes to the CCNC model may not make sense. For example, Treo Solutions estimates that children in CCNC saw hospital admissions decline by 13 percent between 2007 and 2010.72 But the same report also found that children not enrolled in CCNC saw hospital admissions decline by more than 14 percent during the same time period.73 Additionally, hospital admissions for elderly, blind, and disabled patients in CCNC actually increased between 2007 and 2010.74
The consultants who analyzed CCNC even note that the methods used to estimate savings cannot guarantee the alleged savings were the result of CCNC rather than other factors.75 Indeed, Milliman noted in its report that it could not precisely estimate how much the trends were the result of CCNC’s efforts.76 This is because it analyzed only claims data from North Carolina’s Medicaid program, largely ignoring the statewide, regional, and national trends that may have impacted their results.
CCNC also defends itself by noting that AHRQ data does not distinguish between CCNC and non-CCNC patients.77 While this is true, given the size of the CCNC program and the magnitude of its alleged savings, any significant changes would likely be captured in the comprehensive data reported to AHRQ by the state. For example, more than 70 percent of North Carolina’s Medicaid patients have been enrolled in CCNC or its sister program, Carolina ACCESS, since 2003.78 One consultant reported savings of nearly $1.5 billion during a recent three-year window.79
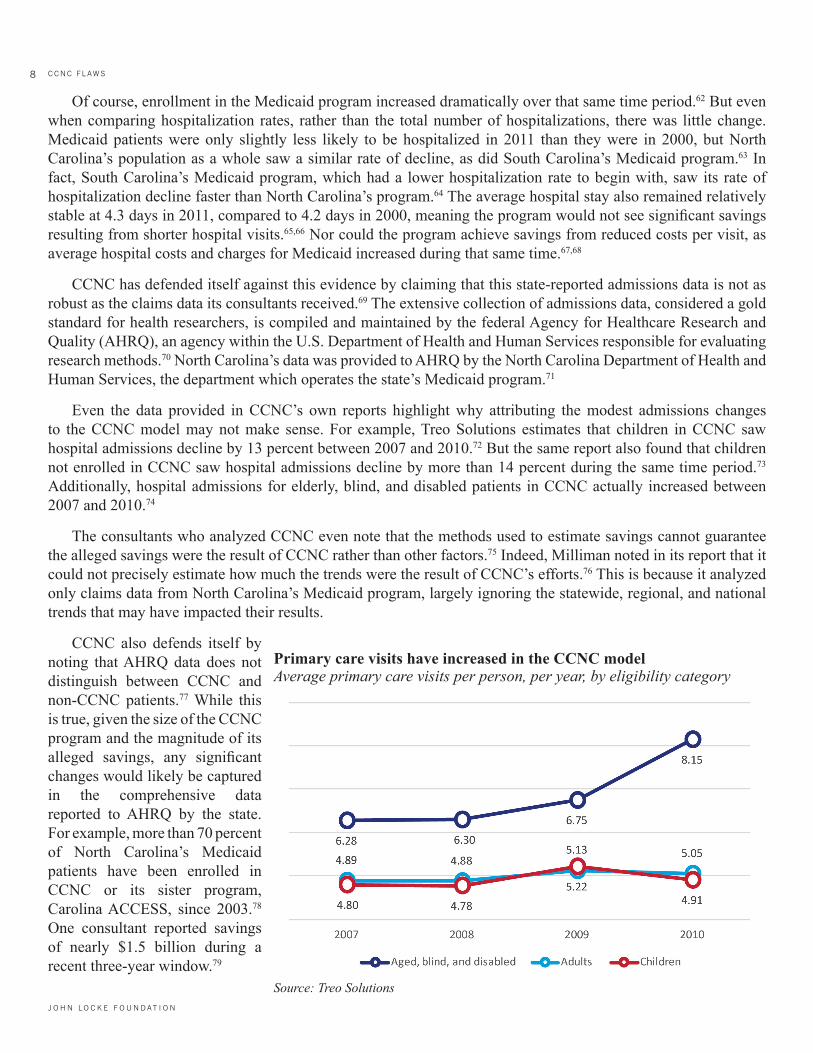
Source: Treo Solutions
Primary care visits have increased in the CCNC modelAverage primary care visits per person, per year, by eligibility category

9CCNC FLAWS
P O L I C Y R E P O R T
The consultants reviewing CCNC’s alleged savings further noted that the trends they identified were apparent for the Medicaid population as a whole, after combining the CCNC and non-CCNC populations.80 As such, the significant declines in admissions necessary to achieve such substantial savings would appear in the AHRQ data.
Emergency Room Visits Are Increasing Despite Greater Primary Care Utilization
In the CCNC medical home model, additional costs for higher utilization of primary care services and prescription drugs are supposed to be offset by reduced hospital costs.81 As expected, Medicaid patients have increased their primary care visits in the CCNC model across all eligibility groups.82 For example, the average aged, blind, or disabled Medicaid patient had approximately 8.15 primary care visits in 2010, up from 6.28 visits in 2007.83 Non-disabled children and adults on Medicaid also increased their visits to primary care physicians.84
Also as expected, the number of drugs prescribed to Medicaid patients has increased in the CCNC model.85 For example, the average aged, blind, or disabled Medicaid patient
received approximately 38.74 prescriptions per year in 2010, up from 35.33 prescriptions in 2007.86 Non-disabled adults also increased the number of prescriptions they received, although children received fewer prescriptions in 2010 than they did in 2007.87
Despite an increase in primary care visits and the number of drugs prescribed, emergency room visits actually increased in the CCNC model.88 The average aged, blind, or disabled Medicaid patient had approximately 1.20 emergency room visits in 2010, up from 1.09 emergency room visits in 2007.89 Non-disabled
Use of prescription drugs has increased in the CCNC modelAverage number of drug prescriptions per person, per year, by eligibility category
Source: Treo Solutions
Emergency room visits have increased in the CCNC modelAverage number of emergency room visits per person, per year, by eligibility category
Source: Treo Solutions

10
J O H N LO C K E F O U N D AT I O N
C C N C F L AW S
adults also visited the ER more, despite the increased emphasis on primary care and maintenance medications.90 Only non-disabled children, the lowest-cost category enrolled in Medicaid, saw a slight decline in emergency room visits between 2007 and 2010.91
In the medical home model, increased access to primary care services and greater use of prescription drugs are supposed to reduce emergency room visits. These reduced emergency room visits are expected to offset the higher costs of patients receiving more primary care visits and prescription drugs. If emergency room visits did not decline, but actually increased for the most expensive patients, this begs the question of where the supposed savings, amounting to hundreds of millions of dollars each year, came from.
CCnC Flaw # 5: FundIng sCheMe Makes It IMPossIble to know IF It aCtually saves taxPayer dollars
The Agency for Healthcare Research and Quality (AHRQ), an agency within the U.S. Department of Health and Human Services that has extensively studied the medical home model, excludes reports produced by the state-hired consultants reviewing CCNC when analyzing the models.92 AHRQ researchers note that the consultants’ reports have little value, as they did not use research methods that were rigorous enough to effectively evaluate the program.93
Given these shortcomings, North Carolina’s State Auditor has recommended that the state contract with medical researchers, rather than the type of consultants-for-hire used in the past, in order to perform a “scientifically valid study based upon actual data” to determine whether CCNC is really saving money and improving the health of its patients.94 The State Auditor’s recommendation is particularly important given that CCNC’s previous reports have been used by the North Carolina Department of Health and Human Services to predict Medicaid savings for the budget. This has resulted in annual budget overruns that have averaged 11 percent during the past four years.95
The Kaiser Family Foundation has also questioned CCNC’s purported savings, noting that its savings estimates exceed any rigorous estimate for any other Medicaid model or intervention ever tested on a large population.96 Kaiser researchers noted that Mercer estimated approximately 70 percent of the savings were the result of reduced inpatient costs.97 These inpatient costs were allegedly cut by nearly 50 percent, despite the above-noted research finding no statistically significant change in hospital admissions.98 Mercer also estimated that more than half of these savings were for infants under the age of one.99 Recognizing many of the same issues, Mathematica, a research organization that evaluates medical home models for the federal government, has called CCNC’s savings estimates misleading.100
CCNC’s own consultants report that aged, blind, and disabled patients enrolled in CCNC are more expensive to treat
Elderly and disabled CCNC Medicaid patients cost more than those in traditional Old MedicaidAverage annual cost of aged, blind, and disabled patients, by CCNC enroll-ment status
Source: Treo Solutions

11CCNC FLAWS
P O L I C Y R E P O R T
than those not enrolled in CCNC. In 2010, for example, this group of individuals cost on average $17,364 when enrolled in CCNC, compared to $16,896 when not in CCNC.101 The cost to treat this group of CCNC patients has continued to grow, while the average cost for the same eligibility categories not enrolled in CCNC has declined.102
CCNC defends these cost disparities by arguing that their patients are, on average, sicker than the patients not enrolled in its medical home model.103 Their consultants do note some small differences in health status among the two populations, with CCNC patients appearing sicker than non-CCNC patients for some eligibility categories.104 But overall, CCNC’s consultants report that CCNC patients have significantly lower health risks in general than their counterparts outside of the CCNC model.105
The CCNC savings estimates also beg the question: if CCNC is actually producing the massive savings it has claimed, why is North Carolina’s Medicaid spending so much higher than its neighbors?106,107
Despite CCNC’s purported savings, North Carolina’s per-person Medicaid costs are out of control. Not only does the state spend more than the national average, it spends far more than any other state in the region.108 Worse yet, these costs have grown for every category of Medicaid eligibility during the past decade.109
Even in the unlikely event one of the savings estimates prepared for CCNC is accurate, North Carolina’s Medicaid program remains unsustainable. Medicaid costs are higher than the national average and continue to grow faster than state revenues, jeopardizing all other state priorities.110
ConClusIon
Community Care of North Carolina has proven to be a flawed model that has failed to achieve its goals. Medicaid patients and taxpayers in North Carolina are caught in a perfect storm of unsustainable cost increases and deteriorating patient health outcomes, while policymakers lack honest and accurate information needed to effectively develop the state’s Medicaid budget. The program is in urgent need of reform.
The Partnership for a Healthy North Carolina—inspired by strategies already working for patients in Florida, Kansas, and Louisiana—will replace CCNC’s failures with pro-patient, pro-taxpayer reforms that can transform North Carolina’s Medicaid system into the health care safety net it was meant to be all along.
North Carolina spends more per person on Medicaid than any other state in the region
Source: North Carolina Office of the State Auditor

12
J O H N LO C K E F O U N D AT I O N
C C N C F L AW S
Endnotes1. For a detailed examination of North Carolina’s current Medicaid program and the need for reform, see Jonathan Ingram and Katherine
Restrepo, “The Partnership for a Healthy Carolina: Medicaid reform that works for patients, providers, and taxpayers alike,” Foundation for Government Accountability (2013), http://www.medicaidcure.org/wp-content/uploads/2013/05/The-Partnership-for-a-Healthy-North-Carolina-MedicaidCure-Policy-Brief-5.pdf.
2. For a detailed outline of the Partnership for a Healthy North Carolina, see Pat McCrory, “Partnership for a Healthy North Carolina,” North Carolina Office of the Governor (2013), http://p1.governor.nc.gov/sites/default/files/partnershipforahealthynorthcarolina.pdf.
3. For a detailed analysis of the Partnership for a Healthy North Carolina, see Jonathan Ingram and Katherine Restrepo, “The Partnership for a Healthy Carolina: Medicaid reform that works for patients, providers, and taxpayers alike,” Foundation for Government Accountability (2013), http://www.medicaidcure.org/wp-content/uploads/2013/05/The-Partnership-for-a-Healthy-North-Carolina-MedicaidCure-Policy-Brief-5.pdf..
4. Ibid.5. Adam Linker, “North Carolina does not need to be remade,” Star News Online (2013), http://www.starnewsonline.com/article/20130414/
ARTICLES/130419816.6. Division of Medical Assistance, “Basic Medicaid and N.C. Health Choice billing guide,” North Carolina Department of Health and Human
Services (2012), http://www.ncdhhs.gov/dma/basicmed/Compilation_1012.pdf.7. Authors’ calculations, based upon the number of Medicaid patients enrolled in CCNC or Carolina ACCESS and the total number of
Medicaid patients, as of August 2013. See, e.g., Division of Medical Assistance, “North Carolina Medicaid: CCNC/CA monthly enrollment report,” North Carolina Department of Health and Human Services (2013), http://www.ncdhhs.gov/dma/ca/enroll/caenr13.pdf.
8. Division of Medical Assistance, “Overview and history of managed care in North Carolina,” North Carolina Department of Health and Human Services (2013), www.ncdhhs.gov/dma/ca/overviewhistory.htm.
9. Jennifer Cockerham and Susan L. Davis, “Public-private partnership supports medical homes in managing Medicaid enrollees via disease/case management and other initiatives, leading to higher quality and significant cost savings,” Agency for Healthcare Research and Quality (2013), http://www.innovations.ahrq.gov/content.aspx?id=3844.
10. Authors’ calculations based upon federal data from the Medicaid Statistical Information System covering fiscal year 2010, disaggregated by each claim type category. See, e.g., Medicaid Statistical Information System, “State summary datamart: FY 2010 quarterly cube,” Centers for Medicare and Medicaid Services (2012), http://msis.cms.hhs.gov.
11. Community Care of North Carolina, “A history of CCNC: The evolution of Community Care of North Carolina,” Community Care of North Carolina (2012), http://www.communitycarenc.org/about-us/history-ccnc-rev/.
12. Division of Medical Assistance, “Basic Medicaid and N.C. Health Choice billing guide,” North Carolina Department of Health and Human Services (2012), http://www.ncdhhs.gov/dma/basicmed/Compilation_1012.pdf.
13. Community Care of North Carolina, “A history of CCNC: The evolution of Community Care of North Carolina,” Community Care of North Carolina (2012), http://www.communitycarenc.org/about-us/history-ccnc-rev/.
14. Division of Medical Assistance, “Basic Medicaid and N.C. Health Choice billing guide,” North Carolina Department of Health and Human Services (2012), http://www.ncdhhs.gov/dma/basicmed/Compilation_1012.pdf.
15. Florida Agency for Health Care Administration, “Florida Medicaid reform: Year 7, 3rd quarter progress report,” Florida Agency for Health Care Administration (2013), http://ahca.myflorida.com/medicaid/medicaid_reform/pdf/FL_1115_Q3_YR_7_Report_01-01-2013_03-31-2013.pdf.
16. Florida Agency for Health Care Administration, “Florida Medicaid reform: Year 6 annual report,” Florida Agency for Health Care Administration (2012), http://ahca.myflorida.com/Medicaid/medicaid_reform/pdf/FL_1115_YR_6_Final_Annual_Report_07-01-11_06-30-12.pdf.
17. Division of Health Care Finance, “KanCare: More choices, better access, healthy patients,” Kansas Department of Health and Environment (2013), http://www.kancare.ks.gov/download/KanCare_ProPatient_ProTaxpayer.pdf.
18. Florida Agency for Health Care Administration, “Florida Medicaid reform: Year 7, 3rd quarter progress report,” Florida Agency for Health Care Administration (2013), http://ahca.myflorida.com/medicaid/medicaid_reform/pdf/FL_1115_Q3_YR_7_Report_01-01-2013_03-31-2013.pdf.
19. Florida Agency for Health Care Administration, “Florida Medicaid reform: Year 6 annual report,” Florida Agency for Health Care Administration (2012), http://ahca.myflorida.com/Medicaid/medicaid_reform/pdf/FL_1115_YR_6_Final_Annual_Report_07-01-11_06-30-12.pdf.
20. Division of Health Care Finance, “Medicaid for Kansas: Choosing a KanCare health plan,” Kansas Department of Health and Environment (2013), http://www.kancare.ks.gov/choosing_a_plan.htm.
21. Jonathan Ingram and Katherine Restrepo, “The Partnership for a Healthy Carolina: Medicaid reform that works for patients, providers, and taxpayers alike,” Foundation for Government Accountability (2013), http://www.medicaidcure.org/wp-content/uploads/2013/05/The-Partnership-for-a-Healthy-North-Carolina-MedicaidCure-Policy-Brief-5.pdf.
22. National Committee for Quality Assurance, “HEDIS and Quality Compass: What is HEDIS?” National Committee for Quality Assurance (2013), http://www.ncqa.org/HedISQualityMeasurement/WhatisHedIS.aspx.

13CCNC FLAWS
P O L I C Y R E P O R T
23. Division of Medical Assistance, “DMA HEDIS 2011 reporting: Comparisons and trends,” North Carolina Department of Health and Human Services (2012), http://www.ncdhhs.gov/dma/quality/hedis2011_reporting_Comparisons_Trends.xls.
24. Jonathan Ingram and Katherine Restrepo, “The Partnership for a Healthy Carolina: Medicaid reform that works for patients, providers, and taxpayers alike,” Foundation for Government Accountability (2013), http://www.medicaidcure.org/wp-content/uploads/2013/05/The-Partnership-for-a-Healthy-North-Carolina-MedicaidCure-Policy-Brief-5.pdf.
25. Division of Medical Assistance, “DMA HEDIS 2010 reporting: Comparisons and trends,” North Carolina Department of Health and Human Services (2011), http://www.ncdhhs.gov/dma/quality/hedis2010reportingcomparisonsandtrends.xls.
26. Jonathan Ingram and Katherine Restrepo, “The Partnership for a Healthy Carolina: Medicaid reform that works for patients, providers, and taxpayers alike,” Foundation for Government Accountability (2013), http://www.medicaidcure.org/wp-content/uploads/2013/05/The-Partnership-for-a-Healthy-North-Carolina-MedicaidCure-Policy-Brief-5.pdf.
27. Florida Agency for Health Care Administration, “Florida Medicaid reform: Year 7, 2nd quarter progress report,” Florida Agency for Health Care Administration (2012), http://ahca.myflorida.com/medicaid/medicaid_reform/pdf/Fl_1115_Q2_yr_7_report_10-1-2012_12-31-2012_final.pdf.
28. Ibid.29. Authors’ calculations, based upon a comparison of 2011 HEDIS metrics from each state. See, e.g., Florida Agency for Health Care
Administration, “Florida Medicaid reform: Year 7, 2nd quarter progress report,” Florida Agency for Health Care Administration (2012), http://ahca.myflorida.com/medicaid/medicaid_reform/pdf/Fl_1115_Q2_yr_7_report_10-1-2012_12-31-2012_final.pdf. See also Division of Medical Assistance, “DMA HEDIS 2011 reporting: Comparisons and trends,” North Carolina Department of Health and Human Services (2012), http://www.ncdhhs.gov/dma/quality/hedis2011_reporting_Comparisons_Trends.xls.
30. Tarren Bragdon, “Florida’s Medicaid reform shows the way to improve health, increase satisfaction and control costs,” Heritage Foundation (2011), http://www.medicaidcure.org/wp-content/uploads/2012/09/Medicaid-Cure-Floridas-Medicaid-Reform-Pilot.pdf.
31. Florida Agency for Health Care Administration, “Florida Medicaid reform: Year 6 annual report,” Florida Agency for Health Care Administration (2012), http://ahca.myflorida.com/Medicaid/medicaid_reform/pdf/FL_1115_YR_6_Final_Annual_Report_07-01-11_06-30-12.pdf.
32. Ibid.33. Division of Health Care Finance, “KanCare: Section 1115 demonstration waiver,” Kansas Department of Health and Environment (2013),
http://www.kancare.ks.gov/download/KanCare_Section_1115_Demonstration_August_6_2012.pdf.34. Office of Facilities and Procurement Management, “KanCare Medicaid and CHIP capitated managed care services: Bid event ID
EVT0000186,” Kansas Department of Administration (2011), http://dl.dropboxusercontent.com/s/ln32rkk49du8fmv/KanCare-RFP.pdf.35. Office of Facilities and Procurement Management, “KanCare program: Medicaid state quality strategy,” Kansas Department of
Administration (2011), http://dl.dropboxusercontent.com/s/dqbg0t8fc0kkroc/KanCare-State-Quality-Strategy.pdf.36. Division of Health Care Finance, “KanCare: Section 1115 demonstration waiver,” Kansas Department of Health and Environment (2013),
http://www.kancare.ks.gov/download/KanCare_Section_1115_Demonstration_August_6_2012.pdf.37. Community Care of North Carolina, “Community Care of North Carolina: 2012 overview,” Community Care of North Carolina (2012),
http://dl.dropboxusercontent.com/s/d6zm7o2i301fl90/ccnc-overview.pdf.38. For a brief critique of these savings estimates, see Al Lewis, “Questioning the widely publicized savings reported for North Carolina
Medicaid,” American Journal of Managed Care (2012), http://www.ajmc.com/articles/Questioning-the-Widely-Publicized-Savings-Reported-for-North-Carolina-Medicaid.
39. Dan Way, “Consultants can skew Medicaid spending, critics say,” Carolina Journal (2012), http://www.carolinajournal.com/exclusives/display_exclusive.html?id=9718.
40. Joseph Burns, “North Carolina PCHM’s data offer promise, spur debate,” Managed Care (2012), http://www.managedcaremag.com/archives/1203/1203.carolina_pcmh.html.
41. Community Care of North Carolina, “Community Care of North Carolina: 2012 overview,” Community Care of North Carolina (2012), http://dl.dropboxusercontent.com/s/d6zm7o2i301fl90/ccnc-overview.pdf.
42. Ibid.43. Ibid.44. Ibid.45. Bruce D. Greenstein, “The Louisiana story: How to achieve a Medicaid cure without a federal waiver,” Louisiana Department of Health
and Hospitals (2012), http://www.medicaidcure.org/wp-content/uploads/2012/10/THE-LOUISIANA-STORY-HOW-TO-ACHIEVE-A-MEDICAID-CURE-WITHOUT-A-FEDERAL-WAIVER.pdf.
46. Ibid.47. Tarren Bragdon, “Florida’s Medicaid reform shows the way to improve health, increase satisfaction and control costs,” Heritage Foundation
(2011), http://www.medicaidcure.org/wp-content/uploads/2012/09/Medicaid-Cure-Floridas-Medicaid-Reform-Pilot.pdf.48. Ibid.

14
J O H N LO C K E F O U N D AT I O N
C C N C F L AW S
49. Jonathan Ingram and Katherine Restrepo, “The Partnership for a Healthy Carolina: Medicaid reform that works for patients, providers, and taxpayers alike,” Foundation for Government Accountability (2013), http://www.medicaidcure.org/wp-content/uploads/2013/05/The-Partnership-for-a-Healthy-North-Carolina-MedicaidCure-Policy-Brief-5.pdf.
50. Ibid.51. Robert Cosway et al., “Analysis of Community Care of North Carolina cost savings,” Milliman (2012), http://www.communitycarenc.
com/media/related-downloads/milliman-cost-savings-study.pdf.52. Ibid.53. Joseph Burns, “North Carolina PCHM’s data offer promise, spur debate,” Managed Care (2012), http://www.managedcaremag.com/
archives/1203/1203.carolina_pcmh.html.54. Ibid.55. Ibid.56. Ibid.57. Ibid.58. Ibid.59. The North Carolina Department of Health and Human Services partners with the U.S. Department of Health and Human Services to
provide researchers with hospital data. See, e.g., Healthcare Cost and Utilization Project, “List of HCUP data partners for reference in publications,” Agency for Healthcare Research and Quality (2013), http://www.hcup-us.ahrq.gov/db/Citation_0613.pdf.
60. Healthcare Cost and Utilization Project, “State inpatient databases: North Carolina 2011,” Agency for Healthcare Research and Quality (2012), http://dl.dropboxusercontent.com/s/cva00vv4cdv5jkf/HCUP-NC2011.pdf.
61. Healthcare Cost and Utilization Project, “State inpatient databases: North Carolina 2000,” Agency for Healthcare Research and Quality (2001), http://dl.dropboxusercontent.com/s/62fachfd5sim343/HCUP-NC2000.pdf.
62. North Carolina’s Medicaid enrollment has nearly doubled since 1998. See, e.g., Jonathan Ingram and Katherine Restrepo, “The Partnership for a Healthy Carolina: Medicaid reform that works for patients, providers, and taxpayers alike,” Foundation for Government Accountability (2013), http://www.medicaidcure.org/wp-content/uploads/2013/05/The-Partnership-for-a-Healthy-North-Carolina-MedicaidCure-Policy-Brief-5.pdf.
63. Authors’ calculations based upon hospital discharge data from the Agency for Healthcare Research and Quality, disaggregated by insurance type, as well as population estimates and Medicaid enrollment.
64. Ibid.65. Healthcare Cost and Utilization Project, “State inpatient databases: North Carolina 2000,” Agency for Healthcare Research and Quality
(2001), http://dl.dropboxusercontent.com/s/62fachfd5sim343/HCUP-NC2000.pdf.66. Healthcare Cost and Utilization Project, “State inpatient databases: North Carolina 2011,” Agency for Healthcare Research and Quality
(2012), http://dl.dropboxusercontent.com/s/cva00vv4cdv5jkf/HCUP-NC2011.pdf.67. Healthcare Cost and Utilization Project, “State inpatient databases: North Carolina 2000,” Agency for Healthcare Research and Quality
(2001), http://dl.dropboxusercontent.com/s/62fachfd5sim343/HCUP-NC2000.pdf.68. Healthcare Cost and Utilization Project, “State inpatient databases: North Carolina 2011,” Agency for Healthcare Research and Quality
(2012), http://dl.dropboxusercontent.com/s/cva00vv4cdv5jkf/HCUP-NC2011.pdf.69. Community Care of North Carolina, “Response to criticisms of actuarial studies,” Community Care of North Carolina (2012), http://www.
communitycarenc.org/our-results/response-criticisms-savings-studies/.70. Healthcare Cost and Utilization Project, “Fact sheet: Database and related tools from the Healthcare Cost and Utilization Project (HCUP),”
Agency for Healthcare Research and Quality (2011), http://www.ahrq.gov/legacy/data/hcup/datahcup.pdf.71. Healthcare Cost and Utilization Project, “List of HCUP data partners for reference in publications,” Agency for Healthcare Research and
Quality (2013), http://www.hcup-us.ahrq.gov/db/Citation_0613.pdf.72. Treo Solutions, “Performance analysis: Healthcare utilization of CCNC-enrolled population, 2007-2010,” Community Care of North
Carolina (2012), https://www.communitycarenc.org/media/related-downloads/treo-solutions-report-on-utilization.pdf.73. Ibid.74. Ibid.75. Robert Cosway et al., “Analysis of Community Care of North Carolina cost savings,” Milliman (2012), http://www.communitycarenc.
com/media/related-downloads/milliman-cost-savings-study.pdf.76. Ibid.77. Community Care of North Carolina, “Response to criticisms of actuarial studies,” Community Care of North Carolina (2012), http://www.
communitycarenc.org/our-results/response-criticisms-savings-studies/.

15CCNC FLAWS
P O L I C Y R E P O R T
78. The percentage of North Carolina Medicaid patients enrolled in CCNC or Carolina ACCESS has increased from 70 percent in 2003 to nearly 86 percent in 2013. See, e.g., Division of Medical Assistance, “North Carolina Medicaid: CCNC/CA monthly enrollment report,” North Carolina Department of Health and Human Services (2003), http://www.ncdhhs.gov/dma/ca/enroll/caenr03.pdf. See also Division of Medical Assistance, “North Carolina Medicaid: CCNC/CA monthly enrollment report,” North Carolina Department of Health and Human Services (2013), http://www.ncdhhs.gov/dma/ca/enroll/caenr13.pdf.
79. Community Care of North Carolina, “Community Care of North Carolina: 2012 overview,” Community Care of North Carolina (2012), http://dl.dropboxusercontent.com/s/d6zm7o2i301fl90/ccnc-overview.pdf.
80. Robert Cosway et al., “Analysis of Community Care of North Carolina cost savings,” Milliman (2012), http://www.communitycarenc.com/media/related-downloads/milliman-cost-savings-study.pdf.
81. Ibid.82. Treo Solutions, “Performance analysis: Healthcare utilization of CCNC-enrolled population, 2007-2010,” Community Care of North
Carolina (2012), http://www.communitycarenc.org/media/related-downloads/treo-solutions-report-on-utilization.pdf.83. Ibid.84. Ibid.85. Ibid.86. Ibid.87. Ibid.88. Ibid.89. Ibid.90. Ibid.91. Ibid.92. Deborah Peikes et al., “Early evidence on the patient-centered medical home,” Agency for Healthcare Research and Quality (2012), http://
dl.dropboxusercontent.com/s/loxzkbnb4e2cv4v/Early-Evidence-on-PCMH.pdf.93. Ibid.94. Beth A. Wood, “Performance audit: Department of Health and Human Services Division of Medical Services – Medicaid,” North Carolina
Office of the State Auditor (2013), http://www.ncauditor.net/ePSWeb/reports/Performance/Per-2013-7291.pdf.95. Ibid.96. Randall Brown, “Strategies for reining in Medicare spending through delivery system reforms: Assessing the evidence and opportunities,”
Kaiser Family Foundation (2009), http://dl.dropboxusercontent.com/s/8yp80l6vvyburu7/7984.pdf.97. Ibid.98. Ibid.99. Ibid.100. Debbie Peikes, “Medical home evaluations: Why they can fail, how to structure them,” Mathematica Policy Research (2010), http://
dl.dropboxusercontent.com/s/3l79cnaxfy0x46s/peikes.pdf.101. Treo Solutions, “Highlights of Treo Solutions report,” Community Care of North Carolina (2011), http://www.communitycarenc.com/
media/related-downloads/treo-analysis-of-ccnc-performance.pdf.102. Ibid.103. Ibid.104. Treo Solutions, “Performance analysis: Healthcare utilization of CCNC-enrolled population, 2007-2010,” Community Care of North
Carolina (2012), http://www.communitycarenc.org/media/related-downloads/treo-solutions-report-on-utilization.pdf.105. Ibid.106. Jonathan Ingram and Katherine Restrepo, “The Partnership for a Healthy Carolina: Medicaid reform that works for patients, providers,
and taxpayers alike,” Foundation for Government Accountability (2013), http://www.medicaidcure.org/wp-content/uploads/2013/05/The-Partnership-for-a-Healthy-North-Carolina-MedicaidCure-Policy-Brief-5.pdf.
107. This question was also raised by North Carolina’s State Auditor. See, e.g., Beth A. Wood, “Performance audit: Department of Health and Human Services Division of Medical Services – Medicaid,” North Carolina Office of the State Auditor (2013), http://www.ncauditor.net/ePSWeb/reports/Performance/Per-2013-7291.pdf.
108. Jonathan Ingram and Katherine Restrepo, “The Partnership for a Healthy Carolina: Medicaid reform that works for patients, providers, and taxpayers alike,” Foundation for Government Accountability (2013), http://www.medicaidcure.org/wp-content/uploads/2013/05/The-Partnership-for-a-Healthy-North-Carolina-MedicaidCure-Policy-Brief-5.pdf.
109. Ibid.110. Ibid.

16
J O H N LO C K E F O U N D AT I O N
C C N C F L AW S
about the authors
Jonathan Ingram is the Director of Research at the Foundation for Government Accountability (FGA).
Before joining the FGA, Jonathan served as the Director of Health Policy and Pension Reform at the Illinois Policy Institute, a non-partisan research organization dedicated to promoting personal freedom and prosperity in Illinois. While at the Institute, he developed public policy solutions, with a particular focus on patient-centered health care policies and public sector retirement reform. Jonathan has also previously served as a staff writer and editor-in-chief for the Journal of Legal Medicine, an internationally-ranked peer-reviewed academic journal.
Jonathan’s work has earned coverage from The Wall Street Journal, the Chicago Tribune, Crain’s Chicago Business, the Washington Examiner and Fox Business News, among other media outlets.
Jonathan earned his Juris Doctor from Southern Illinois University School of Law, where he specialized in health law and policy, and his Bachelor of Science from MacMurray College. He is licensed to practice law in the State of Illinois.
Katherine Restrepo is the Health and Human Services Policy Analyst at the John Locke Foundation.
Before joining the John Locke Foundation, she interned at the Cato Institute under the direction of Michael F. Can-non, Director of Health Policy Studies. In Washington, D.C., she developed a strong interest in consumer-driven health care and repeal of anti-constitutional provisions in the Patient Protection and Affordable Care Act.
Katherine graduated Phi Beta Kappa from McDaniel College with a Bachelors of Arts in Political Science and Span-ish along with a minor in Communication.
A former collegiate athlete, Katherine enjoys playing basketball, golf, and running in her spare time and continues to play the violin.

17CCNC FLAWS
P O L I C Y R E P O R T
about the John loCke FoundatIon
The John Locke Foundation is a nonprofit, nonpartisan policy institute based in Raleigh. Its mission is to develop and promote solutions to the state’s most critical challenges. The Locke Foundation seeks to transform state and local government through the principles of competition, innovation, personal freedom, and personal responsibility in order to strike a better balance between the public sector and private institutions of family, faith, community, and enterprise.
To pursue these goals, the Locke Foundation operates a number of programs and services to provide information and observations to legislators, policymakers, business executives, citizen activists, civic and community leaders, and the news media. These services and programs include the foundation’s monthly newspaper, Carolina Journal; its daily news service, CarolinaJournal.com; its weekly e-newsletter, Carolina Journal Weekly Report; its quarterly newslet-ter, The Locke Letter; and regular events, conferences, and research reports on important topics facing state and local governments.
The Foundation is a 501(c)(3) public charity, tax-exempt education foundation and is funded solely from voluntary contributions from individuals, corporations, and charitable foundations. It was founded in 1990. For more informa-tion, visit www.JohnLocke.org.

200 West Morgan St., #200
Raleigh, NC 27601
V: 919-828-3876
F: 919-821-5117
www.johnlocke.org
“To prejudge other men’s notions
before we have looked into them
is not to show their darkness
but to put out our own eyes.”
JOHN LOCKE (1632–1704)
Author, Two Treatises of Government and Fundamental Constitutions of Carolina