adam stramel jonathan folsom leanne sawyer kenneth aerts robin lilly
TRANSCRIPT

Adam Stramel Jonathan Folsom
Leanne Sawyer
Kenneth Aerts
Robin Lilly
TEAM M

Enter immediately into 500kg Nut.
Retain a high margin per product.
Build up product stock to generate a steady income.
Long production runs to prevent production downtime.
Initial Strategy

Day 3
Qtr 8
Values
Row Labels Sales Equity Net Profits Marketing Exp Bank Loan Cash Acc Payables
RR $ 22,713,829 $ 16,103,301 $ 8,103,301 $ 1,821,711 $ (5,504,873) $ 1,211,331 $ -
SS $ 9,582,578 $ 9,318,138 $ 1,318,138 $ 546,025 $ (12,000,000) $ 4,359,210 $ -
TT $ 15,634,359 $ 11,530,920 $ 3,530,920 $ 1,362,700 $ (12,000,000) $ 6,188,129 $ (450,476)
UU $ 19,476,544 $ 14,174,454 $ 6,174,454 $ 1,640,282 $ (12,000,000) $ 6,108,721 $ (614,452)
VV $ 10,586,191 $ 8,444,114 $ 444,114 $ 591,980 $ (12,000,000) $ 2,208,550 $ (33,588)
WW $ 15,338,336 $ 10,785,336 $ 2,785,336 $ 1,836,700 $ (12,000,000) $ 5,045,617 $ -
XX $ 15,328,216 $ 11,479,390 $ 3,479,390 $ 453,550 $ (12,000,000) $ 6,150,029 $ (1,172,371)
YY $ 16,512,363 $ 10,106,603 $ 2,106,603 $ 1,687,800 $ (12,000,000) $ 1,915,803 $ -
Grand Total $ 125,172,417 $ 91,942,257 $ 27,942,257 $ 9,940,748 $ (89,504,873) $ 33,187,388 $ (2,270,887)
Game Strategy
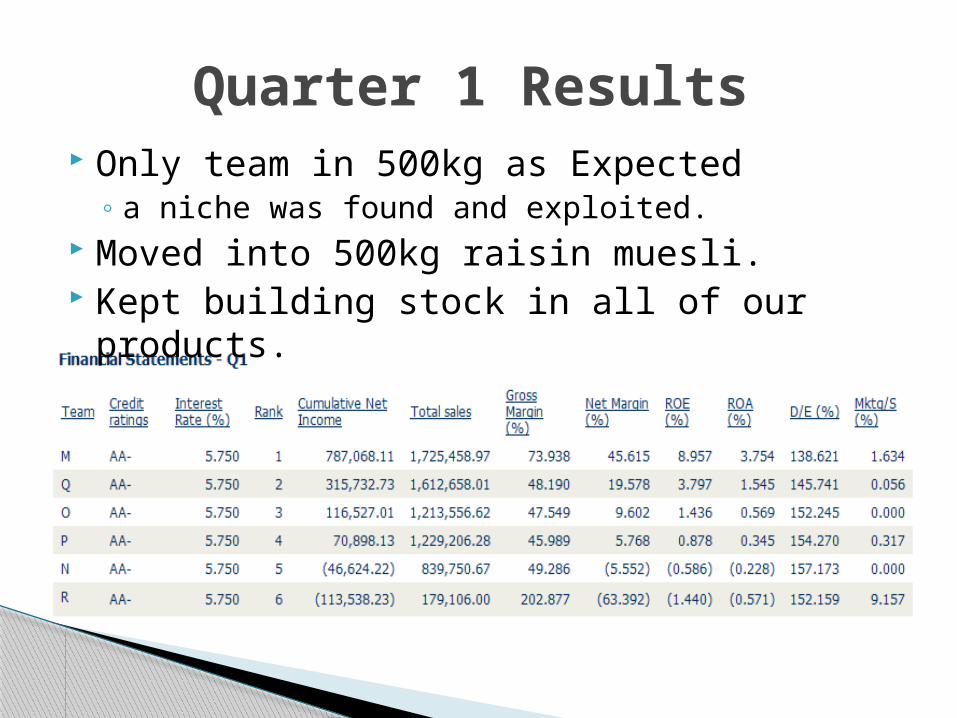
Only team in 500kg as Expected◦ a niche was found and exploited.
Moved into 500kg raisin muesli. Kept building stock in all of our products.
Quarter 1 Results

Increase Production
Invest in lean manufacturing
Keep stock levels high to stay fluid
Build diverse product line
Increase marketing
Keep liquidity around 1.5 million
Increasing production decreased Margins
Adjustment Strategy
Ordered too much product including an individual
order for strawberries.
Forecasting problem- Individual product orders
actually ordered for all products. Liquidity dropped
into the negatives and increased interest rate on Bank
Loan.
It caused us to lower our marketing expense which
affected our sales.
Accumulation of stock levels
Problems Encountered - Qtr 5

Liquidity Qtr 4 Example
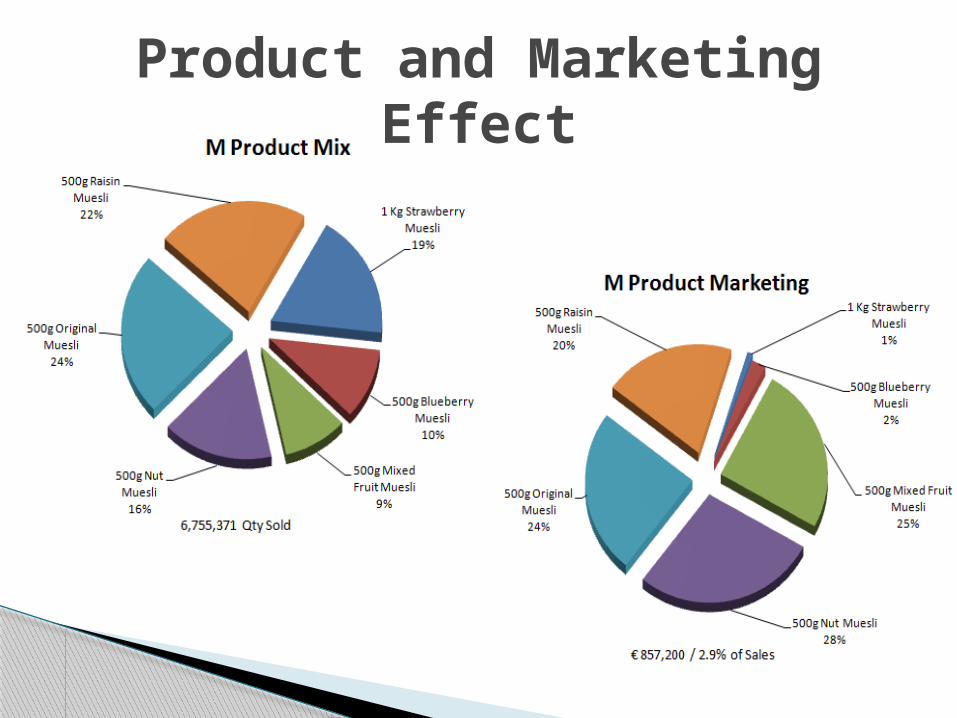
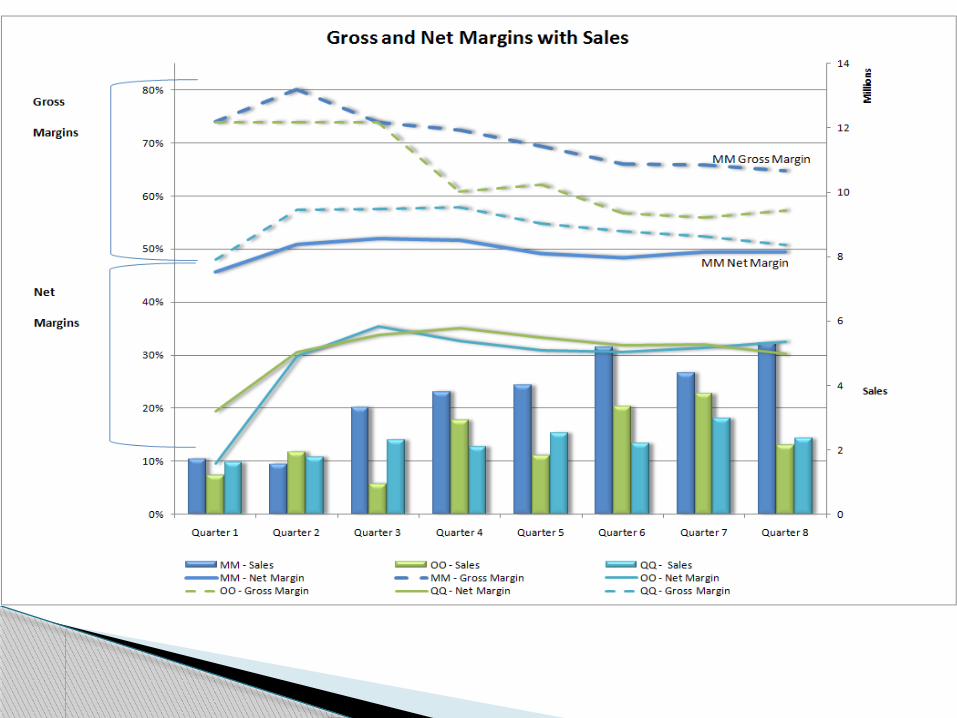
Product and Marketing Effect

Didn’t overreact to slow moving product
Maintained margins
Monitored Market Pricing
Had Price Floor
Consistently Checked Inventory
Pricing

From End Qtr 7
StockAverage
Cost
Last 10 day Avg
Sale Price (Mkt)
Our Avg Last 10
days sale price Margin
End Stock Qtr 6
Our Ending Stock
% of Marke
tNo Cos In Mkt
No Cos Predicted
in Mkt
Can Produce Today?
1 Kg Blueberry Muesli 1.88 4.52 58% 296179 3 31 Kg Mixed Fruit Muesli 1.88 4.63 59% 235591 2 11 Kg Nut Muesli 1.64 4.41 63% 50669 1 31 Kg Original Muesli 1.45 3.96 63% 199297 2 41 Kg Raisin Muesli 1.48 3.67 60% 68624 3 21 Kg Strawberry Muesli 2.25 5.16 5.19 56% 373175 103946 28% 2 1ü500g Blueberry Muesli 1.16 4.39 4.39 74% 47430 47430 100% 1 3In prod500g Mixed Fruit Muesli 0.99 5.10 5.10 81% 192585 192585 100% 1 2ü500g Nut Muesli 0.93 4.43 4.34 79% 147001 72469 49% 3 3ü500g Original Muesli 0.82 3.69 3.69 78% 83620 26739 32% 3 3ü500g Raisin Muesli 0.85 3.98 3.99 79% 289936 179383 62% 2 2ü500g Strawberry Muesli 1.09 5.04 78% 93419 2 3ü
Totals 2077526 622552 30%
Change in Market from Qtr 6 92934 137797 6%
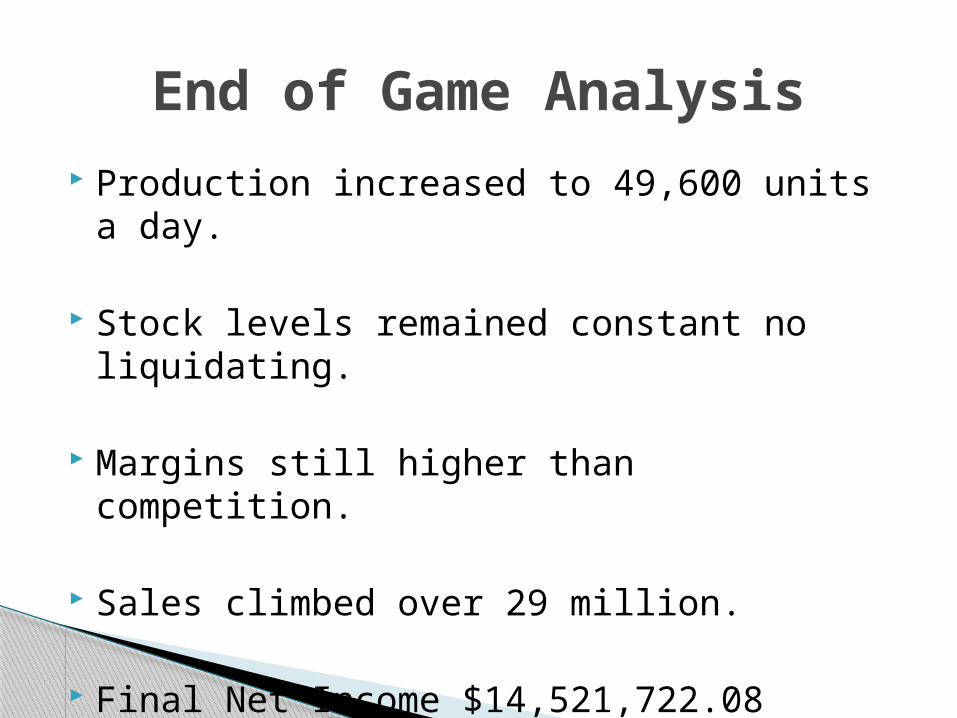
Production increased to 49,600 units a day.
Stock levels remained constant no liquidating.
Margins still higher than competition.
Sales climbed over 29 million.
Final Net Income $14,521,722.08
End of Game Analysis

More of the same
Maintain Margins
Increase Production
Resolve Ordering difficulties
Just in Time model
Move out of 1Kg Strawberries into .5Kg
Strawberries
Qtr 9 – Our next move
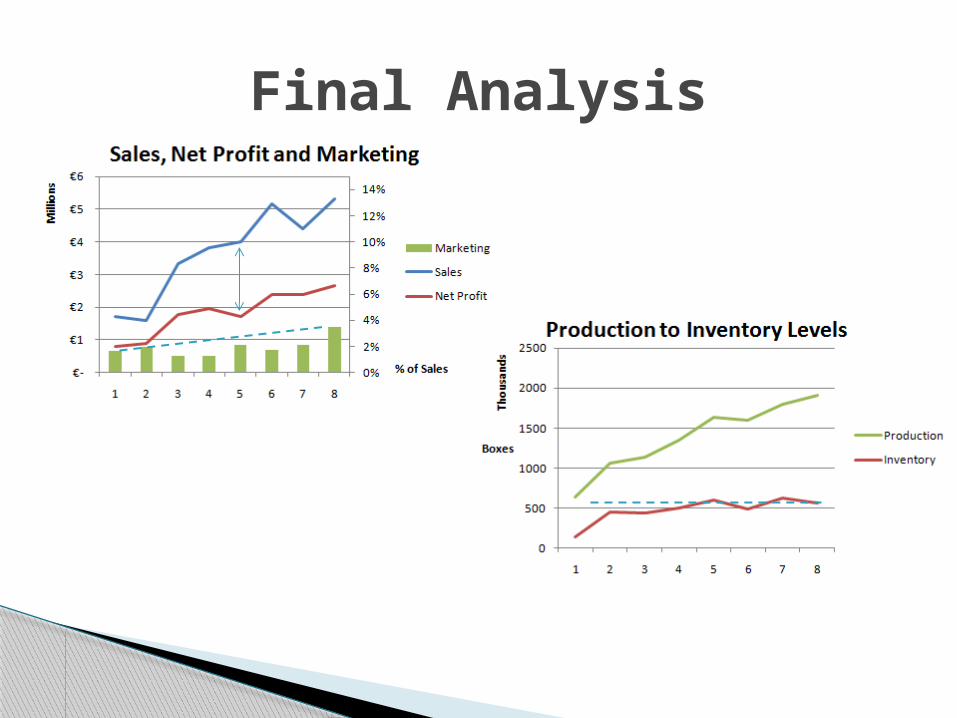
Final Analysis

Analyzed the Data
Effective Teamwork & Communication
Made Decisions
Questions?
Keys to Success