sir20195115.pdf - a probabilistic assessment methodology
TRANSCRIPT
A Probabilistic Assessment Methodology for Carbon Dioxide Enhanced Oil Recovery and Associated Carbon Dioxide Retention
Scientific Investigations Report 2019–5115
U.S. Department of the InteriorU.S. Geological Survey

Cover: Oil, gas, and water separation vessels at a carbon dioxide enhanced oil recovery operation, Horseshoe Atoll, Upper Pennsylvanian-Wolfcampian play in the Permian Basin Province in Texas. Photograph by Peter D. Warwick, U.S. Geological Survey, December 10, 2019.
A Probabilistic Assessment Methodology for Carbon Dioxide Enhanced Oil Recovery and Associated Carbon Dioxide Retention
By Peter D. Warwick, Emil D. Attanasi, Ricardo A. Olea, Madalyn S. Blondes, Philip A. Freeman, Sean T. Brennan, Matthew D. Merrill, Mahendra K. Verma, C. Özgen Karacan, Jenna L. Shelton, Celeste D. Lohr, Hossein Jahediesfanjani, and Jacqueline N. Roueché
Scientific Investigations Report 2019–5115
U.S. Department of the InteriorU.S. Geological Survey

U.S. Department of the InteriorDAVID BERNHARDT, Secretary
U.S. Geological SurveyJames F. Reilly II, Director
U.S. Geological Survey, Reston, Virginia: 2019
For more information on the USGS—the Federal source for science about the Earth, its natural and living resources, natural hazards, and the environment—visit https://www.usgs.gov or call 1–888–ASK–USGS.
For an overview of USGS information products, including maps, imagery, and publications, visit https://store.usgs.gov.
Any use of trade, firm, or product names is for descriptive purposes only and does not imply endorsement by the U.S. Government.
Although this information product, for the most part, is in the public domain, it also may contain copyrighted materials as noted in the text. Permission to reproduce copyrighted items must be secured from the copyright owner.
Suggested citation:Warwick, P.D., Attanasi, E.D., Olea, R.A., Blondes, M.S., Freeman, P.A., Brennan, S.T., Merrill, M.D., Verma, M.K., Karacan, C.Ö., Shelton, J.L., Lohr, C.D., Jahediesfanjani, H., and Roueché, J.N., 2019, A probabilistic assessment methodology for carbon dioxide enhanced oil recovery and associated carbon dioxide retention: U.S. Geological Survey Scientific Investigations Report 2019–5115, 51 p., https://doi.org/10.3133/sir20195115.
ISSN 2328-0328 (online)

iii
Acknowledgments
The authors wish to thank the following reviewers for their constructive comments on this report: James L. Coleman (U.S. Geological Survey), Scott M. Frailey (Illinois State Geological Survey), Larry W. Lake (University of Texas at Austin), Heidi Leathers-Miller (U.S. Geological Survey), and Gary F. Teletzke (ExxonMobil Upstream Research Company).
iv
ContentsAcknowledgments ........................................................................................................................................iiiAbstract ...........................................................................................................................................................11 Introduction..................................................................................................................................................1
1.1 Background .....................................................................................................................................11.2 Objective...........................................................................................................................................2
2 Information on CO2-EOR and Related Topics ..........................................................................................22.1 Overview of the CO2-EOR Process ...............................................................................................22.2 CO2-EOR: Background and Basics ...............................................................................................32.3 CO2 Utilization (Trapping) During EOR Operations .....................................................................42.4 Comprehensive Resource Database ...........................................................................................42.5 Geology .............................................................................................................................................52.6 Reservoir CO2 Miscibility ...............................................................................................................6
3 Operational Assumptions ..........................................................................................................................63.1 CO2 Supply ........................................................................................................................................63.2 Potential for Additional Oil Recovery by Using the CO2-EOR Process ...................................6
3.2.1 Residual Oil Zone (ROZ) .....................................................................................................73.2.2 “Next Generation” CO2-EOR Technology ........................................................................7
3.3 Gas Reservoirs: Enhanced Gas Recovery and CO2 Retention .................................................74 Methodology ................................................................................................................................................8
4.1 Reservoir Screening Criteria ......................................................................................................114.2 Assessment Procedure................................................................................................................12
4.2.1 Distribution of the Original Oil in Place (OOIP) Values ...............................................124.2.2 Distribution of the Recovery-Factor (RF) Values .........................................................134.2.3 Calculation of Additional Oil Recovered by CO2-EOR..................................................174.2.4 Calculation of CO2 Retention ...........................................................................................17
4.3 Probabilistic Estimates and Aggregation .................................................................................174.4. Assessment Meetings.................................................................................................................18
5 Summary.....................................................................................................................................................186 References Cited.......................................................................................................................................187 Glossary ......................................................................................................................................................26Appendix 1. Input Data Variables for the Assessment of Oil Reservoirs that are Candidates
for the Application of the CO2-EOR Process ..............................................................................30Reservoir Original Oil in Place (OOIP) Estimation .........................................................................30Reservoir Recovery Factor (RF) Estimation Using the CO2 Prophet Model ..............................30
Uniform or Default Variables ....................................................................................................30Reservoir-Specific Variables ...................................................................................................31
Appendix 2. Sensitivity Analysis of Recovery Factors of the Original Oil in Place for the Representative Carbonate and Clastic Reservoirs of the Horseshoe Atoll Play of the Permian Basin ..........................................................................................................................32
Appendix 3. Probabilistic Estimates and Aggregation—A Pilot Case Study .....................................36Horseshoe Atoll Play ..........................................................................................................................36Original Oil in Place (OOIP) ...............................................................................................................43Recovery Factor (RF) ..........................................................................................................................43Enhanced Oil Recovery (EOR) and Associated CO2 Storage .......................................................43Aggregation .........................................................................................................................................50

v
Figures
1. Plot showing oil production in thousands of barrels per day associated with various enhanced oil recovery methods in the United States between 1984 and 2014 ..........................................................................................................................................3
2. Flowcharts showing the framework of the U.S. Geological Survey probabilistic assessment methodology for oil recovery potential resulting from the use of carbon dioxide (CO2) injection and associated CO2 retention ...............................................8
3. Three-dimensional graphs showing estimated ranges of the residual oil saturation after waterflood and Dykstra-Parsons coefficient variables used for calculating the recovery factors (RF) and RF uncertainty for carbonate and clastic reservoirs in the Horseshoe Atoll play of the Permian Basin in Texas. The graphs are nearly identical .......................................................................................................16
2.1. Graph showing the sensitivity of the computed recovery factors for the representative carbonate and clastic reservoirs of the Horseshoe Atoll play of the Permian Basin in Texas to variations in the Dykstra-Parsons coefficient .................33
2.2. Graph showing the sensitivity of the computed recovery factors for the representative carbonate reservoir of the Horseshoe Atoll play of the Permian Basin in Texas to variations in the residual oil saturation after waterflood expressed as the fraction of pore space still occupied by oil ............................................34
2.3. Graph showing the sensitivity of the computed recovery factors to the volumes of carbon dioxide injected into the representative carbonate and clastic reservoirs of the Horseshoe Atoll play of the Permian Basin in Texas .............................35
3.1. Map showing the location of the Horseshoe Atoll play in the Permian Basin Province in Texas ........................................................................................................................37
3.2. Input values and boxplots of modeled distributions for reservoir area, net reservoir thickness, porosity, initial oil saturation, and formation volume factor for oil for assessed reservoirs in the Horseshoe Atoll play of the Permian Basin in Texas .........................................................................................................................................38
3.3. Boxplots of modeled distributions of original oil in place for each reservoir used for carbon dioxide enhanced oil recovery calculation for the Horseshoe Atoll play of the Permian Basin in Texas ................................................................................44
3.4. Graphs showing distributions of values for the residual oil saturation after waterflood and Dykstra-Parsons coefficient used for calculating the recovery factors for reservoirs in the Horseshoe Atoll play of the Permian Basin in Texas ..........45
3.5. Boxplots of modeled distributions of the recovery factor for each reservoir used for carbon dioxide enhanced oil recovery calculation in the Horseshoe Atoll play of the Permian Basin in Texas ................................................................................47
3.6. Boxplots of the modeled volume of oil produced during carbon dioxide enhanced oil recovery for each reservoir of the Horseshoe Atoll play of the Permian Basin in Texas..............................................................................................................48
3.7. Boxplots of the modeled mass of carbon dioxide stored during carbon dioxide enhanced oil recovery for each reservoir of the Horseshoe Atoll play of the Permian Basin in Texas..............................................................................................................49
3.8. Graphs showing total volume of oil produced by carbon dioxide enhanced oil recovery and total mass of carbon dioxide stored in the Horseshoe Atoll play of the Permian Basin in Texas modeled using probabilistic aggregation and different assumptions of correlation between reservoirs ...................................................51

vi
Tables
1. Oil and gas reservoir properties in the comprehensive resource database for which values are averaged, calculated, or inferred ...............................................................5
2. Reservoir screening criteria for miscible and immiscible carbon dioxide enhanced oil recovery processes ...........................................................................................11
1.1. Default values of selected variables used in the CO2 Prophet reservoir model program to compute recovery factors for all candidate reservoirs ...................................30
2.1. Basic input data used in the CO2 Prophet reservoir model program for representative carbonate and clastic reservoirs of the Horseshoe Atoll play of the Permian Basin in Texas .......................................................................................................32
2.2. Nominal recovery factors for various water-alternating-with-gas injection regimes and time periods for representative carbonate and clastic reservoirs of the Horseshoe Atoll play of the Permian Basin in Texas .....................................................32
3.1. Volume of oil produced during carbon dioxide enhanced oil recovery and associated carbon dioxide retention for the case study of the Horseshoe Atoll play of the Permian Basin in Texas ..........................................................................................50
vii
Conversion Factors
Multiply By To obtain
Length
foot (ft) 0.3048 meter (m)kilometer (km) 0.6214 mile (mi)
Area
square inch (in2) 6.452 square centimeter (cm2)square foot (ft2) 0.09290 square meter (m2)acre 43,560 square foot (ft2)acre 4,047 square meter (m2)
Volume
barrel (bbl; petroleum, 1 barrel = 42 gallons) 0.1590 cubic meter (m3)stock tank barrel (STB) 0.1590 cubic meter (m3)thousand barrels petroleum (Mbbl) 0.1590 thousand cubic meters (m3)million barrels petroleum (MMbbl) 0.1590 million cubic meters (m3)cubic foot (cf, ft3) 0.02832 standard cubic meter (m3)thousand cubic feet (Mcf, ft3) 28.32 cubic meter (m3)thousand standard cubic feet (Mscf) of natural gas at
standard conditions of 60 degrees Fahrenheit (°F) and 14.7 pound-force per square inch, absolute (psia)
28.31 cubic meters (m3) of natural gas at standard conditions of 15 degrees Celsius (°C) and 101.325 kilopascals (kPa)
million cubic feet (MMcf) 28,317 cubic meter (m3)billion cubic feet (Bcf) 28,316,847 cubic meter (m3)acre-foot (acre-ft) 1,233 cubic meter (m3)acre-foot (acre-ft) 7,758.4 barrel (bbl)liter (L) 0.2642 gallon (gal)cubic meter (m3) 6.290 barrel (bbl; petroleum, 1 barrel =
42 gallons)Mass
pound, avoirdupois (lb) 0.4536 kilogram (kg) ton, short (2,000 lb) 0.9072 megagram (Mg) ton, long (2,240 lb) 1.016 megagram (Mg) ton, metric (2,204.62 lb) 1.000 megagram (Mg)milligram (mg) 0.00003527 ounce, avoirdupois (oz)kilogram (kg) 2.205 pound, avoirdupois (lb)megagram (Mg) = 1 metric ton (t) (1,000 kg) 1.102 ton, short (2,000 lb)megagram (Mg) 0.9842 ton, long (2,240 lb)million metric tons = 1 megaton (Mt) 1.102 million short tonsbillion metric tons = 1 gigaton (Gt) 1.102 billion short tons
Pressure
pound-force per square inch (psi, lbf/in2) 6.895 kilopascal (kPa)pound-force per square inch, absolute (psia, lbf/in2) 6.895 kilopascal (kPa)
viii
Multiply By To obtain
Pressure gradient
pound-force per square inch per foot (psi/ft, lbf/in2/ft) 22.62 kilopascal per meter (kPa/m)Density
pound per cubic foot (lb/ft3) 16.02 kilogram per cubic meter (kg/m3)pound per cubic foot (lb/ft3) 0.01602 gram per cubic centimeter (g/cm3)kilogram per cubic meter (kg/m3) 0.06242 pound per cubic foot (lb/ft3)
Viscosity
centipoise (cP) 1 millipascal second (mP·s)
Temperature in degrees Celsius (°C) may be converted to degrees Fahrenheit (°F) as
°F = (1.8 × °C) + 32.
Temperature in degrees Fahrenheit (°F) may be converted to degrees Celsius (°C) as
°C = (°F − 32) / 1.8.
AbbreviationsØ porosity, expressed as a fraction
°API American Petroleum Institute oil gravity, in degrees
A planar area of reservoir, in acres
bbl petroleum barrel or barrels
Bcf billion cubic feet
Beta-PERT special case of the beta distribution, Program Evaluation and Review Technique
BOE barrel of oil equivalent
BOEM Bureau of Ocean Energy Management
Btu British thermal unit
C5+ natural gasoline (a mixture of pentanes [C5] plus heavier molecules such as hexane [C6] to nonane [C9] in smaller amounts)
CO2 carbon dioxide
CO2-EOR carbon dioxide enhanced oil recovery
cP centipoise
CRD comprehensive resource database (USGS)
D darcy or darcies
DCA decline curve analysis
EIA U.S. Energy Information Administration
EOR enhanced oil recovery
EORv incremental oil volume produced by enhanced oil recovery (EOR)
EUR estimated ultimate recovery, in thousands of barrels (Mbbl) or billions of cubic feet (Bcf)
ix
FVFo formation volume factor for oil, barrels at reservoir conditions per stock tank barrels at standard conditions (bbl/STB)
GOR gas:oil ratio, in standard cubic feet per stock tank barrel (Scf/STB)
Gt gigaton = billion metric tons
h reservoir thickness, in feet
H2S hydrogen sulfide
HCPV hydrocarbon pore volume
IHS IHS Inc.
k permeability, in darcies or millidarcies
KR known recovery production volume
mD millidarcy
MMP minimum miscibility pressure, in pound-force per square inch, absolute (psia)
Mscf thousand standard cubic feet
Mt megaton = million metric tons
N2 nitrogen
NETL U.S. Department of Energy, National Energy Technology Laboratory
NGL natural gas liquids
NOGA U.S. Geological Survey National Oil and Gas Assessment
OOIP original oil in place, in thousands of stock tank barrels (Mbbl in STB)
psi pound-force per square inch
psia pound-force per square inch, absolute
PVT pressure, volume, and temperature
RF recovery factor for oil or gas
ROZ residual oil zone
Scf standard cubic foot
SOI initial or original oil saturation, expressed as a fraction
SORW residual oil saturation after waterflood, expressed as a fraction
STB stock tank barrel
TDS total dissolved solids
TORIS Tertiary Oil Recovery Information System
TZ transition zone
USGS U.S. Geological Survey
VDP Dykstra-Parsons coefficient
WAG water alternating with gas
Z factor compressibility of gas

x
A Probabilistic Assessment Methodology for Carbon Dioxide Enhanced Oil Recovery and Associated Carbon Dioxide Retention
By Peter D. Warwick,1 Emil D. Attanasi,1 Ricardo A. Olea,1 Madalyn S. Blondes,1 Philip A. Freeman,1 Sean T. Brennan,1 Matthew D. Merrill,1 Mahendra K. Verma,1 C. Özgen Karacan,1 Jenna L. Shelton,1 Celeste D. Lohr,1 Hossein Jahediesfanjani,2 and Jacqueline N. Roueché2
AbstractThe U.S. Energy Independence and Security Act of 2007
authorized the U.S. Geological Survey (USGS) to conduct a national assessment of the potential volume of hydrocarbons recoverable by injection of carbon dioxide (CO2) into known oil reservoirs with historical production. The implementation of CO2 enhanced oil recovery (CO2-EOR) techniques could increase the U.S. recoverable hydrocarbon resource base. Use of anthropogenic CO2 in the CO2-EOR process could reduce the amount of CO2 released to the atmosphere by allowing a percentage of the injected CO2 to remain in reservoir pore space once occupied by produced oil and water or by CO2 dissolution in oil and water in the reservoir.
The USGS has developed a new methodology for the national assessment of technically recoverable oil resources that may be produced by using current CO2-EOR technologies. The methodology relies on a proprietary reservoir-level database, the comprehensive resource database (CRD). The CRD incorporates commercially available geologic and engineering data, and USGS-defined play averages or province averages of reservoir data were used to populate incomplete records. Values from the CRD are used to estimate the original oil in place (OOIP) for each reservoir. The inputs are reviewed by USGS geologists, particularly when play or province averages have been used. Monte Carlo simulation is used to produce a numerical probability distribution for the OOIP for each reservoir, with the mean defined as the value of the OOIP in the CRD. A reservoir model (CO2 Prophet, developed for the U.S. Department of Energy by Texaco, Inc.) is used to determine the incremental recovery factors for oil during the CO2-EOR process, on an individual reservoir basis. The model is also used to estimate the volume of CO2 remaining in the reservoir after the CO2-EOR process is complete. Empirical decline curve analysis and comparison with data
1U.S. Geological Survey.2Lynxnet, LLC, under contract to the U.S. Geological Survey.
from published papers and reports on CO2-EOR projects are utilized to substantiate the simulation results. Numerical distributions of recovery factors are prepared for variations in the reservoir lithology (clastic or carbonate). The distribution of incremental oil is computed by multiplying the appropriate probability distribution of recovery factors by the individual reservoir distribution of the OOIP. A way to estimate the CO2 remaining in the reservoir after the completion of the CO2-EOR process is also included in the methodology.
Assessment results will be aggregated to play, petroleum province, regional, and national scales. This assessment methodology has been tested on the Horseshoe Atoll, Upper Pennsylvanian-Wolfcampian play in the Permian Basin Province in Texas; the play consists of 27 reservoirs having at least 2 billion barrels of OOIP that are amenable to the CO2-EOR process. The play was selected as a test case because CO2-EOR production data and published reports are available for several reservoirs within the play. Preliminary estimates of oil recoverable by implementation of miscible CO2-EOR are comparable to those reported in the literature and obtained by reservoir decline curve analysis.
1 Introduction1.1 Background
The Energy Independence and Security Act of 2007 (Public Law 110–140; U.S. Congress, 2007) authorized the U.S. Geological Survey (USGS) to conduct a national assessment of geologic storage resources for carbon dioxide (CO2) and requested the USGS to estimate the “potential volumes of oil and gas recoverable by injection and sequestration of industrial carbon dioxide in potential sequestration formations” (U.S. Congress, 2007, 121 Stat. 1711). The USGS developed a probability-based methodology to assess the Nation’s technically accessible geologic storage resources available for sequestration of CO2 (Brennan and others, 2010; Blondes, Brennan, and others, 2013) and
2 A Probabilistic Assessment Methodology for Carbon Dioxide Enhanced Oil Recovery and Associated Carbon Dioxide Retention
published the results of the assessment (U.S. Geological Survey Geologic Carbon Dioxide Storage Resources Assessment Team, 2013a, b, c). Technically accessible storage resources are those that can be accessed using today’s technology and pressurization and injection techniques. The storage resources include those saline formations and structural traps (containing water and [or] hydrocarbons) that met the assessment criteria. The assessment results do not represent how much CO2 is economically viable for storage in geologic reservoirs, but they do represent the pore space volume that is technically accessible; thus, the results are technically viable.
The use of CO2 enhanced oil recovery (CO2-EOR) techniques in identified hydrocarbon reservoirs can increase the U.S. recoverable hydrocarbon resource volume. Because some of the injected CO2 is retained in the reservoir, use of anthropogenic CO2 in the EOR process could potentially help reduce the amount of CO2 released to the atmosphere that might contribute to global warming as a greenhouse gas. A probabilistic methodology has been developed that could be used to assess oil reservoirs for hydrocarbon recovery potential, additional gas recovery, and CO2 storage in the United States using CO2-EOR methods.
1.2 Objective
The objective of this report is to describe an assessment methodology to achieve two outcomes: (1) estimating the volumes of oil that could be technically recoverable by applying the CO2-EOR method to suitable oil reservoirs and (2) estimating the masses of CO2 that could be stored (retained) in petroleum reservoirs within the United States as a result of the application of CO2-EOR. The methodology follows the current practice in industry to maximize oil production rather than CO2 retention because, in the general absence of regulations or economic incentives,3 current industry practice is to minimize CO2 retention in the subsurface (Jahangiri and Zhang, 2010). The assessment results are an estimate of the technically recoverable incremental oil resource that is available with the application of CO2-EOR. The estimate does not include economic or logistical constraints, such as the availability of pipelines for CO2 supply and surface ownership or use, on recovering the resource.
Although enhanced gas recovery by CO2 gas injection into the reservoir is technically feasible, no commercial enhanced gas recovery projects exist today in conventional gas reservoirs. In this report, a gas reservoir is any
hydrocarbon accumulation with a producing gas:oil ratio above 10,000 standard cubic feet per barrel (Scf/bbl); see Carolus and others (2018). A brief discussion of CO2 injection for potential enhanced gas recovery and CO2 sequestration (retention) in gas reservoirs is provided in section 3.3.
2 Information on CO2-EOR and Related Topics
2.1 Overview of the CO2-EOR Process
Within the United States, the CO2-EOR process is more widely applied than other EOR processes that use thermal and chemical methods or gases other than CO2. Injection of CO2 has the ability to increase technically recoverable hydrocarbon volumes, and anthropogenic CO2 could potentially be stored in substantial volumes in active and depleted oil reservoirs. These topics were addressed in detail at a symposium in 2010 (Massachusetts Institute of Technology Energy Initiative and the Bureau of Economic Geology at the University of Texas, Austin, 2010) and in a report authored by the International Energy Agency (2015). Another important feature of the CO2-EOR process is its wide application to conventional accumulations (reservoirs) with a wider range of oil gravities and viscosities than those associated with other EOR processes. Preliminary limitations to the widespread application of CO2-EOR are the lack of infrastructure to provide CO2 to all potential oil-field locations and the lack of a sufficient source of anthropogenic or naturally occurring CO2 found in gas reservoirs. This methodology applies to candidate reservoirs where both primary and secondary recovery processes have been used and where the tertiary CO2-EOR process can be utilized. Before continuing the description of the CO2-EOR methodology, it would be worthwhile to briefly describe the earlier phases of production in an oil field, such as the primary and secondary recovery phases.
Primary recovery.—During the primary recovery phase, oil reservoirs are produced using natural reservoir energy, such as dissolved gas in oil, water influx from the associated aquifers, and the rock and the fluid compressibility. As oil is produced, the reservoir pressure declines, causing the production rate to decline and associated water and gas production to increase, both of which adversely affect the economics of oil-field operations. At the end of the primary recovery phase, oil recoveries are generally low, typically ranging between 5 and 15 percent of the original oil in place (OOIP) (Walsh and Lake, 2003; Tzimas and others, 2005); these low levels of recovery imply that a large volume of oil is left behind in the reservoir, which becomes a target for the next phase, the secondary recovery.
3The Bipartisan Budget Act of 2018 (Public Law 115–123; U.S. Congress, 2018) includes increases to the tax credits that CO2-EOR operators may receive for injecting and sequestering anthropogenic carbon dioxide.
2 Information on CO2-EOR and Related Topics 3
Secondary recovery.—Reservoir pressure is typically maintained early in the life of a producing oil field by water and (or) gas injection. The ultimate recovery by immiscible injection of water or gas will depend on volumetric sweep and the displacement efficiency of the injection fluid. On average, worldwide, the ultimate recovery for the primary plus secondary processes (generally after waterflood) ranges between 30 and 50 percent of the OOIP (Green and Willhite, 1998; Walsh and Lake, 2003). After the water or gas breakthrough in the production wells occurs, the water cut (water production as a percentage of the total stream) and producing gas:oil ratio increase, adversely affecting the economics of the production. As a result, at the end of the secondary process, there is still a significant volume of oil left in the reservoir. If favorable economic conditions exist, extraction may lead to the next recovery process, EOR.
2.2 CO2-EOR: Background and Basics
There are multiple enhanced (tertiary) recovery processes that various authors have classified in different ways. Terry (2001) and Lake and others (2014) classified the EOR processes into three categories: thermal, chemical, and solvent methods, with CO2-EOR categorized as a solvent method. The CO2-EOR (miscible) method is one of the two most commonly
used EOR methods, the other being steam flood, a type of thermal process (Alvarado and Manrique, 2010). Miscible and immiscible methods are described below.
Although experimental work on CO2 dissolution and benefits in increasing oil recovery was reported over six decades ago by Holm (1959), the technical viability of the CO2-EOR process was first established on a fieldwide basis in the early 1970s in the Permian Basin of Texas and New Mexico. Martin and Taber (1992) observed even higher recoveries with CO2 miscible flooding than with the hydrocarbon miscible flooding and attributed it to the higher solubility of CO2 in water than hydrocarbon gases and its subsequent diffusion through the water phase to swell oil. Over the years, ongoing research has been dedicated to improving ultimate oil recoveries through a better understanding of both miscible and immiscible CO2-EOR processes.
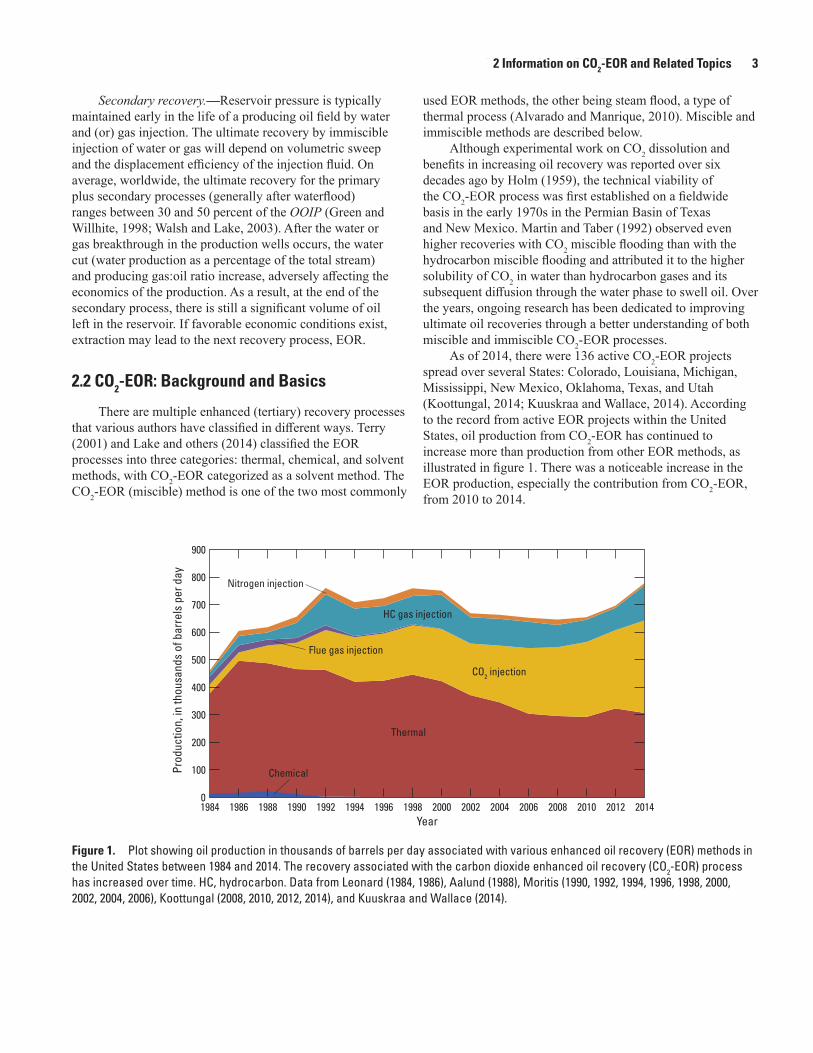
As of 2014, there were 136 active CO2-EOR projects spread over several States: Colorado, Louisiana, Michigan, Mississippi, New Mexico, Oklahoma, Texas, and Utah (Koottungal, 2014; Kuuskraa and Wallace, 2014). According to the record from active EOR projects within the United States, oil production from CO2-EOR has continued to increase more than production from other EOR methods, as illustrated in figure 1. There was a noticeable increase in the EOR production, especially the contribution from CO2-EOR, from 2010 to 2014.
0
100
200
300
400
500
600
700
800
900
1984 1986 1988 1990 1992 1994 1996 1998 2000 2002 2004 2006 2008 2010 2012 2014
Prod
uctio
n, in
thou
sand
s of
bar
rels
per
day
Year
Thermal
Flue gas injection
CO2 injection
HC gas injection
Nitrogen injection
Chemical
Figure 1. Plot showing oil production in thousands of barrels per day associated with various enhanced oil recovery (EOR) methods in the United States between 1984 and 2014. The recovery associated with the carbon dioxide enhanced oil recovery (CO2-EOR) process has increased over time. HC, hydrocarbon. Data from Leonard (1984, 1986), Aalund (1988), Moritis (1990, 1992, 1994, 1996, 1998, 2000, 2002, 2004, 2006), Koottungal (2008, 2010, 2012, 2014), and Kuuskraa and Wallace (2014).
2 Information on CO2-EOR and Related Topics
4 A Probabilistic Assessment Methodology for Carbon Dioxide Enhanced Oil Recovery and Associated Carbon Dioxide Retention
The CO2 flooding of an oil reservoir can be either miscible or immiscible. When the reservoir pressure is below the minimum miscibility pressure (MMP), the CO2 and oil are immiscible. In an immiscible flood, the CO2 and oil will not form a single phase, but the immiscible process still improves oil recovery because of oil viscosity reduction, oil swelling, and dissolved gas drive. When the reservoir pressure is above the MMP, the CO2 and oil, though immiscible on first contact, develop miscibility after multiple contacts through in situ mass transfer of components. The miscible process is more effective in oil recovery because of significant reduction in the interfacial tension in addition to the effects of oil viscosity reduction, oil swelling, and dissolved gas drive. The displacement mechanism is predominantly a vaporizing gas drive in which miscibility is developed through vaporization or extraction of the light ends (volatile components) of the oil into the CO2 (Stalkup, 1983; Jarrell and others, 2002). As miscibility is approached, the CO2 and oil begin to form a single phase without interfacial tension; the formation of a single phase makes this process more efficient than if the phases were immiscible (Martin and Taber, 1992). In the immiscible mode, the recovery mechanism is primarily a solution-gas drive because the injected CO2 only partly mixes with oil, and a free and distinct CO2 phase is present.
Depending on the reservoir geology, oil properties, and well-pattern configuration, the CO2-EOR projects may use one of the several flood types: continuous CO2 injection followed by either water or CO2 (or another gas), or constant or tapered water-alternating-with-gas (WAG) injection (Jarrell and others, 2002). The projects may use one of the following operating methods: gravity-stabilized recovery, double displacement, gas-cycling, or huff-and-puff (Merchant, 2010). WAG injection is designed to reduce CO2 mobility in order to mitigate the tendency of CO2 to override oil and water in the reservoir due to its lower gravity and viscosity. WAG injection helps to reduce early CO2 breakthrough to a production well, resulting in increased oil production and decreased CO2 production. For detailed information on the basics of the CO2-EOR process, refer to Verma (2015), a report prepared to supplement this methodology report.
2.3 CO2 Utilization (Trapping) During EOR Operations
During the EOR operations, some volume of CO2 is continuously produced and recycled while some volume of CO2 is left trapped or dissolved in oil and water in the reservoir. The measure of how efficiently CO2 injection recovers additional oil is expressed in two ways, both being reported as thousand standard cubic feet (Mscf) of CO2 injected per stock tank barrel of incremental oil produced (Azzolina and others, 2015):
• Gross CO2 utilization—includes the recycled and the make-up volumes (purchased) of CO2, and
• Net CO2 utilization factor—quantity of gross CO2 injected minus the CO2 produced divided by the oil in barrels produced.
Both net and gross CO2 utilization values have been reported in the literature; for example, average net CO2 utilization of 4–6 Mscf of CO2/barrel of oil produced and gross CO2 utilization of 8–15 Mscf of CO2/barrel of oil produced were reported by Jeschke and others (2000) for all miscible CO2-EOR projects. Olea (2015) also reviewed the values reported in the literature for CO2 retained in 23 subsurface oil reservoirs and found that the percentage of retained CO2 decreases with the volume of CO2 injected and is larger for carbonate reservoirs than for sandstone (clastic) reservoirs.
2.4 Comprehensive Resource Database
A comprehensive resource database (CRD) has been developed to identify candidate reservoirs for CO2-EOR and to provide a basis for the assessment of the technically recoverable hydrocarbons from conventional oil reservoirs (Carolus and others, 2018). The USGS contracted with a petroleum engineering consulting company, INTEK Inc., to develop the CRD. The data within the CRD (table 1) are proprietary and will not be released to the public by the USGS. They include location information for fields and reservoirs along with reservoir fluid properties and production data from the proprietary database by Nehring Associates Inc. (2012), “The Significant Oil and Gas Fields of the United States Database,” and proprietary production and drilling data by well from IHS Inc. (2012). The reservoirs in the CRD were organized by the geologic plays and petroleum provinces identified during the 1995 USGS National Oil and Gas Assessment (NOGA) project (U.S. Geological Survey National Oil and Gas Resource Assessment Team, 1995; Beeman and others, 1996).
The commercial databases provide information on the geologic characteristics of reservoirs, formations, and fields; the reservoir properties; and some production data, and they differ in the type of data they report. The Nehring Associates Inc. (2012) database reports production by individual reservoir or field, whereas the IHS Energy Group (2011) and IHS Inc. (2012) databases report production by individual well or producing entity such as a lease. Carolus and others (2018) described the parameters from the Nehring Associates and IHS databases that were used to create the CRD. The IHS data were used to augment the production data from the Nehring database for years 2011 and 2012. Well and lease production data from IHS were aggregated to the field level, and, for fields where the two databases matched, the extended production data for IHS were allocated to the reservoirs in the Nehring database according to each reservoir’s historical shares. Other publicly available reservoir engineering databases were used to verify the estimates and ranges of reservoir values found in the CRD. These include the database developed by the National Petroleum Council (1984b) and data compiled by the Appalachian Oil and Natural Gas Research Consortium (1996), the Midwest Regional Carbon Sequestration Partnership (Riley and others, 2010), and the Midwest Geological Sequestration Consortium (2012).

2 Information on CO2-EOR and Related Topics 5
The CRD contains the location, key petrophysical properties, production, and well counts from the Nehring Associates Inc. (2012) database for the significant (>0.5 million barrels of oil equivalent of reserves and cumulative production) oil and gas reservoirs in the United States. The missing values in the Nehring Associates Inc. (2012) database have been estimated by using various analogs and algorithms that primarily use play and province averages. For details on the development of the CRD, see Carolus and others (2018).
2.5 Geology
Certain geological conditions must be met before a reservoir or play can be characterized and assessed. Previous USGS oil and gas assessments have been conducted to estimate technically recoverable undiscovered resources where play characteristics are often poorly reported (Schmoker and Klett, 2005). This assessment methodology evaluates additional production from already discovered reservoirs for which there is usually a large amount of available data. The CRD was especially developed to facilitate data handling (Carolus and others, 2018). Another important difference in this assessment methodology relative to those used for previous USGS oil and gas assessments (for example, Schmoker and Klett, 2005) and the USGS national assessment of geologic carbon dioxide storage resources (Brennan and others, 2010; Blondes, Brennan, and others, 2013), is that the fundamental assessment unit is the reservoir instead of the play or storage assessment unit. This difference is defined by the basic reservoir entries in the Nehring Associates Inc. (2012) database and the CRD.
The lithologic data from Nehring Associates Inc. (2012) for the reservoirs suitable for CO2-EOR were grouped by the USGS into two general lithologies: clastic or carbonate. All conventional oil reservoirs, regardless of lithology, would be included in this potential assessment if they had interconnected pore space for fluid accumulation and flow and met other screening requirements, discussed below. Survey results reported by Koottungal (2014) and Kuuskraa and Wallace (2014) show that in the United States in 2014, there were 54 active CO2-EOR projects in clastic (sandstone) reservoirs, 71 in carbonate (combined dolomites and limestones) reservoirs, and 10 in other reservoirs with mixed lithology (8 in tripolitic chert and 2 in mixed sandstone, limestone, and dolomite), and 1 with inadequate geologic data.
Unlike assessments having the minimum depth requirement of 3,000 feet (ft) for CO2 storage described by Brennan and others (2010), this assessment would include reservoirs at all depth intervals that are suitable for miscible or immiscible CO2-EOR. In addition, all reservoir formation water salinities would be considered because the U.S. Environmental Protection Agency Underground Injection Control Program may grant aquifer exemptions for CO2-EOR operations in reservoirs where the total dissolved solids in the formation water are less than 10,000 milligrams per liter (U.S. Environmental Protection Agency, 2009); therefore, all reservoirs suitable for potential CO2-EOR operations would be considered in this assessment methodology.
Table 1. Oil and gas reservoir properties in the comprehensive resource database (CRD) for which values are averaged, calculated, or inferred.
[Values are averaged or calculated because they are missing from the Nehring Associates Inc. (2012) database. Abbreviations: API, American Petroleum Institute; CO2, carbon dioxide; H2S, hydrogen sulfide; N2, nitrogen; NGL, natural gas liquids; Z factor, compressibility of gas. Modified from Carolus and others (2018, table 2)]
Oil reservoir properties Gas reservoir properties
Averaged valuesNet pay (thickness) Net pay (thickness) Depth DepthTemperature gradient Temperature gradientPressure gradient Pressure gradientPorosity PorosityPermeability PermeabilityInitial oil saturation Initial gas saturationInitial water saturation Initial water saturationInitial oil formation volume
factorCO2 concentration
API gravity of oil N2 concentrationSpecific gravity of the gas H2S concentrationWell spacing Specific gravity of the gas
Heat contentSulfur content
Calculated and inferred valuesReservoir area Initial gas formation volume
factorLithology LithologyNumber of active wells Well spacingOriginal oil in place* Producing areaRecovery factor Gas compressibilityCurrent pressure Gas-in-place volumeCurrent oil formation volume
factor Recovery factor
Current oil saturation Original gas in placeCurrent water saturation Current gas formation volume
factorCurrent gas saturation Current temperatureGas:oil ratio Current oil saturationSwept zone oil saturation Current water saturationViscosity Current gas saturationPseudo-Dykstra-Parsons coef-
ficient Current Z factor
Size class Water influxNGL:gas ratioCondensate:gas ratioViscositySize class
*Adjusted if the recovery factor is >35 percent. Adjusted volumetric data are checked against the play range and other U.S. Geological Survey data.
2 Information on CO2-EOR and Related Topics
6 A Probabilistic Assessment Methodology for Carbon Dioxide Enhanced Oil Recovery and Associated Carbon Dioxide Retention
2.6 Reservoir CO2 Miscibility
Although the basic role of reservoir engineering is to understand the flow of oil, gas, and water through hydrocarbon reservoirs to maximize oil and gas recovery, it also covers reservoir management with a goal to coordinate various reservoir and operational activities to optimize reservoir delineation, development, and exploitation. In this assessment methodology, we focus on oil recovery using the CO2-EOR process. All reservoir parameters would affect the recovery efficiency of CO2-EOR to some extent, but miscibility has the most profound effect of all. The miscible process has a higher oil recovery due to improved displacement and sweep efficiencies and is therefore a preferred option. To have miscibility between CO2 and reservoir oil, the MMP must be less than the reservoir pressure. The injection pressure is regulated to remain below the reservoir fracture pressure. The MMP is determined either in the laboratory or through the use of established correlations.
The MMP is a function of oil composition, temperature, and the CO2 purity. In the absence of oil composition, oil gravity is used as a proxy. The experimental work by Holm and Josendal (1974) and Alston and others (1985) pointed out that the use of molecular weight of C5+ hydrocarbons provides better correlation than does the oil gravity (expressed in ºAPI, American Petroleum Institute). In the CRD (Carolus and others, 2018), the correlation by Lasater (1958) was used to obtain the molecular weight of C5+ hydrocarbons in the reservoir oil. The National Petroleum Council (1984a) discussed the correlation by Holm and Josendal (1974), along with the extensions by Mungan (1981), for estimating the MMP, which is a function of the molecular weight of C5+ hydrocarbons and reservoir temperature. The CRD also uses methods from Holm and Josendal (1974) and Mungan (1981) for estimating the MMP because of their general acceptance in the industry.
For a miscible CO2-EOR flood project, the oil recovery will depend on various factors, including formation lithology and permeability, oil saturation, oil gravity and viscosity, the WAG ratio, total injection volume of CO2, and well pattern (Azzolina and others, 2015). In the immiscible CO2-EOR process, depending on oil gravity and reservoir pressure and temperature, some injected CO2 will go into solution with reservoir oil, resulting in oil swelling and the lowering of oil viscosity, which will help improve oil recovery. However, the immiscible CO2-EOR process does not recover as much oil as the miscible EOR process unless other reservoir factors play a better-than-expected role in the recovery process. For additional information on the basics of CO2-EOR, see Verma (2015).
3 Operational Assumptions
3.1 CO2 Supply
The basic requirement for the implementation of CO2-EOR is to have a reliable source of CO2, which could be either natural (CO2 reservoirs) or anthropogenic (industrial plants). The next important operational requirement is the purity of CO2, which may vary between 90 and 98 percent for a miscible process, depending on the oil composition and reservoir pressure and temperature (Jarrell and others, 2002). For CO2-EOR projects, the recommended supply pipeline CO2 concentration should be greater than 95 percent (U.S. Department of Energy, National Energy Technology Laboratory, 2013). The concentration of CO2 in natural gas reservoirs may range from less than 1 percent to as high as 25 percent, and in gas from CO2-dominated reservoirs, it may be as high as 63 to 99 percent (Jarrell and others, 2002). Some of the impurities, such as methane and nitrogen, increase the MMP, whereas hydrogen sulfide and lighter hydrocarbons, excluding methane, reduce it (Jarrell and others, 2002; McKaskle, 2014). Since the miscible process is the preferred option because it has a much higher ultimate recovery factor than the immiscible process, the requirement of high purity of CO2 becomes critical for a successful application of CO2-EOR.
This assessment methodology assumes that an adequate source of CO2 that is more than 90-percent pure will be available from either natural or anthropogenic sources for possible EOR projects. Naturally occurring or anthropogenic gas streams of CO2 can be concentrated or cleansed of impurities but at a cost depending on requirements or needs. Another assumption is that the CO2 retained in the reservoir at the end of the CO2-EOR process will not be removed for reuse in other CO2-EOR projects.
3.2 Potential for Additional Oil Recovery by Using the CO2-EOR Process
Though the fundamentals of the various CO2-EOR processes are well understood, recent advancements in other areas, such as residual oil zones (ROZs) in oil reservoirs, “next generation” CO2-EOR technology, and continuous oil accumulations such as tight oil shale (Melzer, 2006; Kuuskraa and Ferguson, 2008; Hoffman, 2014), may increase the potential for technically recoverable hydrocarbon volumes to be produced by using the CO2-EOR process. However, these techniques and reservoirs are typically not part of present oil-field CO2-EOR production practices. Although the above-mentioned topics are not included in the current assessment methodology, further technology advancements in these areas could have a significant effect on the potential for hydrocarbon recovery and carbon sequestration. Because such advancements may affect the future estimates of CO2-EOR potential associated with carbon sequestration, a brief description of some of them is included here.
3 Operational Assumptions 7
3.2.1 Residual Oil Zone (ROZ)The residual oil zone (ROZ) is the interval of lower oil
saturation created by the movement of water in the reservoir caused either by natural or production-induced aquifer flow or a waterflood with injection below the producing oil-water contact (Melzer, 2006). Broadly speaking, the ROZ is the interval below the oil-water contact where oil saturation varies from its highest value in the upper section to almost zero at the base of the section. The upper part of the ROZ may also include transition zones (TZs). The ROZ can also be an independent reservoir on its own without an overlying conventional oil reservoir.
Historically, the recovery from the ROZ section has not been a part of oil-field production practices because of high water production making the oil recovery uneconomical. Investigations in improving recovery efficiency of all oil fields, including the application of CO2-EOR to the ROZ, are important parts of the long-term sustainability plan of the petroleum industry. Improving efficiency is important because the ROZ has a large oil potential (National Petroleum Council, 2011) and because the ROZ may occur below developed oil fields with existing infrastructure. For example, Melzer (2006) estimated TZ and ROZ oil in the Wasson and Seminole fields of the Permian Basin of Texas and New Mexico to be 4 billion barrels (OOIP) and estimated that another 4 billion barrels (OOIP) is present in seven other Permian Basin reservoirs, with 3 billion barrels of this oil being potentially recoverable from all areas.
The national occurrence of the ROZ below oil reservoirs is poorly defined. The USGS is working to develop techniques to better identify ROZs using core data and conventional well logs with probabilistic and predictive methods (Roueché and Karacan, 2018). Most of the ROZs that have been discovered and that are under production occur in the Permian Basin (Godec and others, 2013). In addition, production from the ROZ is not defined in the Nehring Associates Inc. (2012) database or the CRD. Therefore, the current methodology does not include the potential for oil production from the ROZ.
3.2.2 “Next Generation” CO2-EOR TechnologyMost of the currently active CO2-EOR projects are
miscible because miscible methods have a higher recovery efficiency than immiscible methods. However, the recovery factor will depend on geologic and reservoir characteristics, the composition of oil, purity of CO2, oil mobility, flood type, and CO2 injection-production well pattern and size. Any improvement in the recovery factor through technology advancement in the CO2-EOR process will expand its application to many other reservoirs and fields.
As reported by Advanced Resources International, Inc. (2010), Remson (2010), and Enick and others (2012), the application of “next generation” CO2-EOR technology has the potential for achieving higher recoveries through improvement in the following:
• Well placement and flood design via multilateral wells, horizontal drilling, and well patterns;
• Mobility and conformance control through the proper design of WAG (Enick and others, 2012) by adding viscosity enhancers to improve mobility and miscibility enhancers to lower MMP (Advanced Resources International, Inc., 2010);
• Increased volume of CO2 injection from an amount equal to 100 percent of the hydrocarbon pore volume (1 HCPV) used in “best practices” up to 150 percent of the HCPV (1.5 HCPV; Advanced Resources International, Inc., 2010); and
• Flood performance monitoring through use of various logs including time-lapse three-dimensional surface seismic and vertical seismic profiles to identify bypassed oil regions (O’Brien and others, 2004; Al Aryani and others, 2011). Raef and others (2005) reported a successful application of a high-resolution time-lapse seismic technique to monitor the movement of miscible CO2-EOR flood into a carbonate reservoir in Russell County, Kansas.
The recovery factors used in this methodology are more in line with current proven CO2-EOR practices. Assumptions about the application of “next generation” CO2-EOR technology are not included in this assessment methodology.
3.3 Gas Reservoirs: Enhanced Gas Recovery and CO2 Retention
The technology to inject CO2 for enhanced gas and condensate recovery is available and has been described in several reports on the feasibility of CO2 injection for retention (sequestration) associated with enhanced gas recovery (Mamora and Seo, 2002; Oldenburg and Benson, 2002; Jikich and others, 2003; van der Meer and others, 2005; Khan and others, 2012). There are no known reports on the fieldwide application of the enhanced gas recovery process, probably because of economic constraints on the operation, such as the cost of gas separation facilities and the availability and cost of CO2. However, CO2 injection in depleted gas reservoirs has been field tested (van der Meer and others, 2005), and it could certainly enhance gas recovery, as well as offer a potential for carbon sequestration.
Because of the low viscosity and specific gravity, gas easily flows even through reservoirs having low formation permeability. Therefore, the primary ultimate recovery factors for gas reservoirs are generally much higher than those for oil reservoirs and could range between 70 and 85 percent (Cornelson, 1974; Cruz Lopez, 2000; Toole and Grist, 2003). This difference makes conventional gas reservoirs less attractive for enhanced gas recovery and, thus, they are not included in this assessment methodology.
8 A Probabilistic Assessment Methodology for Carbon Dioxide Enhanced Oil Recovery and Associated Carbon Dioxide Retention
4 MethodologyA methodology for assessing the potential hydrocarbon
recovery resulting from the use of CO2-EOR technology
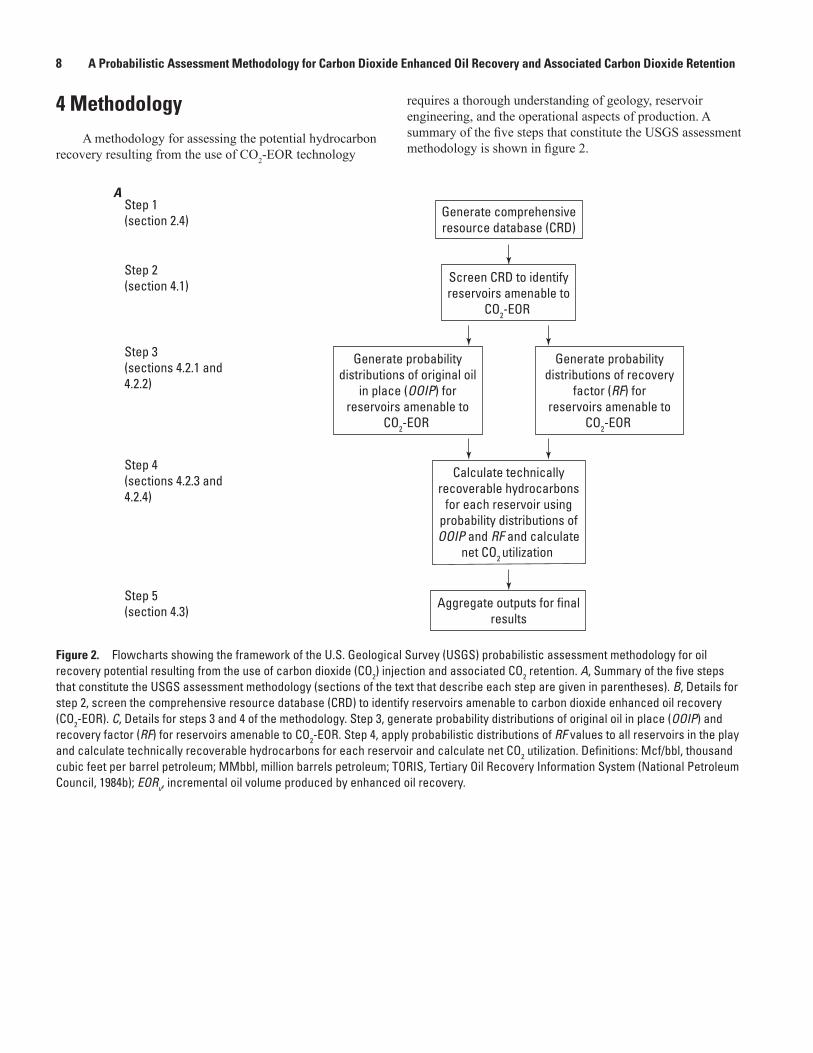
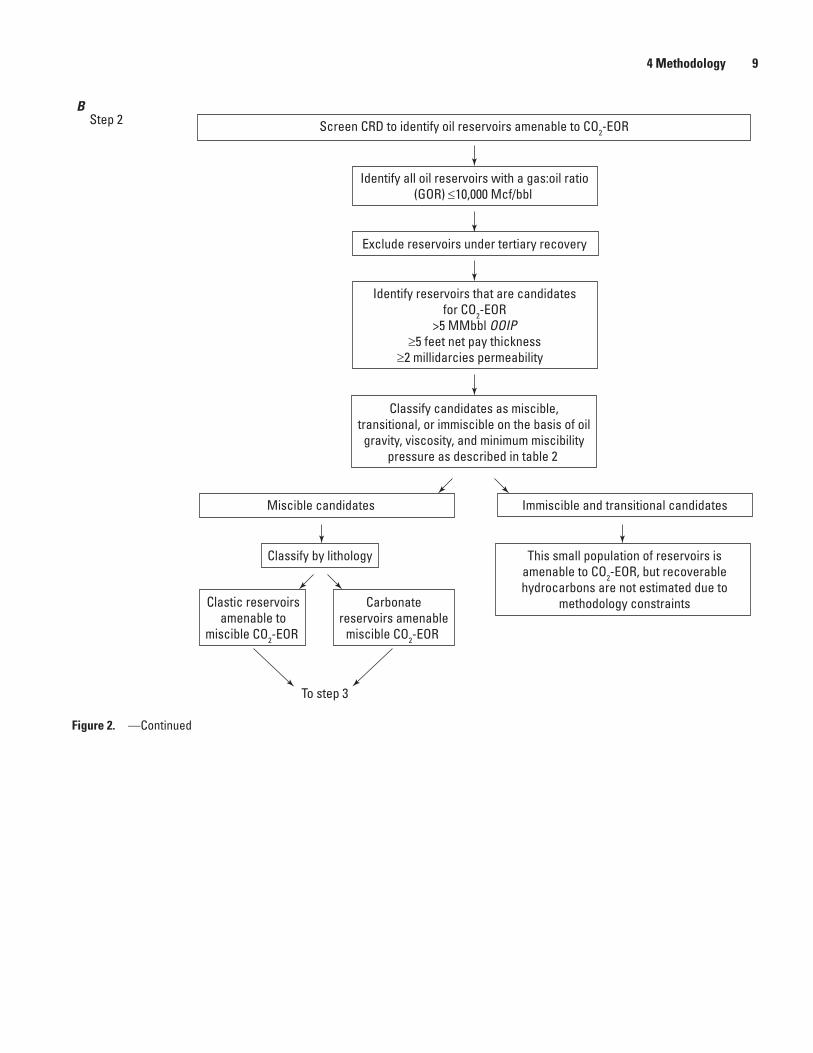
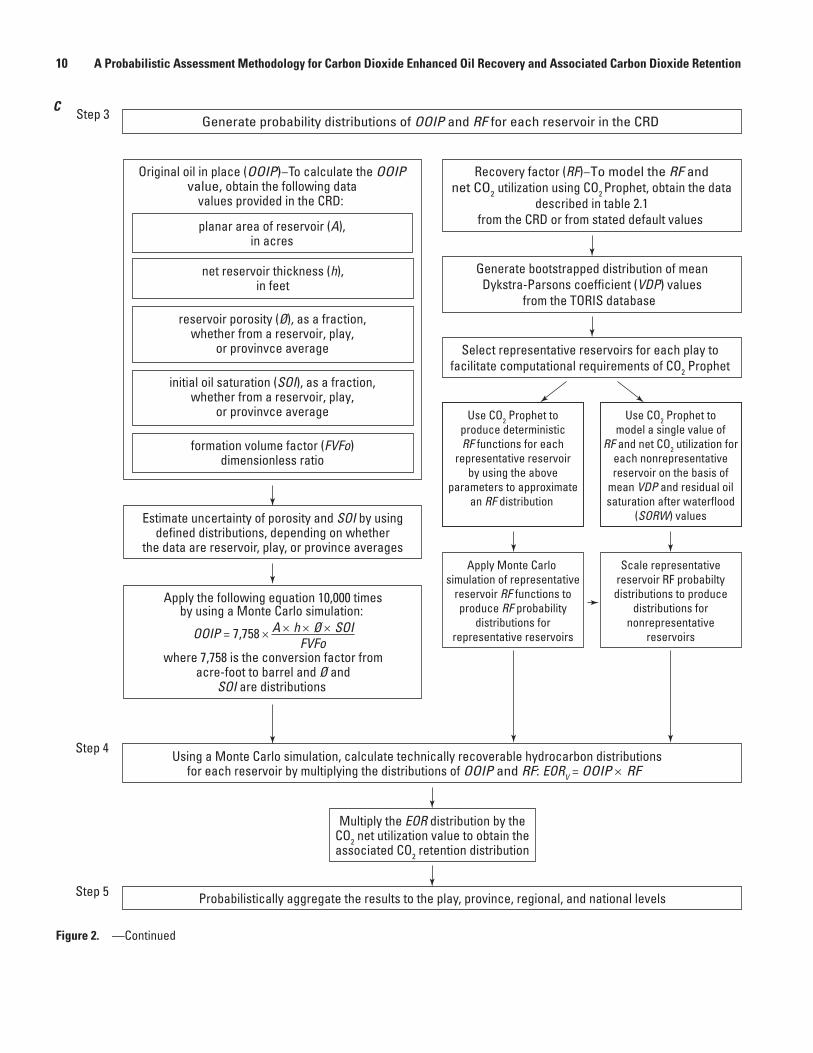
Figure 2. Flowcharts showing the framework of the U.S. Geological Survey (USGS) probabilistic assessment methodology for oil recovery potential resulting from the use of carbon dioxide (CO2) injection and associated CO2 retention. A, Summary of the five steps that constitute the USGS assessment methodology (sections of the text that describe each step are given in parentheses). B, Details for step 2, screen the comprehensive resource database (CRD) to identify reservoirs amenable to carbon dioxide enhanced oil recovery (CO2-EOR). C, Details for steps 3 and 4 of the methodology. Step 3, generate probability distributions of original oil in place (OOIP) and recovery factor (RF) for reservoirs amenable to CO2-EOR. Step 4, apply probabilistic distributions of RF values to all reservoirs in the play and calculate technically recoverable hydrocarbons for each reservoir and calculate net CO2 utilization. Definitions: Mcf/bbl, thousand cubic feet per barrel petroleum; MMbbl, million barrels petroleum; TORIS, Tertiary Oil Recovery Information System (National Petroleum Council, 1984b); EORv, incremental oil volume produced by enhanced oil recovery.
requires a thorough understanding of geology, reservoir engineering, and the operational aspects of production. A summary of the five steps that constitute the USGS assessment methodology is shown in figure 2.
Generate comprehensiveresource database (CRD)
Step 1(section 2.4)
Step 5(section 4.3)
Step 2(section 4.1)
Step 3(sections 4.2.1 and4.2.2)
Step 4(sections 4.2.3 and4.2.4)
Screen CRD to identifyreservoirs amenable to
CO2-EOR
Calculate technicallyrecoverable hydrocarbons
for each reservoir usingprobability distributions ofOOIP and RF and calculate
net CO2 utilization
Aggregate outputs for finalresults
Generate probabilitydistributions of original oil
in place (OOIP) forreservoirs amenable to
CO2-EOR
Generate probabilitydistributions of recovery
factor (RF) forreservoirs amenable to
CO2-EOR
A
4 Methodology 9
Figure 2. —Continued
Identify all oil reservoirs with a gas:oil ratio(GOR) ≤10,000 Mcf/bbl
Identify reservoirs that are candidatesfor CO2-EOR
>5 MMbbl OOIP≥5 feet net pay thickness
≥2 millidarcies permeability
Classify by lithology This small population of reservoirs isamenable to CO2-EOR, but recoverablehydrocarbons are not estimated due to
methodology constraints
To step 3
Clastic reservoirsamenable to
miscible CO2-EOR
Carbonatereservoirs amenable
miscible CO2-EOR
Classify candidates as miscible,transitional, or immiscible on the basis of oil
gravity, viscosity, and minimum miscibilitypressure as described in table 2
Immiscible and transitional candidatesMiscible candidates
Screen CRD to identify oil reservoirs amenable to CO2-EOR
Exclude reservoirs under tertiary recovery
Step 2B
10 A Probabilistic Assessment Methodology for Carbon Dioxide Enhanced Oil Recovery and Associated Carbon Dioxide Retention
Figure 2. —Continued
Step 3
Step 4
Step 5
Generate probability distributions of OOIP and RF for each reservoir in the CRD
Original oil in place (OOIP)−To calculate the OOIPvalue, obtain the following data
values provided in the CRD:
planar area of reservoir (A),in acres
Apply the following equation 10,000 timesby using a Monte Carlo simulation:
A × h × Ø × SOI FVFo
where 7,758 is the conversion factor fromacre-foot to barrel and Ø and
SOI are distributions
net reservoir thickness (h),in feet
reservoir porosity (Ø), as a fraction,whether from a reservoir, play,
or provinvce average
initial oil saturation (SOI), as a fraction,whether from a reservoir, play,
or provinvce average
Estimate uncertainty of porosity and SOI by usingdefined distributions, depending on whether
the data are reservoir, play, or province averages
formation volume factor (FVFo)dimensionless ratio
Using a Monte Carlo simulation, calculate technically recoverable hydrocarbon distributionsfor each reservoir by multiplying the distributions of OOIP and RF: EORV = OOIP × RF
Recovery factor (RF)−To model the RF andnet CO2 utilization using CO2 Prophet, obtain the data
described in table 2.1from the CRD or from stated default values
Multiply the EOR distribution by theCO2 net utilization value to obtain theassociated CO2 retention distribution
Probabilistically aggregate the results to the play, province, regional, and national levels
Generate bootstrapped distribution of meanDykstra-Parsons coefficient (VDP) values
from the TORIS database
Select representative reservoirs for each play to facilitate computational requirements of CO2 Prophet
OOIP = 7,758 ×
Apply Monte Carlo simulation of representative
reservoir RF functions toproduce RF probability
distributions forrepresentative reservoirs
Use CO2 Prophet tomodel a single value of
RF and net CO2 utilization foreach nonrepresentativereservoir on the basis of
mean VDP and residual oilsaturation after waterflood
(SORW) values
Use CO2 Prophet toproduce deterministicRF functions for each
representative reservoirby using the above
parameters to approximatean RF distribution
Scale representativereservoir RF probabilty
distributions to producedistributions for
nonrepresentativereservoirs
C
4 Methodology 11
The assessment requires first that various geologic, reservoir-engineering, and operational parameters, which affect the original-hydrocarbon-in-place values and recovery factors of the reservoirs (Verma and Warwick, 2011) be compiled into a database; the comprehensive resource database (CRD) was prepared as described in section 2.4 (step 1, fig. 2A). The CRD is used to screen reservoirs that are suitable for CO2-EOR (step 2, fig. 2A; table 2). For this study, the candidates for immiscible CO2-EOR are those reservoirs having an average oil gravity between 13 and 22 degrees API (ºAPI), typically classified as heavy-oil reservoirs.4 Reservoirs identified as candidates for the immiscible CO2-EOR recovery process were not assessed because they are few in number (approximately 250), their combined OOIP is insignificant compared to that of the miscible reservoirs, and immiscible CO2-EOR recovery factors (RFs) are difficult to model with the CO2 Prophet software. After the candidate miscible reservoirs have been identified following the screening criteria discussed below, OOIP is calculated from the parameters in the CRD by using standardized uncertainties that vary depending on the reservoir, play average, or province average origin of the parameter. Expected RFs are modeled by use of the CO2 Prophet model (step 3, fig. 2A). For this assessment, we apply the CO2 Prophet reservoir model (Dobitz and Prieditis, 1994) to estimate RFs and net CO2 utilization for miscible reservoirs. The model is publicly available and is commonly used by industry for reconnaissance-level CO2-EOR reservoir assessments (Hsu and others, 1995; Jarrell and others, 2002). Estimates of the RF uncertainty come from more in-depth modeling of representative candidate reservoirs in each play. These reservoirs often have the largest OOIP and the most available data in the play (step 4, fig. 2A). Using a Monte Carlo simulation, values from both the OOIP and RF distributions are sampled and multiplied to produce a distribution of incremental recovery and CO2 utilization. Finally, the results are aggregated at the play, province, regional, and national levels (step 5, fig. 2A, and section 4.3 below). The following sections provide a brief description of the major parts of the assessment methodology, including the use of the CO2 Prophet reservoir model to determine the recovery factors for the CO2-EOR process and the validation process.
4.1 Reservoir Screening Criteria
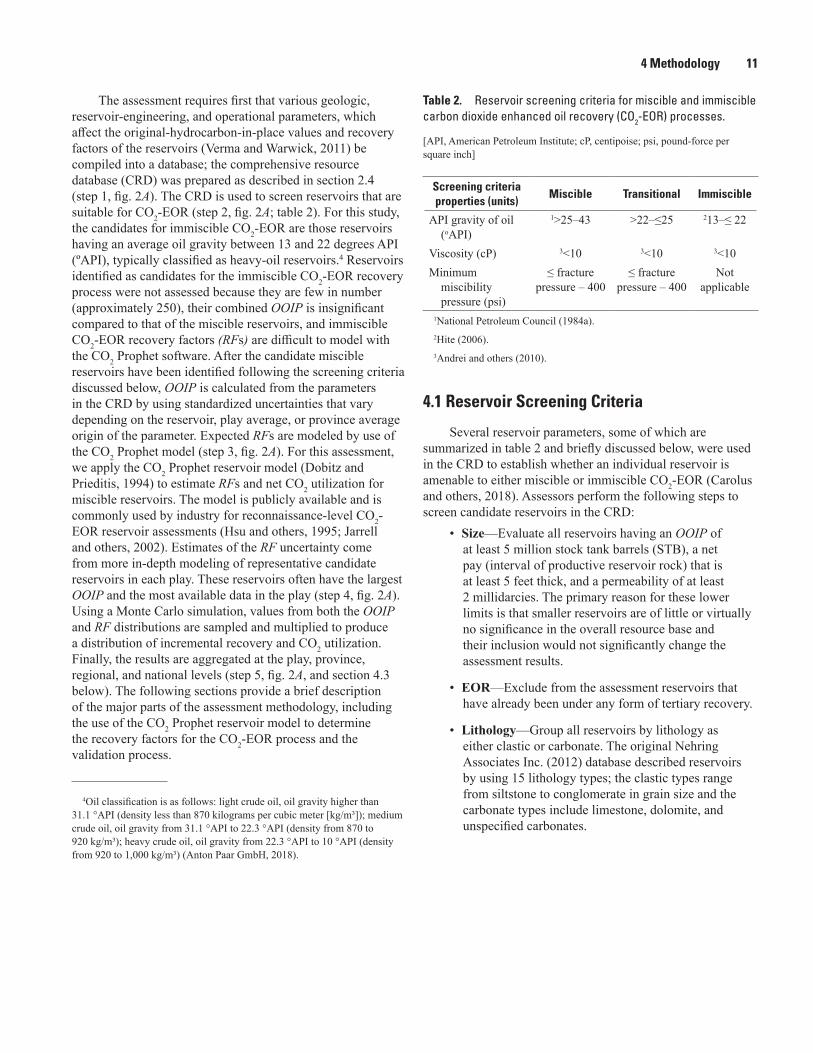
Several reservoir parameters, some of which are summarized in table 2 and briefly discussed below, were used in the CRD to establish whether an individual reservoir is amenable to either miscible or immiscible CO2-EOR (Carolus and others, 2018). Assessors perform the following steps to screen candidate reservoirs in the CRD:
• Size—Evaluate all reservoirs having an OOIP of at least 5 million stock tank barrels (STB), a net pay (interval of productive reservoir rock) that is at least 5 feet thick, and a permeability of at least 2 millidarcies. The primary reason for these lower limits is that smaller reservoirs are of little or virtually no significance in the overall resource base and their inclusion would not significantly change the assessment results.
• EOR—Exclude from the assessment reservoirs that have already been under any form of tertiary recovery.
• Lithology—Group all reservoirs by lithology as either clastic or carbonate. The original Nehring Associates Inc. (2012) database described reservoirs by using 15 lithology types; the clastic types range from siltstone to conglomerate in grain size and the carbonate types include limestone, dolomite, and unspecified carbonates.
4Oil classification is as follows: light crude oil, oil gravity higher than 31.1 °API (density less than 870 kilograms per cubic meter [kg/m³]); medium crude oil, oil gravity from 31.1 °API to 22.3 °API (density from 870 to 920 kg/m³); heavy crude oil, oil gravity from 22.3 °API to 10 °API (density from 920 to 1,000 kg/m³) (Anton Paar GmbH, 2018).
Table 2. Reservoir screening criteria for miscible and immiscible carbon dioxide enhanced oil recovery (CO2-EOR) processes.
[API, American Petroleum Institute; cP, centipoise; psi, pound-force per square inch]
Screening criteria properties (units)
Miscible Transitional Immiscible
API gravity of oil (oAPI)
1>25–43 >22–≤25 213–≤ 22
Viscosity (cP) 3<10 3<10 3<10Minimum
miscibility pressure (psi)
≤ fracture pressure – 400
≤ fracture pressure – 400
Not applicable
1National Petroleum Council (1984a).2Hite (2006).3Andrei and others (2010).

12 A Probabilistic Assessment Methodology for Carbon Dioxide Enhanced Oil Recovery and Associated Carbon Dioxide Retention
• Miscibility—Use the correlations by Holm and Josendal (1974) and Mungan (1981) to calculate the minimum miscibility pressure (MMP) to determine if the CO2-EOR process would be miscible or immiscible for all screened and qualifying reservoirs. In most cases, the immiscible CO2-EOR process happens in reservoirs with oil gravity below 22 oAPI, and the miscible process takes place in reservoirs with oil gravity greater than 25 oAPI. A few reservoirs (50) in the CRD had oil gravities (22 to 25 oAPI) that fall within a transition range and may not be entirely suitable for miscible CO2-EOR (table 2). These were included with the miscible reservoirs, and they accounted for about 0.5 percent of the miscible OOIP evaluated.
• Viscosity—Use oil viscosity of 10 centipoise as the cutoff for miscible CO2-EOR (Taber and others, 1997). This screening value was also used for immiscible reservoirs in this methodology.
The CRD was supplemented by the addition of Appalachian Basin reservoirs described in Appalachian Oil and Natural Gas Research Consortium (1996). The Appalachian Basin reservoirs were screened using the criteria described above, and the candidate reservoirs were added to the CRD.
4.2 Assessment Procedure
The objective of this methodology is to provide an assessment procedure that will produce a probabilistic estimate of the technically recoverable hydrocarbon volumes from the qualifying oil reservoirs that could be produced with CO2-EOR within the United States. Because the values in the CRD are deterministic, a method is required to estimate the probabilistic uncertainty of the OOIP and ultimate recovery factors. In this methodology, the basic assessment unit is the reservoir. Reservoir assessment results are aggregated and presented at the USGS play level, which includes conterminous reservoirs sharing similar geologic and petrophysical characteristics, typically the same formation(s). Figure 2 summarizes the methodology.
For any reservoir amenable to CO2-EOR, the incremental oil volume produced by enhanced oil recovery (EORv) can be determined by multiplying the OOIP by the incremental oil RF as follows:
EOR OOIP RFv � � (1)
To make a probabilistic estimate of technically recoverable hydrocarbon volume, one needs to have estimates of the OOIP and RF values as well as their uncertainty for each reservoir. The OOIP and RF are transformed into
continuous random variables with a defined mean and spread by the methods described below in sections 4.2.1 and 4.2.2. Once the OOIP and RF distributions are obtained, they are sampled 10,000 times and multiplied together in a Monte Carlo simulation to generate a numerical model for the CO2-EOR production volume and associated CO2 retention of each reservoir within the United States that has passed the screening criteria (fig. 2).
4.2.1 Distribution of the Original Oil in Place (OOIP) Values
At surface conditions, the OOIP of any reservoir is given by the following:
OOIP A h Ø SOI
FVFo� �
� � �7 758,
(2)
where 7,758 is the conversion factor from acre-foot (acre-
ft) to barrel (bbl); A is the planar area of the reservoir, in acres; h is the average net thickness of the reservoir, in
feet (ft); Ø is the reservoir porosity, expressed as a
fraction between 0 and 1; SOI is the initial or original oil saturation,
expressed as a fraction between 0 and 1; and
FVFo is the formation volume factor, a dimensionless ratio of oil volume at subsurface conditions to oil volume at surface conditions, in reservoir barrels per stock tank barrel (bbl/STB).
The values of the parameters in equation 2 are from the CRD, and they are applied and interpreted as representing the average value for the individual reservoir (app. 1).
Though the uncertainty of the estimated OOIP depends on the five parameters in equation 2, we determined that three variables (A, h, FVFo) have negligible uncertainty compared with the other two (Ø, SOI). Realistically, for oil reservoirs that have undergone primary recovery and waterflood, there should be minimal uncertainty about the area or net pay thickness because they have been densely drilled and characterized for many years. Variation in the formation volume factor is also negligible on the scale of a single reservoir. The uncertainty of the OOIP is therefore determined by using only the estimated uncertainties of porosity and initial oil saturation, which become random variables. The other three (A, h, FVFo) are treated as deterministic variables, that is, variables taking a single value, the one listed in the CRD.
4 Methodology 13
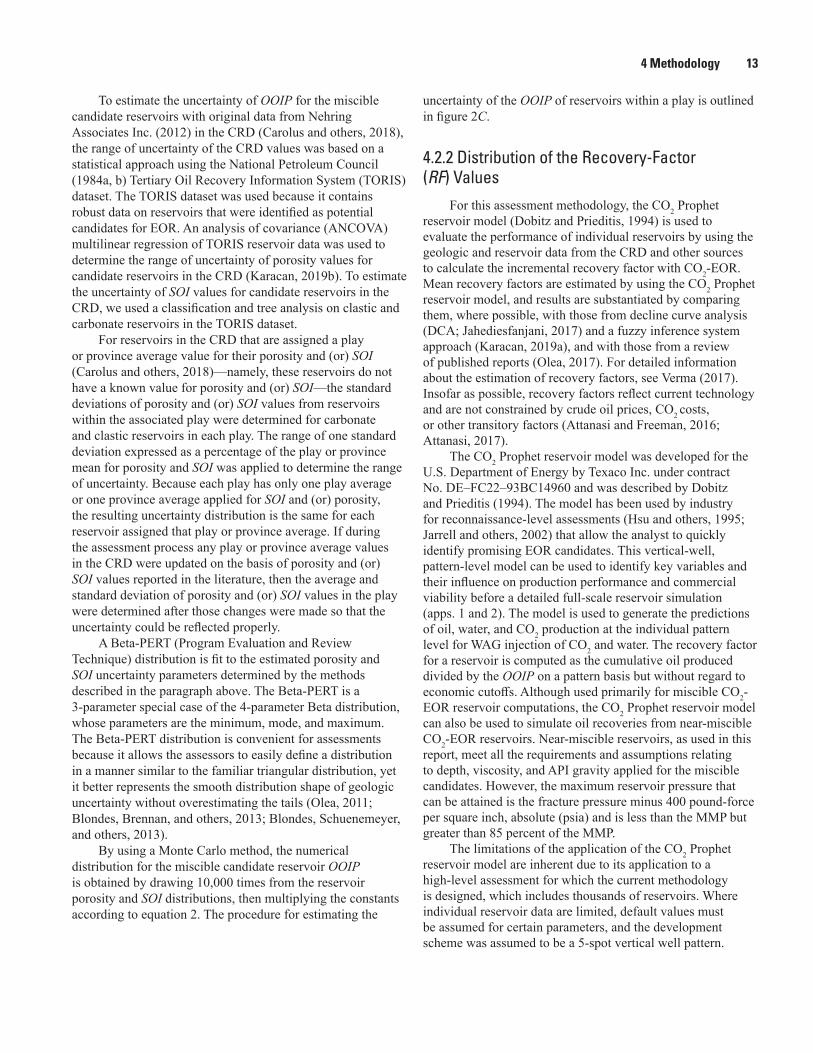
To estimate the uncertainty of OOIP for the miscible candidate reservoirs with original data from Nehring Associates Inc. (2012) in the CRD (Carolus and others, 2018), the range of uncertainty of the CRD values was based on a statistical approach using the National Petroleum Council (1984a, b) Tertiary Oil Recovery Information System (TORIS) dataset. The TORIS dataset was used because it contains robust data on reservoirs that were identified as potential candidates for EOR. An analysis of covariance (ANCOVA) multilinear regression of TORIS reservoir data was used to determine the range of uncertainty of porosity values for candidate reservoirs in the CRD (Karacan, 2019b). To estimate the uncertainty of SOI values for candidate reservoirs in the CRD, we used a classification and tree analysis on clastic and carbonate reservoirs in the TORIS dataset.
For reservoirs in the CRD that are assigned a play or province average value for their porosity and (or) SOI (Carolus and others, 2018)—namely, these reservoirs do not have a known value for porosity and (or) SOI—the standard deviations of porosity and (or) SOI values from reservoirs within the associated play were determined for carbonate and clastic reservoirs in each play. The range of one standard deviation expressed as a percentage of the play or province mean for porosity and SOI was applied to determine the range of uncertainty. Because each play has only one play average or one province average applied for SOI and (or) porosity, the resulting uncertainty distribution is the same for each reservoir assigned that play or province average. If during the assessment process any play or province average values in the CRD were updated on the basis of porosity and (or) SOI values reported in the literature, then the average and standard deviation of porosity and (or) SOI values in the play were determined after those changes were made so that the uncertainty could be reflected properly.
A Beta-PERT (Program Evaluation and Review Technique) distribution is fit to the estimated porosity and SOI uncertainty parameters determined by the methods described in the paragraph above. The Beta-PERT is a 3-parameter special case of the 4-parameter Beta distribution, whose parameters are the minimum, mode, and maximum. The Beta-PERT distribution is convenient for assessments because it allows the assessors to easily define a distribution in a manner similar to the familiar triangular distribution, yet it better represents the smooth distribution shape of geologic uncertainty without overestimating the tails (Olea, 2011; Blondes, Brennan, and others, 2013; Blondes, Schuenemeyer, and others, 2013).
By using a Monte Carlo method, the numerical distribution for the miscible candidate reservoir OOIP is obtained by drawing 10,000 times from the reservoir porosity and SOI distributions, then multiplying the constants according to equation 2. The procedure for estimating the
uncertainty of the OOIP of reservoirs within a play is outlined in figure 2C.
4.2.2 Distribution of the Recovery-Factor (RF) Values
For this assessment methodology, the CO2 Prophet reservoir model (Dobitz and Prieditis, 1994) is used to evaluate the performance of individual reservoirs by using the geologic and reservoir data from the CRD and other sources to calculate the incremental recovery factor with CO2-EOR. Mean recovery factors are estimated by using the CO2 Prophet reservoir model, and results are substantiated by comparing them, where possible, with those from decline curve analysis (DCA; Jahediesfanjani, 2017) and a fuzzy inference system approach (Karacan, 2019a), and with those from a review of published reports (Olea, 2017). For detailed information about the estimation of recovery factors, see Verma (2017). Insofar as possible, recovery factors reflect current technology and are not constrained by crude oil prices, CO2 costs, or other transitory factors (Attanasi and Freeman, 2016; Attanasi, 2017).
The CO2 Prophet reservoir model was developed for the U.S. Department of Energy by Texaco Inc. under contract No. DE–FC22–93BC14960 and was described by Dobitz and Prieditis (1994). The model has been used by industry for reconnaissance-level assessments (Hsu and others, 1995; Jarrell and others, 2002) that allow the analyst to quickly identify promising EOR candidates. This vertical-well, pattern-level model can be used to identify key variables and their influence on production performance and commercial viability before a detailed full-scale reservoir simulation (apps. 1 and 2). The model is used to generate the predictions of oil, water, and CO2 production at the individual pattern level for WAG injection of CO2 and water. The recovery factor for a reservoir is computed as the cumulative oil produced divided by the OOIP on a pattern basis but without regard to economic cutoffs. Although used primarily for miscible CO2-EOR reservoir computations, the CO2 Prophet reservoir model can also be used to simulate oil recoveries from near-miscible CO2-EOR reservoirs. Near-miscible reservoirs, as used in this report, meet all the requirements and assumptions relating to depth, viscosity, and API gravity applied for the miscible candidates. However, the maximum reservoir pressure that can be attained is the fracture pressure minus 400 pound-force per square inch, absolute (psia) and is less than the MMP but greater than 85 percent of the MMP.
The limitations of the application of the CO2 Prophet reservoir model are inherent due to its application to a high-level assessment for which the current methodology is designed, which includes thousands of reservoirs. Where individual reservoir data are limited, default values must be assumed for certain parameters, and the development scheme was assumed to be a 5-spot vertical well pattern.
14 A Probabilistic Assessment Methodology for Carbon Dioxide Enhanced Oil Recovery and Associated Carbon Dioxide Retention
The geologic characterization of the reservoir must be simplified to uniform layer-cake geology to represent vertical permeability. Information on structural orientation of the individual reservoirs that might indicate amenability to gravity drainage was not available in the CRD. The CO2 Prophet reservoir model may not work well with heavy-oil reservoirs (where the gravity is 22 ºAPI or less), nor with CO2-miscible reservoirs developed with horizontal and deviated wells such as those used to develop fields on the North Slope of Alaska. In addition, the Mungan (1981) correlation curves used to estimate MMP cannot be applied to heavy-oil reservoirs. For heavy-oil fields where CO2 Prophet is inapplicable, a default recovery factor of 5 percent is assumed on the basis of the few values reported in the literature. In other situations, such as recovery from North Slope fields, default values for the recovery factors are taken from the literature.
The application of CO2 Prophet to the suite of miscible carbonate and clastic candidate reservoirs required several simplifying assumptions. The starting point of the CO2-EOR program is the residual oil saturation to water (oil saturation after the waterflood program). For this report, residual oil saturation is defined as the remaining oil saturation (SORW) after a reservoir has undergone waterflood. For the clastic reservoirs, this value has been assumed to be 0.25 (National Petroleum Council, 1984a). For the carbonate reservoirs, the value has been assumed to be 0.305, according to the National Petroleum Council’s study group revision of the residual oil saturation value (Donald Remson, U.S. Department of Energy, written commun., 2015).
The water and CO2 injection rates were set so that the reservoir pressure remains at or above the MMP, but below fracture pressure, given the distance between the two wells, fluid viscosity, permeability, pay thickness, and the production well diameter for a 5-spot pattern (Lyons, 1996, p. 295).5
Operators have observed that the water and CO2 injection rates may decline or remain the same over time and that the changes in injectivity are specific to individual reservoirs and even individual patterns (Holtz, 2014). Because treatments are available to remedy the injectivity losses (Wallace and others, 2013; Holtz, 2014), the methodology assumes that for the purpose of calculating the incremental oil production with EOR, the injection rates would remain constant in time. Another assumption used is that the total volume of CO2 injected is equal to 100 percent of the hydrocarbon pore volume (HCPV; see the “Glossary”).6 On the basis of data presented by Lange (1998), the parameter representing the
residual oil saturation of oil to the solvent CO2 is set at 0.08. Appendix 1 lists the uniform or default values of selected variables used in the application of the CO2 Prophet model that were uniformly applied across all candidate reservoirs.
The Dykstra-Parsons coefficient (VDP, see the “Glossary” for explanation) is a measure of the reservoir heterogeneity in terms of stratification, which is important in modeling recovery efficiency of waterfloods and CO2-EOR projects. It is calculated from permeability measurements made along a vertical direction in core samples (Dykstra and Parsons, 1950; Willhite, 1986; Lake, 1989). Because reservoir VDP values are seldom provided by operators or reported in the literature, the National Petroleum Council’s 1984 study on EOR (National Petroleum Council, 1984a) used a pseudo-Dykstra-Parsons coefficient (see the “Glossary” for explanation). A pseudo-Dykstra-Parsons coefficient was also calculated for the CRD (method described in Carolus and others, 2018, p. 25). An analysis of pseudo-Dykstra-Parsons coefficient values in the CRD found that many of the parameters needed to calculate the pseudo-Dykstra-Parsons coefficient were absent from the Nehring Associates Inc. (2012) database; thus, estimated values or defaulted values were used to generate the pseudo-Dykstra-Parsons coefficient values in the CRD (Carolus and others, 2018, p. 25). The estimates or averages used to generate the pseudo-Dykstra-Parsons coefficient values in the CRD lead to the pseudo-Dykstra-Parsons coefficient being populated consistently at values that were higher than would be expected and greater than VDP values for individual reservoirs that are reported in the literature. Therefore, this assessment methodology relies on the distribution of VDP values in the TORIS database (National Petroleum Council, 1984b). In the TORIS dataset, the VDP values were truncated at 0.5; those values less than 0.5 were assigned a value of 0.5. To produce a more robust distribution for sampling, the TORIS VDP values were randomly sampled or bootstrapped after extrapolating the distribution above 0.5 to below 0.5 in an effort to recover the truncated values. Matching individual reservoirs between the TORIS database and the CRD was not possible due to naming inconsistencies. This situation was similar to that for porosity and SOI, where individual reservoir values were not available in the CRD, and play or province averages were used as default values. For porosity and SOI, the distribution of uncertainty was based on the mean value plus and minus one standard deviation of the data. The same was done for VDP, and the TORIS dataset was used to define an empirical distribution of mean VDP values for the entire country, with a mean of 0.7 and range from 0.51 to 0.89, for use in the RF calculation.5The analytical form provided in Lyons (1996, p. 295) for the 5-spot
configuration is the following: i = [0.003541 × kh(Δp)] / µ[ln(d/rw) − 0.619] where i is the injection rate, in barrels of water per day; k is reservoir permeability, in mD; h is the reservoir pay thickness, in feet; µ is the fluid viscosity (water), in centipoises; d is the distance, in feet, between the injector well and producer well; and rw is the wellbore diameter, in feet. The variable Δp represents the difference between the pressure (in psia) at the injector well and the pressure at the producer well. The pressure at the injector well is greater than the minimum miscibility pressure (MMP) but less than the formation fracture pressure minus the 400 psi allowed for the safety margin; the pressure at the producer well is kept greater than the MMP.
6Under miscible or multicontact miscibility conditions, the injected CO2 partitions between the gas and liquid CO2 phases, swells the oil, and reduces the viscosity of the residual oil; the lighter fractions of the oil vaporize and mix with the CO2 gas phase (Teletzke and others, 2005). Consequently, some of the injected CO2 is produced with the oil, some of it may be produced with the water, and some of it may remain in the formation. The injection of an amount equal to 100 percent of the HCPV does not imply retention of all CO2 that is injected.
4 Methodology 15
A tapered WAG injection program is modeled by CO2 Prophet in the evaluation of the recovery factors for technically recoverable oil attributed to the implementation of the CO2-EOR program (Donald Remson, U.S. Department of Energy, written commun., 2014). For each reservoir, CO2 is injected in three phases having volumes equivalent to 25, 35, and 40 percent of the current HCPV, respectively. To achieve a tapered WAG, a different WAG ratio is specified for each phase. To achieve an injection of CO2 having a volume equivalent to 100 percent of the HCPV, the tapered WAG injection program is divided into three phases, with CO2 injection volumes in phase 1 of 25 percent, phase 2 of 35 percent, and phase 3 of 40 percent. For each phase, a different WAG ratio is specified. The WAG injection ratio in phase 1 is 1:3, the water:gas injection ratio in phase 2 is 1:2, and the water:gas injection ratio in phase 3 is 1:1.5. When the WAG ratio is tapered over the three phases, as indicated here, water is injected in greater cumulative amounts in each phase relative to the CO2 injected.
To illustrate the sensitivity of the recovery factor (RF) to various parameters, such as WAG, injection of CO2 in volumes from 50 to 225 percent of the HCPV, SORW, and the VDP, a case study of the Horseshoe Atoll, Upper Pennsylvanian-Wolfcampian play in the Permian Basin Province in Texas (defined in Ball [1996] as play number 4405; hereinafter, Horseshoe Atoll play) was prepared using the CO2 Prophet reservoir model. The details of the sensitivity study of the four parameters are presented in appendix 2. The analysis provides guidelines to set values for some of the important parameters to be used in reservoir calculations to help compute recovery factors for the assessment of the recoverable oil potential in all reservoirs amenable to the miscible CO2-EOR process within the United States.
The CO2 Prophet model was not run in a manner that would produce a full distribution of RF results for each candidate reservoir. It would be too laborious and time consuming to attempt. However, by relying on representative reservoirs at the play level and generating response functions to minimize model processing for that limited set of reservoirs, the method can approximate distributions of RF for all candidate reservoirs with two orders of magnitude less processing. These concepts are described in the following paragraphs.
For every representative reservoir in a play (typically one clastic reservoir and one carbonate reservoir containing
more than 1 billion STB of OOIP), a response function is prepared, keeping all parameters constant except for SORW and VDP. Figure 3 shows this function as response surfaces for representative carbonate and clastic reservoirs of the Horseshoe Atoll play. Note that, other than the range of variability, preparation of the RF functions does not follow any probability distributions. Also, the RF function is deterministic, not probabilistic. Pairs of VDP and SORW values are taken to cover the range of variability. A distribution of VDP values was generated by sampling the actual empirical TORIS dataset distribution of values with a mean VDP of 0.7 plus and minus one standard deviation of 0.19. The default SORW values used were 0.25, plus and minus 10 percent for clastic reservoirs, and 0.305, plus and minus 10 percent for carbonate reservoirs. The minimum and maximum SORW values are set to plus and minus 10 percent of the default value (0.25 or 0.305) on the basis of a review of SORW data presented by the Interstate Oil Compact Commission (1978, p. 212) for the North Burbank oil field in Oklahoma. A sensitivity analysis of the input parameters used by the CO2 Prophet reservoir model shows that the VDP has a significant influence on the reservoir recovery factor (app. 2). A Beta-PERT distribution with a shape parameter of 4 is used for both VDP and SORW.
For all other reservoirs in a play, CO2 Prophet generates a single recovery factor value by using the reservoir parameters in the CRD for all variables except for VDP and SORW, for which the default values are as described above, that is VDP is 0.7 and SORW is either 0.25 for clastic reservoirs or 0.305 for carbonate reservoirs. For all possible values that any variable can take over the entire reservoir, we used the mean as the single number summarizing the entire distribution of values.
To produce RF results for each play, Monte Carlo simulation is used to sample the response functions 10,000 times to obtain the probability distribution for the RF of the representative reservoir based on the ranges for the VDP and SORW as described above. The resulting range of the RF for the representative reservoir, relative to its mean, is scaled to represent uncertainty about the single values of RF for the remaining reservoirs in the play to produce a distribution of RF values. The use of play-level representative reservoirs to produce these distributions through scaling removes the prohibitively long process of running recovery simulations for every candidate reservoir in the Nation.
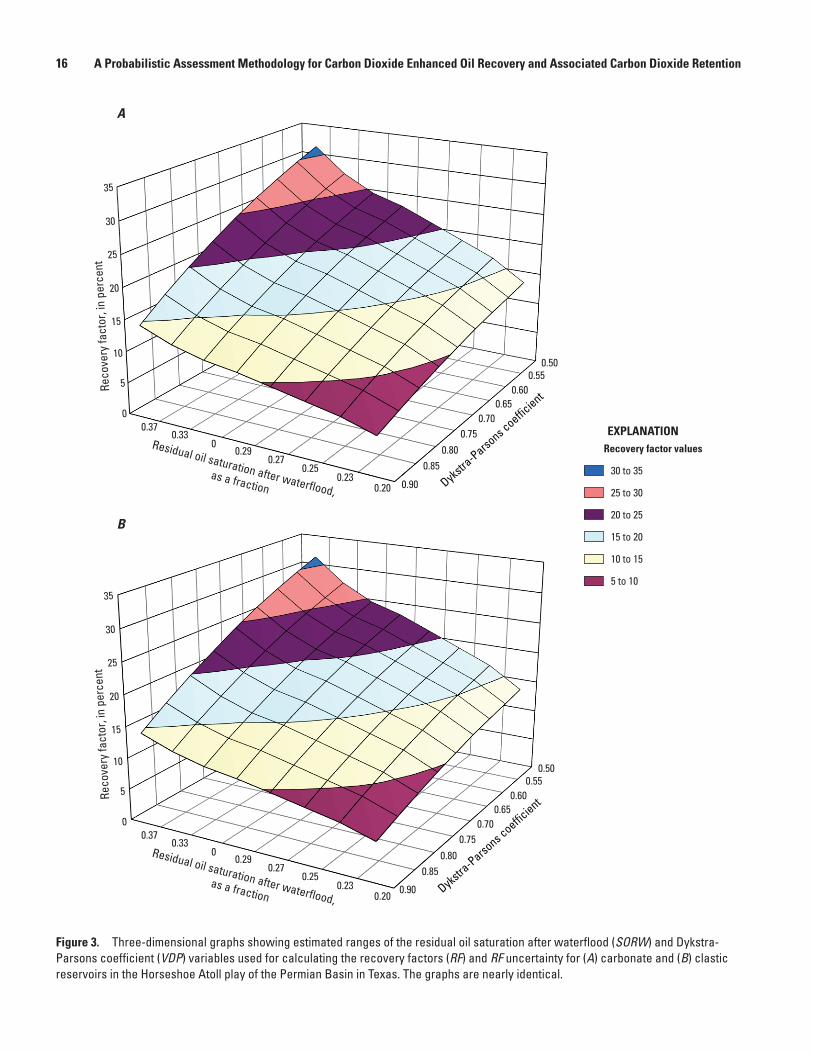
16 A Probabilistic Assessment Methodology for Carbon Dioxide Enhanced Oil Recovery and Associated Carbon Dioxide Retention
0.200.23
0.250.27
0.290
0.330.37
0.500.55
0.600.65
0.700.75
0.800.85
0.90
0
5
10
15
20
25
30
35
Reco
very
fact
or, i
n pe
rcen
t
Residual oil saturation after waterflood,as a fraction
0.200.23
0.250.27
0.290
0.330.37
0.500.55
0.600.65
0.700.75
0.800.85
0.90
0
5
10
15
20
25
30
35
Reco
very
fact
or, i
n pe
rcen
t
Residual oil saturation after waterflood,as a fraction
Dykstra
-Parsons c
oefficient
Dykstra
-Parsons c
oefficient
A
B
Recovery factor values
30 to 35
25 to 30
20 to 25
15 to 20
10 to 15
5 to 10
EXPLANATION
Figure 3. Three-dimensional graphs showing estimated ranges of the residual oil saturation after waterflood (SORW) and Dykstra-Parsons coefficient (VDP) variables used for calculating the recovery factors (RF) and RF uncertainty for (A) carbonate and (B) clastic reservoirs in the Horseshoe Atoll play of the Permian Basin in Texas. The graphs are nearly identical.
4 Methodology 17
4.2.3 Calculation of Additional Oil Recovered by CO2-EOR
To determine the total amount of oil that might be produced by using CO2-EOR for a given reservoir that has passed the screening criteria described in section 4.1, a Monte Carlo simulation is performed; it samples 10,000 times from the OOIP and RF distributions, following equation 1. Summary statistics, including the mean, P5, P50, and P95,
7 or any other percentile, can be calculated directly from this distribution.
4.2.4 Calculation of CO2 RetentionCarbon dioxide retained (trapped) is calculated as the
total injected volume of CO2 minus the CO2 produced. This CO2 retention is the percentage of CO2 injected that is retained in the subsurface as a result of CO2-EOR (Olea, 2015). During the CO2-EOR process, CO2 is removed from the oil production stream, compressed, and injected back into the reservoir. To avoid additional background research needed for this assessment methodology, we assume that increases in CO2 impurities during the recycling process will have no effect on recovery factors. Because of its solubility in oil and formation brine, some CO2 remains in the reservoir and is dissolved in the reservoir fluids. Also, CO2 can be trapped in high-permeability thief zones in the reservoir, and therefore, additional CO2 is required to make up for the losses during the EOR operations. The following are the major ways that CO2 could be retained (sequestered) in the subsurface:
• Occupying reservoir pore space vacated by produced oil and gas, which would be occupied by water at the end of field life if CO2 were not injected;
• Dissolved in residual reservoir oil; and
• Dissolved in connate formation water.The volume of CO2 retained in the reservoir is
determined by multiple factors acting generally in combinations that vary according to the geology of the reservoir and the implementation and type of recovery process
(Olea, 2015). CO2 retention is the percentage of injected8 CO2, measured in thousands of standard cubic feet, that remains in the subsurface as a result of the CO2 flooding; the percentage is calculated as follows:
CO retention CO remaining at subsurface
cumulative CO2
2100
� �
22 injected
(3)
In this methodology, the net CO2 utilization (gross CO2 injection minus the produced CO2 volume) for each reservoir in the play is estimated by using a net CO2 utilization factor per stock tank barrel of oil recovered (at surface conditions) multiplied by the recoverable oil to generate the volume of CO2 (at surface conditions) that will be retained for each value of OOIP simulated by CO2 Prophet. The CO2 retention volume from an individual reservoir will then be aggregated at play, regional, or national levels to help estimate the total carbon sequestration potential associated with CO2-EOR application to conventional oil fields within the United States.
4.3 Probabilistic Estimates and Aggregation
The sections above describe how to generate a probability distribution for the technically recoverable hydrocarbon volumes from CO2-EOR for each reservoir within a play without considering dependencies. To determine the probability distribution at the play level, one cannot simply sum the reservoir distributions without taking dependencies, or correlations, between reservoirs into account. Oil and gas resource assessors have long recognized that correlations between geologic units may be present from geologic similarities, the use of analog data, and human factors that go into the assessment process (for example Delfiner and Barrier, 2008; Schuenemeyer and Gautier, 2010; van Elk and others, 2010; Blondes, Schuenemeyer, and others, 2013). These dependencies are introduced as part of the aggregation process and have a strong effect on the uncertainty of the summed distributions. In general, as the correlations increase, the distributions for the aggregated resources have greater dispersion (Blondes, Schuenemeyer, and others, 2013). A correlation matrix will be generated with values that represent the dependencies between reservoirs according to expert estimates elicited from the assessment geologists (Meyer and Booker, 2001). This matrix is used to induce a rank correlation structure between the reservoir probability distributions as they are combined to form an aggregate sum (Kaufman and others, 2018). An example aggregation for the Horseshoe Atoll play is shown in appendix 3. The effect of correlation coefficient choice for hydrocarbon volume uncertainty is also discussed in appendix 3.
7P5, P50, and P95 are probability percentiles and represent the 5-, 50-, and 95-percent probabilities, respectively, that the true storage resource is less than or equal to the value shown. The terminology used in this report differs from that used by the petroleum industry and follows standard statistical practice (for example, Everitt and Skrondal, 2010), where percentiles, or fractiles, represent the value of a variable below which a certain proportion of observations falls. The percentiles were calculated by using the aggregation method described in U.S. Geological Survey Geologic Carbon Dioxide Storage Resources Assessment Team (2013b) and in Blondes, Schuenemeyer, and others (2013).
8The quantity of injected CO2 used in equation 3 is equivalent to the CO2 that is purchased rather than the gross injected volume, which includes recycled CO2.
18 A Probabilistic Assessment Methodology for Carbon Dioxide Enhanced Oil Recovery and Associated Carbon Dioxide Retention
Appendix 1 summarizes the basic data needed for the assessment at the reservoir level of the incremental oil volume produced by EOR and associated CO2 retention that could result from application of the CO2-EOR process. Appendix 2 describes a sensitivity analysis of RFs of the OOIP for representative (largest) carbonate and clastic reservoirs of the Horseshoe Atoll play. Appendix 3 provides an example of the reservoir calculations and describes how to combine the reservoirs to the USGS play level with correctly propagated uncertainty by using a probabilistic aggregation method.
4.4. Assessment Meetings
To implement this methodology, assessment geologists from the USGS would review the literature, the CRD, and other reservoir data for each province and play in the country. The main purpose of the review is to compare the values in the CRD with the values reported in the literature and by the National Petroleum Council (1984b). The geologic and reservoir input data described in appendixes 1 and 3 would be presented to an assessment panel and agreed upon by unanimous group consensus. If significant discrepancies are found, the new values would be entered into a modified version of the CRD. Completion of the assessment would require that the geologist also elicit correlations for aggregating the resources by play, petroleum province, region, and the Nation.
5 SummaryThis report describes a probabilistic assessment
methodology for estimating the volumes of technically recoverable hydrocarbons that could be produced by using the carbon dioxide enhanced oil recovery (CO2-EOR) method in oil reservoirs of the United States. In addition, the methodology could be used to estimate the net CO2 utilization and the amount of CO2 retained in all oil reservoirs that are suitable for the CO2-EOR process. The methodology does not include a consideration of cost and availability of industrial sources of CO2; it is assumed that there is enough CO2 to flood all screened qualifying reservoirs not yet undergoing some form of tertiary recovery. The additional oil estimated to be produced by CO2-EOR flooding is calculated as a fraction of the original oil in place (OOIP). Such a fraction, technically referred to as the recovery factor, is calculated by using the computer program CO2 Prophet. The application of the methodology heavily relies on the use of the U.S. Geological Survey (USGS) comprehensive resource database. The results are aggregated according to the geographical units of play, petroleum province, region, and country. The methodology was applied to 27 reservoirs in an area of Texas known as the
Horseshoe Atoll, Upper Pennsylvanian-Wolfcampian play, and the resulting estimates of a mean of 430 million barrels of oil recovery and a mean 140 million metric tons of retained CO2 volume (sequestration) are well within the ranges of typical values reported in the literature. This assessment methodology provides a pathway to fulfill the requirements of the Energy Independence and Security Act of 2007 (U.S. Congress, 2007, 121 Stat. 1711) that requested the USGS to estimate the “potential volumes of oil and gas recoverable by injection and sequestration of industrial carbon dioxide in potential sequestration formations.”
6 References CitedThis list includes sources cited in the body of the report
and in the appendixes.Aalund, L.R., 1988, Annual production report—EOR projects
decline but CO2 pushes up production: Oil and Gas Journal, v. 86, p. 33–74.
Advanced Resources International, Inc., 2010, U.S. oil production potential from accelerated deployment of carbon capture and storage—White paper: Advanced Resources International, Inc., March 2010, 51 p., accessed August 10, 2015, at http://www.adv-res.com/pdf/v4ARI%20CCS-CO2-EOR%20whitepaper%20FINAL%204-2-10.pdf.
Al Aryani, F.M., Obeidi, A., Brahmakulam, J.V., and Ramamoorthy, R., 2011, Pulsed neutron monitoring of the first CO2 EOR pilot in the Middle East: Society of Petroleum Engineers, presentation at the Middle East Oil and Gas Show and Conference, Manama, Bahrain, September 25–28, 2011, paper SPE–141490–MS, 15 p.
Alston, R.B., Kokolis, G.P., and James, C.F., 1985, CO2 minimum miscibility pressure─A correlation for impure CO2 streams and live oil systems: Society of Petroleum Engineers Journal, v. 25, no. 2, paper SPE–11959–PA, p. 268–274.
Alvarado, V., and Manrique, E., 2010, Enhanced oil recovery—An update review: Energies, v. 3, p. 1529–1575.
Andrei, M., De Simoni, M., Delbianco, A., Cazzani, P., and Zanibelli, L., 2010, Enhanced oil recovery with CO2 capture and sequestration: Presentation at the World Energy Congress, September 15, 2010, 20 p., accessed October 3, 2016, at http://worldwidescience.org/topicpages/c/co2+enhanced+oil.html.
Anton Paar GmbH, 2018, Viscosity of crude oil, in Anton Paar Wiki: Anton Paar website, accessed April 3, 2018, at https://wiki.anton-paar.com/en/crude-oil/.
6 References Cited 19
Appalachian Oil and Natural Gas Research Consortium, 1996, Enhancement of the TORIS data base of Appalachian Basin oil fields: U.S. Department of Energy [technical report] DOE/MC/28176–1, prepared by Appalachian Oil and Natural Gas Research Consortium, 21 p., accessed Febuary 9, 2018, at http://dx.doi.org/10.2172/251348.
Attanasi, E.D., 2017, Using CO2 Prophet to estimate recovery factors for carbon dioxide enhanced oil recovery, chap. B of Verma, M.K., ed., Three approaches for estimating recovery factors in carbon dioxide enhanced oil recovery: U.S. Geological Survey Scientific Investigations Report 2017–5062, p. B1–B10, accessed July 18, 2017, at https://doi.org/10.3133/sir20175062B.
Attanasi, E.D., and Freeman, P.A., 2016, Play-level distributions of estimates of recovery factors for a miscible carbon dioxide enhanced oil recovery method used in oil reservoirs in the conterminous United States: U.S. Geological Survey Open-File Report 2015–1239, 36 p., accessed October 3, 2016, at https://doi.org/10.3133/ofr20151239.
Azzolina, N.A., Nakles, D.V., Gorecki, C.D., Peck, W.D., Ayash, S.C., Melzer, L.S., and Chatterjee, S., 2015, CO2 storage associated with CO2 enhanced oil recovery—A statistical analysis of historical operations: International Journal of Greenhouse Gas Control, v. 37, p. 384–397, accessed October 24, 2016, at https://doi.org/10.1016/j.ijggc.2015.03.037.
Ball, M.M., 1996, Permian Basin Province (044), in Gautier, D.L., Dolton, G.L., Takahashi, K.I., and Varnes, K.L., 1995 national assessment of United States oil and gas resources—Results, methodology, and supporting data (release 2, 1996): U.S. Geological Survey Digital Data Series DDS–30, 21 p., accessed January 13, 2015, at http://certmapper.cr.usgs.gov/data/noga95/prov44/text/prov44.pdf.
Beeman, W.R., Obuch, R.C., and Brewton, J.D.., comps., 1996, Digital map data, text, and graphical images in support of the 1995 national assessment of United States oil and gas resources: U.S. Geological Survey Digital Data Series DDS–35, 1 CD–ROM.
Blondes, M.S., Brennan, S.T., Merrill, M.D., Buursink, M.L., Warwick, P.D., Cahan, S.M., Cook, T.A., Corum, M.D., Craddock, W.H., DeVera, C.A., Drake, R.M., II, Drew, L.J., Freeman, P.A., Lohr, C.D., Olea, R.A., Roberts-Ashby, T.L., Slucher, E.R., and Varela, B.A., 2013, National assessment of geologic carbon dioxide storage resources—Methodology implementation: U.S. Geological Survey Open–File Report 2013–1055, 26 p., accessed August 10, 2015, at http://pubs.usgs.gov/of/2013/1055/.
Blondes, M.S., Schuenemeyer, J.H., Olea, R.A., and Drew, L.J., 2013, Aggregation of carbon dioxide sequestration storage assessment units: Stochastic Environmental Research and Risk Assessment, v. 27, no. 8, p. 1839–1859.
Brennan, S.T., Burruss, R.C., Merrill, M.D., Freeman, P.A., and Ruppert, L.F., 2010, A probabilistic assessment methodology for the evaluation of geologic carbon dioxide storage: U.S. Geological Survey Open-File Report 2010–1127, 31 p., accessed September 23, 2014, at http://pubs.usgs.gov/of/2010/1127.
British Columbia Oil and Gas Commission, 2014, Policy for determining primary product of oil or gas (update of August 6, 2014): British Columbia Oil and Gas Commission Reservoir Engineering Department website, 1 p., accessed June 11, 2015, at https://www.bcogc.ca/policy-determining-primary-product-oil-or-gas.
Burnside, R.J., 1959, Geology of part of the Horseshoe atoll in Borden and Howard Counties, Texas, chap. B of Pennsylvanian and Lower Permian rocks of parts of west and central Texas: U.S. Geological Survey Professional Paper 315, p. 21–35, accessed October 24, 2016, at http://pubs.usgs.gov/pp/0315b/report.pdf.
Carolus, M., Biglarbigi, K., Warwick, P.D., Attanasi, E.D., Freeman, P.A., and Lohr, C.D., 2018, Overview of a comprehensive resource database for the assessment of recoverable hydrocarbons produced by carbon dioxide enhanced oil recovery (ver. 1.1, June 2018): U.S. Geological Survey Techniques and Methods, book 7, chap. C16, 31 p., accessed June 12, 2018, at https://doi.org/10.3133/tm7C16.
Cornelson, D.W., 1974, Analytical prediction of natural gas reservoir recovery factors: Journal of Canadian Petroleum Technology, v. 13, no. 4 (September–December 1974), paper PETSOC–74–04–01, 9 p.
Cruz Lopez, J.A., 2000, Gas injection as a method for improved recovery in gas-condensate reservoirs with active support: Society of Petroleum Engineers International Petroleum Conference and Exhibition in Mexico, Villahermosa, Mexico, February 1–3, 2000, paper SPE–58981–MS, 4 p.
Delfiner, P., and Barrier, R., 2008, Partial probabilistic addition—A practical approach for aggregating gas resources: SPE Reservoir Evaluation and Engineering, v. 11, no. 2, paper SPE–90129–PA, p. 379–385.
Dobitz, J.K., and Prieditis, J., 1994, A steam tube model for the PC: SPE/DOE Ninth Symposium on Improved Oil Recovery, Tulsa, Okla., April 17–20, 1994, paper SPE–27750–MS, 8 p.
20 A Probabilistic Assessment Methodology for Carbon Dioxide Enhanced Oil Recovery and Associated Carbon Dioxide Retention
Dykstra, H., and Parsons, R.L., 1950, The prediction of oil recovery by water flooding, in Secondary recovery of oil in the United States (2d ed.): New York, American Petroleum Institute, p. 160–174.
Enick, R.M., Olsen, D.K., Ammer, J.R., and Schuller, W., 2012, Mobility and conformance control for CO2 EOR via thickeners, foams, and gels—A literature review of 40 years of research and pilot tests: Society of Petroleum Engineers, SPE 18th Improved Oil Recovery Symposium, Tulsa, Okla., April 14–18, 2012, paper SPE–154122–MS., 12 p., accessed November 21, 2013, at https://doi.org/10.2118/154122-MS.
ESRI, 2007a, U.S. counties (generalized), in ESRI data and maps 2007: Redlands, Calif., ESRI, accessed March 27, 2009, at http://www.esri.com/.
ESRI, 2007b, U.S. states, in ESRI data and maps 2007: Redlands, Calif., ESRI, accessed May 27, 2011, at http://www.esri.com/.
Everitt, B.S., and Skrondal, A., 2010, The Cambridge dictionary of statistics (4th ed.): Cambridge, England, Cambridge University Press, 478 p.
Gaswirth, S.B., Marra, K.R., Lillis, P.G., Mercier, T.J., Leathers-Miller, H.M., Schenk, C.J., Klett, T.R., Le, P.A., Tennyson, M.E., Hawkins, S.J., Brownfield, M.E., Pitman, J.K., and Finn, T.M., 2016, Assessment of undiscovered continuous oil resources in the Wolfcamp shale of the Midland Basin, Permian Basin Province, Texas, 2016: U.S. Geological Survey Fact Sheet 2016–3092, 4 p., accessed September 24, 2018, at https://doi.org/10.3133/fs20163092.
Green, D.W., and Willhite, G.P., 1998, Enhanced oil recovery: Society of Petroleum Engineers Textbook Series, v. 6, 545 p.
Godec, M.L., Kuuskraa, V.A., and Dipietro, P., 2013, Opportunities for using anthropogenic CO2 for enhanced oil recovery and CO2 storage: Energy Fuels, v. 27, no. 8, p. 4183–4189.
Hirasaki, G.J., Morra, F., and Willhite, G.P., 1984, Estimation of reservoir heterogeneity from waterflood performance: Society of Petroleum Engineers, paper SPE–13415–MS, 10 p.
Hirasaki, G., Stewart, W.C., Elkins, L.E., and Willhite, G.P., 1989, Reply to discussion of the 1984 National Petroleum Council studies on EOR: Journal of Petroleum Technology, v. 41, no. 11, paper SPE–20007–PA, p. 1218–1222.
Hite, D.M., 2006, Use of CO2 in EOR—Background and potential application to Cook Inlet oil reservoirs: U.S. Department of Energy, South Central Alaska Energy Forum, Anchorage, Alaska, September 20–21, 2006, 13 p., accessed September 23, 2014, at http://doa.alaska.gov/ogc/reports-studies/EnergyForum/06_ppt_pdfs/27_hite.pdf.
Hoffman, B.T., 2014, Enhanced oil recovery—Modeling examines gas injection results for improving Bakken recovery: The American Oil and Gas Reporter, June 2014, accessed September 7, 2015, at http://www.aogr.com/magazine/cover-story/modeling-examines-gas-injection-results-for-improving-bakken-recovery.
Holm, L.W., 1959, CO2 solvent flooding for increased oil recovery: Petroleum Transactions, AIME, v. 216, paper SPE–1250–G, p. 225–231.
Holm, L.W., and Josendal, V.A., 1974, Mechanisms of oil displacement by carbon dioxide: Journal of Petroleum Technology, v. 26, no. 12, paper SPE–4736–PA, p. 1427–1438.
Holtz, M.H., 2014, Insights and managing CO2 WAG injectivity: Presentation at the 8th Annual CO2 Conference, University of Wyoming, Casper, July 8–10, 2014, 42 p., accessed September 23, 2014, at http://www.uwyo.edu/eori/_files/co2conference14/holtz.pdf.
Hsu, C.-F., Koinis, R.L., and Fox, C.E., 1995, Technology, experience speed CO2 flood design: Oil and Gas Journal, v. 93, no. 44, p. 51–59.
IHS Energy Group, 2011, ENERDEQ U.S. well data: IHS Energy Group, database, accessed January 20, 2011, at http://energy.ihs.com/.
IHS Inc., 2012, PIDM [Petroleum Information Data Model] relational U.S. well data [data current as of December 23, 2011]: Englewood, Colo., IHS Energy Group, database.
International Energy Agency, 2015, Storing CO2 through enhanced oil recovery—Combining EOR with CO2 storage (EO+) for profit: Paris, International Energy Agency Insights Series, 46 p., accessed August 9, 2011, at https://www.iea.org/publications/insights/insightpublications/Storing_CO2_through_Enhanced_Oil_Recovery.pdf.
Interstate Oil Compact Commission, 1978, Determination of residual oil saturation: Oklahoma City, Okla., Interstate Oil Compact Commission, 302 p.
6 References Cited 21
Jahangiri, H.R., and Zhang, D., 2010, Optimization of carbon dioxide sequestration and enhanced oil recovery in oil reservoir: Society of Petroleum Engineers, Western North America Regional Meeting, Anaheim, Calif., May 27–29, 2010, paper SPE–133594–MS, 9 p.
Jahediesfanjani, H., 2017, Application of decline curve analysis to estimate recovery factors for carbon dioxide enhanced oil recovery, chap. C of Verma, M.K., ed., Three approaches for estimating recovery factors in carbon dioxide enhanced oil recovery: U.S. Geological Survey Scientific Investigations Report 2017–5062, p. C1–C20, accessed July 18, 2017, at https://doi.org/10.3133/sir20175062C.
Jarrell, P.M., Fox, C.E., Stein, M.H., and Webb, S.L., 2002, Practical aspects of CO2 flooding: Society of Petroleum Engineers Monograph Series, v. 22, 220 p.
Jensen, J.L., Lake, L.W., Corbett, P.W.M., and Goggin, D.J., 1997, Statistics for petroleum engineers and geoscientists: Upper Saddle River, N.J., Prentice Hall, 390 p.
Jeschke, P.A., Schoeling, L., and Hemmings, J., 2000, CO2 flood potential of California oil reservoirs and possible CO2 sources: Society of Petroleum Engineers, Annual Technical Conference and Exhibition, Dallas, Tex., October 1–4, 2000, paper SPE–63305–MS, 8 p.
Jikich, S.A., Smith, D.H., Sams, W.N., and Bromhal, G.S., 2003, Enhanced gas recovery (EGR) with carbon dioxide sequestration—A simulation study of effects of injection strategy and operational parameters: Society of Petroleum Engineers, Eastern Regional Meeting, Pittsburgh, Pa., September 6–10, 2003, paper SPE–84813–MS, 9 p.
Karacan, C.Ö., 2019a, A fuzzy logic approach for estimating recovery factors of miscible CO2-EOR projects in the United States: Journal of Petroleum Science and Engineering, v. 184, 12 p., accessed October 1, 2019, at https://doi.org/10.1016/j.petrol.2019.106533.
Karacan, C.Ö., 2019b, An ANCOVA model for porosity and its uncertainty for oil reservoirs based on TORIS dataset: Journal of Petroleum Science and Engineering, v. 180, p. 584–593.
Kaufman, G.M., Olea, R.A., Faith, R., and Blondes, M.S., 2018, Probabilistic aggregation of uncertain geological resources: Mathematical Geosciences, v. 50, no. 7, p. 729–752, accessed November 13, 2018, at https://doi.org/10.1007/s11004-018-9747-9.
Khan, C., Amin, R., and Madden, G., 2012, Economic modelling of CO2 injection for enhanced gas recovery and storage—A reservoir simulation study of operational parameters: Energy and Environment Research, v. 2, no. 2, p. 65–82.
Klett, T.R., Schmoker, J.W., Charpentier, R.R., Ahlbrandt, T.S., and Ulmishek, G.F., 2005, Glossary, chap. 25 of U.S. Geological Survey Southwestern Wyoming Province Assessment Team, Petroleum systems and geologic assessment of oil and gas in the Southwestern Wyoming Province, Wyoming, Colorado, and Utah: U.S. Geological Survey Digital Data Series DDS–69–D, 3 p., on CD–ROM. [Also available at http://pubs.usgs.gov/dds/dds-069/dds-069-d/.]
Koottungal, L., ed., 2008, 2008 worldwide EOR survey: Oil and Gas Journal, v. 106, no. 15 (April 21, 2008), p. 47–59.
Koottungal, L., ed., 2010, EOR/heavy oil survey—2010 worldwide EOR survey: Oil and Gas Journal, v. 108, no. 14 (April 19, 2010), p. 41–53.
Koottungal, L., ed., 2012, 2012 worldwide EOR survey: Oil and Gas Journal, v. 110, no. 4 (April 2, 2012), p. 57–69, accessed January 2013, at http://www.ogj.com/articles/print/vol-110/issue-4/general-interest/special-report-eor-heavy-oil-survey/2012-worldwide-eor-survey.html.
Koottungal, L., ed., 2014, 2014 worldwide EOR survey: Oil and Gas Journal, v. 112, no. 4 (April 7, 2014), p. 79–91, accessed September 24, 2019, at https://www.ogj.com/ogj-survey-downloads/worldwide-eor/document/17299687/2014-worldwide-eor-survey.
Kuuskraa, V., and Ferguson, R., 2008, Storing CO2 with enhanced oil recovery: U.S. Department of Energy, National Energy Technology Laboratory DOE/NETL–402/1312/02–07–08, 55 p., accessed August 10, 2015, at http://www.netl.doe.gov/kmd/cds/disk44/D-CO2%20Injection/NETL-402-1312.pdf.
Kuuskraa, V., and Wallace, M., 2014, CO2-EOR set for growth as new CO2 supplies emerge: Oil and Gas Journal, v. 112, no. 4 (April 7, 2014), p. 92–105, accessed August 10, 2015, at http://www.ogj.com/articles/print/volume-112/issue-4/special-report-eor-heavy-oil-survey/co-sub-2-sub-eor-set-for-growth-as-new-co-sub-2-sub-supplies-emerge.html.
Lake, L.W., 1989, Enhanced oil recovery: Englewood Cliffs, N.J., Prentice Hall, 550 p.
Lake, L.W., Johns, R.T., Rossen, W.R., and Pope, G.A., 2014, Fundamentals of enhanced oil recovery: Richardson, Tex., Society of Petroleum Engineers, 496 p.
Lange, E.A., 1998, Correlation and prediction of residual oil saturation for gas injection EOR processes: SPE Reservoir Evaluation and Engineering, v. 1, no. 2, paper SPE–35425–PA, p. 127–133.
Lasater, J.A., 1958, Bubble point pressure correlation: Petroleum Transactions, AIME, v. 213, paper SPE–957–G, p. 379–381.
22 A Probabilistic Assessment Methodology for Carbon Dioxide Enhanced Oil Recovery and Associated Carbon Dioxide Retention
Leonard, J., 1984, Annual production report—EOR set to make significant contribution: Oil and Gas Journal, v. 82, p. 83–90, 92–95, 98–105.
Leonard, J., 1986, Production/enhanced oil recovery report—Increased rate of EOR brightens outlook: Oil and Gas Journal, v. 84, p. 71–89.
Lyons, W.C., ed., 1996, Standard handbook of petroleum and natural gas engineering, volume 2: Houston, Tex., Gulf Publishing Company, 1,090 p.
Mamora, D.D., and Seo, J.G., 2002, Enhanced gas recovery by carbon dioxide sequestration in depleted gas reservoirs: Society of Petroleum Engineers, Annual Technical Conference and Exhibition, San Antonio, Tex., September 29–October 2, 2002, paper SPE–77347–MS, 9 p.
Marra, K.R., Gaswirth, S.B., Schenk, C.J., Leathers-Miller, H.M., Klett, T.R., Mercier, T.J., Le, P.A., Tennyson, M.E., Finn, T.M., Hawkins, S.J., and Brownfield, M.E., 2017, Assessment of undiscovered oil and gas resources in the Spraberry Formation of the Midland Basin, Permian Basin Province, Texas, 2017: U.S. Geological Survey Fact Sheet 2017–3029, 2 p., accessed September 24, 2018, at https://doi.org/10.3133/fs20173029.
Martin, F.D., and Taber, J.J., 1992, Carbon dioxide flooding: Journal of Petroleum Technology, v. 44, no. 4, paper SPE–23564–PA, p. 396–400.
Massachusetts Institute of Technology Energy Initiative, and Bureau of Economic Geology at the University of Texas, Austin, 2010, Role of enhanced oil recovery in accelerating the deployment of carbon capture and sequestration: Cambridge, Mass., Massachusetts Institute of Technology, variously paged, accessed April 13, 2018, at http://energy.mit.edu/publication/role-of-enhanced-oil-recovery-in-accelerating-the-deployment-of-carbon-capture-and-storage/.
McKaskle, R., 2014, A new look at impurities in CO2 for EOR and their consequences: Presentation at the 20th Annual CO2 Flooding Conference, Midland, Tex., December 11–12, 2014, 24 p., accessed August 10, 2015, at http://www.co2conference.net/wp-content/uploads/2014/12/6-McKaskle-Trimeric_-_A_New_Look_at_Impurities_in_CO2_for_EOR_and_their_Consequences.pdf.
Melzer, L.S., 2006, Stranded oil in the residual oil zone: Advanced Resources International and U.S. Department of Energy, Office of Fossil Energy–Office of Oil and Natural Gas, prepared by Melzer Consulting, February 2006, 91 p., accessed August 13, 2019, at http://residualoilzones.com/wp-content/uploads/2018/02/Melzer2006.pdf.
Merchant, D.H., 2010, Life beyond 80—A look at conventional WAG recovery beyond 80% HCPV injection in CO2 tertiary floods: Society of Petroleum Engineers, International Conference on CO2 Capture, Storage, and Utilization, New Orleans, La., November 10–12, 2010, paper SPE–139516–MS, 14 p.
Meyer, M.A., and Booker, J.M., 2001, Eliciting and analyzing expert judgement—A practical guide: Alexandria, Va., ASA–SIAM [American Statistical Association–Society for Industrial and Applied Mathematics], 459 p.
Midwest Geological Sequestration Consortium, 2012, Demonstration of CO2-enhanced oil recovery potential in the Illinois Basin: Midwest Geological Sequestration Consortium Technical Report, 36 p., accessed April 8, 2015, at http://www.sequestration.org/resources/publish/MGSC%20Final%20Phase%20II%20Report.pdf. [Prepared under U.S. Department of Energy cooperative agreement DE–FC26–05NT42588.]
Moritis, G., 1990, CO2 and HC injection lead EOR production increase: Oil and Gas Journal, v. 88, no. 17, p. 49–82.
Moritis, G., 1992, EOR increases 24% worldwide; claims 10% of U.S. production: Oil and Gas Journal, v. 90, no. 16, p. 51–54, 56–58, 60–65, 68–73, 76–79.
Moritis, G., 1994, EOR dips in U.S. but remains a significant factor: Oil and Gas Journal, v. 92, no. 39, p. 51–52, 55–56, 58, 60, 62–69, 72–79.
Moritis, G., 1996, 1996 worldwide EOR survey: Oil and Gas Journal, v. 94, no. 16, p. 45–61.
Moritis, G., 1998, 1998 worldwide EOR survey: Oil and Gas Journal, v. 96, no. 16, p. 60–65, 68–71, 74–77.
Moritis, G., 2000, 2000 worldwide EOR survey: Oil and Gas Journal, v. 98, no. 12, p. 39–42, 44–53, 56–61.
Moritis, G., 2002, 2002 worldwide EOR survey: Oil and Gas Journal, v. 100, no. 15, p. 72–83.
Moritis, G., 2004, EOR continues to unlock oil resources—2004 worldwide EOR survey: Oil and Gas Journal, v. 102, no. 14, pages 48–50, 52–65.
Moritis, G., 2006, 2006 worldwide EOR survey: Oil and Gas Journal, v. 104, no. 15, p. 46–57.
Mungan, N., 1981, Carbon dioxide flooding—Fundamentals: Journal of Canadian Petroleum Technology, v. 20, no. 1, paper PETSOC–81–01–03, p. 87–92.
National Petroleum Council, 1984a, Enhanced oil recovery: Washington D.C., National Petroleum Council, variously paged [285 p.]. [Also available at http://www.npc.org/reports/rby.html.]

6 References Cited 23
National Petroleum Council, 1984b, NPC public database: National Petroleum Council, accessed August 10, 2015, at http://www.netl.doe.gov/research/oil-and-gas/software/databases.
National Petroleum Council, 2011, Onshore conventional oil including EOR, paper #1–5 supplementing Prudent development—Realizing the potential of North America’s abundant natural gas and oil resources: National Petroleum Council paper, 92 p., accessed August 10, 2015, at https://www.npc.org/Prudent_Development-Topic_Papers/1-5_Onshore_Conventional_Oil_Incl_EOR_Paper.pdf.
Nehring Associates Inc., 2012, The significant oil and gas fields of the United States database [data current as of December 2012]: Colorado Springs, Colo., Nehring Associates Inc., database.
O’Brien, J., Kilbride, F., and Lim, F., 2004, Time-lapse 3-D VSP monitoring of a CO2 EOR flood [expanded abs.]: Society of Exploration Geophysicists, SEG International Exposition and 74th Annual Meeting, Denver, Colo., October 10–15, 2004, 4 p., accessed August 10, 2015, at http://library.seg.org/doi/pdf/10.1190/1.1843310.
Oldenburg, C.M., and Benson, S.M., 2002, CO2 injection for enhanced gas production and carbon sequestration: Society of Petroleum Engineers International Petroleum Conference and Exhibition in Mexico, Villahermosa, Mexico, February 10–12, 2002, paper SPE–74367–MS, 10 p.
Olea, R.A., 2011, On the use of the beta distribution in probabilistic resource assessments: Natural Resources Research, v. 20, no. 4, p. 377–388.
Olea, R.A., 2015, CO2 retention values in enhanced oil recovery: Journal of Petroleum Science and Engineering, v. 129, p. 23–28.
Olea, R.A., 2017, Carbon dioxide enhanced oil recovery performance according to the literature, chap. D of Verma, M.K., ed., Three approaches for estimating recovery factors in carbon dioxide enhanced oil recovery: U.S. Geological Survey Scientific Investigations Report 2017–5062, p. D1–D21, accessed July 18, 2017, at https://doi.org/10.3133/sir20175062D.
Raef, A.E., Miller, R.D., Byrnes, A.P., Harrison, W.E., and Franseen, E.K., 2005, Time-lapse seismic monitoring of enhanced oil recovery CO2-flood in a thin carbonate reservoir, Hall-Gurney field, Kansas, U.S.A.: Kansas Geological Survey Open–File Report 2005–24, 7 p., accessed January 7, 2015, at http://www.kgs.ku.edu/Geophysics/OFR/2005/24/Ofr2005-24_AAPG2005_8x11.pdf.
Remson, D., 2010, Storing CO2 and producing domestic crude oil with next generation CO2-EOR technology: U.S. Department of Energy, National Energy Technology Laboratory, report DOE/NETL–2010/1417, 67 p., accessed January 7, 2015, at http://www.netl.doe.gov/File%20Library/Research/Energy%20Analysis/Publications/DOE-NETL-2010-1417-StoringCO2NexGenEOR10.pdf.
Riley, R.A., Harper, J.A., Harrison W.B., III, Barnes, D.A., Nuttall, B.C., Avary, K.L., Wahr, A.M., Baranoski, M.T., Slater, B.E., Harris, D.C., and Kelley, S.R., 2010, Evaluation of CO2-enhanced oil recovery and sequestration opportunities in oil and gas fields in the MRCSP Region—MRCSP Phase II topical report, October 2005–October 2010: Midwest Regional Carbon Sequestration Partnership, 176 p., accessed August 14, 2019, at https://irp-cdn.multiscreensite.com/5b322158/files/uploaded/topical_3_enhanced_oil_recovery.pdf. [Prepared under U.S. Department of Energy cooperative agreement DE–FC26–05NT42589 and OCDO (Ohio Coal Development Office) grant agreement DC–05–13.]
Robl, F.W., Emanuel, A.S., and Van Meter, O.E., Jr., 1986, The 1984 National Petroleum Council estimate of potential EOR for miscible processes: Journal of Petroleum Technology, v. 38, no. 8, paper SPE–13241–PA, p. 875–882.
Roueché, J.N., and Karacan, C.Ö., 2018, Zone identification and oil saturation prediction in a waterflooded field—Residual oil zone, East Seminole Field, Texas, USA, Permian Basin: Society of Petroleum Engineers Improved Oil Recovery Conference, Tulsa, Okla., April 14–18, 2018, paper SPE–190170–MS, 14 p., accessed June 15, 2018, at https://doi.org/10.2118/190170-MS.
Schenk, C.J., Pollastro, R.M., Cook, T.A., Pawlewicz, M.J., Klett, T.R., Charpentier, R.R., and Cook, H.E., 2008, Assessment of undiscovered oil and gas resources of the Permian Basin Province of west Texas and southeast New Mexico, 2007: U.S. Geological Survey Fact Sheet 2007–3115, 4 p., accessed January 13, 2015, at http://pubs.usgs.gov/fs/2007/3115/.
Schlumberger, 2015a, Estimated ultimate recovery, in Schlumberger Oilfield Glossary: Schlumberger website, accessed August 11, 2015, at http://www.glossary.oilfield.slb.com/en/Terms/e/estimated_ultimate_recovery.aspx.
Schlumberger, 2015b, Injectivity test, in Schlumberger Oilfield Glossary: Schlumberger website, accessed August 11, 2015, at http://www.glossary.oilfield.slb.com/Display.cfm?Term=injectivity%20test.
Schlumberger, 2015c, Minimum miscibility pressure, in Schlumberger Oilfield Glossary: Schlumberger website, accessed August 11, 2015, at http://www.glossary.oilfield.slb.com/en/Terms/m/minimum_miscibility_pressure.aspx.
24 A Probabilistic Assessment Methodology for Carbon Dioxide Enhanced Oil Recovery and Associated Carbon Dioxide Retention
Schlumberger, 2015d, Mobility ratio, in Schlumberger Oilfield Glossary: Schlumberger website, accessed August 11, 2015, at http://www.glossary.oilfield.slb.com/en/Terms/m/mobility_ratio.aspx.
Schlumberger, 2015e, Oil formation volume factor, in Schlumberger Oilfield Glossary: Schlumberger website, accessed August 11, 2015, at http://www.glossary.oilfield.slb. com/en/Terms/o/oil_formation_volume_factor.aspx.
Schlumberger, 2015f, Sweep efficiency, in Schlumberger Oilfield Glossary: Schlumberger website, accessed August 11, 2015, at http://www.glossary.oilfield.slb.com/en/Terms/s/sweep_efficiency.aspx.
Schlumberger, 2015g, WAG, in Schlumberger Oilfield Glossary: Schlumberger website, accessed August 11, 2015, at http://www.glossary.oilfield.slb.com/en/Terms/w/wag.aspx.
Schlumberger, 2018, Carbon dioxide, in Schlumberger Oilfield Glossary: Schlumberger website, accessed April 16, 2018, at http://www.glossary.oilfield.slb.com/Terms/c/carbon_dioxide.aspx.
Schmoker, J.W., and Klett, T.R., 2005, U.S. Geological Survey assessment concepts for conventional petroleum accumulations, chap. 19 of U.S. Geological Survey Southwestern Wyoming Province Assessment Team, Petroleum systems and geologic assessment of oil and gas in the Southwestern Wyoming Province, Wyoming, Colorado, and Utah: U.S. Geological Survey Digital Data Series, DDS–69–D, 6 p., accessed August 11, 2015, at http://pubs.usgs.gov/dds/dds-069/dds-069-d/REPORTS/69_D_CH_19.pdf.
Schuenemeyer, J.H., and Gautier, D.L., 2010, Aggregation methodology for the Circum-Arctic resource appraisal: Mathematical Geosciences, v. 42, no. 5, p. 583–594.
Stafford, P.T., 1959, Geology of part of the Horseshoe Atoll in Scurry and Kent Counties, Texas, chap. A of Pennsylvanian and Lower Permian rocks of parts of west and central Texas: U.S. Geological Survey Professional Paper 315, 20 p., accessed October 24, 2016, at http://pubs.usgs.gov/pp/0315a/report.pdf.
Stalkup, F.I., Jr., 1983, Miscible displacement: Society of Petroleum Engineers Monograph 8, 204 p.
Taber, J.J., Martin, F.D., and Seright, R.S., 1997, EOR screening criteria revisited—Part 1: Introduction to screening criteria and enhanced recovery field projects: SPE (Society of Petroleum Engineers) Reservoir Engineering, v. 12, no. 3, paper SPE–35385–PA, p. 189–198.
Teletzke, G.F., Patel, P.D., and Chen, A., 2005, Methodology for miscible gas injection EOR screening: SPE International Improved Oil Recovery Conference in Asia Pacific, Kuala Lumpur, Malaysia, December 5–6, 2005, paper SPE–97650–MS, 11 p.
Tennyson, M.E., Cook, T.A., Charpentier, R.R., Gautier, D.L., Klett, T.R., Verma, M.K., Ryder, R.T., Attanasi, E.D., Freeman, P.A., and Le, P.A., 2012, Assessment of remaining recoverable oil in selected major oil fields of the Permian Basin, Texas and New Mexico: U.S. Geological Survey Fact Sheet 2012–3051, 4 p., accessed January 13, 2015, at http://pubs.usgs.gov/fs/2012/3051/.
Terry, R.E., 2001, Enhanced oil recovery, in Meyers, R.A., ed., Encyclopedia of physical science and technology, 3d edition, v. 18, p. 503–518, accessed January 13, 2015, at http://www.firp.ula.ve/archivos/cuadernos/01_Chap_Terry_EOR.pdf.
Thormahlen, L.F., 1999, Boundary development on the outer continental shelf: Minerals Management Service Mapping and Boundary Branch, OCS report MMS 99–0006, 12 p., accessed August 11, 2015, at http://www.boem.gov/BOEM-Newsroom/Library/Publications/1999/99-0006-pdf.aspx.
Toole, S.T., and Grist, D.M., 2003, Oil and gas recovery behaviour in the UKCS Basins: Society of Petroleum Engineers, Offshore Europe, Aberdeen, United Kingdom, September 2–5, 2003, paper SPE–83982–MS, 9 p.
Tzimas, E., Georgakaki, A., Garcia Cortes, C., and Peteves, S.D., 2005, Enhanced oil recovery using carbon dioxide in the European energy system: Pettern, The Netherlands, European Commission, Directorate-General Joint Research Centre (DG JRC), Institute for Energy, report EUR 21895 EN, December 2005, 118 p., accessed January 13, 2015, at http://science.uwaterloo.ca/~mauriced/earth691-duss/CO2_General%20CO2%20Sequestration%20materilas/CO2_EOR_Misciblein%20Europe21895EN.pdf.
U.S. Congress, 2007, Energy Independence and Security Act of 2007—Public Law 110–140: U.S. Government Printing Office, 311 p., accessed October 30, 2012, at http://frwebgate.access.gpo.gov/cgi-bin/getdoc.cgi?dbname=110_cong_public_laws&docid =f:publ140.110.pdf.
U.S. Congress, 2018, Bipartisan Budget Act of 2018—Public Law 115–123: U.S. Government Printing Office, 250 p., accessed May 17, 2018, at https://www.congress.gov/115/bills/hr1892/BILLS-115hr1892enr.pdf.
6 References Cited 25
U.S. Department of Energy, National Energy Technology Laboratory, 2013, Quality guidelines for energy system studies—CO2 impurity design parameters: U.S. Department of Energy, National Energy Technology Laboratory report DOE/NETL–341/011212, 28 p., accessed September 13, 2016, at https://www.netl.doe.gov/research/energy-analysis/search-publications/vuedetails?id=789.
U.S. Environmental Protection Agency, 2009, Safe Drinking Water Act (SDWA): Washington, D.C., U.S. Environmental Protection Agency website, accessed October 15, 2012, at http://www.epa.gov/ogwdw/sdwa/index.html.
U.S. Environmental Protection Agency, 2018, Overview of greenhouse gases—Carbon dioxide emissions: U.S. Environmental Protection Agency website, accessed August 14, 2019, at https://www.epa.gov/ghgemissions/overview-greenhouse-gases#CO2%20references.
U.S. Geological Survey, 2019, United States assessments of undiscovered oil and gas resources: U.S. Geological Survey Energy Resources Program website, accessed August 14, 2019, at https://www.usgs.gov/centers/cersc/science/united-states-assessments-undiscovered-oil-and-gas-resources?qt-science_center_objects=0#qt-science_center_objects.
U.S. Geological Survey Geologic Carbon Dioxide Storage Resources Assessment Team, 2013a, National assessment of geologic carbon dioxide storage resources—Data (ver. 1.1, September 2013): U.S. Geological Survey Data Series 774, 13 p., plus 2 appendixes and 2 large tables in separate files, accessed September 25, 2013, at http://pubs.usgs.gov/ds/774/. [Supersedes ver. 1.0, released in June 2013.]
U.S. Geological Survey Geologic Carbon Dioxide Storage Resources Assessment Team, 2013b, National assessment of geologic carbon dioxide storage resources—Results (ver. 1.1, September 2013): U.S. Geological Survey Circular 1386, 41 p., accessed September 25, 2013, at http://pubs.usgs.gov/circ/1386/. [Supersedes ver. 1.0, released in June 2013.]
U.S. Geological Survey Geologic Carbon Dioxide Storage Resources Assessment Team, 2013c, National assessment of geologic carbon dioxide storage resources—Summary (ver. 1.1, September 2013): U.S. Geological Survey Fact Sheet 2013–3020, 6 p., accessed September 25, 2013, at http://pubs.usgs.gov/fs/2013/3020/. [Supersedes ver. 1.0, released in June 2013.]
U.S. Geological Survey National Oil and Gas Resource Assessment Team, 1995, 1995 national assessment of United States oil and gas resources: U.S. Geological Survey Circular 1118, 20 p., accessed January 4, 2009, at http://pubs.usgs.gov/circ/1995/circ1118/execsum.html.
van der Meer, L., Kreft, E., Geel, C., and Hartman, J.J., 2005, K12–B—A test site for CO2 storage and enhanced gas recovery: Society of Petroleum Engineers, Europec/EAGE Annual Conference, Madrid, Spain, June 13–16, 2005, paper SPE–94128–MS, 9 p.
van Elk, J.F., Gupta, R., and Wann, D.J., 2010, Probabilistic aggregation of oil and gas field resource estimates and project portfolio analysis: SPE Reservoir Evaluation and Engineering, v. 13, no. 1, paper SPE–116395–PA, p. 72–81.
Verma, M.K., 2015, Fundamentals of carbon dioxide-enhanced oil recovery (CO2-EOR)—A supporting document of the assessment methodology for hydrocarbon recovery using CO2-EOR associated with carbon sequestration: U.S. Geological Survey Open–File Report 2015–1071, 19 p., accessed January 8, 2016, at https://doi.org/10.3133/ofr20151071.
Verma, M.K., ed., 2017, Three approaches for estimating recovery factors in carbon dioxide enhanced oil recovery: U.S. Geological Survey Scientific Investigations Report 2017–5062, variously paged (chap. A–E), accessed July 18, 2017, at https://doi.org/10.3133/sir20175062.
Verma, M.K., and Warwick, P.D., 2011, Development of an assessment methodology for hydrocarbon recovery potential using carbon dioxide and associated carbon sequestration—Workshop findings: U.S. Geological Survey Fact Sheet 2011–3075, 2 p., accessed July 25, 2011, at http://pubs.usgs.gov/fs/2011/3075/.
Vose, D., 1996, Quantitative risk analysis—A guide to Monte Carlo simulation modelling: New York, Wiley, 328 p.
Wallace, M., Kuuskraa, V.A., and DiPietro, P., 2013, An in-depth look at “next generation” CO2-EOR technology: Washington, D.C., U.S. Department of Energy, National Energy Technology Laboratory, 207 p., accessed February 2, 2015, at http://www.netl.doe.gov/File%20Library/Research/Energy%20Analysis/Publications/Disag-Next-Gen-CO2-EOR_full_v6.pdf.
Walsh, M.P., and Lake, L.W., 2003, A generalized approach to primary hydrocarbon recovery— Handbook of petroleum exploration and production, no. 4: Amsterdam, Elsevier, 640 p.
Wickham, H., 2009, ggplot2—Elegant graphics for data analysis: New York, Springer-Verlag New York, 213 p.
Willhite, G.P., 1986, Waterflooding: Society of Petroleum Engineers Textbook Series, v. 3, 326 p.
26 A Probabilistic Assessment Methodology for Carbon Dioxide Enhanced Oil Recovery and Associated Carbon Dioxide Retention
7 GlossaryThe following definitions are modified from Brennan
and others (2010), U.S. Geological Survey Geologic Carbon Dioxide Storage Resources Assessment Team (2013b), and other sources indicated.
assessment unit (AU) Since 2000, the U.S. Geological Survey Energy Resources Program National Oil and Gas Assessment has used subdivisions of the total petroleum system, termed assessment units, as the basic level of assessment for undiscovered petroleum resources. An assessment unit is a mappable volume of rock within a total petroleum system that encompasses accumulations (discovered and undiscovered) that share similar geologic traits and socio-economic factors. A total petroleum system consists of all genetically related petroleum generated by a pod or closely related pods of mature source rocks (Schmoker and Klett, 2005). In contrast, the U.S. Geological Survey National Oil and Gas Resource Assessment Team (1995) used the play as the basic assessment unit.barrel of oil equivalent (BOE) A unit of petroleum volume in which the gas part is expressed in terms of its energy equivalent in barrels of oil. For this assessment, the energy equivalent (not the volume equivalent) of 6,000 standard cubic feet of natural gas equals 1 barrel of oil equivalent (Klett and others, 2005).Beta-PERT distribution A Beta-PERT (Program Evaluation and Review Technique) distribution is a three-parameter special case of the four-parameter Beta distribution, both varying within finite intervals (for example Vose, 1996). Olea (2011) showed that the Beta distribution, with finite minima and maxima like the triangular distribution, can better represent the shape of distributions found in nature such as the truncated normal or the lognormal. The Beta-PERT distribution was found to be a good compromise between the triangular and the Beta distributions because, like the triangular distribution, only three parameters (minimum, most likely, and maximum) must be specified, but it can still mimic distributions typical for geologic data like the Beta, normal, and lognormal distributions (Blondes, Brennan, and others, 2013). carbon dioxide (CO2) An odorless gas that is widely distributed in nature and is a minor component of air. It is highly soluble in water and oil under pressure. Carbon dioxide is the primary greenhouse gas emitted through human activities such as the combustion of fossil fuels (coal, natural gas, and oil) for energy and transportation, although certain industrial processes and land-use changes also emit
CO2 (Schlumberger, 2018; U.S. Environmental Protection Agency, 2018). carbon sequestration Both natural and deliberate processes by which CO2 is either removed from the atmosphere or diverted from emission sources and stored in the ocean, terrestrial environments (vegetation, soils, and sediment), and geologic formations.continuous accumulation A petroleum accumulation that is pervasive throughout a large area, that is not significantly affected by hydrodynamic influences, and for which the chosen methodology for assessment of sizes and number of discrete accumulations is not appropriate. Continuous accumulations lack well-defined down-dip water contacts. The terms “continuous accumulation” and “continuous-type accumulation” are used interchangeably (Klett and others, 2005). Continuous accumulations are also known as unconventional accumulations.conventional accumulation A discrete accumulation commonly bounded by a down-dip water contact and significantly affected by the buoyancy of petroleum in water. This geologic definition does not involve factors such as water depth, regulatory status, or engineering techniques (Klett and others, 2005).enhanced oil recovery (EOR) Injection of steam, gas, or other chemical compounds into hydrocarbon reservoirs to stimulate the production of usable oil beyond what is possible through natural pressure, water injection, and pumping at the wellhead.estimated ultimate recovery (EUR) The “Schlumberger Oilfield Glossary” (Schlumberger, 2015a) defined estimated ultimate recovery (EUR) as follows: “The amount of oil and gas expected to be economically recovered from a reservoir or field by the end of its producing life. Estimated ultimate recovery can be referenced to a well, a field, or a basin.”Dykstra-Parsons coefficient (VDP) The Dykstra-Parsons coefficient (Dykstra and Parsons, 1950; Willhite, 1986; Lake, 1989) is a measure of the vertical reservoir heterogeneity, which is important in modeling recovery efficiency of waterfloods and CO2-EOR projects. It is calculated from permeability measurements obtained from core samples. A completely homogeneous reservoir has a Dykstra-Parsons coefficient value of zero, whereas an infinitely heterogeneous reservoir has a Dykstra-Parsons coefficient value of one. For most reservoirs, the Dykstra-Parsons coefficient ranges from 0.5 to 0.9 (Willhite, 1986; Jensen and others, 1997). For this assessment methodology, the variability of VDP for each reservoir was set at a fixed range of 0.51 to 0.89.
7 Glossary 27
federally owned offshore submerged lands Federal jurisdiction for offshore submerged lands begins at 3 geographic (nautical) miles from the established baseline for the coast and extends to an outer limit of 200 nautical miles. However, there are special cases. Because of claims existing at the dates of statehood, Texas and the Gulf Coast of Florida have proprietary interest in a submerged belt of land, 9 geographic miles wide, extending seaward along the coast (Thormahlen, 1999). Resource assessments in federally owned offshore areas are typically done by the Bureau of Ocean Energy Management (BOEM).formation volume factor for oil (FVFo) The “Schlumberger Oilfield Glossary” (Schlumberger, 2015e) defined the oil formation volume factor as follows: “Oil and dissolved gas volume at reservoir conditions divided by oil volume at standard conditions. Since most measurements of oil and gas production are made at the surface, and since the fluid flow takes place in the formation, volume factors are needed to convert measured surface volumes to reservoir conditions. Oil formation volume factors are almost always greater than 1.0 because the oil in the formation usually contains dissolved gas that comes out of solution in the wellbore with dropping pressure.”gas:oil ratio (GOR) Ratio of gas to oil (in standard cubic feet per stock tank barrel, Scf/STB) in a hydrocarbon accumulation. The GOR is calculated by using volumes of gas and oil at surface conditions.gas reservoir A subsurface accumulation of hydrocarbons primarily in the gas phase that is contained in porous or fractured rock formations. A gas reservoir in the comprehensive resource database (CRD) used for this assessment methodology was defined by Carolus and others (2018, p. 13) as having greater than 10,000 standard cubic feet (Scf) of natural gas per stock tank barrel (STB) of oil. This classification conforms to the demonstrated CO2-EOR projects listed in Koottungal (2012, 2014) and is used by some regulatory agencies to determine the primary product of hydrocarbon reservoirs (British Columbia Oil and Gas Commission, 2014). This value is lower than the 20,000 Scf per STB of oil used in U.S. Geological Survey (USGS) assessments of undiscovered oil and gas resources (Klett and others, 2005).geologic storage of CO2 A type of carbon sequestration that utilizes the long-term retention of carbon dioxide in subsurface geologic formations. gross CO2 utilization In a CO2-EOR project, gross CO2 utilization includes the total amount of CO2 injected, which incorporates both purchased and recycled CO2 volumes into the calculation (Azzolina and others, 2015). hydrocarbon pore volume (HCPV) The total interstitial space in a reservoir occupied by oil and gas. It usually refers to the original reservoir conditions.
initial oil saturation (SOI) The fraction (0–1) of pore space in an oil reservoir occupied by oil prior to production. injectivity The “Schlumberger Oilfield Glossary” (Schlumberger, 2015b) defined an injectivity test as a procedure that is used to determine “the rate and pressure at which fluids can be pumped into the treatment target without fracturing the formation.”known recovery production volume (KR) The cumulative petroleum production and proved reserves for a given reservoir.minimum miscibility pressure (MMP) The “Schlumberger Oilfield Glossary” (Schlumberger, 2015c) defined minimum miscibility pressure as follows: “At constant reservoir temperature and composition, the lowest pressure at which first- or multiple-contact miscibility (dynamic miscibility) can be achieved. At minimum miscibility pressure, the interfacial tension is zero and no interface exists between the fluids.”minimum size The lower limit for inclusion of oil and gas field information in assessment calculations. Following USGS oil and gas assessment methodology (Schmoker and Klett, 2005), volumetric data from accumulations with less than 0.5 million barrels of oil equivalent total production were not included in any of the calculations in the methodology used for this assessment.mobility ratio The “Schlumberger Oilfield Glossary” (Schlumberger, 2015d) defined mobility ratio as follows: “The mobility of an injectant divided by that of the fluid it is displacing, such as oil. The mobility of the oil is defined ahead of the displacement front while that of the injectant is defined behind the displacement front, so the respective effective permeability values are evaluated at different saturations.”National Oil and Gas Assessment (NOGA) The U.S. Geological Survey National Oil and Gas Assessment (NOGA) team provides periodic assessments of the oil and natural gas endowment of the United States. New, prioritized assessment results, as required by the Energy Policy and Conservation Act (EPCA), and current assessments of undiscovered oil and gas resources are described at https://www.usgs.gov/centers/cersc/science/united-states-assessments-undiscovered-oil-and-gas-resources?qt-science_center_objects=0#qt-science_center_objects (U.S. Geological Survey, 2019). Additional assessment results and methodology updates will be posted on the website as they become available. net CO2 utilization factor In a CO2-EOR project, the net CO2 utilization factor is calculated as the quantity of gross CO2 injected minus the CO2 produced divided by the oil in barrels produced. Net CO2 utilization does not include the recycled CO2 component and incorporates only the purchased CO2 volumes into the calculation (Azzolina and others, 2015).
28 A Probabilistic Assessment Methodology for Carbon Dioxide Enhanced Oil Recovery and Associated Carbon Dioxide Retention
oil reservoir A subsurface accumulation of hydrocarbons composed primarily of oil that is contained in porous or fractured rock formations. An oil reservoir in the comprehensive resource database (CRD) used for this assessment methodology was defined by Carolus and others (2018, p. 13) as having less than or equal to 10,000 standard cubic feet (Scf) of natural gas per stock tank barrel (STB) of oil. This classification conforms to the demonstrated CO2-EOR projects listed in Koottungal (2012, 2014) and is used by some regulatory agencies to determine the primary product of hydrocarbon reservoirs (British Columbia Oil and Gas Commission, 2014). This value is lower than 20,000 Scf per STB of oil used in USGS assessments of undiscovered oil and gas resources (Klett and others, 2005).original oil in place (OOIP) The volume of original oil in a reservoir prior to production. Typically, the units are in thousands of stock tank barrels (Mbbl in STB).pattern A pattern is a surface configuration or arrangement of injector and production wells.percentile In values sorted by increasing magnitude, any of the 99 dividers that produce exactly 100 groups with equal number of values (Everitt and Skrondal, 2010). The dividers are used to denote the proportion of values above and below them. The dividers are sequential integer numbers starting from the one between the two groups with the lowest values. For example, in the modeling of sequestration capacity, a 95th percentile of 10 gigatons (Gt) denotes that 10 Gt divides all likely values into 95 percent of them equal to or below 10 Gt and 5 percent above it.permeability (k) A measure of the ability of a rock to permit fluids to be transmitted through it; it is controlled by pore size, pore throat geometry, and pore connectivity. Permeability is typically reported in darcies.play A set of known or postulated oil and (or) gas accumulations sharing similar geologic, geographic, and temporal properties, such as source rock, migration patterns, timing, trapping mechanism, and hydrocarbon type. Confirmed plays are plays where one or more accumulations of minimum size (1 million barrels of oil or 6 billion cubic feet of gas) have been discovered in the play (U.S. Geological Survey National Oil and Gas Resource Assessment Team, 1995). Since 2000, the U.S. Geological Survey Energy Resources Program oil and gas assessments have used subdivisions of the total petroleum system, termed assessment units, as the basic level of assessment. A total petroleum system consists of all genetically related petroleum generated by a pod or closely related pods of mature source rocks (Schmoker and Klett, 2005). porosity (Ø) The part of a rock that is occupied by voids or pores. Pores can be connected by passages called pore throats, which allow for fluid flow, or pores can be isolated and inaccessible to fluid flow. These conditions can be overcome by hydraulic fracture stimulation wherein the pores are forcibly connected with high-pressure fluid injection and
propping open of the induced fracture. Porosity is typically reported as a volume, fraction, or percentage of the rock.pressure gradient The change in pore pressure per unit depth, typically in units of pound-force per square inch per foot (psi/ft or lbf/in2/ft), kilopascals per meter (kPa/m), or bars per meter (bar/m).pseudo-Dykstra-Parsons coefficient An estimate of the Dykstra-Parsons coefficient. A pseudo-Dykstra-Parsons coefficient may be computed from the calculated waterflood sweep efficiency and mobility ratio (Robl and others, 1986; Hirasaki and others, 1989). The procedure was used for the National Petroleum Council’s 1984 study on enhanced oil recovery (National Petroleum Council, 1984a). The basic data for the relationships among pseudo-Dykstra-Parsons values, sweep efficiency, and mobility ratios were presented in graphical form in Willhite (1986) and Hirasaki and others (1984). For the comprehensive resource database (CRD), the graphical data of Willhite (1986) and Hirasaki and others (1984) were transferred into tabular data form and interpolated with a two-dimensional function (Carolus and others, 2018, p. 25). residual oil saturation after waterflood (SORW) At the conclusion of waterflooding of a reservoir, the fraction (0–1) of pore space still occupied by oil in those parts of the reservoir effectively flooded.residual oil zone (ROZ) The interval of the reservoir below the oil-water contact where oil saturation varies from its highest value in the upper section to almost approaching zero percent at the base of the interval.seal A geologic feature that inhibits the mixing or migration of fluids and gases between adjacent geologic units. A seal is typically a rock unit or a fault; it can be a top seal, inhibiting upward flow of buoyant fluids, or a lateral seal, inhibiting the lateral flow of buoyant fluids. seal formation The confining rock unit within the storage assessment unit. The seal formation is a rock unit that sufficiently overlies the carbon dioxide (CO2) storage formation and where managed properly has a capillary entrance pressure low enough to effectively inhibit the upward buoyant flow of CO2 (Brennan and others, 2010).State offshore submerged lands State jurisdiction for offshore submerged lands begins at the established baseline for the coast and extends seaward 3 geographic (nautical) miles. However, there are special cases. Because of claims existing at the dates of statehood, Texas and the Gulf Coast of Florida have proprietary interest in a submerged belt of land, 9 geographic miles wide, extending seaward along the coast (Thormahlen, 1999).storage assessment unit (SAU) A mappable volume of rock that includes two main components: (1) the storage formation, which is a reservoir for CO2 storage, and (2) a regional seal formation (Brennan and others, 2010).

7 Glossary 29
supercritical state A condition in which distinct liquid and gas phases of a fluid do not exist because of special conditions of pressure and temperature.sweep efficiency The “Schlumberger Oilfield Glossary” (Schlumberger, 2015f) defined sweep efficiency as follows: “A measure of the effectiveness of an enhanced oil recovery process that depends on the volume of the reservoir contacted by the injected fluid. The volumetric sweep efficiency is an overall result that depends on the injection pattern selected, off-pattern wells, fractures in the reservoir, position of gas-oil and oil/water contacts, reservoir thickness, permeability and areal and vertical heterogeneity, mobility ratio, density difference between the displacing and the displaced fluid, and flow rate.” It is measured in percent.
total dissolved solids (TDS) The quantity of dissolved material in a sample of water, usually expressed in milligrams per liter (mg/L). trapping The physical and geochemical processes by which injected CO2 is retained in the subsurface.water alternating with gas (WAG) The “Schlumberger Oilfield Glossary” (Schlumberger, 2015g) defined WAG as follows: “An enhanced oil recovery process whereby water injection and gas injection are carried out alternately for periods of time to provide better sweep efficiency and reduce gas channeling from [the] injector [well] to [a] producer [well]. This process is used mostly in CO2 floods to improve hydrocarbon contact time and sweep efficiency of the CO2.”
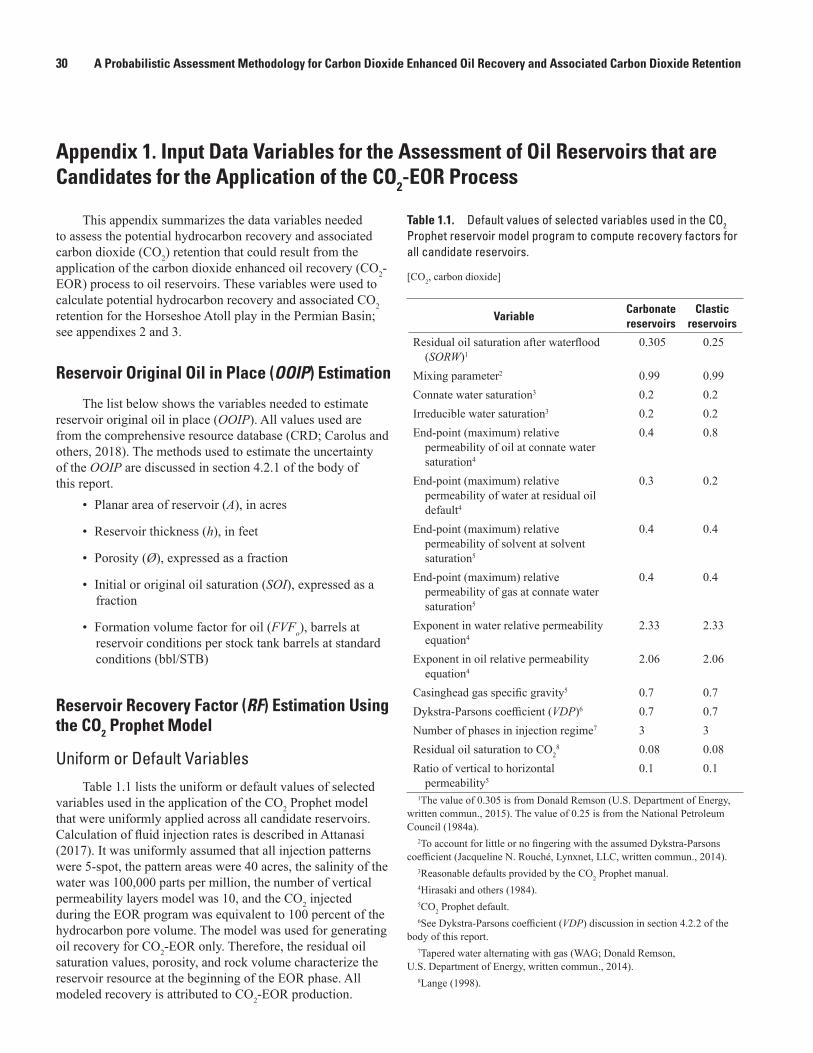
30 A Probabilistic Assessment Methodology for Carbon Dioxide Enhanced Oil Recovery and Associated Carbon Dioxide Retention
Appendix 1. Input Data Variables for the Assessment of Oil Reservoirs that are Candidates for the Application of the CO2-EOR Process
This appendix summarizes the data variables needed to assess the potential hydrocarbon recovery and associated carbon dioxide (CO2) retention that could result from the application of the carbon dioxide enhanced oil recovery (CO2-EOR) process to oil reservoirs. These variables were used to calculate potential hydrocarbon recovery and associated CO2 retention for the Horseshoe Atoll play in the Permian Basin; see appendixes 2 and 3.
Reservoir Original Oil in Place (OOIP) Estimation
The list below shows the variables needed to estimate reservoir original oil in place (OOIP). All values used are from the comprehensive resource database (CRD; Carolus and others, 2018). The methods used to estimate the uncertainty of the OOIP are discussed in section 4.2.1 of the body of this report.
• Planar area of reservoir (A), in acres
• Reservoir thickness (h), in feet
• Porosity (Ø), expressed as a fraction
• Initial or original oil saturation (SOI), expressed as a fraction
• Formation volume factor for oil (FVFo), barrels at reservoir conditions per stock tank barrels at standard conditions (bbl/STB)
Reservoir Recovery Factor (RF) Estimation Using the CO2 Prophet Model
Uniform or Default VariablesTable 1.1 lists the uniform or default values of selected
variables used in the application of the CO2 Prophet model that were uniformly applied across all candidate reservoirs. Calculation of fluid injection rates is described in Attanasi (2017). It was uniformly assumed that all injection patterns were 5-spot, the pattern areas were 40 acres, the salinity of the water was 100,000 parts per million, the number of vertical permeability layers model was 10, and the CO2 injected during the EOR program was equivalent to 100 percent of the hydrocarbon pore volume. The model was used for generating oil recovery for CO2-EOR only. Therefore, the residual oil saturation values, porosity, and rock volume characterize the reservoir resource at the beginning of the EOR phase. All modeled recovery is attributed to CO2-EOR production.
Table 1.1. Default values of selected variables used in the CO2 Prophet reservoir model program to compute recovery factors for all candidate reservoirs.
[CO2, carbon dioxide]
VariableCarbonate reservoirs
Clastic reservoirs
Residual oil saturation after waterflood (SORW)1
0.305 0.25
Mixing parameter2 0.99 0.99Connate water saturation3 0.2 0.2Irreducible water saturation3 0.2 0.2End-point (maximum) relative
permeability of oil at connate water saturation4
0.4 0.8
End-point (maximum) relative permeability of water at residual oil default4
0.3 0.2
End-point (maximum) relative permeability of solvent at solvent saturation5
0.4 0.4
End-point (maximum) relative permeability of gas at connate water saturation5
0.4 0.4
Exponent in water relative permeability equation4
2.33 2.33
Exponent in oil relative permeability equation4
2.06 2.06
Casinghead gas specific gravity5 0.7 0.7Dykstra-Parsons coefficient (VDP)6 0.7 0.7Number of phases in injection regime7 3 3Residual oil saturation to CO2
8 0.08 0.08Ratio of vertical to horizontal
permeability50.1 0.1
1The value of 0.305 is from Donald Remson (U.S. Department of Energy, written commun., 2015). The value of 0.25 is from the National Petroleum Council (1984a).
2To account for little or no fingering with the assumed Dykstra-Parsons coefficient (Jacqueline N. Rouché, Lynxnet, LLC, written commun., 2014).
3Reasonable defaults provided by the CO2 Prophet manual.4Hirasaki and others (1984).5CO2 Prophet default.6See Dykstra-Parsons coefficient (VDP) discussion in section 4.2.2 of the
body of this report.7Tapered water alternating with gas (WAG; Donald Remson,
U.S. Department of Energy, written commun., 2014).8Lange (1998).

Appendix 1 31
Reservoir-Specific VariablesThe list below shows the reservoir-specific variables
used by the CO2 Prophet model. All values are from the comprehensive resource database (CRD; Carolus and others, 2018).
• Viscosity of water, in centipoise (cP)
• Viscosity of oil, in cP
• Formation volume factor for oil (FVFo), barrels at reservoir conditions per stock tank barrels at standard conditions (bbl/STB)
• American Petroleum Institute oil gravity (oAPI), in degrees
• Reservoir temperature, in degrees Fahrenheit
• Reservoir pressure, in pound-force per square inch absolute (psia)
• Minimum miscibility pressure (MMP), in psia
• Average permeability (k), in darcies or millidarcies
• Reservoir thickness (h), in feet
• Porosity (Ø), expressed as a fraction
Appendix 1
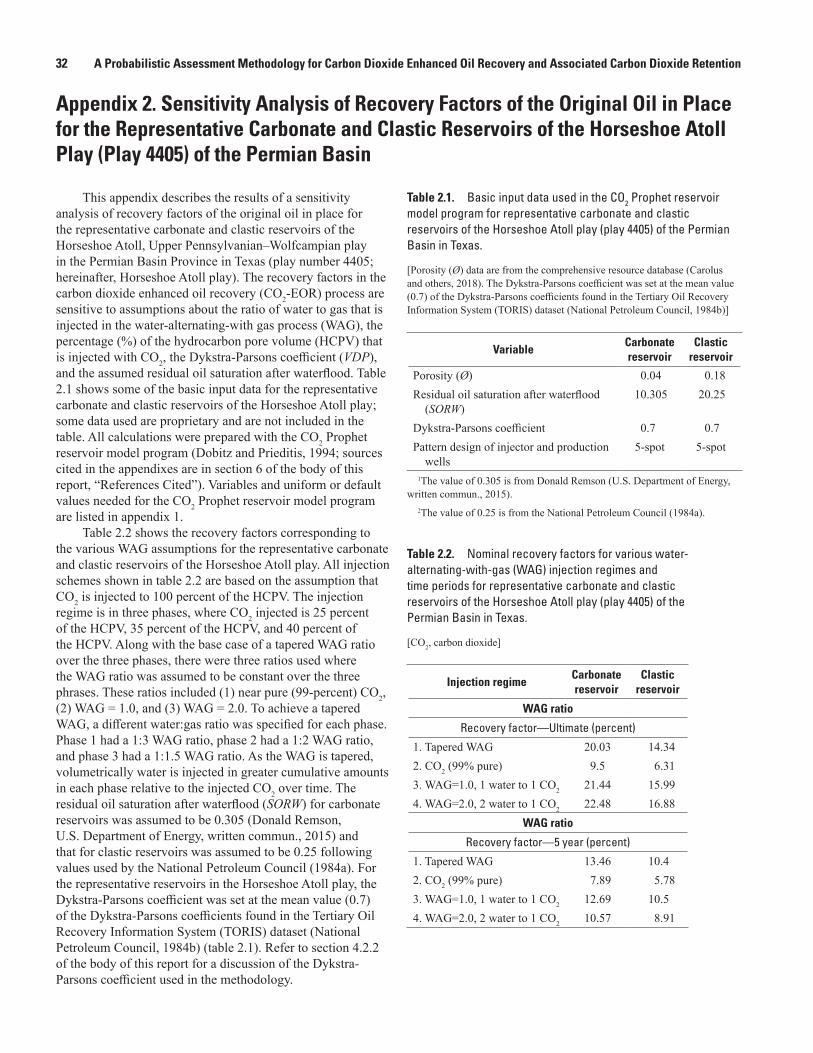
32 A Probabilistic Assessment Methodology for Carbon Dioxide Enhanced Oil Recovery and Associated Carbon Dioxide Retention
Appendix 2. Sensitivity Analysis of Recovery Factors of the Original Oil in Place for the Representative Carbonate and Clastic Reservoirs of the Horseshoe Atoll Play (Play 4405) of the Permian Basin
This appendix describes the results of a sensitivity analysis of recovery factors of the original oil in place for the representative carbonate and clastic reservoirs of the Horseshoe Atoll, Upper Pennsylvanian–Wolfcampian play in the Permian Basin Province in Texas (play number 4405; hereinafter, Horseshoe Atoll play). The recovery factors in the carbon dioxide enhanced oil recovery (CO2-EOR) process are sensitive to assumptions about the ratio of water to gas that is injected in the water-alternating-with gas process (WAG), the percentage (%) of the hydrocarbon pore volume (HCPV) that is injected with CO2, the Dykstra-Parsons coefficient (VDP), and the assumed residual oil saturation after waterflood. Table 2.1 shows some of the basic input data for the representative carbonate and clastic reservoirs of the Horseshoe Atoll play; some data used are proprietary and are not included in the table. All calculations were prepared with the CO2 Prophet reservoir model program (Dobitz and Prieditis, 1994; sources cited in the appendixes are in section 6 of the body of this report, “References Cited”). Variables and uniform or default values needed for the CO2 Prophet reservoir model program are listed in appendix 1.
Table 2.2 shows the recovery factors corresponding to the various WAG assumptions for the representative carbonate and clastic reservoirs of the Horseshoe Atoll play. All injection schemes shown in table 2.2 are based on the assumption that CO2 is injected to 100 percent of the HCPV. The injection regime is in three phases, where CO2 injected is 25 percent of the HCPV, 35 percent of the HCPV, and 40 percent of the HCPV. Along with the base case of a tapered WAG ratio over the three phases, there were three ratios used where the WAG ratio was assumed to be constant over the three phrases. These ratios included (1) near pure (99-percent) CO2, (2) WAG = 1.0, and (3) WAG = 2.0. To achieve a tapered WAG, a different water:gas ratio was specified for each phase. Phase 1 had a 1:3 WAG ratio, phase 2 had a 1:2 WAG ratio, and phase 3 had a 1:1.5 WAG ratio. As the WAG is tapered, volumetrically water is injected in greater cumulative amounts in each phase relative to the injected CO2 over time. The residual oil saturation after waterflood (SORW) for carbonate reservoirs was assumed to be 0.305 (Donald Remson, U.S. Department of Energy, written commun., 2015) and that for clastic reservoirs was assumed to be 0.25 following values used by the National Petroleum Council (1984a). For the representative reservoirs in the Horseshoe Atoll play, the Dykstra-Parsons coefficient was set at the mean value (0.7) of the Dykstra-Parsons coefficients found in the Tertiary Oil Recovery Information System (TORIS) dataset (National Petroleum Council, 1984b) (table 2.1). Refer to section 4.2.2 of the body of this report for a discussion of the Dykstra-Parsons coefficient used in the methodology.
Table 2.1. Basic input data used in the CO2 Prophet reservoir model program for representative carbonate and clastic reservoirs of the Horseshoe Atoll play (play 4405) of the Permian Basin in Texas.
[Porosity (Ø) data are from the comprehensive resource database (Carolus and others, 2018). The Dykstra-Parsons coefficient was set at the mean value (0.7) of the Dykstra-Parsons coefficients found in the Tertiary Oil Recovery Information System (TORIS) dataset (National Petroleum Council, 1984b)]
VariableCarbonate reservoir
Clastic reservoir
Porosity (Ø) 0.04 0.18Residual oil saturation after waterflood
(SORW)10.305 20.25
Dykstra-Parsons coefficient 0.7 0.7Pattern design of injector and production
wells5-spot 5-spot
1The value of 0.305 is from Donald Remson (U.S. Department of Energy, written commun., 2015).
2The value of 0.25 is from the National Petroleum Council (1984a).
Table 2.2. Nominal recovery factors for various water-alternating-with-gas (WAG) injection regimes and time periods for representative carbonate and clastic reservoirs of the Horseshoe Atoll play (play 4405) of the Permian Basin in Texas.
[CO2, carbon dioxide]
Injection regimeCarbonate reservoir
Clastic reservoir
WAG ratio
Recovery factor—Ultimate (percent)
1. Tapered WAG 20.03 14.342. CO2 (99% pure) 9.5 6.313. WAG=1.0, 1 water to 1 CO2 21.44 15.994. WAG=2.0, 2 water to 1 CO2 22.48 16.88
WAG ratio
Recovery factor—5 year (percent)
1. Tapered WAG 13.46 10.42. CO2 (99% pure) 7.89 5.783. WAG=1.0, 1 water to 1 CO2 12.69 10.54. WAG=2.0, 2 water to 1 CO2 10.57 8.91
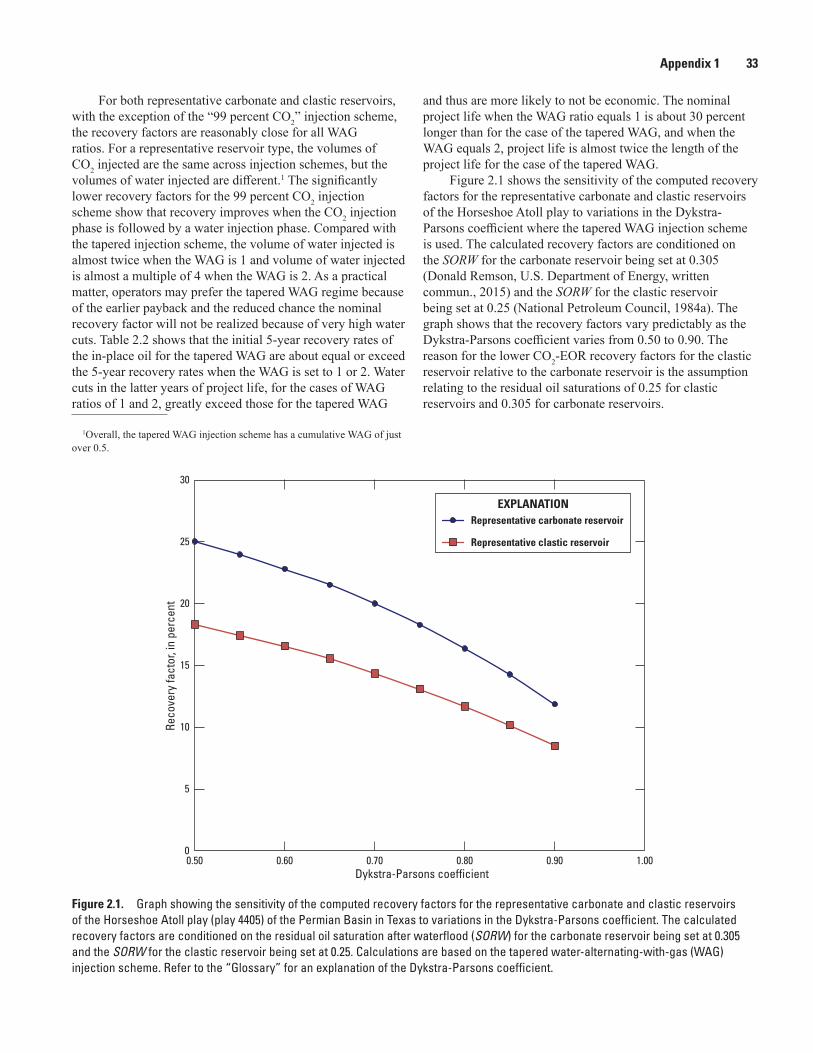
Appendix 1 33
For both representative carbonate and clastic reservoirs, with the exception of the “99 percent CO2” injection scheme, the recovery factors are reasonably close for all WAG ratios. For a representative reservoir type, the volumes of CO2 injected are the same across injection schemes, but the volumes of water injected are different.1 The significantly lower recovery factors for the 99 percent CO2 injection scheme show that recovery improves when the CO2 injection phase is followed by a water injection phase. Compared with the tapered injection scheme, the volume of water injected is almost twice when the WAG is 1 and volume of water injected is almost a multiple of 4 when the WAG is 2. As a practical matter, operators may prefer the tapered WAG regime because of the earlier payback and the reduced chance the nominal recovery factor will not be realized because of very high water cuts. Table 2.2 shows that the initial 5-year recovery rates of the in-place oil for the tapered WAG are about equal or exceed the 5-year recovery rates when the WAG is set to 1 or 2. Water cuts in the latter years of project life, for the cases of WAG ratios of 1 and 2, greatly exceed those for the tapered WAG
and thus are more likely to not be economic. The nominal project life when the WAG ratio equals 1 is about 30 percent longer than for the case of the tapered WAG, and when the WAG equals 2, project life is almost twice the length of the project life for the case of the tapered WAG.
Figure 2.1 shows the sensitivity of the computed recovery factors for the representative carbonate and clastic reservoirs of the Horseshoe Atoll play to variations in the Dykstra-Parsons coefficient where the tapered WAG injection scheme is used. The calculated recovery factors are conditioned on the SORW for the carbonate reservoir being set at 0.305 (Donald Remson, U.S. Department of Energy, written commun., 2015) and the SORW for the clastic reservoir being set at 0.25 (National Petroleum Council, 1984a). The graph shows that the recovery factors vary predictably as the Dykstra-Parsons coefficient varies from 0.50 to 0.90. The reason for the lower CO2-EOR recovery factors for the clastic reservoir relative to the carbonate reservoir is the assumption relating to the residual oil saturations of 0.25 for clastic reservoirs and 0.305 for carbonate reservoirs.
1Overall, the tapered WAG injection scheme has a cumulative WAG of just over 0.5.
Appendix 1
Figure 2.1. Graph showing the sensitivity of the computed recovery factors for the representative carbonate and clastic reservoirs of the Horseshoe Atoll play (play 4405) of the Permian Basin in Texas to variations in the Dykstra-Parsons coefficient. The calculated recovery factors are conditioned on the residual oil saturation after waterflood (SORW) for the carbonate reservoir being set at 0.305 and the SORW for the clastic reservoir being set at 0.25. Calculations are based on the tapered water-alternating-with-gas (WAG) injection scheme. Refer to the “Glossary” for an explanation of the Dykstra-Parsons coefficient.
0
5
10
15
20
25
30
0.50 0.60 0.70 0.80 0.90 1.00
Reco
very
fact
or, i
n pe
rcen
t
Dykstra-Parsons coefficient
Representative carbonate reservoir
Representative clastic reservoir
EXPLANATION
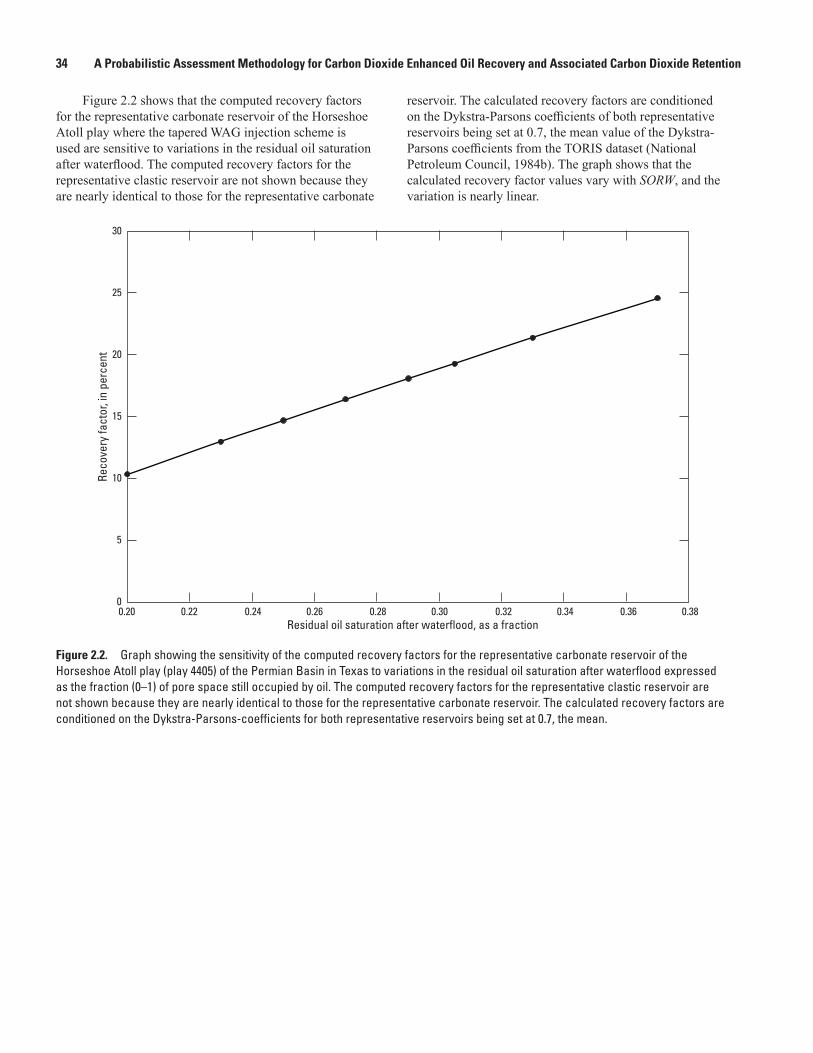
34 A Probabilistic Assessment Methodology for Carbon Dioxide Enhanced Oil Recovery and Associated Carbon Dioxide Retention
Figure 2.2 shows that the computed recovery factors for the representative carbonate reservoir of the Horseshoe Atoll play where the tapered WAG injection scheme is used are sensitive to variations in the residual oil saturation after waterflood. The computed recovery factors for the representative clastic reservoir are not shown because they are nearly identical to those for the representative carbonate
reservoir. The calculated recovery factors are conditioned on the Dykstra-Parsons coefficients of both representative reservoirs being set at 0.7, the mean value of the Dykstra-Parsons coefficients from the TORIS dataset (National Petroleum Council, 1984b). The graph shows that the calculated recovery factor values vary with SORW, and the variation is nearly linear.
0
5
10
15
20
25
30
0.20 0.22 0.24 0.26 0.28 0.30 0.32 0.34 0.36 0.38
Reco
very
fact
or, i
n pe
rcen
t
Residual oil saturation after waterflood, as a fraction
Figure 2.2. Graph showing the sensitivity of the computed recovery factors for the representative carbonate reservoir of the Horseshoe Atoll play (play 4405) of the Permian Basin in Texas to variations in the residual oil saturation after waterflood expressed as the fraction (0–1) of pore space still occupied by oil. The computed recovery factors for the representative clastic reservoir are not shown because they are nearly identical to those for the representative carbonate reservoir. The calculated recovery factors are conditioned on the Dykstra-Parsons-coefficients for both representative reservoirs being set at 0.7, the mean.
Appendix 2 35
Appendix 2
0
5
10
15
20
25
30
0 50 100 150 200 250
Reco
very
fact
or, i
n pe
rcen
t
Injected CO2, as percent of HCPV
Representative carbonate reservoir
Representative clastic reservoir
EXPLANATION
Figure 2.3. Graph showing the sensitivity of the computed recovery factors to the volumes of carbon dioxide (CO2) injected into the representative carbonate and clastic reservoirs of the Horseshoe Atoll play (play 4405) of the Permian Basin in Texas. The volumes of CO2 injected are expressed in terms of the percentage of hydrocarbon pore volume (HCPV). Calculations are based on the tapered water-alternating-with-gas (WAG) injection scheme. The residual oil saturation values for the clastic reservoir and carbonate reservoir are 0.25 and 0.305, respectively. The Dykstra-Parsons coefficient for both the clastic and carbonate reservoirs was set to 0.7, the mean value of the Dykstra-Parsons coefficients from the Tertiary Oil Recovery Information System (TORIS) dataset (National Petroleum Council, 1984b). If the volume of injected carbon dioxide is increased from 100 to 150 percent of the hydrocarbon pore volume (HCPV), the carbonate reservoir recovery factor increases by 16 percent (from 19.27 to 22.32 percent) and the clastic reservoir recovery factor increases by 15 percent (14.8 to 17.08 percent).

36 A Probabilistic Assessment Methodology for Carbon Dioxide Enhanced Oil Recovery and Associated Carbon Dioxide Retention
Appendix 3. Probabilistic Estimates and Aggregation—A Pilot Case Study
Horseshoe Atoll Play
This appendix provides an example of the reservoir resource calculations and describes how to combine the reservoirs to the U.S. Geological Survey (USGS) play level with correctly propagated uncertainty by using a probabilistic aggregation method. An example aggregation for the Horseshoe Atoll, Upper Pennsylvanian–Wolfcampian play in the Permian Basin Province in Texas (play number 4405; hereinafter, Horseshoe Atoll play) is demonstrated. The effect of correlation coefficient on hydrocarbon volume uncertainty is also discussed in this appendix.
The Horseshoe Atoll play (fig. 3.1) was defined and assessed for undiscovered oil and gas resources by the USGS in 1995 (Ball, 1996; sources cited in the appendixes are in section 6, “References Cited,” of the body of this report). The area that contains the play was also reassessed by Schenk and others (2008), Tennyson and others (2012), Gaswirth and others (2016), and Marra and others (2017). The play contains carbonate and clastic reservoir rock consisting of platform-edge facies of Pennsylvanian Strawn through Permian Wolfcampian ages. Oil and associated gas accumulations are primarily trapped in stacked carbonate beds and reef
and organic-matter-rich carbonate mound reservoirs that form a massive reef bank (Burnside, 1959; Stafford, 1959; Ball, 1996).
The reservoirs in the Horseshoe Atoll play with the largest amount of original oil in place (OOIP) were selected to be representative of all reservoirs of similar lithology in the play. To estimate the OOIP for each reservoir in the play, data from the comprehensive resource database (CRD; Carolus and others, 2018) and the literature were used to determine reservoir area (acres), net reservoir (main pay) thickness (feet), porosity (Ø), initial oil saturation (SOI), and formation volume factor for oil (FVFo) (fig. 3.2; app. 1).
There are approximately 80 oil reservoirs in the Horseshoe Atoll play. After screening, the 27 reservoir values and distributions of Ø and SOI values for input variables and results used in the current pilot case study represent real reservoirs within the Horseshoe Atoll play, but they are given arbitrary number designations for the purpose of this methodology example (fig. 3.2). Horseshoe 17 is a clastic reservoir; the remaining reservoirs are carbonate. The method to determine the minimum, most likely, and maximum estimates for Ø and SOI for carbonate and clastic reservoirs is discussed in section 4.2.1 of the body of this report. These values are used to fit a Beta-PERT (Program Evaluation and Review Technique) distribution, a special case of the beta distribution with a shape parameter of 4 (Blondes, Brennan, and others, 2013).
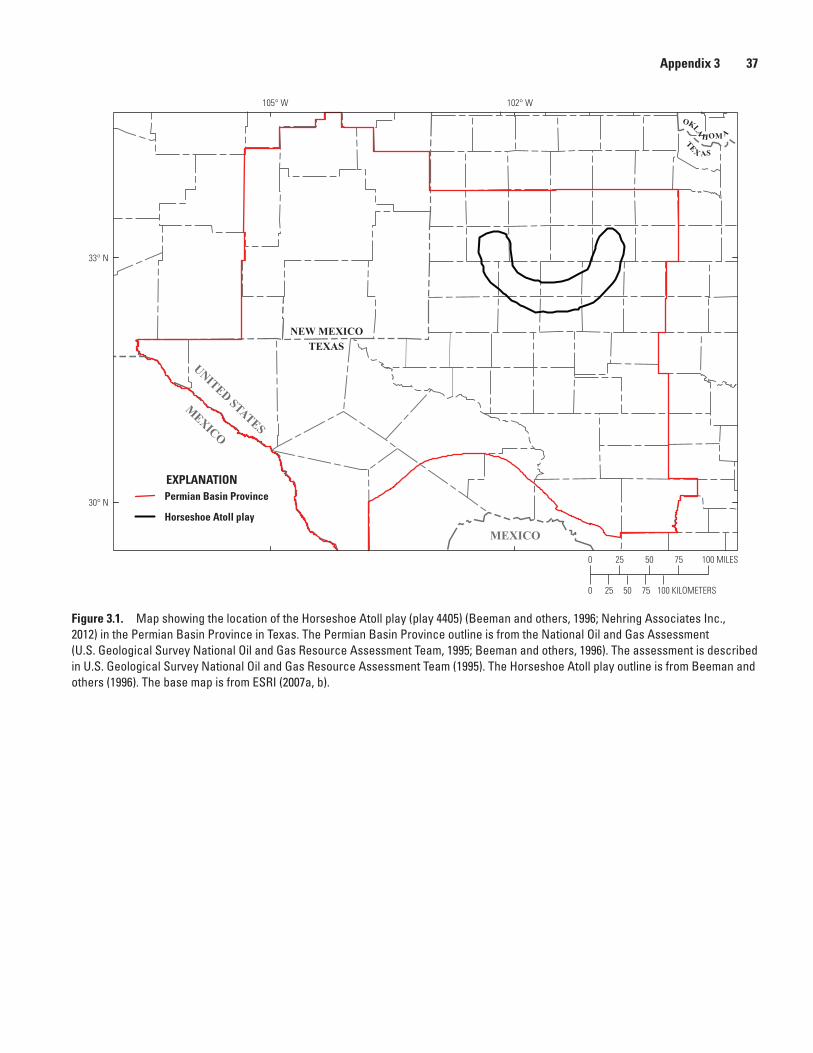
Appendix 3 37
Appendix 3
102° W105° W
33° N
30° N
0 50 100 KILOMETERS25
0 50 100 MILES25 75
75
NEW MEXICOTEXAS
UNITED STATESMEXICO
MEXICO
OKLA
HOM ATEX AS
EXPLANATIONPermian Basin Province
Horseshoe Atoll play
Figure 3.1. Map showing the location of the Horseshoe Atoll play (play 4405) (Beeman and others, 1996; Nehring Associates Inc., 2012) in the Permian Basin Province in Texas. The Permian Basin Province outline is from the National Oil and Gas Assessment (U.S. Geological Survey National Oil and Gas Resource Assessment Team, 1995; Beeman and others, 1996). The assessment is described in U.S. Geological Survey National Oil and Gas Resource Assessment Team (1995). The Horseshoe Atoll play outline is from Beeman and others (1996). The base map is from ESRI (2007a, b).
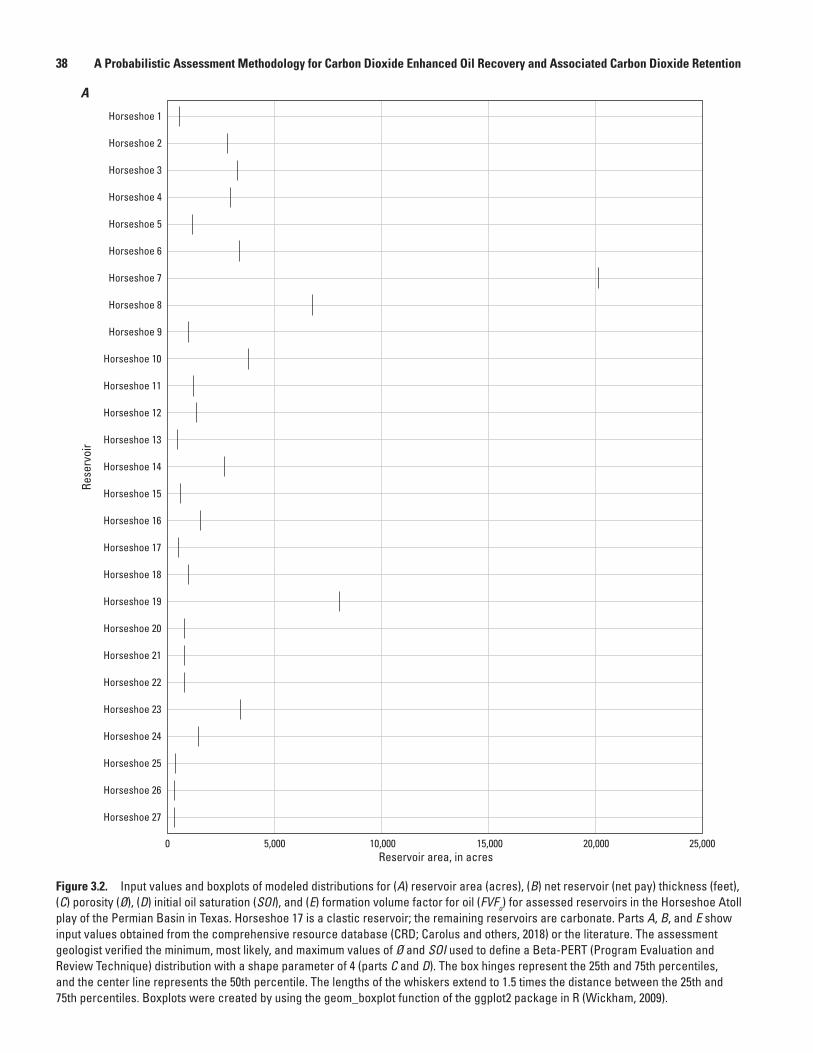
38 A Probabilistic Assessment Methodology for Carbon Dioxide Enhanced Oil Recovery and Associated Carbon Dioxide Retention
Horseshoe 27
Horseshoe 26
Horseshoe 25
Horseshoe 24
Horseshoe 23
Horseshoe 22
Horseshoe 21
Horseshoe 20
Horseshoe 19
Horseshoe 18
Horseshoe 17
Horseshoe 16
Horseshoe 15
Horseshoe 14
Horseshoe 13
Horseshoe 12
Horseshoe 11
Horseshoe 10
Horseshoe 9
Horseshoe 8
Horseshoe 7
Horseshoe 6
Horseshoe 5
Horseshoe 4
Horseshoe 3
Horseshoe 2
Horseshoe 1
0 5,000 10,000 15,000 20,000 25,000
Rese
rvoi
r
Reservoir area, in acres
A
Figure 3.2. Input values and boxplots of modeled distributions for (A) reservoir area (acres), (B) net reservoir (net pay) thickness (feet), (C) porosity (Ø), (D) initial oil saturation (SOI), and (E) formation volume factor for oil (FVFo) for assessed reservoirs in the Horseshoe Atoll play of the Permian Basin in Texas. Horseshoe 17 is a clastic reservoir; the remaining reservoirs are carbonate. Parts A, B, and E show input values obtained from the comprehensive resource database (CRD; Carolus and others, 2018) or the literature. The assessment geologist verified the minimum, most likely, and maximum values of Ø and SOI used to define a Beta-PERT (Program Evaluation and Review Technique) distribution with a shape parameter of 4 (parts C and D). The box hinges represent the 25th and 75th percentiles, and the center line represents the 50th percentile. The lengths of the whiskers extend to 1.5 times the distance between the 25th and 75th percentiles. Boxplots were created by using the geom_boxplot function of the ggplot2 package in R (Wickham, 2009).
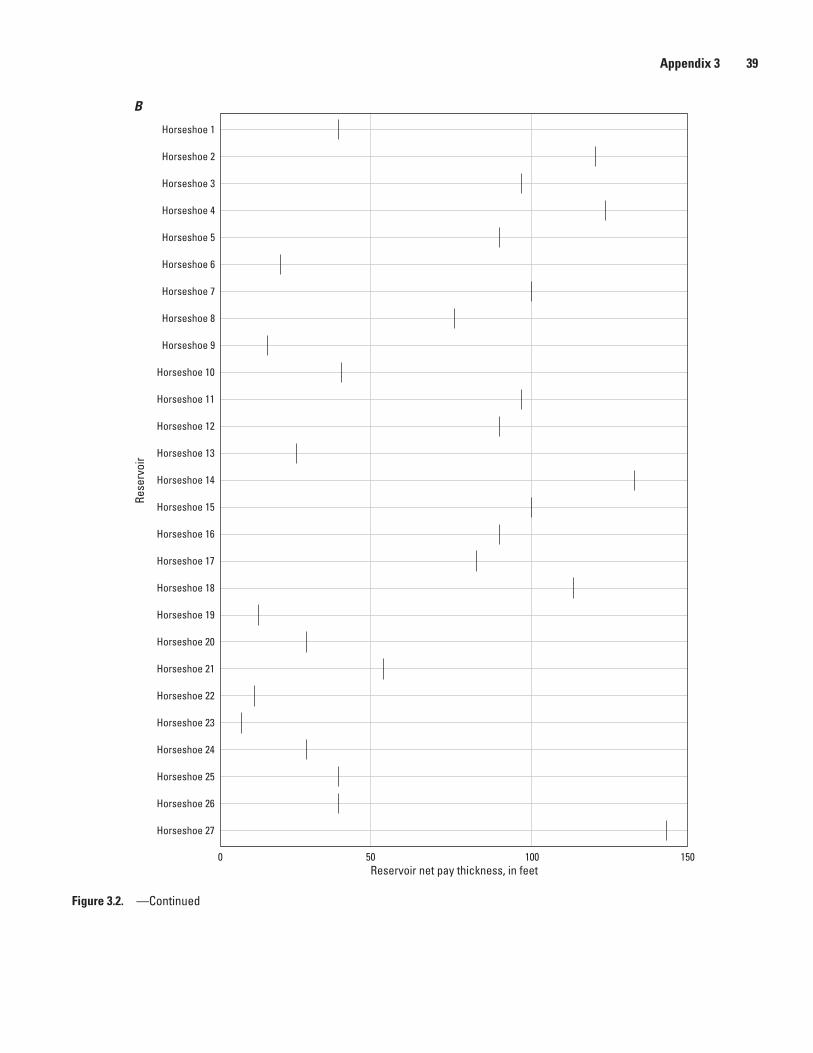
Appendix 3 39
Appendix 3
Horseshoe 27
Horseshoe 26
Horseshoe 25
Horseshoe 24
Horseshoe 23
Horseshoe 22
Horseshoe 21
Horseshoe 20
Horseshoe 19
Horseshoe 18
Horseshoe 17
Horseshoe 16
Horseshoe 15
Horseshoe 14
Horseshoe 13
Horseshoe 12
Horseshoe 11
Horseshoe 10
Horseshoe 9
Horseshoe 8
Horseshoe 7
Horseshoe 6
Horseshoe 5
Horseshoe 4
Horseshoe 3
Horseshoe 2
Horseshoe 1
500 100 150
Rese
rvoi
r
Reservoir net pay thickness, in feet
B
Figure 3.2. —Continued
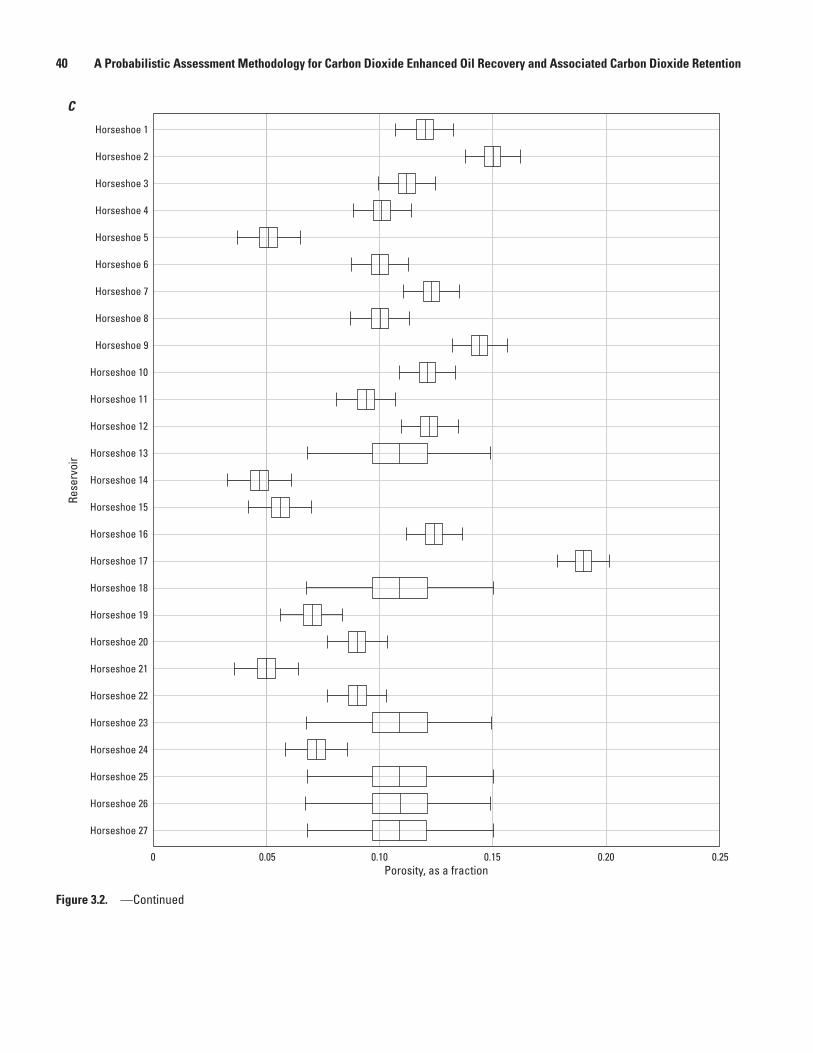
40 A Probabilistic Assessment Methodology for Carbon Dioxide Enhanced Oil Recovery and Associated Carbon Dioxide Retention
Figure 3.2. —Continued
Horseshoe 27
Horseshoe 26
Horseshoe 25
Horseshoe 24
Horseshoe 23
Horseshoe 22
Horseshoe 21
Horseshoe 20
Horseshoe 19
Horseshoe 18
Horseshoe 17
Horseshoe 16
Horseshoe 15
Horseshoe 14
Horseshoe 13
Horseshoe 12
Horseshoe 11
Horseshoe 10
Horseshoe 9
Horseshoe 8
Horseshoe 7
Horseshoe 6
Horseshoe 5
Horseshoe 4
Horseshoe 3
Horseshoe 2
Horseshoe 1
0.050 0.10 0.15 0.20 0.25
Rese
rvoi
r
Porosity, as a fraction
C
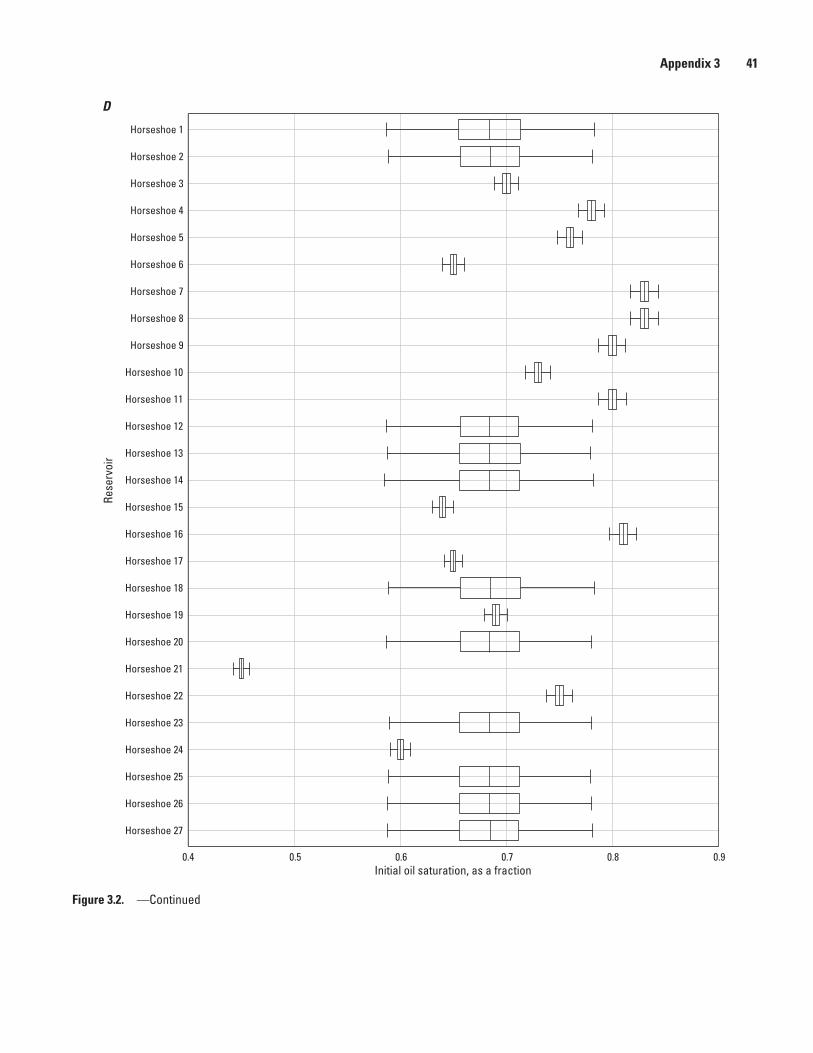
Appendix 3 41
Appendix 3
Horseshoe 27
Horseshoe 26
Horseshoe 25
Horseshoe 24
Horseshoe 23
Horseshoe 22
Horseshoe 21
Horseshoe 20
Horseshoe 19
Horseshoe 18
Horseshoe 17
Horseshoe 16
Horseshoe 15
Horseshoe 14
Horseshoe 13
Horseshoe 12
Horseshoe 11
Horseshoe 10
Horseshoe 9
Horseshoe 8
Horseshoe 7
Horseshoe 6
Horseshoe 5
Horseshoe 4
Horseshoe 3
Horseshoe 2
Horseshoe 1
0.50.4 0.6 0.7 0.8 0.9
Rese
rvoi
r
Initial oil saturation, as a fraction
D
Figure 3.2. —Continued
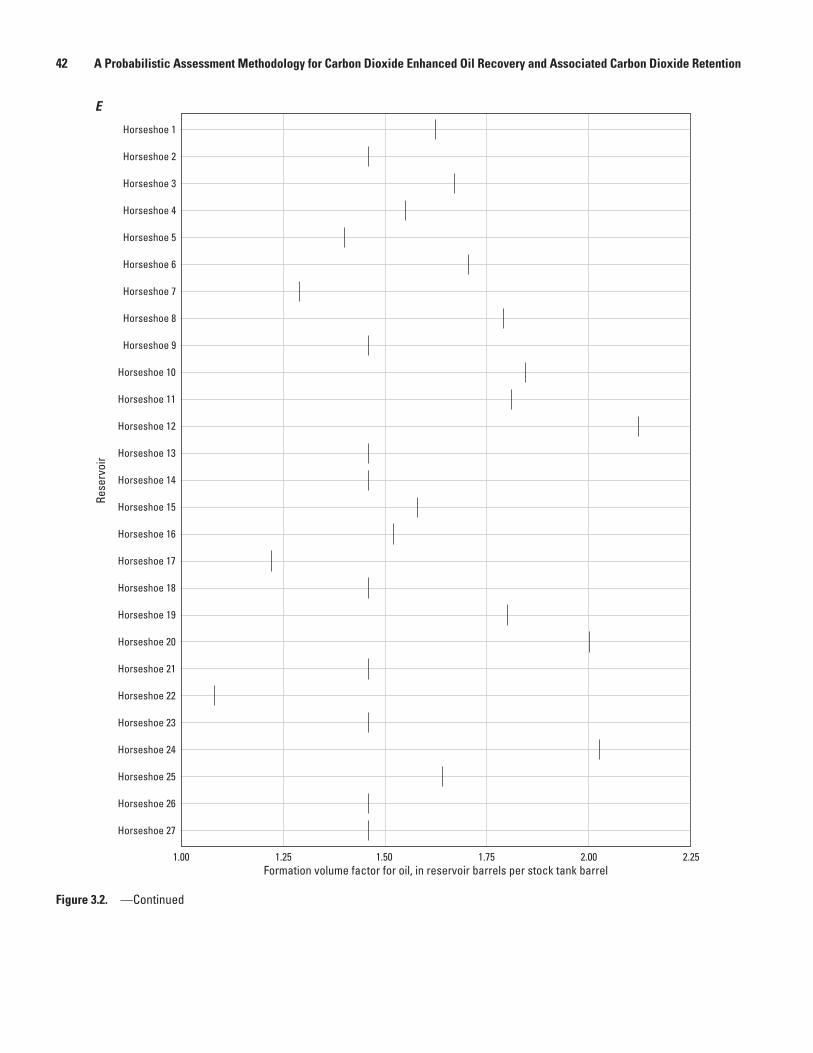
42 A Probabilistic Assessment Methodology for Carbon Dioxide Enhanced Oil Recovery and Associated Carbon Dioxide Retention
Figure 3.2. —Continued
Horseshoe 27
Horseshoe 26
Horseshoe 25
Horseshoe 24
Horseshoe 23
Horseshoe 22
Horseshoe 21
Horseshoe 20
Horseshoe 19
Horseshoe 18
Horseshoe 17
Horseshoe 16
Horseshoe 15
Horseshoe 14
Horseshoe 13
Horseshoe 12
Horseshoe 11
Horseshoe 10
Horseshoe 9
Horseshoe 8
Horseshoe 7
Horseshoe 6
Horseshoe 5
Horseshoe 4
Horseshoe 3
Horseshoe 2
Horseshoe 1
1.251.00 1.50 1.75 2.00 2.25
Rese
rvoi
r
Formation volume factor for oil, in reservoir barrels per stock tank barrel
E
Appendix 3 43
Appendix 3
Original Oil in Place (OOIP)
For a reservoir, the original oil in place (OOIP) is estimated by multiplying the rock volume (area [A] x thickness [h]) by the porosity (Ø) and initial oil saturation (SOI), and dividing the product by a formation volume factor (FVFo) that converts surface oil volumes to oil volumes at depth:
OOIP A h Ø SOI
FVFo� �
� � �7 758,
All of the parameters that make up the OOIP for each reservoir are found in the CRD and are taken as the mean values. For a description of the variables in the CRD, see Carolus and others (2018). The uncertainty in OOIP is dominated by Ø and SOI because FVFo is generally constant in each reservoir, and reservoirs subject to potential EOR have generally been fully drilled and under production for a number of years and thus their area and thickness are well known. The FVFo value for each reservoir in the play is that given in the CRD. Refer to section 4.2.1 of the body of this report for a discussion of the methods used to determine the ranges of uncertainty for Ø and SOI.
The results for the modeling of the uncertainty for Ø and SOI are shown in figure 3.2C and 3.2D. There are six reservoirs that have Ø play averages (Horseshoe 13, Horseshoe 18, Horseshoe 23, Horseshoe 25, Horseshoe 26, and Horseshoe 27); all others have reservoir mean values. For SOI, 16 reservoirs have reservoir mean values. Those with play averages are Horseshoe 1, Horseshoe 2, Horseshoe 12, Horseshoe 13, Horseshoe 14, Horseshoe 18, Horseshoe 20, Horseshoe 23, Horseshoe 25, Horseshoe 26, and Horseshoe 27.
A Monte Carlo simulation is used to sample the distributions of Ø and SOI 10,000 times to obtain a distribution for OOIPs for each reservoir in the Horseshoe Atoll play. The OOIP distribution for each reservoir is shown in figure 3.3.
Recovery Factor (RF)
As introduced in section 4.2 of this report, CO2 Prophet is used to create an empirical relationship for the recovery factor (RF) as a function of SORW and the Dykstra-Parsons coefficient (VDP). To model the SORW distribution, the mean values of SORW are assumed to be 0.305 for carbonate reservoirs and 0.25 for clastic reservoirs for the entire country. The ranges of SORW and VDP that were used for calculating the RF and RF uncertainty for carbonate reservoirs in the Horseshoe Atoll play are shown in figure 3.4. The minimum
and maximum values used to define a beta-PERT distribution with a shape parameter of 4 for SORW are set to plus and minus 10 percent of the mean values (fig. 3.5A) on the basis of a review of SORW data presented by the Interstate Oil Compact Commission (1978, p. 212) for the North Burbank oil field in Oklahoma. The uncertainty of the VDP for all reservoirs in the Horseshoe Atoll play was estimated by using an empirical distribution of VDP values found in the TORIS dataset (National Petroleum Council, 1984b), with a mean of 0.7 and a range of 0.51 to 0.89, for use in the RF calculation (3.1)(fig. 3.5B). For a discussion of this method, see section 4.2.2 of the body of this report. For each of the 10,000 iterations of the Monte Carlo simulation, a value of SORW or VDP is sampled and applied to the RF function, generating an RF distribution for each reservoir (fig. 3.6). Recovery factor distributions are then compared to decline curves and published data for similar reservoirs (Verma, 2017).
Enhanced Oil Recovery (EOR) and Associated CO2 Storage
As described in section 4 of this study, a probabilistic estimate of technically recoverable hydrocarbon volumes from CO2-EOR is determined from the original oil-in-place (OOIP) multiplied by a recovery factor (RF):
EOR OOIP RFv � � (3.2)
The mass of CO2 stored during EOR is determined by multiplying the total volume of EOR by the net utilization in CO2, multiplied by the density of CO2:
(3.3)
For each of the 10,000 iterations of the Monte Carlo simulation, a value is chosen from the OOIP distribution and is multiplied by a value from the RF distribution. These iterations are compiled into new distributions for each reservoir that represent the technically recoverable hydrocarbon volume from CO2-EOR in millions of barrels (MMbbl) (fig. 3.6). The resulting EOR reservoir volume distributions are then multiplied by the net utilization value calculated with CO2 Prophet on the basis of the assumption that the CO2 injected was equal to 100 percent of the HCPV, and by the density of CO2 at standard conditions for natural gas (60 degrees Fahrenheit and 14.696 pound-force per square inch, absolute) which is 0.0529 metric tons per thousand cubic feet (t/Mcf). The products are the reservoir distributions for stored CO2 in millions of metric tons (fig 3.7).
Mass of CO stored EOR CO COv utilization density
2 2 2� � �
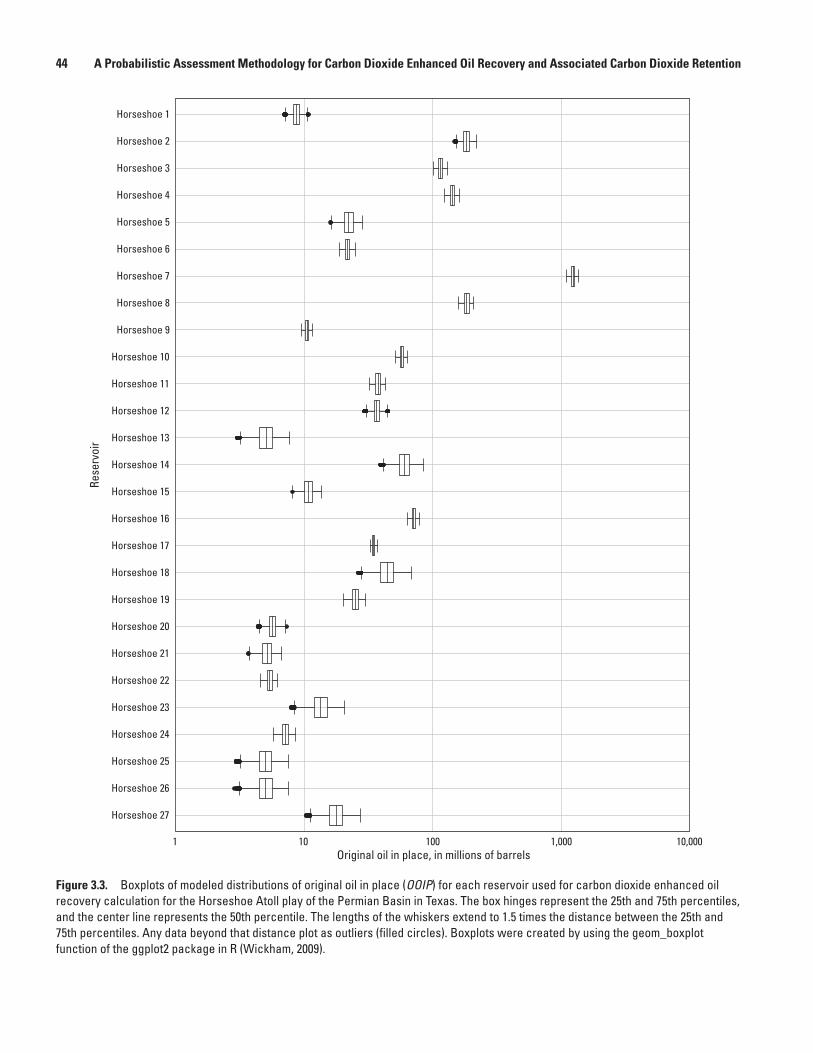
44 A Probabilistic Assessment Methodology for Carbon Dioxide Enhanced Oil Recovery and Associated Carbon Dioxide Retention
Horseshoe 27
Horseshoe 26
Horseshoe 25
Horseshoe 24
Horseshoe 23
Horseshoe 22
Horseshoe 21
Horseshoe 20
Horseshoe 19
Horseshoe 18
Horseshoe 17
Horseshoe 16
Horseshoe 15
Horseshoe 14
Horseshoe 13
Horseshoe 12
Horseshoe 11
Horseshoe 10
Horseshoe 9
Horseshoe 8
Horseshoe 7
Horseshoe 6
Horseshoe 5
Horseshoe 4
Horseshoe 3
Horseshoe 2
Horseshoe 1
1 10 100 1,000 10,000
Rese
rvoi
r
Original oil in place, in millions of barrels
Figure 3.3. Boxplots of modeled distributions of original oil in place (OOIP) for each reservoir used for carbon dioxide enhanced oil recovery calculation for the Horseshoe Atoll play of the Permian Basin in Texas. The box hinges represent the 25th and 75th percentiles, and the center line represents the 50th percentile. The lengths of the whiskers extend to 1.5 times the distance between the 25th and 75th percentiles. Any data beyond that distance plot as outliers (filled circles). Boxplots were created by using the geom_boxplot function of the ggplot2 package in R (Wickham, 2009).
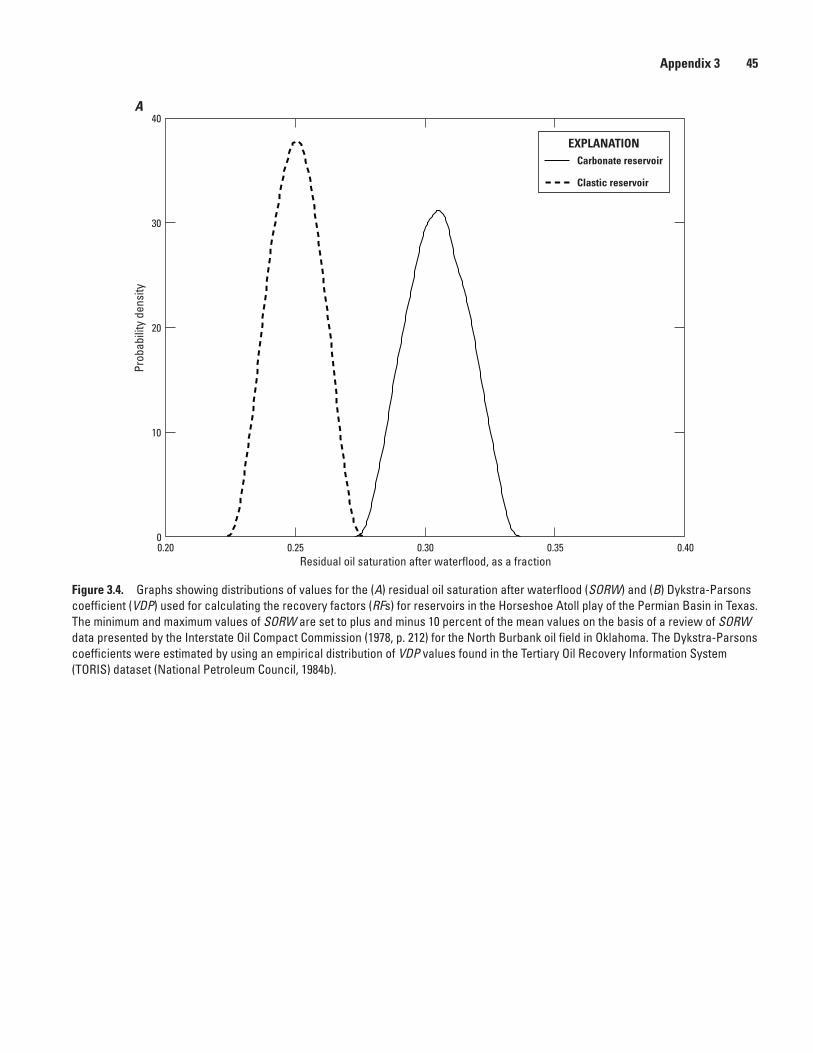
Appendix 3 45
Appendix 3
0
10
20
30
40
0.20 0.25 0.30 0.35 0.40Residual oil saturation after waterflood, as a fraction
Prob
abili
ty d
ensi
tyEXPLANATION
Carbonate reservoir
Clastic reservoir
A
Figure 3.4. Graphs showing distributions of values for the (A) residual oil saturation after waterflood (SORW) and (B) Dykstra-Parsons coefficient (VDP) used for calculating the recovery factors (RFs) for reservoirs in the Horseshoe Atoll play of the Permian Basin in Texas. The minimum and maximum values of SORW are set to plus and minus 10 percent of the mean values on the basis of a review of SORW data presented by the Interstate Oil Compact Commission (1978, p. 212) for the North Burbank oil field in Oklahoma. The Dykstra-Parsons coefficients were estimated by using an empirical distribution of VDP values found in the Tertiary Oil Recovery Information System (TORIS) dataset (National Petroleum Council, 1984b).
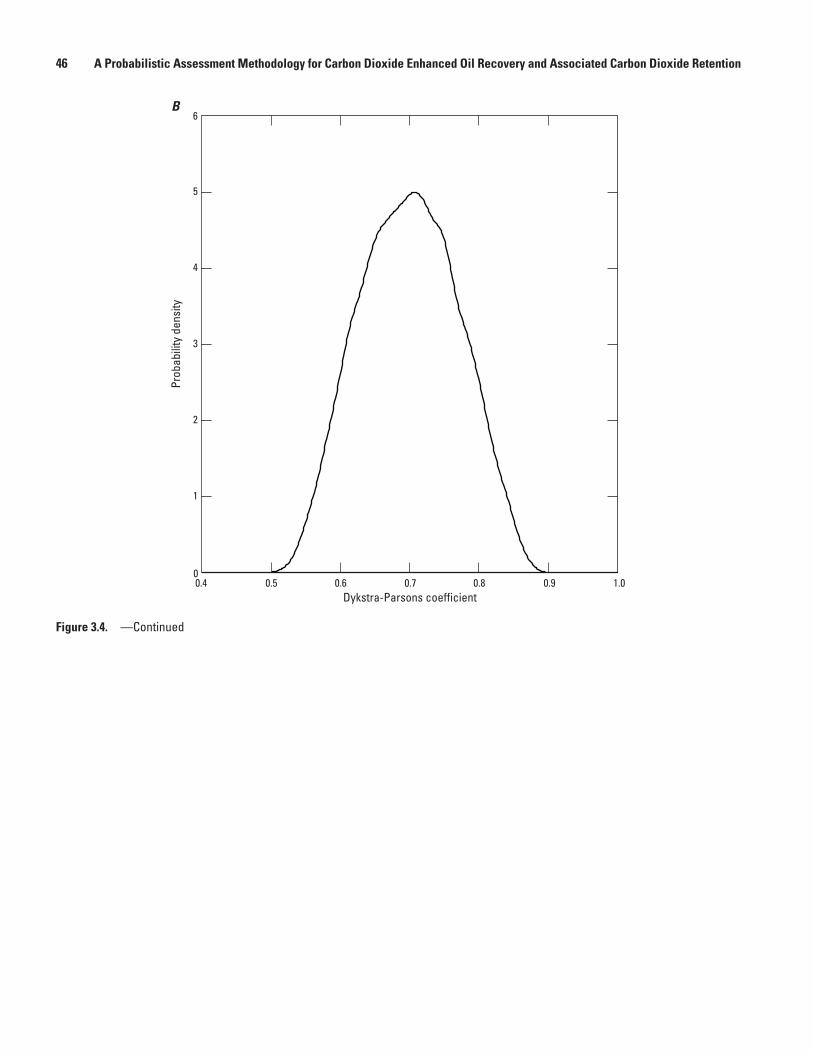
46 A Probabilistic Assessment Methodology for Carbon Dioxide Enhanced Oil Recovery and Associated Carbon Dioxide Retention
0
Dykstra-Parsons coefficient
Prob
abili
ty d
ensi
ty
B
1
2
3
4
5
6
0.4 0.5 0.6 0.7 0.8 0.9 1.0
Figure 3.4. —Continued
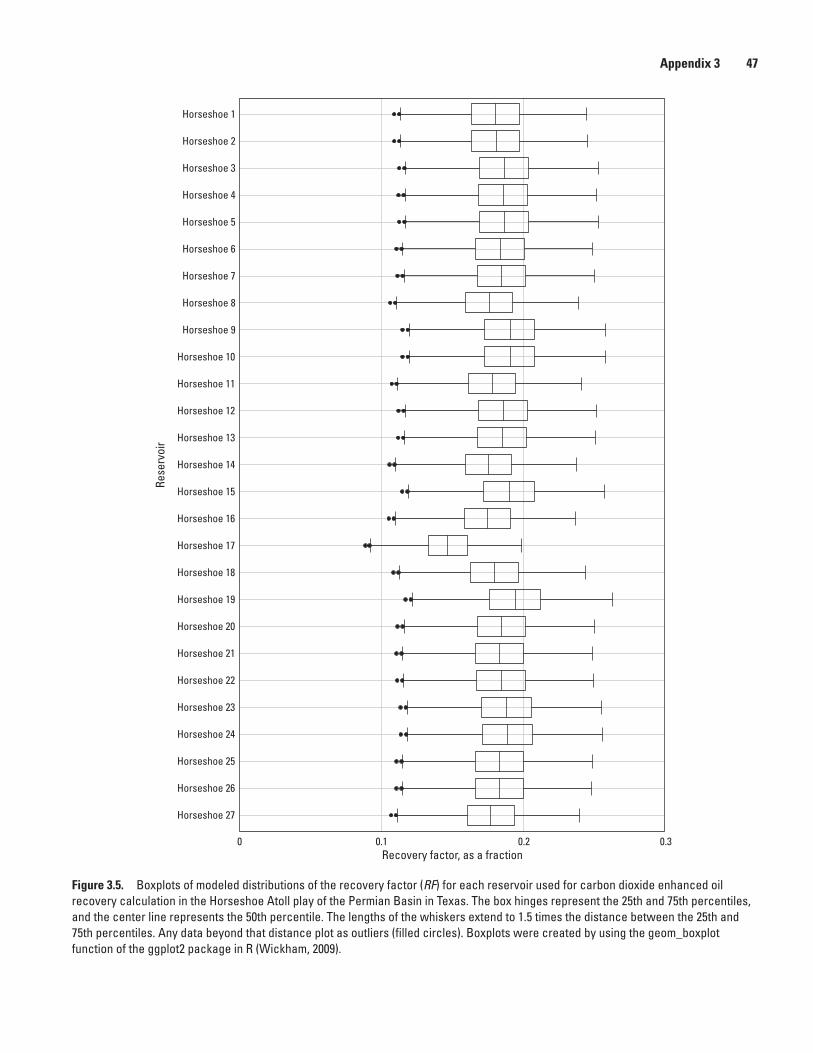
Appendix 3 47
Appendix 3
Horseshoe 27
Horseshoe 26
Horseshoe 25
Horseshoe 24
Horseshoe 23
Horseshoe 22
Horseshoe 21
Horseshoe 20
Horseshoe 19
Horseshoe 18
Horseshoe 17
Horseshoe 16
Horseshoe 15
Horseshoe 14
Horseshoe 13
Horseshoe 12
Horseshoe 11
Horseshoe 10
Horseshoe 9
Horseshoe 8
Horseshoe 7
Horseshoe 6
Horseshoe 5
Horseshoe 4
Horseshoe 3
Horseshoe 2
Horseshoe 1
0 0.1 0.2 0.3
Rese
rvoi
r
Recovery factor, as a fraction
Figure 3.5. Boxplots of modeled distributions of the recovery factor (RF) for each reservoir used for carbon dioxide enhanced oil recovery calculation in the Horseshoe Atoll play of the Permian Basin in Texas. The box hinges represent the 25th and 75th percentiles, and the center line represents the 50th percentile. The lengths of the whiskers extend to 1.5 times the distance between the 25th and 75th percentiles. Any data beyond that distance plot as outliers (filled circles). Boxplots were created by using the geom_boxplot function of the ggplot2 package in R (Wickham, 2009).
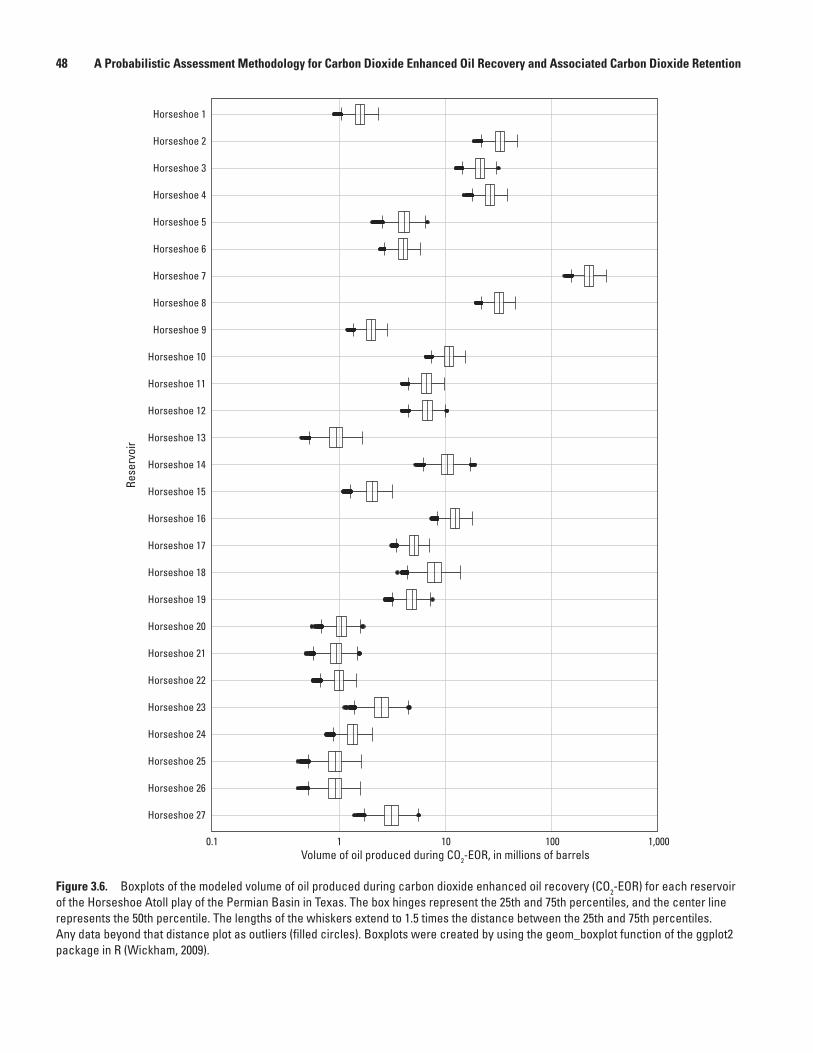
48 A Probabilistic Assessment Methodology for Carbon Dioxide Enhanced Oil Recovery and Associated Carbon Dioxide Retention
Horseshoe 27
Horseshoe 26
Horseshoe 25
Horseshoe 24
Horseshoe 23
Horseshoe 22
Horseshoe 21
Horseshoe 20
Horseshoe 19
Horseshoe 18
Horseshoe 17
Horseshoe 16
Horseshoe 15
Horseshoe 14
Horseshoe 13
Horseshoe 12
Horseshoe 11
Horseshoe 10
Horseshoe 9
Horseshoe 8
Horseshoe 7
Horseshoe 6
Horseshoe 5
Horseshoe 4
Horseshoe 3
Horseshoe 2
Horseshoe 1
10.1 10 100 1,000
Rese
rvoi
r
Volume of oil produced during CO2-EOR, in millions of barrels
Figure 3.6. Boxplots of the modeled volume of oil produced during carbon dioxide enhanced oil recovery (CO2-EOR) for each reservoir of the Horseshoe Atoll play of the Permian Basin in Texas. The box hinges represent the 25th and 75th percentiles, and the center line represents the 50th percentile. The lengths of the whiskers extend to 1.5 times the distance between the 25th and 75th percentiles. Any data beyond that distance plot as outliers (filled circles). Boxplots were created by using the geom_boxplot function of the ggplot2 package in R (Wickham, 2009).
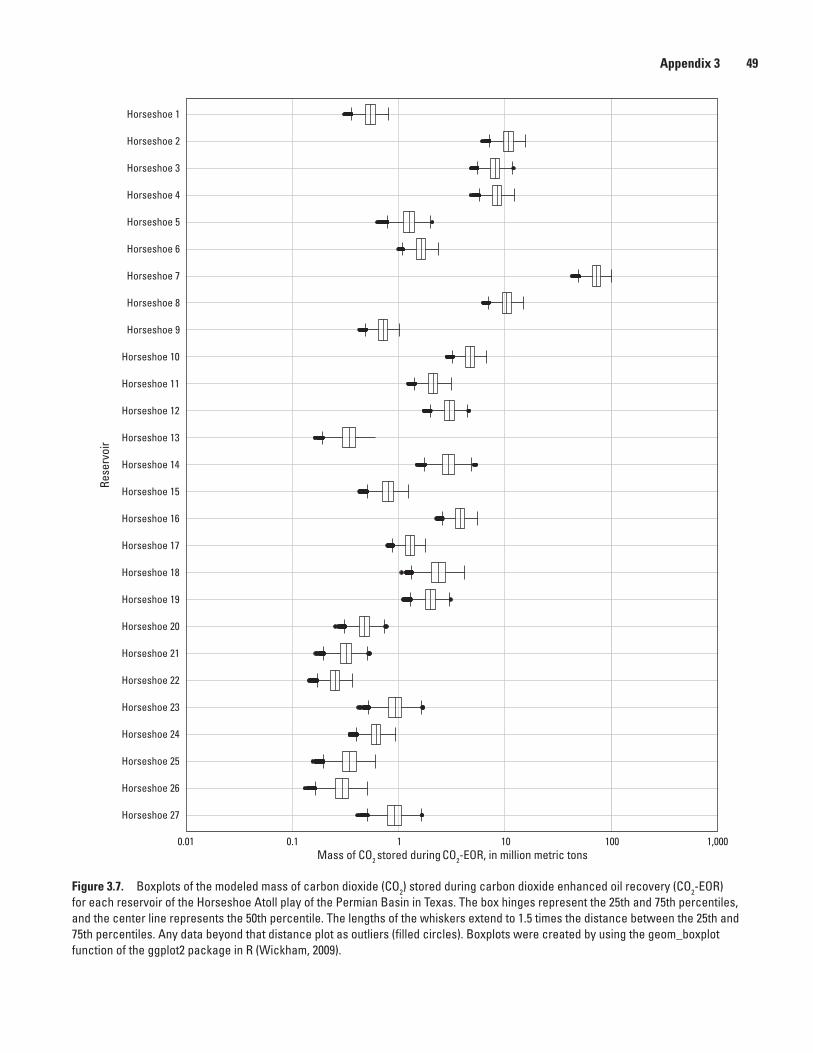
Appendix 3 49
Appendix 3
Horseshoe 27
Horseshoe 26
Horseshoe 25
Horseshoe 24
Horseshoe 23
Horseshoe 22
Horseshoe 21
Horseshoe 20
Horseshoe 19
Horseshoe 18
Horseshoe 17
Horseshoe 16
Horseshoe 15
Horseshoe 14
Horseshoe 13
Horseshoe 12
Horseshoe 11
Horseshoe 10
Horseshoe 9
Horseshoe 8
Horseshoe 7
Horseshoe 6
Horseshoe 5
Horseshoe 4
Horseshoe 3
Horseshoe 2
Horseshoe 1
0.10.01 1 10 100 1,000
Rese
rvoi
r
Mass of CO2 stored during CO2-EOR, in million metric tons
Figure 3.7. Boxplots of the modeled mass of carbon dioxide (CO2) stored during carbon dioxide enhanced oil recovery (CO2-EOR) for each reservoir of the Horseshoe Atoll play of the Permian Basin in Texas. The box hinges represent the 25th and 75th percentiles, and the center line represents the 50th percentile. The lengths of the whiskers extend to 1.5 times the distance between the 25th and 75th percentiles. Any data beyond that distance plot as outliers (filled circles). Boxplots were created by using the geom_boxplot function of the ggplot2 package in R (Wickham, 2009).

50 A Probabilistic Assessment Methodology for Carbon Dioxide Enhanced Oil Recovery and Associated Carbon Dioxide Retention
Aggregation
The output of the Monte Carlo simulation for each reservoir is an empirical distribution with 10,000 samples. To combine all 27 reservoirs to the play level with correctly propagated uncertainty, the aggregation procedure must be used in a manner that correlations between reservoirs are taken into account (see section 4.3). The aggregation procedure was adapted directly from the USGS CO2 assessment methodology (Blondes, Brennan, and others, 2013; Blondes, Schuenemeyer, and others, 2013; Kaufman and others, 2018). A correlation matrix for the entire Horseshoe Atoll play is created by eliciting expert estimates from the geologists (using the methods of Meyer and Booker, 2001). For this example, a correlation coefficient of 0.75 between all reservoirs is assumed. The Cholesky decomposition is used to induce rank correlation from the correlation matrix to the 27 empirical reservoir distributions. Figure 3.8 shows the results for oil produced by CO2-EOR and CO2 utilization. The solid lines show the assumption where all correlation coefficients are 0.75 and the dotted and dashed lines show assumptions of perfect correlation and no correlation, respectively, for the Horseshoe Atoll play. The total volumes of oil produced during CO2-EOR and the masses of associated CO2 stored are shown in table 3.1.
The Horseshoe Atoll play example illustrates CO2-EOR and associated CO2 retention reservoir resource calculations and demonstrates how probabilistic aggregation of the reservoir results can be made to the USGS play level. Methods tested in this case study could be used in a national assessment to produce a probabilistic estimate of the hydrocarbon volumes that are technically recoverable with the application of the CO2-EOR process to qualifying oil reservoirs.
Table 3.1. Volume of oil produced during carbon dioxide enhanced oil recovery (CO2-EOR) and associated carbon dioxide (CO2) retention for the case study of the Horseshoe Atoll play of the Permian Basin in Texas.
[Estimates of volumes of oil produced during CO2-EOR are in millions of petroleum barrels (MMbbl) and estimates of CO2 retention are in millions of metric tons (Mt). P5, P50, and P95 are probability percentiles and represent the 5-, 50-, and 95-percent probabilities, respectively, that the true storage resource is less than the value shown. The terminology used in this report differs from that used by the petroleum industry and follows standard statistical practice (for example, Everitt and Skrondal, 2010), where percentiles, or fractiles, represent the value of a variable below which a certain proportion of observations falls. The percentiles were calculated by using the aggregation method described in U.S. Geological Survey Geologic Carbon Dioxide Storage Resources Assessment Team (2013b) and in Blondes, Schuenemeyer, and others (2013). Percentile values do not sum to totals because the aggregation procedure used partial dependencies between assessment units. The P50 (median) values are generally less than mean values because most output distributions are right skewed. Values are reported to only two significant figures]
Resource type P5 P50 P95 Mean
Oil produced during CO2-EOR (MMbbl)
350 430 510 430
CO2 retention (Mt) 120 140 170 140
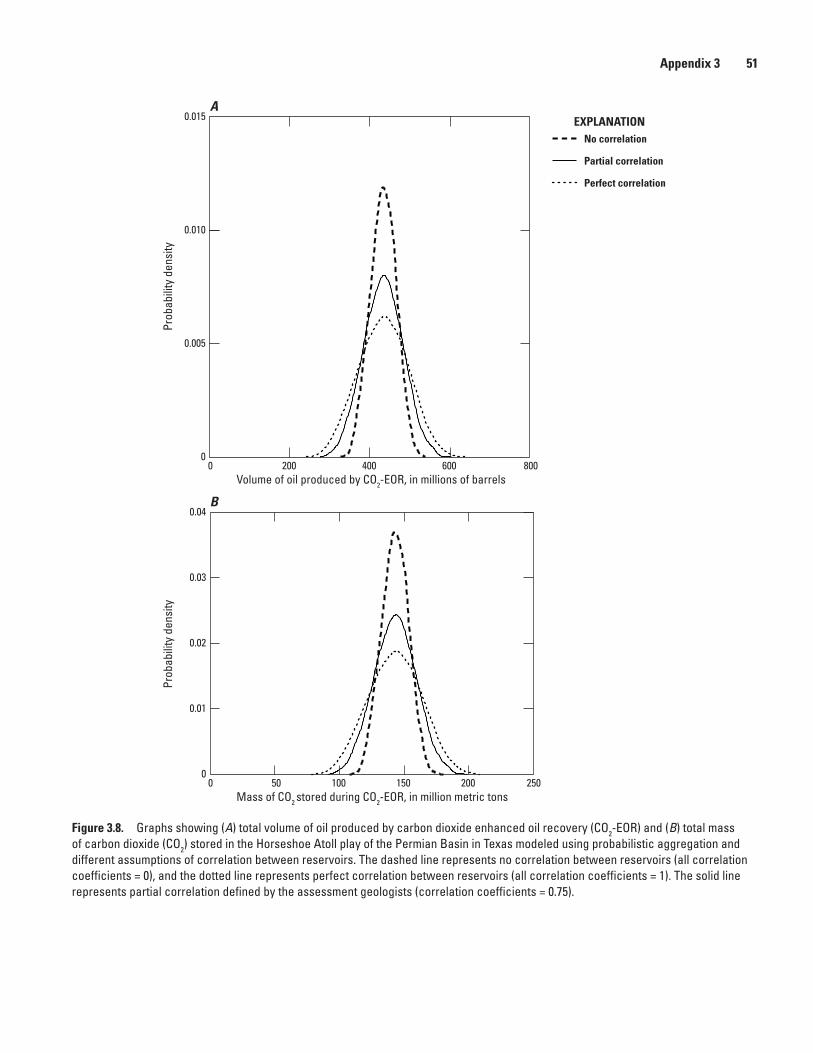
Appendix 3 51
Appendix 3
Volume of oil produced by CO2-EOR, in millions of barrels
Mass of CO2 stored during CO2-EOR, in million metric tons
EXPLANATIONNo correlation
Partial correlation
Perfect correlation
A
B
0
0.005
0.010
0.015
0 200 400 600 800
Prob
abili
ty d
ensi
tyPr
obab
ility
den
sity
0
0.01
0.02
0.03
0.04
0 50 100 150 200 250
Figure 3.8. Graphs showing (A) total volume of oil produced by carbon dioxide enhanced oil recovery (CO2-EOR) and (B) total mass of carbon dioxide (CO2) stored in the Horseshoe Atoll play of the Permian Basin in Texas modeled using probabilistic aggregation and different assumptions of correlation between reservoirs. The dashed line represents no correlation between reservoirs (all correlation coefficients = 0), and the dotted line represents perfect correlation between reservoirs (all correlation coefficients = 1). The solid line represents partial correlation defined by the assessment geologists (correlation coefficients = 0.75).


For more information concerning the research in this report, contact Director, Eastern Energy Resources Science Center U.S. Geological Survey 12201 Sunrise Valley Drive Mail Stop 956 Reston, VA 20192 https://www.usgs.gov/centers/eersc
Publishing support provided by the U.S. Geological Survey Science Publishing Network, Reston and Sacramento Publishing Service Centers

Warw
ick and others—A
Probabilistic Assessm
ent Methodology for Carbon D
ioxide Enhanced Oil Recovery and A
ssociated Carbon Dioxide Retention—
Scientific Investigations Report 2019–5115
ISSN 2328-0328 (online)https://doi.org/10.3133/sir20195115