8 p, 00 ol - forside - ssb ppr cntrl r f sttt, .. 8 p, 00 ol , r n. 44 t 8 n td f ndtr, nvrnnt nd nr...
TRANSCRIPT
Discussion PaperCentral Bureau of Statistics, P.B. 8131 Dep, 0033 Oslo 1, Norway
No. 44 August 1989
SIMEN
Studies of Industry, Environment
and Energy towards 2000
by
Brita Bye, Torstein Bye and Lorents Lorentsen
Abstract
This paper describes an attempt to analyze the question of how to control airpollution, without hampering further economic growth. The analytical frameworkis a macroeconomic planning model, extended with a submodel for air pollution.Taxes on petroleum products for heating and transportation purposes are sub-stantially increased, with the aim of stabilizing Norwegian emissions of CO2 andsimultaneously decrease the emissions of SO2 and NO S . This policy change isanalyzed under the restriction of balanced government budgets. The increase inrevenue from the taxation of petroleum products, is counteracted by an equivalentreduction in taxes or wage income. On average this leaves production costs andcompetitiveness unchanged and contributes to a more efficient use of the labourforce and energy.
Not to be quoted without permission from author(s). Comments welcome.
Preface
The Norwegian Ministry of Industry initiated the SIMEN-project l in the springof 1988 as a follow-up of the report from the World Commission on Environmentand Development. The aim of the project was to evaluate the possibilities forindustrial growth towards 2000, under different restrictions on pollution and dif-ferent assumptions on domestic energy supply. Is it possible to pursue an ambitiousenvironment policy and simultaneously achieve an acceptable economic growth?Which policy instruments should the authorities choose to modify possible targetconflicts? To address these questions, it is essential to analyse the links betweenenergy consumption and pollution in a macroeconomic setting, where the inter-play between different sectors of the economy is explicitly taken into account. Thisreport, which gives a summary of the SIMEN-project, therefore presents analysesof the whole economy - not only of industrial development.
In addition to this main report, the SIMEN-Project comprises 9 sub-reports.The sub-reports discuss the prospects for some manufacturing industries in greaterdetail; the power intensive industries and the pulp and paper industry. In additionthe sub-reports discuss issues as domestic consumption of natural gas, costs andeffects of new environmental restrictions and the use of different instruments inenvironment and energy policies.
The state secretaries of the Ministry of Finance, the Ministry of Environment,the Ministry of Industry and the Ministry of Petroleum and Energy have actedas steering committee for the SIMEN-project. The day to day follow-up of theproject has been conducted by a project group of civil servants from the samefour ministries. The Central Bureau of Statistics has coordinated the SIMEN-project and had the professional responsibility for the main report. The sub-reportshave been elaborated by the Resource Policy Group, the Institute of IndustrialEconomics, the State Pollution Control Authority, Center for Applied EconomicResearch at the University of Oslo and the Central Bureau of Statistics. Altogetherthe research effort adds up to three man years, sponsored by the participatingministries, see Appendix 1 on the organization of the SIMEN-project.
The project has benefited from informal contacts with organizations and in-dividuals from several industries. The SIMEN-reports are therefore a result of a
'SIMEN is a Norwegian acronym for "Studier av Industri, Miljø og Energi"; i.e. "Studies ofIndustry, Environment and Energy".
cooperation between politicians, civil servants, researchers and industrialists. Theexperience with this kind of cooperation in the SIMEN-projects has been positive.The political "steering" has not interferred with the "professional integrity".
Several staff members of the Research Department of the Central Bureau ofStatistics have contributed to the completion of the SIMEN-project. The mainreport is written by Brita Bye, Torstein Bye and Lorents Lorentsen. Knut Alfsen,Anne Brendemoen, Adne Cappelen, Solveig Glomsrød, Torgeir Johnsen and TrondSandmo have contributed with calculations and comments, while Elisa Holm andAnne Strandli have typed and edited the manuscript. The authors wish to thankall participants of the SIMEN-project for constructive cooperation.
Oslo, June 1989
2
CONTENTS
1 Introduction and summary 51.1 Background for the analyses . . . . . . . . 51.2 Purpose. Target groups 61.3 Follow-up of the SIMEN-project 71.4 Summary of the report 81.5 Conclusions .............. . . • • • • • .
•
18
2 Norwegian Economy, Energy Consumption and Pollution 1962-1988 21
2.1 Introduction 212.2 Economy, Energy Consumption and Pollution 1962-1986 . 222.3 Economy, Energy Consumption and Pollution 1986-1988 . 26
3 Challenges in Environmental and Energy Policies 303.1 Challenges and Targets in Environmental Policies . . . . . . . . . . 303.2 Challenges in Energy Policies . . . . . . • • • • . . • • . 333.3 Instruments in Environmental - and Energy Policies 35
4 Prospects for selected Manufacturing Industries 404.1 Introduction 404.2 Traditional Export Competing, Man.ufacturing Industries 404.2.1 Power intensive industries . . . ...... . .... . .. 404.2.1.1 The aluminium industry 414.2.1.2 The ferro alloy industry .. . . . . .... . . . .... .. 454.2.2 Pulp and paper production 514.2.3 Production of metal products, machinery and equipment 554.2.4 Industrial use of natural gas . . • . • • • • • . • • 554.3 Conclusions 56
5 Industry, Environment and Energy in a Macroeconomic Perspec-tive 1988-2000 58
5.1 Introduction ........... . . .... . . • • • • • • . 585.2 The Reference scenario 615.3 The gas scenario .......... . ....... .
•
• • • • .
•
705.4 The Environment scenarios .. . ..... . . . . . • • • • . • 755.4.1 Introduction 755.4.2 The Regulation scenario 775.4.3 The Tax scenario 80

5.5 Summary of the calculations 90
References 94
Appendix 1. Organization. Participants. Sub-projects 96
Appendix 2. The Macroeconomic Model MODAG W 101
4

1 Introduction and summary
1.1 Background for the analyses
The Norwegian economy has for more than 10 years been strongly influenced by theincreasing petroleum activity on the Norwegian Continental Shelf and a high levelof domestic use based on petroleum incomes. The economy has become steadilymore vulnerable to changes in petroleum incomes. This was clearly demonstratedby the fall in the oil-prices in 1985-86, which resulted in great deficits on thecurrent accounts.
It is a central target for Norwegian economic policies to reduce the depen-dency of petroleum incomes and to increase production in other competing sectors,among others in the manufacturing industries. Such a restructuring is only possi-ble if the profitability of competing industries is improved. Investments and know-how which otherwise would have been channeled to sheltered sectors or petroleumactivities have to be transferred to competing industries to increase productioncapacity.
The report from the World Commission on Environment and Development(Brundtland-Commission) has greatly improved the general awareness of the linksbetween economic growth, energy consumption and pollution. The report pointsout that if the economic growth continues and the composition of production andconsumption is not radically changed, unacceptable environmental damages mightoccur. Emissions of substances like sulphur dioxides (502) and nitrogen oxides(N0z) already exceed nature's absorption capacity. Increased concentration ofgreenhouse gases in the atmosphere, among others carbon dioxid (CO2) , mightlead to global warming and unpredictable climatic changes. Emissions of green-house gases shoula therefore be restricted.
The Brundtland-Commission describes a sustainable development as a processof economic growth which does not deteriorate natural resources and the environ-ment for future generations. This will also be a guideline for Norwegian policies.Norwegian industries will therefore, in the years to come, have to comply to newrestrictions on pollution, partly as a result of international agreements and partlyas a result of specific Norwegian targets.
Norway has signed international agreements on reduction of emissions of sul-phur dioxides, nitrogen oxides and chlorofluorearbons to air, and toxic waste,phosphorous and nitrogen to exposed parts of the North Sea. The State Pol-lution Control Authority has elaborated a list of 13 toxic substances which shouldbe reduced by 60-90 percent the next 5 to 6 years. International agreements onredaction of greenhouse gases is under preparation. A future agreement will most
5

likely include reductions in emissions of carbon dioxid (CO2), as the major andeasiest controlable source to the greenhouse problem.
The report from the Brundtland-Commission gives recommendations on en-ergy policy which basically is deduced from the targets to reduce emissions ofpollution from fossil fuels. International agreements on such reductions will haveconsequences also for Norwegian energy policy.
1.2 Purpose. Target groups
The analyses of the SIMEN-project focus especially on the effects on the Norwegianeconomy of a possible convention on reductions of CO2 emissions, in addition toeffects of the international agreements Norway have already signed on reductionsof emissions of SO2 and NOS .
It is necessary to restructure industries, change accustomed consumption pat-terns and to use improved technology to achieve an acceptable economic growth,reductions of pollution and more efficient energy comsumption simultaneously. In-troduction of new and tougher environmental restrictions will, however, lead toincreased costs for industries, making it difficult to achieve the structural changesnecessary for economic growth, balance on the current accounts and a satisfactorydevelopment in the labour market. There is a possible target conflict between lesspollution and increased production and consumption in the short run.
The SIMEN-scenarios are based on evaluations of market developments fordifferent industrial sectors, and of how quickly restructuring and introduction ofnew technology can be achieved. Attention has also been paid to the evaluationof which -policy instruments that seem necessary to reduce pollution without un-necessarily constraining further economic growth.
Economic development must be managed such that the environment is pre-served as a basis for future production and consumption. This means a change intraditional ways of thinking, towards more emphasis on coherent and long termissues.
The politicians have shown interest for the SIMEN-project since they are con-cerned with bringing forward realistic alternatives for social and economic develop-ment. Which development paths for the Norwegian economy are sustainable, andwhich policy instruments will have to be applied to achieve such a development?
Civil servants are responsible for elaborating background material for plan-ning and policy decisions. The follow-up ol the Brundtland-Commission's reportdemands coordination of activities between different ministries, when elaboratingplanning documents. Preliminary results from the SIMEN-project were used asbackground material for the Government's Long Term Programme 1990-1993, a
6

White Paper on industrial policies and a White Paper on the follow-up of theBrundtland-Commission.
For the business community, restrictions on pollution and demand for moreefficient energy use mean changes in external conditions and competitiveness. Itis important that changes in external condtitions are announced in advance suchthat firms can take these changes into account in their investment decisions. Evenif measures to improve the state of the environment give social gains in the formof improved environment, better health, improved productivity and less capitaldepreciation - they also in the short run imply costs for the firms and for thesociety. Environmental restrictions also give possibilities to develop and marketnew products. Also this aspect of the follow-up of the Brundtland-Commission isof interest to the business community.
1.3 Follow-up of the SIMEN-project
The SIMEN-project was completed within a few months, with a total researcheffort of three man years. Some of the issues which have been raised in the projectare fairly thoroughly discussed, whereas other important issues are hardly men-tioned in passing. The SIMEN-project can therefore be followed up in severalways.
For the research community, the work on the SIMEN-project has increasedthe recognition that the analytical methods and models developed and used fortraditional economic planning are not well suited for analysis of the relativelyprofound social changes that the Brundtland-Commission seems to imply.
The issues raised in the Brundtland-Commission's report are genuinely multi-diciplinary. The SIMEN-project has to some extent combined social science, natu-ral science and technological knowledge. This kind of multi-diciplinary cooperationhas little tradition in Norwegian research. Both deficiencies of the analytical toolsand problems with combining information from different professional groups makethe conclusions of the SIMEN- project basically qualitatively. They only indicatedirection and magnitude, even though they are based on quantitative analyses.The experiences from SIMEN show that the models and the cooperation betweendifferent diciplines should be further developed. .
An adequate analysis of economic development and environmental issues shouldinclude all sectors and all important pollutants in one framework, and at the sametime draw on ssectoral information. The SIMEN-project has applied sectoral in-formation on manufacturing industries in macro-economic analyses. For severalmanufacturing industries the information has been deficient, especially the infor-mation on technological development and costs of different solutions to environ-
7
mental problems.Pollution from the transportation sector is a source to several increasing en-
vironmental problems, in a Norwegian context far more severe than the environ-mental problems caused by manufacturing industries. It will therefore be of greatinterest to investigate the possibilities to develop and use more energy efficientvehicles, possibly using other mobile fuels than today. The level and compositionof transport demand from households and industries are strongly dependent, onthe localization of work and dwelling areas, and of the supply of public transport.These issues are only rudimentary treated in the SIMEN-project.
The follow-up of the Brundtland-Commission is a prosess which demands aday-to-day comprimising between traditional economic policy, energy and envi-ronmental policies. In this process it is important to avoid short term and costlymeasures against single problems. Instead one should try to manage different en-vironmental problems simultaneously and use measures which contribute to a longterm solution of the problems. A cooperation between researchers, industrialists,civil servants and politicians as in the SIMEN-project can contribute to this.
1.4 Summary of the report
Chapter 2 gives a brief overview of the development of the Norwegian economy,energy consumption and emissions of selected pollutants the last 25 years. Chapter3 discusses the challenges of energy and environmental policies, as seen from today.Chapter 4 deals with the prospects for some of the traditional manufacturingindustries. These chapters give background information for the macro-economicanalyses of chapter 5.

Norwegian economy, energy consumption and pollution 1962-1988
Seen in a historic perspective the economic growth of the western world wasunusually high and stable in the postwar period up to 1973. The economic growthinduced major changes in the composition of industries, also in Norway. Primaryindustries' share of total production and employment were sharply reduced, andthere was a strong growth of production and employment in the service sectors.Manufacturing industries' share of total employment has been steadily reducedsince the 1950s, and the share of total production has stagnated or declined sincethe early 1970s.
In Norway the economic growth in the period 1973-86 was higher than inmost other OECD-countries and unemployment was extremely low compared tointernational standards. This unique Norwegian economic growth was mainly dueto petroleum incomes, which made it possible to maintain a strong growtb indomestic use of commodities and services. Prices and costs have grown fasterthan the OECD average in the 1980s.
After the fall in oil prices in 1985-86, the economic policies in Norway weretightened to curb domestic use of commodities and services. The rest of theOECD area has enjoyed a relatively strong economic growth after 1986, led by aboom in investment demand. This has led to high product prices and high capacityutilization for traditional, Norwegian export competing industries. Combined witha gradual reduction of imports, this has improved the current accounts with morethan 20 billion NOK during 1987-88. (Norway's GDP was 527 billion NOK in1987). Reduced domestic demand has also increased unemployment, and thereare few signs of a transfer of resources from sheltered to competing industries.
Up to 1973 the growth in energy consumption, both electricity and oil products,grew faster than gross national product. Relatively low increases in energy pricescombined with the expansion of power intensive industries in the 1960s, increaseduse of energy in services and households and a strong growth in road transport,contributed to increased energy consumption per unit of gross national product.
The increase in oil prices in 1973-74 and 1979-80 resulted in a sharp reductionin the consumption of oil per unit of gross national product. This was partlydue to a switch from the use of oil to the use of electricity for heating purposes,partly a result of the introdiiction of more energy efficient technology i.e. inthe transportation sector. The price of electricity to the primary market hasalso increased since the end of the 1970s. Higher energy prices, technologicalimprovements and changes in the composition of industries reduced total energyconsumption per unit of gross national product - by 20 percent from 1973 to 1986.

The fall in the crude oil prices in 1986 gave a sharp reduction in keroseneprices, but only a moderate decline in gasoline prices due to the adjustment oftaxes. Despite the fall in kerosene prices, the consumption has fallen the lastfew years, whereas the consumption of transport oils and gasoline have increasedsomewhat. The growth in electricity consumption has been lower the last two yearsthan in the early 1980s, due to industry changes, relatively high price increases inthe primary market and mild winters.
In the ten-year period 1974-84 the State Pollution Control Authority run acleaning program in the manufacturing industries, mainly aiming at reducing emis-sions of pollution to water and air from some large enterprises. The investmentcosts of the cleaning program have been estimated to 5-8 billion 1985-NOK.
The total emissions of SO2 increased sharply up to the beginning of the 1970s.Thereafter the emissions were reduced by 80 per cent from 1970 to 1986 as a resultof increased oil prices and therefore a switch to the use of electricity, introduction ofregulations against emissions from single firms and gradually stronger regulationsof the sulphur contents in heavy oils.
The emissions of NO where tripled from 1962 to 1986, mainly due to increasedtransportation activities. Control measures against NO emissions have only beenin effect since 1989 when all new private gasoline cars should be equipped with acatalytic cleaner.
The growth of CO2 emissions has been hampered by higher oil prices. Increasedtransportation activities contributed, however, strongly to the doubling of CO2emissions in the period 1962-86. So far, no control measures aim at reducing CO2emissions.
Challenges in environmental and energy policies
The report from the World Commission on Environment and Developmentdiscusses the development of natural resources and the state of the environmentin a global prespective. The Commission focuses on the possible dangers of an.increased strain on renewable and conditionally renewable resources. The Com-mission is especially concerned with the limited capacity of the atmosphere andthe ocean areas to absorb residual gases from combustion of fossil fuels and otherpollutants. The combustion of fossil fuels releases carbon dioxides (CO2), whichis one of the major sources to the greenhouse problem. Fossil fuels are also amajor source to emissions of sulphur dioxides (SO2) and nitrogen oxides (N0z)which contribute to the acidification of water and soil, which in turn might leadto damages to human health, loss of species and corrosion costs.
The Brundtland-Commission finds it both possible and necessary to sustain theeconomic growth in industrialized countries and at the same time substantially
10
reduce energy consumption - first and foremost the consumption of fossil fuels.The reason for this "recornmendation" is primarily the pollution which followsfrom the use of fossil fuels, but alSo the concern for the management of depletableenergy resources.
The emissions of SO2 can be reduced to an acceptable level by control measureswhich does not require new technology. There are also several ways of reducingthe emissions of NOE , but it seems more difficult to achieve large reductions inthe short run. The control measures against NO can not be expected to give fulleffect until much of the existing capital equipment is replaced.
The greatest challenge to international environmental policies is probably tofind measures to reduce the releases of greenhouse gases like carl5on dioxide andmethane (CH4). There are available technology to clean CO2 emissions, but thetechnology can only be applied for large point sources and is at the moment ex-tremely costly. Therefore, only a reduction of the consumption of fossil fuels canbring the emissions of CO2 down to an acceptable level.
Norway has in the last 2-3 years signed several international conventions onreduction of emissions:
• 30 percent reduction of SO2 emissions by 1993, compared to the emissionlevel in 1980. The government's target is to reduce emissions by 50 percentover the same period.
• Stabilizing emissions of NO at the 1987-level by the end of 1994 and adeclaration that Norway will aim at a 30 percent reduction by the end of1998.,
4. 50 percent reduction of emissions of chlorofluorcarbons (CFC) by 1991 and90 percent by 1995.
• 50 percent reduction, of emissions of toxic wastes, nitrogen and phosphorousto exposed parts of the North Sea by 1995 compared to 1985-levels.
There are good reasons to believe that the development of international agree-ments on reductions of national emissions will continue. New agreements willappear and existing agreements will be renegotiated. An international agreementon 20 percent reductions of CO2 emissions by the year 2005, has already beenproposed and discussed. This is a relatively moderate proposal compared to theBrundtland-Commissions report which indicates that the industrialized countriesshould reduce their consumption of energy (fossil fuels) by 50 percent whithin30-40 years.
11
It is certainly not reasonable that a small country like Norway should startreducing emissions of CO2 on a unilateral basis. There are, however, severalarguments for the interest in calculating the consequences such an agreement couldhave on the Norwegian economy:
• Norway has been one of the most active countries in the international work,arguing for the benefits of reductions of pullutants, not least through thework of the Brundtland-Commission. The signal effect of a national solutionis therefore important, and might strengthen Norway's credibility.
• It is important to analyse the consequences of an agreement before the agree-ment is signed.
• Even though the emissions of greenhouse gases like CO2 is an internationalproblem, a reduction of domestic use of fossil fuels will have significant pos-itive impacts by a reduction of local pollutants like SO2, NO and particles.Thus, there are good reasons to reduce emissions other than as a contributionto solving global problems.
Administrative or regulatory instruments are the dominating control measuresin Norwegian pollution policy today, whereas economic instruments are hardlyused. Both types of instruments have their strong and weak sides. Two importantevaluation criteria for all instruments are to which extent they give the authori-ties control over the amount of emissions (target efficiency), and if they lead toreductions of emissions at the lowest cost (cost efficiency).
Emission charges seem adequate when the damages are independent of wherethe emissions occur, and if there are many pollutants which otherwise could noteasily be controlled. I.e., indirect taxes or charges seem adequate as instrumentsto reduce the emissions of carbon dioxide, which causes no local damages, butcontributes to the greenhouse effect irrespectively of where the emissions occur.
SIMEN gives a scenario where the indirect taxes on fossil fuels are sharplyincreased. The indirect taxes which correct for external effects will also give publicrevenues. This revenue will reduce the need for other taxes which have distortiveeffects on the economy. In total, a change of the tax system from direct incometaxes to environmental taxes, given tax level, will contribute to a more efficientuse of resources in the economy.
Prospects for selected manufacturing industries
As a background for evaluating possible development paths towards 2000, theSIMEN-project includes several analyses of different manufacturing industries.
12

The focus has been on traditional, energy intensive, export competing industries,e.g. production of aluminium, ferro alloys and pulp and paper.
The analyses of the aluminium and ferro industries, based on micro-data, revealgreat differences in the productivity of individual firms. The input of labour perunit of production varies by 30 percent in both industries. Energy efficiency variesin the same range.
By expanding the capacity of existing firms, both labour and electricity can beused more effeciently, and costs per unit of production can be significantly reduced.It is therefore assumed that at present factor prices there are some possibilities forgrowth in the capacity of existing firms towards the end of the century.
These tentative conclusions are heavily dependent on the price of electricityin future and renegotiated contracts. Production costs in new firms, based on1983-contracts for electricity, are significantly higher than the costs of expandingexisting capacities.
Industry, environment and energy in a macro-economic perspective
Chapter 5 presents several scenarios for the Norwegian economy towards 2000,based on different assumptions on energy supply and environmental restrictions.
The Reference scenario
The economic development of the Reference scenario is somewhat more pes-simistic than in the Governments Long Term Programme 1990-1993. This is
mainly due to different assumptions on oil and gas prices (20 $ 1988-prices perbarrel in 2000 in SIMEN, and 25 $ per barrel in the Long Term Programme). Inaddition the oil production is assumed to decrease faster at the end of the 1990sin SIMEN in the Long Term Programme. Due to lower oil revenues the economicpolicies are less expantionary in SIMEN than in the Long Term Programme.
The calculations are for the next few years characterized by a low increase indomestic use of commodities and services and a moderate growth in the productionin mainland Norway. This should be seen in the context of the extremely highgrowth of domestic use in the period 1984-87 and the belt-tightening after the fallin oil prices in 1986.
For the 1990s, the calculations show and average annual increase of 2 per cent ingross domestic production for mainland Norway. It is assumed that the domesticprice and cost increase is lower than for the OECD area, such that Norway'scompetitiveness is gradually improved. The current accounts show balance from1991 and a surplus for the rest of the 1990s. Norway's net foreign debt is thereforeincreasing the first few years, but is repaid by the year 2000. The calculations
13
show an unemployment rate at the 1988-level until the middle of the 1990s, butunemployment is slightly reduced -towards the turn of the century.
The increase in crude oil prices give an increase in real prices of oil products andgasoline of about 5 percent over the period 1986-2000. It is assumed that energyefficiency will improve by 0.5-1 percent per year in manufacturing industries androad transport.
Total domestic use of electricity increases from 100 TWh in 1986 to 114 TWhin 2000. The power intensive industries are assumed to use 30 TWh per yearover the whole period. The use of heating oils grows by 10-12 percent, whereasthe consumption of transport oils grow by approximately 20 percent during thecalculation period.
In the Reference scenario, no. strong restrictions on energy or environmentalpolicies are imposed. The alternative shows what the consequenses might be iftodays environmental policies are continued. Even if the Reference scenario ischaracterized by a modest economic growth, the increase in activity levels leadto an increase in energy consumption and a relatively rapid growth of emissionsof SO 2 (18 percent), NO (5 percent) and CO2 (20 percent) over the calculationperiod.
The effects of higher oil and gas prices
There is great uncertainty about the development of the crude oil prices onthe world market. With the Reference scenario as a starting point, the impacts ofhigher oil and gas prices are calculated, (25 $ 1988-prices in the year 2000). Highercrude , oil prices will immediately improve Norway's external balance, but highercrude oil prices will also effect the level and composition of energy consumptionand pollution.
In the calculations, higher oil prices lead to a switch from oil to electricity.Electricity consumption increases by approximately 3 TWh and the oil consump-tion decreases accordingly. This induces a reduction in the emissions of 502, NOand CO2 compared to the Reference scenario. If the increased electricity demandis covered by gas power, the CO2 emissions will increase instead of decrease corn-pared with the Reference scenario. Higher crude oil prices will give a significantimprovement of the current accounts. In the calculations, Norway's foreign fi-nancial assets amounts to approximately 20 percent of gross domestic product in2000, measured in current prices. This will allow for a more expantionary economicpolicy and lower unemployment rates than in the Reference scenario.
14

The Gas scenario
In this scenario, the possible consequences for economic activity, energy con-sumption and pollution from increased utilization of Norwegian gas resources arecalculated. It is assumed that exports of natural gas to Sweden is combined withdomestic power production and use of gas for industrial purposes.
The calculations assume the construction of a gas pipeline with a capacity ofapproximately 6 billion Sm3 from Western-Norway to Eastern-Norway and fur-ther to Sweden. Up to 1995 this will lead to higher investments in gas pipelines,distribution net-work and gas fired power stations.
Given the idle capacity in the Norwegian economy, increased investments willlead to increased domestic activity level, incomes and household consumption.Higher domestic activity levels also increase imports and deteriorate the externalbalance compared to the Reference scenario up to the end of the 1990s. Lowerdomestic energy prices, which follows from the increased energy supply, thereafterimproves the competitiveness of Norwegian industries and the export of traditionalcommodities increase. In the last years of the decade, the direct export of naturalgas to Sweden gives higher incomes. In 2000, the calculated gross national productin the Gas scenario is approximately 1.5 percent higher than in the Referencescenario. The external balance is almost unchanged in the year 2000 comparedto the Reference scenario. The economic benefits from an increased depletionof natural gas resources will, however, be more significant after the turn of thecentury.
Lower prices on electricity give an increase in electricity consumption (net) ofapproximately 10 TWh compared to the Reference scenario. The consumption ofoil products is reduced due to a switch to electricity. After 2000, direct use ofnatural gas can replace some of the remaining consumption of oil products.
In 2000 the emissions of SO2 are lower than in the Reference scenario dueto lower consumption of heating oils. The effects on NO-emissions are almostinsignificant in this scenario, whereas CO2 emissions increase by 5-6 million tons,mainly as a result of increased gas power production.
The Environment scenarios
The calculations of the two Environment scenarios, the Regulation and the Taxscenario, illustrate two different policy approaches.
The Regulation scenario discusses which reductions of SO2 and NO can beachieved by regulatory measures against individual firms, stronger restrictions onsulphur contents in oils and new technical restrictions on vehicles. For SO2, itis possible to achieve substantial reductions in emissions by lowering the sulphur
15
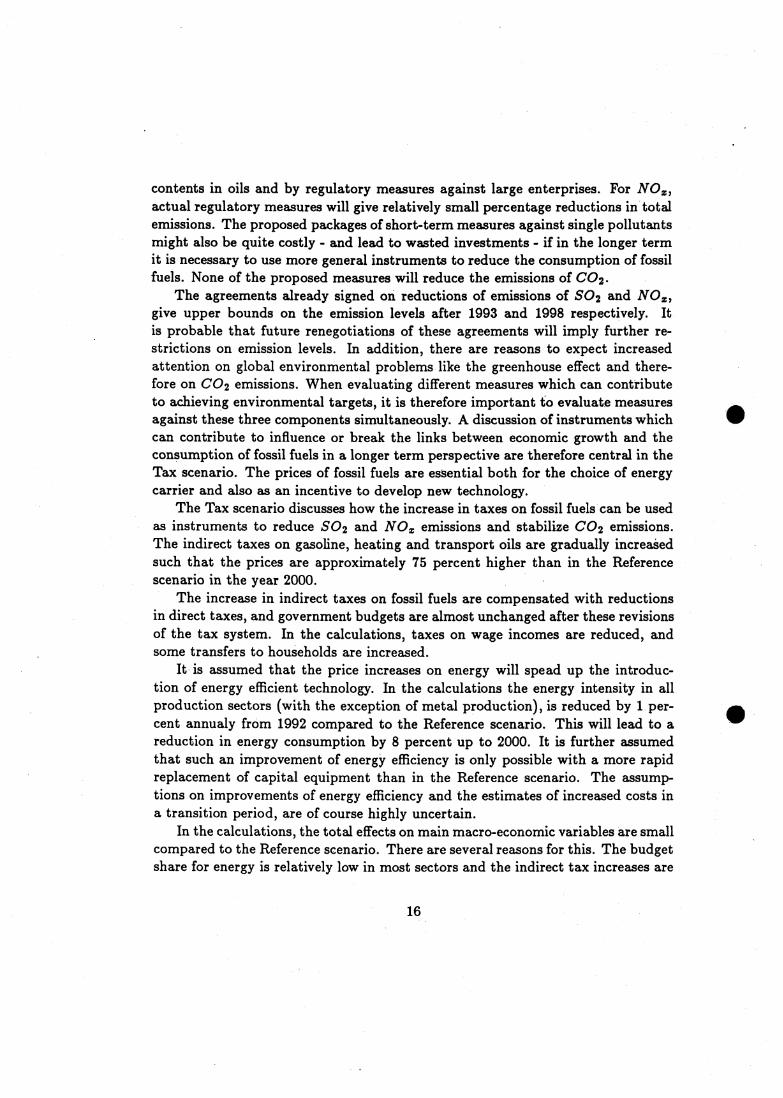
contents in oils and by regulatory measures against large enterprises. For NOE ,actual regulatory measures will give relatively small percentage reductions in totalemissions. The proposed packages of short-term measures against single pollutantsmight also be quite costly - and lead to wasted investments - if in the longer termit is necessary to use more general instruments to reduce the consumption of fossilfuels. None of the proposed measures will reduce the emissions of CO2 .
The agreements already signed on reductions of emissions of SO2 and NOE ,give upper bounds on the emission levels after 1993 and 1998 respectively. Itis probable that future renegotiations of these agreements will imply further re-strictions on emission levels. In addition, there are reasons to expect increasedattention on global environmental problems like the greenhouse effect and there-fore on CO2 emissions. When evaluating different measures which can contributeto achieving environmental targets, it is therefore important to evaluate measuresagainst these three components simultaneously. A discussion of instruments whichcan contribute to influence or break the links between economic growth and theconsumption of fossil fuels in a longer term perspective are therefore central in theTax scenario. The prices of fossil fuels are essential both for the choice of energycarrier and also as an incentive to develop new technology.
The Tax scenario discusses how the increase in taxes on fossil fuels can be usedas instruments to reduce SO2 and NO emissions and stabilize CO2 emissions.The indirect taxes on gasoline, heating and transport oils are gradually increaiedsuch that the prices are approximately 75 percent higher than in the Referencescenario in the year 2000.
The increase in indirect taxes on fossil fuels are compensated with reductionsin direct taxes, and government budgets are almost unchanged after these revisionsof the tax system. In the calculations, taxes on wage incomes are reduced, andsome transfers to hou seholds are increased.
It is assumed that the price increases on energy will spead up the introduc-tion of energy efficient technology. In the calculations the energy intensity in allproduction sectors (with the exception of metal production), is reduced by 1 per-cent annualy from 1992 compared to the Reference scenario. This will lead to areduction in energy consumption by 8 percent up to 2000. It is further assumedthat such an improvement of energy efficiency is only possible with a more rapidreplacement of capital equipment than in the Reference scenario. The assump-tions on improvements of energy efficiency and the estimates of increased costs ina transition period, are of course highly uncertain.
In the calculations, the total effects on main macro-economic variables are smallcompared to the Reference scenario. There are several reasons for this. The budgetshare for energy is relatively low in most sectors and the indirect tax increases are
16
compansatecl by reductions in direct taxes on wage , income. Reductions in directtaxes are assumed to reduce nominal claims on wage increases. The change ofthe tax system from direct to indirect taxation thus leads to small changes inproduction costs for most sectors. At the same time, the productivity of theeconomy is increased by introducing more energy efficient capital equipment.
This combination of instruments reduces the use of fossil fuels without ham-pering continued economic growth. In addition, the reductions of emissions willgive positive effects in the form of better health, less corrosion costs and a cleanerenvironment, which is not reflected in the calculations. There are, however, goodreasons to underline that a major change of the tax system can effect productionand incomes in single firms and regions more substantially than these calculationsshow.
To cover the increased demand for electricity in this scenario, it is assumed thatthe hydro power system is expanded faster than in the Reference scenario. Thiswill lead to higher marginal costs of hydro power production, and the real price'of electricity will be 10 percent higher in the Tax scenario than in the Referencescenario in 2000.
The total consumption of electricity increases by almost 5 percent or 5 TWhcompared to the Reference scenario. This increase is due to higher demand in theprimary market. The power intensive industries are assumed to maintain theirelectricity contracts from the Reference scenario.
The consumption of heating oils and gasoline is reduced by 35 and 19 percent,respectively, while the consumption of transport oils decrease by approximately14 percent compared to the Reference scenario in 2000. The reduction in gasolineand transport oil consumption can partly be seen as a result of more energy effi-cient vehicles, reduced use of private cars and better capacity utilization in roadtransport.
Increased prices of energy lead to an increased potential for energy economizing.Better organization of the electricity market, restructuring of old power plants,improvements of the distribution and transmission networks, increased use of heatpumps etc., can probably increase significantly the capacity of the existing hydropower system at the prices which are assumed in the Tax scenario. This potentialis not harvested in the calculations.
The emissions of SO2 are 82 kilotons in 2000, reduced by h kilotons comparedto the Reference scenario due to lower consumptibn of fossil fuels and a switch tooils with lower sulphur contents. The percentage reduction is largest for heatingoils, (stationary combustion) where the SO2 emissions are reduced by close to 50percent.
17

The total emissions of NO are 223 kilotons in 2000, 35 kilotons lower than inthe Reference scenario and 22 kilotons lower than in 1987. The largest percentagereduction of NO emissions compared to the Reference scenario is in stationarycombustion, while the absolute reduction is largest for mobile sources.
In the Tax scenario, the CO2 emissions are stabilized at 1987 level. Totalemissions of CO2 in 2000 is 36 million tons compared to 43 million tons in theReference scenario. The emissions from industrial processes are higher in 2000than in 1987 since these emissions are linked to the production level in pollutingindustries. The emissions from mobile sources are reduced at the same rate as thereduction of mobile fuels.
To achieve the Goverments target on 50 percent reduction in SO2 emissions, itseems necessary to introduce new regulations against single firms, in addition tothe increase in indirect taxes. The Government's target of 30 percent reduction ofNO emissions within 1998 seems quite difficult to achieve without policy measuresthat induce technological changes in ocean transport and fisheries, in addition tonew restrictions on road transport.
1.5 Conclusions
The macro-economic calculations indicate that it will be possible to achieve balanceon the current accounts in the early 1990s and to repay the extèrnal debt by theend of next decade. The conditions are that productivity is increased and thatdomestic increases in prices and costs are lower than in competing countries, suchthat the Norwegian competitiveness is improved.
The greatest challenge to environmental policies seems to be a stabilization orreduction of CO2 emissions, since that requires a reduction in the consumptionof fossil fuels. However, a reduction in fossil fuels will also give reductions in theemissions of NO and SO 2 .
The calculations indicate that it is possible to maintain an acceptable eco-nomic growth combined with compliance to international environmental agree- ,
ments, through a combination of economic and regulatory instruments. Calcu-lated main economic indicators like gross national product and total consumption,vary almost insignificantly between different scenarios, while the restructuring ofthe tax system from direct wage taxes to environmental charges gives significantenvironmental gains.
It should be underlined, though, that the proposed changes of the tax systemare relatively dramatic. In the Tax scenario the indirect taxes on oil products areincreased by 10-12 billion NOK, combined with a similar reduction in wage taxes.It is therefore questionable if the applied model has captured all the consequences
18

of the restructuring of the tax system. The consequences for production andincomes of single firms and industries, and hence for the total economy, can be
/ larger than the calculations indicate.Energy consumption and emissions to air are quite different in the different
scenarios. In the Tax scenario, the consumption of fossil fuels are stabilized, butthe total domestic energy consumption grows by approximately 7 percent from1987 to 2000. Even with a sharp increase in energy prices, it seems difficult tostabilize energy consumption.
The emissions of SO2 is approximately 82 kilotons in 2000 in the Tax scenario,included emissions from ocean transport and petroleum activities. This is 45percent lower than the 1980 level. The agreement on 30 percent reduction fromthe 1980 level is thus clearly within reach.
The emissions of NO in the Tax scenario is 10 percent lower in 2000 than in1986. The declaration on 30 percent reduction of NO emissions will thus not beachieved without stronger restrictions on road and ocean transport.
The emissions of CO2 are stabilized in the Tax scenario relative to the 1987level, but it seems quite difficult to achieve a sustained reduction in CO2 emissions,without new technological solutions, especially in the transportation sector.
If economic growth is increased compared to the SIMEN calculations, the chal-lenges to the energy and environmental policies will increase - given energy tech-nologies. On the other hand, higher economic growth will also improve the abilityto carry costly environment programs, including energy research, and increase thepossibilities for industrial restructuring.
In addition to the instruments analysed in the SIMEN-project, there are severalmeasures which could contribute to a reduction in fossil fuel consumption andhence give less pollution, especially of NO and CO2. Some measures are:
• Improve land use planning to reduce the need for transportation betweendwelling areas, workplace, shops, kindergardens and other service institu-tions.
• Improve the supply of public transport in urban areas
• Differentiate sales taxes on motor vehicles by energy efficiency
• Improve the efficiency of the electricity market; equalization of prices betweendifferent consumer groups, peak load pricing, rationalization and better or-ganization of supply units. A more efficient use of hydro power resourceswill reduce the need for production of electricity based on natural gas
• Reduce the growth of transportation by regulatory measures
19

• Improve the possibilities for using natural gas directly as a substitute for oilfor heating and transportation purposes.
20

Norwegian Economy, Energy Consumption and Pol-lution 1962-1988
2.1 Introduction
Seen in a historic perspective, the economic growth of the western world was highand stable in the post-war period up to 1973. The increase in the Norwegian grossnational product was on line with the increase in the other European OECD-countries up to the beginning of the 1970s. While the economic growth in thesecountries decreased markedly after 1973, it continued in Norway up to 1986. Thisunique Norwegian economic growth was mainly due to petroleum incomes, whichmade it possible to maintain a strong growth in domestic use of commodities andservices. The growth of mainland Norway decreased, compared to the previousdecade, but not as strongly as in the other European OECD-countries.
The economic growth has induced profound structural changes in the Norwe-gian economy. Primary industries' share of total production and employment weresharply reduced, while employment in the service sectors increased rapidly. Man-ufacturing industries' share of total employment has been steadily reduced sincethe 1950s, and the share of total production has stagnated or declined since theearly 1970s.
The economic growth and structural changes have led to great changes inthe picture of energy consumption. In the 1950s and 1960s, process industriesconsumed more than half of the energy demand, while the major part today goesto heating purposes and electricity specific equipment in services and households.The oil price increases in the 1970s initiated a substitution from oil products toelectricity for heating purposes. Domestic electricity prices grew strongly in thefirst half of the 1980s. These increases in energy prices have induced a decline inthe growth of total energy consumption.
Economic growth and increased consumption of fossil fuels have led to a contin-uous and strong increase in the emissions of NO and CO2 in the post-war period.The emissions of SO2 have, however, been substantially reduced the last 10 to 15years as a result of control measures against process emissions from manufactur-ing industries and regulations of the sulphur contents in oil products. The switchfrom oil products to electricity for heating purposes, as a result of strongly increas-ing oil prices up to 1985, has dampened the growth of emissions from stationarycombustion.
21
3.0 •Mainland Norway
- -- Primary Industries Mining and Manufacturing
2.5- Services
2.0 •
- 1.5 •
1.0 •
.5-
o .1611•11111e1111111114teseel
1962 1966 1970 1974 1978 1982 1986
2.2 Economy, Energy Consumption and Pollution 1962-1986
Economy
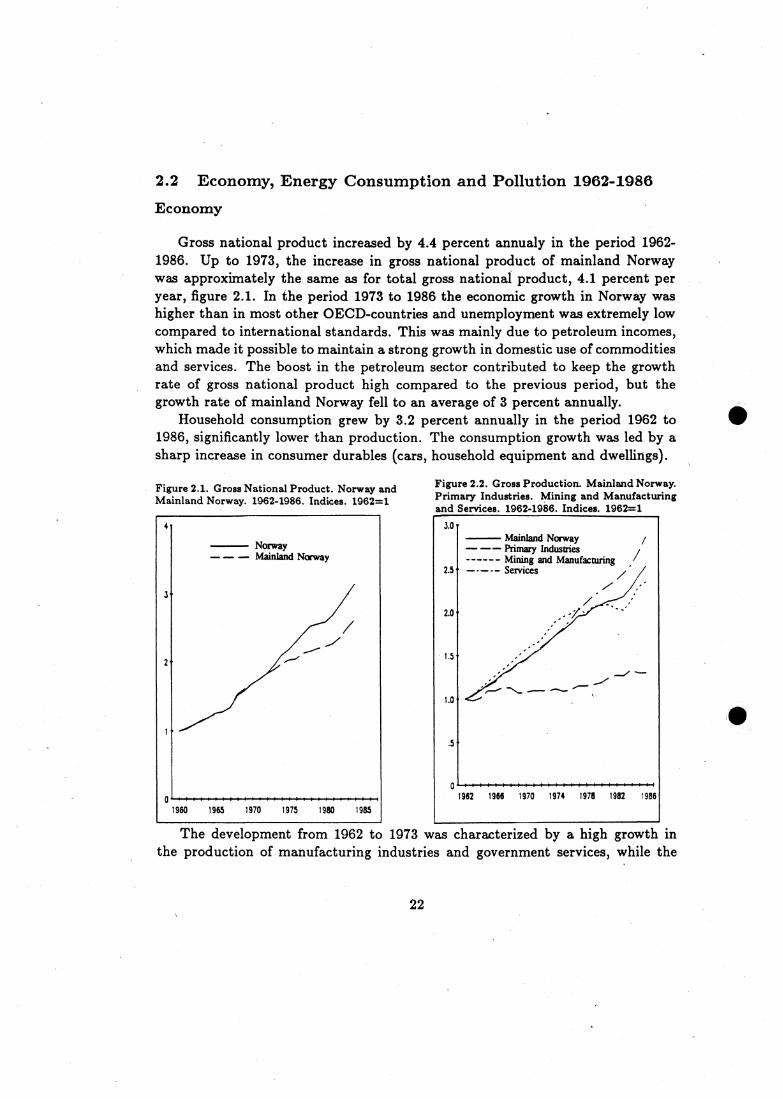
Gross national product increased by 4.4 percent annualy in the period 1962-1986. Up to 1973, the increase in gross national product of mainland Norwaywas approximately the same as for total gross national product, 4.1 percent peryear, figure 2.1. In the period 1973 to 1986 the economic growth in Norway washigher than in most other OECD-countries and unemployment was extremely lowcompared to international standards. This was mainly due to petroleum incomes,which made it possible to maintain a strong growth in domestic use of commoditiesand services. The boost in the petroleum sector contributed to keep the growthrate of gross national product high compared to the previous period, but thegrowth rate of mainland Norway fell to an average of 3 percent annually.
Household consumption grew by 3.2 percent annually in the period 1962 to1986, significantly lower than production. The consumption growth was led by asharp increase in consumer durables (cars, household equipment and dwellings).
Figure 2.1. Gross National Product. Norway andMainland Norway. 1962-1986. Indices. 1962=1
Figure 2.2. Gross Production. Mainland Norway.Primary Industries. Mining and Manufacturingand Services. 1962-1986. Indices. 1962=1
The development from 1962 to 1973 was characterized by a high growth inthe production of manufacturing industries and government services, while the
22

increase in production of private services was relatively low. The production ofprimary industries grew only moderately in this period.
From 1973 to 1986 the price and cost inflation in Norway was higher thanfor most trading partners. This deteriorated the competitiveness of traditionalexport and import competing industries and led to a stagnation of manufacturingindustries. The growth in the service sector was relatively high in this period,figure 2.2.
Total employment grew steadily in the period 1962 to 1986, but significantlylower than the growth of production. From 1962 to 1973 the growth of man-yearswas on average slightly below 1 percent annually and from 1973 to 1986 slightlyabove 1 percent.
Energy consumption
In the period 1962-1973, the growth in energy consumption (electricity and oilproducts) in mainland Norway was approximately 6.5-7.0 percent on average, i.e.significantly higher than the growth of production, figure 2.3. The consumptionof electricity grew somewhat stronger than the consumption of oil products, eventhough the relative prices of electricity and oil products were stable in this period.This development was due to the strong increase in power intensive industries andincreased stocks of electricity consuming equipment in households and services.
Stable energy prices, strong growth in power intensive industries, increasedconsumption of energy per unit of production in services, strong growth in house-holds' energy consumption and growth in road transport contributed to an increasein the energy intensity (total oil and electricity consumption compared to grossnational product in mainland Norway) in the period 1962 to 1970, figure 2.4.
In the period 1973 to 1986 the growth rate of energy consumption in mainlandNorway was only half of the growth rate of production. Increases in energy prices,both in Norway and internationaly, induced a substitution away from energy in-tensive products. The growth rates of Norwegian power intensive industries andpulp and paper production were only moderate in this period.
The increase in oil prices in 1973-74 and 1979-80 resulted in a decline in theconsumption of oil per unit of production, partly as a result of a substitutionfrom oil products to electricity for heating purposes, and partly as a result oftechnological changes in the transport sectors, figure 2.3. Sharply increased energyprices reduced the energy intensity by approximately 20 percent from 1973 to 1986,figure 2.4. In the mid-1980s, the oil product prices fell at the same time as theelectricity prices were increased. This change in relative prices contributed to ahalt in the substitution from oil products to electricity for heating purposes.
23
Gross ProductionElectricity r\Oil ProductsTotal Energy2.5 Employment r-
t• '1\ /,
2.0
' 1/74
1.5„.
1.0
3.0•■■••■■ •■■■■.
O1962 1966 1970 1974 1978 1982 1986
•
.•••\
------- Electricity— — Oil Products Total Energy
.4•
.2
01962 1966 1970 1974 1978 1982 1986
1.6*
1.4*
1.2 •
1.0*
.8'
.6*
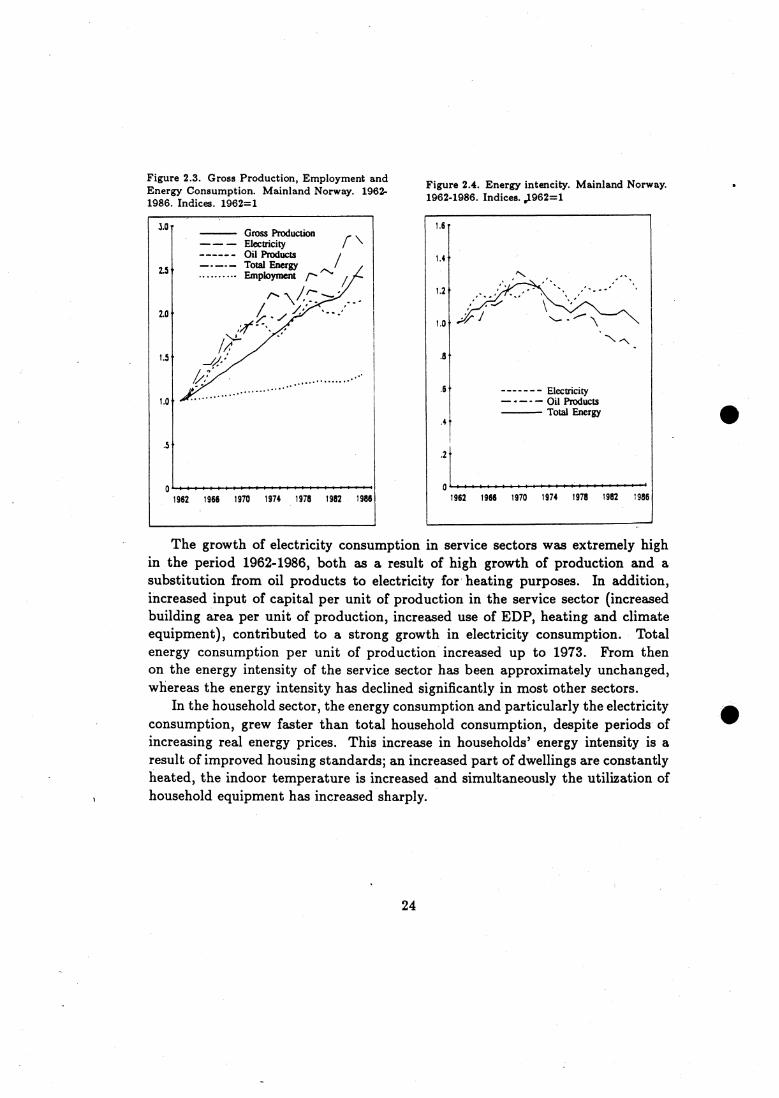
Figure 2.3. Gross Production, Employment andEnergy Consumption. Mainland Norway. 1962-1986. Indices. 1962=1
Figure 2.4. Energy intencity. Mainland Norway.1962-1986. Indices. ,1962=1
The growth of electricity consumption in service sectors was extremely highin the period 1962-1986, both as a result of high growth of production and asubstitution from oil products to electricity for heating purposes. In addition,increased input of capital per unit of production in the service sector (increasedbuilding area per unit of production, increased use of EDP, heating and climateequipment), contributed to a strong growth in electricity consumption. Totalenergy consumption per unit of production increased up to 1973. From thenon the energy intensity of the service sector has been approximately unchanged,whereas the energy intensity has declined significantly in most other sectors.
In the household sector, the energy consumption and particularly the electricityconsumption, grew faster than total household consumption, despite periods ofincreasing real energy prices. This increase in households' energy intensity is aresult of improved housing standards; an increased part of dwellings are constantlyheated, the indoor temperature is increased and simultaneously the utilization ofhousehold equipment has increased sharply.
24

Gross Production— — — — Electricity Oil Products
— — - Total Energy Employment
1962' 1966 1970 1974 1978 1982
Oil Consumption— — SO,----- - NO.----- CO,
1962 1966 1970 1974 1978 1982 1986
Figure 2.6. Consumption of Oil Products andEmission of SO2, NO and CO2. Norway. 1962-1986. Indices, 1962=1
Figure 2.5. Gross Production, Employment andEnergy Consumption. Service Sectors. 1962-1986. Indices. 1962=1
Pollution
The emissions to air of SO2, NO and CO2 grew more or less propotionatelyto oil consumption over the period 1962- 1973.
The increases in oil prices in 1973-74, together with the clean up programfor older manufacturing industries, reduced the sulphur emissions sharply. Newregulatory measures of the sulphur contents in heating oils and the oil price shockin 1979-80 further reduced sulphur emissions. Altogether, the emissions of SO2were reduced by 80 percent from 1970 to 1986. The emissions where 100 000 tonsin 1986 against 110 000 tons in 1960.
The growth rate of NO emissions was almost halved in the period 1973-1986compared to the period 1962-1973, due to higher oil prices and therefore lowergrowth in oil consumption. The growth in emissions was, however, faster than thegrowth in total oil consumption over the period 1962-86, due to a faster growthin the consumption of transport oils than in the consumption of heating oils, andthe NO emissions are higher for the high temperature combustion of transportoils. The emissions were approximately 244 000 tons in 1986, against 80 000 tonsin 1960, i.e. a trippeling in the emissions over the period.
25

Table 2.1. Total emission to air
1960 1973 1986
SO, (1000 tons) 110 162 100NO (1000 tons) 80 190 244CO, (Mill. tons) 16 30 35
The growth in total CO2 emissions decreased from 5 percent annualy in theperiod 1962-1973 to slightly above 1 percent from 1973 to 1986. The growth intotal CO2 emissions in this period were lower than the growth in oil consumptionas a result of lower growth in the emissions from process industries. The emissionswere approximately 35 million tons in 1986, against 16 million tons in 1960, i.e.more than a doubling over the period.
In 1960, stationary combustion was a major source of the total SO2 emissions,approximately 60 percent. In 1986, the emissions from processes contributed toapproximately 44 percent, while the emissions from stationary combustion andmobile sources both contributed to 25 to 30 percent.
Mobile combustion is a main source to NO emissions. Mobile sources in-creased their share from 65 percent in 1960 to 85 percent in 1986.
In 1986 approximately 45 percent of the emissions of CO2 came from mobilesources, 41 percent from stationary combustion and 14 percent from industrialprocesses. As a result of the strong increase in transport oil consumption, theshare of mobile sources has increased from 30 percent in 1960 to 45 percent in1986. The share of stationary combustion has declined from 64 to 41 percent, dueto the substitution from heating oils to electricity.
2.3 Economy, Energy Consumption and Pollution 1986-1988
The economic development, energy consumption and pollution of SO2, NO andCO 2 for the last two years, are commented on below based on preliminary figuresfrom the national accounts, the energy accounts and the accounts for emissions toair.
26
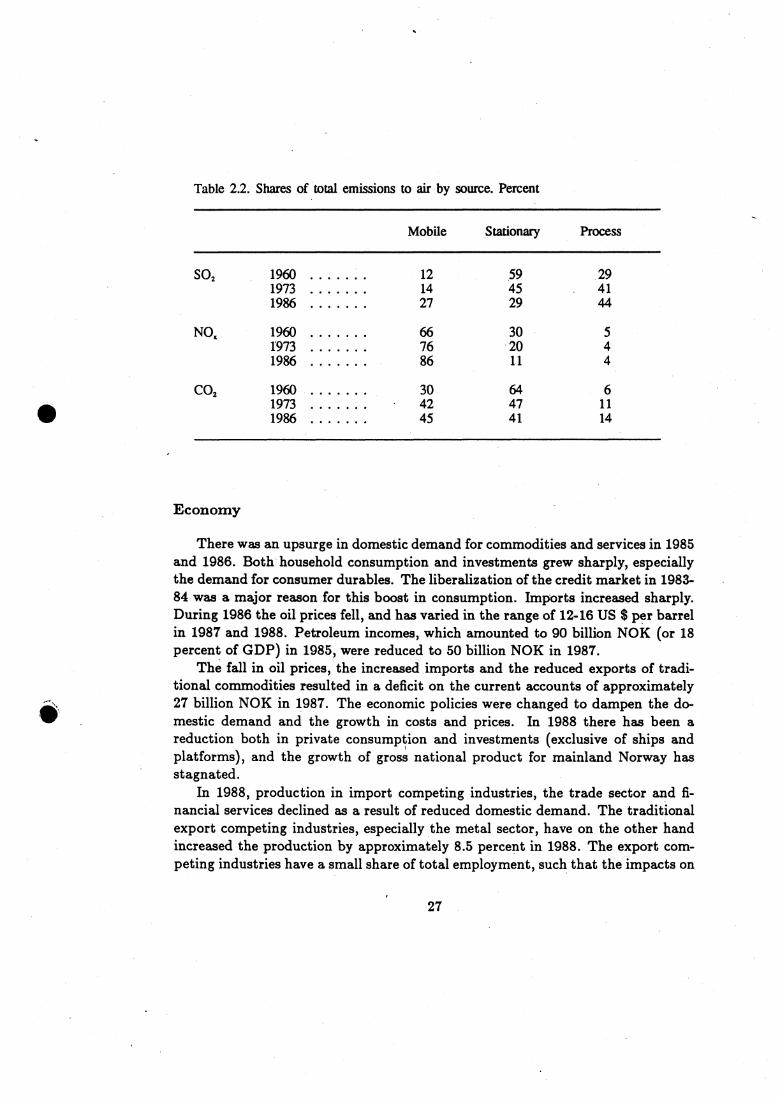
Table 2.2. Shares of total emissions to air by source. Percent
Mobile Stationary Process
SO, 1960 12 59 291973 14 45 411986 27 29 44
NO 66 30 51973 76 20 41986 86 11 4
CO, 1960 •• OOOOO 30 64 61973 42 47 111986 OOOOO •• 45 41 14
Economy
There was an upsurge in domestic demand for commodities and services in 1985and 1986. Both household consumption and investments grew sharply, especiallythe demand for consumer durables. The liberalization of the credit market in 1983-84 was a major reason for this boost in consumption. Imports increased sharply.During 1986 the oil prices fell, and has varied in the range of 1246 US $ per barrelin 1987 and 1988. Petroleum incomes, which amounted to 90 billion NOK (or 18percent of GDP) in 1985, were reduced to 50 billion NOK in 1987.
The fall in oil prices, the increased imports and the reduced exports of tradi-tional commodities resulted in a deficit on the current accounts of approximately27 billion NOK in 1987. The economic policies were changed to dampen the do-mestic demand and the growth in costs and prices. In 1988 there has been areduction both in private consumption and investments (exclusive of ships andplatforms), and the growth of gross national product for mainland Norway hasstagnated.
In 1988, production in import competing industries, the trade sector and fi-nancial services declined as a result of reduced domestic demand. The traditionalexport competing industries, especially the metal sector, have on the other handincreased the production by approximately 8.5 percent in 1988. The export com-peting industries have a small share of total employment, such that the impacts on
27

the labour market have been insignificant. Lower domestic demand has resultedin a decline in imports of traditional commodities. This has, together with the in-creased export of traditional industries, reduced the deficit of the current accountsby more than 10 billion NOK to 13.5 billion NOK in 1988 (exclusive of ships andplatforms).
The domestic price and cost inflation was at the end of 1988 down on thesame level as the rest of the OECD-area. Measured as relative labour cost perunit of production, the import competing industries still lost competitive edgein 1987 and 1988, while traditional export competing industries increased theircompetitiveness. In 1988 the labour productivity in manufacturing industries,measured as gross product per hour, increased by 2.7 percent. The growth inproductivity was, however, slow for import competing industries and part of theservice sectors, where production declined.
Energy Consumption
Total energy consumption in mainland Norway increased by approximately0.3 percent per year in the period 1986-88. The growth was due to increasedproduction in power intensive industries and an increase in oil consumption fortransportation purposes. In all other sectors, total energy consumption declinedby 2 perce-nt per year. Much of the decline was, however, due to the fact that 1988was a milder year than 1986. Corrected for differences in temperature, the declinewas only 0.5 percent per year.
Electricity consumption increased by 1.8 percent per year. Some of the increasewas due to supply of cheap, surplus hydro power, used as a substitute for oil,ecpesially in the pulp and paper industry.
Total domestic consumption of oil products was almost unchanged from 1986to 1988. The consumption of heating oils declined by approximately 11 percentper year. About 40 percent of this decline was compensated by consumption ofsurplus hydro power.
The prices of crude oil fell sharply through 1986. This change in relative energyprices ended the relatively strong substitution from oil to electricity for heatingpurposes, experienced earlier in the 1980s.
Pollution
Total emissions of 502 declined from 100 000 tons in 1986 to 88 000 tons in1988. The shut-down of the copper smelter in Sulitjelma reduced the emissionsby 12 000 tons, the rest was due to a decline in the consumption of heating oils.
28

Preliminary figures indicate that the emissions have fallen further from 1987 to1988.
The total emissions of NO increased from 244 000 tons in 1986 to approx..imately 245 000 tons in 1987. Preliminary figures for 1988 indicate a moderatedecline from 1987.
The total emissions of CO2 increased from 35 to 36 million tons from 1986 to1987, and probably declined 1-2 million tons from 1987 to 1988.
•
29
3 Challenges in Environmental and Energy Policies
3.1 Challenges and Targets in Environmental Policies
The report from the World Commission on Environment and Development dis-cusses the development of natural resources and the state of the environment in aglobal perspective. The Commission focuses on the possible dangers of an increasedstrain on renewable and conditionally renewable resources. The Commission is es-pecially concerned with the limited capacity of the atmosphere and the oceanes toabsorb residual gases from combustion of fossil fuels and other pollutants.
The Brundtland Commission finds it both possible and necessary to sustainthe economic growth in industrialized countries and at the same time substan-tially reduce energy consumption - first and foremost the consumption of fossilfuels. The Commission draws several energy scenarios in the report. The mainalternative can be interpreted as a target of 50 percent reduction in the indus-trialized countries' use of fossil fuels from 1985 to 2030, at the same time as theeconomic growth in these countries are kept at 3 to 4 percent annualy. The rea-son for this "recommendation" is primarily the pollution which follows from theconsumption of fossil fuels, but also the concern for the management of depletableenergy resources.
Environmental effects of air pollution
One of the most alarming effects of air pollution is that some of the pollutantsmight change the heat balance of the earth. This is referred to as the greenhouseeffect, which is a result of increased concentration of greenhouse gases in the at-mosphere. These gases function in the same way as a greenhouse roof, trappingthe heat radiation from the earth. The greenhouse gases include chlorofluorcar-bons (CFC), methan (CH4), dinitrogenmonoxide (N20) and carbondioxid (CO2).Reduced vegetation, i.e. through deforestation in tropical areas, contributes tothe increased concentration of CO2 in the atmosphere, since plants absorb CO2in the growth process. The CO2 concentration is estimated to contribute to ap-proximately half of the greenhouse effect. It is estimated that the concentrationof carbondioxid in the atmosphere has increased by 8 percent since 1958 and by25 percent 1750. If this increase continues, the average temperature of the earthwill increase substantially in the longer run.. In the stratosphere (10-15 kilometers over the earth's surface), an ozone layer
protects the earth against ultra violet radiation from the sun. Emissions of CFCand NO contribute to deplete this ozone layer. A depletion of the ozone layer willincrease the exposure of ultra violet radiation at the earth's surface, and probably
30
increase the incidents of skin cancer, and possibly reduce both terrestrial andoceanic plant growth. Monitoring data indicate that the ozone layer is alreadyeffected, especially over Antartic.
Sulphur dioxid, ii the combination with particulates, increases the risk of respi-ratory illnesses. High concentrations of SO2 might damage vegetation and increasecorrosion. Norwegian emissions of 502 contributes to approximately 10 percentof the total deposition of sulphur in Norway, the rest is "imported" as acid pre-cipitation.
Nitrogen oxides, especially NO2, can at high concentrations increase the risk ofrespiratory illnesses. Nitrogen oxides also contribute to the acidification of soil andwater. In the last 10 years, NO has been an increasing source to the acidificationof Norwegian waters, both absolutely and relative to the contribution from SO2 .
Reductions of emissions
If past trends of economic growth, energy consumption and pollution continue,the world risks unacceptable and irreversible environmental damages. Even if therisk of catastrophic environmental events might be small, it is still rational tohedge against events like great climatic changes, which might bring the iearth'secological balance at peril.
A rational attitude imply that the decision makers of the economy should begiven incentives to take into account the costs and damages which other actorsindirectly suffer in the form of pollution of air, water and soil, and in the form ofmismanagement of depletable or conditionally depletable resources. Increased useof environmental charges and other economic instruments will give the consumersand producers incentives to take into account such indirect effects.
The emissions of 502 can be reduced to an acceptable level by control measureswhich does not require new technology. There are also several ways of reducingthe emissions of NOS , but it seems more difficult to achieve large reductions inthe short run. The control measures against NO can not be expected to give fulleffect until much of the existing capital equipment is replaced.
The greatest challenge to international environmental policies is probably tofind measures to reduce the emissions of greenhouse gases like carbon dioxid andmethan (CH4); There are available technology to clean CO2 emissions, but thetechnology can only be applied for large point sourceg and is at the moment ex-tremely costly. Therefore, only a reduction of the use of fossil fuels can probablybring the emissions of CO2 down to an acceptable level.
31
International agreements
Norway has in the last 2-3 years signed several international conventions onreductions of emissions.
• 30 percent reduction of CO2 emissions by 1993, compared to the emissionlevel in 1980. The government's target is to reduce emissions by 50 percentover the same period.
• Stabilizing emissions of NOx at the 1987 level by the end of 1994 and adeclaration that Norway will aim at a 30 percent reduction by the end of1998.
• 50 percent reduction of emissions of chlorofluorcarbons (CFC) by 1991 and90 percent by 1995.
• 50 percent reduction of emissions of toxic wastes, nitrogen and phosphoronsto exposed parts of the North-Sea by 1995, compared to the 1985 levels.
There are good reasons to believe that the development of international agree-ments on reductions of national emissions will continue. New agreements willappear and existing agreements will be renegociated.
An international convention on 20 percent reduction of CO2 emissions by theyear 2005, has already been proposed and discussed. This is a relatively moderateproposal compared to the Brundtland Commission's report, which indicates thatthe industrialized countries should reduce their consumption of energy (fossil fuels)by 50 percent within 30 to 40 years. In principle, a climate agreement shouldinclude all greenhouse gases and give incentives to a cost efficient allocation of thereductions, where e.g. the national absorbtion capacity in the form of vegetationis taken into account.
Measures against CO2 emissions
Conventions on reductions of emissions of SO2 and NO are designed as equalpercentage reductions of gross emissions in all countries which have signed theagreements. It is not obvious that a future CO2 agreement will be a blueprint ofthese earlier conventions.
Global reductions of emissions of CO2, NO and SO2 could most efficientlybe achieved by reducing the consumption of coal, the fossil fuel which pollutes themost. Measured per theoretical energy contents the combustion of coal on averagereleases 45 percent more emissions of CO2 than oil, which in turn gives 35 percent
32

higher emissions than natural gas. The differences are even greater if one takesinto account the efficiency of thermal power stations.
USA, China and the Soviet Union are the major consumers of coal. If globalCO2 emissions should be reduced, the effects on the energy markets will greatlydepend of the behaviour of these great consuming countries, with respect to theircionsumption of coal and other energy carriers as oil, natural gas, hydro power,nuclear energy, wave, wind, and solar energy.
Per capita, Norwegian emissions of CO2 are relatively high. Norway has 1perxnille of the world's population and contributes to approximately 2 permille ofthe worlds total CO2 emissions. This is due to several factors. First, the levelof production and consumption in Norway is one of the world's highest. Second,the energy consumption for heating purposes is fairly high due to climatic condi-tions. Third, Norwegian heavy industries contribute to CO2 emissions. Fourth, adispersed settlement require a relatively extensive use of transportation.
It is certainly not reasonable that a small country like Norway should startreducing emissions of CO2 on a unilateral basis. There are, however, severalarguments for the interest in calculating the consequences which a CO2 conventionmight have on the Norwegian economy:
• Norway has been one of the most active countries in the international work,arguing for the need for reductions of pollutants, not least through the workof the Brundtland Commission. The signal effect a national "solution" mighthave, and Norway's credibility is therefore important.
• It is of interest to • analyze the consequences of an agreement before theagreement is signed.
• Even though the emissions of greenhouse gases like CO2 is an internationalproblem', a reduction of domestic use of fossil fuels will have significant localimpacts, by reducing pollutants like 502, NO and particulates. Thus, thereare good reasons to reduce emissions other than a.,1 a contribution to solvingglobal problems.
3.2 Challenges in Energy Policies
In an international context, Norway is in a very favourable energy situation. Nor-way is self-sufficient of energy and a major exporter of oil and natural gas. Nor-wegian energy policies are therefore concerned with a rational management of theNorwegian energy resources to exports and domestic consumption.
33
An almost unique feature of Norwegian energy consumption is the high shareof hydro power. Compared to electricity production based on fossil fuels, hydropower production is clean.
In 1987 the Norwegian indiginous energy consumption (exclusive of shipping)was based on 50 percent renewable energy carriers (45 percent hydro power, 4 per-cent bioenergy) and 50 percent fossil fuels. In comparison, the worlds total energyconsumption consists of approximately 80 percent fossil fuels (British petroleumstatistics, 1985). Norwegian energy consumption per capita is among the world'shighest.
The market for oil products in Norway is based on world market prices for crudeoil, but with significant amounts of fiscal taxes. The electricity market is stronglyregulated. This might lead to non-optimal consumption both of oil products andelectricity. The external costs of oil consumption is not accounted for in todaysenergy market. Policy measures against the consumption_of oil could therefore toa great extent be deduced from environmental targets.
Hydro power is based on a renewable natural resource, but the productionof hydro power also exploits conditionally renewable resources, such as unspoilednature. A reduction of unspoiled nature and recreational services, have to becalculated as a cost in the utilization of hydro resources, and should be revealedin the prices of hydro power.
The Norwegian authorities have to make two central decisions in their manage-ment of hydro resources: capacity expansion and prices. An optimal managementof hydro power resources should be based on the following principles:
fb All consumers should pay - the same price, corrected for user time and differentdistribution costs.
e Prices should be set such that the capacity is utilized at any point in time.The prices should, however, not be lower than the cost of producing an extraunit within the given capacity (short term marginal cost).
fb The cost of increasing capacity of energy supply with one unit is called thelong term marginal cost. The long term marginal cost is a principle fordetermining the optimal capacity. If the market price continuously is abovethe long term marginal cost, it is profitable to expand the capacity.
Several of these basic principles for a rational management of hydro powerresources are violated today. The power intensive industries pay a lower price thanother consumers. Also in the primary market, there aré great regional differencesin prices between consumer groups.
34

An equalization of prices would lead to a better allocation of hydro power inthe economy. All consumers would then have the same incentives to economize,and those who are not willing to pay the market price, would be out of the market.
In Norwegian hydro power production, marginal costs are an increasing func-tion of capacity. In an optimal market, this should lead to a significant economicrent. In toda,ys market this economic rent is distributed to those consumers whopay low prices, and are given incentives to overutilize a valuable natural resource.
The price prospects for electricity are highly uncertain. Future prices depende.g. on the costs of producing gas power, the organization of the electricity marketand the possibilities for exports. Possible restrictions on the emissions of CO2,create uncertainty as to which role gas power could play in a longer perspective.The supply of energy could therefore be a limiting factor for the economic growthof the mainland economy.
In todays market, consumers pay the same price for electricity irrespectively ofthe time of consumption, except in the market for surplus power where the priceis determined on a daily basis by auction. By differentiating the electricity pricesover the day and over the season (i.e. peak load pricing) the hydro power resourceswould be better utilized, and the need for further expansion of the power systemwould be less.
Better organization of the electricity market, rationalization and improvementsof old power plants, improvements of the distribution network, more energy effi-cient production and transportation technology, increased use of heat pumps etc.,are measures which would increase the existing hydro power capacity.
If prices on fossil fuels and electricity are increased, unconventional energycarriers as biofuels (wood, peat) and wind or wave energy could cover some of theenergy demand. The supply of such unconventional energy carriers will of coursebe dependent on ithe costs of production (inclusive of environmental costs), and theprices of these alternatives relative to hydro power and conventional fossil fuels.
The development of new and more energy efficient technology is dependent onthe prices of energy. The higher the prices of energy, the higher is the probabilityfor a rapid technological development. Energy policies are, therefore, indirectly adeterminant of the speed of technological development.
3.3 Instruments in Environmental - and Energy Policies
Instruments in environmental policies
A sub-group of the SIMEN-project (see Appendix 1) has evaluated todays useof instruments in environmental policies. The group tried in particular to evaluate
35

the adequacy of increased use of economic incentives. The work of the group ispresented in a sub- report.
The instruments of environmental policies are normally divided into two broadgroups: Administrative and economic instruments. Administrative instrumentscomprise sets of rules or regulations of how much a producer or consumer couldpollute. To these regulations are tied non-compliance fees or sanctions againstthe polluters if quotas are exceeded. Economic instruments aim at changing thebehaviour of economic actors, by changing relative prices. Examples of economicinstruments are charges on emissions or taxes on commodities which lead to pol-lution, deposit-refund systems and tradeable emission quotas.
The use of administrative instruments today
Administrative or regulatory instruments are the dominating control measuresin Norwegian pollution policies today. The Pollution Act is the legal foundation forthe regulation of pollution and waste from manufacturing industries and offshoreactivities. The Products Control Act is the basis for regulation of hazardousproducts.
The emissions from manufacturing industries are mainly regulated through aconcession or quota system. Approximately 1500 establishments are regulatedthrough this concession system. The concessions give a complete and detailedframework for polluting activities within these establishments. The core of a con-cession is maximum emissions of different pollutants.
The State Pollution Control Authority classifies establishments according theamount of pollution. The heaviest polluters are found withing the aluminium.industry, pulp and paper industry, ferro-alloy industry, refineries, and petrochem-ical industry. Class 2 comprises mines, food processing industries and some firmswithin paper production. Class 3 comprises some food producers, some pulp andpaper industries, plastic and chemical industries.
So far, the concessions have been designed within a negotiation system wherethe State Pollution Control Authority and the individual firm have tried to agreeon a solution where the concern for the environment is balanced against concern forproduction and employment. This means that it has been difficult to introduceregulations which could not be complied to within existing or slightly modifiedtechnologies. There has, however, been some examples of a more agressive attitudefrom the authorities the last few years.
Todays concession system based on individual negotiations, hardly leads to acost efficient reduction of emissions. The concession system might still be quiteefficient, in cases where pollution mainly causes local damages to a recipient.
36

Todays concession system does not give incentives to reduce emissions belowagreed levels or to introduce new and more efficient technology. The system is alsocostly to administer. These are arguments in favour of introducing more economicincentives.
The use of economic-instruments today
The use of economic instruments have little tradition in Norwegian environ-mental policies, but some new charges and taxes have been introduced the lastyear. Most of 'the existing indirect taxes were originally introduced as fiscal in-struments.
Indirect taxes on oil products are differentiated by sulphur content. To thebasic tax of 21 ore per liter is added a sulphur tax of 1.5 ore per liter for eachbracket of 0.25 percent sulphur. Taxes are refunded for those firms which candocument cleaning. This sulphur tax is so small that the refund system is hardlyused. This sulphur tax is one of the few indirect taxes in Norway today, introducedto give incentives to reduce consumption of a polluting product. In relation to thepollution which follows from the use of oil products the tax rate is very modest.
There are also indirect taxes on lubricants and gasoline. Gasoline taxes aredifferentiated, such that unleaded gasoline has a lower tax that leaded gasoline.The difference in indirect taxes on leaded and unleaded gasoline was 36 ore perliter by 1 January 1989. This difference is only 7 percent of the price of gasoline.To an average car driver, this difference is too small to give incentives to a morerapid car replacement.
Most of the indirect taxes on oil products are introduced for fiscal reasons, andtheir legal basis is an act from 1933. In addition to indirect taxes on fossil fuelsand lubricants, there are also indirect taxes on batteries, biocides, fertilizers, nonrefundable packings and bottles and deposit- refund systems for bottles and cars.All these economic incentives are introduced for environmental reasons, and seemto work relatively satisfactory. It has also been proposed to introduce an indirecttax on CFC.
Evaluation of instruments in environmental policies
Both administrative and economic instruments have their strong and weaksides. To important criteria for evaluating all instruments are to which extent theygive the authority control over the amount of emissions (target efficiency), and ifthey lead to reductions where emissions could be reduced at the lowest cost (costefficiency). The cost of an instruments are both the direct cost to administer theinstrument and the direct and indirect costs of increased resource use by producers
37

and consumers. These costs can vary substantialy from instrument to instrument.Other criteria to evaluate instruments are their incentives to improve technology,and their effect on income distribution which can be an obstacle to the intruductionof new measures.
Emissions charges seem adequate when the damages are independent on wherethe emissions occur, and if there are many pollutants which otherwise could noteasily be controlled. I.e., indirect taxes or charges seem adequate as instrumentsto reduce the emissions of carbon dioxid, which causes no local damages, butcontributes to the greenhouse effect irrespectively of where the emissions occur.Chapter 5 gives a scenario where the indirect taxes on fossil fuels are sharplyincreased. Indirect taxes on coal, natural gas and oil products could be differ-entiated by the total damages they contribute to, without being administrativelycomplicated. Such indirect taxes will never be perfectly adjusted to the damagesof emission, but will lead to a more correct pricing of fossil fuels.
General economic instruments might be necessary to achieve the substantialreallocation which global pollution problems seem to demand.
Indirect taxes, which correct for external effects, will also give public revenues.These revenues will reduce the need for other taxes which have destortive effectson the economy. In total, a change of the tax system from direct income taxes toenvironmental charges, given tax level, will contribute to a more efficient use ofresources in the economy.
Economic instruments could never totally replace regulations as an instrumentagainst local pollution problems or as urgent measures against especially toxicsubstances.
Taxes are superior to regulations in reducing emissions cost efficiently, whereasregulations are superior to taxes in target efficiency. These properties can becombined in a system of tradeable quotas, i.e. the creation of a market for pollutionquotas, where the quotas sum up to a total amöunt of pollution which is acceptable.
Tradeable quotas have the same incentives as charges on emissions, but inaddition the costs of pollution (the market price of tradable quotas) automaticallychanges with inflation. An indirect tax, on the other hand, will need adjustment,which means administrative treatment and political decisions and the indirect taxmight therefore over time loose its power as an instrument. Tradeable quotas,on the other hand, is dependent on a creation of a sort of stock exchange and acertain compliance control. •
For large and medium sized firms, it is both technically and economically fea-sible to install meters to give a permanent surveillance of emissions. The devel-opment of monitoring technology has therefore made taxes and tradable quotasto practical instruments both in the case of emissions to air and to water. In the
38

case of CO2 , however, indirect taxes on inputs of fossil fuels seems to be the mostadequate instrument.
Indirect taxes on energy
The SIMEN-project has mainly been concerned with the question of how touse charges on energy to incorporate environmental costs of energy consumption.Correct use of indirect taxes might lead to great differences between the marketprice of the energy commodity and the cost of producing it. In general, there areseveral reasons to tax production and consumption of energy:
o If marginal costs of energy production are increasing, energy production willlead to an economic rent. The price system, including energy taxes, decideswho captures this economic rent. Production taxes on electricity, or royaltieson oil production, can be used by the government to collect the economicrent, which otherwise would have been collected by producers or consumers.
• An unregulated, competitive market for energy, might not reflect the scarcetyof depletable resources like oil and natural gas. Indirect taxes might be usedto reflect this scarceity.
• Taxes on gasoline might also be used as an indirect price of road services.Even if the consumption of road services, included depreciation, is not pro-portionate to the consumption of fuels, gasoline taxes might still be a goodproxy for the user price. Other solutions might lead to high and unnecessaryadministrative costs.
4, Production, transport and consumption of energy lead to several, seriousenvironmental effects. These negative externalities might be reflected in theenergy prices through taxes. The adequacy of this instrument is dependenton the proportionality between the amount of energy consumption and thenegative environmental effects.
• So far, taxes on energy have to a great extent been introduced for fiscalreasons, i.e. to finance public activities. Efficiency criteria imply that oneshould tax factor input with low price elasticities. In the short run, energyconsumption is price inelastic, which Means that a change of prices will havesmall effects on e.nergy consumption. In addition, a high and increasingenergy consumption has been an attractive tax base.
39

4 Prospects for selected Manufacturing Industries
4.1 Introduction
Most Norwegian manufacturing industries are exposed to competition in interna-tional markets. E.g., 80 percent of Norwegian metal production is exported. Arealistic evaluation of the growth potential for manufacturing industries, like powerintensive industries and pulp and paper production, therefore demands analysesboth of international product markets and of production technologies and costs.
The production capacity of aluminium and ferro products are increasing inNIC-countries and LDC-countries, with low production costs. In addition, theproduction costs in Norwegian " greenfield units" are higher than the average pro-duction costs of existing units. On the other hand, there seems to be possibilities toincrease productivity and competitiveness in Norwegian power intensive industriesby expansion of existing units.
Producers of aluminium, ferro alloys, industrial chemicals and pulp and paperare heavy consumers of energy and significant polluters. The SIMEN-project hasfocused on the possibilities to reduce energy consumption and pollution per unitof production in these industries.
SIMEN comprises three sub-projects for power intensive industries and pulpand paper production, Appendix 1. This chapter is a summary of the three sub-projects on aluminium production, ferro alloy production, and pulp and paperproduction by the Institute of Industrial Economics, the Center for Applied Eco-nomic Research at the University of Oslo and the Central Bureau of Statistics.These sub-projects are used as background material for evaluating possible macro-economic developments towards 2000 in chapter 5.
4.2 Traditional Export Competing, Manufacturing Industries
4.2.1 Power intensive industries
Power intensive industries comprise aluminium production, ferro alloy productionand production of industrial chemicals. For industrial chemicals, the calculationsof chapter 5 are based on the assumption that Norwegian production and exportwill follow the growth of international markets. The descriptions and discussionsin this subsection are therefore confined to aluminium and ferro alloy production.
The market for power intensive products is characterized by great fluctuationsin demand and hence in capacity utilization and prices. In the first half of the1980s, the metal markets were soft and prices low. In 1982, most Norwegianenterprises showed read figures. After 1986, there has been a boost in demand,
40

70 71 72 73 74 75 76 77 78 79 80 31 82 83 84 85 86 87 88
with a preliminary peak in 198S, with extremely high prices both for aluminiumand ferro alloy products. Preliminary figures for 1988 show an operating surplusfor metals of approximately 6 billions NOK and somewhat below 1 billion NOKfor industrial chemicals.
4.2.1.1 The aluminium industry
International conditions
The report from the Institute of Industrial Economics indicates that the prof-itability of international aluminium production on average has been lower the last10 to 15 years than in the previous period. This is partly due to reduced growthin demand, and partly due to a change on the producers side from oligopoly toapproximately free competition.
Figure 4.1. Aluminium consumption in the Western World. Mill. tons and average annual growth.1970-1987
Source: Norsk Hydro.
In the 1960s, the growth of energy demand in the Western world was on average10 percent per year, and declined to below 1 percent in the 1980s, figure 4.1. Theslower growth Was partly due to reduced growth of the world economy, increasedcompetition from other products as plastic, and efficiency in the utilization ofmetals by the consumers. This is a production cyclus which is not unusual formanufactured products. For aluminium, the postwar period up to the early 1970s,
41

Percent of World Capacity
was characterized by an introduction period with strong growth, followed by aperiod of saturation and increased competition from substitutes and improvedefficiency and technology by the metal consumers.
The production costs between international producers of aluminium vary con-siderably, as shown in figure 4.2.
Figure 4.2. Total Production Cost in International Aluminium Production. 1987. US dollars per ton
Source: Resources Strategies Inc.
The figure shows that the production costs in 1987 varied between 1150 dollarsper ton f.o.b. to approximately 2200 dollar per ton. The cost of the most efficientNorwegian unit was approximately 1450 dollars per ton. Approximately 60 percentof world capacity had lower costs than the most efficient Norwegian unit. Themajority of the Norwegian units had in 1987 costs above 1500 dollars per ton.Approximately 75 percent of the world capacity had lower cost than these units. Ina non cooperative market, which is a reasonable characterization of the aluminiummarket today, future prices might be expected to lie somewhat above the margizialcost of establishing new production capacity on the world market. In the short run,excess capacity might bring prices down to variable costs, and shortage of capacitymight bring prices well above marginal cost. Based on international market data,the Institute of Industrial Economics has tried to establish a supply curve for
42

aluminium on the world market.The analyses of the Institute of Industrial Economics indicate that several
countries are capable of introducing new production capacities at costs of approx-imately 14 to 1500 dollars per ton f.o.b. Expansion of Norwegian capacity at thesecosts seems hardly possible, with the possible exception of existing units.
Some LDSs have ambitious industrialization plans, which might effect the alu-minium markets. If these investments plans are carried out, they might lead toexcess capacity and prices which are well below the prices determined by the costbased supply curve.
Norwegian production costs
In the sub-report from the Center of Applied Economic Research and the Cen-tral Bureau of Statistics, the cost structure of Norwegian aluminium producersare analysed, based on micro-data. This study shows significant differences in coststructure between the different units.
In 1989, the most efficient Norwegian unit used 30 percent less energy per unitof production than the least efficient unit. This is due both to choice of technologyand the efficiency of utilization of existing technology. Average consumption ofelectricity declined from 20.2 to 17.7 kWh/kg produced aluminium from 1966 to1986. The electricity consumption in the most efficient unit declined from 16.4 to14.9 kWh/kg over the same period.
Theoretically, the minimum quantity of electricity needed to produce 1 kiloof aluminium is approximately 7 kWh/kg. In practice, this minimum quantityis inachievable, and it has been indicated that 14-15 kWh/kg on average is areasonable target for Norwegian units towards the end of the century. That impliesan average improvement of approximately 20 percent from the 1986 level.
Figures also show great differences in labour costs per unit of production.These differences are not due to differences in wages, but to differences in labourproductivity. The gradual improvement of labour productivity from 1966 to 1976,seems to have stagnated in the last decade. However, the average improvement oflabour productivity was 56 percent over the period 1966 to 1986, with the greatestimprovements in the less efficient units. Labour costs per ton aluminium are still30 percent lower in the most efficient unit than in the least efficient unit.
Looking at labour costs and electricity costs simultaneously, one might con-clude that low energy prices indirectly have subsidized inefficient use of labour.By improving labour productivity, there are good reasons to believe that the in-dustry might maintain or even improve its. competitive position even if electricityprices are increased. In 1986, both electricity costs and labour costs amounted toapproximately 15 to 20 percent of total production cost.
43
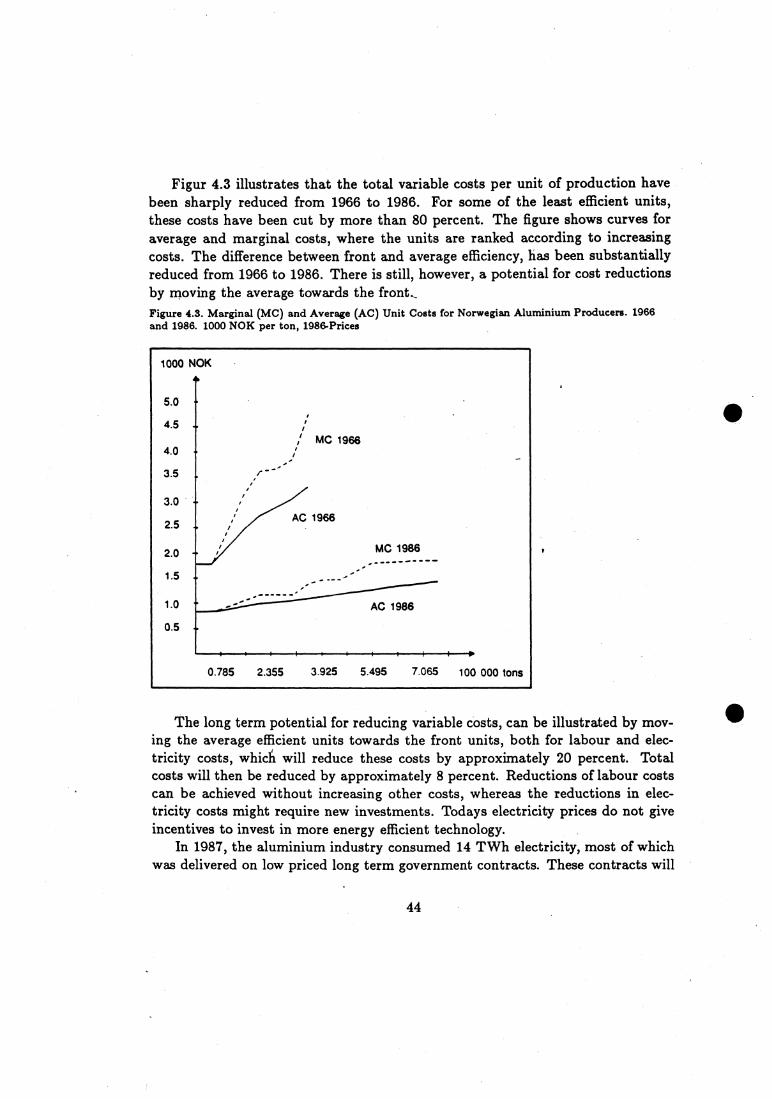
1000 NOK
5.0 •
4.5 -
4.0 -
3.5 -
/ MC 1966
3.0 -
2.5
2.0 -
1.5 -
MC 1986
1.0 • AC 1986
0.5 -
0.785 2.355 3.925 5.495 7.065 100 000 tons
Figur 4.3 illustrates that the total variable costs per unit of production havebeen sharply reduced from 1966 to 1986. For some of the least efficient units,these costs have been cut by more than 80 percent. The figure shows curves foraverage and marginal costs, where the units are ranked according to increasingcosts. The difference between front and average efficiency, has been substantiallyreduced from 1966 to 1986. There is still, however, a potential for cost reductionsby moving the average towards the front._Figure 4.3. Marginal (MC) and Average (AC) Unit Costs for Norwegian Aluminium Producers. 1966and 1986. 1000 NOK per ton, 1986-Prices
The long term potential for reducing variable costs, can be illustrated by mov-ing the average efficient units towards the front units, both for labour and elec-tricity costs, whicli will reduce these costs by approximately 20 percent. Totalcosts will then be reduced by approximately 8 percent. Reductions of labour costscan be achieved without increasing other costs, whereas the reductions in elec-tricity costs might require new investments. Todays electricity prices do not giveincentives to invest in more energy efficient technology.
In 1987, the aluminium industry consumed 14 TWh electricity, most of whichwas delivered on low priced long term government contracts. These contracts will
44

be renegotiated in the period 1996 to 2010. The alternative value of these contractsat the turn of the century will probably be much higher than the contract pricestoday. If renegotiated contracts are based on alternative values, this will probablyimply a reduction in the aluminium industry instead of growth.
Emissions
The process of electrolysis in the aluminium production leads to emissions ofgases, which also absorb particules from melted aluminium. The gases includecomponents as hydrogenfluorid, particulate fluorid, sulphurdioxid, PCB and car-bonoxides. The replacements of catodes and other materials lead to a deponitionof large amounts of waste materials, containing fluorids.
According to the State Pollution Control Agency the fluorid problem is stilln6t solved, despite a gradual reduction per unit of production. The State PollutionControl Agency also monitors the development of emissions of PAH, SO2, CO2and other residuals. For the industry, it is important that stronger regulationscould be integrated in modernization and investment plans and not introduced asimmediate and accute measures.
Total emissions of SO2 in the aluminium industry is approximately 5.500 tonsper year, or 7 percent of total emissions from mainland Norway. Two firms with 28percent of the production capacity are responsible for . 67 percent of the industry'semissions of 502. Sea water scrubbing is already introduced in one of these units,the other needs alternative solutions.
Further reductions of emissions from the aluminium industry will lead to highercosts, a deteriorated competitiveness and reduced growth potential. There are,however, good reasons to believe that the aluminium producers worldwide willhave to face stronger regulations of emissions.
4.2.1.2 The ferro alloy industry
International conditions
Ferro mangan, silico mangan and ferro silicium are inputs to the steal industry.The report from the institute of industrial economics show that approximately95 percent of ferro mangam and 70 percent of ferro silicium products, producedin the Western world are used as intemediate input to the steal industry, figure4.4. Silicium metal is in addition used by the silicon industry and the electronicsindustry.
45

1960
1970 1980
1990
Mill. tons
1.3
1.2
1.1
1
0.9
0.8
0.7
0.6
0.5
0.4
0.3
Production 1960-1987Forecast 1975Forecast 1979Forecast 1980RSI, June 1988IISI, 1986
Figure 4.4. World Production of Steel. 1960-1990. Mill. tons
Source: Elkem.
Immediately after the second world war, when the steal consumption increasedsharply, the profit margins of the ferro industry was very high. The last 10 to 15years, the growth of the steal consumption has declined, and several producershave entered the market. Hence, the ferro industry has experienced periods withsubstantional excess capacity and low prices.
Internationally there are great variations in the production costs of differentferro producers. For ferro silicium, Norway is one of the major producers, fig-ure 4.5. In 1988 only Venezuela and Island had lower production costs than theNorwegian producers.
46
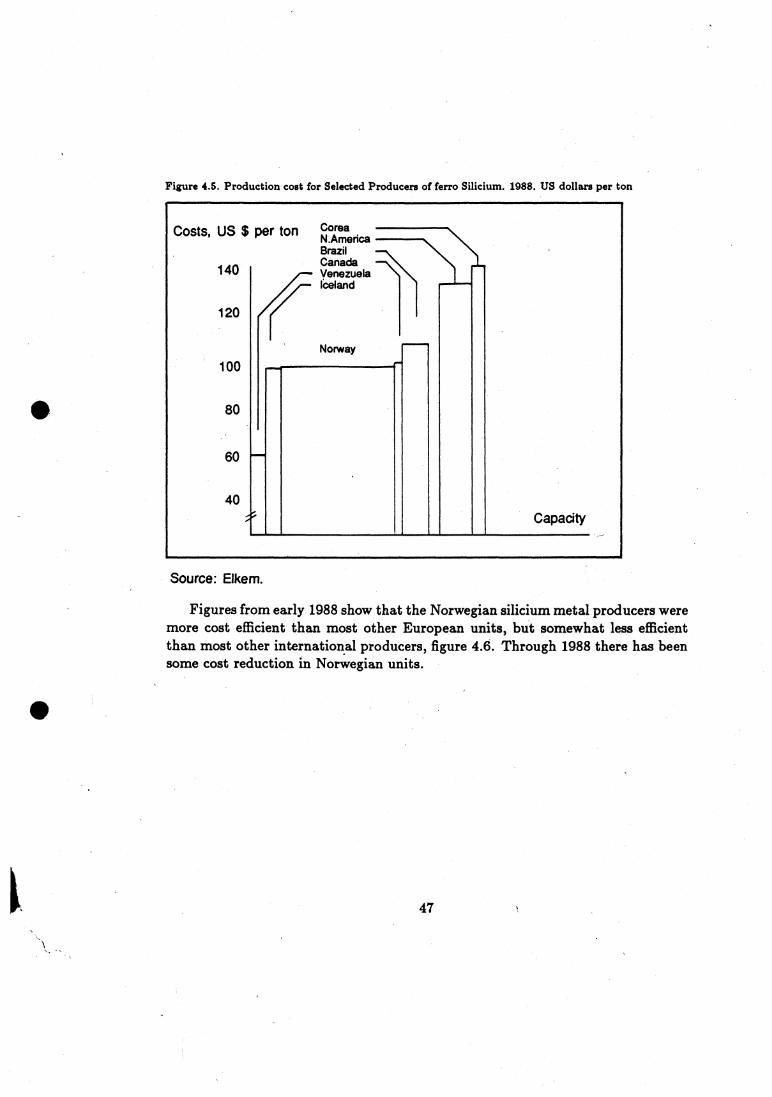
Costs, US $ per ton
140
120
100
80
60
CoreaN.America BrazilCanada —\VenezuelaIceland
Norway
40Capacity
Figure 4.5. Production cost for Selected Producers of ferro Silicium. 1988. US dollars per ton
Source: Elkem.
Figures from early 1988 show that the Norwegian silicium metal producers weremore cost efficient than most other European units, but somewhat less efficientthan most other international producers, figure 4.6. Through 1988 there has beensome cost reduction in Norwegian units.
47

Costs, US $ per ton
120
110 - ■••■•••
100
11=1.11.
maxial
\— Norwegian Firms
.11NME.
11111•01•11111=1111,
90 .11.11111.
80 Capacity
Figure 4.6. Production Costs for Selected Producers of Silicium Metal. 1988. US dollars per ton
Source: Elkem.
For ferro silicum, the situation in 1988 is somewhat more gloomy. Thére isovercapacity, a stagnating market and huge investment projects in low cost areas.It is therefore most likely that the production costs in low cost countries willdetermine the future profitability of standard ferro silicium products. The mostvaiable option for Norwegian producers therefore seems to be a substitution fromstandard products to more specialized products.
The prospects for ferro mangan and siliko mangan seem somewhat better thanfor ferro silicium, due to an oligopolistic orginization of these markets. For Europe,the 5 largest producers control 80 percent of the market for ferro mangan.
Norwegian production costs
Including partly owned enterprizes, the Norwegian units control 20-30 percentof the Western market for ferro products. Until reasently, the ferro productionin Norway was characterized by production of standard products with increasingcompetition. Today, approximately 50 percent of production is refined to specialproducts for deliveries in markets where there are few competitors and reasonableprofitability. There are, however, signs of increased competition also in thesemarkets.
48

Ferro silicium is the main produci t in' most Norwegian units. Some units pro-duce ferro mangan as the main product, whereas one unit produces ferrocrorn.These products represent different technologies, which to some extent explain thedifferences in factor input.
Capital costs for existing units are substantially lower than for greenfield units.Modernizations, rebuildings and expansion of existing units are assumed to incurcapital costs 20 to 30 percent below capital costs of greenfield units. Expansionsof existing units might also lead to rationalization of other input factors. Atgiven factor prices, it is therefore a certain potential for expanding the productioncapacity firms. There is, on the other hand, no reasons to expect expansions ofgreenfield capacity in Norway towards 2000, unless electricity prices are kept verylow.
In 1986, the ferro alloy industry consumed 6.5 TWh electricity. Parallel to thealuminium industry, the future electricity contracts will be crucial for the prospectsfor expansions of capacity.
There are great differences in energy consumption per unit of production be-tween the Norwegian firms, mainly due to choice of technology. On average theelectricity consumption per unit of production has been reduced by 15 percent, orapproximately 1 percent per year over the period 1972 to 1986.
There are also great differences in the labour costs per unit of productionbetween the different units. In the period 1972 to 1986 there has been an im-
a provement in the use of labour input per unit of production by approximately 35percent, or approximately 2 percent per year. The laboUr productivity in the mostefficient capacity was, however, more than twice as iiigh as in the least efficientunit in 1986. In the same way as for aluminium production, there has been asubstantial reduction of variable unit costs in ferro production from 1976 to 1986.The average units have approached the front unit, but even in 1986 there wasa substantial difference between the variable cost of the front unit and the leastefficient capacity, figure 4.7.
49

— Figure 4.7. Marginal (MC) and Average (AC) Unit Costs for Norwegian Ferro Alloy Producers. 1972and 1986. 1000 NOK per ton, 1986-Prices
Emissions
Ferro alloy production is extremely energy intensive and polluting. The indus-try discharges SO2, CO2, NO., PAH and several heavy metals. Traditionally theproblems of particulates and SO2 have been regarded as the ferro industry's mainenvironmental problems.
The emissions of particles from the ferro alloy industry has been regulatedworld wide. Only a few producers, like Venezuela and China, have not yet intro-duced cleaning programs. This regulations have led to few competitive changes forNorwegian producers. The reduction of emissions of particles through cleaning,has also reduced some of the other emissions. The State Pollution Control Agencyconsideres the particulate problem of the Norwegian ferro alloy industry as solved,but the regularity of the cleaning equipment is not yet satisfactory.
The total emissions of SO2 from the ferro industry was approximately 10 000tons in 1987. This amounts to 13 percent of the total domestic emissions. TheState Pollution Control Agency has, however, already decided to regulate the in-dustry stronger in the years to come. Measures against the three most polluting
50

units will reduce the total emissions from the industry by approximately 40 per-cent. These new regulations might imply costs that will lead to a shut down ofthe least efficient and least profitable units.
4.2.2 Pulp and paper production
The pulp and paper industry is, in the same way as the production of aluminiumand ferro alloys, exposed to international competition. Both in 1987 and 1988, theindustry experienced high prices and approximately 100 percent capacity utiliza-tion. Despite high international demand, the return to capital in Norwegian pulpand paper industry was only 3.5 percent in 1988, calculated as operating surplusdevided by capital evaluated at current prices.
Norwegian pulp and paper production has been concentrated on printingmainly paper for magazine and newspaper production. These are power intensiveproducts, but where the input of wood products per ton final product is low. Ap-proximately 75 percent of Norwegian paper production is newspaper and magazinepaper. One reason for this development of production is that paper is producedfrom long fibers, based on pine trees which only grow in the Northern hemisphere.This means that the competitors for these qualities are first and formost Sweden,Finland, the Soviet union, Canada and the USA, i.e. high cost countries exceptthe Soviet union. This is different from metal production, where the competitorsare NIC-countries.
International conditions
The world consumption of paper and paper products increased from 40 milliontons in 1950 to 187 million tons in 1984, i.e. 4 to 5 percent per year. The last twoyears, the growth has been 6 percent annualy. A 1985 FAO-forecast indicates agrowth of demand for paper and paper products on a global scale of 2.7 percent.In the industrialized countries which is the main market for Norwegian pulp andpaper products, the estimated growth of consumption is expected to be somewhatlower. Based on the FAO- analysis, there might be room for expansion of thecapacity of Norwegian pulp and paper industries.
Within year 2000, there does not seem to exist natural substitutes for the longfiber wood, which Norwegian pulp and paper industry is producing. In the longrun, however, new technology might make it possible to produce good qualitiesbased on short fiber wood from rain forests. There are also good reasons to be-lieve that the share of production which is based on return paper will increase.The competition from substitutes like plastic for some paper products, are highlyuncertain and difficult to asess for the years to come.
51

Norway is a relatively small producer of paper and paper products. The marketshare ranges from .75 percent to 3 percent for the different segments of the market.The largest exporters are Canada, Sweden and Finland and the import areas arewestern- Europe and the USA. Norwegian products are mainly exported to theEuropean Comunity.
Norwegian production
The competitive problems of the Norwegian pulp and paper industry are mainlydue to high transport costs of raw materials (twice as high as in Sweden), highwage costs (15 percent higher than in Sweden), limited supply of raw materialsand small units. Norwegian producers have over time become fewer and larger.A fusion of three of the major, producers have been negotiated in the early 1989.Rationalization and fusion have contributed to improve the competitiveness, butstill Norwegian producers- are small, figure 4.8.
Similar to the studies of aluminium and ferro production, the analyses of thepulp and paper industry, show that there are great differences in costs per unit ofproduction between different producers. In 1986 e.g., the input of electricity perunit of production was more than 50 percent higher for many producers than inthe most efficient unit.
On average, the pulp and paper industry increased its productivity substan-tially in the period from 1972 to 1980. This development has continued in the leastefficient units after 1980. Also energy efficiency has increased markedly in the pe-riod from 1972 to 1986, especially in the least efficient units. Low energy costsstill give Norwegian producers a competitive advantage compared to producers inSweden, Finland and Canada.
The differences in input per unit of production, both for labour and energy,should imply a substantial potential for further reductions of costs.
52

1000 tons
200
150
100
50
O
Sweden Finland Norway
Figure 4.8. Average Capacity. Nordic Paper Producers. 1986. 1000 tons
Source: Bergen Bank, Quarterly Journal no 1. 1988.
Figure 4.9 illustrates that the average total .variable unit cost for pulp andpaper producers has been reduced from 1972 to 1986, especially for the leastefficient units. There are still, however, substantial differences in costs between theleast efficient and the most efficient units, which implies a potential for efficiencyimprovements by moving the average towards the front.
•
53

.i1111•■•1■111111114
0.24 0.48 0.72 0.96 1.20 1.44 1.68 1.92 2-16 2.40 *106
.-/ MC 1986
• AC 1986
1.50 -
1.35 -
.20 -
1.05 -
0.90 -
0.75 -
0.60
0.45 -
0.30
0.15
MC 1972
AC 1972
Figure 4.9. Marginal (MC) and Average (AC) Costs for l■forwegian Pulp and Paper producers. 1972 and1986. 1000 NOK per ton, 1986-Prices
The pulp and paper industry benefits from low priced long term electricitycontracts, and in addition is a huge consumer of surplus power. The pulp andpaper industry has a great potential for substituting between oil products andelectricity. The soft Norwegian energy market the last couple of years, has giventhe industry access to hughe amounts of cheap surplus power, a situation whichmight continue with an expanding production capacity in the electricity sector.
If Norwegian pulp and paper producer should move along with the internationaltechnology front, the industry is facing substantial investments in the years tocome. The industry's own estimate is 10 billion NOK, of which 700 million NOKwill be environment investments towards 2000.
54

Emissions
The pulp and paper industry discharges CO2 tó air, fiber and desolved or-ganic materials to water. The emissions to water contain chlorine, nitrogen andphosphorous.
Total emissions of 502 was in 1986 approximately 9000 tons. Some of theseemissions could be reduced by sea-water-scrubbing. For the least efficient units,stronger regulations of emissions could imply shut-down.
4.2.3 Production of metal products, machinery and equipment
This industry has traditionally produced intermediate inputs to the rest of Nor-wegian manufacturing industries, power production and to petroleum activities.The reductions in building of ships, platforms and power stations has led to greatproblems for theie composite group of intermediate producers. There are reasonsto believe that this situation will continue up to 2000. Future growth seems there-fore to demand a restructuring of the industry, towards new products and newmarkets, in the same way as the industry was restructured from 1960 up to 1988.In the calculations in chapter 5, it is assumed that the industry will continue todeliver intemediate products to the rest of the Norwegian economy, and that theexports will increase propotionately to the growth of international markets.
4.2.4 Industrial use of natural gas
Natural gas is used as a raw material for production of a,monia, metanol andplastic. Approximately 850 Sm 3 natural gas is used to produce 1 ton amonia and900 Sm3 to produce 1 ton of metanol.
The amonia production at Herøya has a production capacity of approximately400 000 tons. That leads to a consumption of natural gas of 850 million Sms . Theproduction at Herøya might from the middle of the 1990s consume approximately400-600 million Sms natural gas per year.
The petrochemical factory at Raffles uses etanol as a raw material for differentplastic products. Only a small part of this etanol could be substituted by rnethanat todays technology.
In many countries, the amonia production is intergrated with the productionof fertilizers, such that the frue market for amonia is only 5 percent of the totalproduction. The world consumption of arnonia is approximately 105 million tons,which correspond to a consumption of 95 million Sm3 natural gas.
In addition to a certain potential for use of natural gas to produce energy, thereis a certain potential for use of natural gas to industrial processes also in Norway.
55
Towards 2000, the demand for industrial use is estimated to be relatively modest.
4.3 Conclusions
The growth of Norwegian manufacturing industries towards the turn of this cen-tury is dependent on international demand, domestic demand and limitations onfactor supply, i.e. the supply of raw materials and energy. The producers canwin or loose market shares dependent on the development of producer costs inNorway compared to the development in competitive countries. This relations areaccounted for in the macroeconomic model which has' been used for the calcula-tions in chapter 5. The analysis of selected manufacturing industries, has givenreason to deviate somewhat from these model relations, especially for the powerintensive industries.
Both for aluminium and ferro production there are great differences betweenmarginal costs of expanding capacity and average cost, both for capital cost andelectricity costs.
Marginal costs of electricity is reflected in the so called 1983- contracts (20 oreper kWh), which is approximately twice the present average price. According tothe industry's own asessments, there will be no expansions of capacity, based on1983-contracts.
The capital costs of new and old metal factories are very different. Mostexisting capital equipment is written off, and has low alternative value.
The capital costs of expansion of existing firms are assumed to be substantiallylower than for greenfield plants. By expanding existing capacities, it is also possibleto use existing electricity more efficiently, which will contribute to lower costs perunit of production. It also seems possible to reduce the input of labour per unitof production within existing firms. The industry itself assume that the capitalcosts could be reduced by 20 percent without effecting production. Expansion ofexisting capacities therefore seems to be the most promising possibility for themetal producers.
In the macro economic calculations of chapter 5, it is assumed that the growthof metal production will be approximately 1 percent per year in the 1990s, withthe same consumption of electricity and the same electricity prices as in 1989.The production growth is set equal to the growth rate of energy efficiency. Futureelectricity contracts are essential for the growth potential of the power intensiveindustries. The macroeconomic calculation are based on the assumption that thesecontracts will not be changed until 2000. When these contracts are renegotiated to-wards 2000 and beyond, the electricity will probably have a high alternative value.This is also the case for the industry's own power production. If the renegotiated
56

contracts are based on the alternative value of electricity, the assumption of pro-duction growth of this industry might be to high in the calculations of chapter5.
57

Industry, Environment and Energy in a Macro-economic Perspective 1988-2000
5.1 Introduction
Main challenges to Norwegian economic policies
In the short run, the greatest challenge to Norwegian economic policies isthe unusually high and increasing unemployment, combined with a deficit on thecurrent accounts.
High international demand for traditional export competing products and ship-ping services, somewhat higher oil prices and oil production, have improved thecurrent accounts significantly through 1988. The fact that Norway, despite highexport prices, high activity in traditional export competing sectors and low do-mestic demand, has not achieved balance in the current accounts underlines theneed for a\ restructuring of the economy.
International economic growth is expected to decline the next two years. Hence,the profitability of traditional export competing industries might be substantiallylower than in 1988-89. High oil prices and oil production might still give a balanceor even surplus on the current accounts in the short and medium term. Thismight give a momentum, but at the same time a false impression that the externaleconomic problems are solved. In a longer term perspective, the balance of theexternal economy must be based on growth in other competing industries, not ona rapid depletion of a limited natural resource.
The traditional resource based, export competing industries, e.g. the metalindustry, today produces at its capacity limit. The expansion of this industry ishampered by a limited supply of new electricity - at a price the industry is willing topay. At the same time, the general reduction of domestic demand has led to lowerproduction and great problems for the import competing industries. In parts ofthe import competing industry, the reduction in production has been greater thanthe reduction in imports, which means that the industry has lost market shares.The high unemployment figures indicate that it has been relatively easy to reducedomestic demand directed towards sheltered and import competing industries, butdifficult to transfer resources to new competing activities. There are few signs ofa transition or restructuring so far. The investments in competitive industriesdeclined sharply from 1987 to 1988.
The purpose of expanding competitive industries is not primarily to createemployment in these industries, but to establish enough production capacity tosecure external economic manouverability. This will give space for increased do-
58

mestic demand for sheltered products, such that the unemployed and new-comerson the labour market can be absorbed in these sectors.
The Norwegian investment ratio, investments divided by gross national prod-uct, is fairly high compared to other OECD countries, but the return on theseinvestments have been quite low. j Norwegian industries are subsidised in severaldifferent ways. In addition to direct government support, several industries areindirectly subsidized through the tax system, sheltering from external competitionand low prices on energy. These direct and indirect subsidies lead to investmentswhich are socially unprofitable. Calculations show that, corrected for differentforms of support, the return on capital is very low in many Norwegian industries,see Ministry of Finance (1988a). Subsidies lead to inefficient use of productiveresources.
Many Norwegian production sectors are energy intensive and heavy polluters.Households' consumption of energy for heating purposes and equipment and theiruse of private cars have increased strongly as a result of the general growth ofprivate real disposable income. The increased awareness of-the links between eco-nomic growth, energy consumption and environmental issues, might make it bothpossible and necessary to change accustomed patterns of production and consump-tion. A conservation of the industrial structure, means of transportation and corn-position of consumption will put unnecessary constraints on the inanoeuverabilityin a transition prosess.
Measures already introduced, have gradually reduced the emissions of SO2,but without new measures, the emissions of SO2, NO and CO2 will increase.This implies new challenges, not only for environmental and energy policies, butalso for the economic policies.
The SIMEN-calculations
The SIMEN-project studies possible paths for industrial development towardsthe turn of the century, and analysis to what extent these developments will bein conflict with targets for environmental and energy policies. In such analyses, itis necessary to focus on the interplay between activity levels, energy consumptionand environmental issues in different sectors of the economy. Partial forecastsof individual sectors would easily be inconsistent and unrealistic. The analysesshould in principle be ”multisectoral brid multipollutant” . Macroeconomic analysisis therefore a central part of the SIMEN-project.
The analyses of environmental issues are concentrated on emissions to air ofSO2 , NO and CO2 . So far, Norway has signed international agreements on re-ductions of emissions to air of SO 2 and NO.. Analyses of adequate and feasible
59
instruments should comprise all sectors of the economy, and the measures shouldbe chosen such that pollution is reduced cost efficiently, without introducing un-necessary constraints on continued economic growth.
This chapter presents several alternative development scenarios for the Nor-wegian economy towards 2000, "the Reference scenario" , "the Gas scenario" and" the Environment scenarios" which comprises " the Regulation scenario" and "theTax scenario" . These forecasts indicate possible consequences of different choicesof energy and environmental policies, but none of the alternatives can be regardedas a prognosis, i.e. the most probable development.
The Reference scenario describes a possible economic development towards2000, characterized by relatively moderate economic growth and moderate restruc-turing of industries, but with a gradual improvement of Norwegian competitivenessand external balance.
The consequences of increased utilization of indigenous gas resources are treatedin the Gas scenario, chapter 5.3.
The consequences of stronger -restrictions on pollution are presented in theEnvironment scenarios, the Regulation scenario and the Tax scenario, chapter 5.4.
The scenarios are calculated using the CBS-model MODAG W. This modelis used by the Ministry of Finance in preparing forecasts for the Government'sLong Term Programme, and by other government agencies in forecasting energyconsumption and pollution. A description of the model is given in appendix 2.
The ,base year of the model is 1986. The forecasts are to some extent calibratedagainst preliminary national accounting and energy accounting figures for 1987 and1988, and on forecasts for 1989 which 'where available in January-February 1989.
Such forecasts are of course highly uncertain. These uncertainties are due bothto the exogenous assumptions and the model structure. No model can give a fullyadequate description of the functioning of the economy over a longer period. Ifthe Norwegian economy or the economy of Norway's trading partners are radicallychanged, there are reasons to believe that there will also be changes in expecta-tions, behavioural relations and institutional conditions which the model does notadequately capture. E.g., the model relations are probably not robust enough tocapture all the effects of major changes in tax policies.
Using the model for energy and pollution forecasts, it is especially important tounderline the uncertainty in the model's description of technological development,and the substitution between oil products and electricity following a radical changein energy prices. The consequences for single firms and industries, and hence forthe total economy, can be different from what the SIMEN-calculations show.
60
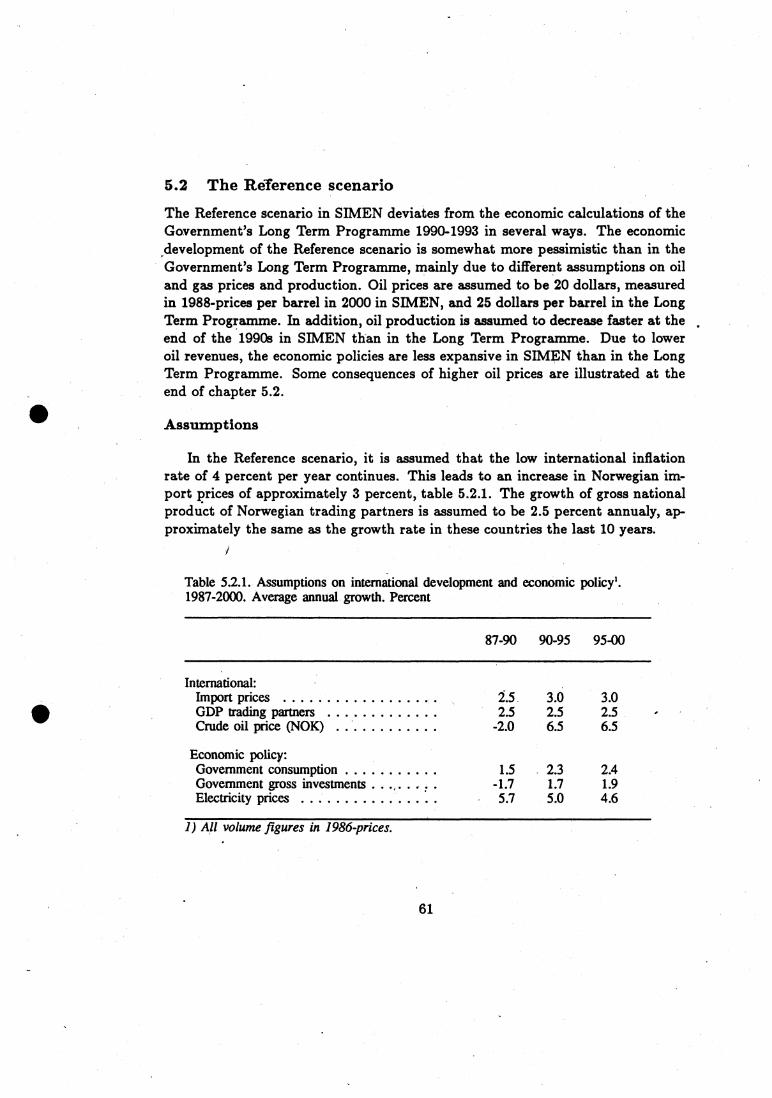
5.2 The ReTerence scenario
The Reference scenario in SIMEN deviates from the economic calculations of theGovernment's Long Term Programme 19904993 in several ways. The economic,development of the Reference scenario is somewhat more pessimistic than in theGovernment's Long Term Programme, mainly due to different assumptions on oiland gas prices and production. Oil prices are assumed to be 20 dollars, measuredin 1988-prices per barrel in 2000 in SIMEN, and 25 dollars per barrel in the LongTerm Programme. In addition, oil production is assumed to decrease faster at theend of the 1990s in SIMEN than in the Long Term Programme. Due to loweroil revenues, the economic policies are less expansive in SIMEN than in the LongTerm Programme. Some consequences of higher oil prices are illustrated at theend of chapter 5.2.
Assumptions
In the Reference scenario, it is assumed that the low international inflationrate of 4 percent per year continues. This leads to an increase in Norwegian im-port prices of approximately 3 percent, table 5.2.1. The growth of gross nationalproduct of Norwegian trading partners is assumed to be 2.5 percent annualy, ap-proximately the same as the growth rate in these countries the last 10 years.
Table 5.2.1. Assumptions on international development and economic policy'.1987-2000. Average annual growth. Percent
87-90 90-95 95-00
International:Import prices 2'.5 3.0 3.0GDP trading partners 2.5 2.5 2.5Crude oil price (NOK) . . OOOOOO •• -2.0 6.5 6.5
Economic policy:Government consumption 1.5 2.3 2.4Government gross investments . . -1.7 1.7 1.9Electricity prices 5.7 5.0 4.6
1) All volume figures in 1986-prices.
61

The oil and gas prices (with a lag of 1 year) are assumed to increase from 15dollars per barrel in 1988 to approximately 20 dollars per barrel in 2000 (1988prices). This development of the oil prices are based on the same assumptions asin the NOU (1988:21). In 1988, the oil price was 91 NOK per barrel. With anexchange rate for US dollars of 6.50 NOK, the oil price in the Refernce scenariowill be 130 NOK in 2000. This implies a growth in real prices of oil, measured inNOK, of 3 percent annualy from 1988.
The electricity price of the primary market is assumed to follow the officialcalculations of the long term marginal cost of hydro power production, with a 6percent return to capital. The real price of electricity, therefore, increases by 1.5percent annualy in the 1990s.
The Reference scenario assumes no major changes of economic policies. Gov-ernment consumption is assumed to increase by 2.3 percent, and the growth ofgovernment investments by 1.8 percent annually in the 1990s. Total taxes, as ashare of gross national product, is approximately unchanged through the calcula-tion period. The households' saving rate is assumed to increase from -1 percent in1988 to 3 percent in 2000.
Macroeconomic results
The calculations for the next few years are characterized by a low increasein domestic use of commodities and services and a moderate growth in the pro-duction of mainland Norway, table 5.2.2. This should be seen in the context ofthe extremely high growth of domestic use in the period 1984-1987, and the belttightening policies after the fall in the oil prices in 1986. The economic growth inthis scenario is not a result of an expansive policy, but a gradual improvement inproductivity, lower costs increases in Norway than internationally and hence animprovement of the competitive position. The growth of mainland Norway's grossnational product is increasing to somewhat above 2 percent annualy towards theend of the 1990s. Lower oil production gives slightly lower growth for Norway'stotal gross domestic product.
Household consumption decreases from 1986 to 1990, but the growth in the1990s is approximately the same as the growth for gross national product in main-land Norway. Towards the end of the 1990s, the growth of private consumptionis again reduced as a result of lower oil production which contributes to a 4owergrowth in disposable income.
Total gross capital formation increases only moderately over the calculationperiod. The growth is decreasing at the end of the 1990s, as a result of reducedinvestments in oil and gas activities. On the other hand, increased production and
62

Table 5.2.2. Macroeconomic variables. 1987-2000. Reference scenario'.Average annual growth. Percent
87-90 90-95 95-00
GDP 1,6 1,9 1,0GDP, mainland-Norway 0,9 1,9 2,1
Total domestic use .0,1 1,5 1,6Household consumption -0,8 1,8 1,8Government consumption 1,5 2,3 2,4Gross capital formation -0,7 0,6 0,1
Gross capital formation, mailand-Norway -.2,8 0,8 2,1Exports ............... . • • • 4,2 2,9 9,7
Oil and gas 8,6 2,7 -5,5Other commodities 4,6 2,8 3,3
Imports 0,3 • 1,9 2,1
Real disposable national income . . . . . 1,4 1,9 1,6
Consumer price index . . . . ... .. . • • . 4,9 3,9 3,6Wage costs per min-year 3,9 4,9 4,4Employment . . . ....... . . .. . . . . • • -0,3 0,6 0,8
Operating surplus 13,4 5,9 3,7
12,6 2,8 7,7 Manufacturing industries
1) All volume figures in 1986-prices.
operating surpluses in traditional industries, lead to higher growth of investmentsin mainland Norway towards the end of the 1990s. The increase of consumerprices are 3.5 to 4 percent annually in the 1990s. In the model, increases inwages are determined by import prices, consumer prices, the rate of unemploy-ment and productivity. Wage growth is assumed to decline when unemploymentincreases, but gradually less as greater the unemployment is (non-linear Phillipscurve mechanism, see Appendix 2). Up to 1990, real wages decline, but increasesby approximately 1 percent annualy in the rest of the 1990s.
Employment, measured as man-years, increases by 0.5 percent on average overthe period. The calculated unemployment is approximately at the 1988 level inthe 1990s, but decreases at the end of the decade.
Total operating surplus is increasing rapidly in the first years, but is reducedtowards the end of the 1990s due to lower oil and gas production. Operatingsurplus in manufacturing industries is growing steadily as a result of increasedproductivity and low increases in costs.
63

Export growth is high, partly as a result of the increased oil exports towards1995, thereafter as a result of high growth in exports of traditional commodities.Low growth in domestic demand leads to low growth in imports. The currentaccounts show balance from 1991 and a surplus for the rest of the 1990s. Norway'snet foreign debt was 110 billion NOK in 1988, or 19 percent of nominal grossnational product. This share is kept almost constant up to 1991. Thereafter, theNorwegian net foreign debt is decreasing, and is repayed within 2000.
Figure 5.2.1 gives an illustration of Norway's net disposable real income overthe period 1986 to 2000, and the development of the components of domestic use;household consumption, government consumption and net capital formation. Thedifference between disposable real income and total domestic use, corresponds tothe current accounts in fixed prices. Figure 5.2.1 shows that real disposable na-tional income is equal to domestic use in 1991-92, and that incomes are significantlyhigher than domestic use in the middle of the 1990s.
Supply and use of energy
Based on time series for the last 15 years, the development of energy consump-tion per unit of production is in the calculations assumed to decrease by 0.5 percentannualy in manufacturing industries (except metal production) and the transportsector. These assumptions reflect that the increas in real prices of energy are less inthe calculation period than in the sample period 1973 to 1986. For metal produc-tion, the energy efficiency is assumed to increase by 1 percent annualy, based oninformation on possible productivity improvements from the industry. The powerintensive industries, which comprise metal production and production of industrialchemicals, are assumed to consume the same amount of electricity as in 1988, 30TWh, over the whole period. Production in these industries is thus assumed togrow at the same rate as productivity, see chapter 4.
It is assumed that fish farming will increase its share of total production in thefishery sector, and that the sector therefore will reduce its energy consumption perunit of production.
In the sample period, the energy intensity of service sectors increased, probablydue to an expansion in office space, increased use of energy for heating purposes,ventilation and office machines. In the calculations, it is assumed that this capitaldeepening will be slower than in the sample period and the energy efficiencies ofthe service sectors are therefore kept constant.
64
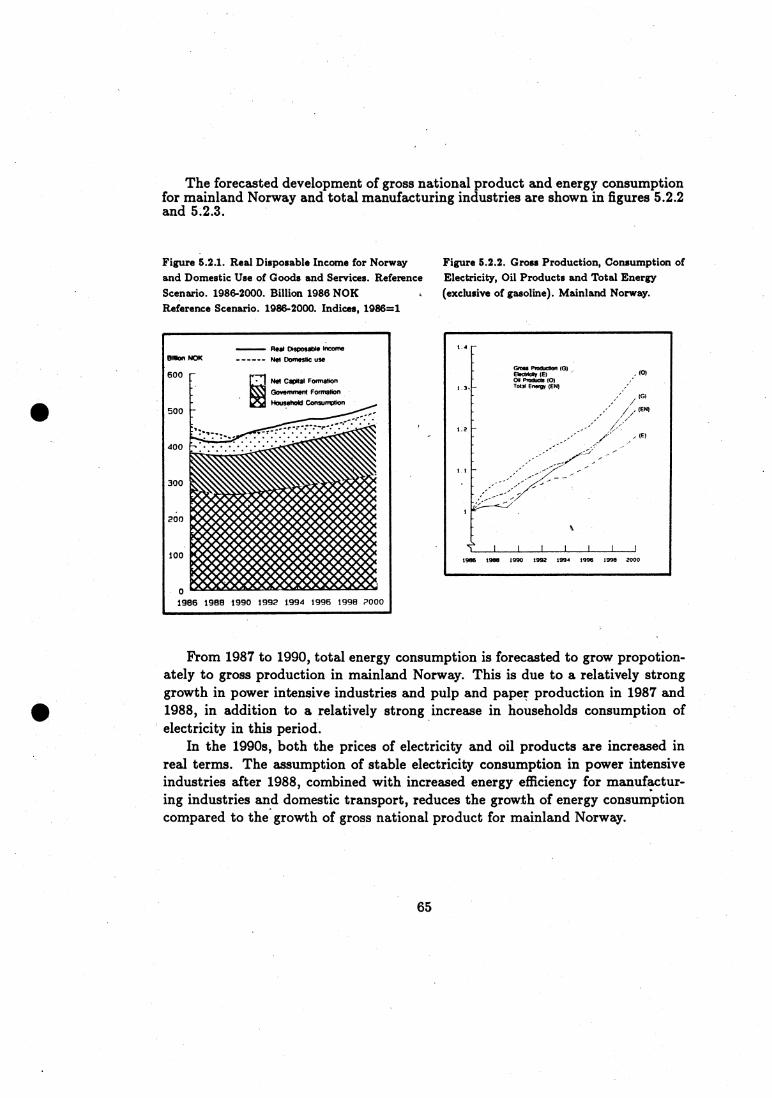
Flea Oisposabie income
--- Net Domestic useMon NOK
600
500
400
300
260
100
01986 1988 1990 1992 1994 1996 1998 P000
1966 19163 1990 1992 1994 1996 1998 2000
The forecasted development of gross national product and energy consumptionfor mainland Norway and total manufacturing industries are shown in figures 5.2.2and 5.2.3.
Figure 5.2.1. Real Disposable Income for Norway Figure 5.2.2. Gross Production, Consumption ofand Domestic Use of Goods and Services. Reference Electricity, Oil Products and Total EnergyScenario. 1986-2000. Billion 1986 NOK (exclusive of gasoline). Mainland Norway.Reference Scenario. 1986-2000. Indices, 1986=1
From 1987 to 1990, total energy consumption is forecasted to grow propotion-ately to gross production in mainland Norway. This is due to a relatively stronggrowth in power intensive industries and pulp and paper production in 1987 and1988, in addition to a relatively strong increase in households consumption ofelectricity in this period.
In the 1990s, both the prices of electricity and oil products are increased inreal terms. The assumption of stable electricity consumption in power intensiveindustries after 1988, combined with increased energy efficiency for manufactur-ing industries and domestic transport, reduces the growth of energy consumptioncompared to the growth of gross national product for mainland Norway.
65

1986 1968 1990 1992 1994 1996 1996 ?000
Figure 5.2.3. Gross Production, Consumptionof Electricity, Oil Products and TotalEnergy (exclusive of Gasoline). Miningand Manufacturing. Reference Scenario.Indices, 1986=1
Total net power consumption (firmand surplus power) increases from91 TWh in 1987 to 104 TWh in2000. The Primary market consumes74 TVVh and power intensive indus-tries 30 TWh. Distribution and trans-mission losses are assumed to be 3 per-cent for power intensive industries and12 percent for the primary market.Necessary production capacity istherefore 114 TWh in 2000, disregard-ing net exports or imports of electric-ity. Official forecasts of the averageannual production capacity of the hy-dro power system is 112 TWh in 2000,see Norwegian Water and ElectricityBoard (1988). The remaining electric-ity demand, 2 TWh, is assumed to becovered by gas power production.
Over the period from 1987 to 2000, total consumption of gasoline increasesby 22 percent, heating oils by 14 percent and transport oils by 16 percent. From1990, the oil products prices increase by 1 percent relative to the price of electricity.This leads to a substitution from oil products to electricity for heating purposes.It is assumed that the consumption of fuel wood in households is constant at the19864evel over the calculation period.
The strong growth in gasoline consumption is a result of increased privateconsumption and increased use of private cars. The consumption of transportoils grows slower than the production in the transport sector, as a result of theassumption of increased energy efficiency.
66
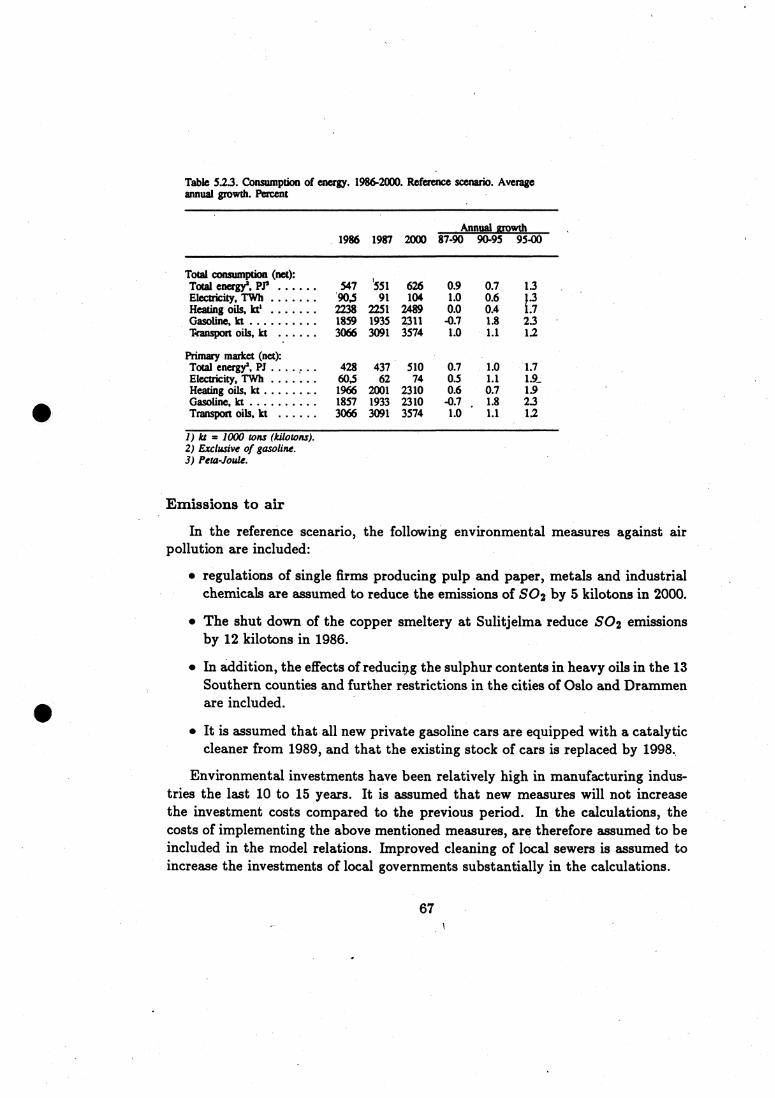
Table 5.2.3. Consumption of energy. 1986-2000. Reference scenario. Averageannual grow& Percent
Annual arowdt1986 1987 2000 87-90 90-95 95-00
Total consumption (net):Total energy', Pr . . . . . . 547 551 626 0.9 0.7 1.3Electricity, TWh . ..... 90,5 91 104 1.0 0.6 1.3Heating oils, kts 2238 2251 2489 0.0 0.4 L7Gasoline, kt 1859 1935 2311 -0.7 1.8 2.3Transport oils, kt • 3066 3091 3574 1.0 1.1 1.2
Primary market (net):Total energy', P1 428 437 510 0.7 1.0 1.7,Electricity, TWh . . . . . . . 60,5 62 74 0.5 1.1 1.9..Heating oils, kt . . . . . .
•
1966 2001 2310 0.6 0.7 1.9Gasoline, kt 1857 1933 2310 -0.7 . 1.8 2.3Transport oils, kt 3066 3091 3574 1.0Li 1.2
1) kt = 1000 tons (kilotons).2) Exclusive of gasoline.3) l'eta-Joule.
Emissions to air
In the reference scenario, the following environmental measures against airpollution are included:
• regulations of single firms producing pulp and paper, metals and industrialchemicals are assumed to reduce the emissions of SO2 by 5 kilotons in 2000.
• The shut down of the copper smeltery at Sulitjelma reduce SO2 emissionsby 12 kilotons in 1986.
• In addition, the effects of reduchn the sulphur contents in heavy oils in the 13Southern counties and further restrictions in the cities of Oslo and Drammenare included.
• It is assumed that all new private gasoline cars are equipped with a catalyticcleaner from 1989, and that the existing stock of cars is replaced by 1998.
Environmental investments have been relatively high in manufacturing indus-tries the last 10 to 15 years. It is assumed that new measures will not increasethe investment costs compared to the previous period. In the calculations, thecosts of implementing the above mentioned measures, are therefore assumed to beincluded in the model relations. Improved cleaning of local sewers is assumed toincrease the investments of local governments substantially in the calculations.
67

1 000 metric tons
120
, 100
BO
60
1
4p
20
01986 1988 1990 1992 1994 1996 1998 7000 1986 1988 1990 1992 1994 1996 1998 2000
Figure 5.2.4. S02-emissions. Reference Scenario. Figure 5.2.5. NO.-emissions. Reference Sce-1986- 2000. 1000 metric tons per year nario. 1986-2000. 1000 metric tons per year
The development of SO2, NO and CO2 emissions are shown in figures 5.2.4-5.2.6 and table 5.2.4. Total emissions of SO2 increases by 18 percent, from 88kilotons in 1987 to 104 kilotons in 2000. The emissions of NO increases in thecalculations by 5 percent from 245 kilotons in 1987 to 258 kilotons in 2000. Thismoderate growth is a result of the introduction of catalytic cleaning of privategasoline cars and the increased energy efficiency in the transport sector. Theemissions from processes and stationary combustion increase by 27 and 15 percent,respectively.
The emissions of CO2 are calculated to increase from 36 million tons to 43million tons in 2000, a growth of 19 percent. In these figures, the emissions frompossible production of gas power is not included. 2 TWh gas power will increaseCO2 emissions by 1 million tons in 2000, and the increase in total emissions willbe 22 percent from 1987 to 2000.
68
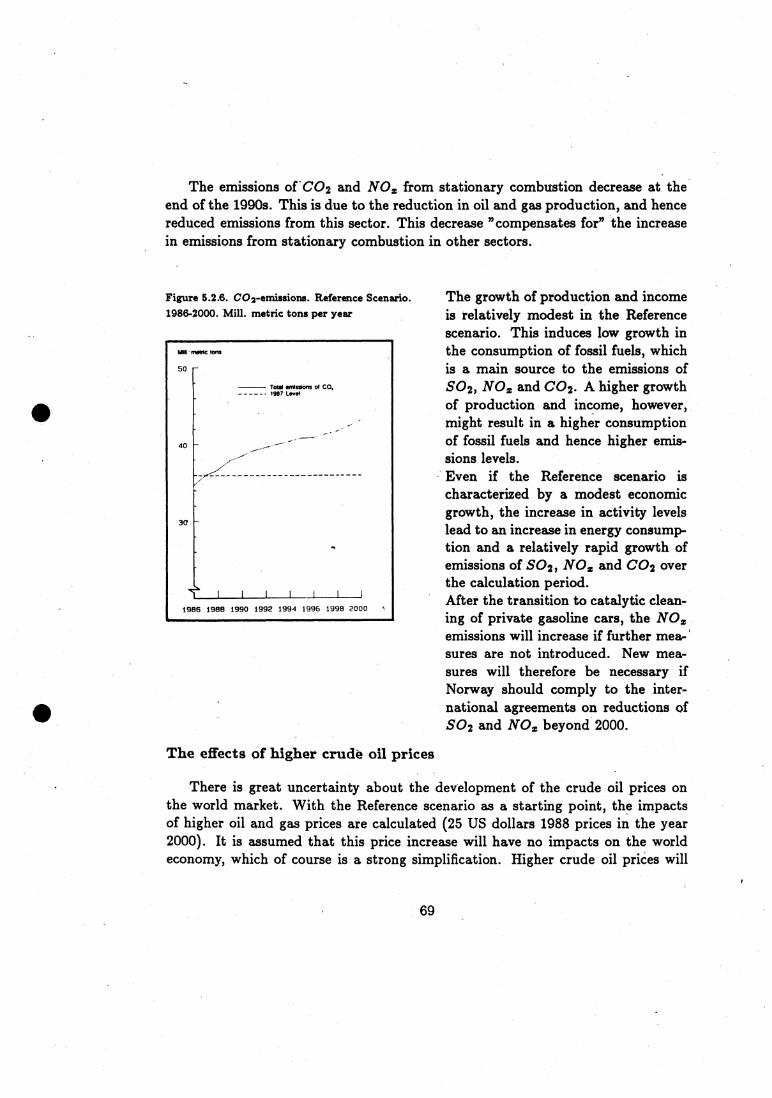
The emissions of*CO2 and NO from stationary combustion decrease at theend of the 1990s. This is due to the reduction in oil and gas production, and hencereduced emissions from this sector. This decrease "compensates for" the increasein emissions from stationary combustion in other sectors.
Figure 5.2.6. CO2-emissions. Reference Scenario.1986-2000. Mill. metric tons per year
The growth of production and incomeis relatively modest in the Referencescenario. This induces low growth inthe consumption of fossil fuels, whichis a main source to the emissions of502, NO and CO2. A higher growthof production and income, however,might result in a higher consumptionof fossil fuels and hence higher emis-sions levels.Even if the Reference scenario ischaracterized by a modest economicgrowth, the increase in activity levelslead to an increase in energy consump-tion and a relatively rapid growth ofemissions of 502, NO and CO2 overthe calculation period.After the transition to catalytic clean-ing of private gasoline cars, the NOemissions will increase if further mea:sures are not introduced. New mea-sures will therefore be necessary ifNorway should comply to the inter-national agreements on reductions ofSO2 and NO. beyond 2000.
The effects of higher crudè oil prices
There is great uncertainty about the development of the crude oil prices onthe world market. With the Reference scenario as a starting point, the impactsof higher oil and gas prices are calculated (25 US dollars 1988 prices in the year2000). It is assumed that this price increase will have no impacts on the worldeconomy, which of course is a strong simplification. Higher crude oil prices will
69
immediately improve Norway's external balance, but higher crude oil prices willalso effect the level and composition of energy consumption and pollution.
Higher oil prices lead to a substitution from oil products to electricity. Electric-ity consumption increases by approximately 3 TWh and oil consumption decreasesaccordingly. This reduces the emissions of SO2, NO and CO2 in the order of 2to 4 percent compared to the Reference scenario in 2000. If the increased electric4ity demand is covered by gas power, the CO2 emissions will increase instead ofdecrease compared to the Reference scenario.
In these calculations, the oil prices are 20 percent higher than in the Referencescenario in 2000. It is not assumed that this will lead to increased energy efficiency.
Higher crude prices will give a significant improvement of the current accounts.In the calculations, Norway's foreign financial assets will amount to approximately20 percent of gross domestic product in 2000, measured in current prices. Thiswill allow for a more expansionary economic policy and lower unemployment ratesthan in the Reference scenario.
5.3 The gas scenario
In the Gas scenario, the possible consequences for economic activity, energy con-sumption and pollution from increased utilization of Norwegian gas resources arecalculated. It is assumed that exports of natural gas to Sweden is combined withdomestic power production based on natural gas, and consumption of gas for in-dustrial purposes.
Assumptions
The calculations assume the construction of a gas pipeline with a capacityof approximately 6 billion Sm3 from Western to Eastern Norway and furtherto Sweden. Up to 1995 this will lead to higher investments in gas pipe lines,distribütion grids and thermal power stations.
In Sweden, the total demand for gas has been estimated to 4 to 5 billion Sm3
per year in 2000 and 8 billion Sm3 in 2010. Denmark might deliever 1 billion Sm3
per year. The potential for Norwegian exports should therefore be up to 4 billionSm3 annualy at the end of the 1990s, which is also the assumption in the Gasscenario.
Domestically, gas can be used for several purposes: for power production, asa raw material for production of amonia, direct use of gas for energy purposes inmanufacturing industries, direct use of gas for heating purposes in services andhouseholds and for transportation.
70
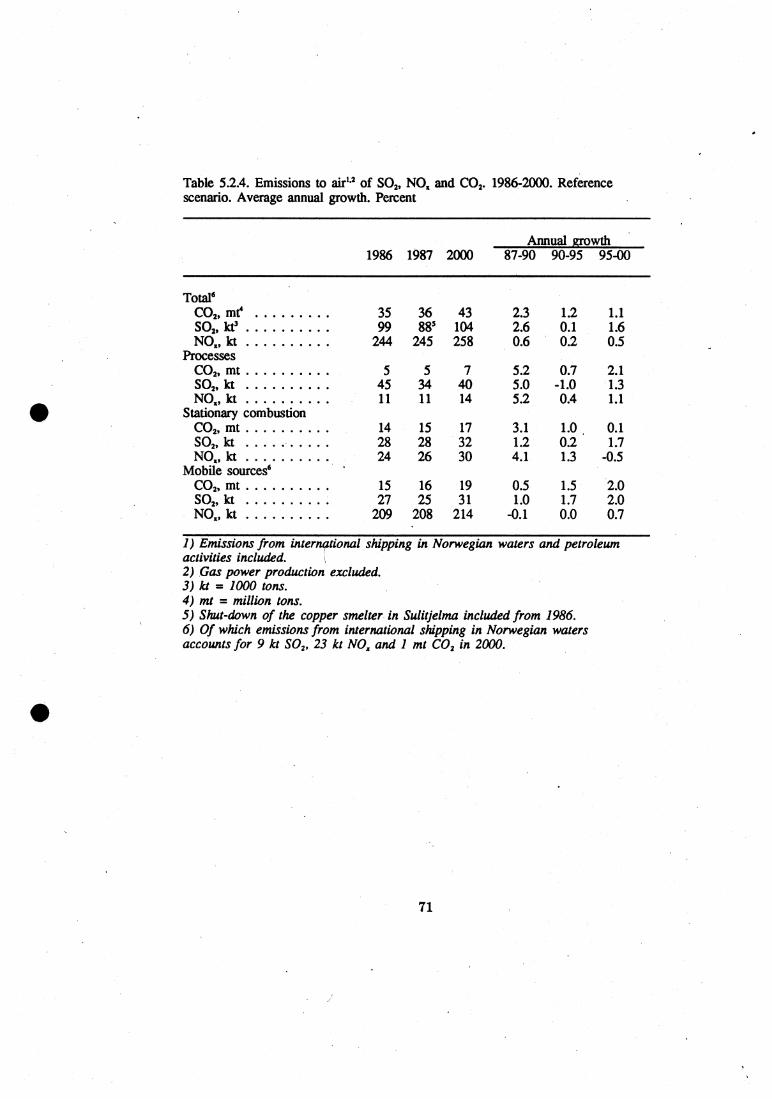
Table 5.2.4. Emissions to air'.2 of SO2, NO and CO,. 1986-2000. Referencescenario. Average annual growth. Percent
Annual growth1986 1987 2000 87-90 90-95 95-00
Total'CO2, . • • • • • • 35 36 43 2.3 12 1.1SO„ . . • • . . . 99 885 104 2.6 0.1 1.6NO., kt 244 245 258 0.6 0.2 0.5
ProcessesCO2, mt 5 5 7 5.2 0.7 2.1SO„ kt 45 34 40 5.0 -1.0 1.3NO., kt 11 11 14 5.2 0.4 1.1
Stationary combustionCO2, mt 14 15 17 3.1 1.0 0.1SO2, kt 28 28 32 12 02 13NO., kt 24 26 30 4.1 1.3 -0.5
Mobile sources'CO2, mt 15 16 19 0.5 1.5 2.0SO2, kl 27 25 31 1.0 1.7 2.0NO., kt . . . . . • • 209 208 214 -0.1 0.0 0.7
•
1) Emissions from international shipping in Norwegian waters and petroleumactivities included.2) Gas power production excluded.3) kt = 1000 tons.4) mc = million tons.5) Shut-down of the copper smelter in Sulitjelma included from 1986.6) Of which emissions from international shipping in Norwegian watersaccounts for 9 kt SO2 , 23 kt NO and 1 mt CO, in 2000.
71
Since there is no gas grid in Norway, most domestic use would imply substantialcosts of transmission and distribution. Total transport costs per unit delieveredare lowest for power production, even if the production is based on a gas pipelineto Eastern Norway. For the other alternatives, total transport costs per unitdelievered will be higher, since they will demand a distribution network to severalsmall consumers.
In the Reference scenario, the price of electricity followed the development ofthe long term marginal cost for hydro power. This corresponds to an increasein real prices of electricity of approximately 1.5 percent annualy from 1990. In2000, the Reference scenario assumes a long term marginal cost of 29 ore per kWhmeasured in ,1988 prices, referred to the power station at 6 percent discount ratefor deliveres to the primary market. The production costs in a gas fired powerstation is 10 ore per kWh, including the cleaning costs of emissions of NOE .If, the prices of electricity based on gas is equal to the long term marginal costfor hydro power, the netback price for gas delivered at the power station will beapproximately 95 ore per Sm3 in 2000.
To increase demand for electricity in the Gas scenario, compared to the Refer-ence scenario, it is assumed that the price of electricity to the primary market is20 percent lower than in the Reference scenario. This implies a netback price forgas delivered to the power station of approximately 65 ore per Sm3 . The willing-ness to pay might be higher if the gas fired power station is located close to theconsumers, such that the transmission and distribution costs for gas power is lowerthan for hydro power. The willingness to pay might also be higher if the efficiencyrate of the gas fired power plant is higher than 50 percent, i.e. in a combinedpower station were the cooling water from gas power production is utilized.
In addition to the significant potential for gas power production, there is also acertain potential for indiginous use of gas to industrial processes. Up to 2000, thedemand from Norwegian industries is assumed to be relatively modest. In the Gasscenario it is assumed that 0.5 billion Sm3 is used as raw materials in industrialprocesses.
Direct use of gas as a substitute for oil and other fossil fuels in manufacturingindustries, will require relatively large investmènts in transmission and distributionnetworks. This is also the case for direct use of gas in households and services,where the introduction of gas would also require investments in heating equip-ments. The efficiency rate of direct use of gas for heating purposes is, however,close to 100 percent. This implies a high willingness to pay for direct use of gasin the residential sector in the longer run. The potential seems, however, to berelatively small within 2000, due to the large investment cost. This market seg-ment might be increased if direct use of gas is considered as an alternative in the
72
planning of new housing areas and commercial buildings.The prospects for direct use of gas for transportation purposes in Norway
(buses, trucks, private cars, ocean transport) are uncertain. The technology isknown and available, and gas vehicles are used in several countries.
Macroeconomic effects
In the Gas scenario, the investments in infrastructure and transport capacityfor gas is increased substantially compared to the Reference scenario. Lower priceson electricity induce increased demand and production of electricity, and thereforehigher investments in production and distribution capacity. Given the idle capacityin the Norwegian economy, increased investments will lead to higher domesticactivity levels, increased incomes and increased household consumption. In theGas scenario, the level of gross national product and household consumption isapproximately 1.5 percent higher than in the Reference scenario in 2000.
Higher domestic activity levels also increase imports and deteriorate the ex-ternal balance compared to the Reference scenario up to the end of the 1990s.Lower domestic energy prices, which follows from the increased energy supply,thereafter improves the competitiveness of Norwegian industries and the exportsof traditional commodities increase. In the last years of the decade, direct exportsof natural gas to Sweden gives higher incomes. The external balance is thereforealmost unchanged compared to the Reference scenario in 2000. The economic ben-efits from an increased depletion of natural gas will, however, be more significantafter the turn of the century.
Consumption of energy
In the Gas scenario, the production and energy consumption of power intensiveindustries are assumed to be unchanged compared to the Reference scenario. Thisis due to the fact that the industry has refused to purchase new power at priceswhich are equivalent to the 1983-contracts. Even if the electricity prices of the Gasscenario is 20 percent lower than the long term marginal cost for hydro power, theyare higher than the 1983-contracts.
Lower electricity prices give a substitution from oil products to electricity.Electricity consumption (net) increases by 9 percent or 10 TWh, the consump-tion of heating oils is reduced by 6 percent and the consumption of transportoils is almost unchanged. Lower energy prices, therefore, increases total energyconsumption compared to the Reference scenario, table 5.3.1.
It is not assumed that the sectoral energy consumption per unit of production isincreased in the Gas scenario compared to the Reference scenario. If lower energy
73
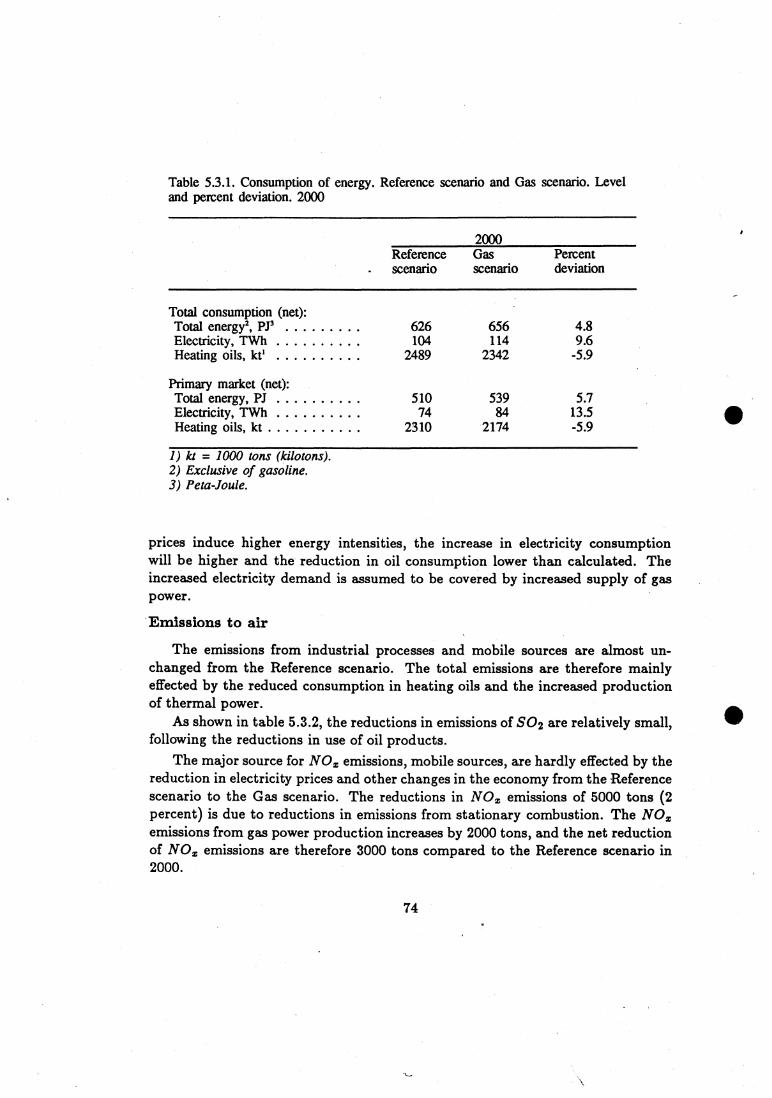
Table 5.3.1. Consumption of energy. Reference scenario and Gas scenario. Leveland percent deviation. 2000
2000Reference Gas Percent
- scenario scenario deviation
Total consumption (net):Total energy', RP 626 656 4.8Electricity, T'Wh 104 114 9.6Heating oils, kt' 2489 2342 -5.9
Primary market (net) •.Total energy, PJ . . • • 510 539 5.7Electricity, TWh 74 84 13.5Heating oils, kt 2310 2174 -5.9
1) kt = 1000 tons (kilotons).2) Exclusive of gasoline.3) Peta-Joule.
prices induce higher energy intensities, the increase in electricity consumptionwill be higher and the reduction in oil consumption lower than calculated. Theincreased electricity demand is assumed to be covered by increased supply of gaspower.
Emissions to air
The emissions from industrial processes and mobile sources are almost un-changed from the Reference scenario. The total emissions are therefore mainlyeffected by the reduced consumption in heating oils and the increased productionof thermal power.
As shown in table 5.3.2, the reductions in emissions of SO2 are relatively small,following the reductions in use of oil products.
The major source for NO emissions, mobile sources, are hardly effected by thereduction in electricity prices and other changes in the economy from the Referencescenario to the Gas scenario. The reductions in NO emissions of 5000 tons (2percent) is due to reductions in emissions from stationary combustion. The NOemissions from gas power production increases by 2000 tons, and the net reductionof NO emissions are therefore 3000 tons compared to the Reference scenario in2000.
74

Table 5.3.2. Emissions to airl.2 of CO2, SO2 and NO,. Reference 'scenario andGas scenario. Level and percent deviation. 2000
2000Percent
Reference scenario Gas scenario deviation
CO„ me 44 48 9.1Of which, gas powerproduction 1 6
SO2,ke 104 ' 102 -1.9NO., kt 258 255 -12
1) Emissions from international shipping in Norwegian waters and petroleumactivities included.2) Emissions from gas power production included.3) la = 1000 tons.4) mt = million tons.
The emissions of CO2 from stationary combustion is reduced by 1 billion tonas a result of fuel substitution. The reduction of emissions from heating oils arehowever more than compensated by the emissions from production of 10 TWh -gaspower, which increases emissions by 5 million tons. Even if gas has a lower carboncontent than oils, the CO2 emissions will increase, since gas is assumed to be usedin termal power plants with an efficiency rate of 0.5.
5.4 The Environment scenarios
5.4.1 Introduction
The starting point for the calculations in the Environment scenarios are the inter-national agreements on:
• 30 percent reduction of SO2 emissions by 1993, compared to the emissionlevel in 1980. The Governments target is to reduce emissions by 50 percentover the same period.
• Stabilizing emissions of NO at the 1987 level by the end of 1994 and adeclaration that Norway will aim at a 30 percent reduction by the end of1998.
75
Until recently much of the focus has been on air pollution of SO2 and NO,.Recently, the focus has changed to an increased attention on global environmentalproblems as the greenhouse effect and the depletion of the ozone layer of thestratosphere, see chapter 3.
Protection of the ozone layer will demand measures which will only effect rela-tively few commodities and processes, and where cost competitive alternatives areavailable in most cases.
The major source of CO2 emissions, one of the greenhouse gases, is combustionof fossil fuels. CO2 is difficult and costly to clean with known technolod, andemissions reductions will in practice mean reductions of consumption of fossil fuels.This might be a dominating feature of future environmental policies, and willdirectly or indirectly effect all economic activities. On the other hand, reducedconsumption of fossil fuels will also lead to lower emissions of SO2 and NO,.
Historically, there has been a high correlation between growth in production,income, energy consumption and pollution. The authorities can modify this rela-tion by introducing direct regulations either in the form of cleaning requirements,restrictions on consumption of fossil fuels or by introducing economic instrumentsas charges on emissions or on the use of fuels. The oil price increases in 1973-74and 1979-80, illustrated that prices on fossil fuels are essential both for the choiceof energy carrier and also as incentives to develop new technology.
The Reference scenario is characterized by a relatively moderate economicgrowth. Over a 14 year period, the increased activity levels still contribute toa rapid increase in the emission levels of SO2, NO and CO2. This means thatthe authorities will have to introduce new measures in addition to those alreadyintroduced, if the environmental targets should be achieved. When searching fornew policy measures, it is important to evaluate measures to control the threecomponents simultaneously, and the long term effects of the instruments shouldbe given some attention. Packages of short measures against single pollutantsmight be quite costly - and lead to wasted investments - if in the longer run itis necessary to use more general instrtiments to reduce the consumption of fossilfuels,
The agreements already signed on reductions of emissions of SO2 and NOS,give upper bounds on the emission levels after 1993 and 1998, respectively. Fu-ture renegotiations of these agreements will probably imply further ,restrictions onemission levels. It therefore seems appropriate to focus on instruments which couldstabilize or reduce the consumption of fossil fuels, even if the economic growth con-tinues up to 2000 and beyond. Steering mechanisms which change relative prices,seem most promising, since they give incentives both for substitution betweendifferent energy sources and technology development.
76
Chapter 5.4.2 discusses regulatory measures which can be introduced to achievethe targets on reductions of 502 and NO., and the costs of implementing suchpackages.
Chapter 5.4.3 discusses how economic instruments, such as indirect taxes, canbe used to achieve the targets, including a stabilizing of CO2 emissions. Finally,chapter 5.5 gives a brief discussion on how one can combine direct regulations andgeneral economic instruments to achieve environmental targets.
5.4.2 The Regulation scenario
The State Pollution Control Authority and the Ministry of Environment haveevaluated different measures to reduce emissions of S02 and NOE . The proposalsinclude stronger restrictions of the sulphur content of oil products, further clean-ing of manufacturing industries, new restrictions on emissions from vehicles andocean transport, energy economizing and traffic regulation. In the Regulation sce-nario, the costs and reduction of emissions of NO and SO2 of these proposals arecalculated as deviations from the Reference scenario.
The proposals are discussed in the White Paper no. 47 (1987-88) " On thereduction of emissions of nitrogen oxides in Norway" , and in a paper on reductionof SO2 emissions by the State Pollution Control Authority. Cost efficiency, i.e.costs per unit of emissions reduction are estimated for most of the proposals. TheResource Policy Group has evaluated costs and possible reduction of emissions as aresult of stronger regulations of industrial concessions and expected improvementsof technology in polluting process industries. This work is published as a sub-reportof the SIMEN-project, see appendix 1. Some of these changes can be characterizedas most likely, whereas others are only feasable if environment policies are radicallychanged.
Measures against SO2
The State Pollution Control Authority has given priority to three measures toachieve the government's target of 50 percent reduction of emissions from 1980 to1993:
• Restrict the content of sulphur in heavy oils to maximum 1 percent in allregions of the country. This restriction is only introduced in the 13 Southerncounties today. The State Pollution Control Authority has estimated thecosts of producing low sulphur oils to approximately 5 percent higher thanfor oils with an average sulphur content of 2.5 percent. Total annual costsare thus estimated to 30 million NOK at present oil consumption.
77

• Further reduce in the sulphur content in refined products such as dieseland light heating oils. The costs of reducing the sulphur contents in theseproducts from 0.23 to 0.20 percent is estimated to be less than 0.1 ore perliter.
• Introduce stronger regulations and cleaning requirements for SO2 emissionsin some of the larger establishments in the 13 Southern counties within 1993.The problem of acidification is concentrated to these counties. The measuresagainst establishments are regulations of process emissions, and reductionswill therefore be additional to the reduction following from lower sulphurcontent in transport and heating oils. These measures against manufacturingindustries, will according to the State Pollution Control Authority, reduceS02 emissions by 5000 tons before 1993, but the costs are highly uncertain.
The report from the Resource Policy Group gives estimates for SO2 clean-ing costs. The costs of sea-water-scrubbing is estimated to 13-26 NOK per kiloSO2 and lime scrubbing to approximately 35 NOK per kilo. Most establishmentsare located along the coast, such that sea-water-scrubbing is possible. Assumingthat the average cleaning costs will be 20 NOK per kilo, the proposals againstmanufacturing industries from the State Pullution Control Authority will costapproximately 100 million NOK annualy.
In addition to evaluating the proposals from the State Pollution Control Au-thority, the Resource Policy Group has also evaluated some measures against thealuminium industry, production of industrial chemicals and ferro alloys.
For the aluminium industry, most consessions are renegotiated the last twoyears or will be renegotiated through 1989. The most polluting units have beenasked to suggest measures which would reduce the emissions by 50 percent.
Today, only a few of the ferro alloy producers clean their emissions of SO2.Further restrictions on the remaining units might reduce emissions by 8000 tons,.Some of these regulations might imply considerable investments and reconstruc-tions, and marginal units might not be able to carry such costs.
Production of cilicium carbide also results in large emissions of 502. Thesource of emissions is coke with a sulphur content up to 2.7 percent. Technologyimprovement now make it possible to reduce sulphur contents to 2 percent, and theResource Policy Groups assumes that a further reduction to 1 percent might berealistic over a 10 year period. It is assumed that the average for the industry willbe 2 percent in 2000, which represents the technology front today. Low sulphurcoke is not more expensive than high sulphur coke, and the technology improve-ment which would reduce emissions by 1000 tons in 2000, is therefore assumed toincur no extra costs.
78

Table 5.4.1 shows the reduction in future emissions, given that all the abovementioned measures are introduced.
Table 5.4.1. Estimated reduction of S02-emissions. 1000 tons. 2000
Reduced sulphur contents in heating oils ... .. . 5Reduced sulphur contents in transport oils . . . . . 3Regulations of industries in acid areas . . . . . . • • 5
Further regulations of aluminium production . . . . . 3Further regulations of industrial chemicals . • • • 1Further regulations of ferro-alloy production . . . . 8
Total . . 25
Altogether the proposed regulations are estimated to cost 300-400 million NOKannualy, including interest costs. In a macroeconomic context, these costs arerelatively low, but some firms will have their costs increased substantially if thesenew regulations are enforced. The regulations will reduce total SO2 emissions by25 000 tons in 2000 compared to the Reference scenario. The emissions will thenbe 45 percent below the 1980 level, and the agreement of 30 percent reduction willbe reached since the measures are assumed to be enforced by 1993.
Measures against NO'.
The White Paper no. 47 (1987-88) discusses the effects of introducing USA-standards for diesel cars, which will reduce the NO emissions by approximately50 percent. This standard requires technical changes which will increase the pro-duction costs of private cars by 1600 NOK, small trucks by 3000 NOK and largetrucks by 10 000 NOK. The White Paper also discusses the impacts of introducingCalifornia standards to small gasoline and diesel cars. For gasoline cars, California-standards means that 90 percent of NO emissions are cleaned, whereas the emis-sions are reduced by 70 percent by todays catalytic cleaners.
Table 5.4.2 shows the reductions which follows from introducing USA-standardsfor light diesel cars within 1990, heavy diesel cars by 1994 and California standardsto all light vehicles by 1994.
There is some dispute over the effects these technical changes might have onfuel consumption, but preliminary estimates show an increase of 0-5 percent, which
79

Table 5.4.2. Estimated reductions of No.-emissions from mobile sources. 1000 tons
1995 1998 2000
Light gasoline cars 1 8 6Heavy gasoline cars 0 1 1Light diesel cars 1 2 2Heavy diesel cars 2 6 8
Total 4 16 18
would contribute to an increase in the emissions both of SO2 and CO2. Theseassessments are neglected in this chapter. The annual costs of the NO measuresare estimated to 130 million NOK in the White Paper.
Total emissions of NO were estimated to 245 000 tons in 1987, of whichprocess emissions contributed only 11 000 tons. Production of fertilizers is themain source of these process emissions. Some proposed cleaning, measures in thefertilizer industry will reduce NO emissions by 34 000 tons.
The White Paper on NO emissions, also discusses new regulations in oceantransport. The costs per ton reductions are, however, estimated to be 3 to 6 timesas high as in measures against road traffic. This might imply that measures againstocean transport might not contribute to emission reductions before the ,end of thecentury, but some recent technological improvements are promising.
Other proposed measures against SO2 and NO are energy economizing andregulation and stabilizing Of ocean and road transport. The instruments necessaryto achieve these changes are not discussed in the White Paper, but implicitly itis reasonable to assume that general economic instruments will be applied to giveincentives to energy economizing and technological improvements.
5.4.3 The Tax scenario
This scenario analysis the consequences of an environmental policy aiming at sta-bilizing the domestic emissions of CO2 at the 1987 level. The instrument is anincrease of the indirect taxes on fossil fuels, combined with an equivalent reductionof direct income taxes.
In this scenario, the assumptions on the development of crude oil prices and
80
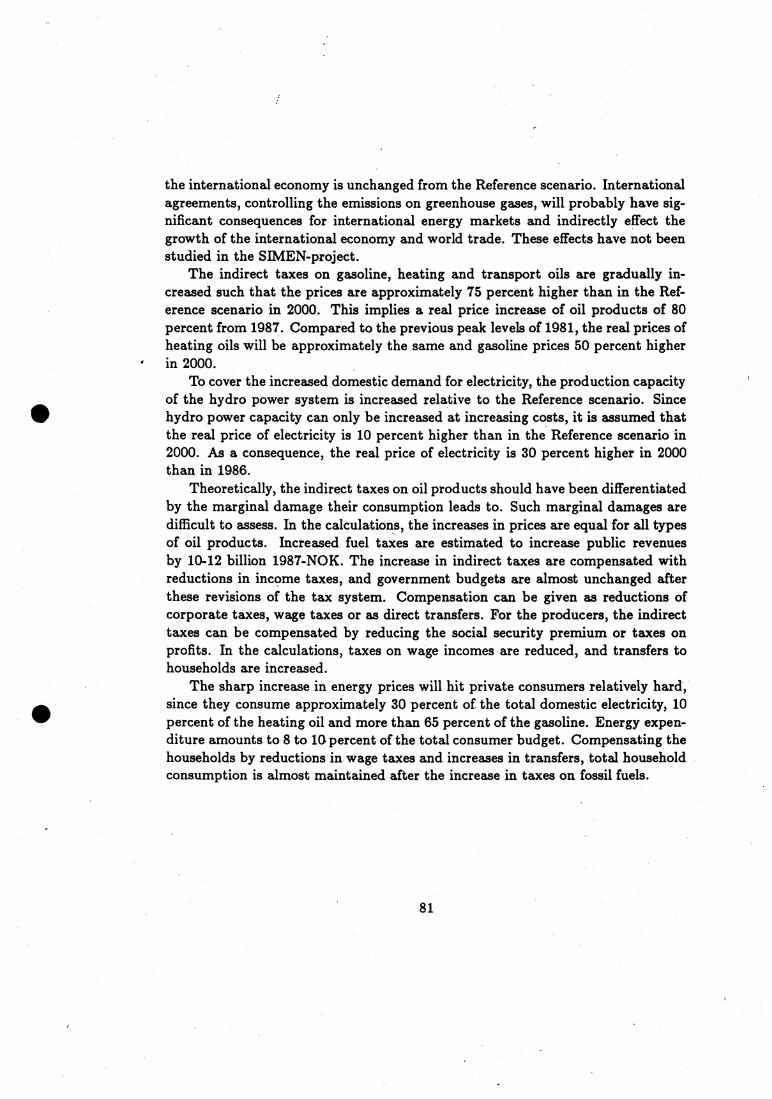
the international economy is unchanged from the Reference scenario. Internationalagreements, controlling the emissions on greenhouse gases, will probably have sig-nificant consequences for international energy markets and indirectly effect thegrowth of the international economy and world trade. These effects have not beenstudied in the SIMEN-project.
The indirect taxes on gasoline, heating and transport oils are gradually in-creased such that the prices are approximately 75 percent higher than in the Ref-erence scenario in 2000. This implies a real price increase of oil products of 80percent from 1987. Compared to the previous peak levels of 1981, the real prices ofheating oils will be approximately the same and gasoline prices 50 percent higherin 2000.
To cover the increased domestic demand for electricity, the production capacityof the hydro power system is increased relative to the Reference scenario. Sincehydro power capacity can only be increased at increasing costs, it is assumed thatthe real price of electricity is 10 percent higher than in the Reference scenario in2000. As a consequence, the real price of electricity is 30 percent higher in 2000than in 1986.
Theoretically, the indirect taxes on oil products should have been differentiatedby the marginal damage their consumption leads to. Such marginal damages aredifficult to assess. In the calculations, the increases in prices are equal for all typesof oil products. Increased fuel taxes are estimated to increase public revenuesby 10-12 billion 1987-NOK. The increase in indirect taxes are compensated withreductions in income taxes, and government budgets are almost unchanged afterthese revisions of the tax system. Compensation can be given as reductions ofcorporate taxes, wage taxes or as direct transfers. For the producers, the indirecttaxes can be compensated by reducing the social security premium or taxes onprofits. In the calculations, taxes on wage incomes are reduced, and transfers tohouseholds are increased.
The sharp increase in energy prices will hit private consumers relatively hard,since they consume approximately 30 percent of the total domestic electricity, 10percent of the heating oil and more than 65 percent of the gasoline. Energy expen-diture amounts to 8 to 10 percent of the total consumer budget. Compensating thehouseholds by reductions in wage taxes and increases in transfers, total householdconsumption is almost maintained after the increase in taxes on fossil fuels.
81
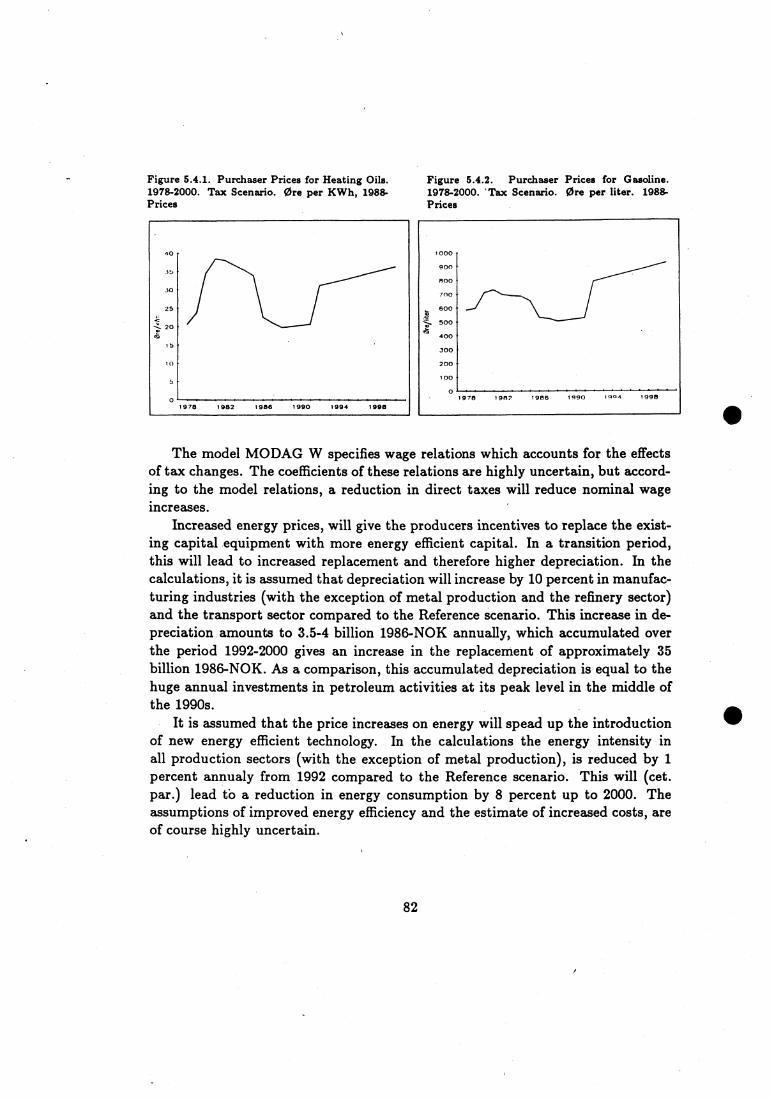
000
900
ROO
700
600.1.
500
400
300
200
100
01978 198 7 1966 1990 1994 1998
Figure 5.4.1. Purchaser Prices for Heating Oils. Figure 5.4.2. Purchaser Prices for Gasoline.1978-2000. Tax Scenario. Ore per KWh, 1988- 1978-2000. 'Tax Scenario. Ore per liter. 1988-Prices Prices
The model MODAG W specifies wage relations which accounts for the effectsof tax changes. The coefficients of these relations are highly uncertain, but accord-ing to the model relations, a reduction in direct taxes will reduce nominal wageincreases.
Increased energy prices, will give the producers incentives to replace the exist-ing capital equipment with more energy efficient capital. In a transition period,this will lead to increased replacement and therefore higher depreciation. In thecalculations, it is assumed that depreciation will increase by 10 percent in manufac-turing industries (with the exception of metal production and the refinery sector)and the transport sector compared to the Reference scenario. This increase in de-preciation amounts to 3.5-4 billion 1986-NOK annually, which accumulated overthe period 1992-2000 gives an increase in the replacement of approximately 35billion 1986-NOK. As a comparison, this accumulated depreciation is equal to thehuge annual investments in petroleum activities at its peak level in the middle ofthe 1990s.
It is assumed that the price increases on energy will spead up the introductionof new energy efficient technology. In the calculations the energy intensity inall production sectors (with the exception of metal production), is reduced by 1percent annualy from 1992 compared to the Reference scenario. This will (cet.par.) lead tb a reduction in energy consumption by 8 percent up to 2000. Theassumptions of improved energy efficiency and the estimate of increased costs, areof course highly uncertain.
82
Macroeconomic development
In the calculations, the total effects on main macroeconomic variables are smallcompared to the Reference scenario. Gross national product and household con-sumption are approximately 1 to 2 percent lower in 2000 than in the Referencescenario.
There are several reasons for these moderate changes in macroeconomic indi-cators. The budget share for energy is relatively low in most sectors, on average 5percent of total variables costs. The effects of higher energy prices are dampenedby the assumed increase in energy efficiency by 1 percent annually. The real priceincrease of oil products by 75 .percent, and the increase of electricity by 10 per-cent, will therefore on average increase variable costs by 0-3 percent. The effectsof higher energy prices, however, unequally distributed among sectors, dependenton the composition of the total energy consumption between electricity and oilproducts, and the budget share for energy. Reductions in direct income taxes areassumed to reduce nominal wage increases. The change of the tax system fromdirect to indirect taxation thus leads to small changes in production costs andhence in production and productivity for most sectors.
The calculated effects on total production are small, but for some industriesthe effects are significant. The decline in production is highest for relatively energyintensive industries as production of pulp and paper, chemicals and machineries.The decline ranges from 4 to 7 percent measured as production in 2000 comparedto the Reference scenario. The calculated effects for some of these energy intensivesub-sectors might be underestimated.
The change in relative energy prices, leads to higher domestic demand for elec-tricity, and increased investments and production in the hydro power sector. Thisalso increases the domestic activity level. At the same time the productivity ofthe economy is increased by introducing more energy efficient capital equipment.The compensation of private households by tax cuts and increased transfers, main-tains household disposable real income and thereby household consumption. Theimpacts on the external economy are also small. A more rapid replacement ofthe capital equipment in manufacturing industries and transportation increasesdomestic production and imports of investment commodities. Lower domestic oilconsumption, given production capacity, increases oil exports.
Supply and use of energy
Total domestic consumption of electricity increases by almost 5 percent or 5TWh compared _to the Reference scenario in 2000. This increase is due to higherdemand in the primary market. The power intensive industries are assumed to
83

maintain the production profile and the elctricity consumption Ironi the Referencescenario.
Table 5.4.3. Consumption of energy. Reference scenario and Tax scenario. Leveland percent deviation. 2000
2000 Level Level Reference Tax Percent1986 1987 scenario scenario deviation
Total consumption (net):Total energy', Pr . . 547 551 626 590 -5.7Electricity, TWh . . . . 90.5 91.3 104 109 4.8Heating oils, kt' . . . 2238 2251 2489 1621 -34.9Gasoline, kt 1859 1933 2311 1873 19.0Transport oils, kt . . 3006 3099 3574 3085 -13.7
Primary market (net):Total energy', P.1 . . . . 428 437 510 474 -7.1Electricity, GWh . . . . 60.5 62.4 74 79 6.8Heating oils, kt 1966 2001 2310 1476 -36.1Gasoline, kt 1957 1931 2310 1872 -19.0Transport oils, kt . . 3066 3099 3574 3085 -13.7
1) kt = 1000 tons (kilotons).2) Exclusive of gasoline.3) Peta-Joule.
The consumption of heating oils are reduced by 35 percent, gasoline by 19percent and transport oils by only 14 percent. The reduction in gasoline andtransport oil consumption can partly be seen as a result of more energy efficientvehicles, reduced use of private cars and better efficiency in road transport.
Supply of energy
Total net electricity consumption is 109 TWh in the Tax scenario in 2000.Gross demand for electricity is then 120 TWh, including the power loss of 12percent for delieveries to the primary market. The average annual productioncapacity of existing and planned hydro power plants is estimated to 112 TWh in2000. The demand gap is then 8 TWh electricity in the Tax scenario, comparedto 2 TWh in the Reference scenario. The increased demand for electricity can becovered in different ways, which will have different effects on the economy and onemissions of different pollutants.
84
- Gaspower
If the gap of 8 TVVh electricity in the Tax scenario, should be covered by gaspower, the CO2 emissions will be 4 million tons higher than in table 5.4.4. Ifreductions of CO2 emissions is a high priority target, substitution from heatingoils to electricity based on natural gas is not an acceptable solution.
- Direct use of natural gas for heating purposes
Direct use of gas for heating purposes is briefly discussed in the Gas scenario,chapter 5.3. The conclusion is relatively pessimistic, but the potential might in-crease after 2000. A substitution from oil to direct use of gas in existing stationarycombustion, might reduce CO2 emissions by more than 40 percent. Direct use ofgas for heating purposes is still not a very promising Norwegian solution if thetarget is to reduce CO2 emissions, since the substitution potential is relativelysmall. It should be noted, though, that direct use of gas is more." energy and costefficient" than converting gas to electricity.
- Reorganization of the electricity market
The Norwegian electricity market is characterized by great differences in pur-chaser prices between consumer groups. The power intensive industries, throughtheir long term contracts, benefit from low prices compared to other commercialsectors. There are also great differences in purchaser prices payed by householdsin different regions, without any differences in basic production and distributioncosts.
A deregulation of the electricity market towards a system based on willing-ness to pay, would reduce the need for expansion of the electricity capacity. Halfof the Norwegian energy consumption is based on clean hydro power. It seemsreasonable to utilize hydro power resources more optimally to achieve ambitiousenvironmental targets.
The price of electricity is not differentiated over the year and over the day,with the exception of surplus power, where the price is determined in a short termauction market. Introducing a peak load pricing system, would lead to betterutilization of the hydro power resources, and reduce the need for a further expan-sion of the power system. Several propositions and White Papers conserning theorginization of the Norwegian electricity market are under preparation.
85

- Expansion of the hydro power capacity
A third way of covering the extra demand for electricity is to expand thehydro power system. It is possible to expand the hydro power system to 127 TWh(firm power), without exploiting protected water falls. The estimated productioncapacity in 2000 is 109 TWh firm power. The cost estimates from the NorwegianWater and Electricity board show an increasing long term marginal costs for theremaining 18 TWh firm power. The planning and investment period for newhydro power projects has normally been approximately 10 years. According to theNorwegian Water and Electricity board, the required 8 TWh in the Tax scenario,can realistically be realized within year 2000 at the assumed prices.
- Energy economizing
Improved organization of the electricity market, improved efficiency of oldpower plants, improvements of distribution and transmission networks, more en-ergy efficient production and transport technology and increased use of heat pumps,might contribute to a more efficient use of hydro power resources even at presentenergy prices. These measures might e.g. reduce the power losses and allow forhigher consumption of electricity without increasing the total production capacity.
Increased prices of energy, as in the Tax scenario, will lead to introduction ofnew technology* and enhance the energy economizing potential compared to thepresent situation. The Tax scenario does not assume energy economizing addi-tional to the Reference scenario - which include estimates from official documents.
- Unconventional energy sources
If prices of fossil fuels and electricity increase, bio fuels (wood, peat, etc) andwind and wave power might cover some of the energy demand. The supply ofthese unconventional energy sources will be dependent on relative prices, but willprobably not contribute significantly to domestic energy supply within 2000.
1-
Emissions to air
The increased taxes on fossil fuels reduce consumption and therefore the emis-sions compared to the Reference scenario. The môst significant reductions are dueto lower consumption of heating oils in stationary combustion. Table 5.4.4 givesa summary of the calculations by comparing the Tax scenario and the Referencescenario in 2000 with historical numbers. Figures 5.4.6-5.4.8 show emission profilesfor the calculation period and depict international agreements.
86

Total emissions of 502 in 2000 is 82 kt, which is a reduction of 61ct from 1987.Tax differentiation is assumed to reduce the sulphur content in heavy oils from 2.5to 1 percent in the 6 Northern counties, and the sulphur contents for diesel and lightheating oils from 0.23 percent to 0.20 percent. A further reduction from 1 percentto 0.2 percent for heavy oils would cut the emissions by an additional 3 kt comparedto the calculation results in table 5.4.4. Compared to the Reference scenario in2000, the 502 emissions from stationary combustion is reduced by 15 percent, andthe emissions are then significantly lower than in 1987. The S02-emissions fromprocesses and mobile sources are lower than in the Reference scenario, but higherthan in 1987. Process emissions grow proportionately to production. A marginalincrease in the consumption of some transport oils gives higher emissions frommobile sources.
Total emissions of NO are 223 kt in 2000, which is 22 kt lower than in 1987.The highest percentage reduction of NO emissions compared to the Referencescenario is in stationary combustion, whereas the largest absolute reduction isfor mobile sources. This is mainly a result of reduced gasoline consumption byhouseholds. Both the emissions from mobile and stationary combustion are lowerthan in 1987. The figures of table 5.4.4 do not include possible measures againstthe production of fertilizer, which could reduce emissions by 34 kt.
Total emissions of CO2 are 36 mt in 2000, 7 mt lower than in the Referencescenario and the emissions are stabilized at the 1987 level. Process emissions arehigher in 2000 than in 1987 due to increased production in manufacturing indus-tries. This is compensated by a reduction in emissions from stationary sources,whereas emissions from mobile sources are unchanged.
The calculations only to a limited extent takes into account the possibilities tosubstitute from buses to local trains, and to transfer commodity transports fromvehicles to railway. The possibilities to use natural gas as a mobile fuel for roadand ocean transport are not included in the calculations. This means that theforecasts for reductions of emissions might be underestimated in the Tax scenario.
Reductions of SO2 and NO emissions might improve health conditions andgive efficiency gains in the form of increased labour productivity and lower expen-sies to medical care. In addition, less air pollution will reduce corrosion costs andcleaning expenses. It is difficult to assess this effects numerically, and they are notaccounted for in the model calculations.
87

Table 5.4.4. Emissions to airla of CO2, SO2 and NOE. Reference scenario andTax scenario. Level and percent deviation. 2000
2000 Level Level Reference Tax Percent1986 1987 scenario scenario deviation
TotalCO2, me 35 36 43 36 -16.3SO2, ke 99 885 104 82 -21.1NOE, kt 244 245 258 223 -13.6
ProcessesCO2, mt 5 5 7 7 -0.0SO2, kt 45 34 40 39 -2.5NOE, kt 11 11 14 14 -0.0
Stationary combustionCO2, mt 14 15 17 13 -23.5SO2, kt 29 28 32 16 -50.0NOE, kt 24 26 30 24 -20.0
Mobile sourcesCO2, mt 15 16 19 16 -15.8S02, kt 27 25 31 27 -22.9NOE, kt 209 208 214 186 -13.1
1) Emissions from international shipping in Norwegian waters and petroleumactivities included.2) Possible emissions from gas power production excluded.3) kt = 1000 tons.4) mt = million tons.5) Shut-down of the copper smelter in Sulitjelma included from 1986.
88

01986 1988 1990 1992 1994 1996 1998 2000
Figure 5.4.3. 502-emissions. Tax Scenario. Figure 5.4.4. NO.-emissions. Tax Scenario.1986-2000. 1000 metric tons per year
1986-2000. 1000 metric tons per year
The calculations in the Tax scenario indicate that the SO2 agreement on 30percent reduction from the 1980 level is clearly within reach, and that the Gov-ernment's target of 50 percent reduction is possible. The NO agreement onstabilizing the emissions at the 1987 level is achieved, but the emissions in 2000 ismore than 50 kt over the level which comply to the Governments declaration on30 percent reduction within 1998.
•
89
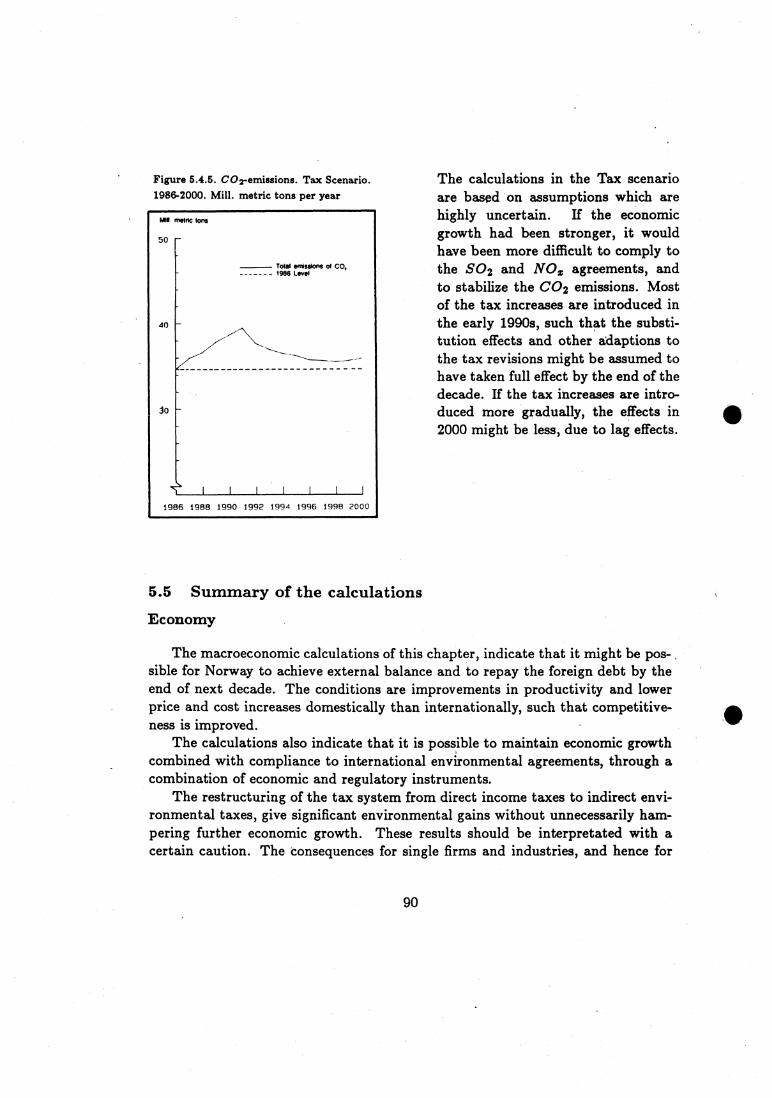
Figure 5.4.5. COremissions. Tax Scenario.1986-2000. Mill. metric tons per year
The calculations in the Tax scenarioare based on assumptions which arehighly uncertain. If the economicgrowth had been stronger, it wouldhave been more difficult to comply tothe SO2 and NO agreements, andto stabilize the CO2 emissions. Mostof the tax increases are introduced in.the early 1990s, such that the substi-tution effects and other adaptions tothe tax revisions might be assumed tohave taken full effect by the end of thedecade. If the tax increases are intro-duced more gradually, the effects in2000 might be less, due to lag effects.
1986 1988 1990 1992 1994 1996 1998 2000
5.5 Summary of the calculations
Economy
The macroeconomic calculations of this chapter, indicate that it might be pos-sible for Norway to achieve external balance and to repay the foreign debt by theend of next decade. The conditions are improvements in productivity and lowerprice and cost increases domestically than internationally, such that competitive-ness is improved.
The calculations also indicate that it is possible to maintain economic growthcombined with compliance to international environmental agreements, through acombination of economic and regulatory instruments.
The restructuring of the tax system from direct income taxes to indirect envi-ronmental taxes, give significant environmental gains without unnecessarily ham-pering further economic growth. These results should be interpretated with acertain caution. The consequences for single firms and industries, and hence for
90
the total economy, might be underestimated in the calculations. The SIMENcalculations do not include any regional effects.
Even if the effects on macroeconomic indicators are small between the differentscenarios, energy consumption and emissions to air vary significantly.
If economic growth is increased compared to the SIMEN calculations, the chahlenges to energy and environmental policies will also increase. On the other hand,higher economic growth will also improve the ability to carry costly environmentprograms and increase the possibilities for industrial restructuring.
Energy
Total energy consumption is highest in the Gas scenario, as a result of lowerenergy prices.. The consumption of electricity is 10 TWIt higher, than in the Ref-erence scenario, while the consumption of oil products are somewhat lower. Gaspower production is 12 TWh in the Gas scenario and 2 TWh in the Referencescenario.
In all scenarios ; it is assumed that the power intensive industries consume theircontracted 30 TWh electricity (equivalent to their consumption in 1988) over thecalculation period. This might be unrealistic, if the alternative value of electricityis increasing towards the end of the 1990s. tven though the electricity prices are,low in the Gas scenario, they are still higher than in the 1983-contracts, which thepower intensive industries have declined.
In the Tax scenario, where the indirect taxes on fossil fuels are increasedsharply, total energy consumption decline compared to the Reference scenario.Total oil consumption is reduced by 20 percent, while the consumption of elec-tricity to the primary market increases by approximately 5 TWh (net). Higherenergy prices give incentives to researh and development of more energy efficienttechnology, and the energy efficiency is increased by 1 percent annually for mostsectors compared to the Reference scenario.
In the Tax scenario, the increase in domestic electricity demand is covered byhydro power production, which is 8 TVVh higher than in the Reference scenario.The Tax scenario does not assume any additional energy economizing or betterorganization of the electricity market, compared to official documents. This mightbe a conservative estimate.
Future planning of electricity supply, should give special attention to the in-efficient utilization of Norwegian hydro power resources. By substituting fuel oilswith electricity produced as hydro power, the emissions of 502 and NO and CO2might be reduced. If future increases in energy demand is covered by electricityproduced from natural gas or by direct use of gas, at the same time as the hydro
91

200
180
160
140
120
100
BO
1 1 1 1 L LJ_J1970 1974 1978 1982 1986 1990 1994 1998 2002
power resources are inefficiently used, this might create unnecessary problems inachieving central environmental targets.
Pollution
The greatest challenge to environmental policies seems to be a stabilizing orreduction of CO2 emissions, since this implies a reduction in the consumption offossil fuels. However, such a reduction will also lead to reduction in the emissionsof NO and SO2.
Figures 5.5.1-5.5.3 show the emissions of SO2, NO and CO2 in the Referencescenario, the Regulation scenario and the Tax scenario. None of the proposedadministrative measures in the Regulation scenario effect the emissions of CO2.
Figure 5.5.1. Emissions of 502. 1000 metric tons Figure 5.5.2. Emissions of NO2 . 1000 metricper year. 1970-2000 tons per year. 1970-2000
92
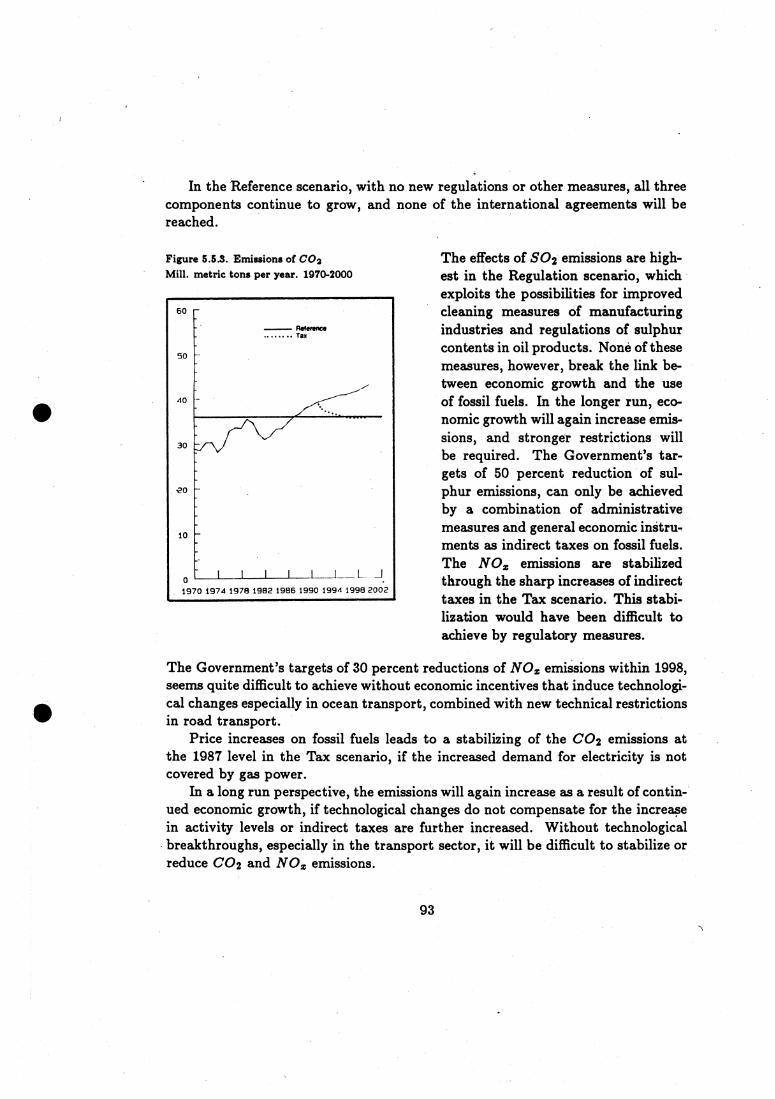
In the Reference scenario, with no new regulations or other measures, all threecomponents continue to grow, and none of the international agreements will bereached.
Figure 5.5.3. Emissions of CO2Mill. metric tons per year. 1970-2000
60 I^
Reference........ Tax
50
40
30
•20
10
111111L_11970 1974 1978 1982 1986 1990 1994 1998 2002
The effects of SO2 emissions are high-est in the Regulation scenario, whichexploits the possibilities for improvedcleaning measures of manufacturingindustries and regulations of sulphurcontents in oil products. Noné of thesemeasures, however, break the link be-tween economic growth and the useof fossil fuels. In the longer run, eco-nomic growth will again increase emis-sions, and stronger restrictions willbe required. The Government's tar-gets of 50 percent reduction of sul-phur emissions, can only be achievedby a combination of administrativemeasures and general economic initru-ments as indirect taxes on fossil fuels.The NO emissions are stabilizedthrough the sharp increases of indirecttaxes in the Tax scenario. This stabi-lization would have been difficult toachieve by regulatory measures.
The Government's targets of 30 percent reductions of NO emissions within 1998,seems quite difficult to achieve without economic incentives that induce technologi-cal changes especially in ocean transport, combined with new technical restrictionsin road transport.
Price increases on fossil fuels leads to a stabilizing of the CO2 emissions atthe 1987 level in the Tax scenario, if the increased demand for electricity is notcovered by gas power.
In a long run perspective, the emissions will again increase as a result of contin-ued economic growth, if technological changes do not compensate for the increasein activity levels or indirect taxes are further increased. Without technologicalbreakthroughs, especially in the transport sector, it will be difficult to stabilize orreduce CO2 and NO emissions.
93

References
Bergan R., A. Cappelen, S. Longva and N.M. Stolen (1986): MODAG A- A medium term annual macroeconomic model of the Norwegian economy.Discussion paper no. 18, Central Bureau of Statistics.
Bye, B. and A. Aaheim (1988): Introduction of gas power. Economic Analy-sis no. 3 - 1988, Central Bureau of Statistics.
Bye, T. and F. FOrsund (1989a): Norwegian Aluminium production 1966-1986.Forthcoming. Central Bureau of Statistics.
Bye, T. og F. Forsund (1989b): Norwegian ferro alloy production 1972-1986.Forthcoming. Central Bureau of Statistics.
Bye, T., F. Forsund and T.A. Johnsen (19890 Norwegian pulp and paperproduction 1972-1986. Forthcoming. Central Bureau of Statistics.
Cappelen, A. and S. Longva (1987): MODAG A; A Medium- Term Macro-economic Model of the Norwegian Economy. In Bjerkholt, O. and J. Rosted.(eds.) (1987): Macroeconomic Medium- Term Models in the Nordic Coun-tries. North Holland, Amsterdam.
Cappelen, A. and K. Mourn (1987): The structure and properties of the MO-DAG models. Sosialøkonomen. no. 5, Oslo.
Eldegaard T.(1989): Domestic use of natural gas. Report from the Institute ofIndustrial Economics. No. 111.
The Energy Forecasting Committe (1987): Contribution from the Energy Fore-casting Committee to the White Paper on Energy 1987. Mimeographed.Ministry of Petroleum and Energy
Glomsrød, S. and A. Rosland (1988): Air Pollution and Corrosion: SocioEconomic Costs. Report 1988/31. Central Bureau of Statistics.
Jervan, H. and P. Stiansen (1989): Pollution and Environmental Investmentsin Norwegian Manufacturing Industries towards 2000. Report GRS-745. TheResource Policy Group.
Ministry of Environment (1988): On the Reduction of Emissions of NitrogenOxides in Norway. White Paper no. 47 (1987-88).
94
Ministry of Finance (1988a): Norwegian Economy in Transition. Perspictivesfor National Wealth and Economic Policies in the 1990s. NOU (1988:21).
Ministry of Finance (1988b): The income formation in Norway. NOU (1988:24).
Ministry of Finance (1989): Norwegian Long-Terrn Programme 19904995. WhitePaper no. 4 (1988-89).
Norwegian Water and Electricity board (1988): Hydro Power Supply 1988 -
2005. Report from NWEB, ES/21- 88, part 1.
The Ministry of Petroleum and Energy (1987a): Future Norwegian EnergyConsumption and Production, White Paper no. 38 (1986-87).
The Ministry of Petroleum and Energy (198713): Addendum to White Pa-per no. 38 (1986-87). White Paper no. 19 (1987-88).
Svendsen, B. (1988a): Industry, Environment and Energy towards 2000. Nor-wegian Aluminium Production. Report from the Institute of Industrial Eco-nomics. No. 108.
Svendsen, B (1988b): Industry, Environment and Energy towards 2000. Nor-wegian Ferro Alloy Production. Report from the Institute of Industrial Eco-nomics. No. 109.
Svendsen, B (1988c): Industry, Environment and Energy towards 2000. Nor-wegian Pulp and Paper Production. Report from the Institute of IndustrialEconomics. No. 110.
World Commission on Environment and Development (1987): Our Com-mon Future. Oxford University Press, Oxford and New York.
Central Bureau of Statistics (1989a): Natural Resources and the Environment1988. Report no. 1989/1.
Central Bureau of Statistics (1989b): Economic Survey 1988. Norway. Eco-nomic analysis no. 1 - 1989.
Ostberg, O. (1989): Economic and Administrative Instruments in EnvironmentPolicies. Report from the State Pollution Control Authority.
95
APPENDIX 1
Organization. Participants. Sub-projects
The Ministry of Industry initiated the SIMEN-project in the spring of 1988 aspart of the Norwegian follow up of the report from the 'World Commission onEnvironment and Development. The project started in May 1988 and the mainreport was published in March 1989.
The state secretaries of the Ministry of Finance, The Ministry of Environment,the Ministry of Industry and the Ministry of Petroleum and Energy have actedas steering committee for the SIMEN-project. The' day to day follow up of theproject has been conducted by a project groiip of civil servants from the same fourministries.
The Central Bureau of Statistics has coordinated the SIMEN- project and hasthe professional responsibility for the main report. The sub-reports have beenelaborated by the Resource Policy Group, the Institute of Industrial Economics,the State Pollution Control Agency, the Center for Applied Economic Research atthe University of Oslo and the Central Bureau of Statistics. The SIMEN-projectwas completed within a few months, with a total research effort of three man-years,sponsored by the participating ministries. The project has benefited from informalcontacts with organizations and individuals from several industries.
The following individuals have contributed to the completion of the SIMEN-
project:
Advisory Board
Tone Bratteli, the Ministry of EnvironmentAstrid Nistad, the Ministry of Petroleum and EnergyJon Ivar Misund, the Ministry of IndustryBjorn Skogstad Aamo, the Ministry of Finance
96
Project Group
Kari Selte, the Ministry of IndustryJon Nicolaisen, the Ministry of FinanceMagne Rod, thé Ministry of EnvironmentSvein-Roar Brunborg, the Ministry of Petroleum and EnergyAarne Rovik og Jon Magne Skjelvik, the Ministry of Industry-(secretary for the Project Group)
Project Coordinator
Lorents Lorentsen, Central Bureau of Statistics
Macroeconomic Calculations/Main report
Torstein Bye, Central Bureau of StatisticsBrita Bye, Central Bureau of StatisticsAdne Cappelen, Central Bureau of StatisticsLorents Lorentsen, Central Bureau of Statistics
Sub-project on power intensive industries
Bjorn Svendsen, Institute of Industrial EconomicsFinn Forsund, Center for Applied ResearchTorstein Bye, Central Bureau of Statistics
Contacts:
Per A. Beck, State Pollution Control AuthorityLeif Hegna, ElkemRonald Fagernes, Norwegian Pulp and Paper Association
97
Sub-project on natural gas
Tom Eldegård, Institute of Industrial Economics
Contacts:
Asbjørn Aaheim, Central Bureau of StatisticsSvein-Roar Brunborg, the Ministry of Petroleum and EnergyOddbjørg Bakli, State Pollution Control AuthorityLars T. Dyrhaug, Confederation of Norwegian Business and IndustryGeir Høibye, Confederation of Norwegian Business and IndustryEivind Reiten, Norsk HydroAarne Røvik, the Ministry of Industry
Sub-project on environment technology
Hilde Jervan, Resource Policy GroupPeer Stiansen, Resource Policy Group
Contacts:
Gunnar Jorfald, State Pollution Control AuthorityBjorn Sveen, Confederation of Norwegian Business and IndustryHelge Skinnemoen, Norsk HydroSimen Ensby, the Norwegian Royal Council for Scientific andIndustrial Research
Sub-project on Economic Instruments
Øyvind Østberg, State Pollution Control AuthorityJan E. Tveter, State Pollution Control AuthorityOddbjørg Bakli, State Pollution Control AuthorityJohn Magne Skjelvik, the Ministry. of IndustryHåkon Jentoft, the Ministry of EnvironmentSolveig Glomsrød, Central Bureau of Statistics
98
Contacts:
Helge Fredriksen, Confederation of Norwegian Business andIndustryRolf Marstrander, Norsk Hydro
Contact in the Norwegian Labour Union
Erik Orskaug

Reports from the SIMEN-project
Bye, T. and F. Forsund (1989a): Norwegian Aluminium Production 1966- 1986.Forthcoming. Central Bureau of Statistics.
Bye, T. og F. Forsund (1989b): Norwegian ferro alloy production 19724986.Forthcoming. Central Bureau of Statistics.
Bye, T., F. FOrsund and T. Johnsen (1989): Norwegian Pulp and Paper Pro-duction 1972-1986. Forthcoming. Central Bureau of Statistics.
Eldegaard T.(1989): Domestic use of natural gas. Report from the Institute ofIndustrial Economics.
Jervan, H. and P. Stiansen (1989): Pollution and Environmental investmentsin Norwegian manufacturing industries towards 2000. Report GRS-745, theResource Policy Group.
Svendsen, B. (1988a): Industry, Environment and Energy towards 2000. Nor-wegian Aluminium production. Report from the Institute of Industrial Eco-nomics.
Svendsen, B (1988b): Industry, Environment and Energy towards 2000. Nor-
wegian Ferro Alloy production. Report from the Institute of Industrial Eco-nomics.
Svendsen, B (1988c): Industry, Environment and Energy towards 2000. Nor-wegian pulp and paper production. Report from the Institute of IndustrialEconomics.
Østberg, 0. (1989): Economic and Administrative instruments in pollution poli-cies. Report from the State Pollution Control Authority.
100
APPENDIX 2
The Macroeconomic Model MODAG W
Main macroeconomic features
MODAG W, applied in the analysis of chapter' 5, is a model for mediumterm macroeconomic planning, extensively used by the Norwegian Ministryof Finance. MODAG W gives a relatively detailed description of the labour-,capital- and commodity markets of the Norwegian economy, while financialand monetary issues are assessed outside the model. For a description of themodel, see Cappelen and Longva (1987) or Cappelen and Mourn (1987).
The core of the model is an input-output-matrix, specifying about 40 com-modities and 30 production sectors. The model describes the private sector'sbehaviour, while the government sector is exogenously treated. Production,labour and capital use and hence gross investments are determined by ag-gregate demand.
The production function (the model specifies dual cost functions) in eachsector Could be represented by
X F (1)
Output, (X) is a function of labour (L), capital (K), materials (M) and.an energy-aggregate (U) of electricity (E) and oil products (F). Substitu-tion pbssibilities between labour and capital, due to changing factor pricesare specified. Materials and total energy use are determined by base-year-estimated, but exogenous unit coefficients. The description of producer be-haviour varies from sector to sector, but can be characterized as cost mini-mizing. The petroleum and shipping sectors are almost totally exogenouslydetermined. The model thus describes the behaviour of the private sectorsof the mainland economy. The producers of the mainland economy, are as-sumed to have a certain market power both in domestic and foreign markets.
101

= xPm M-FPE E-FPF F-1-147 L
(2)
Norwegian sectors compete on the international and domestic markets. Themain explanatory variables on the export market are exogenously given mar-ket indicators and relative prices on Norwegian and international products.Imports are determined by commodity-sector differentiated, price elastic,import shares. In the short and medium term, assessments of internationaland government demand are the main determinants for production and em-ployment in the mainland economy. In the longer run, the supply of labourand the development of productivity constrain production growth.
Increased Norwegian factor prices will, ceteris paribus, reduce the marketshares of Norwegian producers, and lead to a reduction of competitive in-dustries. The model does not include any strong mechanism which bringsimbalances in the labour market or the external economy automaticly to-wards a new equilibrium.
Product prices depend on variable unit costs, capacity utilization and worldmarket prices. Variable unit costs, Py, vary due to input, factor prices andoutput,
Electricity prices (PE) are directly under government control, while oil prod-ucts prices (PF) are determined by international crude oil prices, and indirecttaxes.
Given total demand, both domestic and from export-markets; the producersminimizes their variable production costs of labour, materials and energy.Wage costs (W) are determined by
W = W(UR, PC, T, r, V). (3 )
UR is the unemployment rate, PC is domestic prices, T is income taxes, ris technical change and V is a vector of other factors. The wage-formationincludes a Phillips-curve-mechanism. The larger the unemployment rate, thesmaller is wage increases. Growth in domestic prices and income taxes both •
induce increases in wages, while labour-augmenting technical change givesless increase in the wage costs. The hyphothesis that changes in incometaxes influence on the wage-rate growth has been analysed on Norwegiandata, and tests are inconclusive, but such a relation is implemented in the
102

model MODAG W, and is important when analysing how to solve pollutionproblems by changing the tax system. In the analysis in chapter 5, Ppis increased by increasing indirect taxes on oil-products and W is reducedthrough reductions of income taxes T.
The model describes household's behaviour for the supply of labour anddemand for consumer commodities and housing services. The supply oflabour is basically determined by demographic factors, and is relatively in-elastic with respect to marginal real wages. The households demand forcommodities and services are determined in a general linear expenditure sys-tem, depending on relative prices and real disposable income. Investmentsin dwellings and other consumer demand are dependent on household's dis-posable real incomes, relative prices, interest rates and an exogenously de-termined saving ratio.
Energy demand
Total demand for energy follows from an exogenous input coefficient and theactivity level. The model specifies substitution possibilities between energycommodities i.e. between electricity and oil products. Oil products is aLeontief-aggregate of heating and transport oils. • Relative prices betweenelectricity and oil products determine the composition of energy in a CES-aggregate
E.=1.[6 (7) ff + (1 - 6)
((1 6))- 6))
The households' demand for energy depends on real disposible income. Alsofor households relative prices between electricity and oil products determinethe composition of total energy demand.
Pollution
An emission model with a set of emission-coefficients links different air pollu-tants to economic variables in MODAG W. These coefficients are, dependingon polluting component, linked to the use of materials in production pro-cesses, and the consumption of oil products for heating and transportation,
a-1
(4)
103
AIjj = tki (5)
AIN is emission to air of component k from source î, tki is emission-coefficientfor component k from source i. S is a matrix of explanatory variables forproduction processes, and different types of oil products.
The emissions coefficients can be changed exogenously through the calcula-tion period, to account for new policy measures.
The following components are included in the sub-model: SO2, NOE, CO2,VOC, particulates and Pb.
Critical evaluation of the model
MODAG W is extensively used by government agencies to forecast themacroeconomic development of the Norwegian economy in a medium termperspective. Major changes in the Norwegian economy or in the economyof trading partners, might lead to changes in expectations, behavioural re-lations and in institutions, which the model. does not adequately capture.The calculations of the SIMEN-project, especially the tax scenario, includedramatic changes of the tax system and relative factor prices. The changesin factor prices are clearly outside the sample observations, which the modelis estimated on. This, of course, creates some uncertainty about the validityof the calculations.
The model has several weaknesses and was certainly not intended for analy-ses of major changes in economic policies as in the SIMEN-project. However,the SIMEN questions could hardly be adequately analysed without applyinga macroeconomic model, describing the interplay between activity levels, en-ergy consumption and pollution in all sectors of the economy simultaneously.
104
ISSUED IN THE SERIES DISCUSSION PAPER
No. 1 I. Aslaksen and O. Bjerkholt: Certainty Equivalence Proceduresin the Macroeconomic Planning of an Oil Economy.
No. 3 E. Biørn: On the Prediction of Population Totals from Samplesurveys Based on Rotating Panels.
No. 4 P. Frenger: A Short Run Dynamic Equilibrium Model of theNorwegian Prduction Sectors.
No. 5 I. Aslaksen and O. Bjerkholt: Certainty EquivalenceProcedures in Decision-Making under Uncertainty: an EmpiricalApplication.
No. 6 E. Morn: Depreciation Profiles and the User Cost of Capital.
No. 7 P. Frenger: A Directional Shadow Elasticity of Substitution.
No. 8 S. Longva, L. Lorentsen, and O. Olsen: The Multi-SectoralModel MSG-4, Formal Structure and Empirical Characteristics.
No. 9 J. Fagerberg and G. Sollie: The Method of Constant MarketShares Revisited.
No.10 E. Biørn: Specification of Consumer Demand Models withStocahstic Elements in the Utility Function and the firstOrder Conditions.
No.11 E. Morn, E. Holmoy, and O. Olsen: Gross and Net Capital,Productivity and the form of the Survival Function . SomeNorwegian Evidence.
No.12 J. K. Dagsvik: Markov Chains Generated by MaximizingComponents of Multidimensional Extremal Processes.
No.13 E. Biørn, M. Jensen, and M. Reymert: KVARTS - A QuarterlyModel of the Norwegian Economy.
No.14 R. Aaberge: On the Problem of Measuring Inequality.
No.15 A-M. Jensen and T. Schweder: The Engine of FertilityInfluenced by Interbirth Employment.
No.16 E. Biørn: Energy Price Changes, and Induced Scrapping andRevaluation of Capital - A Putty-Clay Approach.
No.17 E. Biørn and P. Frenger: Expectations, Substitution, andScrapping in a Putty-Clay Model.
No.18 R. Bergan, A. Cappelen, S. Longva, and N. M. Stolen: MODAG A -A Medium Term Annual Macroeconomic Model of the NorwegianEconomy.
No.19 E. Biørn and H. Olsen: A Generalized Single Equation ErrorCorrection Model and its Application to Quarterly Data.
105.
No.20 K. H. Alfsen, D. A. Hanson, and S. Glomsrod: Direct andIndirect Effects of reducing SO2 Emissions: ExperimentalCalculations of the MSG-4E Model.
No.21 J. K. Dagsvik: Econometric Analysis of Labor Supply in a LifeCycle Context with Uncertainty.
No.22 K. A. Brekke, E. Gjelsvik, B. H. Vatne: A Dynamic Supply SideGame Applied to the European Gas Market.
No.23 S. Bartlett, J. K. Dagsvik, Ø. Olsen and S. Strom: Fuel Choiceand the Demand for Natural Gas in Western European Households.
No.24 J. K. Dagsvik and R. Aaberge: Stochastic Properties andFunctional Forms in Life Cycle Models for Transitions into andout of Employment.
No.25 T. J. Klette: Taxing or Subsidising an Exporting Industry.
No.26 K. J. Berger, O. Bjerkholt and O. Olsen: What are the Optionsfor non-OPEC Producing Countries.
No.27 A. Aaheim: Depletion of Large Gas Fields with Thin Oil Layersand Uncertain Stocks.
No.28 J. K. Dagsvik: A Modification of Heckman's Two StageEstimation Procedure that is Applicable when the Budget Set isConvex.
No.29 K. Berger, A. Cappelen and I. Svendsen: Investment Booms in anOil Economy - The Norwegian Case.
No.30 A. Rygh Swensen: Estimating Change in a Proportion byCombining Measurements from a True and a Fallible Classifier.
No.31 J.K. Dagsvik: The Continuous Generalized Extreme Value Modelwith Special Reference to Static Models of Labor Supply.
No.32 K. Berger, M. Hoel, S. Holden and Ø. Olsen: The Oil Market asan Oligopoly.
No.33 I.A.K. Anderson, J.K. Dagsvik, S. Strom and T. Wennemo: Non-Convex Budget Set, Hours Restrictions and Labor Supply in Swe-den.
No.34 E. Holmoy and O. Olsen: A Note on Myopic Decision Rules in theNeoclassical Theory of Producer Behaviour, 1988.
No.35 E. Biørn and H. Olsen: Production - Demand Adjustment in-Norwegian Manufacturing: A Quarterly Error Correction Model,
1988.
No.36 J. K. Dagsvik and S. Strom: A Labor Supply Model for MarriedCouples with Non-Convex Budget Sets and Latent Rationing,1988.
No.37 T. Skoglund and A. Stokka: Problems of Linking Single-Regionand Multiregional Economic Models, 1988.
106

No.38 T. J. Klette: The Norwegian Aluminium industry, Electricityprices and Welfare,1988
No.39 I. Aslaksen, O. Bjerkholt and K. A. Brekke: Optimal Sequencingof Hydroelectric and Thermal Power Generation under EnergyPrice Uncertainty and Demand Fluctuations, 1988.
No.40 0. Bjerkholt and K.A. Brekke: Optimal Starting and StoppingRules for Resource Depletion when Price is Exogenous andStochastic, 1988.
No.41 J. Aasness, E. Biørn and T. Skjerpen: Engel Functions, PanelData and Latent Variables, 1988.
No.42 R. Aaberge, O. Kravdal and T. Wennemo: Unobserved Hetero-geneity in Models of Marriage Dissolution, 1989.
No.43 K. A. Mork, H. T. Mysen and O. Olsen: Business Cycles and OilPrice Fluctuations: Some evidence for six OECD countries.1989.
No.44 B. Bye, T. Bye and L. Lorentsen: SIMEN. Studies of Industry,Environment and Energy towards 2000, 1989.
197 •