© 2014 gartner, inc. and/or its affiliates. all rights reserved. gartner is a registered trademark...
TRANSCRIPT

© 2014 Gartner, Inc. and/or its affiliates. All rights reserved. Gartner is a registered trademark of Gartner, Inc. or its affiliates. This publication may not be reproduced or distributed in any form without Gartner's prior written permission. If you are authorized to access this publication, your use of it is subject to the Usage Guidelines for Gartner Services posted on gartner.com. The information contained in this publication has been obtained from sources believed to be reliable. Gartner disclaims all warranties as to the accuracy, completeness or adequacy of such information and shall have no liability for errors, omissions or inadequacies in such information. This publication consists of the opinions of Gartner's research organization and should not be construed as statements of fact. The opinions expressed herein are subject to change without notice. Although Gartner research may include a discussion of related legal issues, Gartner does not provide legal advice or services and its research should not be construed or used as such. Gartner is a public company, and its shareholders may include firms and funds that have financial interests in entities covered in Gartner research. Gartner's Board of Directors may include senior managers of these firms or funds. Gartner research is produced independently by its research organization without input or influence from these firms, funds or their managers. For further information on the independence and integrity of Gartner research, see "Guiding Principles on Independence and Objectivity."
George Ambler
Spend Less on IT, Drive More Value: How Best-in-Class Organisations Do It

© 2014 Gartner, Inc. and/or its affiliates. All rights reserved.
How Do Your Clients Perceive IT?
ERP
Cloud
Digital
Our Perception of IT Their Perception of IT
Do We Run IT Like a Business?
© 2014 Gartner, Inc. and/or its affiliates. All rights reserved.
Key Issues
1. What is the best way to approach IT cost optimization?
2. How to manage IT cost optimization using Gartner’s four phase process
3. How can a broader approach to IT optimization deliver breakthroughs that increase IT's contribution to business success?

© 2014 Gartner, Inc. and/or its affiliates. All rights reserved.
Leading Practice: Treat IT Cost Optimization As An On-going IT Discipline
Successful IT cost optimization programs have common characteristics that deliver sustained results as compared to typical cost cutting programs
Characteristics of IT Cost Optimization Programs
1. Have a clear definition of short- and long-term success
2. Operate from a basis of fact rather than speculation
3. Look at the Demand side of IT as well as Supply side
4. Prioritize cost savings opportunities taking into account risk to implement in addition to financial payback
5. Align IT Cost Optimization management disciplines with business alignment objectives
6. Focus on successful execution, including a program in place for benefits realization to hold people accountable through measured performance
7. Use working capital from IT savings to self-fund improvements towards business
Our services constantly evolve
with clients' changing needs, but our focus on results never changes
Evaluate
Strategize
Execute
Optimize
ManageStrategize

© 2014 Gartner, Inc. and/or its affiliates. All rights reserved.
Gartner Framework for IT Cost Reduction
IT ProcurementGet the best pricing and terms for your IT purchases
Cost Savings Within ITIdentify opportunities to reduce IT costs
Joint Business and IT Cost SavingsImplement cost-saving technologies with the business
Business Restructuring and InnovationProcess improvement, reorganization, new methods
Different types of cost optimization involve different parts of the organization and varying IT department decision rights
Difficulty Value

© 2014 Gartner, Inc. and/or its affiliates. All rights reserved.
Key Issues
1. What is the best way to approach IT cost optimization?
2. How to manage IT cost optimization using Gartner’s four phase process
3. How can a broader approach to IT optimization deliver breakthroughs that increase IT's contribution to business success?

© 2014 Gartner, Inc. and/or its affiliates. All rights reserved.
Manage IT Cost Optimization Effectively Using Gartner's Four Phase Process
Create Detailed Road Map
Phase 1: EstablishBaseline
Phase 3: Develop Capture Strategy
Phase 2: Identify Opportunities
Create Benefits Dashboards to Measure and Monitor
Set Measurable Targets
Phase 4: Realize Benefits
Evaluate Risk vs. RewardPrepare Org. Change Program
0
100
200
300
400
500
600
700
800
900
Productivity trend & Defect rate influence
productivity trend
defect rate trend
Linear (productivity trend)
Poly. (defect rate trend)
0%
5%
10%
15%
20%
25%
30%
35%
40%
Requ Design CUT SYS Test UAT
Barclays
Gartner Peer
0%5%
10%15%20%25%30%35%40%
Development Activity Distribution
UKL
Avg
0%
5%
10%
15%
20%
25%
30%
35%
40%
PM Req & Des CUT Tes & DR Imp QM Oth
Barclays
Gartner Peer
xyz trend
Stand Up ITCO Program Office
For internal use of BPL only. © 2003 Gartner, Inc. All Rights Reserved.
Page 30
Engagement: 220447480—July 2003
consulting
July DATE DATE DATE
Business Benefit Risk
1. Benefit Specification
2. Benefit Measurement
3. Value Management
4. Ongoing Cost Planning
5. Ongoing Cost Management
6. Gap Management
7. Project Prioritization
8. Complexity Control
Budget & Schedule Risk
9. Estimation Quality
10. Contractual
11. Project Management
12. Project Resources
13. Budget Management
14. Scope Management
Initial Project Risk Observations
High Risk Medium Risk Low Risk
Business Case needs to be reviewed and updated so that measurable progress can be quantified and reported.
Comments
Project Scorecard
It is unclear how the resources from all parties are going to be utilized/coordinated, and when the project mgmt. controls are going to be implemented. For internal use of BPL only.
© 2003 Gartner, Inc. All Rights Reserved.
Page 30
Engagement: 220447480—July 2003
consulting
July DATE DATE DATE
Business Benefit Risk
1. Benefit Specification
2. Benefit Measurement
3. Value Management
4. Ongoing Cost Planning
5. Ongoing Cost Management
6. Gap Management
7. Project Prioritization
8. Complexity Control
Budget & Schedule Risk
9. Estimation Quality
10. Contractual
11. Project Management
12. Project Resources
13. Budget Management
14. Scope Management
Initial Project Risk Observations
High Risk Medium Risk Low Risk
Business Case needs to be reviewed and updated so that measurable progress can be quantified and reported.
Comments
Project Scorecard
It is unclear how the resources from all parties are going to be utilized/coordinated, and when the project mgmt. controls are going to be implemented.
Create the IT Base Case
Capture Total IT Cost
Establish Cost and Performance Baseline Relative
to Peers
Analyze Improvement Options
Identify Viable Alternatives Feasibility Planning

© 2014 Gartner, Inc. and/or its affiliates. All rights reserved.
1. Establish a Baseline
IT Spending % of Operational Expenses 4.4% 4.3%IT Spending % of Revenue 3.5% 3.3%IT Spending per Employee $12,696 $13,100IT Employees % of Total Employees 5.3%* 5.0%*
20142013Cross Industry Averages
Run 67%
Grow 20%
Transform13%
Contractors20%
In-house80%
IT Capex 29%IT Opex 71%
Hardware 16%Software 20%Personnel 41%Outsourcing 23%
Apps Dev. 18%Apps Support 16%Data Center 23%End User 11%Data Network 9%Service Desk 7%Voice Network 6%IT Mgmt. 6%Fin. and Admin. 4%
Gartner IT Key Metrics Database, 2014 *2012/2013 Figures for IT Employees

© 2014 Gartner, Inc. and/or its affiliates. All rights reserved.
Start With a Follow-the-money Approach to IT Cost Optimization
23%
18%
16%
11%
9%
6%
7%
6%4%
Data Center
App Development
App Support
End-user Computing
Data Networking
Voice Networking
Service Desk
IT Management
Finance and Administration

© 2014 Gartner, Inc. and/or its affiliates. All rights reserved.
Cost Optimization Opportunities Remain in Every Area of IT
Differences Between Average and Best Performers
Overall IT Spend 38% difference in cost
Application Development 53% difference in cost per function point
Application Support 55% difference in cost per function point
Mainframe 35% difference in cost per installed MIPS
Unix Server 62% difference in cost per server
Wintel Server 32% difference in cost per server
Storage 44% difference in cost per TB
Desktop 22% difference in cost per device
Help Desk 33% difference in cost per handled contact
Wide-area Data Network 43% difference in cost per device
Local-area Network 51% difference in cost per active port
Wide-area Voice Network 27% difference in cost per minute
Voice Premise Technologies 34% difference in cost per active extension

© 2014 Gartner, Inc. and/or its affiliates. All rights reserved.
2. Identify Opportunities and Assess Viability
For each opportunity generated: • What's the upside?
• Is it worth the effort?
Small Medium Large
>18 months 6 to 18 months <6 months
High; impacts OS, DB, middleware, and applications
Moderate; impacts few components
of the architecture
Low; little more than "moving
boxes"
High; staff redundancies,
and re-engineering of processes and
structures
Moderate; limited changes in roles, structures, and
processes
Low; no staff reduction, nor
changes in organization and
processes
High Moderate Low/None
Negative None Positive
Potential Benefit:• How big is the saving if the action is implemented and
how does it affect cash flow?
Time Requirement:• Can you capture the savings in this fiscal year?
Degree of IT Technical Risk:• Is there a risk that the change will undermine the ability
of your systems to deliver?
Degree of Organizational Risk:• Will your leaders ensure the changes are made?
Is your organization capable of adapting to the changes?
Investment Requirement:• Does the change require a large upfront investment
before savings can be captured? Is the organization willing to make an investment at all?
Business Impact:• What impact will this have on the business?
Benefits
Costs, Time, and
Risks
?

© 2014 Gartner, Inc. and/or its affiliates. All rights reserved.
3. Develop Strategy and Ready Change Program
Imp
lem
enta
tio
n R
isk/
Tim
e
Benefits/Cost Savings
Reform IT Governance and Demand Management
$5.7M
Outsource Application Development and Support
$8.0MOptimize
Infrastructure Service Delivery
$2.0M Recompete Data and Voice Networks
$1.5M Improve ILM and Data
$8.0M
Application Portfolio
Optimization
$10.5M
Improve Application Delivery
Is the risk worth the reward?
Opportunities likely taken as natural part
of business
$1.5M
Optimize End-User Support
$6.0M
ILM = Information life cycle management

© 2014 Gartner, Inc. and/or its affiliates. All rights reserved.
4. Track Benefits
UnanticipatedBusiness Changes
Complex Technical Solution
Lack of Org. Change Mgmt.
Poor Estimation(Benefit Size, Investment)
Increase Virtual-ization
Mature S/W Asset
Mgmt. Practices
Large Program Benefits Predicted
Mature Key ITIL
Processes
Re-negotiate
S/W
RationalizeApplications
Deploy Info. Life
Cycle Mgmt.
Often Smaller-Than-Predicted Program Benefits Realized

© 2014 Gartner, Inc. and/or its affiliates. All rights reserved.
Key Issues
1. Which IT cost optimization techniques will be most effective going forward?
2. How can IT executives break throughcost-cutting barriers and optimize business performance?
3. How can a broader approach to IT optimization deliver breakthroughs that increase IT's contribution to business success?

© 2014 Gartner, Inc. and/or its affiliates. All rights reserved.
Traditional IT Cost Cutting Provides Limited Value in an Increasingly Digital World
Source of IT Budget Data: "IT Key Metrics Data 2014: Executive Summary" (G00258818)
IT Cost4.3% of
Enterprise Costs (Opex*)All Other
Business Costs
*Industry Average 4.3%
Government 9.1%
Banking 8.0%
Healthcare 4.3%
Utilities 3.6%
Transportation 3.1%
Manufacturing 1.8%
Retail 1.8%

© 2014 Gartner, Inc. and/or its affiliates. All rights reserved.
Change the Approach to Deliver ITO360
Traditional View• Cost cutting• Looking at constrained
opportunities within IT• IT supports the
enterprise• Cost accountability
stays in IT• Single view of the
IT budget(General leader view)
• "Good enough" cost transparency
ITO360 View• Value adding• Looking at multiple
opportunities outside IT• IT is a key partner• Cost accountability
passes to the business• Multiple views of the
IT budget• World-class cost and
value transparency

© 2014 Gartner, Inc. and/or its affiliates. All rights reserved.
Work Smarter: Change IT's Role Through ITO360 Approach
OptimizeIT
Optimize Business
Processes
Optimize Information
Delivery
Optimize Business
ModelIncreasing IT Engagement and Skills
Technology Innovator
Information Architect
Process Designer
IT Technician
© 2014 Gartner, Inc. and/or its affiliates. All rights reserved.
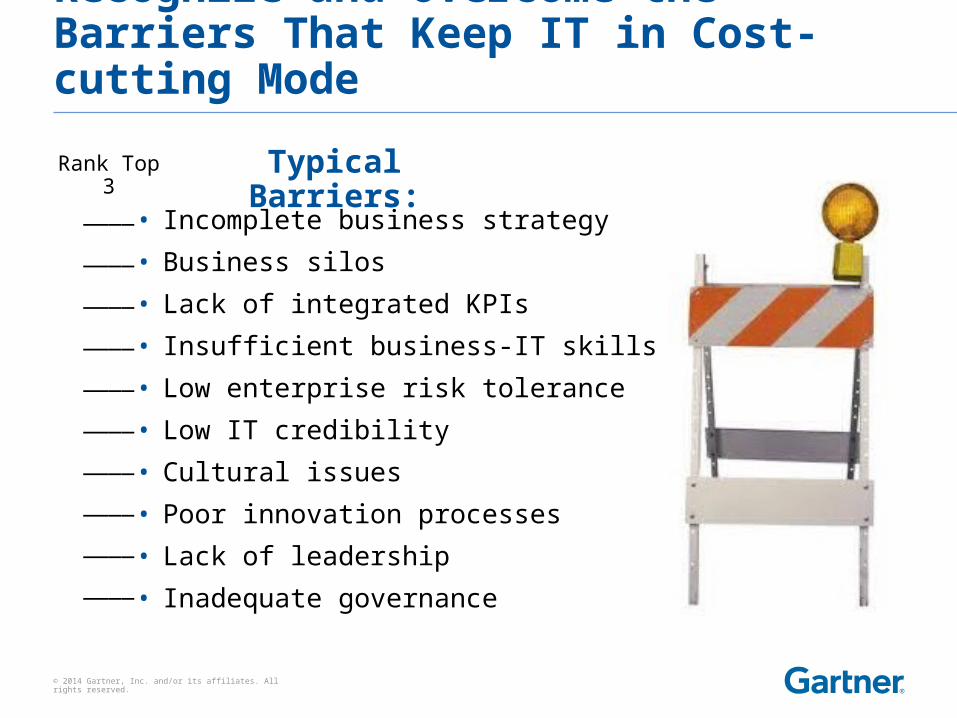
Recognize and Overcome the Barriers That Keep IT in Cost-cutting Mode
• Incomplete business strategy
• Business silos
• Lack of integrated KPIs
• Insufficient business-IT skills
• Low enterprise risk tolerance
• Low IT credibility
• Cultural issues
• Poor innovation processes
• Lack of leadership
• Inadequate governance
Typical Barriers:Rank Top 3
____
____
____
____
____
____
____
____
____
____

© 2014 Gartner, Inc. and/or its affiliates. All rights reserved.
Recommendations Be proactive when managing IT cost optimization. Create a cost optimization team. Get the team to leverage the four steps to build a solid IT
cost optimization program Break out of cost-cutting mode by taking transformation
actions to position IT and the enterprise IT for success. Build a skilled business and IT workforce focused on
enterprise optimization. Forge partnerships with business stakeholders and
develop the vision for what ITO360 looks like in your enterprise.
© 2014 Gartner, Inc. and/or its affiliates. All rights reserved.
Recommended Gartner Research
Predicts 2014: Taking a 360-Degree View of IT Optimization Will Deliver Increased Value
John Roberts and Barbara Gomolski (G00258191)
ITO360: Break Through IT Cost-Cutting Barriers to Optimize Business Performance
John Roberts and others (G00262676)
How to Manage the IT Budget Wisely Through Cost and Value Optimization
Barbara Gomolski and John Roberts (G00263355)For more information, stop by Gartner Research Zone.
© 2014 Gartner, Inc. and/or its affiliates. All rights reserved. Gartner is a registered trademark of Gartner, Inc. or its affiliates. This publication may not be reproduced or distributed in any form without Gartner's prior written permission. If you are authorized to access this publication, your use of it is subject to the Usage Guidelines for Gartner Services posted on gartner.com. The information contained in this publication has been obtained from sources believed to be reliable. Gartner disclaims all warranties as to the accuracy, completeness or adequacy of such information and shall have no liability for errors, omissions or inadequacies in such information. This publication consists of the opinions of Gartner's research organization and should not be construed as statements of fact. The opinions expressed herein are subject to change without notice. Although Gartner research may include a discussion of related legal issues, Gartner does not provide legal advice or services and its research should not be construed or used as such. Gartner is a public company, and its shareholders may include firms and funds that have financial interests in entities covered in Gartner research. Gartner's Board of Directors may include senior managers of these firms or funds. Gartner research is produced independently by its research organization without input or influence from these firms, funds or their managers. For further information on the independence and integrity of Gartner research, see "Guiding Principles on Independence and Objectivity."
George Ambler
Spend Less on IT, Drive More Value: How Best-in-Class Organisations Do It