© 2005, itron inc. california commercial end-use survey results presenter: bob ramirez itron, inc....
TRANSCRIPT

© 2005, Itron Inc.
California Commercial End-Use Survey Results
Presenter: Bob RamirezItron, Inc.
Mark CiminelliCEC Project Manager
MAESTRO/CALMAC Evaluation ShowcasePacific Energy Center July 27, 2006

© 2006, Itron Inc. 2
Presentation Overview
Objective: Present an overview of the CEUS project and the CEUS report results, and provide an informational “CEUS-in-a-(large)-nutshell” project summary packet.
Overview of the CEUS Project and DrCEUS System Primary CEUS Concepts and Definitions CEUS Report Results Availability of Report and Data Questions and Additional Work\Data Requests

© 2006, Itron Inc. 3
Overview ofthe CEUS Project
andDrCEUS System

© 2006, Itron Inc. 4
CEUS Project Objectives
To characterize the way in which the commercial sector uses energy (EUIs, load profiles and saturations)
To support the end-use forecasting process (baseline values)
To support the assessment of energy efficiency opportunities in the commercial sector (measure saturations, applicability factors, impacts)
To provide a tool that can be used by the CEC for tailored analysis of commercial energy usage as well as other custom/as-needed data requests

© 2006, Itron Inc. 5
Unique California CEUS Attributes
Common Baseline The CEUS study encompasses all four IOUs plus SMUD and provides a common baseline that allows “apples-to-apples” comparison of energy use across the state.
Flexible CEUS “System” not Just Data An interface for reviewing and aggregating the site-level results was a primary deliverable, to allow custom aggregation of CEUS data. This is the “DrCEUS System”.
Normal Weather Development Normal weather data for 20 weather stations was developed for the CEUS project, which also captured both hot and cold average extremes.
Model Visualization Survey form incorporates building geometry aspects that can be used to visually validate the building simulation model construction via eQUEST 3D-view capability.

© 2006, Itron Inc. 6
Key CEUS Stats
The final dataset contains 2790 premises:> PG&E: 1001 premises
> SMUD: 300 premises
> SCE: 1144 premises
> SDG&E: 345 premises 12 Building Types/Segments 13 End Uses (3 HVAC, 10 NonHVAC) Covers 12 Forecasting Climate Zones (FCZ); sample
design was based on FCZs. Limited coverage of all 16 Title 24 Standards Climate
Zones (within the FCZs used for CEUS) 20 Weather Stations for the CEUS simulations

© 2006, Itron Inc. 7
Brief Overview of theDrCEUS System

© 2006, Itron Inc. 8
The DrCEUS System
DrCEUS!

© 2006, Itron Inc. 9
The DrCEUS System
Building simulation uses eQUEST/DOE 2.2 Building characteristics defined through eQuest
> HVAC Zoning
> Building Components
> Variety of Wizard-defined Building Footprints MS Access or SQL Server as data storage facility
> Survey Data
> Simulation Support Data
> Weather Data
> Results Written using script for easy maintenance

© 2006, Itron Inc. 10
DrCEUS Modes of Operation
Site Processor> Premise-level simulation tool
> Both single site and batch processing capability
> Results displayed graphically
> Comparison of results
> Premise management
Segment Processor> Uses results from premise level data
> User-defined segment-level aggregation
> Segment-level results displayed graphically
> All data exportable to MS Excel workbook

© 2006, Itron Inc. 11
DrCEUS Site Selection Interface

© 2006, Itron Inc. 12
Example DrCEUS System Graphics
P010102003 – RESORT Monthly Use for Electricity
P010102003 – RESORT Monthly Use for Electricity
P010102003 – RESORT Annual Electricity Summary
P010102003 – RESORT Annual Electricity Summary

© 2006, Itron Inc. 13
Primary CEUS Concepts and Definitions

© 2006, Itron Inc. 14
Primary CEUS Concepts and Definitions
Read CEUS Report Chapter 7 Utility Service Areas Building Types/Segments 13 End Uses (3 HVAC, 10 NonHVAC) Climate/Weather Regions Premise is a single contiguous business; can be part of
a building, a single building, or a campus. EIs (Energy Intensities) use whole premise floor area End Use Indexes (EUIs) use end-use/fuel floor areas Fuel Shares

© 2006, Itron Inc. 15
Building Types/Segments 12 conventional building types were used for the CEUS Report
> Small Office (<30,000 ft2)> Large Office (>=30,000 ft2)> Restaurant> Retail> Food/Liquor> Unrefrigerated Warehouse> Refrigerated Warehouse> School> College> Health Care> Hotel/Motel> Miscellaneous
However DrCEUS can be used to create custom building type segments to focus in on specific building types using any set of premises, and using any of the variables available on the CEUS data set as criteria.

© 2006, Itron Inc. 16
13 CEUS End Uses
3 HVAC End Uses> Space Heating
> Space Cooling
> Ventilation
10 Non-HVAC End Uses> Water Heating Office Equipment
> Cooking Miscellaneous Equipment
> Refrigeration Air Compressors
> Interior Lighting Motors (non-HVAC)
> Exterior Lighting Process Equipment

© 2006, Itron Inc. 17
Forecasting Climate Zones Covered by CEUS
Forecasting Climate Zones Utility
1, 2, 3, 4, 5 PG&E
6 SMUD
7, 8, 9, 10 SCE
11, 12 LADWP
13 SDG&E
14, 15 Other
16 BGP3

© 2006, Itron Inc. 18
Distribution of Surveyed Sites by FCZ
Bldg TypeCode
DescriptionPGE
1PGE
2PGE
3PGE
4PGE
5SMUD
6SCE
7SCE
8SCE
9SCE10
SCGES07*
SDGES10*
SOFF Small Office (<30k ft2) 4 7 18 25 33 30 6 49 25 19 24 10
LOFF Large Office (>=30k ft2) 1 4 8 31 79 33 1 63 26 5 38 4
REST Restaurant 4 5 13 22 29 17 3 38 25 17 20 4
RETL Retail 8 8 33 45 67 63 11 96 57 54 44 11
GROC Food Store 4 3 9 19 27 13 6 40 36 15 17 10
REFW Refrigerated Warehouse 3 6 12 7 9 6 3 7 12 4 3 1
WRHS Unrefrigerated Warehouse 0 9 2 11 16 9 0 19 29 22 6 3
SCHL School 5 3 9 12 15 14 5 14 19 10 13 6
COLL College 2 4 4 7 11 7 2 9 10 4 4 2
HLTH Health 4 4 10 14 23 19 5 28 23 13 18 5
LODG Lodging 3 2 5 14 22 10 3 19 10 14 23 4
MISC Miscellaneous 14 22 61 66 84 79 16 100 79 73 52 23
* S07 and S10 are SDG&E FCZ13 Coastal and Interior strata

© 2006, Itron Inc. 19
Standards Climate Zone and CEUS Weather Stations
20 Weather Stations were used for the CEUS project (represented by the blue dots in the figure to the left). There are multiple weather stations for Title 24 Climate Zones 3 (split into 3A/3B/3C), 10 (split into 10A/10B), and 16 (split into 16A/16B). Premises were assigned to these weather stations based on zip code.

© 2006, Itron Inc. 20
Distribution of Surveyed Sites by T24StdsCZ (CTZ)
Bldg TypeCode
Description 01 02 03 04 05 06 07 08 09 10 11 12 13 14 15 16
SOFF Small Office (<30k ft2) 0 8 25 11 2 27 23 22 23 25 9 52 14 4 1 4
LOFF Large Office (>=30k ft2) 0 3 66 26 0 40 37 30 20 8 2 52 8 1 0 0
REST Restaurant 0 2 25 12 1 25 17 27 12 16 1 36 15 3 2 3
RETL Retail 1 12 53 23 6 52 42 69 29 45 12 96 35 13 9 0
GROC Food Store 0 11 26 7 1 26 14 32 18 24 3 20 12 3 0 2
REFW Refrigerated Warehouse 0 3 9 3 1 5 3 7 7 5 0 16 14 0 0 0
WRHS Unrefrigerated Warehouse 0 3 16 3 1 7 6 23 16 25 0 22 2 2 0 0
SCHL School 0 8 10 7 1 8 11 14 12 11 4 23 10 2 2 2
COLL College 1 2 11 3 1 3 4 9 6 4 1 13 5 0 0 3
HLTH Health 1 4 17 7 1 20 15 17 15 15 2 34 10 2 1 5
LODG Lodging 3 1 24 4 3 11 23 11 7 7 2 14 7 2 9 1
MISC Miscellaneous 4 22 68 29 6 54 49 73 52 63 32 125 49 16 17 10
NOTE: There are many strata with zeroes because 1) the sample did not cover all T24 climate zones, 2) all building types may not be present in all climate zones or 3) the sample was small and a building type in that climate zone strata could not be recruited for the survey.

© 2006, Itron Inc. 21
CEUS Report Overview

© 2006, Itron Inc. 22
CEUS Report Overview
CEC Report #: CEC-400-2006-005, March 2006 Key Sections of the Report (325 pg, 11Mb w/o Appdx!)
> Sample Design> Survey Design and Implementation> Electric and Natural Gas Consumption Data> Simulation Modeling Software> DrCEUS Energy Simulation and Calibration Process> Analysis of Commercial Segments-Key Concepts> Results (Statewide, Electric IOUs, and SMUD)> Summary and Recommendations> Appendices (Survey materials, simulation algorithms, SIC
code to CEUS bldg types, etc.) Affiliated Reports (Weather and Sample Design)

© 2006, Itron Inc. 23
CEUS Affiliated Reports (Weather)
Weather and Data Normalization Report Describes development of the normal weather data used for the final CEUS simulations. Issues addressed include:> Selection of specific variables used to evaluate and define
normal weather
> Choice of climate zones used to represent the various microclimates in California, and which specific weather stations to represent these climate zones, and
> The process used to convert weather conditions to “normal” values
> The range of years considered in computing normal values of weather variables

© 2006, Itron Inc. 24
CEUS Affiliated Reports (Sample Design)
Final Sample Design Development of the sample design involved the investigation of a variety of different sample design approaches. Topics covered include:> Definition of the sampling unit as a “premise”
> Description and summary of sample frames constructed from utility billing data
> Sample size, sample allocation, minimum quota issues
> Description of the various stratification approaches that were examined and considered
> Special issues (e.g. two strata for the single SDG&E Forecasting climate zone)
> Final approach used for the CEUS sample design

© 2006, Itron Inc. 25
CEUS Report Results
© 2006, Itron Inc. 26
CEUS Service Area Results
Results are available for five “service areas”> “Statewide” (see clarification below)> PG&E> SCE> SMUD> SDG&E
“Statewide” in the CEUS report refers to the combined service areas of the four electric utilities represented in the CEUS study
Results not presented for SCG because much of the SCG service area is excluded from the study (sample design based on electric service areas).

© 2006, Itron Inc. 27
CEUS Report Result Summary
Table/Figure Headings Figure (type) Table (units)
Service Area Results
Overview of Energy Usage (floor stock, Eis, usage) ft2, EI, GWh/Mth
Electricity Use by Building Type Pie-chart
Natural Gas Use by Building Type Pie-chart
Electric Use by Bldg Type and End Use kWh/yr
Electric Energy Intensities by Bldg Type and End Use kWh/ft2-yr
Natural Gas Use by Bldg Type and End Use Mth/yr
Natural Gas Energy Intensities by Bldg Type and End Use kBtu/ft2-yr
Building Segment Results
Electric EUIs, Fuel Shares, and EIs EUI, shares, EI
Natural Gas EUIs, Fuel Shares, and EIs EUI, shares, EI
16-Day Hourly End-use Load Shapes (electric-only) DrCEUS graphic

© 2006, Itron Inc. 28
Service Area Results Example:Statewide Results

© 2006, Itron Inc. 29
Statewide Overview of Energy Use
Annual Energy Intensities Total Annual Usage
Building TypeFloor Stock
(kft2)Electricity (kWh/ft2)
Natural Gas
(therms/ft2)Natural Gas
(kBtu/ft2)Electricity
(GWh)Natural Gas (Mtherms)
All Commercial 4,920,114 13.63 0.26 25.99 67077 1278.60
Small Office (<30k ft2) 361,584 13.10 0.11 10.54 4738 38.10
Large Office (>=30k ft2) 660,429 17.70 0.22 21.93 11691 144.80
Restaurant 148,892 40.20 2.10 209.98 5986 312.60
Retail 702,053 14.06 0.05 4.62 9871 32.50
Food Store 144,209 40.99 0.28 27.60 5911 39.80
Refrigerated Warehouse 95,540 20.02 0.06 5.60 1913 5.30
Unrefrigerated Warehouse 554,166 4.45 0.03 3.07 2467 17.00
School 445,106 7.46 0.16 15.97 3322 71.10
College 205,942 12.26 0.34 34.24 2524 70.50
Health 232,606 19.61 0.76 75.53 4561 175.70
Lodging 270,044 12.13 0.42 42.40 3275 114.50
Miscellaneous 1,099,544 9.84 0.23 23.34 10817 256.60
All Offices 1,022,012 16.08 0.18 17.90 16430 182.90
All Warehouses 649,706 6.74 0.03 3.44 4380 22.40

© 2006, Itron Inc. 30
Statewide: Electricity Use by Bldg Type
Small Office, 7.1%
Large Office, 17.4%
Restaurant, 8.9%
Retail, 14.7%
Refrigerated Warehouse, 2.9%
Unrefrigerated Warehouse, 3.7%
School, 5.0%
College, 3.8%
Health, 6.8%
Lodging, 4.9%Miscellaneous, 16.1%
Food Store, 8.8%

© 2006, Itron Inc. 31
Statewide Natural Gas Use by Bldg Type
Small Office, 3.0%
Large Office, 11.3% Restaurant, 24.5%
Retail, 2.5%
Refrigerated Warehouse, 0.4%
Unrefrigerated Warehouse, 1.3%
School, 5.6%
College, 5.5%Health, 13.7%Lodging, 9.0%
Miscellaneous, 20.1%
Food Store, 3.1%

© 2006, Itron Inc. 32
Statewide Electricity Use By End Use
Heating, 1.6%
Cooling, 14.9%
Ventilation, 11.9%
Refrigeration, 13.4%
Cooking, 4.2%
Interior Lighting, 28.7%
Exterior Lighting, 5.8%
Office Equipment, 7.1%
Miscellaneous, 5.8%
Process, 0.3%
Motors, 4.2%
Air Compressors, 1.0%
Water Heating, 0.9%

© 2006, Itron Inc. 33
Statewide Natural Gas Use By End Use
Heating, 36.4%
Cooling, 1.5%Water Heating,
31.8%
Cooking, 22.6%Process, 5.9%
Miscellaneous, 1.8%

© 2006, Itron Inc. 34
Statewide Electricity Use (GWh) by Bldg Type and End Use
Building Type Heat Cool Vent. Refrig. WH CookInt. Ltg.
Ext. Ltg.
Office Equip. Misc.
Air Comp. Motors Proc. Total
All Commercial 1,087 10,017 8,000 9,014 611 2,805 19,265 3,916 4782 3924 204 2811 642 67,077
Small Office 72 943 467 208 90 38 1,386 343 793 283 1 79 36 4,739
Large Office 322 2358 2,019 268 80 77 2,945 324 2365 383 18 474 60 11,691
Restaurant7 858 482 1,469 56 1,546 961 300 94 168 1 41 3 5,986
Retail55 1553 1,267 726 96 157 4,246 644 343 483 37 201 64 9,871
Food Store12 415 372 3,233 20 266 1,233 137 54 138 1 26 6 5,911
Refrigerated Warehou
se 2 31 23 1284 3 3 262 33 17 55 4 174 22 1,913
Unrefrigerated Warehou
se 20 183 156 154 26 12 1,223 145 131 215 9 162 32 2,467
School 56 520 429 225 43 78 1,281 330 206 110 1 37 7 3,322
College159 393 423 95 25 55 790 188 148 100 2 119 28 2,524
Health166 901 940 166 18 101 1,119 132 200 586 1 181 50 4,561
Lodging114 650 483 244 9 185 945 165 46 301 0 128 6 3,275
Miscellaneous104 1,212 941 942 145 287 2,874 1,175 386 1103 129 1190 330 10,817
All Offices393 3,301 2,485 476 171 115 4,331 666 3157 666 19 553 95 16,430
All Warehouses22 214 179 1,438 28 15 1,485 178 148 270 13 336 54 4,380

© 2006, Itron Inc. 35
Statewide Electric Energy Intensities (kWh/ft2-yr) by Bldg Type and End Use
Total Heat Cool Vent. Refrig. WH CookInt. Ltg.
Ext. Ltg.
Office Equip. Misc.
Air Comp. Motors Proc.
13.63 0.22 2.04 1.63 1.83 0.12 0.57 3.92 0.80 0.97 0.80 0.04 0.57 0.13
13.10 0.20 2.61 1.29 0.58 0.25 0.10 3.83 0.95 2.19 0.78 0.00 0.22 0.10
17.70 0.49 3.57 3.06 0.41 0.12 0.12 4.46 0.49 3.58 0.58 0.03 0.72 0.09
40.20 0.05 5.76 3.24 9.87 0.38 10.38 6.45 2.02 0.63 1.13 0.01 0.27 0.02
14.06 0.08 2.21 1.81 1.03 0.14 0.22 6.05 0.92 0.49 0.69 0.05 0.29 0.09
40.99 0.08 2.88 2.58 22.42 0.14 1.85 8.55 0.95 0.37 0.95 0.01 0.18 0.04
20.02 0.02 0.33 0.24 13.44 0.03 0.04 2.74 0.35 0.17 0.57 0.04 1.82 0.23
4.45 0.04 0.33 0.28 0.28 0.05 0.02 2.21 0.26 0.24 0.39 0.02 0.29 0.06
7.46 0.13 1.17 0.96 0.50 0.10 0.18 2.88 0.74 0.46 0.25 0.00 0.08 0.01
12.26 0.77 1.91 2.05 0.46 0.12 0.27 3.84 0.91 0.72 0.49 0.01 0.58 0.14
19.61 0.71 3.87 4.04 0.71 0.08 0.43 4.81 0.57 0.86 2.52 0.01 0.78 0.22
12.13 0.42 2.41 1.79 0.90 0.03 0.68 3.50 0.61 0.17 1.11 0.00 0.48 0.02
9.84 0.09 1.10 0.86 0.86 0.13 0.26 2.61 1.07 0.35 1.00 0.12 1.08 0.30
16.08 0.38 3.23 2.43 0.47 0.17 0.11 4.24 0.65 3.09 0.65 0.02 0.54 0.09
6.74 0.03 0.33 0.28 2.21 0.04 0.02 2.29 0.27 0.23 0.42 0.02 0.52 0.08

© 2006, Itron Inc. 36
Statewide Natural Gas Usage (Mtherms) by Building Type and End Use
Building Type Heat Cool WH Cook Misc. Proc. Total
All Commercial465.50 19.10 406.70 289.10 23.00 75.20 1278.60
Small Office31.20 0.00 6.00 0.50 0.10 0.40 38.10
Large Office113.70 3.60 17.20 1.50 0.70 8.10 144.80
Restaurant11.50 0.00 72.40 228.20 0.00 0.50 312.60
Retail21.20 0.00 5.50 3.60 1.90 0.30 32.50
Food Store13.70 0.00 11.00 14.90 0.00 0.10 39.80
Refrigerated Warehouse0.80 0.00 0.80 1.20 0.00 2.70 5.30
Unrefrigerated Warehouse14.80 0.00 1.80 0.10 0.20 0.10 17.00
School44.60 0.60 20.90 4.70 0.10 0.30 71.10
College40.80 7.10 17.30 3.40 1.80 0.00 70.50
Health76.10 3.60 73.00 7.80 3.40 11.80 175.70
Lodging19.70 0.20 78.20 11.90 3.90 0.70 114.50
Miscellaneous77.40 4.00 102.70 11.20 10.90 50.30 256.60
All Offices144.90 3.60 23.20 2.00 0.80 8.40 182.90
All Warehouses15.60 0.00 2.60 1.20 0.20 2.80 22.40

© 2006, Itron Inc. 37
Statewide Natural Gas Energy Intensities (kBtu/ft2-yr) by Bldg Type and End Use
Building Type Total Heat Cool WH Cook Misc. Proc.
All Commercial26.00 9.50 0.40 8.30 5.90 0.50 1.50
Small Office10.50 8.60 0.00 1.70 0.10 0.00 0.10
Large Office21.90 17.20 0.50 2.60 0.20 0.10 1.20
Restaurant210.00 7.70 0.00 48.60 153.30 0.00 0.30
Retail4.60 3.00 0.00 0.80 0.50 0.30 0.00
Food Store27.60 9.50 0.00 7.70 10.30 0.00 0.10
Refrigerated Warehouse5.60 0.80 0.00 0.80 1.20 0.00 2.80
Unrefrigerated Warehouse3.10 2.70 0.00 0.30 0.00 0.00 0.00
School16.00 10.00 0.10 4.70 1.10 0.00 0.10
College34.20 19.80 3.50 8.40 1.70 0.90 0.00
Health75.50 32.70 1.60 31.40 3.40 1.40 5.10
Lodging42.40 7.30 0.10 29.00 4.40 1.40 0.30
Miscellaneous23.30 7.00 0.40 9.30 1.00 1.00 4.60
All Offices17.90 14.20 0.40 2.30 0.20 0.10 0.80
All Warehouses3.40 2.40 0.00 0.40 0.20 0.00 0.40

© 2006, Itron Inc. 38
Building Segment Results Example:Statewide, All Commercial

© 2006, Itron Inc. 39
Building Segment Results
Electric and natural gas EIs, EUIs, and Fuel Shares are presented for:> 12 building types previously defined plus
> 3 additional segments: All Commercial, All Offices, and All Warehouses
Only the results for the All Commercial segment are presented here as an example.

© 2006, Itron Inc. 40
Statewide Commercial Electric EUIs, Fuel Shares, and EIs
End UseElectric EUI
(kWh/End-Use ft2)Electric Fuel
ShareElectric EI(kWh/ft2)
Heating 0.53 41.40 0.22
Cooling 2.97 68.60 2.04
Ventilation 2.16 75.10 1.63
Water Heating 0.27 45.70 0.12
Cooking 0.62 91.50 0.57
Refrigeration 1.94 94.40 1.83
Interior Lighting 3.92 99.90 3.92
Office Equipment 0.99 98.40 0.97
Exterior Lighting 0.89 89.60 0.80
Miscellaneous 0.87 91.30 0.80
Process 1.91 2.20 0.04
Motors 0.99 57.70 0.57
Air Compressors 0.36 36.60 0.13
All End Uses13.63

© 2006, Itron Inc. 41
Statewide Commercial Natural Gas EUIs, Fuel Shares, and EIs
End UseNatural Gas EUI
(kBtu/End-Use ft2)Natural GasFuel Share
Natural Gas EI
(kBtu/ft2)
Heating 16.91 55.90 9.46
Cooling 25.68 1.50 0.39
Water Heating 14.47 57.10 8.27
Cooking 20.66 28.40 5.88
Miscellaneous 4.36 10.70 0.47
Process 46.92 3.30 1.53
All End Uses 26.00

© 2006, Itron Inc. 42
Statewide Commercial 16-Day Hourly End-Use Shapes

© 2006, Itron Inc. 43
PG&E Results Summary

© 2006, Itron Inc. 44
PG&E Overview of Energy Use
Annual Energy Intensities Total Annual Usage
Building Type Floor Stock (kft2)Electricity
(kWh/ft2)Natural Gas
(therms/ft2)Natural Gas
(kBtu/ft2)Electricity
(GWh)Natural Gas
(Mtherms)
All Commercial 1,969,884 12.95 0.29 28.67 25,506 564.80
Small Office (<30k ft2) 125,802 13.49 0.18 18.02 1,697 22.70
Large Office (>=30k ft2) 300,528 16.77 0.24 23.94 5,039 71.90
Restaurant 65,534 33.12 1.84 183.53 2,170 120.30
Retail 275,427 12.19 0.07 7.31 3,357 20.10
Food Store 55,797 40.54 0.34 34.46 2,262 19.20
Refrigerated Warehouse 60,854 18.5 0.05 4.5 1,126 2.70
Unrefrigerated Warehouse
156,643 4.87 0.05 4.88 763 7.60
School 193,432 6.82 0.22 21.75 1,319 42.10
College 80,661 11.94 0.37 37.46 963 30.20
Health 79,803 18.51 0.92 91.65 1,477 73.10
Lodging 113,929 9.78 0.38 38.14 1,115 43.50
Miscellaneous 461,474 9.14 0.24 24.11 4,219 111.30
All Offices 426,330 15.8 0.22 22.19 6,736 94.60
All Warehouses 217,497 8.68 0.05 4.77 1,889 10.40

© 2006, Itron Inc. 45
PG&E Energy Use by Building Type
Small Office, 6.7%
Large Office, 19.8%
Restaurant, 8.5%
Retail, 13.2%
Refrigerated Warehouse, 4.4%
Unrefrigerated Warehouse, 3.0%
School, 5.2%
College, 3.8%
Health, 5.8%
Lodging, 4.4%Miscellaneous, 16.5%
Food Store, 8.9%
Small Office, 4.0%
Large Office, 12.7%
Restaurant, 21.3%Retail, 3.6%
Refrigerated Warehouse, 0.5%
Unrefrigerated Warehouse, 1.3%
School, 7.5%
College, 5.3%
Health, 12.9%Lodging, 7.7%
Miscellaneous, 19.7%
Food Store, 3.4%
Electricity
NaturalGas

© 2006, Itron Inc. 46
Heating, 44.0%
Cooling, 0.7%
Water Heating, 29.5%
Cooking, 19.8%Process, 5.2%
Miscellaneous, 0.8%
Heating, 1.8%
Cooling, 12.4%
Ventilation, 12.4%Refrigeration, 14.8%
Cooking, 4.6%
Interior Lighting, 28.9%
Exterior Lighting, 5.2%
Office Equipment, 8.2%
Miscellaneous, 5.9%
Process, 0.3%
Motors, 3.8%
Air Compressors, 0.9%
Water Heating, 0.8%
PG&E Energy Use by End Use
Electricity
NaturalGas

© 2006, Itron Inc. 47
SMUD Results Summary
© 2006, Itron Inc. 48
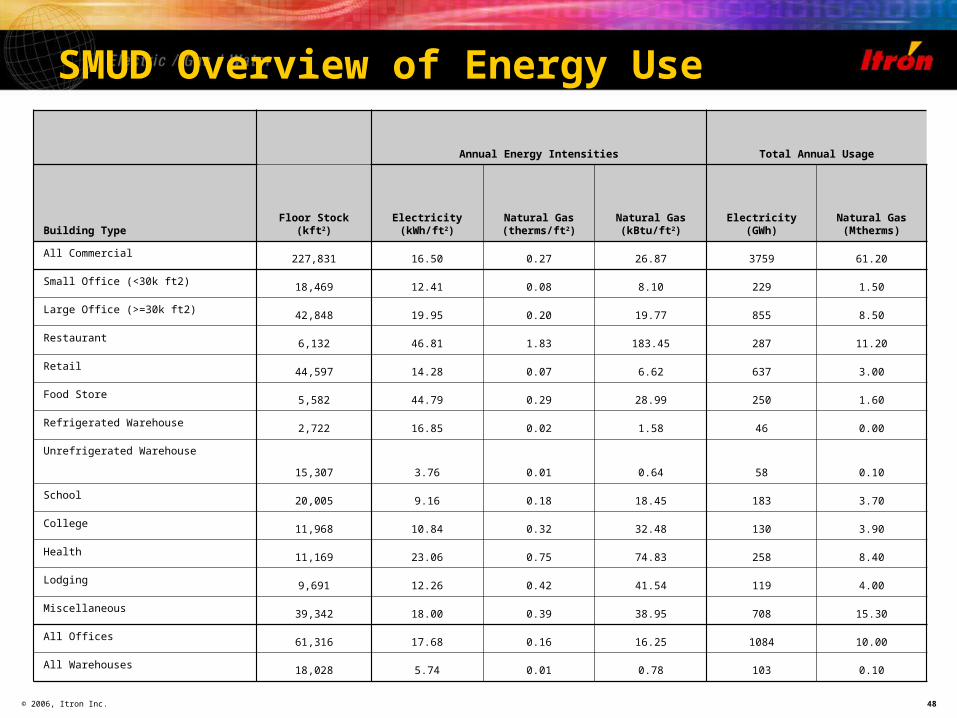
SMUD Overview of Energy Use
Annual Energy Intensities Total Annual Usage
Building Type Floor Stock (kft2)Electricity (kWh/ft2)
Natural Gas (therms/ft2)
Natural Gas (kBtu/ft2)
Electricity(GWh)
Natural Gas (Mtherms)
All Commercial 227,831 16.50 0.27 26.87 3759 61.20
Small Office (<30k ft2) 18,469 12.41 0.08 8.10 229 1.50
Large Office (>=30k ft2) 42,848 19.95 0.20 19.77 855 8.50
Restaurant 6,132 46.81 1.83 183.45 287 11.20
Retail 44,597 14.28 0.07 6.62 637 3.00
Food Store 5,582 44.79 0.29 28.99 250 1.60
Refrigerated Warehouse 2,722 16.85 0.02 1.58 46 0.00
Unrefrigerated Warehouse
15,307 3.76 0.01 0.64 58 0.10
School 20,005 9.16 0.18 18.45 183 3.70
College 11,968 10.84 0.32 32.48 130 3.90
Health 11,169 23.06 0.75 74.83 258 8.40
Lodging 9,691 12.26 0.42 41.54 119 4.00
Miscellaneous 39,342 18.00 0.39 38.95 708 15.30
All Offices 61,316 17.68 0.16 16.25 1084 10.00
All Warehouses 18,028 5.74 0.01 0.78 103 0.10

© 2006, Itron Inc. 49
Small Office, 2.5%
Large Office, 13.9%
Restaurant, 18.3%
Retail, 4.9%
Refrigerated Warehouse, 0.0%
Unrefrigerated Warehouse, 0.2%
School, 6.0%
College, 6.4%
Health, 13.7%Lodging, 6.5%
Miscellaneous, 25.0%
Food Store, 2.6%
Small Office, 6.1%
Large Office, 22.7%
Restaurant, 7.6%Retail, 16.9%
Refrigerated Warehouse, 1.2%
Unrefrigerated Warehouse, 1.5%
School, 4.9%
College, 3.5%
Health, 6.9%
Lodging, 3.2%
Miscellaneous, 18.8%
Food Store, 6.6%
SMUD Energy Use by Building Type
Electricity
NaturalGas

© 2006, Itron Inc. 50
Heating, 44.3%
Cooling, 0.0%
Water Heating, 30.7%
Cooking, 17.8%Process, 4.4%
Miscellaneous, 2.8%
Heating, 3.2%
Cooling, 14.5%
Ventilation, 14.1%
Refrigeration, 10.6%
Cooking, 3.5%
Interior Lighting, 26.2%
Exterior Lighting, 6.2%
Office Equipment, 9.4%
Miscellaneous, 6.4%
Process, 0.3%
Motors, 3.7%
Air Compressors, 0.8%
Water Heating, 1.1%
SMUD Energy Use by End Use
Electricity
NaturalGas

© 2006, Itron Inc. 51
SCE Results Summary

© 2006, Itron Inc. 52
SCE Overview of Energy Use
Annual Energy Intensities Total Annual Usage
Building Type Floor Stock (kft2)Electricity (kWh/ft2)
Natural Gas (therms/ft2)
Natural Gas (kBtu/ft2)
Electricity(GWh)
Natural Gas (Mtherms)
All Commercial 2,142,359 13.69 0.23 23.30 29,321 499.20
Small Office (<30k ft2) 157,884 13.25 0.08 8.05 2,091 12.70
Large Office (>=30k ft2) 227,225 17.91 0.13 12.98 4,071 29.50
Restaurant 61,623 46.19 2.49 249.14 2,846 153.50
Retail 309,601 15.36 0.02 2.46 4,755 7.60
Food Store 63,820 41.71 0.22 21.81 2,662 13.90
Refrigerated Warehouse 30,031 22.41 0.08 8.08 673 2.40
Unrefrigerated Warehouse
353,765 4.29 0.02 2.46 1,517 8.70
School 176,999 8.22 0.12 12.13 1,454 21.50
College 64,809 13.62 0.24 24.01 883 15.60
Health 106,471 20.30 0.68 68.32 2,161 72.70
Lodging 112,405 13.28 0.41 40.95 1,493 46.00
Miscellaneous 477,725 9.87 0.24 24.07 4,714 115.00
All Offices 385,110 16.00 0.11 10.96 6,162 42.20
All Warehouses 383,796 5.71 0.03 2.90 2,190 11.10

© 2006, Itron Inc. 53
Small Office, 2.5%
Large Office, 5.9%
Restaurant, 30.8% Retail, 1.5%
Refrigerated Warehouse, 0.5%
Unrefrigerated Warehouse, 1.7%
School, 4.3%
College, 3.1%
Health, 14.6%Lodging, 9.2%
Miscellaneous, 23.1%
Food Store, 2.8%
Small Office, 7.1%
Large Office, 13.9%
Restaurant, 9.7%
Retail, 16.2%
Refrigerated Warehouse, 2.3%
Unrefrigerated Warehouse, 5.2%
School, 4.9%
College, 3.0%
Health, 7.4%
Lodging, 5.1%Miscellaneous,
16.1%
Food Store, 9.1%
SCE Energy Use by Building Type
Electricity
NaturalGas

© 2006, Itron Inc. 54
Heating, 29.3%
Cooling, 5.0%Water Heating,
33.6%
Cooking, 21.7%Process, 7.7%
Miscellaneous, 2.8%
Cooling, 16.3%
Ventilation, 11.6%
Refrigeration, 12.2%
Cooking, 3.6%
Interior Lighting, 28.4%Exterior Lighting,
6.0%
Office Equipment, 7.2%
Miscellaneous, 5.4%
Process, 0.1%
Motors, 5.4%
Heating, 1.8%Air Compressors,
0.9% Water Heating, 1.1%
SCE Energy Use by End Use
Electricity
NaturalGas

© 2006, Itron Inc. 55
SDG&E Results Summary

© 2006, Itron Inc. 56
SDG&E Overview of Energy Use
Annual Energy Intensities Total Annual Usage
Building Type Floor Stock (kft2)Electricity (kWh/ft2)
Natural Gas (therms/ft2)
Natural Gas (kBtu/ft2)
Electricity(GWh)
Natural Gas (Mtherms)
All Commercial 580,041 14.64 0.26 26.45 8,491 153.40
Small Office (<30k ft2) 59,429 12.13 0.02 2.07 721 1.20
Large Office (>=30k ft2) 89,827 19.23 0.39 38.86 1,727 34.90
Restaurant 15,604 43.73 1.77 176.82 682 27.60
Retail 72,428 15.49 0.02 2.44 1,122 1.80
Food Store 19,010 38.79 0.27 26.53 737 5.00
Refrigerated Warehouse 1,933 35.31 0.07 7.12 68 0.10
Unrefrigerated Warehouse
28,451 4.54 0.02 2.08 129 0.60
School 54,671 6.69 0.07 7.03 366 3.80
College 48,504 11.32 0.43 42.97 549 20.80
Health 35,163 18.92 0.61 61.02 665 21.50
Lodging 34,019 16.10 0.62 61.75 548 21.00
Miscellaneous 121,002 9.72 0.12 12.41 1,176 15.00
All Offices 149,257 16.40 0.24 24.21 2,448 36.10
All Warehouses 30,384 6.50 0.02 2.40 197 0.70

© 2006, Itron Inc. 57
Small Office, 0.8%
Large Office, 22.8%Restaurant, 18.0%
College, 13.6%
Health, 14.0%Lodging, 13.7%
Miscellaneous, 9.8%
Refrigerated Warehouse, 0.1%
Unrefrigerated Warehouse, 0.4%
School, 2.5%
Retail, 1.2%
Food Store, 3.3%
Small Office, 8.5%
Large Office, 20.3%
Restaurant, 8.0%Retail, 13.2%
Refrigerated Warehouse, 0.8%
Unrefrigerated Warehouse, 1.5%
School, 4.3%
College, 6.5%
Health, 7.8%
Lodging, 6.5%Miscellaneous, 13.9%
Food Store, 8.7%
SDG&E Energy Use by Building Type
Electricity
NaturalGas

© 2006, Itron Inc. 58
Heating, 29.9%
Cooling, 5.5% Water Heating, 32.4%
Cooking, 21.1%Process, 8.4%
Miscellaneous, 2.6%
Heating, 1.9%
Cooling, 16.3%
Ventilation, 11.4%
Refrigeration, 12.3%
Cooking, 3.6%
Interior Lighting, 28.4%
Exterior Lighting, 6.1%
Office Equipment, 7.0%
Miscellaneous, 5.3%
Process, 0.1%
Motors, 5.6%
Air Compressors, 0.9%
Water Heating, 1.1%
SDG&E Energy Use by End Use
Electricity
NaturalGas

© 2006, Itron Inc. 59
PG&E versus SDG&ESelect Comparisons
© 2006, Itron Inc. 60
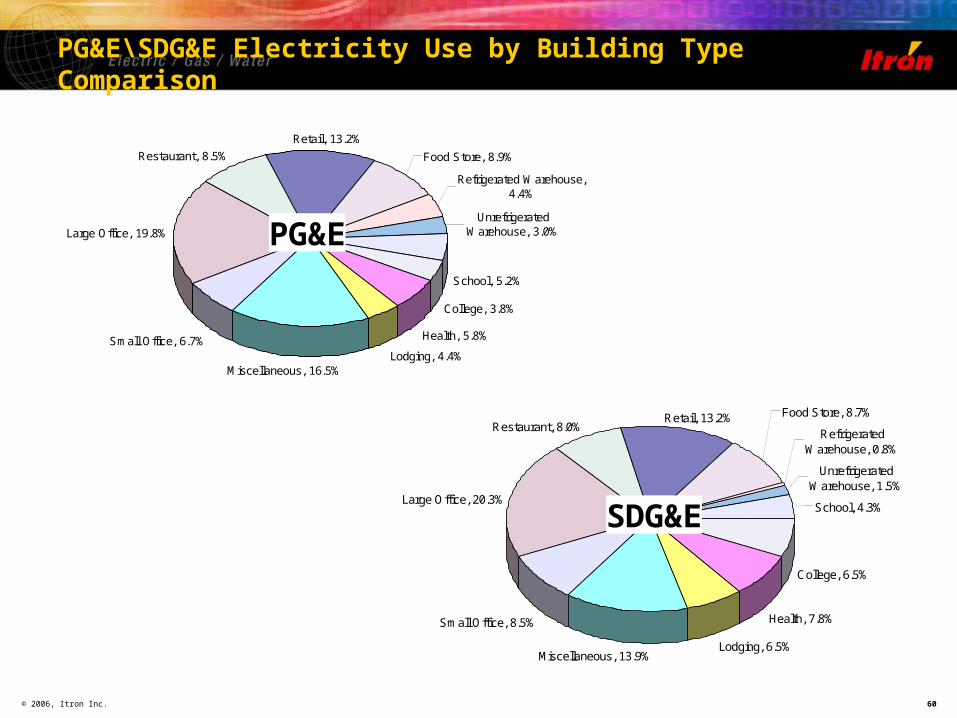
Small Office, 6.7%
Large Office, 19.8%
Restaurant, 8.5%
Retail, 13.2%
Refrigerated Warehouse, 4.4%
Unrefrigerated Warehouse, 3.0%
School, 5.2%
College, 3.8%
Health, 5.8%
Lodging, 4.4%Miscellaneous, 16.5%
Food Store, 8.9%
Small Office, 8.5%
Large Office, 20.3%
Restaurant, 8.0%Retail, 13.2%
Refrigerated Warehouse, 0.8%
Unrefrigerated Warehouse, 1.5%
School, 4.3%
College, 6.5%
Health, 7.8%
Lodging, 6.5%Miscellaneous, 13.9%
Food Store, 8.7%
PG&E\SDG&E Electricity Use by Building Type Comparison
PG&E
SDG&E

© 2006, Itron Inc. 61
PG&E\SDG&E Electric End Use Comparison
Heating, 1.8%
Cooling, 12.4%
Ventilation, 12.4%Refrigeration, 14.8%
Cooking, 4.6%
Interior Lighting, 28.9%
Exterior Lighting, 5.2%
Office Equipment, 8.2%
Miscellaneous, 5.9%
Process, 0.3%
Motors, 3.8%
Air Compressors, 0.9%
Water Heating, 0.8%
Heating, 1.9%
Cooling, 16.3%
Ventilation, 11.4%
Refrigeration, 12.3%
Cooking, 3.6%
Interior Lighting, 28.4%
Exterior Lighting, 6.1%
Office Equipment, 7.0%
Miscellaneous, 5.3%
Process, 0.1%
Motors, 5.6%
Air Compressors, 0.9%
Water Heating, 1.1%
PG&E
SDG&E

© 2006, Itron Inc. 62
Heating, 29.9%
Cooling, 5.5% Water Heating, 32.4%
Cooking, 21.1%Process, 8.4%
Miscellaneous, 2.6%
PG&E\SDG&E Natural Gas End Use Comparison
Heating, 44.0%
Cooling, 0.7%
Water Heating, 29.5%
Cooking, 19.8%Process, 5.2%
Miscellaneous, 0.8%
PG&E
SDG&E

© 2006, Itron Inc. 63
The analysis possibilities are endless……..

© 2006, Itron Inc. 64
Availability of Report and Data
CEC Report ID#: CEC-400-2006-005 Report publicly available on CALMAC website:
> CALMAC Study ID#: CEC0023 Report and presentation available on Itron website:
> http://www.itron.com/pages/products_detail.asp?ID=itr_000806.xml&pgtype=&subID=ar#ar
Segment-level results data will also be made publicly available
Premise-level data currently only available to utilities that participated in the CEUS survey.
CEUS data currently being used by CEC PIER for benchmarking effort.
© 2006, Itron Inc. 65
Questions and Work/Data Requests
Itron Contacts:> Tom Mayer: [email protected]
> Bob Ramirez: [email protected]
CEC Contacts:> Mark Ciminelli: [email protected]
> Mohsen Abrishami: [email protected]