© 2003 the mcgraw-hill companies, inc. all rights reserved. credit and inventory management chapter...
Post on 19-Dec-2015
224 views
TRANSCRIPT

© 2003 The McGraw-Hill Companies, Inc. All rights reserved.
Credit and Inventory Management
Chapter
Twenty

20.2
Copyright © 2005 McGraw-Hill Ryerson Limited. All rights reserved.
Chapter Outline
• Credit and Receivables
• Cash Management
• Terms of the Sale
• Analyzing Credit Policy
• Optimal Credit Policy
• Credit Analysis
• Collection Policy
• Inventory Management
• Inventory Management Techniques

20.3
Copyright © 2005 McGraw-Hill Ryerson Limited. All rights reserved.
Credit Management: Key Issues 20.1
• Granting credit increases sales
• Costs of granting credit– Chance that customers won’t pay– Financing receivables
• Credit management examines the trade-off between increased sales and the costs of granting credit

20.4
Copyright © 2005 McGraw-Hill Ryerson Limited. All rights reserved.
Components of Credit Policy
• Terms of sale– Credit period: length of time between sale and collection– Discounts: price reduction for early payment– Cash discount period: length of time between sale and
payment with discount– Credit instrument: evidence of indebtednessTypes of credit instruments- Invoice- Promissory note – used for large purchases and risky customers,
they are signed after the delivery of the goods
- Commercial draft – to obtain a credit commitment for a customer before the goods are delivered

20.5
Copyright © 2005 McGraw-Hill Ryerson Limited. All rights reserved.
Components of Credit Policy (cont.)
• Credit analysis – distinguishing between “good” customers that will pay and “bad” customers that will default
• Collection policy – effort expended on collecting on receivables

20.6
Copyright © 2005 McGraw-Hill Ryerson Limited. All rights reserved.
Cash Management
• Cash = total bank deposits + currency + marketable securities
• Rationale for holding cash:
1- Speculative Motive – cash needed to take advantage of special cash bargains which come along
2- Precautionary Motive – cash needed for unexpected events
3- Transactions Motive – cash needed to conduct business

20.7
Copyright © 2005 McGraw-Hill Ryerson Limited. All rights reserved.
Cash Management
• Float: difference between cash on the firm’s books and cash as the bank has it. Due to check processing and clearing.
• Disbursement Float: float from checks written
• Collection Float: float from checks received
• Net Float = Disbursement float – Collection float
• Managing float – reduce cash collection time.

20.8
Copyright © 2005 McGraw-Hill Ryerson Limited. All rights reserved.
Example – Cash Management
Each business day, on average, a company writes checks totalling $43,000 to pay its suppliers. The usual clearing time for the checks is five days. Meanwhile, the company is receiving payments from its customers each day, in the form of checks, totalling $57,000. The cash from the payments is available to the firm after 2 days. Calculate the company’s disbursement float, collection float, and net float.
Disbursement float =Collection Float =Net float =

20.9
Copyright © 2005 McGraw-Hill Ryerson Limited. All rights reserved.
The Cash Flows from Granting Credit
Figure 1
Customer mails Company receives Company deposits Cash becomes payment payment payment available
Collection time

20.10
Copyright © 2005 McGraw-Hill Ryerson Limited. All rights reserved.
Notes
• A/R = Credit sales per day x ACP
• Nominal annual cost of foregoing the discount = (x) (y)
(discount / [1 - discount]) (365 / [days credit is outstanding – discount period]
- EAR = (1+x)^y -1

20.11
Copyright © 2005 McGraw-Hill Ryerson Limited. All rights reserved.
Example
A firm’s credit terms are 2/10 net 30, and 65% of its customers take the discount while 35% do not. All sales are credit sales. Find the average collection period.
Solution:
ACP =

20.12
Copyright © 2005 McGraw-Hill Ryerson Limited. All rights reserved.
Terms of Sale 20.2
• Basic Form: 2/10 net 45– 2% discount if paid in 10 days– Total amount due in 45 days if discount not taken
• Buy $500 worth of merchandise with the credit terms given above
20.13
Copyright © 2005 McGraw-Hill Ryerson Limited. All rights reserved.
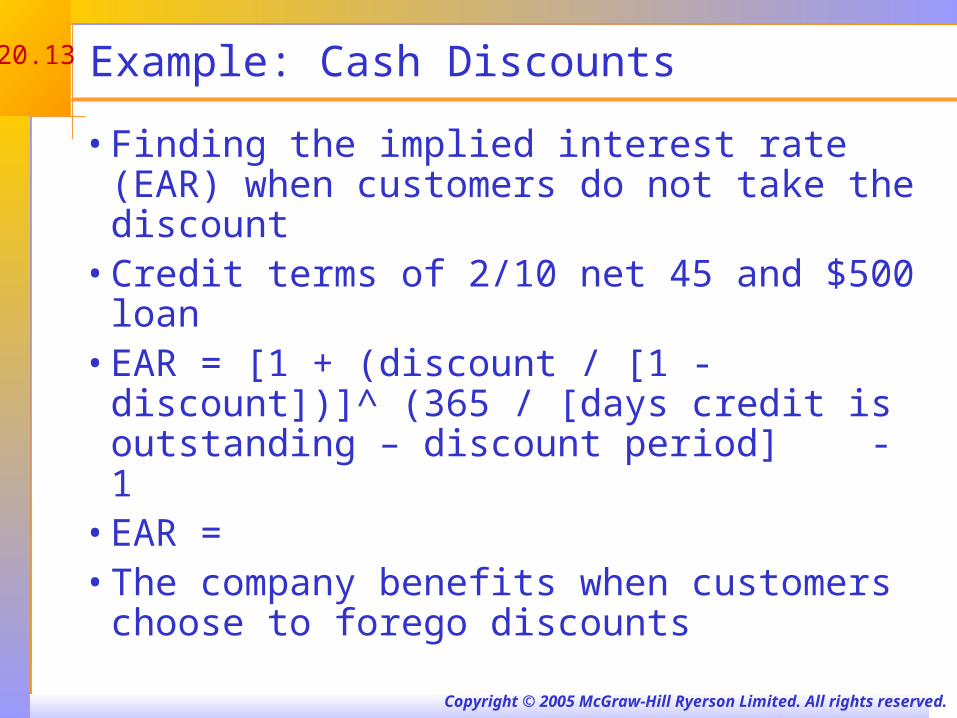
Example: Cash Discounts
• Finding the implied interest rate (EAR) when customers do not take the discount
• Credit terms of 2/10 net 45 and $500 loan• EAR = [1 + (discount / [1 - discount])]^ (365 / [days
credit is outstanding – discount period] - 1• EAR = • The company benefits when customers choose to
forego discounts

20.14
Copyright © 2005 McGraw-Hill Ryerson Limited. All rights reserved.
Example
- A firm offers the following credit terms, 2/20 net 45. A customer purchases $100 of raw materials. Bank financing is available at 18%.
- Find: the nominal cost of foregoing the discount, EAR of the firm, EAR of the bank, and real $ cost of not taking the discount

20.15
Copyright © 2005 McGraw-Hill Ryerson Limited. All rights reserved.
Total Cost of Granting Credit 20.4
• Carrying costs– Required return on receivables– Losses from bad debts– Costs of managing credit and collections
• Shortage costs– Lost sales due to a restrictive credit policy
• Total cost curve– Sum of carrying costs and shortage costs– Optimal credit policy is where the total cost curve
is minimized

20.16
Copyright © 2005 McGraw-Hill Ryerson Limited. All rights reserved.
Figure 20.1 The Costs of Granting Credit

20.17
Copyright © 2005 McGraw-Hill Ryerson Limited. All rights reserved.
Credit Analysis 20.5
• Process of deciding which customers receive credit• Gathering information
– Financial statements
– Credit reports
– Banks
– Payment history with the firm
• Determining Creditworthiness– 5 Cs of Credit
– Credit Scoring

20.18
Copyright © 2005 McGraw-Hill Ryerson Limited. All rights reserved.
Credit Information
• Financial statements (balance sheet, income statement, statement of cash flows)
• Physical condition of the business
• Credit ratings
• Reports from customer’s bank
• Timeliness of payments to others and your firm
• Background of firm owners

20.19
Copyright © 2005 McGraw-Hill Ryerson Limited. All rights reserved.
Five Cs of Credit
• Character – customer’s willingness to meet financial obligations
• Capacity – customer’s ability to meet financial obligations out of operating cash flows (ratio analysis)
• Capital – customer’s financial reserves• Collateral – assets pledged as security by
customer in the event of default• Conditions – general economic conditions
related to customer’s business

20.20
Copyright © 2005 McGraw-Hill Ryerson Limited. All rights reserved.
Credit Score
• Credit score: is the mathematical score representing the probability that the customer will default

20.21
Copyright © 2005 McGraw-Hill Ryerson Limited. All rights reserved.
Collection Policy 20.6
• Monitoring receivables– Keep an eye on average collection period relative
to your credit terms– Use an aging schedule to determine percentage of
payments that are being made late
Aging Schedule: breaks a firm’s A/R down, showing how long particular accounts have been outstanding.

20.22
Copyright © 2005 McGraw-Hill Ryerson Limited. All rights reserved.
Example- Aging Schedule
• If the credit terms are net 60• Age of Account Value %
0-10 days $40,000 38.8
11-30 days 30,000 29.1
31-60 days 15,000 14.6
61-90 days 10,000 9.7
over 90 days 8,000 7.8
$103,000 100%

20.23
Copyright © 2005 McGraw-Hill Ryerson Limited. All rights reserved.
Collection Policy (cont.)
• Collection policy – what to do about collecting delinquent accounts (how to assure payments in A/R)
- Letter to customer
- Phone call to customer
- Collection Agency
- Legal action

20.24
Copyright © 2005 McGraw-Hill Ryerson Limited. All rights reserved.
Inventory Management 20.7
• Inventory can be a large percentage of a firm’s assets
• Costs associated with carrying too much inventory
• Costs associated with not carrying enough inventory
• Inventory management tries to find the optimal trade-off between carrying too much inventory versus not enough

20.25
Copyright © 2005 McGraw-Hill Ryerson Limited. All rights reserved.
Types of Inventory
• Manufacturing firm– Raw material – starting point in production process
– Work-in-progress – partially finished goods requiring additional work before they become finished goods
– Finished goods – completed products ready to ship or sell
• Remember that one firm’s “raw material” may be another company’s “finished good”
• Different types of inventory can vary dramatically in terms of liquidity

20.26
Copyright © 2005 McGraw-Hill Ryerson Limited. All rights reserved.
Inventory Costs
• Carrying costs – range from 20 – 40% of inventory value per year– Storage and tracking– Insurance and taxes– Losses due to obsolescence, deterioration or theft– Opportunity cost of capital– Interest expense
• Shortage costs– Restocking costs– Lost sales or lost customers
• Consider both types of costs and minimize the total cost

20.27
Copyright © 2005 McGraw-Hill Ryerson Limited. All rights reserved.
Inventory Management – ABC Approach 20.8
ABC Method• Classify inventory by cost, demand and need• Those items that have substantial shortage costs
should be maintained in larger quantities than those with lower shortage costs
• Generally maintain smaller quantities of expensive items, monitor closer, and order often
• Maintain a substantial supply of less expensive basic materials, require little monitoring, and order infrequently

20.28
Copyright © 2005 McGraw-Hill Ryerson Limited. All rights reserved.
Economic Order Quantity (EOQ) Model
• The EOQ model minimizes the total inventory cost by finding the optimal inventory level to order
• Total carrying cost = (average inventory) x (carrying cost per unit) = (Q/2)(CC)
• Total restocking cost = (fixed cost per order) x (number of orders) = F(T/Q)
• # of order per period = (usage rate per year / quantity ordered)
= (T / Q)

20.29
Copyright © 2005 McGraw-Hill Ryerson Limited. All rights reserved.
EOQ Model (cont.)
• Total Cost = Total carrying cost + total restocking cost [ TC = (Q/2)(CC) + F(T/Q)]
CC
TFQ
2*

20.30
Copyright © 2005 McGraw-Hill Ryerson Limited. All rights reserved.
Example 1 : EOQ
• A firm uses 2,300 switch assemblies per week and then reorders another 2,300. If the relevant carrying cost per switch assembly is $10 and the fixed order cost is $800, is the firm’s inventory policy optimal? Why or why not?

20.31
Copyright © 2005 McGraw-Hill Ryerson Limited. All rights reserved.
Example 2: EOQ
• Consider an inventory item that has carrying cost = $1.50 per unit. The fixed order cost is $50 per order and the firm sells 100,000 units per year.– What is the economic order quantity?

20.32
Copyright © 2005 McGraw-Hill Ryerson Limited. All rights reserved.
Extensions
• Safety stocks– Minimum level of inventory kept on hand (to prevent
inventory stock outs)– Increases carrying costs
• Reorder points– At what inventory level should you place an order?– Need to account for delivery time
ExampleA firm uses 1000 units per week. It takes 1½ weeks to receive
an order. The firm holds a safety stock of 250 units. Find the reorder point.

20.33
Copyright © 2005 McGraw-Hill Ryerson Limited. All rights reserved.
Extensions (cont.)
• Derived-Demand Inventories: Sales depend on consumer demand– Materials Requirements Planning (MRP): use
computer-based systems for ordering and/or scheduling production of demand-dependent inventories
– Just-in-Time Inventory: design for inventory in which parts, raw materials, and other work-in-process is delivered exactly as needed for production. The goal is to minimize inventory