zonal separation and solids circulation in a draft tube
TRANSCRIPT
ZONAL SEPARATION AND SOLIDS CIRCULATION IN A DRAFT TUBE
FLUIDIZED BED APPLIED TO COAL GASIFICATION
Submitted in partial fulfillment of the requirements for the degree of Doctor of Philisophy in the Department of Chemical Engineering of the University of Natal.
by V Rudolph Dept. of Chemical Engineering University of Natal Durban, South Africa
November 1984,
( i )
STATEMENT
The work embodied in this thesis is my own original work, to the best of my knowledge and belief, except as otherwise acknowledged in the text and has not been submitted for degree purposes to any other University.
V Rudolph
( i i )
ACKNOWLEDGEMENTS
The equipment used in this research has been funded by The National Energy Program of the CSIR; Sasol Ltd; and AECI Ltd. The assistance of Mr. R. Brenner of Afrox Ltd, for the supply of liquid oxygen and Mr. T. Cole of Natal
Associated Collieries for the provision of coal is much appreciated.
Thanks are also due for assistance provided by : Mr. D. Penn and the workshop staff for mecahnical help and equipment maintenance;
Messrs W. Meihack and S. Boardmann in operating the pilot plant; Merle Kohl and Anne Smout for typing.
Finally, the valuable assistance and supervision provided throughout the course of the project by Professor M.R. Judd is gratefully acknowledged,
as is the support of my employers - Engineering Management Services Ltd. . I
( iii)
SUMMARY
In this thesis a fluidized bed containing a draft tube has been studied with the aim of developing the apparatus for coal gasification. The process has the capability of producing synthesis quality gas using air for combustion, and of being able to accomodate poor quality coal feeds containing heavy fines loads. These advantages arise from two special features of a draft tube fluidized bed. In the first place, the bed may be operated as two separate and independent reaction zones, one contained within the draft tube and the
other in the annulus region surrounding it. As a result, the gasification reactions may be carried out in one compartment and the combustion reactions in the other, allowing the useful gasification products to be taken off
separately and undiluted with the combustion flue gases. Secondly, the fluidized material in the bed may be induced to circulate up the draft tube and down the annulus. These circulating solids provide the heat carrier from the combustion to the gasification zones within the bed. Furthermore, . I
circulation of the bed in this way leads to a much longer residence time of fine particles within the bed and results in a high fine coal utilization efficiency.
In order to achieve these benefits in practice, it is necessary to separate the gases supplied to and emitted from the draft tube from those of the annulus, but at the same time allowing free movement of solids between these regions.
The thesis deals with how this may be accomplished in three parts:
Firstly, the principles underlying division of a fluidized bed with a draft
tube into discrete reaction zones are formulated, and strategies for achieving zonal separation, based on these arguments, are experimentally tested. As a result a reactor configuration and operating conditions suitable for coal gasification have been empirically ident~fied.
Secondly, a model describing the bulk circulation of solid material in the bed is presented, for the draft tube operating in the slugging mode. This model
allows the average solids residence time and the particle veloci~ies in the
( i v)
annulus and draft tube to be predicted, provided that slug velocities and spacings are known. The necessary correlations between hydrodynamic behaviour
and the system properties are available in the literature for round nosed and wall slugs, but not for square nosed slugs, which appear to be characteristic
in the apparatus used here.
The third part consequently examines the square nosed slugging regime, and a theory to describe this behaviour, based on interparticle stress analysis, is presented. This regime is identified as having significant advantage over other bubbling modes because of the high dense phase gas flow rates which are sustained, and the resulting improved gas-solid contacting.
The three models together mathematically describe the operation of the draft tube fluidized bed, allowing gas partition between the · annulus and the draft tube regions as well as solids circulation to be predicted, for different bed
configurations and operating conditions. The predictions compare well with . I
experimental results.
The last part of the thesis deals with the application of the system to coal gasification on a one ton coal per day pilot plant. A high quality gas,
containing ·up to 80% CO + H2, (balance CO2), has been produced by steam
gasification in the draft tube, using air for the combustion reaction in the annulus. The H2/CO ratio can be varied from about 1 to 3, by changing the operating temperature of the reactor.
(v)
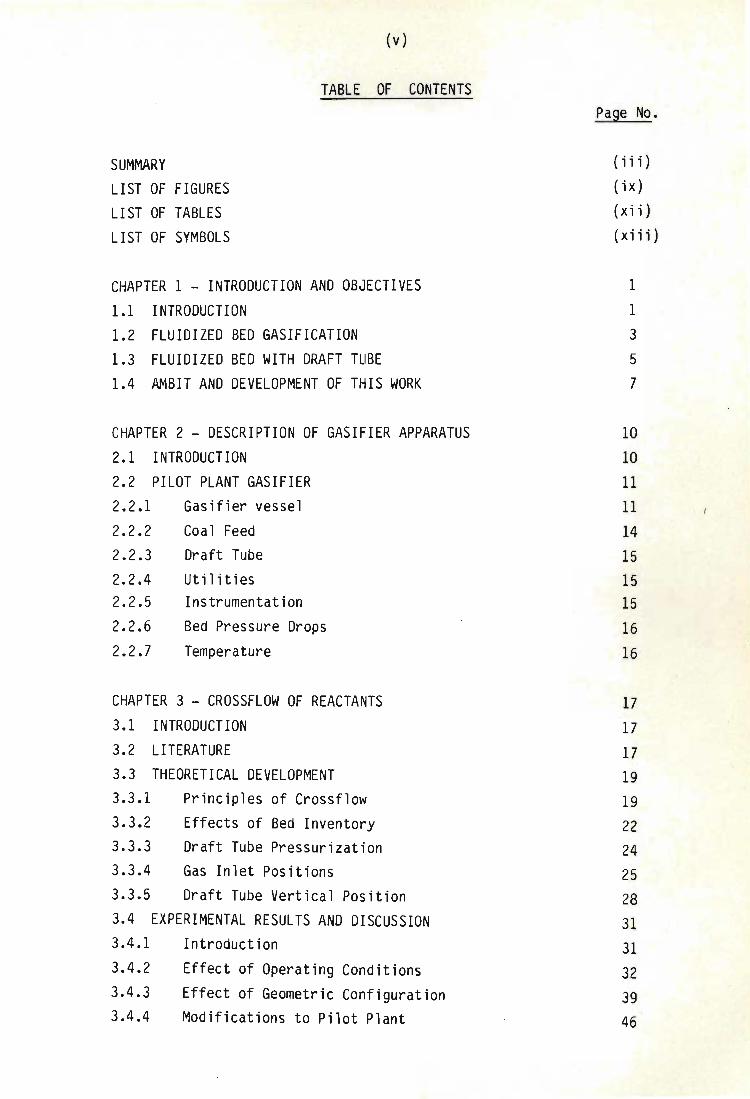
TABLE OF CONTENTS
SUMMARY LIST OF FIGURES LI ST OF TABLES LIST OF SYMBOLS
CHAPTER 1 - INTRODUCTION AND OBJECTIVES 1.1 INTRODUCTION 1.2 FLUIDIZED BED GASIFICATION 1.3 FLUIDIZED BED WITH DRAFT TUBE 1.4 AMBIT AND DEVELOPMENT OF THIS WORK
CHAPTER 2 - DESCRIPTION OF GASIFIER APPARATUS 2.1 INTRODUCTION 2.2 PILOT PLANT GASIFIER 2.2.1 Gasifier vessel 2.2.2 Coal Feed 2.2.3 Draft Tube 2.2.4 Ut i 1 it i es 2.2.5 Instrumentation 2.2.6 Bed Pressure Drops 2.2.7 Temperature
CHAPTER 3 - CROSSFLOW OF REACTANTS 3.1 INTRODUCTION 3.2 LI TERATURE 3.3 THEORETICAL DEVELOPMENT 3.3.1 Principles of Crossflow 3.3.2 3.3.3 3.3.4
Effects of Bed Inventory Draft Tube Pressurization Gas Inlet Positions
3.3.5 Draft Tube Vertical Position 3.4 EXPERIMENTAL RESULTS AND DISCUSSION 3.4.1 Introduction 3.4.2 Effect of Operating Conditions 3.4.3 Effect of Geometric Configuration 3.4.4 Modifications to Pilot Plant
Page No.
(i i i)
(ix) (xii) (xiii)
1 1
3 5
7
10
10
11
11
14 15 15 15 16 16
17
17
17 19 19 22 24 25 28
31 31 32 39
46
(vi)
TABLE OF CONTENTS (Continued)
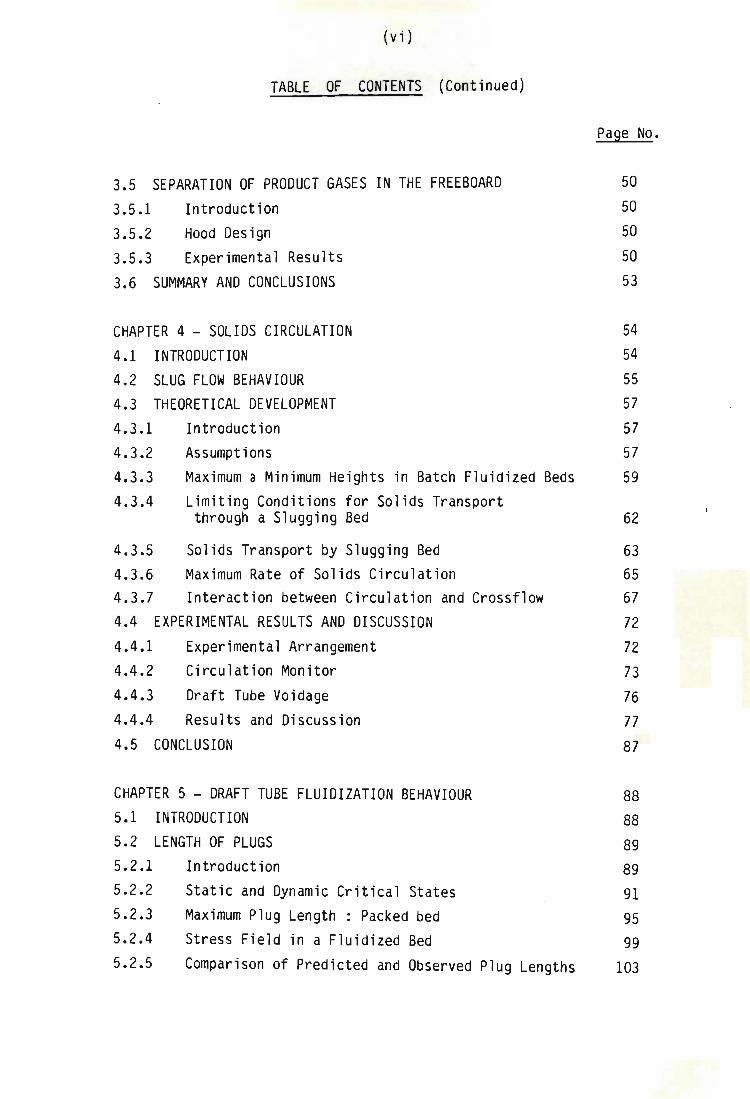
3.5 SEPARATION OF PRODUCT GASES IN THE FREEBOARD 3.5.1 Introduction 3.5.2 Hood Design 3.5.3 Experimental Results 3.6 SUMMARY AND CONCLUSIONS
CHAPTER 4 - SOLIDS CIRCULATION 4.1 INTRODUCTION 4.2 SLUG FLOW BEHAVIOUR 4.3 THEORETICAL DEVELOPMENT 4.3.1 Introduction 4.3.2 Assumptions 4.3.3 Maximum a Minimum Heights in Batch Fluidized 4.3.4 Limiting Conditions for Solids Transport
through a Slugging Bed
4.3.5 Solids Transport by Slugging Bed 4.3.6 Maximum Rate of Solids Circulation 4.3.7 Interaction between Circulation and Crossflow 4.4 EXPERIMENTAL RESULTS AND DISCUSSION 4.4.1 Experimental Arrangement 4.4.2 Circulation Monitor 4.4.3 Draft Tube Voidage 4.4.4 Results and Discussion 4.5 CONCLUSION
CHAPTER 5 - DRAFT TUBE FLUIDIZATION BEHAVIOUR 5.1 INTRODUCTION 5.2 LENGTH OF PLUGS 5.2.1 Introduction 5.2.2 Static and Dynamic Critical States 5.2.3 Maximum Plug Length: Packed bed
Stress Field in a Fluidized Bed
Beds
5.2.4 5.2.5 Comparison of Predicted and Observed Plug Lengths
Page No.
50 50 50 50 53
54 54 55 57 57 57 59
62
63 65 67 72 72 73 76 77 87
88 88 89 89 91 95 99
103
(v i i)
TABLE OF CONTENTS (Continued)
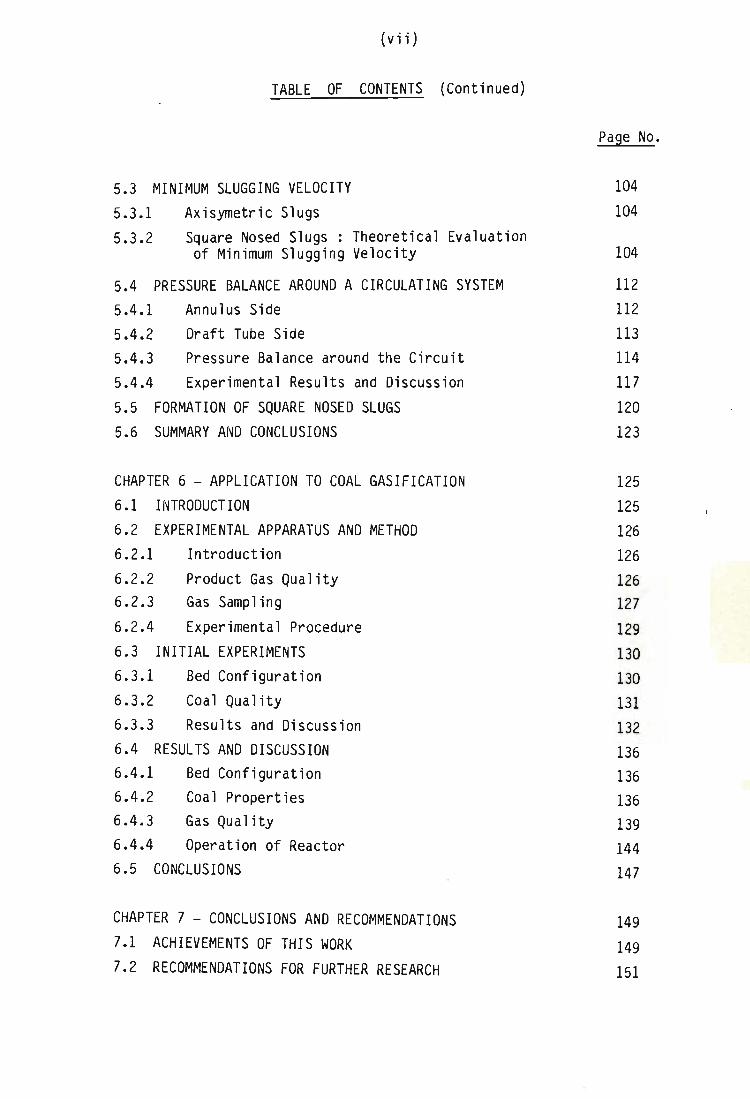
5.3 MINIMUM SLUGGING VELOCITY 5.3.1 Axisymetric Slugs
5.3.2 Square Nosed Slugs : Theoretical Evaluation of Minimum Slugging Velocity
5.4 PRESSURE BALANCE AROUND A CIRCULATING SYSTEM 5.4.1 5.4.2 5.4.3 5.4.4
5.5
Annulus Side Draft Tube Side Pressure Balance around the Circuit Experimental Results and Discussion
FORMATION OF SQUARE NOSED SLUGS 5.6 SUMMARY AND CONCLUSIONS
CHAPTER 6 - APPLICATION TO COAL GASIFICATION 6.1 INTRODUCTION 6.2 EXPERIMENTAL APPARATUS AND METHOD 6.2.1 Introduction
6.2.2 6.2.3
6.2.4
Product Gas Quality Gas Sampling
Experimental Procedure
6.3 INITIAL EXPERIMENTS 6.3.1 Bed Configuration
6.3.2 Coal Quality 6.3.3 Results and Discussion 6.4 RESULTS AND DISCUSSION 6.4.1 Bed Configuration 6.4.2 Coal Properties 6.4.3 Gas Quality 6.4.4 Operation of Reactor 6.5 CONCLUSIONS
CHAPTER 7 - CONCLUSIONS AND RECOMMENDATIONS 7.1 ACHIEVEMENTS OF THIS WORK
7.2 RECOMMENDATIONS FOR FURTHER RESEARCH
Page No.
104
104
104
112 112 113 114
117
120 123
125 125
126 126 126 127
129 130 130 131
132 136 136 136 139 144 147
149
149 151
(viii)
TABLE OF CONTENTS (Continued)
BIBLIOGRAPHY
APPENDICES
APPENDIX A - PROPERTIES OF BED POWDER APPENDIX B - TABULATED CROSSFLOW RESULTS ON MAIN APPARATUS APPENDIX C - SELECTIVE PRESSURIZATION OF DRAFT TUBE APPENDIX 0 - TABULATED CROSSFLOW RESULTS ON SMALL APPARATUS APPENDIX E - PRESSURE DROP OVER ANNULUS APPENDIX F - SLUG RISE VELOCITY IN CONTINUOUSLY BUBBLING BEDS APPENDIX G - LEAD SHIELDING FOR CIRCULATION MONITOR APPENDIX H - CALCULATION OF DRAFT TUBE BUBBLE FRACTION
FROM RADIATION ATTENUATION
APPENDIX I - DENSE PHASE CIRCULATION RATES APPENDIX J - DRAFT TUBE BUBBLE FRACTION APPENDIX K - ANNULUS WALL SHEAR FORCE APPENDIX L - SAMPLE CALCULATION OF PRESSURE BALANCE APPENDIX M - MIXED PRODUCT GAS COMPOSITIONS
Page No.
153
162
166
172 174
177 179
182
184
185 . i
189 190 191 194
----- l. 2.
3. 4. 5. 6.
( i x)
LI ST OF FIGURES
Fluidized bed with draft tube. Pilot plant gasifier: schematic arrangement. Idealized pressure drop-gas velocity relationship.
Pressure-height diagram. Gas crossf10w in connected beds. (a) Pressure-height diagram:
effect of annulus bed depth on crossf10w (b) Pressure drop-gas velocity diagram:
effect of annulus bed depth on crossf10w 7. Pressure-height diagram:
effect of draft tube pressurration on crossf10w.
8. Pressure drop-gas velocity diagram : effect of draft tube pressurization on crossf10w.
9. Pressure-height diagram: effect of annulus gas inlet position on crossf10w.
10. Pressure-height diagram:
ll.
12.
13.
14. 15. 16.
17.
18.
19. 20.
2l.
22.
23.
24.
25.
26.
27.
28.
29. 30.
reverse crossf10w for raised annulus gas inlet. Pressure-height diagram for low draft tube vertical position. Effect of draft tube vertical position on crossflow. Apparatus for crossf10w experiments : schematic arrangement.
Crossf10w rates for two draft tube gas inlet positions. Effect of annulus and draft tube gas velocities on crossf10w. Effect of annulus bed depth on crossflow.
Schematic diagram of small-scale apparatus. Annulus sparger detail for small-scale apparatus. Effect of draft tube gas inlet position on crossf10w. Effect of annulus gas inlet position on crossf10w. Crossf10w rates for different scales of apparatus. Revised annulus sparger design. Revised fluidization gas inlet arrangement. Effect of draft tube vertical position on crossf10w. Elimination of crossflow.
Hood arrangement for separation of draft tube and annulus gas. Slugging behaviour in fluidized beds. Eruption of slugs at bed surface.
Effective height of a slugging bed. Force b~lance at bottom of draft tube.
Page No.
5
12 19
20
21
23
23
25
25
26
27
28
29
34
35
37
38
40
41 42
43
44 45
46
47
48
51 55
59
66
68
F
31. 32. 33. 34. 35. 36. 37-39 40. 41. 42.
43. 44. 45. 46. 47. 48. 49. 50.
51. 52. 53. 54.
55.
56.
57. 58. 59.
60. 61.
(x)
LIST OF FIGURES (Continued)
Page No.
System geometry for solid circulation experiments. 72 Apparatus for measuring solids circulation: schematic diagram. 75
Draft tube voidage measurement : schematic diagram. 76
Solids circulation and slug frequency. 78 Rise velocites of square nosed slugs. 79 Variation of solids circulation with total fluidizing gas flow rate. 81
Bubble fraction in the draft tube. 85 Minimum slug breakdown height in the draft tube. 86
Mohr stress diagram and yield locus.
Mohr stress diagram Rankine active condition.
Mohr stress diagram Rankine passive condition.
Mohr stress diagram dynamic and static conditions.
Mohr stress diagram critical yield plane.
Mechanically propelled bed. Mohr stress diagram for a constrained plug. Mohr stress diagram: active stress field at the wall. Distortion of the slip surface due to wall effect. Mohr stress diagram: yield plane in a fluidized bed.
Stresses acting in a fluidized bed. Force balance on a differential slice of dense phase in a plug.
Predicted and experimental solids velocities in the draft tube. Predicted and experimental gas flows to the draft tube (15Omm diameter). Predicted and experimental gas flows to the draft tube (20Omm diameter). Predicted and experimental solids velocities in the draft tube (20Omm diameter). Predicted dense phase gas flow rates in the draft tube. Formation of square nozed slugs. Mohr stress diagram: yield planes for powders with different angles of internal friction. Gas sample scrubber.
Annulus gas-sampler.
I
90 92
93 94
95
96 97
97 97
100
101
105
115
117
118
119
119 121
121
128
129
62. 63. 64. 65. 66.
67.
AI. B1. C1. C2. Flo G1. G2.
(xi)
LIST OF FIGURES (Continued)
Apparatus configurations during initial gasification experiments. Typical bed temperature profile during gasification. Typical mixed product gas composition in initial experiments. Amended apparatus configuration based on crossflow analysis. H2/CO ratio in mixed gas as a function of gasifier operating temperature. Shift reaction equilibrium.
Incipient fluidizing gas velocity, Umf • Reference level Arrangement for Pressurising the Draft Tube Crossflow Variation with Imposed Draft Tube Pressure Slug rising in a tube. Detector lead shielding. Vessel lead shielding.
Page No.
131
133
135 137
140 141
164"
172 173 174 182 184 184
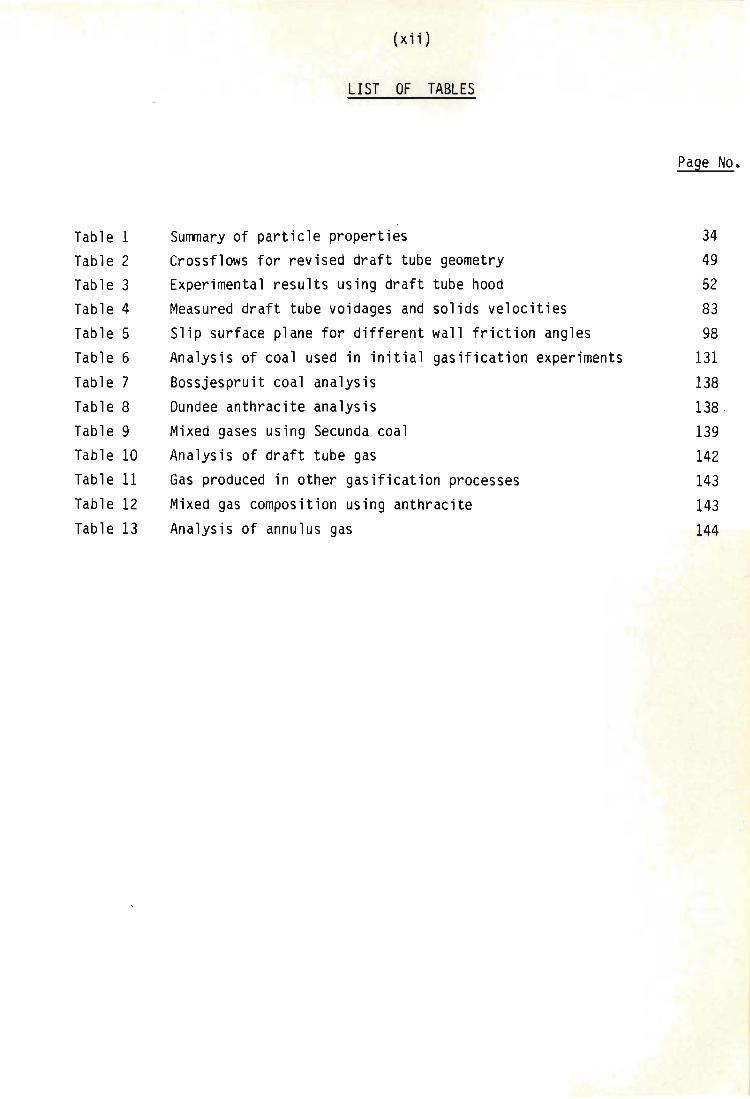
Table 1 Table 2 Table 3 Table 4 Table 5 Table 6 Table 7 Table 8 Table 9 Table 10 Table 11 Table 12 Table 13
(xii)
LIST OF TABLES
,
Summary of particle properties Crossflows for revised draft tube geometry Experimental results using draft tube hood Measured draft tube voidages and solids velocities Slip surface plane for different wall friction angles Analysis of coal used in initial gasification experiments Bossjespruit coal analysis Dundee anthracite analysis Mixed gases using Secunda coal Analysis of draft tube gas Gas produced in other gasification processes Mixed gas composition using anthracite Analysis of annulus gas
Page No.
34 49
52 83
98
131
138
138 .
139
142 143
+43 144
A
B
b
C
D
D
d
H
Hmax HI
max AH K
(xiii)
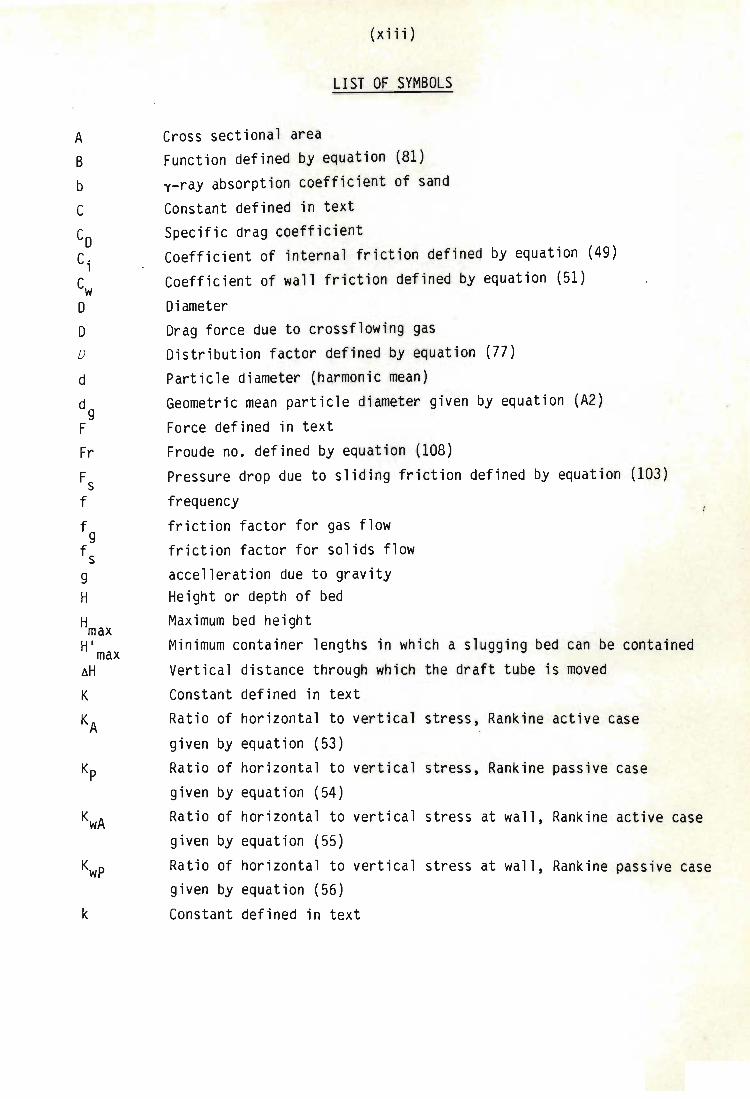
LI ST OF SYMBOLS
Cross sectional area Function defined by equation (81) y-ray absorption coefficient of sand
Constant defined in text Specific drag coefficient Coefficient of internal friction defined by equation (49)
Coefficient of wall friction defined by equation (51)
Diameter Drag force due to crossflowing gas Distribution factor defined by equation (77) Particle diameter (harmonic mean) Geometric mean particle diameter given by equation (A2)
Force defined in text Froude no. defined by equation (108) Pressure drop due to sliding friction defined by equation (103)
frequency friction factor for gas flow friction factor for solids flow accelleration due to gravity Height or depth of bed Maximum bed height Minimum container lengths in which a slugging bed can be contained
Vertical distance through which the draft tube is moved Constant defined in text Ratio of horizontal to vertical stress, Rankine active case
given by equation (53) Ratio of horizontal to vertical stress, Rankine passive case given by equation (54)
KwA Ratio of horizontal to vertical stress at wall, Rankine active case given by equation (55)
Kwp Ratio of horizontal to vertical stress at wall, Rankine passive case given by equation (56)
k Constant defined in text
L
m
n
Q"
r
u
v v
x Y
Y Z Z x,y,z
(xiv)
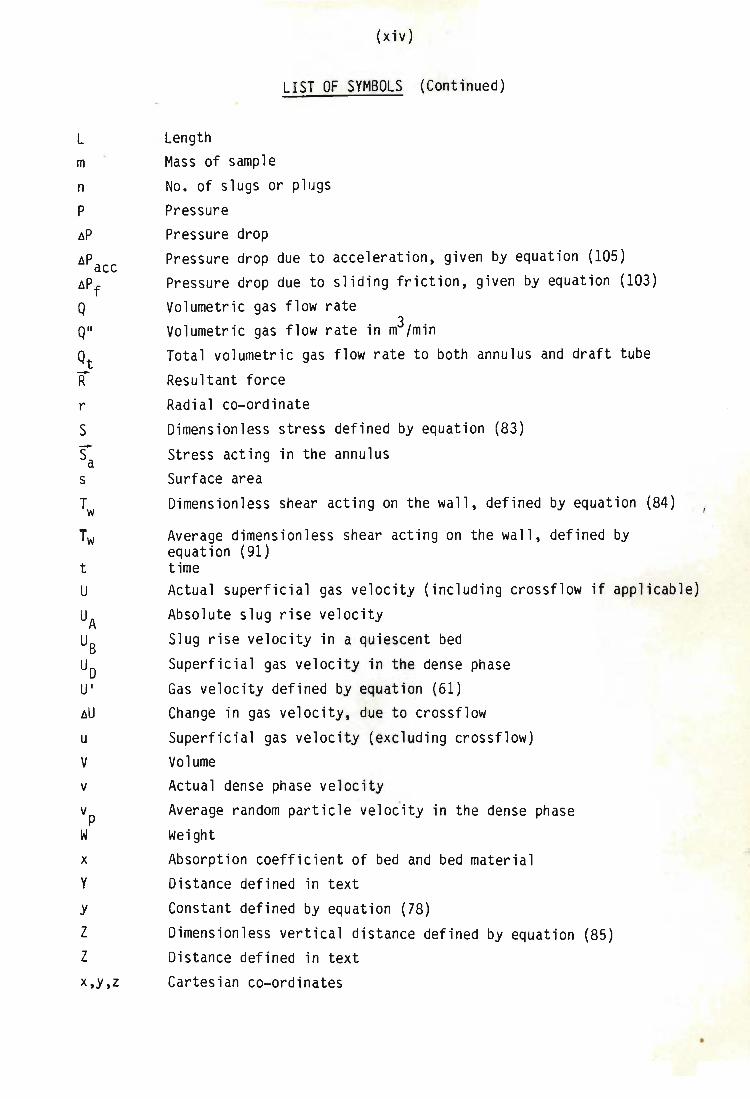
LIST OF SYMBOLS (Continued)
Length Mass of sample No. of slugs or plugs
Pressure Pressure drop Pressure drop due to acceleration, given by equation (105) Pressure drop due to sliding friction, given by equation (103)
Volumetric gas flow rate Volumetric gas flow rate in m3/min Total volumetric gas flow rate to both annulus and draft tube
Resultant force
Radial co-ordinate Dimensionless stress defined by equation (83)
Stress acting in the annulus Surface area
Dimensionless shear acting on the wall, defined by equation (84)
Average dimensionless shear acting on the wall, defined by equation (91) time Actual superficial gas velocity (including crossflow if applicable)
Absolute slug rise velocity
Slug rise velocity in a quiescent bed
Superficial gas velocity in the dense phase
Gas velocity defined by equation (61)
Change in gas velocity, due to crossflow
Superficial gas velocity (excluding crossflow) Volume Actual dense phase velocity
Average random particle veloiity in the dense phase Weight
Absorption coefficient of bed and bed material Distance defined in text
Constant defined by equation (78)
Dimensionless vertical distance defined by equation (85)
Distance defined in text
Cartesian co-ordinates
(xv)
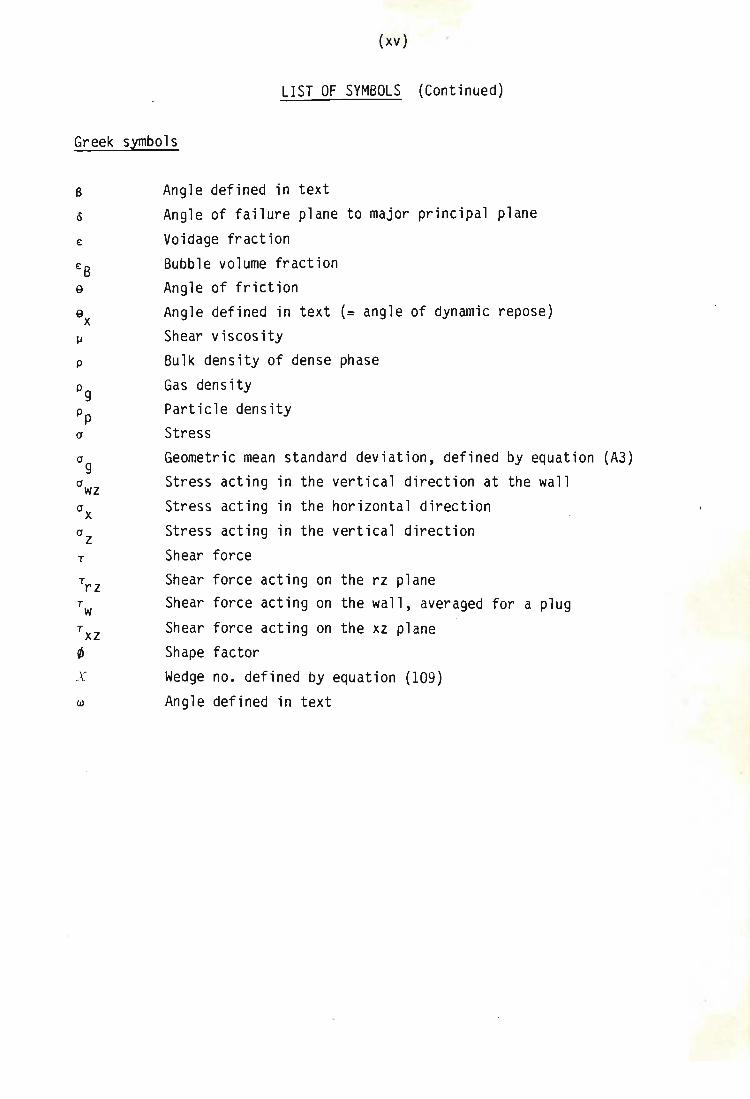
LIST OF SYMBOLS (Continued)
Greek symbols
a o e:
p
T
T xz o X
III
Angle defined in text Angle of failure plane to major principal plane
Voidage fraction Bubble volume fraction Angle of friction Angle defined in text (= angle of dynamic repose) Shear viscosity Bulk density of dense phase Gas density Particle density Stress Geometric mean standard deviation, defined by equation (A3) Stress acting in the vertical direction at the wall Stress acting in the horizontal direction Stress acting in the vertical direction Shear force Shear force acting on the rz plane Shear force acting on the wall, averaged for a plug Shear force acting on the xz plane Shape factor Wedge no. defined by equation (109)
Angle defined in text
(xvi)
LIST OF SYMBOLS (Continued)
Subscripts
A Rankine active state a Annulus B Bubble D Dense phase d Draft tube g Gas i Internal max Maximum mb At minimum bubbling mf At incipient fluidization min Minimum ms At minimum slugging o Static (unfluidized) condition P Rankine passive state p Plug r
s t
w
Radial co-ordinate Slug Total Wall
x Crossflow x,d Superficial velocity due to crossflow, based on draft tube area. x,z Cartesian co-ordinates
- 1 -
CHAPTER 1
INTRODUCTION AND OBJECTIVES
1.1 INTRODUCTION
It is widely acknowledged that coal will play an increasingly important role throughout the world as an energy source and as a feedstock for the chemical industry. Gasification provides a favourable route for coal conversion and as a result, a large number of processes are currently under development using a variety of reactor designs in a range of processing schemes. All of these new processes, as well as the established technologies, are governed in their application and economics by their characteristic feedstock requirements, (eg. size distribution, ash properties), operating variables (eg. temperature, pressure), throughput rates and product gas quality.
The technical and economic advantages and limitations of these processes have been widely reviewed [1, 2, 3] and discussed [4, 5, 6]. Nevertheless, it seems generally true that conventional and existing coal conversion processes are largely unable to accommodate discard and finely ground coals as feedstock and very large quantities of these materials are going to waste as a result. The efficient utilisation of resources demands that the energy value of this material be recovered, either directly by combustion or indirectly by gasification.
Combustion is relatively well established already, but there are a number of compelling reasons for conversion of coal by the gasification route, in particular for production of:
gasoline and other liquid fuels
synthesis gas for conversion to ammonia and other chemicals synthetic natural gas (SNG) for easy distribution of energy utilising existing infrastructure
- 2 -
Three factors especially, provide the incentive to improve fluidized bed
coal technology -
(1) the increasing cost and declining availibility of high grade fossil
fuels;
(2) the recongnition of environmental damage due to emmission of pollutants from conventional coal and oil burning plants;
(3) the increasing accumulation of coal duff (often of poor quality) arising from mechanised mining methods.
The last of these factors is particularly significant in South Africa) where a discard coal stockpile of over 25M tons is being increased by some 7M tons annually, and the accumulated duff coal (of relatively high quality) already exceeds 2M tons, with annual additions of some 1,2M tons [7J. These enormous stockpiles represent not only a waste of energy, but are creating increasing environmental hazards, mainly as a result of spontaneuous combustion in the dumps [8J.
The overall aims of this project are then to develop a fluidized coal gasifier suitable for producing synthesis quality gas -
(a) from a wide range of coals and high ash discard materials;
(b) capable of accepting a wide size distribution of feed particles and in particular a heavy fines load;
(c) using air for gasification rather than oxygen, for maximum cost effectiveness;
(d) free of methane and tarry by-products which require extensive downstream processing;
(e) under pressurized conditions, if necessary;
(f) using a cheap and reliable configuration which is mechanically and operationally simple.
- 3 -
1.2 FLUIDIZED BED GASIFICATION
Coal gasification represents the earliest industrial application of gas-solid fluidization technology with the Winkler process for coal-gas production which was first brought into commercial operation in 1926 (Leuna, Germany). Some fifteen additional large scale plants based on this technology were subsequently built for commercial operation and since that time and especially since the early 1960's a very large research effort has been devoted to this subject. Nevertheless, in spite of the intensive programmes and enormous amount of work which has gone into this research, the payback, in terms of commercially operating fluid bed gasification hardware, has not yet been forthcoming. In fact, there does not seem to be any commercial fluidized bed gasification plants operating anywhere in the world, at the present time [9].
The principal problems with traditional fluidized bed gasification technology are:
(a) fines are readily elutriated from the bed, resulting in poor carbon utilisation and dusty product gas. This may be exacerbated by shattering of larger coal particles in the coal feed due to thermal shock and explosive decomposition when introduced into the hot bed. There are also problems associated with the re-introduction of fines into a fluidized bed gasifiers: the distribution into the bed is difficult and re-elutriation occurs readily, thus leading to a build-up in the fines recycle system;
(b) fluidized bed systems often suffer from significant gas bypassing and oxygen (or air) which finds its way through the reactor, burns up the product gas and presents an explosion hazard. Steam consumption can also be far greater than the stoichiometric requirement as a result of gas bypassing;
(c) the process seems best suited to reactive, non-caking coals;
- 4 -
(d) - coal feeding is difficult due to clinkering at coal and oxygen feed points;
(e) the ratio of hydrogen to carbon monoxide is low, which is generally undesireable for syngas;
(f) the control of bed inventory with respect to particle size distribution and ash removal is difficult.
It has become apparent that no substantial advantage is likely to be achieved over the original Winkler process by utilising a simple bubbling bed and in order to make significant improvements in operation or efficiency some means of altering the fluidization phenomenon will be required.

- 5 -
1.3 FLUiDIZED BED WITH DRAFT TUBE
The incorporation of a draft tube into a fluidized bed gasifier potentially offers a number of substantial advantages over conventional freely bubbling bed designs and as a result could largely overcome many of the problems outlined above [ 10].
In a fluidized bed with a draft tube, illustrated in Fig. 1, the draft-tube region is vigorously fluidized while the annulus is usually operated at or near incipient conditions. This has the effect of establishing a density difference between the two regions which induces circulation of fluidized solids in the bed. The solids are transported up the draft tube by bubbles, or as dispersed phase and flow down the annulus.
Fi g. 1 Fluidized Bed with Draft Tube
dr aft tube
motion of solid particles
gas inlet
- 6 -
The ~ost important consequences of this change are :
(a) a wide size distribution of feed particles, and most importantly fine particles, can be more easily accommodated because early elutriation of fines from the bed is diminished by entraining the feed in the downward flow of solid material in the annular region [11]. This also results in a much longer residence time in the reactor for these fine particles of coal, allowing high carbon conversion and cracking of tars and oils to be accomplished at relatively low temperature;
(b) afterburning and syngas reversion due to oxygen bypass can be reduced by separating the combustion and gasification reactions in the annular region and draft tube respectively. Since the annulus operates at or near incipient fluidization conditions, the usual mechanism for gas bypass - in the bubbles - is effectively
eliminated;
(c) separation of reactions into two discrete zones also allows the possibility that the flue gases of combustion (that is the unwanted carbon dioxide and nitrogen) may be taken separately from the gasification products (mainly hydrogen and carbon monoxide), thereby avoiding the difficulties of gas separation normally associated with obtaining a high quality product gas from air blown gasification;
(d) clambering and fouling of bed surfaces and feed points is reduced because of the scouring which occurs in a circulating bed.
The system also offers a number of other operating and engineering advantages over alternative processes. For example, the incorporation of a draft tube lends itself to long, thin vessel geometry, a configuration which is economically favourable for pressurized operation. Pressurized operation, besides simplifying the downstream processing and reducing the size of the vessel itself, also reduces the bubble growth phenomenon in the deep bed and hence the possibility of oxygen and steam bypassing. In addition, solids recycle to the bed, if necessary, is facilitated by the fact that cyclone diplegs can be essentially straight and terminate in regions of suitable pressure for discharge without foot-valves; also, the returned fines are unlikely to be re-elutriated, since they may be returned into the down-flowing
annulus region.
- 7 -
1.4 AMBIT AND DEVELOPMENT OF THIS WORK
The most important novel features of this work are the development of a fluidized bed with a draft tube, in which different reactions occur in the draft tube and annulus regions of the bed, but in which solid circulation between the zones is maintained; and the application of these principles to coal gasification, to enable the production of high energy-value gas, using air as the oxidising medium.
Three new theories have been formulated, as a result, concerning -
(a) the principles of zonal separation in a fluidized bed with a draft
tube;
(b) solids transport through a slugging fluidized bed and around the draft tube/annulus circuit; and
(c) the square nosed slugging mode of fluidization.
Based on these theories a rational design basis for a circulating draft tube fluidized bed is provided, which allows the solids circulation rate and gas crossflow between the zones to be predicted, for particular operating conditions and design configurations.
This thesis is divided into three major areas concerning each of these theories, individually, and a fourth dealing with their application to coal gasification.
Zonal separation of reactions in a draft tube fluidized bed has not been previously reported and a qualitative theory is advanced in Chapter 3 to explain the principles underlying how this may be achieved. To quantify this theory requires a knowledge of solids circulation and the fluidization state of the draft tube, which are the subjects of Chapters 4 and 5 respectively.
- 8 -
Since this thesis incorporates both experimental as well as theoretical
work, the selection of a suitable design configuration for the experimental apparatus was necessary, which would have some reasonable resemblance to the requirements for coal gasification, namely that the reactant gas flow rates should be fairly close to gasification stoichiometry while maintaining good separation between the combustion and gasification zones in the bed. In consequence, guided by the qualitative model, the effects of different operating and design conditions were empirically investigated and a suitable system geometry, in which the above requirements were met, was obtained for further
detailed examination.
A second distinguishing feature of a draft tube fluidized bed is the circulation of solids which is induced in the system. This is of importance for fines retention, dispersion, mixing, etc. and also
because of its inter-relation with gas crossflow. In Chapter 4, a model is developed for solids transport through a slugging fluidized bed, from
which circulation around the draft tube-annulus loop may be obtained. The actual slugging behaviour in the draft tube was identified by visual observation and experimental measurements to be square nosed slugging -a mode which has received scant attention in the literature and about which very little appears to be known.
As a result, in Chapter 5, a further theory, based on inter-particle stress mechanics, is formulated and presented, to explain this type of fluidization, which may have very significant advantages over other
bubbling systems, because a much higher dense phase gas flow rate occurs, which enhances gas-solid contact.
Having developed these theoretical models for solid circulation and draft tube hydrodynamic behaviour, they are applied to the zone separation model which was qualitatively presented in Chapter 3, in order to predict quantitatively the gas crossflow between the zones and
solid circulation rates. These predictions are shown to compare closely with experimental observations.
- 9 -
Chapter 6 deals with the application of these theories to develop a coal gasifier and presents the results obtained from the operation of a 1 ton coal per day pilot scale unit.
The final Chapter of the Thesis records the overall conclusions of the research program and makes some recommendations for further fundamental investigation required to continue and extend this work.
The gasifier hardware that formed the basis of the apparatus used in this work, is common to the experimental investigations of crossflow, circulation, slugging and gasification and is accordingly separately described in the next Chapter, so that only those detailed changes or additional specialist apparatus, used for particular experiments, need be further dealt with, in the Chapters following.
- 10 -
CHAPTER 2
DESCRIPTION OF GASIFIER APPARATUS
2.1 INTRODUCTION
Experimental work has been conducted in two broad areas, namely, the investigation of the hydrodynamics of the system, including gas crossflow and solids circulation phenomena, which does not require hot work, and coal gasification, based on the application of these findings.
Since the broad objective of the work is to investigate the feasibility and the development of a draft tube fluidized bed gasifier, most of the experimental work has been conducted on relatively large pilot scale equipment. While this approach avoids the many problems associated with applying bench scale experimental results to larger scales, the measurements obtained inevitably have much greater scatter due to intrusion of probes, deformations and imprecise alignments due to high temperatures and sustained robust handling, difficulties in control, precise sampling, separation of variables and so on. Nevertheless,
despite these drawbacks the results are generally more useful in engineering terms because of their better approximation to field operating conditions.
Research of this scale presents other problems also: in particular, detailed mechanical design, engineering of hardware, the provision and maintenance of ancilliary systems, safety, etc., represents a very significant but unreported proportion of the time and effort expended in each stage of the research, especially bearing in mind the hostile conditions necessary for gasification.
- 11 -
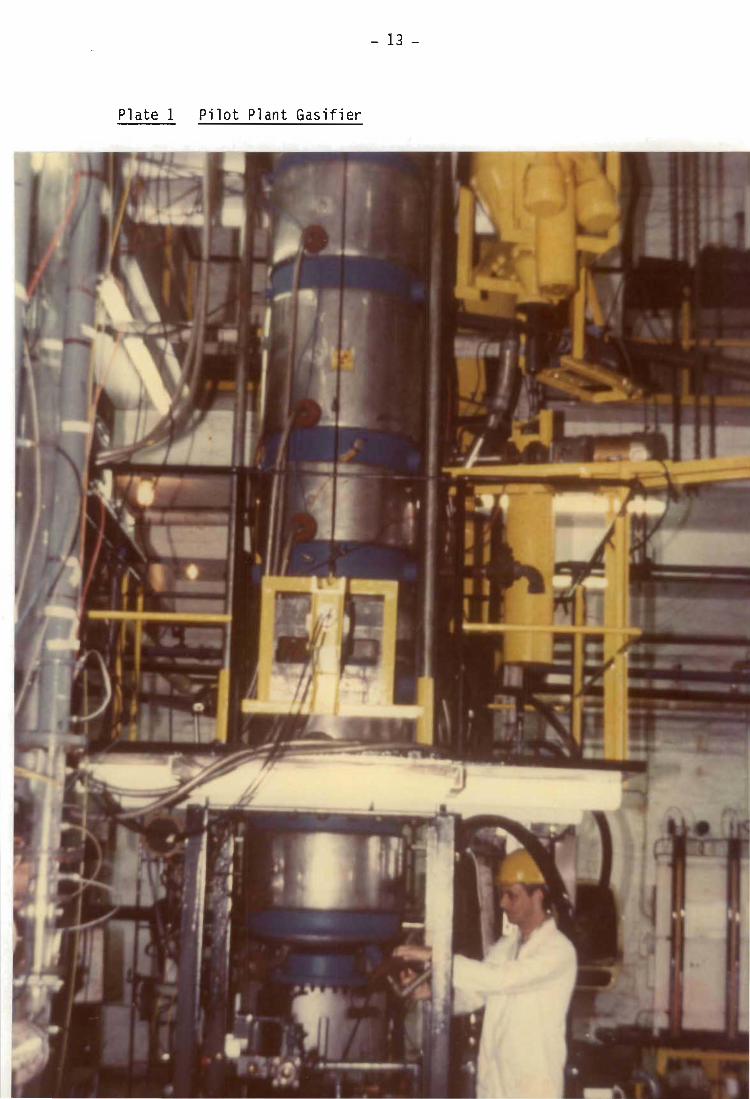
2.2 PILOT PLANT GASIFIER
The major experimental apparatus is shown diagramaticaly in Fig. 2. The main features of the system are the draft tube, discussed previously, and the internally mounted cyclones which retain the larger particles of bed material in the vessel, but allow the finer flyash to pass through. The gasifier itself, which contains the fluidized bed and in which the reactions take place, is supplied with the utilities necessary to sustain the gasification and combustion conditions. A photograph of the
main reactor unit is shown in Plate 1.
Details of the design and development of the equipment have been reported by Meihack [12J and only a brief description is included here.
2.2.1 Gasifier vessel:
The reactor consists of a 600mm diameter by 4300mm tall stainless steel vessel, internally lined with insulating refractory blanket to an operating internal diameter of 50Omm. The insulation material is held in place by an expendible stainless steel liner. The vessel is externally jacketted and cooled with recirculating cooling water.
The fluidized bed depth may be varied up to a maximum of about 2m and
the remainder of the vessel is free-board space. This free-board contains three cyclone separators operating in parallel, which return coarse carryover (>100~m) back into the annulus portion of the bed, via diplegs. Fine flyash is thus carried through the separators with the flue gases and lost from the system while coarser material is retained.
The vessel is designed and certificated as a pressure vessel, but pressurised operation has not been included in the scope of this investigation.
The bottom of the bed, on which the fluidized material rests, consists of a conical plate which also serves as a gas distributor. The chamber below this distributor plate provides a gas plenum • . This plenum is fitted with an LPG burner which is used for startup to initially heat the system to coal ignition temperature.
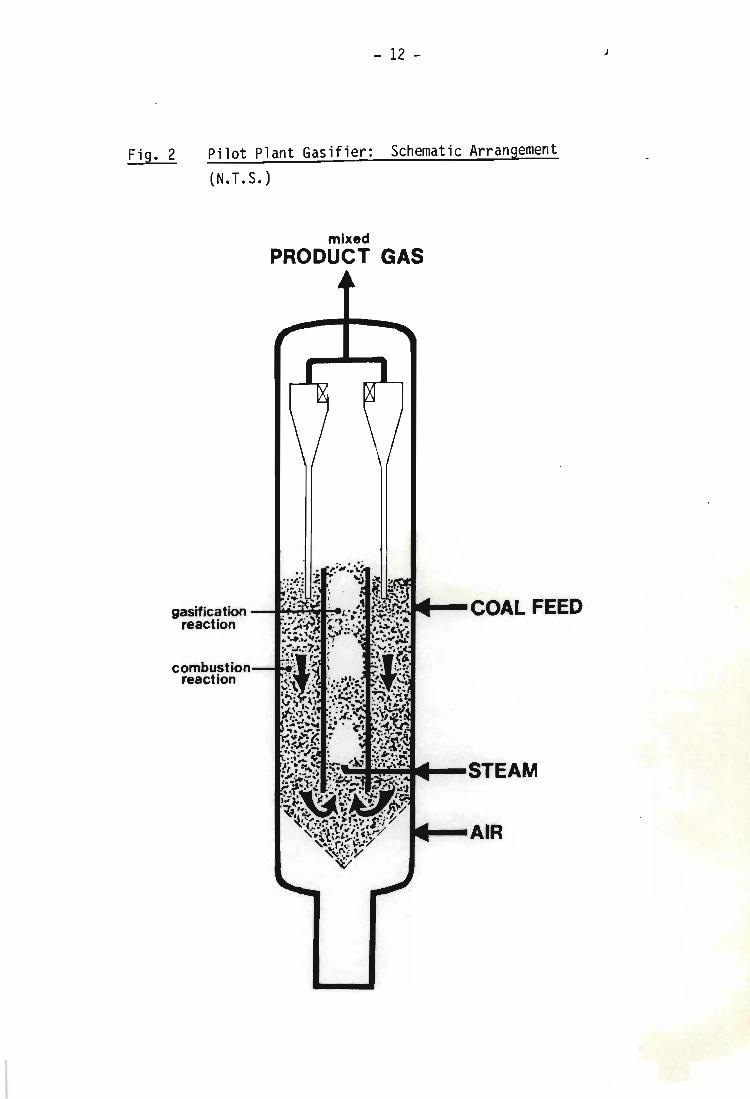
Fig. 2
- 12 -
Pilot Plant Gasifier: Schematic Arrangement
(N.T.S.)
mixed PRODUCT GAS
gasification - .... ....-.~iIF.. ~"-COAL FEED reaction
combustion-.... reaction
~~""-STEAM
"'-AIR
J
- 13 -
Plate 1 Pilot Plant Gasifier
- 14 -
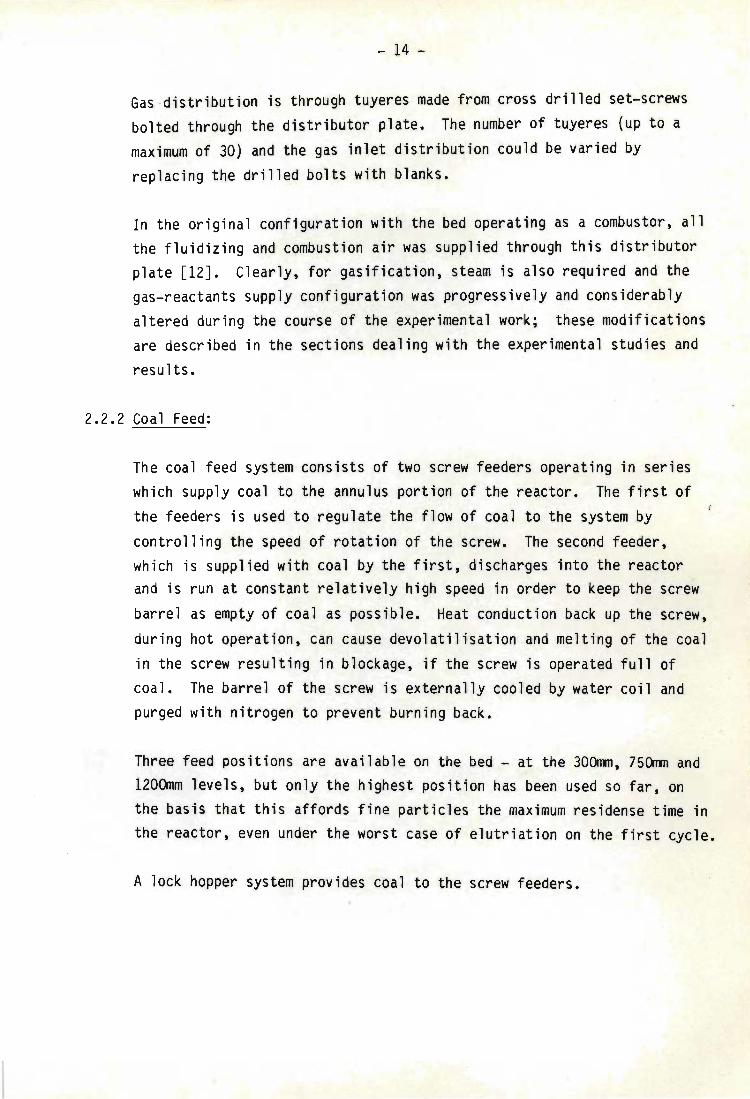
Gas -distribution is through tuyeres made from cross drilled set-screws bolted through the distributor plate. The number of tuyeres (up to a maximum of 30) and the gas inlet distribution could be varied by replacing the drilled bolts with blanks.
In the original configuration with the bed operating as a combustor, all the fluidizing and combustion air was supplied through this distributor plate [12]. Clearly, for gasification, steam is also required and the gas-reactants supply configuration was progressively and considerably altered during the course of the experimental work; these modifications are described in the sections dealing with the experimental studies and results.
2.2.2 Coal Feed:
The coal feed system consists of two screw feeders operating in series which supply coal to the annulus portion of the reactor. The first of the feeders is used to regulat e the flow of coal to the system by controlling the speed of rotat ion of the screw. The second feeder, which is supplied with coal by the f irst, discharges into the reactor and is run at constant relatively high speed in order to keep the screw
barrel as empty of coal as possible. Heat conduction back up the screw, during hot operation, can cause devo latilisation and melting of the coal in the screw resulting in blockage, i f the screw is operated full of coal. The barrel of the screw is externally cooled by water coil and purged with nitrogen to prevent burn i ng back.
Three feed positions are available on the bed - at the 30Omm, 750mm and 1200mm levels, but only the highest position has been used so far, on the basis that this affords fine particles the maximum residense time in the reactor, even under the worst case of e1utriation on the first cycle.
A lock hopper system provides coal to the screw feeders.
- 15 -
2.2.3 Draft Tube
The stainless steel draft tube is supported from the distributor plate on three legs and is held concentrically within the gasifier vessel by three supports which butt up against the tube, about half way up its
length.
The elevation of the draft tube above the distributor can be adjusted. Different draft tube diameters and lengths were used in the experiments.
I 2.2.4 Utilities
The gasifier is provided with feed facilities for compressed air, oxygen, steam and cooling water. The gas pressures are controlled by pressure regulators and the flow rates measured by orifice meters read through differential pressure cells and monitored on a microcomputer logger. The flow rates were manually adjusted.
. I
The compressed air was supplied by a dedicated screw compressor through particle and coalescing oil filters in series.
The steam supply was let down from nominally 800 kPa(g) to 400 kPa(g). A small quantity of condensate still collected in a separator fitted after the let-down valve indicating that the steam had a small residue of wetness even after pressure reduction. For practical purposes, however, the steam was taken to be in a dry, saturated condition.
The oxygen requirement was provided by evaporation from a liquid oxygen storage facility.
~ 2.2.5 Instrumentation
Besides the gasifier feed flow rates (air, steam, oxygen), many other experimental measurements are centrally monitored and logged by microcomputer. These include the product gas quality - for CO, CO
2
- 16 -
and H2 concentration, three differential pressure measurements over the fluidized bed and eight thermocouple probes. Details of the logging systems are given in ref [12].
2.2.6 Bed Pressure Drops
Pressure drop measurements may be made over all or sections of the fluidized bed. Three differential pressure cells are available, reading onto the microcomputer logger. The pressure probe lines are open ended in the fluidized bed and are aspirated in order to prevent blockage by bed material. Aspiration air rates were kept carefully balanced so that there would be no effect on differential pressure measurements.
2.2.7 Temperature
Chrome1 thermocouples are used for temperature measurement. Eight points are displayed and logged by the microcomputer, with additional points (for monitoring and controlling startup) available on a Fluke 2170A digital thermometer with multichannel switching. The gasifier vessel itself was painted with heat sensitive paint so that the occurrence of any hotspots would be readily apparent.

- 17 -
CHAPTER 3
CROSSFLOW OF REACTANTS
3.1 INTRODUCTION
One of the most important advantages to be obtained from the use of a draft tube in a fluidized bed gasifier is the ability to separate the zones in which the combustion and gasification reactions take place. By fluidizing the combustion zone at low gas rates in essentially bubble free operation, all the oxygen can be utilised, effectively eliminating afterburning and syngas reversion. Furthermore, this operation in discrete regions also allows the flue gases of combustion (that is the unwanted CO2 and N2) to be taken off separately by suitable ducting in the freeboard of the reactor, from the gasification products (namely the H2 and CO), thereby avoiding the necessity of an oxygen plant or a complex gas separation plant, while still retaining a syngas quality product.
In order to fully utilise these potential features it is necessary to maintain separation of the reactant gases supplied to the annulus and draft tubes. Thus, crossflow of air (supplied for the combustion reaction in the annulus) to the draft tube, would cause both dilution as well as reversion and after burning of the gasification product gases, and consequently lead to deterioration of the product gas quality; crossflow in the opposite direction - from the draft tube to the annulus - would result in gasification products being lost in the
waste gas stream and therefore to poor steam utilization and energy efficiency.
3.2 LITERATURE
Although the use of a draft tube fluidized bed specifically for separation of reaction zones in the draft tube and annulus has not been reported in the literature, the phenomenon of crossflow in these systems
- 18 -
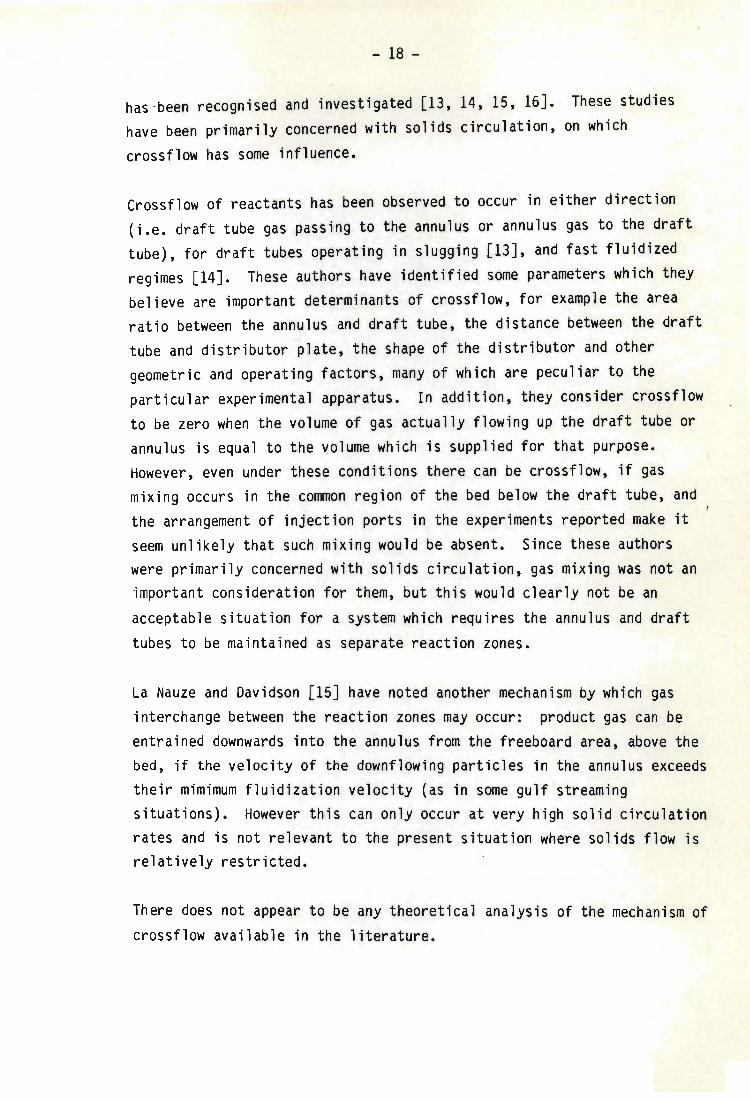
has -been recognised and investigated [13, 14, 15, 16J. These studies have been primarily concerned with solids circulation, on which
crossflow has some influence.
Crossflow of reactants has been observed to occur in either direction (i.e. draft tube gas passing to the annulus or annulus gas to the draft tube), for draft tubes operating in slugging [13J, and fast fluidized regimes [14J. These authors have identified some parameters which they believe are important determinants of crossflow, for example the area ratio between the annulus and draft tube, the distance between the draft tube and distributor plate, the shape of the distributor and other geometric and operating factors, many of which are peculiar to the particular experimental apparatus. In addition, they consider crossflow to be zero when the volume of gas actually flowing up the draft tube or annulus is equal to the volume which is supplied for that purpose. However, even under these conditions there can be crossflow, if gas mixing occurs in the common region of the bed below the draft tube, and the arrangement of injection ports in the experiments reported make it seem unlikely that such mixing would be absent. Since these authors were primarily concerned with solids circulation, gas mixing was not an important consideration for them, but this would clearly not be an acceptable situation for a system which requires the annulus and draft tubes to be maintained as separate reaction zones.
La Nauze and Davidson [15J have noted another mechanism by which gas interchange between the reaction zones may occur: product gas can be entrained downwards into the annulus from the freeboard area, above the bed, if the velocity of the downflowing particles in the annulus exceeds their mimimum fluidization velocity (as in some gulf streaming situations). However this can only occur at very high solid circulation rates and is not relevant to the present situation where solids flow is relatively restricted.
There does not appear to be any theoretical analysis of the mechanism of crossflow available in the literature.
- 19 -
3.3 THEORETICAL DEVELOPMENT
3.3.1 Principles of Crossflow
A fundamental feature of the gasifier design is the development of a density difference between the draft tube and the annulus regions, in order to provide a driving force for solids circulation. Typically, the annulus is operated near or below the minimum fluidization velocity, while the draft tube gas velocity is much higher, in the slugging, fast fluidized or pneumatic conveying regimes.
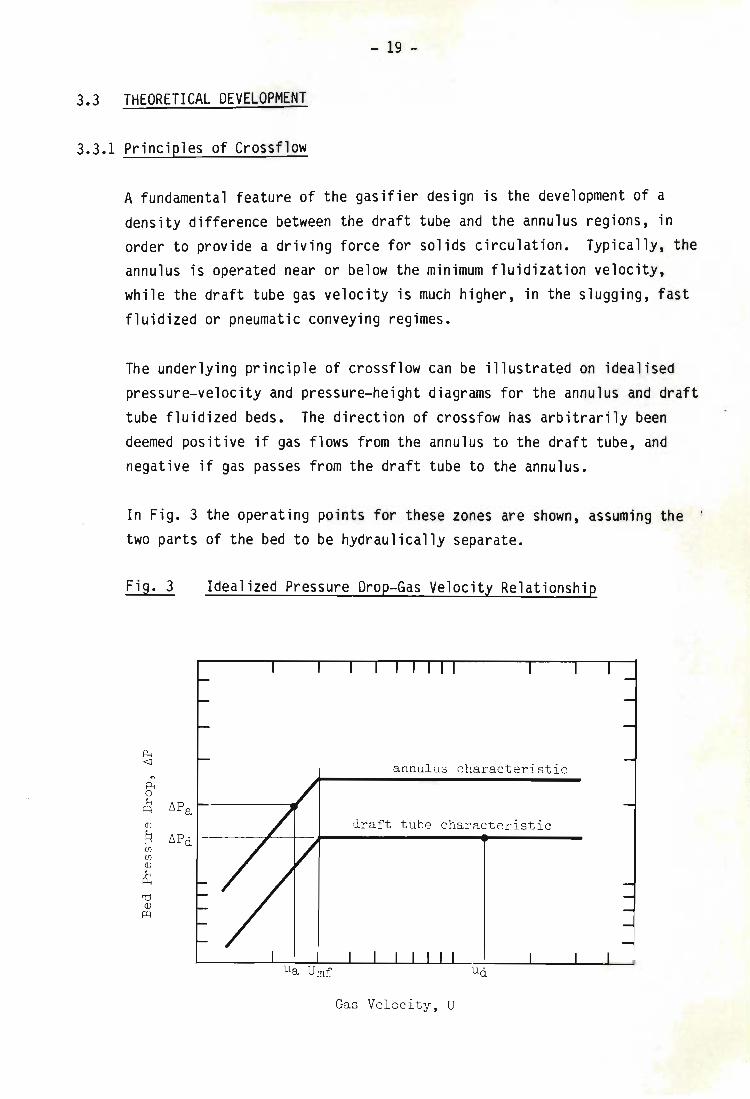
The underlying principle of crossflow can be illustrated on idealised pressure-velocity and pressure-height diagrams for the annulus and draft tube fluidized beds. The direction of crossfow has arbitrarily been deemed positive if gas flows from the annulus to the draft tube, and negative if gas passes from the draft tube to the annulus.
In Fig. 3 the operating points for these zones are shown, assuming the I
two parts of the bed to be hydraulica l ly separate.
Fig. 3 Idealized Pressure Drop-Gas Velocity Relationship
~ ~ annulus characteristic
n
~ 0 H
~Pa ~
w draft tube characteristic ~ ~Pd 00 00 W H ~
~ w ~
Gas Velocity , U
-20 -
The -high gas velocity in the draft tube results in a high voidage fraction and the pressure drop over the draft tube is consequently lower than that in the annulus.
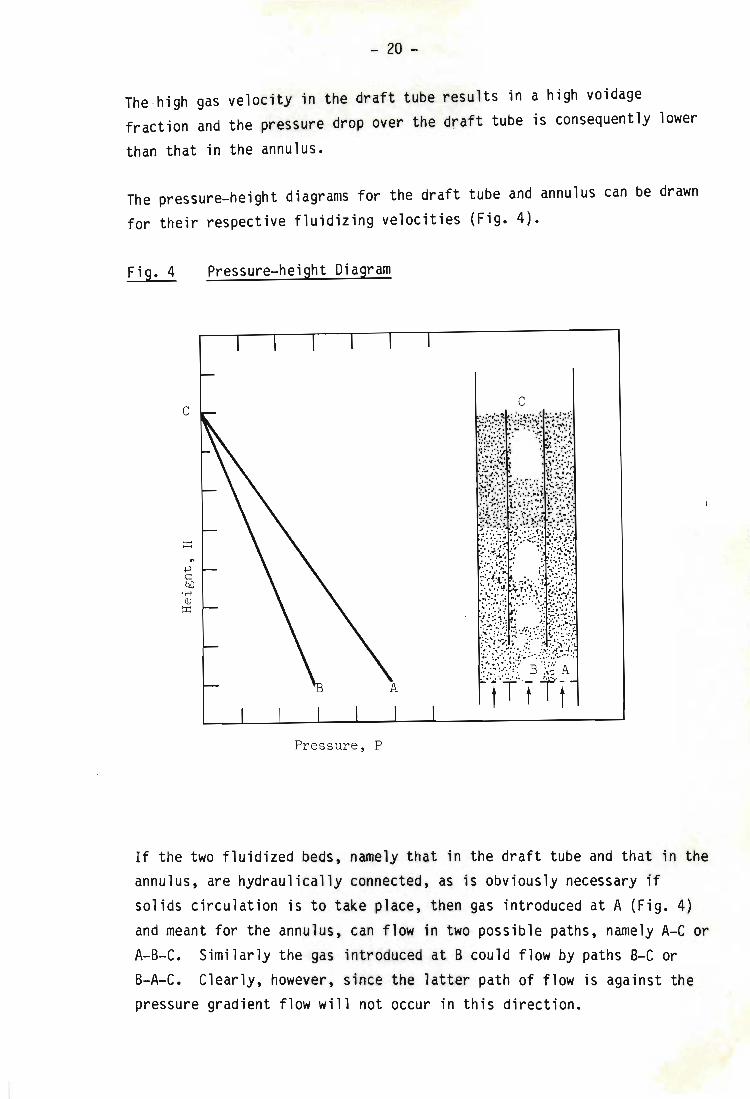
The pressure-height diagrams for the draft tube and annulus can be drawn for their respective fluidizing velocities (Fig. 4).
Fi g. 4 Pressure-height Diagram
c c
Pressure, P
If the two fluidized beds, namely that in the draft tube and that in the annulus, are hydraulically connected, as is obviously necessary if solids circulation is to take place, then gas introduced at A (Fig. 4) and meant for the annulus, can flow in two possible paths, namely A-C or A-B-C. Similarly the gas introduced at B could flow by paths B-C or B-A-C. Clearly, however, since the latter path of flow is against the pressure gradient flow will not occur in this direction.
~
~
~ OM ~ ~
- 21 -
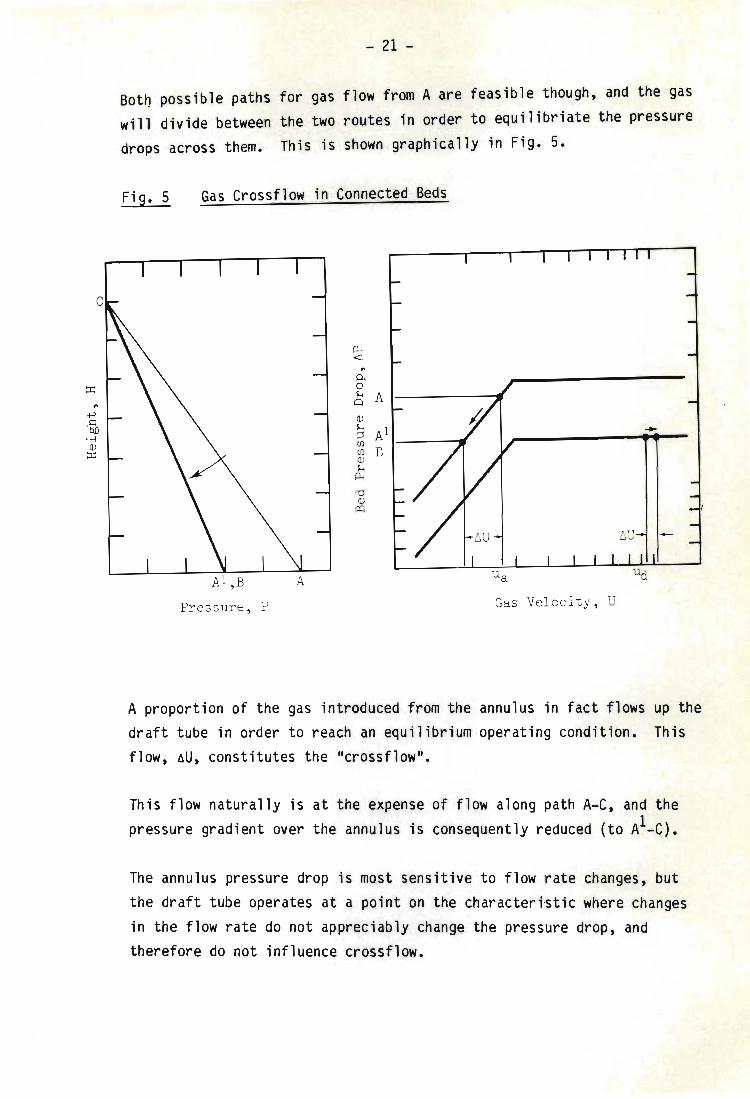
Both possible paths for gas flow from A are feasible though, and the gas will divide between the two routes in order to equilibriate the pressure drops across them. This is shown graphically in Fig. 5.
Fig. 5 Gas Crossflow in Connected Beds
~ ~
~
~ 0 H A Q
~ H ~ ~
~ ~ H ~
~ ~ ~
Pressure , P Gas Velocity , U
A proportion of the gas introduced from the annulus in fact flows up the draft tube in order to reach an equilibrium operating condition. This flow, ~U, constitutes the "crossflow".
This flow naturally is at the expense of flow along path A-C, and the pressure gradient over the annulus is consequently reduced (to AI_C).
The annulus pressure drop is most sensitive to flow rate changes, but the draft tube operates at a pOint on the characteristic where changes in the flow rate do not appreciably change the pressure drop, and therefore do not influence crossflow.
- 22 -
Strictly speaking the change in gas flow in the draft tube due to crossflow may result in a small change in draft tube voidage and consequently the operating point will move to a new characteristic.
Several effects also distort these idealized relationships, for example solids circulation, gas expansion and slugging behaviour in the draft tube. These effects do not alter the underlying principles and have been neglected in the qualitative description following, for clarity.
On this basis it is clear that significant changes may be effected to the gas flow paths within the bed, by alterations to the operation and physical geometry of the apparatus, for example by manipulating the fluidizing gas supply rates or bed inventory, or by selectively pressurizing zones within the bed, by varying the locations of the gas inlets or by changing the vertical position of the draft tube within the bed.
3.3.2 Effects of Bed Inventory
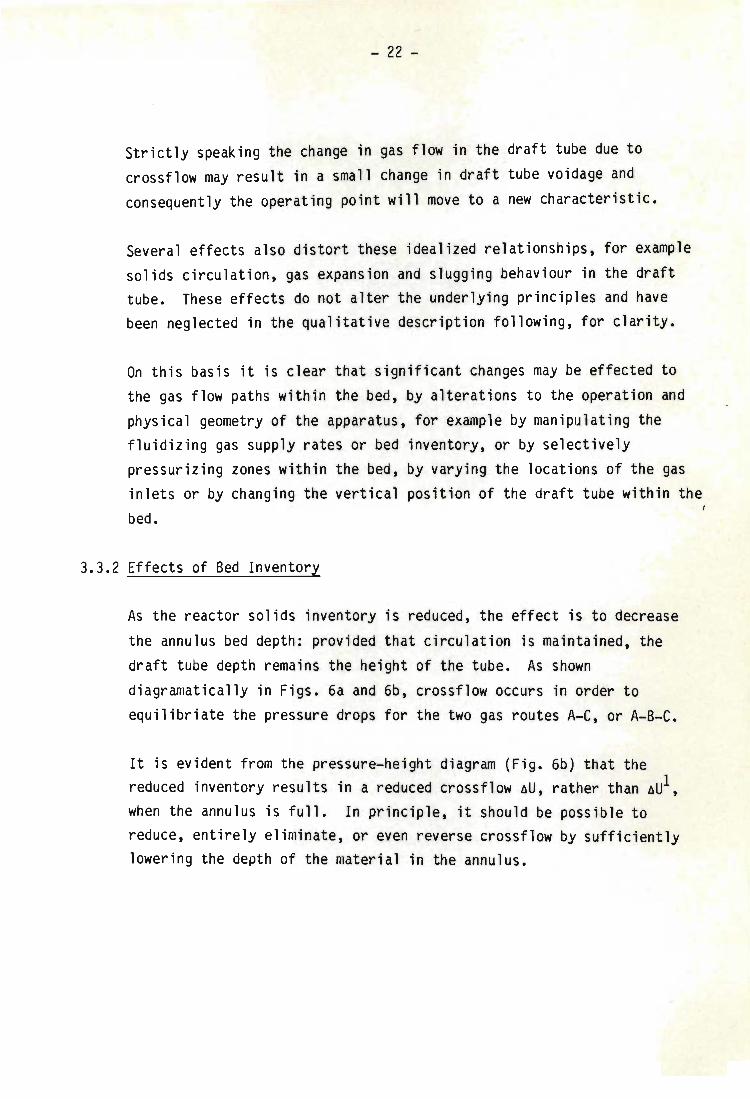
As the reactor solids inventory is reduced, the effect is to decrease the annulus bed depth: provided that circulation is maintained, the draft tube depth remains the height of the tube. As shown diagramatically in Figs. 6a and 6b, crossflow occurs in order to equilibriate the pressure drops for the two gas routes A-C, or A-B-C.
It is evident from the pressure-height diagram (Fig. 6b) that the reduced inventory results in a reduced crossflow ~U, rather than ~ul, when the annulus is full. In principle, it should be possible to reduce, entirely eliminate, or even reverse crossflow by sufficiently lowering the depth of the material in the annulus.
- 23 -
Fig. 6a Effect of Annulus Bed Depth on Crossflow
c c
B A
Pressure , P Pressure , P
(1) seperate annulus and draft tube (2) connected beds
Fig. 6b Effect on Annulus Bed Depth on Crossflow
p... annulus full <l
" P< reduced annulus level 0 H 'd
PA <1> H ;=j PAl Ul Ul <1> H P<
'd <1>
P=I
Gas velocity , U
- 24 -
The method has the serious disadvantage however pf reducing the driving force for particle circulation, which is provided by the annulus head. Nevertheless it could be an attractive means for fine-tuning the system, because it presents an easily adjusted operating variable.
3.3.3 -Draft Tube Pressurization
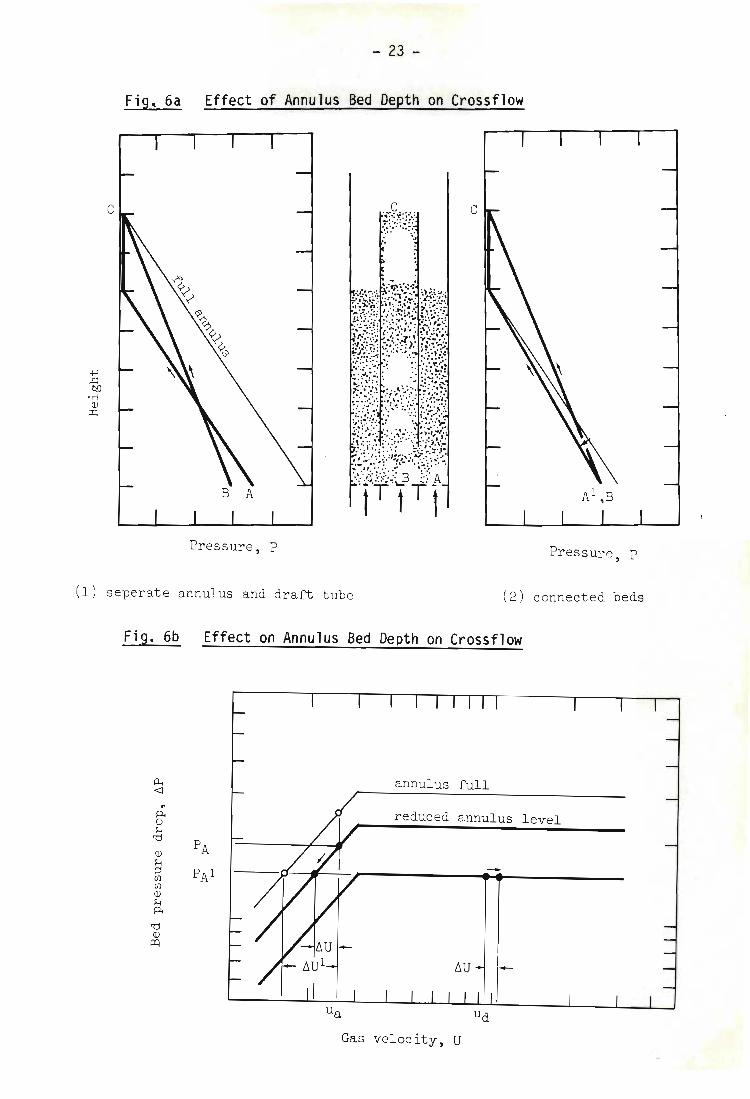
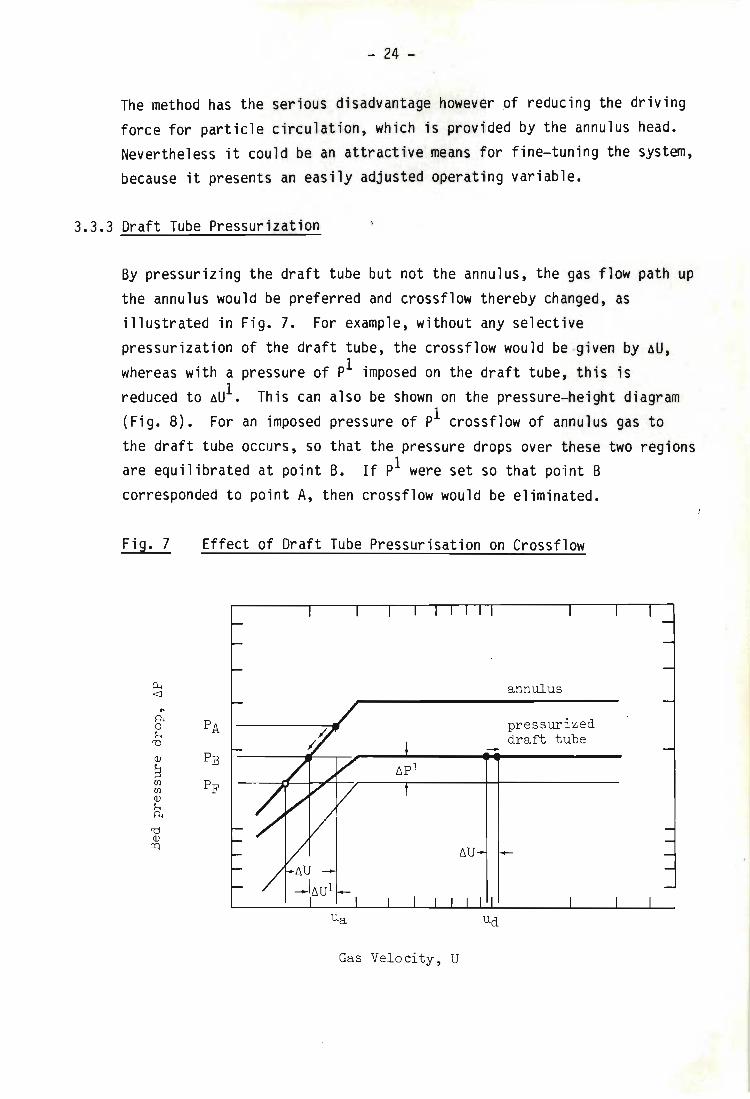
By pressurizing the draft tube but not the annulus, the gas flow path up the annulus would be preferred and crossflow thereby changed, as illustrated in Fig. 7. For example, without any selective pressurization of the draft tube, the crossflow would be ·given by 6U, whereas with a pressure of pI imposed on the draft tube, this is reduced to 6UI . This can also be shown on the pressure-height diagram (Fig. 8). For an imposed pressure of pI crossflow of annulus gas to the draft tube occurs, so that the pressure drops over these two regions are equilibrated at point B. If pI were set so that point B corresponded to point A, then crossflow would be eliminated.
Fig. 7 Effect of Draft Tube Pressurisation on Crossflow
~ annulus ~
~
~ PA pr essurized 0 ~ draft t ube ~
v PB ~ 00 PF 00 v ~ ~
~ v ~
Gas Velocity , U
- 25 -
Fig. 8 Effect of Draft Tube Pressurisation on Crossflow
c c
Pressure , P Pressure , P
(1) seperate beds (2) connected beds
3.3.4 Gas Inlet Positions
3.3.4.1 Annulus Gas Inlet
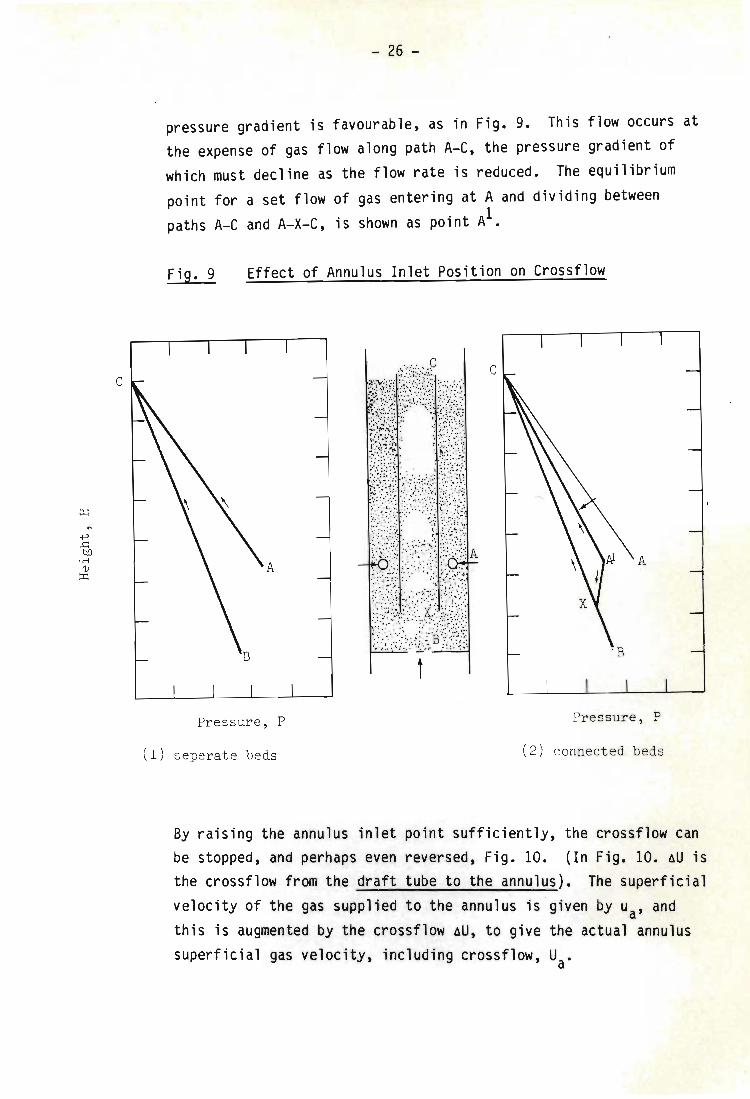
If the annulus gas inlet is moved progressively higher up the annulus, maintaining a constant bed depth, the gas pressure drop up the annulus is reduced and the tendency for gas to crossflow to the draft tube should be correspondingly lower. With reference to Fig. 9, if no crossflow were to occur, i.e. if the beds were hydraulically separate, the pressure height relationship would be given by A-C for the annulus and B-C for the draft tube. However, the gas introduced at A has the alternative path A-X-C in the conncected beds and some gas flow will Occur along this path if the
c
- 26 -
pressure gradient is favourable, as in Fig. 9. This flow occurs at the expense of gas flow along path A-C, the pressure gradient of which must decline as the flow rate is reduced. The equilibrium point for a set flow of gas entering at A and dividing between paths A-C and A-X-C, is shown as point AI.
Fig. 9 Effect of Annulus Inlet Position on Crossflow
.. . C c
"::i' .. :.,::;
A
~: ~~< : .:.:~ : ~ -. ' ,- , '
·:/X·j; :.:.<.;~.:{. rC~{; A
~1\~lii~~i;0l1 A
t
Pressure , P Pressure , P
(1) seperate beds (2) connected beds
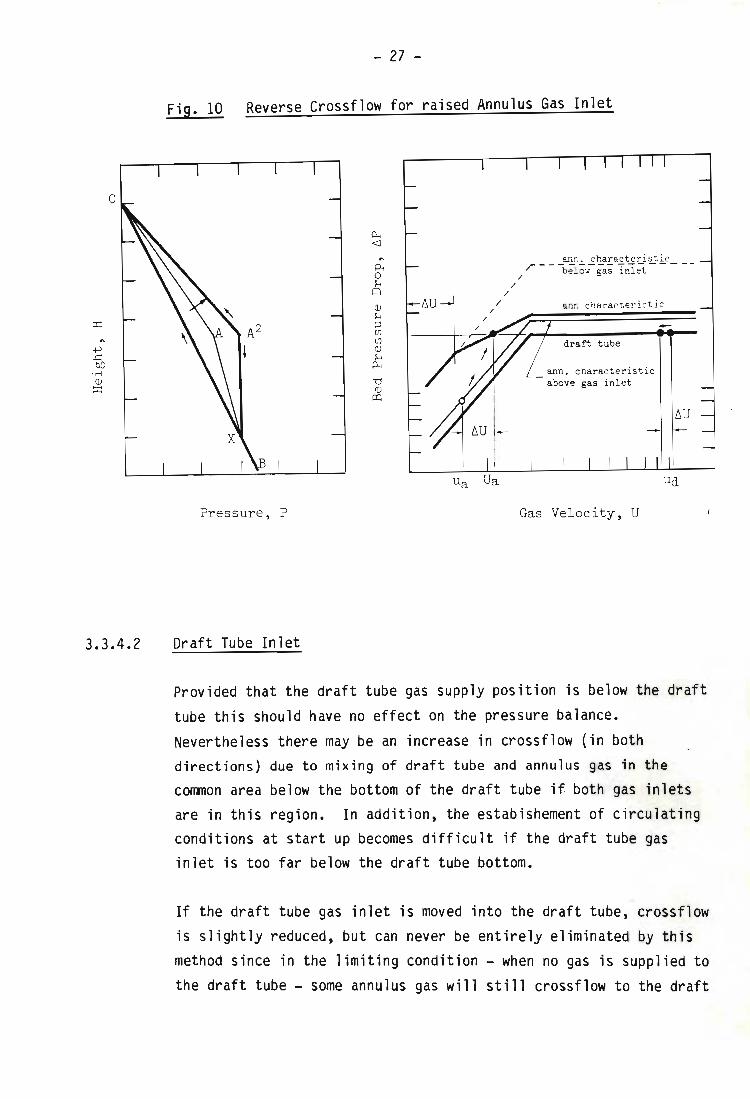
By raising the annulus inlet point sufficiently, the crossflow can be stopped, and perhaps even reversed, Fig. 10. (In Fig. 10. ~U is the crossflow from the draft tube to the annulus). The superficial velocity of the gas supplied to the annulus is given by u
a' and
this is augmented by the crossflow ~U, to give the actual annulus superficial gas velocity, including crossflow, U
a•
c
3.3.4.2
- 27 -
Fig. 10 Reverse Crossflow for raised Annulus Gas Inlet
Pressure , P
Draft Tube Inlet
ann . characteristic .r- -- - ---- --- - --- -/ belo~ gas inlet /
/
/ ann characteristic
dr aft t ube
ann . char acteristic above gas inlet
Gas Vel ocit y , U
!:IU
Provided that the draft tube gas supply position is below the draft tube this should have no ef fect on the pressure balance. Nevertheless there may be an increase in crossflow (in both directions) due to mixing of draft tube and annulus gas in the
corrrnon area below the bottom of the draft tube if both gas inlets are in this region. In addition, the estabishement of circulating conditions at start up becomes difficult if the draft tube gas inlet is too far below the draft tube bottom.
If the draft tube gas inl et is moved into the draft tube, crossflow is slightly reduced, but can never be entirely eliminated by this method since in the limit i ng condition - when no gas is supplied to the draft tube - some annulus gas will still crossflow to the draft
- 28 -
tube. (Negative crossflow - from the draft tube to the annulus -could of course be controlled in this way). Circulation is adversely affected since the density difference between the draft tube and annulus is progressively reduced as smaller lengths of draft tube operate under slugging conditions.
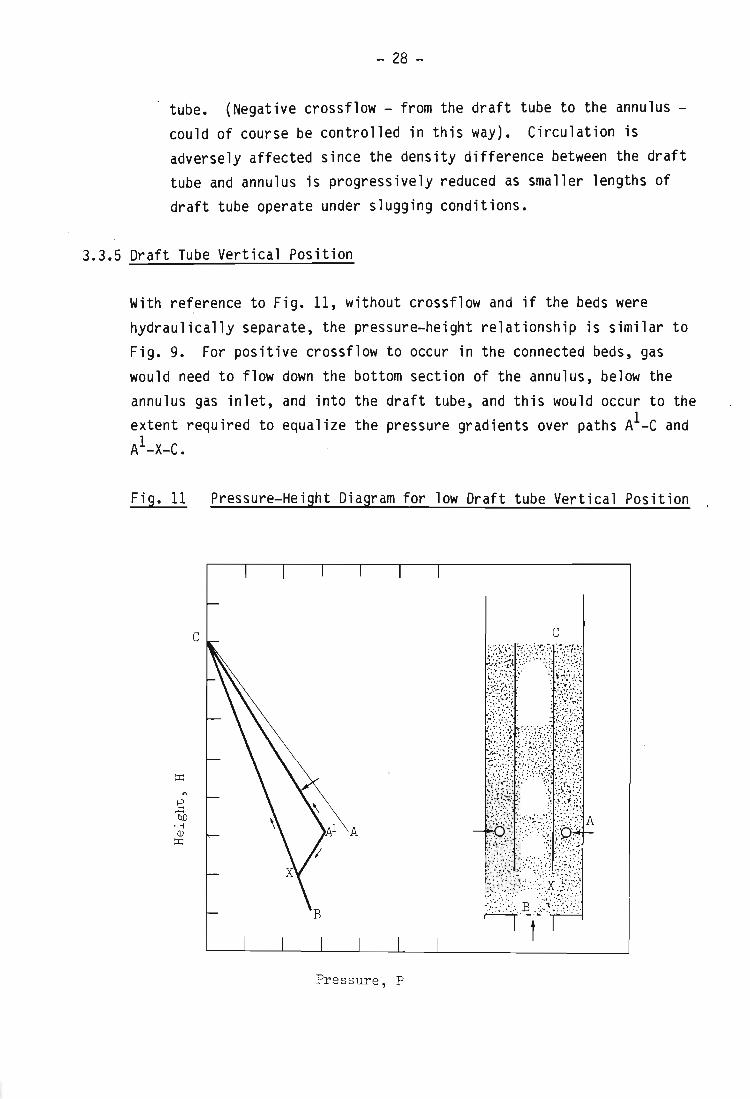
3.3.5 Draft Tube Vertical Position
With reference to Fig. 11, without crossflow and if the beds were , hydraulically separate, the pressure-height relationship is similar to Fig. 9. For positive crossflow to occur in the connected beds, gas would need to flow down the bottom section of the annulus, below the annulus gas inlet, and into the draft tube, and this would occur to the extent required to equalize the pressure gradients over paths AI_C and 1 A -X-C.
Fig. 11 Pressure-Height Diagram for low Draft tube Vertical Position
c c
A
Pr essure , P
- 29 -
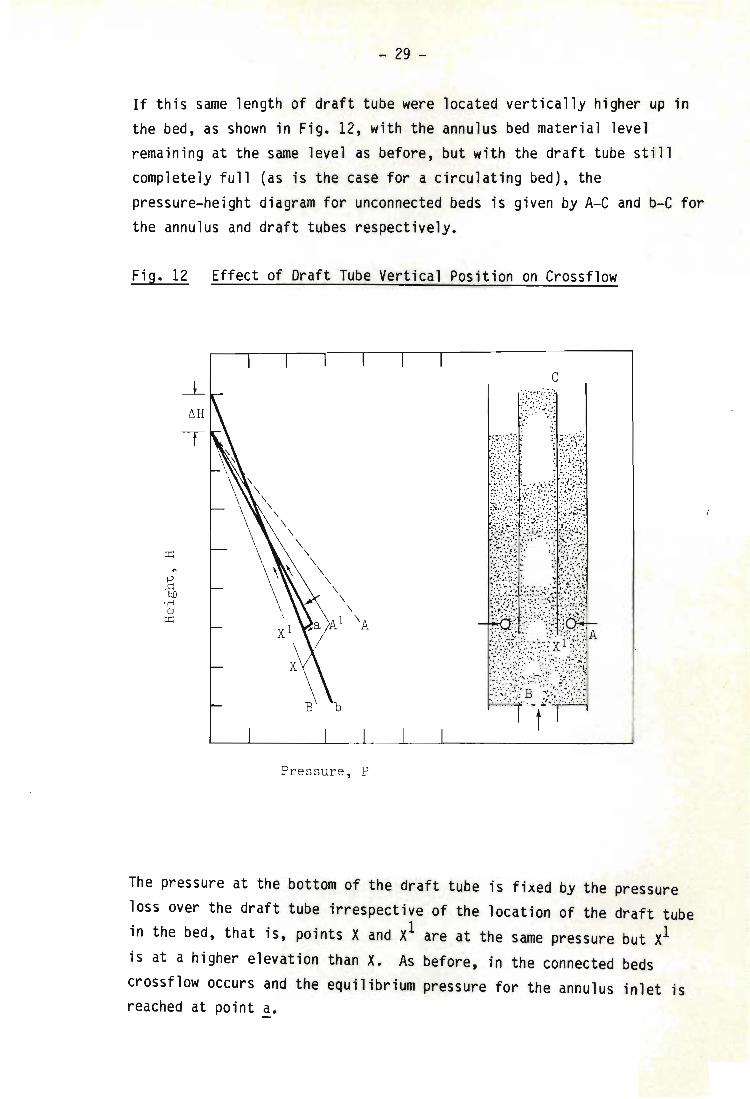
If this same length of draft tube were located vertically higher up in the bed, as shown in Fig. 12, with the annulus bed material level remaining at the same level as before, but with the draft tube still completely full (as is the case for a circulating bed), the pressure-height diagram for unconnected beds is given by A-C and b-C for the annulus and draft tubes respectively.
Fig. 12 Effect of Draft Tube Vertical Position on Crossflow
c
w;,;:;\ .. : .. ; .... ' .. _.:-...... :\.::~ ..... : ;Y:~X : '/ .', .... ... . .~ .:.' .. : .. i. ..• ::.;.:,.: .. ~':~:~f ::: ~
b
t L-~ __ ~ __ ~_~ __ ~ __ L-______________ ~
Pressure, P
The pressure at the bottom of the draft tube is fixed by the pressure loss over the draft tube irrespective of the location of the draft tube in the bed, that is, points X and Xl are at the same pressure but Xl is at a higher elevation than X. As before, in the connected beds crossflow occurs and the equilibrium pressure for the annulus inlet is reached at pOint !.
- 30 -
Notlng that for a high flow, the slope of a line on the pressure height diagram will be shallow, it is clear t hat point ~ must lie inside of point AI. If it were at a higher pressure than AI, then the slopes of both a-C and a_Xl would be shallower than for AI_C and AI_X.
This would imply a simultaneous increase in both the flow up the annulus and crossflow from the annulus to the draft tube, which is impossible for a fixed annulus gas supply rate.
If the pressure at b is ever greater than the pressure at A, then crossflow occurs from the draft tube to the annulus. If this crossflow is sufficient for the annulus fluidization velocity to exceed Umf , then a switch occurs, and the whole bed is evenly fluidized. This switch also occurs if the draft is raised above the annulus gas inlet position (ignoring jetting effects).
By the above argument (and for the draft tube below the annulus gas inlet), as the draft tube is raised the crossflow would be expected, on the basis of the pressure balance alone, to increase.
- 31 -
3.4 EXPE~IMENTAL RESULTS AND DISCUSSION
3.4.1 Introduction
Based on this qualitative analysis it is apparent that the rate of crossf10w between the annulus and draft tube sections of the bed can be significantly altered by changes in the operation and geometry of the system - not only by manipulating the gas supply rates to the annulus and draft tube, but also by altering the bed inventory, varying the gas supply positions, or by changing the vertical position of the draft tube.
In this work, crossflow has been studied experimentally as well as theoretically. The theoretical model for quantitatively solving the pressure balance is presented in the next two Chapters. In this section, experimental results including a description of the apparatus used and the procedure employed to make these measurements, are presented, in order to illustrate the degree to which the trends
predicted by the pressure balance model correspond with the experimental
observations, and to indicate the relative importance of the various changes.
The primary objective of the experimental study, at this stage, was to find a suitable system configuration and operating conditions, in which crossflow was mimimal and with approximately the desired gas flow proportions for gasification stoichiometry, which could be used as the basis for a gasifier design. Since there was no theoretical and little
experimental guidance upon which to base the design for the experimental apparatus available in the literature, an initial configuration (using a 200 mm diameter by 1,8 m long draft tube) which circulated well, with the desired gas rates supplied to the different regions, was used as the starting point for crossflow investigation.
Experiments showed that a large degree of crossflow was occuring in this system and it soon became apparent that the gas pres·sure drop over the
draft tube, could not be easily related to the flow up it, by
I
- 32 -
conventional fluidization theories. As a result the apparatus was modified on a trial and error basis, guided by the qualitative pressure balance model, in order to obtain a configuration more or less fulfilling the above requirements.
This design, which should then bear some reasonable resemblence to the desired gasifier configuration, could then be used as the basis for a more detailed study, in terms of solids circulation rates and draft tube fluidization hydrodynamics, in order to develop a model to describe, optimize and scale the apparatus.
In Chapter 5, after the quantitative theoretical model has been developed, we will return to these experimental crossflow results, in order to compare them with the values predicted by the model.
3.4.2 Effect of Operating Conditions
3.4.2.1 Apparatus and Method
The experimental equipment used to investigate the effect of operating conditions - that is, the rate of gas supply to the annulus and draft tube, the depth of bed material in the annulus and the pressurization of the draft tube, is generally as described in Chapter 2.
For the most part a 200 mm diameter draft tube of 1,8 m length was used - a system which had been found to circulate strongly with gas supply rates to the annulus and draft tube around those necessary for gasification. In the actual sequence of experiments it was only because of the poor performance of this configuration under gasification conditions, that the importance of crossflow on product gas quality was realized and a systematic investigation undertaken, to establish a theoretical and empirical foundation for this phenomenon (see also Chapter 6).
- 33 -
- For the crossflow measurements the annulus was fluidized with pure oxygen and the draft tube with air. By continuously recording the oxygen concentrations in the draft tube and the annulus regions (about 100 mm below the top of the draft tube), the actual flows including crossflow could be calculated, by mass balance.
For comparative purposes these mass flow rates have been converted to superficial gas velocities and shown as ratios of the minimum fluidizing velocity. Where crossflow rates are reported, the superficial velocity due to crossflow, Ux,d' has arbitrarily been based on the draft tube cross-sectional area.
The gas samples were continuously withdrawn from the bed by vacuum pumps, through foam rubber particle filters, to the oxygen meters and chart recorder. In all the crossflow measurements some short term variations in the measured oxygen concentrations were apparent, and the results reported represent a time averaged figure at the particular experimental condition.
,
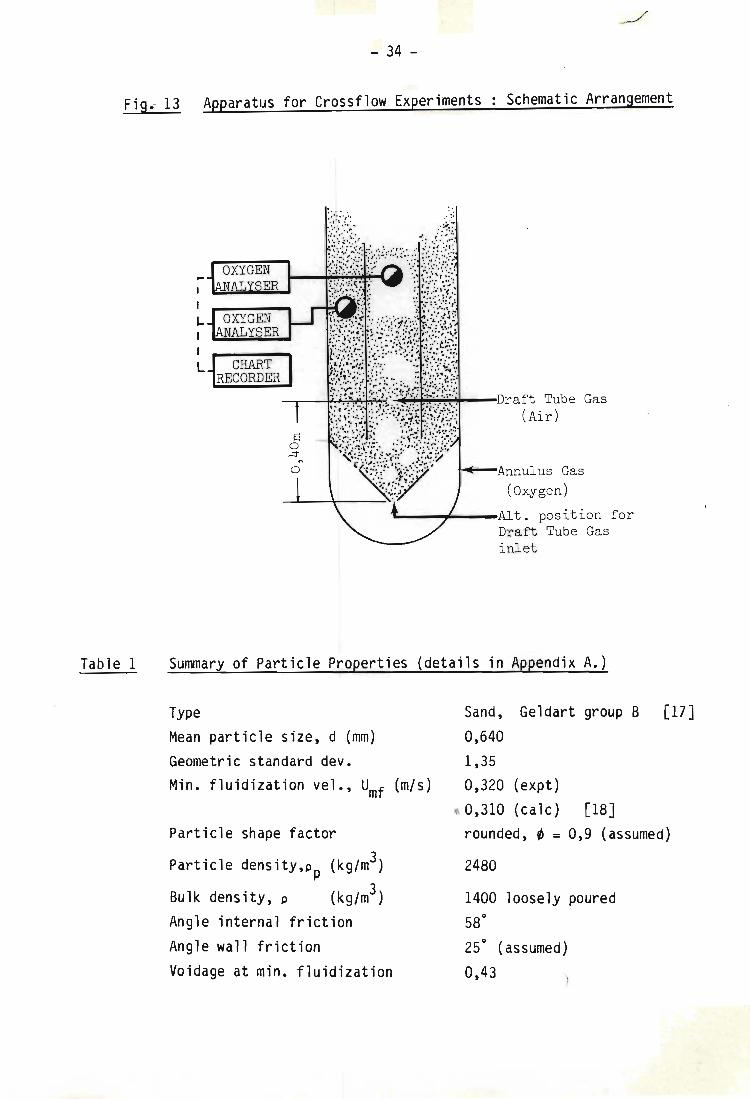
A schematic layout of the apparatus is given in Fig. 13 which also shows the different locations at which fluidizing gas could be injected. The properties of the sand, which was used as the bed material in these and all following experiments is given in Table 1.
In an experiment the apparatus was initially filled with sand to the required depth and fluidization started. It was sometimes necessary to give the draft tube an initial blast of gas, at a high flow rate, in order to initiate circulation, which was generally stable thereafter. Experimental conditions under which circulation was weak or difficult to sustain, were disregarded. Circulation of the solid particles was visually monitored from the top of the bed. Further sand was added or drained from the bed as necessary, in order to set the fluidized annulus at the desired bed depth. Once the required gas flow rates had been set, stable conditions were almost immediately achieved and the oxygen concentrations were recorded for a suitable period, to enable visual averaging of the recorder trace.
- 34 -
Fig. 13 Apparatus for Crossflow Experiments Schematic Arrangement
Table 1
I
I
~
I
L
---,----+<--~~.;.;..: "';"~~~~-D. raft Tube Gas
s o ...:j"
"
(Air)
Annulus Gas (Oxygen)
~-_"'---Alt . pos i tion for Draft Tube Gas inlet
Summary of Particle Properties (details in Appendix A.)
Type
Mean particle size, d (mm) Geometric standard dev. Min. fluidization vel., Umf (m/s)
Particle shape factor
Particle density,pp (kg/m3)
Bulk density, p (kg/m3) Angle internal friction Angle wall friction
Voidage at min. fluidization
Sand, Geldart group B [17J 0,640 1,35 0,320 (expt)
(\ 0,310 (calc) [18J rounded, ~ = 0,9 (assumed)
2480
1400 loosely poured 58°
25° (assumed) 0,43
- 35 -
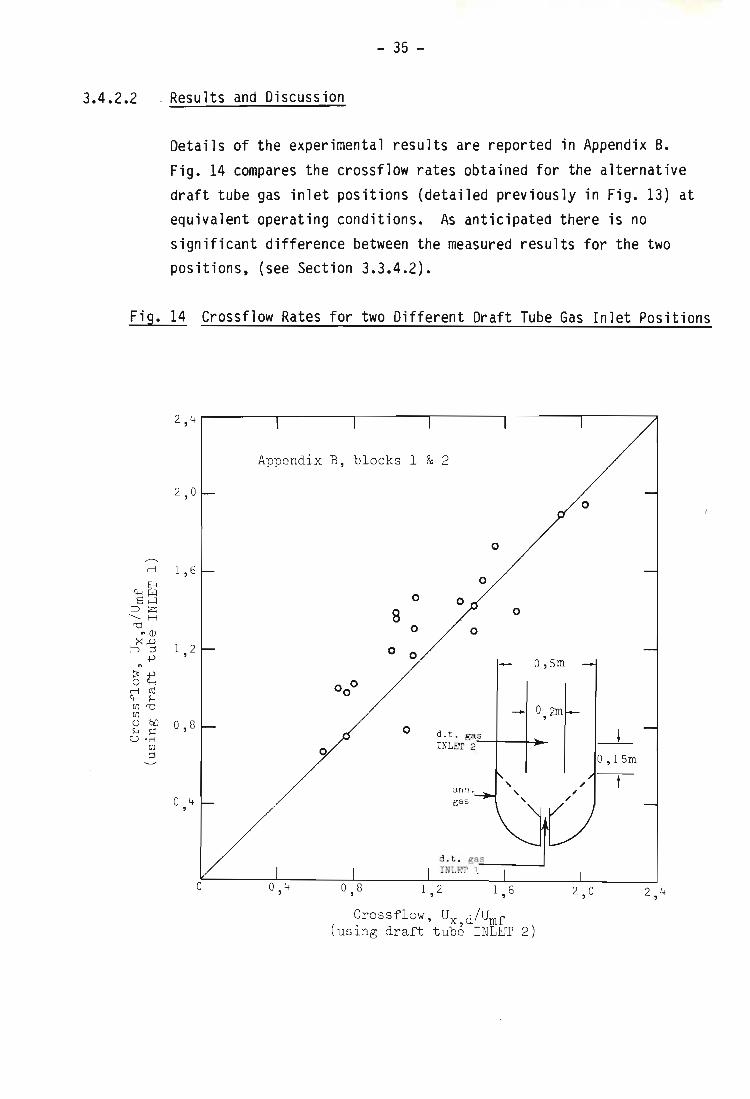
3.4.2.2 - Results and Discussion
Details of the experimental results are reported in Appendix B. Fig. 14 compares the crossflow rates obtained for the alternative draft tube gas inlet positions (detailed previously in Fig. 13) at equivalent operating conditions. As anticipated there is no significant difference between the measured results for the two positions, (see Section 3.3.4.2).
Fig. 14 Crossflow Rates for two Different Draft Tube Gas Inlet Positions
2 , 4
2 , 0
rl 1 , 6 8
r..-..~ S~
;:J:<:=; '- H
'1j ,, (1)
><..0 1 , 2 ;:J ;:l +'
" ~ +' o r..-.. rl aJ r..-.. H UJ'1j UJ 0 bD 0 , 8 H >=:
U ' rl UJ ;:l
° 4 ,
Appendi x B, blocks 1 & 2
0
8 0
0 0
o 0 0
0
0 , 8
0
0
0
0 , 5m
o 2m , d . t. gas INLEl' 2
gas
d .t . ga . .:.:..s __ ~
IN1El' 1
1, 2 1 , 6
Crossflow , Ux d/Umf (using draft t ube I NLET 2)
0
--L 0 ,1 5m
2 , 0 2 , 4
- 36 -
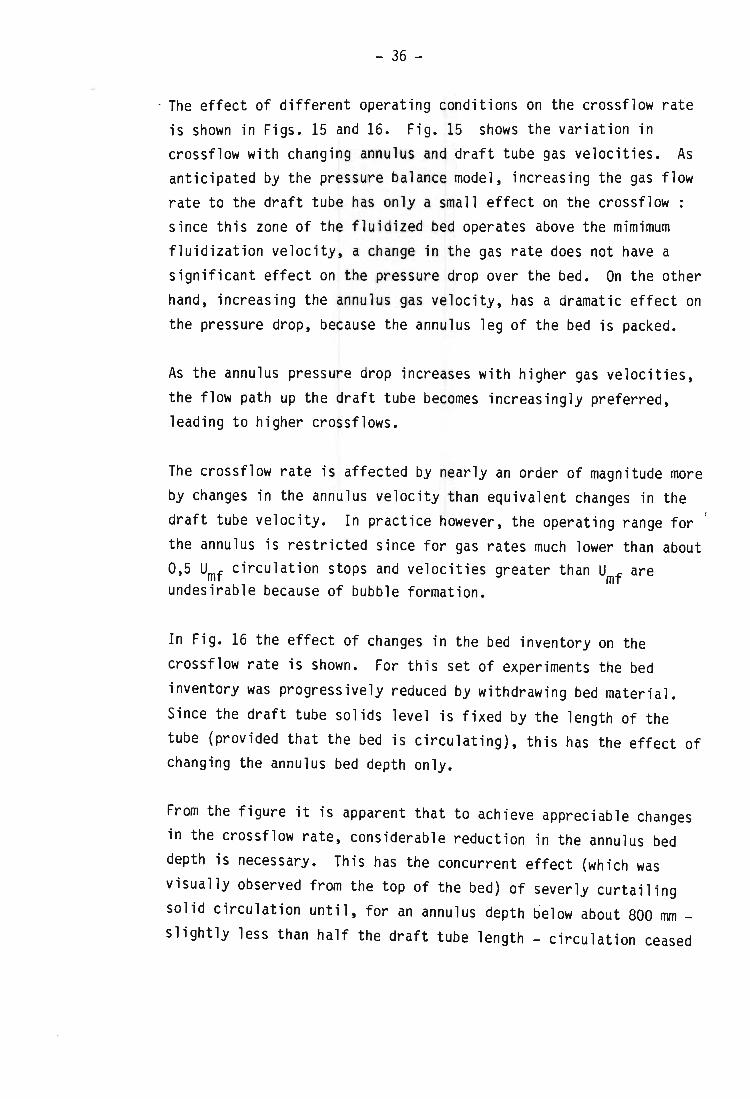
- The effect of different operating conditions on the crossflow rate is shown in Figs. 15 and 16. Fig. 15 shows the variation in crossflow with changing annulus and draft tube gas velocities. As anticipated by the pressure balance model, increasing the gas flow rate to the draft tube has only a small effect on the crossflow since this zone of the fluidized bed operates above the mimimum fluidization velocity, a change in the gas rate does not have a significant effect on the pressure drop over the bed. On the other hand, increasing the annulus gas velocity, has a dramatic effect on the pressure drop, because the annulus leg of the bed is packed.
As the annulus pressure drop increases with higher gas velocities, the flow path up the draft tube becomes increasingly preferred, leading to higher crossflows.
The crossflow rate is affected by nearly an order of magnitude more by changes in the annulus velocity than equivalent changes in the draft tube velocity. In practice however, the operating range for the annulus is restricted since for gas rates much lower than about 0,5 Umf circulation stops and velocities greater than Umf are undesirable because of bubble formation.
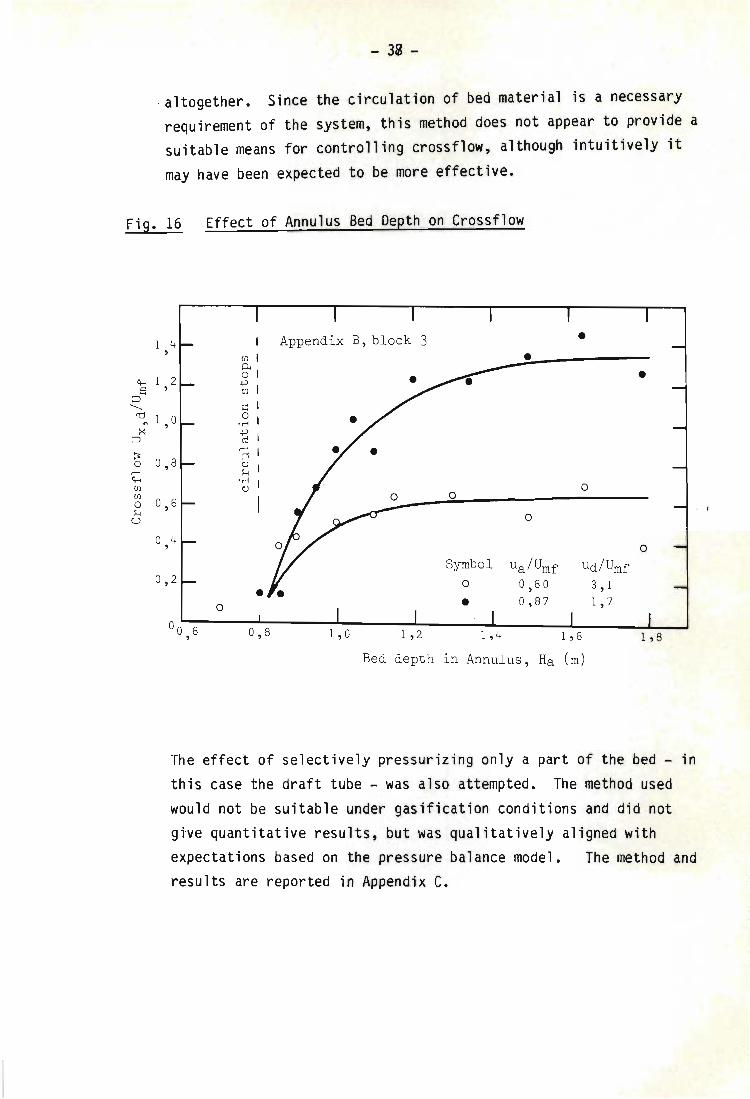
In Fig. 16 the effect of changes in the bed inventory on the crossflow rate is shown. For this set of experiments the bed inventory was progressively reduced by withdrawing bed material. Since the draft tube solids level is fixed by the length of the tube (provided that the bed is circulating), this has the effect of changing the annulus bed depth only.
From the figure it is apparent that to achieve appreciable changes in the crossflow rate, considerable reduction in the annulus bed depth is necessary. This has the concurrent effect (which was visually observed from the top of the bed) of severly curtailing solid circulation until, for an annulus depth below about 800 mm _ slightly less than half the draft tube length - circulation ceased
c.-..
Jl "-
<d ... ><: ~
... ~ 0 rl '+~ Ul Ul 0 H
u
Fig. 15 Effect of Annulus and Draft Tube Gas Velocities on Crossflow.
2 ' 5 ~'--------r-------~--------'---------r--------r--------lr--------r--------r--------l
2 , 0
1 5 ,
1 , 0
0 , 5
o 0 , 5
I lia/Umf
Symbol ud/Um£,
1 , 0
• ()
o ()
2 5 , 3 , 0 3 , 5 4 , 0
1 , 5 2 , 0
•
! ud/Umf
Symbol ua/Umf
2,5
• ()
o ()
1 ,0
0 , 9 0 , 8 0 , 7
3, 0
Appendix B, bl ock 1
o
o 0
~
3 , 5 4 0 ,
Superficial Gas Velocity , u/Umf
(to annulus zone) (to draft tube zone)
4 5 ,
W -....J
- 32 -
_ altogether. Since the circulation of bed material is a necessary requirement of the system, this method does not appear to provide a suitable means for controlling crossflow, although intuitively it
may have been expected to be more effective.
Fig. 16 Effect of Annulus Sed Oepth on Crossflow
4 Appendix B, block 3 • 1 , Ul l •
1 2 ~ I • r.-. i;; 1 :::>s
, ---.. s:: I
rc; 1 0 X ' .8 I
:::> ~ 0 rl r.-. Ul Ul 0 H
U
~ I
0 , 8 3 1
~ I 'M U 0
0 0 , 6
0
0 4 , 0
Symbol ua/Umf Ud/Umf 0 , 2 0 0 , 60 3 , 1
0 • 0 , 87 1 , 7
00 6 0 , 8 1 , 0 1 , 2 1 , 4 1 , 6 1 , 8 , Bed depth in Annulus , Ha (m)
The effect of selectively pressurlzlng only a part of the bed - in
this case the draft tube - was also attempted. The method used would not be suitable under gasification conditions and did not give quantitative results, but was qualitatively aligned with
. I
expectations based on the pressure balance model. The method and results are reported in Appendix C.
- 39 -
- On the basis of these experiments the only easily controlled operating variable which can be used to adjust the crossflow rate is the annulus gas velocity. Unfortunately this also appears to be the limiting factor in the throughput of the system used as a gasifier. For a given vessel size, this annulus gas rate should be as high as possible, but not exceeding the minimum fluidizing velocity beyond which bubbling (and hence oxygen bypass) may occur.
As a result it would seem necessary that the geometry of the system be so designed that crossflow is negligible at the desired operating point, and that annulus inventory or gas velocity be used only for fine tuning the system.
In order to proceed with the experimental program a 2/5 scale perspex model of the pilot plant gasifier apparatus was constructed. The primary purpose was to enable the effects of bed configuration to be systematically investigated, because of the engineering difficulties in suitably modifying the larger equipment ' and the limitations imposed on the possible changes to the geometry, by the requirement that the pressure integrity of the vessel be retained. In addition, operation on different sizes of equipment would give useful information on any scale-related complications that might be encountered.
3.4.3 Effect of Geometric Configuration
3.4.3.1 Apparatus and Method
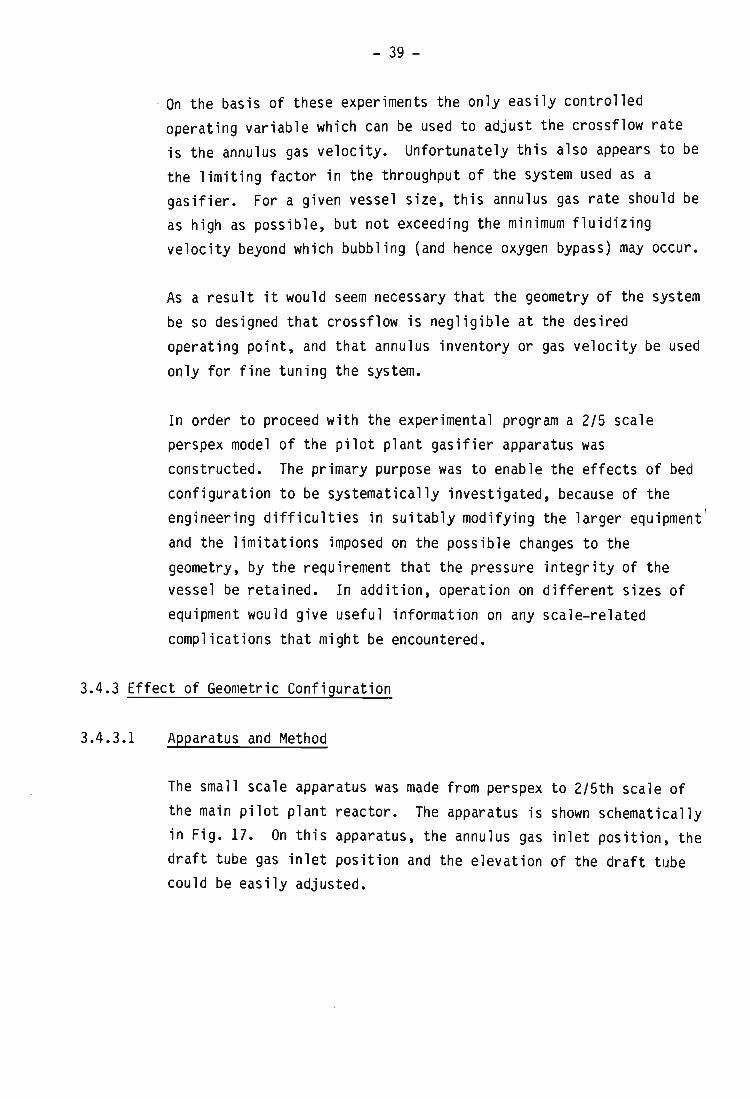
The small scale apparatus was made from perspex to 2/5th scale of the main pilot plant reactor. The apparatus is shown schematically in Fig. 17. On this apparatus, the annulus gas inlet position, the draft tube gas inlet position and the elevation of the draft tube could be easily adjusted.
- 40 -
Fig. 17 Schematic Diagram of small-scale Apparatus
OXYGEN ANALIZER
OXYGEN ANALIZER ANNULUS
GAS
DRAFT TUBE GAS
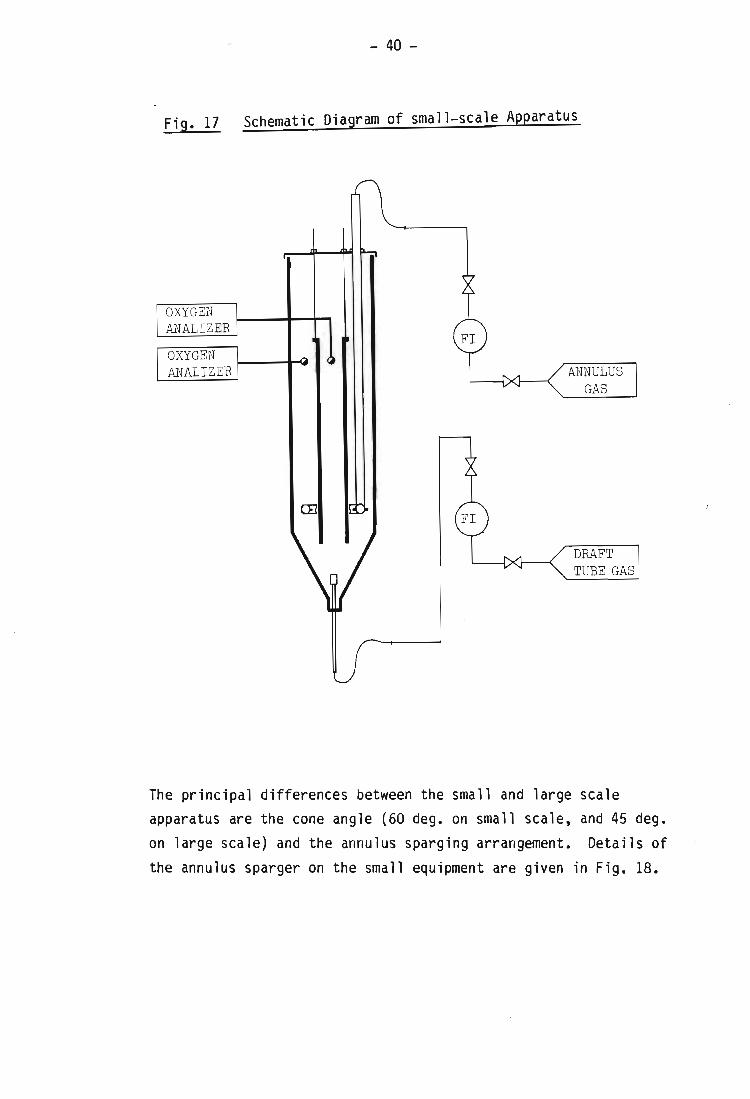
The principal differences between the small and large scale apparatus are the cone angle (60 deg. on small scale, and 45 deg. on large scale) and the annulus sparging arrangement. Details of the annulus sparger on the small equipment are given in Fig. 18.
- 41 -
Fig. 18 Annulus Sparger detail for Small Scale Apparatus
3.4.3.2
O, 16m --I 15mm Copper p i pe
~:...-____ ......a_ - bicycle non- ret ur n val ves
Fluidization gas is independently supplied through rotameter flowmeters to th~ annulus and draft tube gas inlets. All the gas inlets are fitted with non-return valves to prevent blockage by bed
material. The bed material used was the same as for the large scale apparatus, and the same method was followed to measure the
crossflow rates.
Experimental Results and Discussion
The experimental results are given in detail in Appendix D.
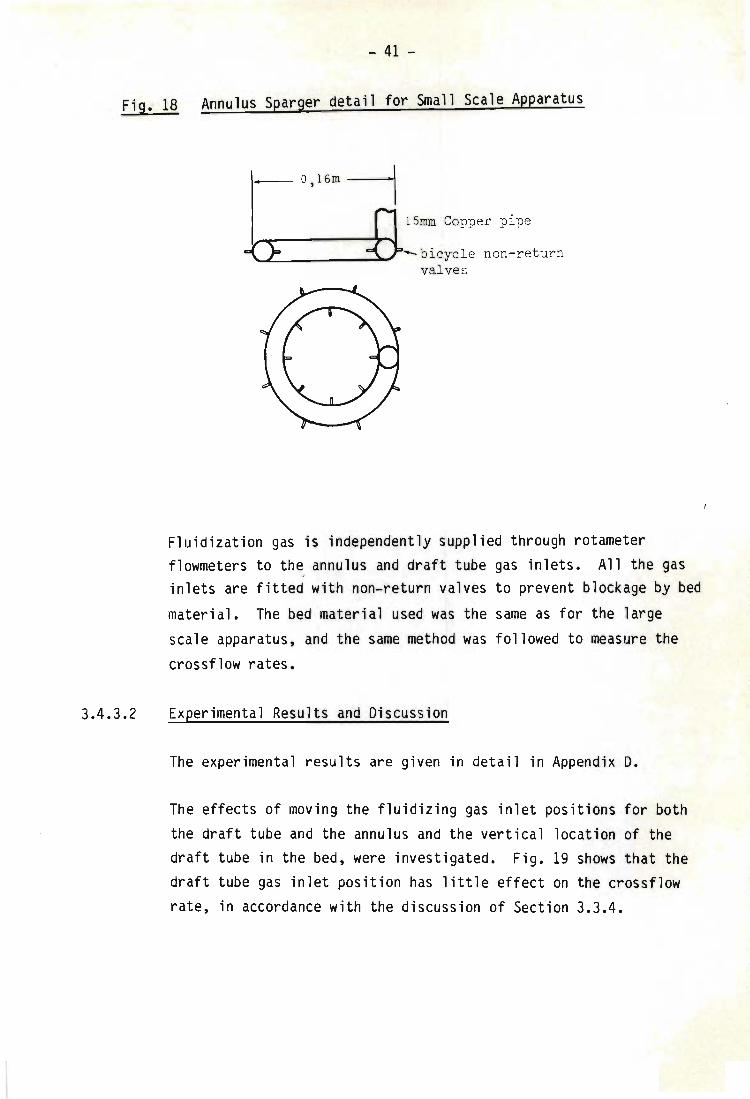
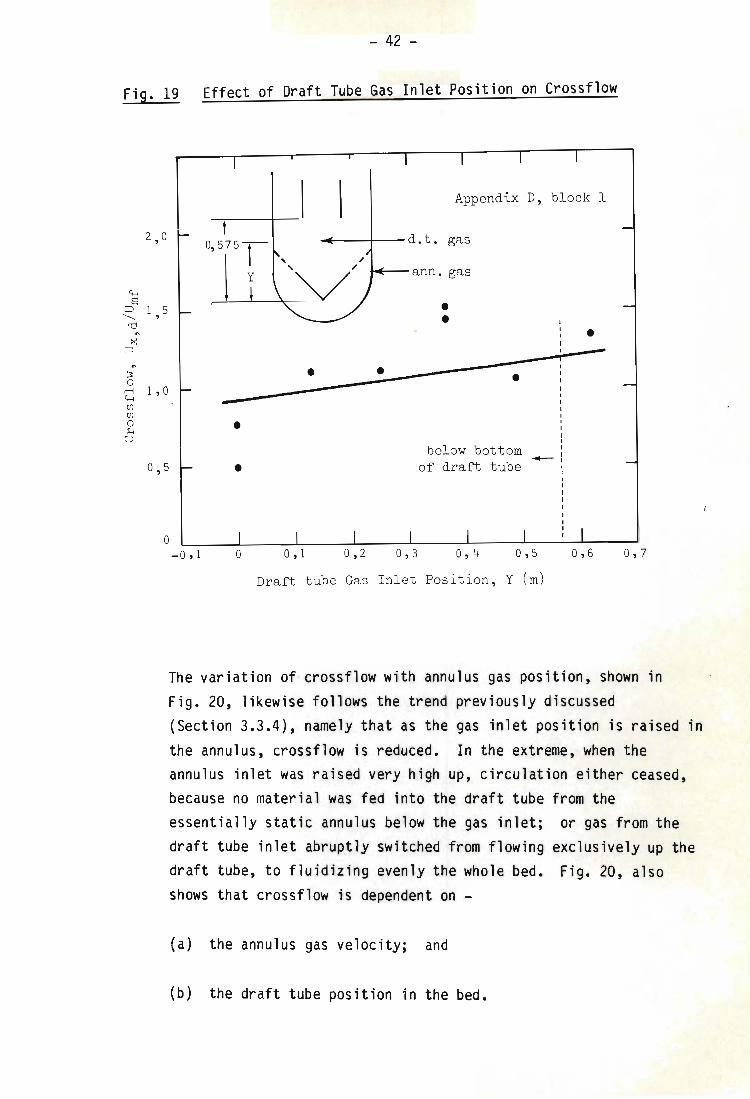
The effects of moving the fluidizing gas inlet positions for both the draft tube and the annulus and the vertical location of the draft tube in the bed, were investigated. Fig. 19 shows that the draft tube gas inlet position has little effect on the crossflow rate, in accordance with the discussion of Section 3.3.4.
- 42 -
Fo 19 Effect of Draft Tube Gas Inlet Position on Crossflow 19.
't-i ::JS ......... 'd
'" >< ::J
'" ~ 0 rl 't-i CJl CJl 0 H u
2 , 0
1 5 ,
•
Appendix D, block 1
~---+-- d.t . gas
ann. gas
• •
. -----~.=-• -
1 , ° -•
0 ,5 •
° - 0,1
below bottom of draft tube -
Draft tube Gas Inlet Position, Y (m)
0 , 7
The variation of crossflow with annulus gas position, shown in Fig. 20, likewise follows the trend previously discussed (Section 3.3.4), namely that as the gas inlet position is raised in the annulus, crossflow is reduced. In the extreme, when the annulus inlet was raised very high up, circulation either ceased, because no material was fed into the draft tube from the essentially static annulus below the gas inlet; draft tube inlet abruptly switched from flowing draft tube, to fluidizing evenly the whole bed. shows that crossflow is dependent on _
(a) the annulus gas velocity; and
(b) the draft tube position in the bed.
or gas from the exclusively up the Fig. 20, also
- 43 -
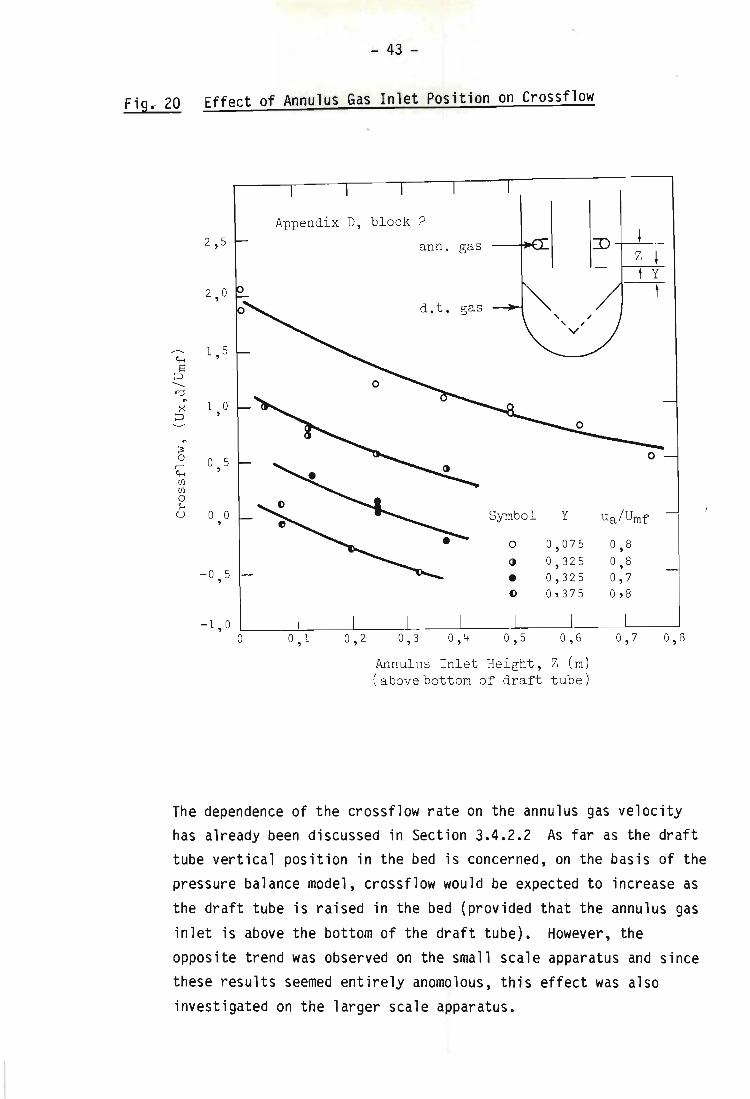
Fig. 20 Effect of Annulus Gas Inlet Position on Crossflow
n
~ o rl G-< en en o H
U
2 , 5
2,0
1, 5
1 ° ,
° 5 ,
° ° ,
- 0 5 ,
- 1 , 0
°
Appendix D, block 2
ann . gas
d . t . gas
Symbol Y
0 0 , 075
~ 0 , 325
• 0 , 325 () 0>375
° , 1 0,2
Annulus Inlet Height , Z (m) (above bottom of draft tube)
Z t y
t
o
Ua/Umf
0 , 8 0 , 8 0 , 7 0 , 8
0 , 8
The dependence of the crossflow rate on the annulus gas velocity has already been discussed in Section 3.4.2.2 As far as the draft tube vertical position in the bed is concerned, on the basis of the pressure balance model, crossflow would be expected to increase as the draft tube is raised in the bed (provided that the annulus gas inlet is above the bottom of the draft tube). However, the opposite trend was observed on the small scale apparatus and since these results seemed entirely anomolous, this effect was also investigated on the larger scale apparatus.
Cr-I S ~ -...... rd " >< ~
" ~ 0 rl ~ -I <Jl <Jl 0 H
u
. - 44 -
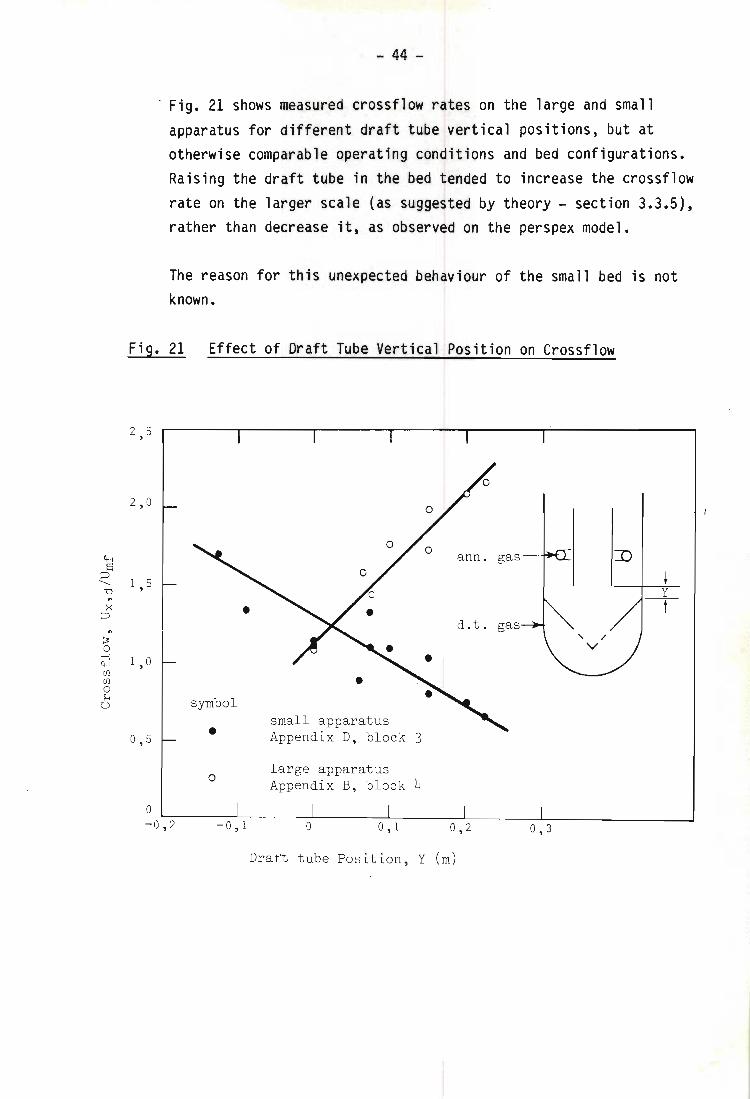
- Fig. 21 shows measured crossflow rates on the large and small apparatus for different draft tube vertical positions, but at otherwise comparable operating conditions and bed configurations. Raising the draft tube in the bed tended to increase the crossflow rate on the larger scale (as suggested by theory - section 3.3.5), rather than decrease it, as observed on the perspex model.
The reason for this unexpected behaviour of the small bed is not known.
Fig. 21 Effect of Draft Tube Vertical Position on Crossflow
2 :i ,
2 , 0
ann . gas
1 , 5
• d . t . gas
1 , 0 • •
symbol small apparatus • Appendix D, block 3 0 , 5
0 large apparatus Appendix B, block 4
0 - 0 , 2 - 0 , 1 0 o , 1 0 , 2 0 , 3
Draft tube Position , Y (m)
- 45 -
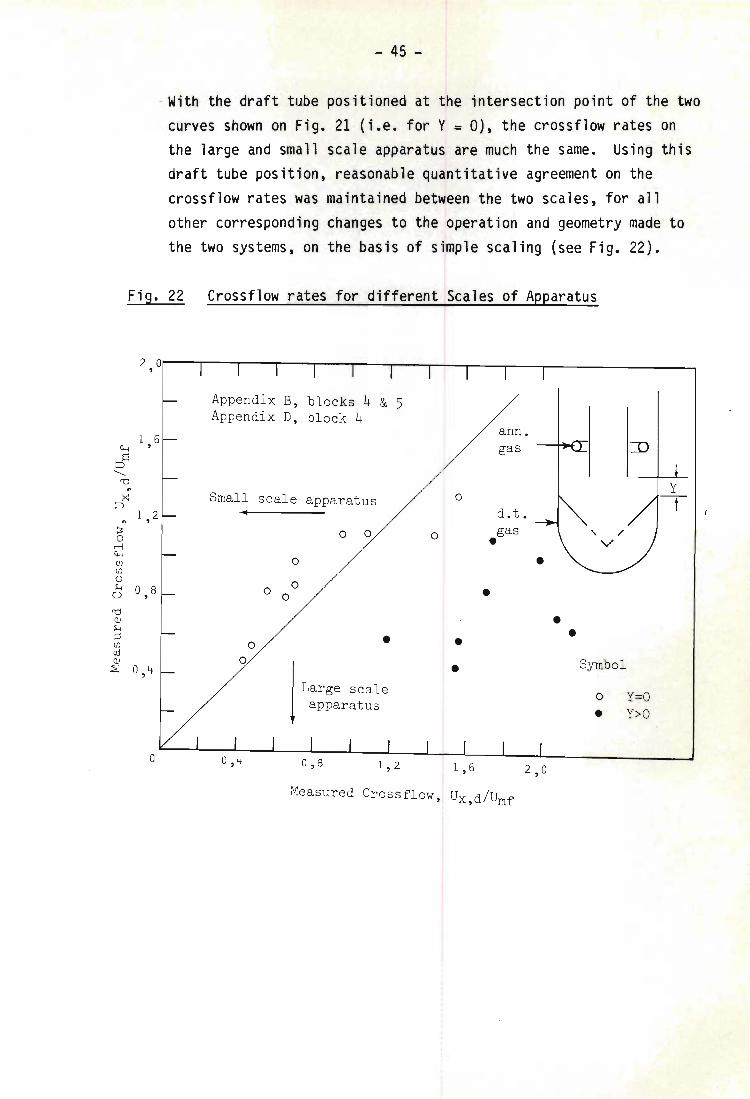
- With the draft tube positioned at the intersection point of the two curves shown on Fig. 21 (i.e. for Y = 0), the crossflow rates on the large and small scale apparatus are much the same. Using this draft tube position, reasonable quantitative agreement on the crossflow rates was maintained between the two scales, for all other corresponding changes to the operation and geometry made to the two systems, on the basis of simple scaling (see Fig. 22).
Fig. 22 Crossflow rates for different Scales of Apparatus
2 ° ,
Appendix B, blocks 4 & 5 Appendix D, block 4
1 6 ann.
e,.; , gas ::JS "-
'd " x Small scale apparatus 0
::J 1 , 2. d.t.
" ~ 0 0 0 gas 0 • rl e,.; CJl 0 CJl 0
0 ~ ° 8 0 • (.) , 0 'd QJ • ~ • ~ • CJl 0 • (\j QJ 0 Symbol ~ 0 ,4 • j Large scale
0 y =o apparatus • y>o
° 1,2 1 , 6 2 , 0
Measured Crossflow , Ux,d/umf
3.4.4
- 46 -
-Modifications to Pilot Plant
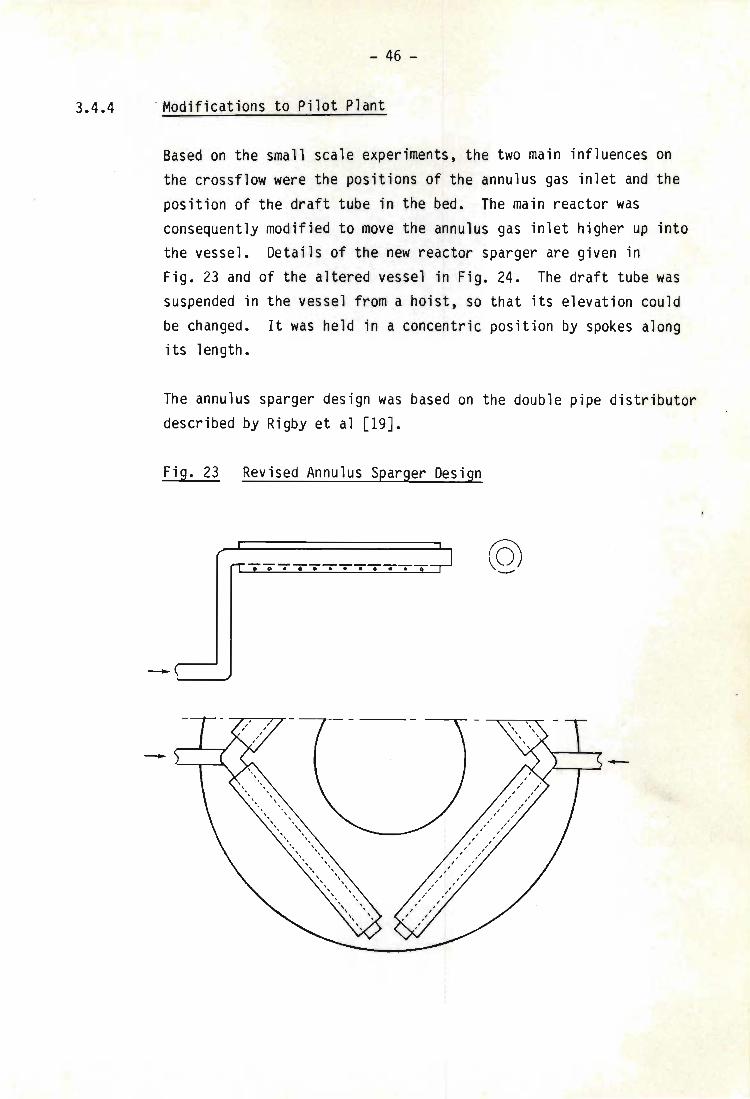
Based on the small scale experiments, the two main influences on the crossflow were the positions of the annulus gas inlet and the position of the draft tube in the bed. The main reactor was consequently modified to move the annulus gas inlet higher up into the vessel. Details of the new reactor sparger are given in Fig. 23 and of the altered vessel in Fig. 24. The draft tube was suspended in the vessel from a hOist, so that its elevation could be changed. It was held in a concentric position by spokes along its length.
The annulus sparger design was based on the double pipe distributor described by Rigby et al [19J.
Fig. 23 Revised Annulus Sparger Design
- 47 -
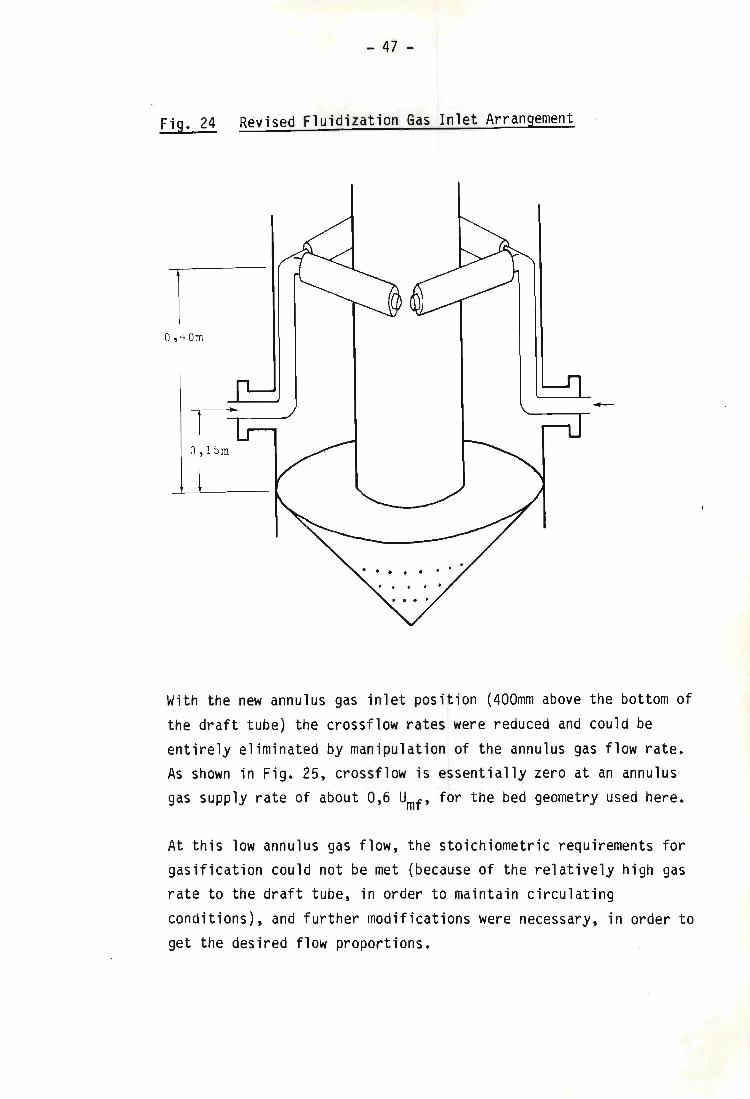
Fig. 24 Revised Fluidization Gas Inlet Arrangement
O, 40m
O, 15m
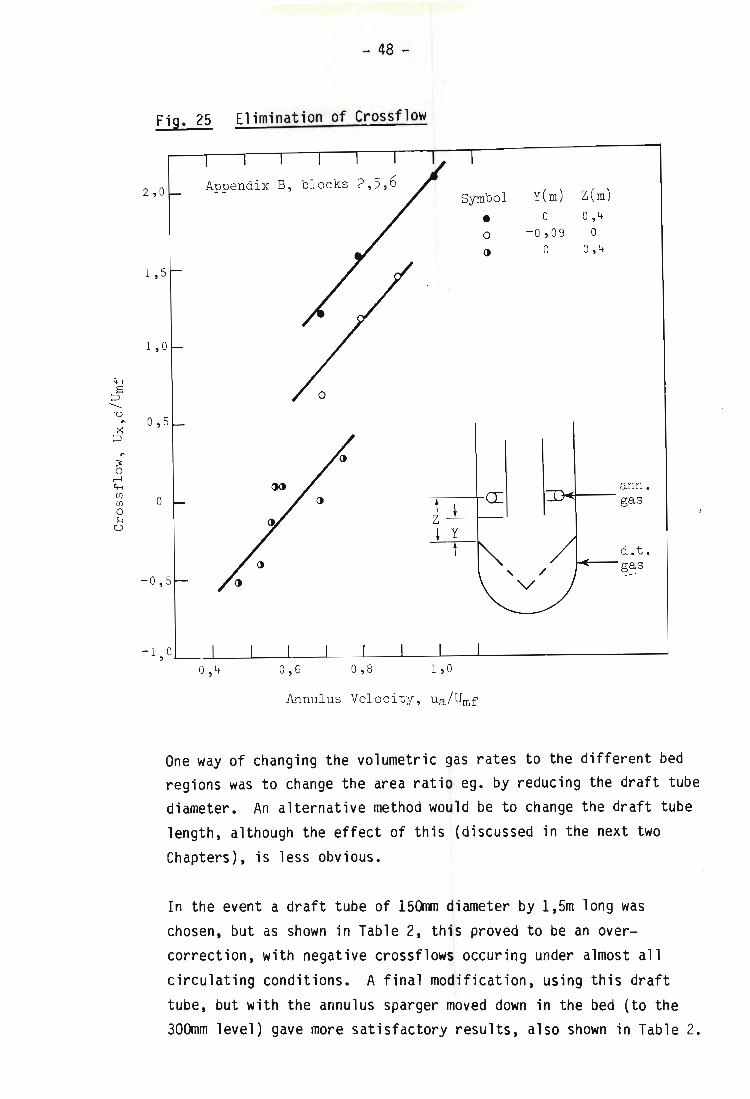
With the new annulus gas inlet position (400mm above the bottom of the draft tube) the crossflow rates were reduced and could be
entirely eliminated by manipulation of the annulus gas flow rate. As shown in Fig. 25, crossflow is essentially zero at an annulus gas supply rate of about 0,6 Umf , for the bed geometry used here.
At this low annulus gas flow, the stoichiometric requirements for gasification could not be met (because of the relatively high gas rate to the draft tube, in order to maintain circulating conditions), and further modifications were necessary, in order to get the desired flow proportions.
~
J -..... 'd
" ~ ::J
" ~ 0 rl ~ Ul Ul 0 H u
- 48 -
Fig. 25 Elimination of Crossflow
2 , 0 Symbol Y(m) Z( m)
• ° 0 ,4
0 - 0 , 09 ° ~ ° 0 , 4
1 , 5
1 , °
° , 5
° <I ann . gas
d . t .
- 0 , 5 g3:-s
- 1 , 0L-__ L-__ L-__ L-__ L-__ L-__ ~ __ J-__ ~ __________________ -J
° , 4 0 , 5 ° , 8 1 , ° Annulus Velocity , ua/Umf
One way of changing the volumetric gas rates to the different bed regions was to change the area ratio ego by reducing the draft tube diameter. An alternative method would be to change the draft tube length, although the effect of this (discussed in the next two Chapters), is less obvious.
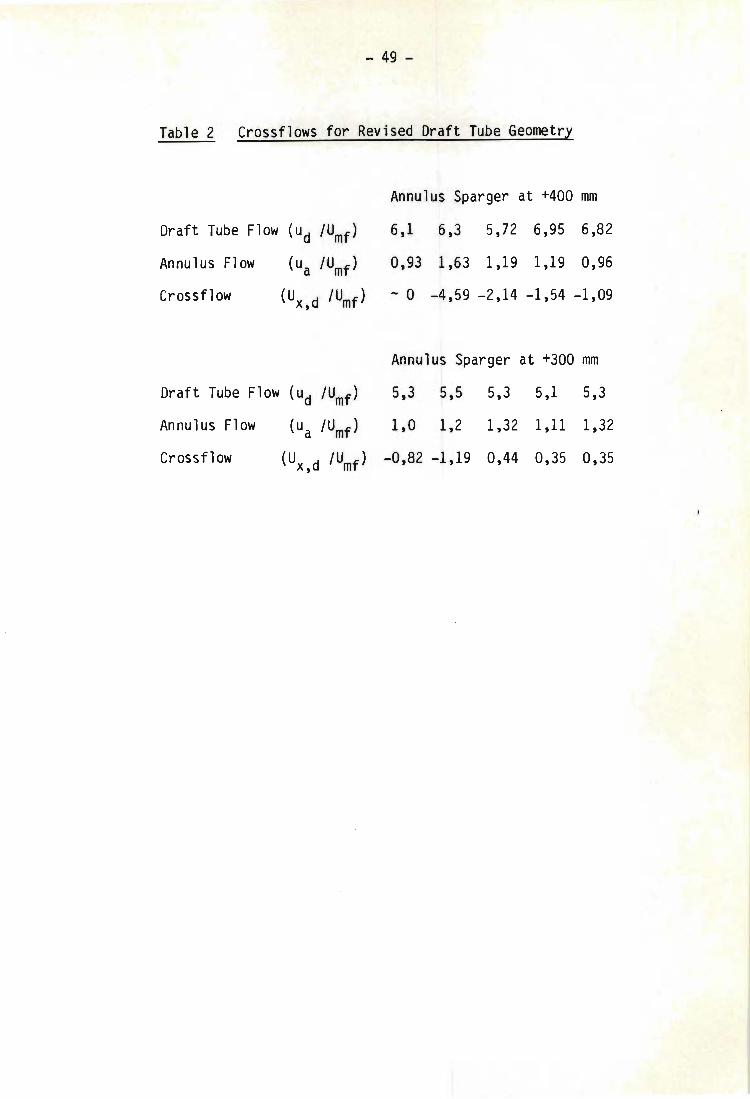
In the event a draft tube of 150mm diameter by 1,5m long was chosen, but as shown in Table 2, this proved to be an overcorrection, with negative crossflows occuring under almost all circulating conditions. A final modification, using this draft tube, but with the annulus sparger moved down in the bed (to the 300mm level) gave more satisfactory results, also shown in Table 2.
- 49 -
Table 2 Crossflows for Revised Draft Tube Geometry
Annulus Sparger at +400 mm
Draft Tube Flow (ud /Umf ) 6,1 6,3 5,72 6,95 6,82
Annulus Flow (ua /Umf ) 0,93 1,63 1,19 1,19 0,96
Crossflow (Ux,d /Umf ) -° -4,59 -2,14 -1,54 -1,09
Annulus Sparger at +300 mm
Draft Tube Flow (ud /Umf ) 5,3 5,5 5,3 5,1 5,3
Annulus Flow (ua /Umf ) 1,0 1,2 1,32 1,11 1,32
Crossflow (Ux,d /Umf ) -0,82 -1,19 0,44 0,35 0,35
- 50 -
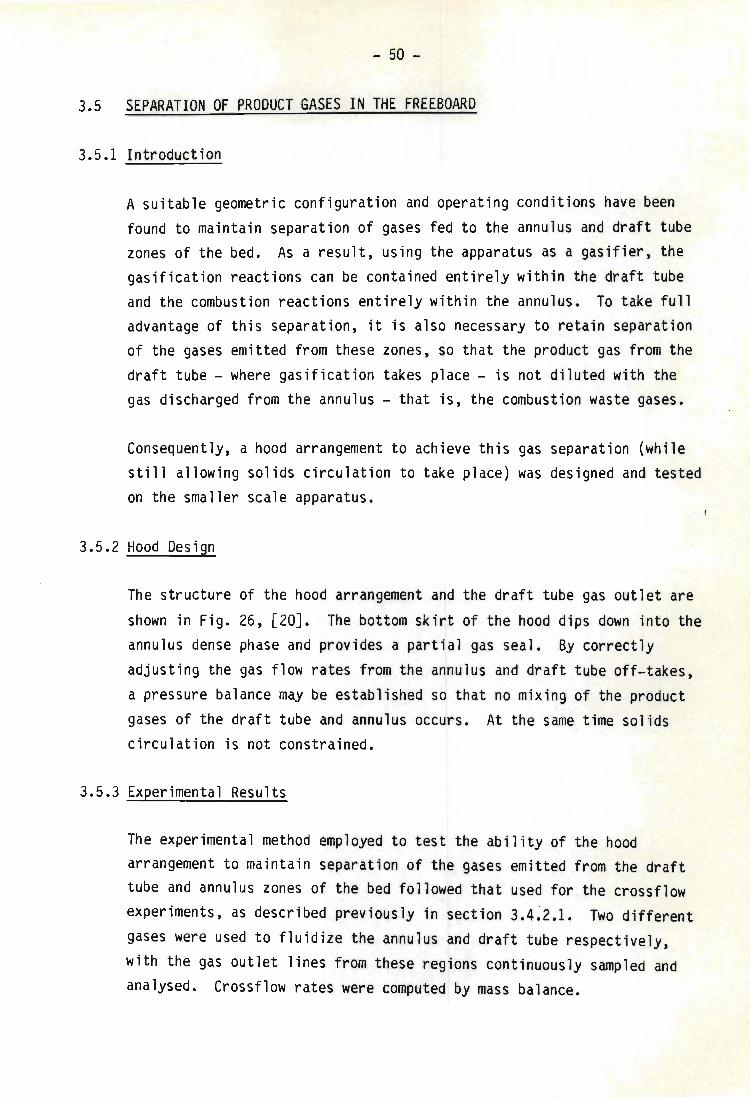
3.5 SEPA~ATION OF PRODUCT GASES IN THE FREEBOARD
3.5.1 Introduction
A suitable geometric configuration and operating conditions have been found to maintain separation of gases fed to the annulus and draft tube zones of the bed. As a result, using the apparatus as a gasifier, the gasification reactions can be contained entirely within the draft tube and the combustion reactions entirely within the annulus. To take full advantage of this separation, it is also necessary to retain separation of the gases emitted from these zones, so that the product gas from the draft tube - where gasification takes place - is not diluted with the gas discharged from the annulus - that is, the combustion waste gases.
Consequently, a hood arrangement to achieve this gas separation (while still allowing solids circulation to t ake place) was designed and tested on the smaller scale apparatus.
3.5.2 Hood Design
The structure of the hood arrangement and the draft tube gas outlet are
shown in Fig. 26, [20J. The bottom skirt of the hood dips down into the annulus dense phase and provides a partial gas seal. By correctly adjusting the gas flow rates f rom the annulus and draft tube off-takes, a pressure balance may be established so that no mixing of the product gases of the draft tube and annulus occurs. At the same time solids circulation is not constrained.
3.5.3 Experimental Results
The experimental method employed to test the ability of the hood arrangement to maintain separation of the gases emitted from the draft tube and annulus zones of the bed followed that used for . the crossflow experiments, as described previously in section 3.4~2.1. Two different gases were used to fluidize the annulus and draft tube respectively, with the gas outlet lines from these regions continuously sampled and analysed. Crossflow rates were computed by mass balance.
- 51 -
Fig. -26 Draft Tube Hood and Gas Outlet
t t
. I -
Schematic Diagram (N . T. S. )
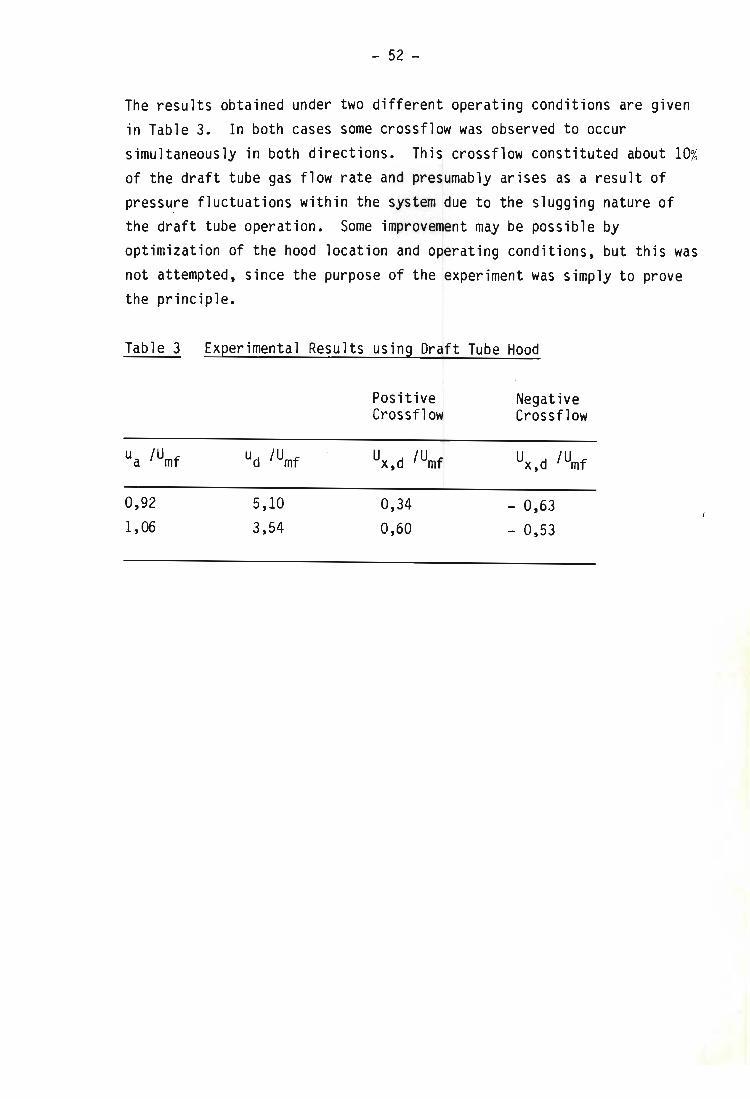
- 52 -
The results obtained under two different operating conditions are given in Table 3. In both cases some crossflow was observed to occur simultaneously in both directions. This crossflow constituted about 10% of the draft tube gas flow rate and presumably arises as a result of pressure fluctuations within the system due to the slugging nature of
. .
the draft tube operation. Some improvement may be possible by optimization of the hood location and operating conditions, but this was not attempted, since the purpose of the experiment was simply to prove the principle.
Table 3 Experimental Results using Draft Tube Hood
Positive Negative Crossflow Crossflow
ua /Umf ud /Umf Ux,d /Umf Ux,d /Umf
0,92 5,10 0,34 - 0,63 1,06 3,54 0,60 - 0,53
- 53 -
3.6 SUMMARY AND CONCLUSIONS
A theory is proposed in which crossflow is taken to be mainly dependent upon a pressure balance being established between the draft tube and annulus legs of a fluidized bed containing a draft tube. The theory has been qualitatively confirmed by an experimental program in which the effects of bed configuration and operating factors on crossflow have been characterised, leading to the identification of a bed geometry in which crossflow is effectively eliminated while at the same time maintaining solids circulation and with gas flow rates to the different bed regions in approximately the proportions required for coal gasification. In order to quantify the theory presented, the pressure drop relationships over the draft tube and annulus must be solved. As far as the annulus is concerned a rough solution is relatively straightforward, since this region operates in slip-stick flow, as a packed bed. For example, the Ergun equation [21J may be used, if the slip velocity between the solids and t he gas in the annulus is known -see Appendix E.
The slip velocity depends on the solids circulation in the system which in turn affects the draft tube voidage and the gas carried between zones by the dense phase. An understanding of the bulk transfer of solids around the system is therefore a necessary input to a quantitative solution of crossflow, and circulation consequently forms the subject of the next Chapter.
Furthermore, a knowledge of the slugg i ng behaviour of the draft tube is necessary, since this not only intimately determines the pressure loss over this part of the bed, but also effects circulation. A detailed examination of draft tube hydrodynamics is presented in Chapter 5.
- 54 -
CHAPTER 4
SOLIDS CIRCULATION
4.1 INTRODUCTION
A principal feature of operation of the draft tube fluidized bed is the circulation of solids up the draft tube and down the annulus. By fluidizing the bed material in the draft tube more vigorously than in the annulus a density difference between the two zones is established, which induces the solids circulation in the system. In practice, in order to obtain a density difference great enough for strong solids circulation, the draft tube is usually operated as a slugging, fast or dilute fluidized bed, while the annulus is operated near the minimum fluidization condition. In the system under consideration here, the draft tube operates in the slugging regime.
The rate of bulk transfer of fluidized solids around the draft tube -annulus circuit is determined by equalization of the driving force (provided by the density difference between the two regions) and the
resistance (friction opposing solids flow), so that the total pressure balance around the loop is closed.
Alternatively, if the draft tube operation only is considered, the transfer rate may be determined by either of two limitations, namely
(a) the rate at which particles are supplied to the draft tube [22J, or
(b) the capacity of the draft tube to transport the solids [23J.
The latter restriction represents the maximum carrying capacity for a given slugging system at a particular fluidizing gas rate.
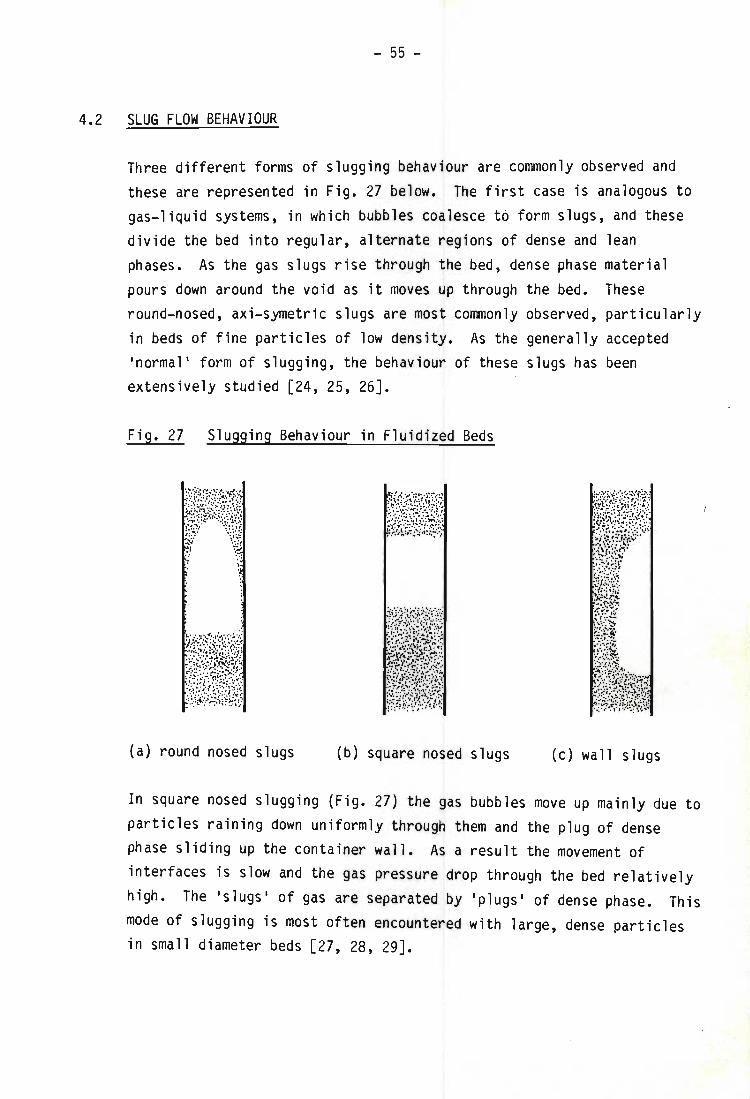
- 55 -
4.2 SLUG FLOW BEHAVIOUR
Three different forms of slugging behaviour are commonly observed and these are represented in Fig. 27 below. The first case is analogous to gas-liquid systems, in which bubbles coalesce to form slugs, and these divide the bed into regular, alternate regions of dense and lean phases. As the gas slugs rise through the bed, dense phase material pours down around the void as it moves up through the bed. These round-nosed, axi-symetric slugs are most commonly observed, particularly in beds of fine particles of low density. As the generally accepted 'normal' form of slugging, the behaviour of these slugs has been extensively studied [24, 25, 26].
Fig. 27 Slugging Behaviour in Fluidized Beds
(a) round nosed slugs (b) square nosed slugs (c) wall slugs
In square nosed slugging (Fig. 27) the gas bubbles move up mainly due to particles raining down uniformly through them and the plug of dense phase sliding up the container wall. As a result the movement of interfaces is slow and the gas pressure drop through the bed relatively high. The 'slugs' of gas are separated by 'plugs' of dense phase. This mode of slugging is most often encountered with large, dense particles in small diameter beds [27, 28, 29].
- .56 -
Finally wall slugs (Fig. 27) often occur at high excess gas velocities, usually as a result of the breakdown of the other two modes [24, 29J.
In the cases of both round nosed and wall slugs gas-solid contacting is relatively poor as a result of gas in the bubbles bypassing through the bed: in contrast, for square nosed s lugging, a much larger proportion of gas is forced to percolate through the dense phase plugs, resulting in much better gas-solid contact. Th is advantage has apparently not been recognised in the literature where square nosed slugging is
generally regarded as an unstable hydrodynamic regime of limited practical interest [26, 30, 31J.
- 57 -
4.3 THEORETICAL DEVELOPMENT
4.3.1 Introduction
In this Section a model for solids transport through a slugging bed is formulated, which may be applied to al l slugging regimes, that is round nosed, square nosed or wall slugs - al though the founding assumptions are more readily shown to be valid for some modes than others.
The arguments that are formulated here are made on the basis that the slug occupies the whole cross section of the tube and is cylindrical in shape - corresponding to the shape in the square nosed slugging mode. Nevertheless, they may be equally well applied to other slug types, provided that the slug and plug lengths are put on the same basis, most easily achieved by using volume equivalent lengths. For example, if the volume of an irregularly shaped slug is Vs ' then the volume equivalent length is given by
LS = Vs ~
where A is the cross sectional area of the tube.
4.3.2 Assumptions
(1)
The gas slip velocity in the dense phase is taken to be constant, for the entire length of the draft tube. For round nosed and wall slugs this velocity is constant and equal to Umf as predicted by the two phase theory [32J and experimentally confirmed for these flow regimes [24J. It is also often assumed in the literature [ego 29, 33, 34J that the dense phase slip velocity in square nosed slug flow is also U
mf but this is shown in the next Chapter to be incorrect. For the moment, it may merely be noted that the assumption is simply that the dense phase slip velocity does not change up the length of the bed, although it may change with other operating conditions ego the total superficial gas velocity.
- 58 -
The gas slugs move up the tube causing solids to be displaced from above to below the bubble, and this solids drainage rate relative to the slug (and equivalent to the absolute rise velocity of a single slug in a stagnant bed) is taken to be independent of the total gas flow rate. For round nosed and wall slugs, the rise velocities in a stagnant bed
are respectively given by:
UB = 0,35 /-go- [24J
and UB = 0,35 /2g0 [35, 36J
(2)
(3)
confirming that there is no dependence on the gas rate. Square nosed slugs proceed up the tube by material raining through the gas void. While there does not appear to be much information available in the literature for the rise velocity of square nosed slugs, there is some evidence that it achieves a stable value irrespective of the superficial gas velocity [28J.
Finally, the spacing of the slugs is assumed to be constant under stable conditions, depending on the powder properties, tube size, etc. but again not on the superficial gas velocity. A change in gas rate is therefore accommodated entirely by a change in the slug lengths, with slug spacing and frequency remaining unchanged. The evidence for this in square nosed slugging systems is discussed in the next Chapter. In beds exhibiting round nosed slugging behaviour there is considerable experimental verification of this [25, 28, 37, 38J, including for example, the fact that the generally accepted criterion for the onset of slugging (Stewart's criterion) [22J, is based on this assumption. There does not, however, appear to be any direct experimental evidence on the spacing of wall slugs, but, since wall slugs usually arise from the breakdown of square or round nosed slugs, and accepting that slug velocities are not dependent on the superficial gas rate, it seems reasonable that wall slugs are also separated by a characteristic distance, similarly independent of gas velocity.
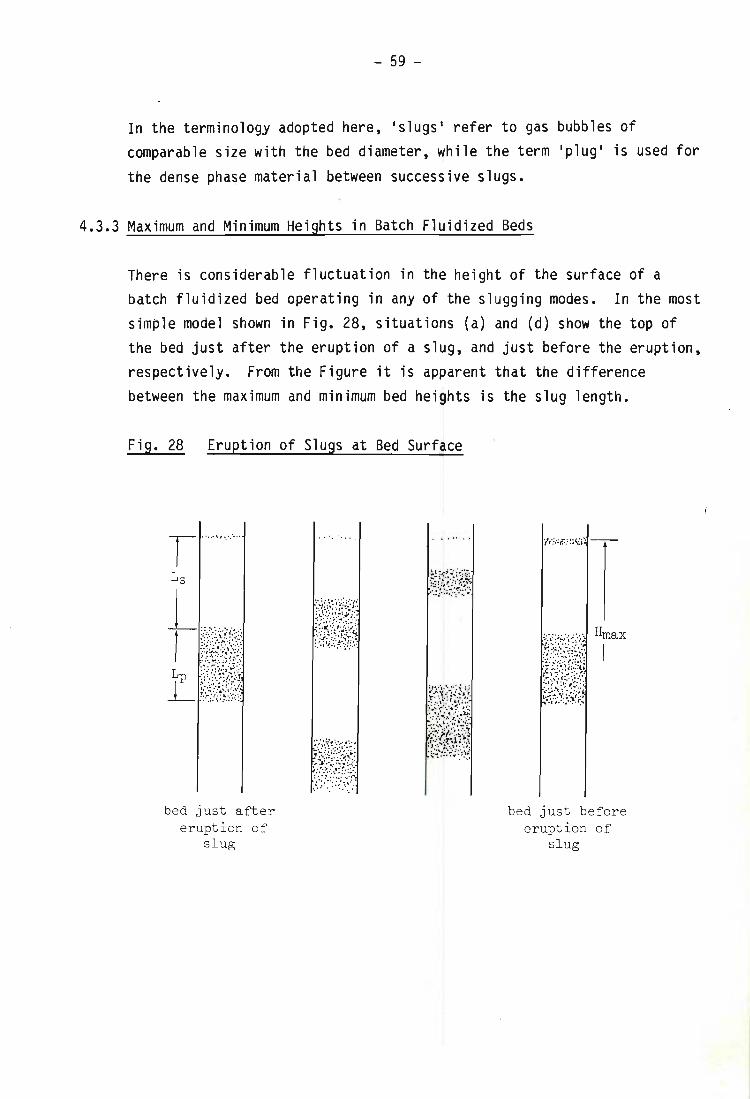
- 59 -
In the terminology adopted here, 'slugs' refer to gas bubbles of comparable size with the bed diameter , while the term 'plug' is used for the dense pha~e material between successive slugs.
4.3.3 Maximum and Minimum Heights in Batch Fluidized Beds
There is considerable fluctuation in t he height of the surface of a batch fluidized bed operating in any of the slugging modes. In the most simple model shown in Fig. 28, situations (a) and (d) show the top of the bed just after the eruption of a slug, and just before the eruption, respectively. From the Figure i t is apparent that the difference between the maximum and minimum bed heights is the slug length.
Fig. 28 Eruption of Slugs at Bed Surface
, ..... " ... : ...
bed just after eruption of
slug
Hmax
I
bed just before eruption of
sl ug
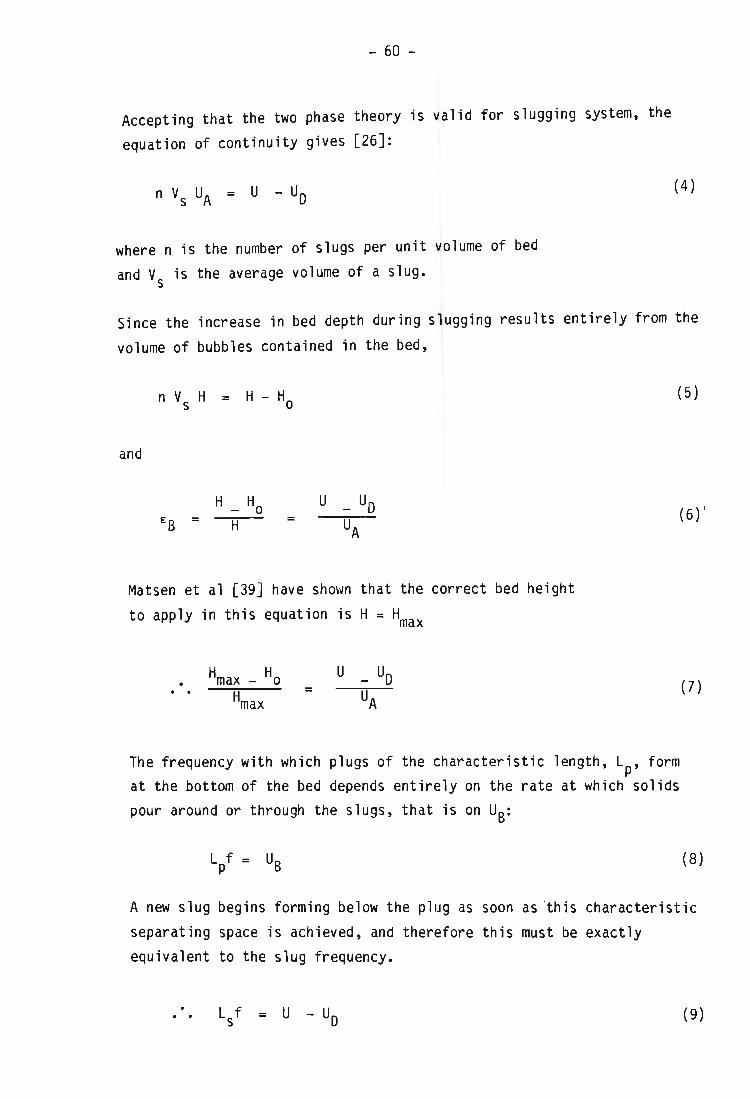
- 60 -
Accepting that the two phase theory is valid for slugging system, the
equation of continuity gives [26]:
(4)
where n is the number of slugs per uni t volume of bed
and V is the average volume of a slug . s
Since the increase in bed depth during slugging results entirely from the
volume of bubbles contained in the bed ,
n V H = H - H s 0 (5)
and
=
Matsen et al [39] have shown that the correct bed height
to apply in this equation i s H = Hmax
=
The frequency with which plugs of the characteristic length, Lp' form at the bottom of the bed depends entirely on the rate at which solids pour around or through the slugs, that is on US:
(7)
(8)
A new slug begins forming below the plug as soon as this characteristic
separating space is achieved, and therefore this must be exactly equivalent to the slug frequency.
(9)
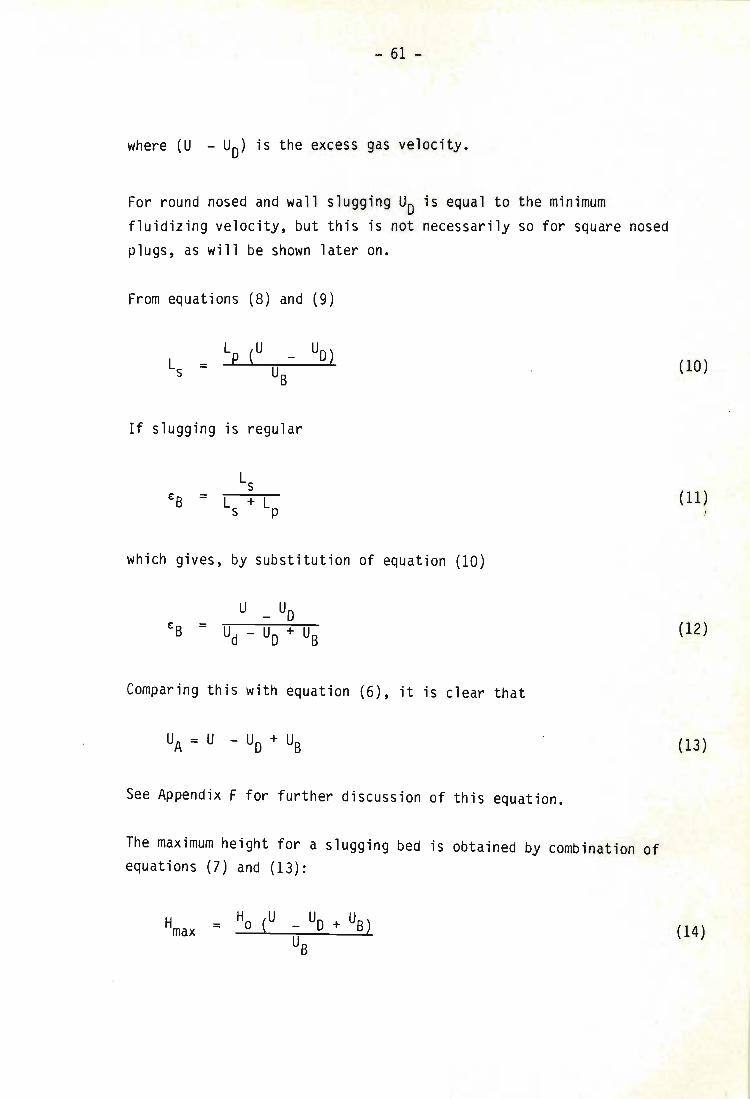
- 61 -
where (U - Uo) is the excess gas velocity.
For round nosed and wall slugging Uo is equal to the minimum fluidizing velocity, but this is not necessarily so for square nosed plugs, as will be shown later on.
From equations (8) and (9)
If slugging is regular
£B = L + L s P
which gives, by substitution of equation (10)
Comparing this with equation (6), it is clear that
See Appendix F for further discussion of this equation.
The maximum height for a slugging bed is obtained by combination of equations (7) and (13):
(10)
(11)
(12)
(13)
(14)
- 62 -
If the length of the tube containing the slugging fluidized bed is progressively reduced at constant gas flow rate, powder will spill out of the top of the tube until some minimum container length is reached,
below which slugging will no longer occur.
HI -max -
(15)
For container lengths less than this, the static bed depth of the powder will be less than a single plug length and it will not be possible for slugs to form; gas will pass through the shallow bed in bubbling
fluidization.
The minimum container length that wil l sustain slugging is therefore
given by substitution of equat ion (10 ) into (15):
HI Lp (U _ Uo + UB) max = U
B A change in the gas flow rate to the bed is accommodated entirely in changing the slug length, without altering the plug length, and consequently effects:
the maximum bed depth, Hmax ' according to equation (14);
the minimum tube length which will enable slugging to occur,
equation (16); the bed bubble fraction, by equation (12); and the degree of surging of the bed surface, L • s
4.3.4 Limiting Conditions for Solids Transport through a Slugging Bed
(16) , I
The gas flow rate in a slugging bed may be set so that the plugs just collapse at the top of the tube, but no solids overflow. This condition occurs when the tube length is given by
(17)
where n is the number of slugs in the tube.
- 63 -
Clearly, under conditions of no circulation, no solids are being fed
into the bottom of the lift pipe. If the gas velocity is increased slightly then some powder will spill out of the tube because the slug length increases, according to equation (10). Therefore, for a given lift pipe length (HI ), the minimum velocity that will sustain max circulation, which corresponds to n = 1, may be derived by combination
of equations (10) and (15).
=
For all gas rates less than Umin (with a tube length of H~ax)' the plugs will collapse below the top of the tube.
(18)
The upper velocity limit for transport of solids through a slugging system is set by when slug flow breaks down (into turbulent fluidization I
or pneumatic conveying).
4.3.5 Solids Transport by Slugging Bed
The driving force for solids circulation in the draft tube bed is determined by the density difference between the annulus and draft tube legs. Assuming that this circulation rate is set by the frictional resistance to solids flow, rather than by the lifting capacity of the draft tube, the rate at which solid material is supplied to the draft tube will be constant for given annulus and draft tube gas velocities.
If the dense phase velocity up the draft tube (which is a measure of the solids circulation rate) is v, then the frequency of plug formation, previously equation (8), becomes:
f = = (19)
- 64 -
The absolute slug velocity is also increased due to the flow of dense phase into the bottom of the draft tube, and equation (13) must be
revised in order to take this into account.
= (20)
From equations (19) and (20)
(21)
This equation can also be easily derived from continuity:
(superficial dense phase velocity) ...!.(..;.,.su;.;..&;...;;.;....;...~~":""T,;;,;.;..;;~~~-.r..;...;;;..,~...;....;."c..L.. (dense phase holdup) =
i.e. =
It may be noted that the bubble fraction (and hence voidage) is lower for a transporting slugging bed than for a batch slugging bed at the same fluidization gas rate.
If the actual height of the draft tube is Hd, and assuming that all the particles ejected from the draft tube escape - that is, none fall back into the draft tube after the plug eruption - then
.. Combining equations (19) and (23)
(22)
(23)
(24)
- 65 -
Where H~ax is given by equation (16), and Lp and UB are characteristic properties of the powder and the tube size (see Section 4.3.2).
By rearrangement of equation (19),
=
from which it is apparent that, for a non-transporting bed, (for
which vd = 0):
The bubble frequency in a batch slugging bed should therefore be constant, if the assumptions that the bubble rise velocity and the bubble spacing are constant, are valid. Considerable experimental evidence is available to support this [31, 40, 41, 42, 43J.
Furthermore, for a transporting bed, t he frequency of slugging must increase in direct proportion to the circulation rate (according to
equation 23), and this is experimentally confirmed by the results
presented in [44J.
4.3.6 Maximum Rate of Solids Circulation
(25)
(26)
When the solids circulation rate is restricted by the draft tube carrying capacity rather than the rate at which solids are fed into the draft tube, this represents the maximum circulation rate attainable in the system at that particular gas velocity.
Singh [23J has proposed a model for this situation, based on the behaviour of batch slugging beds. Referring to Fig~ 29 the
maximum bed depth (for a batch bed) is given by H ,while the max effective dense phase level is H. Singh argues that, since the gas slug
is associated with very little solid material, transport can only occur if the tube length is less than the effective dense phase level, and
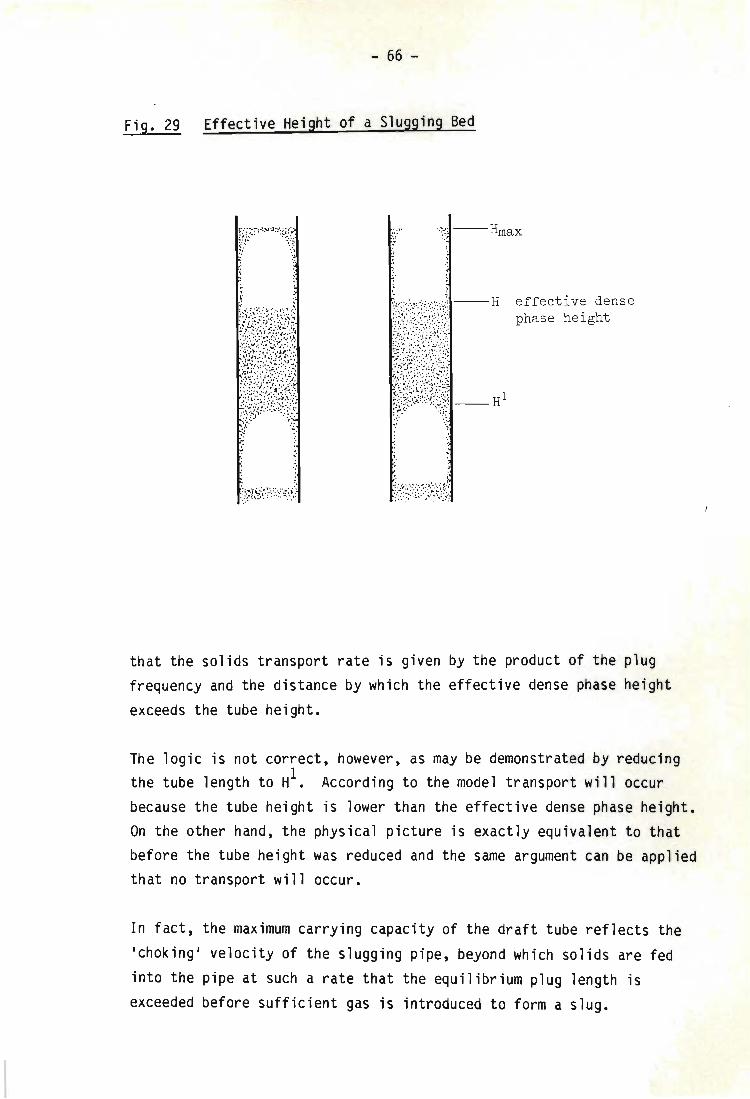
- 66 -
Fig. 29 Effective Height of a Slugging Bed
f?:":~'::: ~~:\l
\
. ,'
. , :~}~~:~·1 :·: :::~:·;';.~~
\~ - - Hmax
effective dense phase height
that the solids transport rate i s given by the product of the plug frequency and the distance by which the effective dense phase height
exceeds the tube height.
The logic is not correct, however, as may be demonstrated by reducing the tube length to HI. According to the model transport will occur
because the tube height is lower than the effective dense phase height. On the other hand, the physical picture is exactly equivalent to that before the tube height was reduced and the same argument can be applied that no transport will occur.
In fact, the maximum carrying capacity of the draft tube reflects the
'choking' velocity of the slugging pipe, beyond which solids are fed
into the pipe at such a rate that the equilibrium plug length is
exceeded before sufficient gas is introduced to form a slug.
- 67 -
The slug (and plug) frequency is given by equation (19).
(19)
thereby contradicting Singh's assertion that the slug frequency is not changed by solid transport up the bed , and giving
vd,max = Lp (Ud - Uo) - Us Ls,min
(27)
Assuming, for example, a slug spacing (ie. plug length) of two pipe diameters and a minimum slug size of one pipe diameter, as is common for
round nosed slugging systems [24, 26J :
(28)
4.3.7 Interaction between Circulation and Crossflow
The driving force for solids circulat i on can also be envisaged in
another way. If the draft tube and annulus are connected at the bottom, as before, but are made very tall, so that they are separate at the top
and no solid circulation can occur, then the equilibrium depth of solids in the two legs depends on the degree of fluidizaton in them [45J.
For example, if the annulus is incipiently fluidized and the draft tube bubbling, solids will flow between the two beds (since the bottoms are common), to establish some equilibrium depth in each, in order to achieve a pressure balance. In this simple case and under ideal conditions one would expect the static bed depths to be identical, although the fluidized depths would be different because of the bubbles present on the draft tube side. If the annulus gas rate was reduced below the incipient fluidization velocity, equilibrium would be
re-established by particles moving from the draft tube side to the
annulus, and as a result the annulus static bed depth would be greater than the draft tube static bed depth.
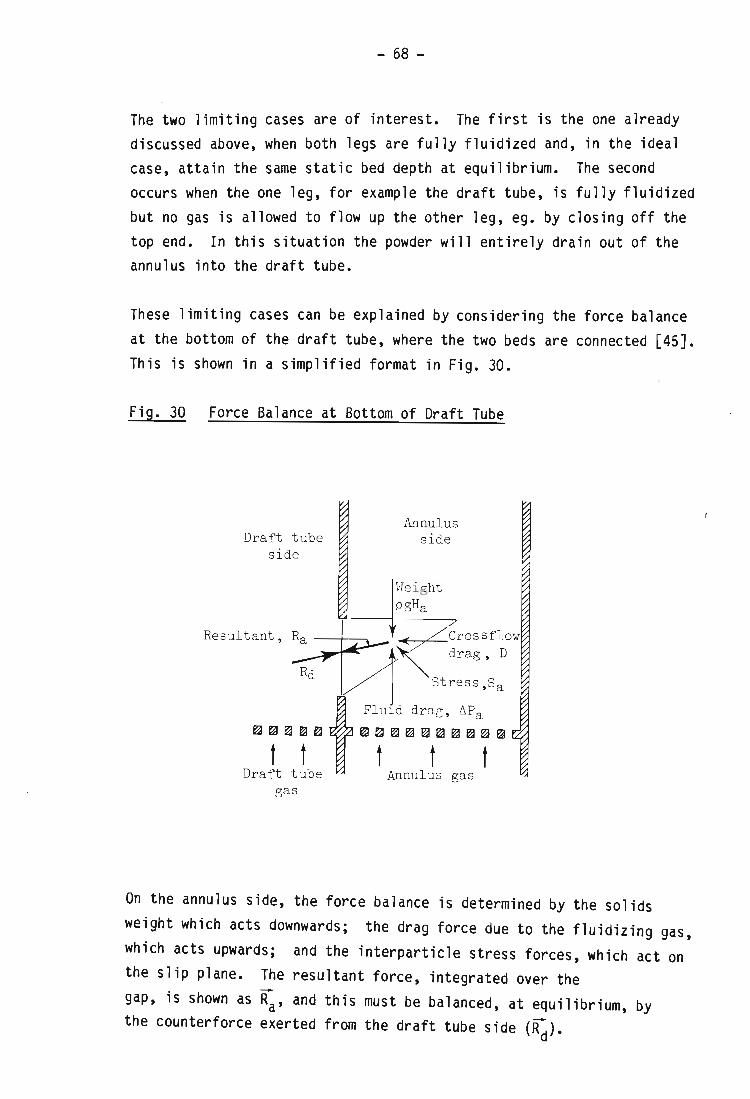
- 68 -
The two limiting cases are of interest. The first is the one already discussed above, when both legs are fully fluidized and, in the ideal case, attain the same static bed depth at equilibrium. The second occurs when the one leg, for example the draft tube, is fully fluidized but no gas is allowed to flow up the other leg, ego by closing off the top end. In this situation the powder will entirely drain out of the annulus into the draft tube.
These limiting cases can be explained by considering the force balance at the bottom of the draft tube, where the two beds are connected [45]. This is shown in a simplified format in Fig. 30.
Fig. 30 Force Balance at Bottom of Draft Tube
Draft tube side
Resultant ,
gas
Annulus side
On the annulus side, the force balance is determined by the solids weight which acts downwards; the drag force due to the fluidizing gas, which acts upwards; and the interparticle stress forces, which act on the slip plane. The resultant force, integrated over the gap, is shown as R;, and this must be balanced, at equilibrium, by the counterforce exerted from the draft tube side (~).
. I
- 69 -
If the draft tube is fully fluidized, then
-Rd = 0
-. Ra 0 . . =
- - -. pgH - AP = 0 and Sa = 0 . . a a
There are two conditions for which equation (31) is true, namely when the annulus is fully fluidized, or when the annulus depth is zero, respectively corresponding to the two limiting cases discussed above.
So far in these arguments it has been assumed that there is no
(29)
(30)
(31)
crossflow, but in practice gas supplied to the annulus may flow through the gap and contribute to the actual gas flow up the draft tube (positive crossflow) or vice versa (negative crossflow). When crossflow occurs an additional force, due to the drag of the gas flowing through the gap, must be taken into account in the force balance. If this drag I -force is 0, then the vectorial sum of all the forces acting, must balance, at equilibrium:
(32)
The quantitative solution of equation (32) is complicated however, by the fact that the drag force due to crossflow depends on the gas velocity through the gap - that is, on the size of the gap. For a large gap the gas velocity through it will be low and this drag force becomes neglible. As before, if the draft tube is fully fluidized, then
-Rd = 0 (29 )
-R = a 0 (30)
and since
0 :: 0 (33)
- 70 -
(34)
• '. Ua ~ Umf (35)
The total annulus gas flow rate must be at least the incipient fluidization rate. If the gas supplied directly to the annulus is not sufficient to achieve this, then the balance must be supplied by
crossflow.
If the gap is small the gas velocity t hrough it due to crossf10w is correspondingly greater, so that the drag forc'e may become significant.
Under this condition
(36)
(37'
The force balance at this condition is dealt with further in Chapter 5, but for the moment, it may simply be noted that crossf10w will be more severe if the gap is large than if it is small.
This result was experimentally confirmed on the larger scale experimental apparatus, but astonishi ngly, the opposite trend was found on the 2/5 scale perspex model, which in other respects scaled relatively well (see Fig. 24).
So far we have considered the condition when the draft tube length is sufficiently great so that no solids circulation can take place. As long as the expanded powder depth in the draft tube is greater than the annulus depth circulation can be induced if the draft tube length is reduced suitably, so that solids can spillover into the annulus. Under these circumstances, the pressure difference between the annulus and the draft tube is dissipated as friction rather than in generating static head. Circulation also introduces some additional forces around the gap, due to changes in kinetic energy of the particles in this region.
- 71 -
However, although there is some evidence that the pressure drop over the gap changes with solids circulation rate [22J, this is an insignificantly small effect [15, 46J compared with the overwhelmingly greater pressure drops over the draft tube and annulus legs.
The drag force on the solid particles flowing through the gap during circulation depends on the relative velocity of the crossflowing gas past them, that is, on the slip veloc ity. For example if the gas flow supplied to the annulus were to be reduced, there would be an increased tendency for draft tube gas to crossf l ow into the annulus in order to restore the pressure balance (resolved vertically). At the same time the particle velocity through the gap would be reduced to maintain the slip velocity and equilibrate the force balance (resolved horizontally). The experimentally observed inverse relationship between crossflow and circulation [14J is thus explained. Further, the solids circulation rate varies in such a way as to counteract pressure fluctuations in the systems. The most severe of these arise from the discharge of solids from the draft tube by eruption of the plugs reaching the top and also the variations due to the hydrodynamic behaviour of the slugging in the draft tube. The crossflow rate will also change with pressure variations and crossflow can only truly be eliminated in a pressure-stable system. Nevertheless, it is a desirable feature in a circulating system that the circulation rate varies to minimize the pressure fluctuation (and hence the crossflow).
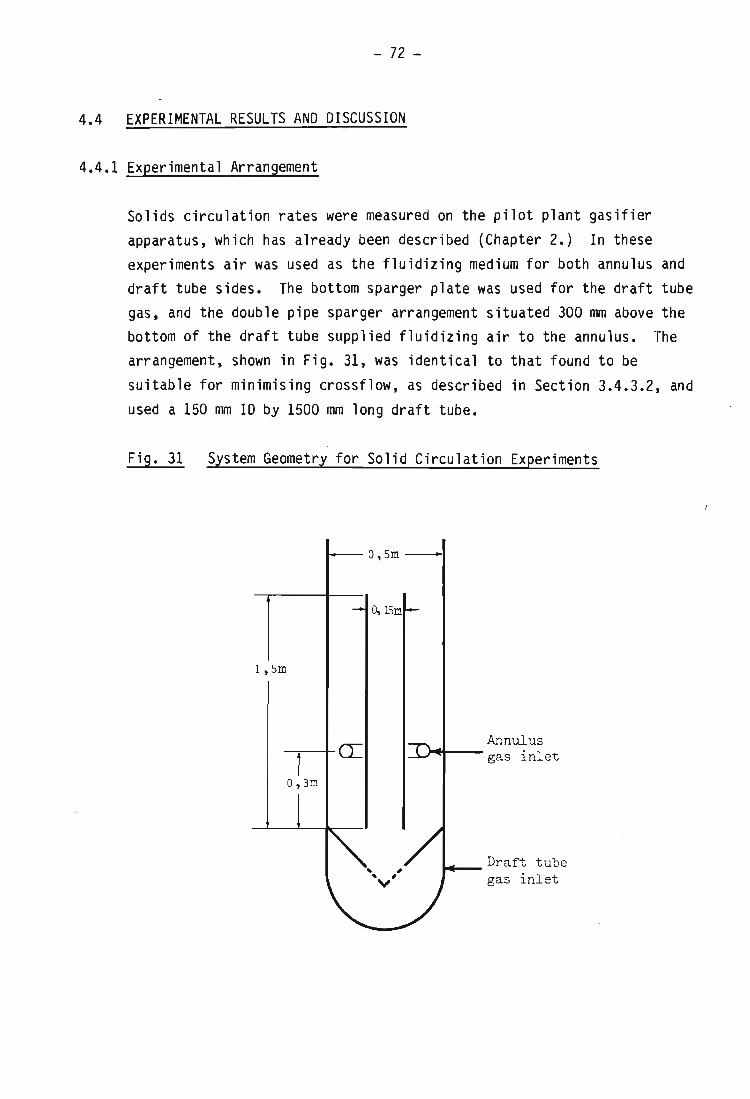
- 72 -
4.4 EXPERIMENTAL RESULTS AND DISCUSSION
4.4.1 Experimental Arrangement
Solids circulation rates were measured on the pilot plant gasifier apparatus, which has already been described (Chapter 2.) In these experiments air was used as the fluidizing medium for both annulus and draft tube sides. The bottom sparger plate was used for the draft tube gas, and the double pipe sparger arrangement situated 300 mm above the bottom of the draft tube supplied fluidizing air to the annulus. The arrangement, shown in Fig. 31, was identical to that found to be suitable for minimising crossflow, as described in Section 3.4.3.2, and used a 150 mm ID by 1500 mm long draft tube.
Fig. 31 System Geometry for Solid Circulation Experiments
1, Sm
O,3m
O,Sm --I
0, 15m
Annulus ~I--- gas inlet
..... _ Draft tube gas inlet
- 73 -
The particle properties of the powder used in the experiments are given in Table 1, Chapter 3. In the experiments the expanded annulus bed depth was about 20 - 50 mm below the top of the draft tube.
The slugging frequency was obtained by timing the period for a set number of plug eruptions (usually 20), counted visually. An average of at least three such measurements was taken. The draft tube bubble fraction was calculated by measuring the level of solids in the tube after quickly shutting off the air supply to both draft tube and annulus. The draft tube voidage was also obtained, in a separate set of experiments by a gamma ray absorption method.
4.4.2 Circulation Monitor
Solids circulation within the bed is monitored by tracking the progress of a radioactive 'pill'. This pill consists of a small Co.60 y-emitting source of about 4mCi embedded in refractory. The refractory provides protection for the Co core at the - 1000°C operating temperature for gasification experiments and under the alternating oxidizing and reducing conditions encountered as the pa rticle passes through the combustion and gasification zones; it also reduces the overall specific gravity of the pill to about 2,2 which is comparable with that of bed material (sand 2,5; coal 1,8).
In plate 2 an example of a pill, which has been broken open, shows the cobalt core and refractory lining. The pi ll size is about 6 mm in diameter which is similar to the larger coal and ash particles in the bed. The refractory material is virtually pure alumina, mixed with a few percent silicate as a binder, and fired under oxy-acety1ene flame.
The pill is tracked by two scintillation detectors which view the fluidized bed at different levels, through carefully defined horizontal slices. By following the successive presence of the radio-active source in these windows, the circulation of solids and their velocity in the bed may be inferred.
- 74 -
The windows, which are defined by lead shielding (see Fig. 32 and Appendix G) and their associated detectors, are located on opposite sides of the bed and may be independently moved up or down by a pulley and counterweight system, allowing the position of the slices of the bed which are viewed to be varied.
These windows may also be overlapped to determine small eddies within the bed, or to obtain solids residence times at various locations, as described by Masson et al [47, 11J.
The radiation detection instrumentation has also been adapted for bed density (ie. voidage) determination, by measuring the attenuation of radiation by bed material as described in the next Section.
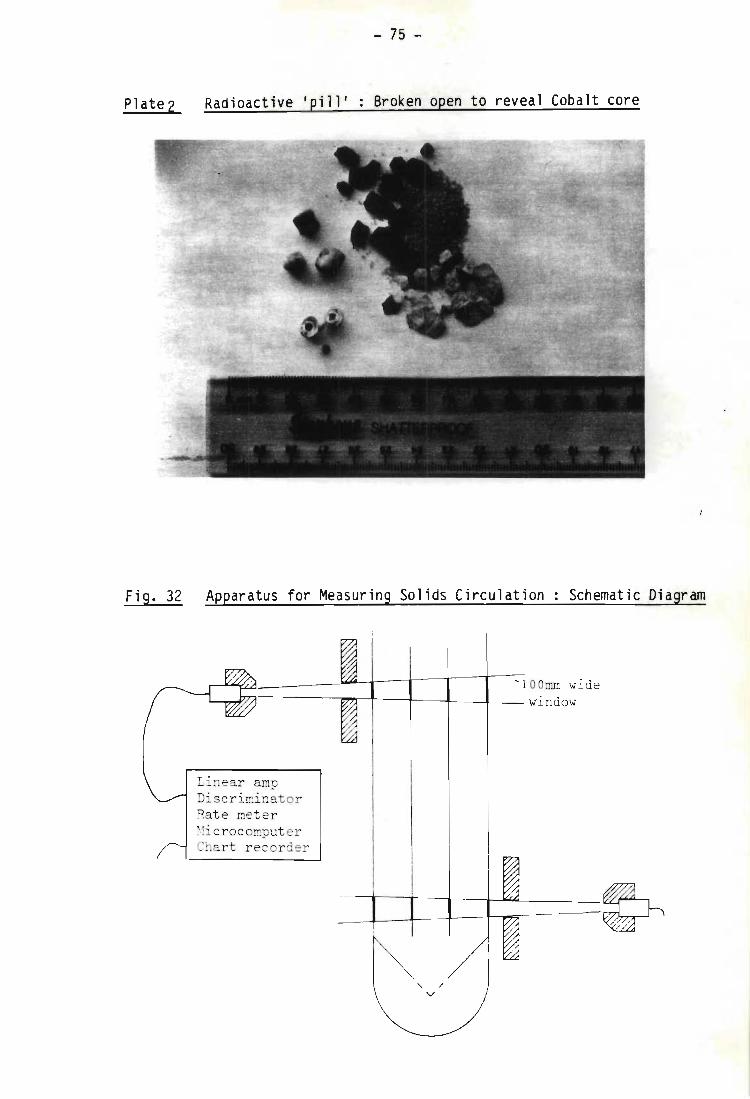
- 75 -
Plate 2 Radioactive 'pill ' Broken open to reveal Cobalt core
Fig. 32 Apparatus for Measuring Solids Circulation Schematic Diagram
~~~---------~~t---T---1r---t--~-lOOmm wide L,~~---------~~~---+--~----t---- wi ndow
Linear amp Discrirr:inator Rate meter ~·'!i crocorr.puter Chart recorder
, /
V
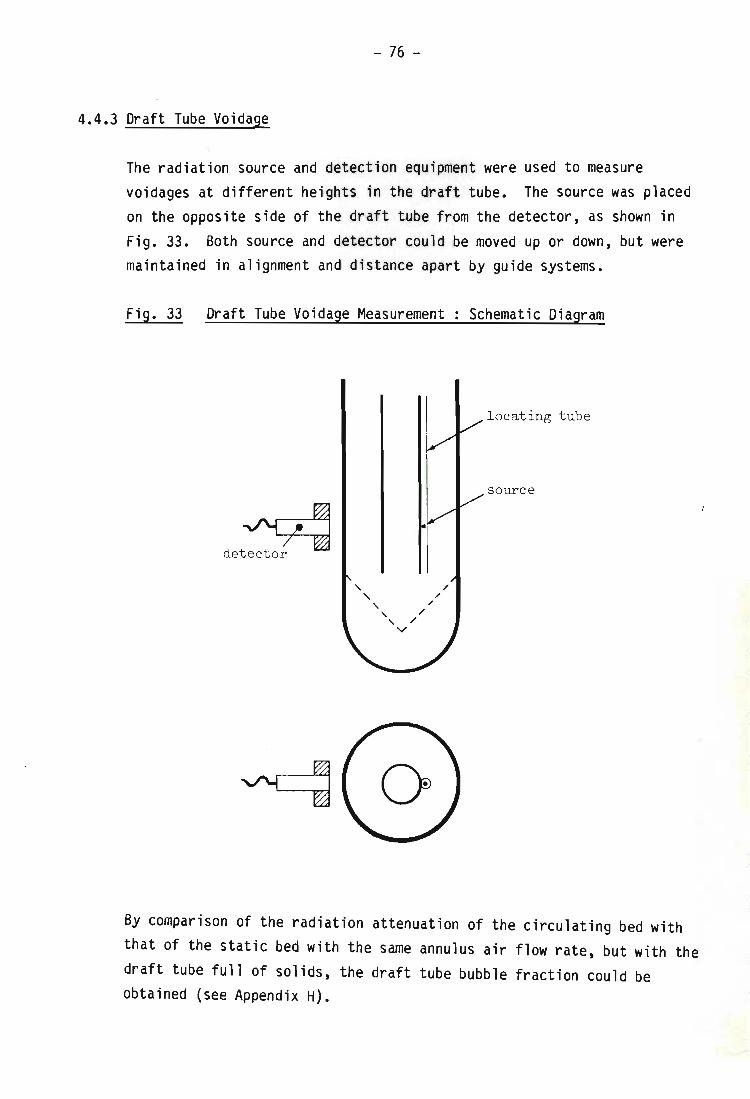
- 76 -
4.4.3 Draft Tube Voidage
The radiation source and detection equipment were used to measure voidages at different heights in the draft tube. The source was placed on the opposite side of the draft tube from the detector, as shown in Fig. 33. Both source and detector could be moved up or down, but were maintained in alignment and distance apart by guide systems.
Fig. 33 Draft Tube Voidage Measurement : Schematic Diagram
locat ing tube
source
~ detector
By comparison of the radiation attenuation of the circulating bed with that of the static bed with the same annulus air flow rate, but with the draft tube full of solids, the draft tube bubble fraction could be obtained (see Appendix H).
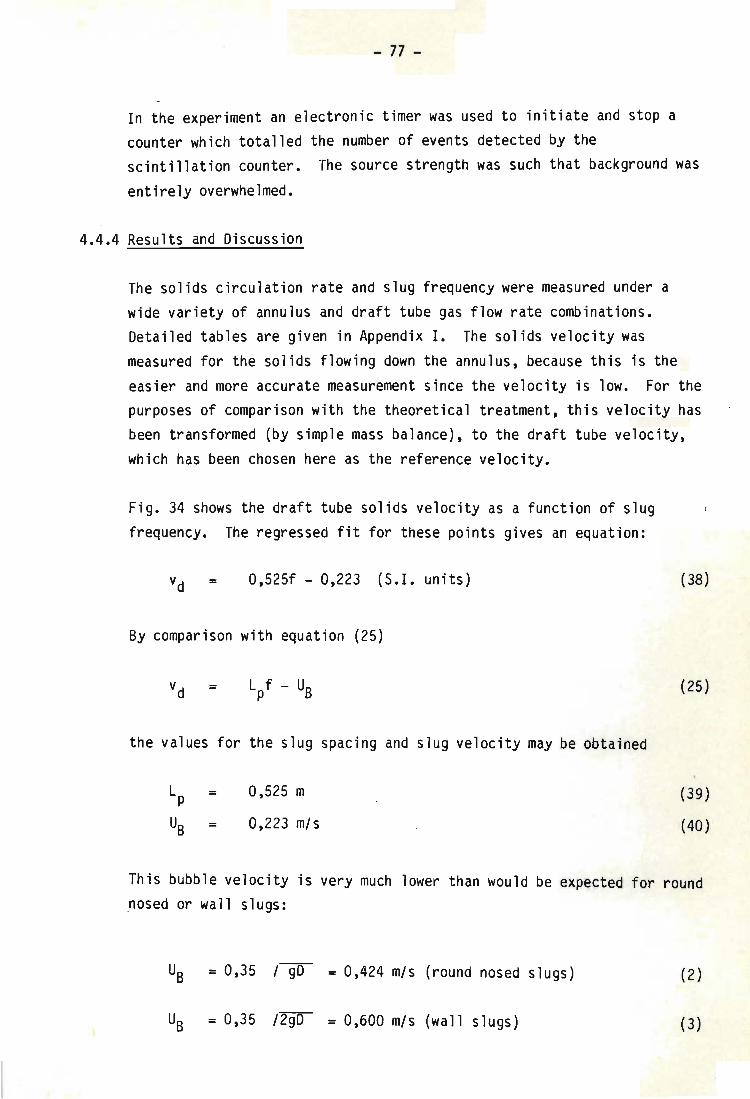
- 77 -
In the experiment an electronic timer was used to initiate and stop a counter which totalled the number of events detected by the scintillation counter. The source strength was such that background was entirely overwhelmed.
4.4.4 Results and Discussion
The solids circulation rate and slug frequency were measured under a wide variety of annulus and draft tube gas flow rate combinations. Detailed tables are given in Appendix I. The solids velocity was measured for the solids flowing down the annulus, because this is the easier and more accurate measurement since the velocity is low. For the purposes of comparison with the theoretical treatment, this velocity has been transformed (by simple mass balance), to the draft tube velocity, which has been chosen here as the reference velocity.
Fig. 34 shows the draft tube solids velocity as a function of slug . I
frequency. The regressed fit for these points gives an equation:
= 0,525f - 0,223 (S.I. units)
By comparison with equation (25)
vd = Lpf - UB
the values for the slug spacing and slug velocity may be obtained
Lp = 0,525 m
UB = 0,223 m/s
(38)
(25)
(39)
(40)
This bubble velocity is very much lower than would be expected for round posed or wall slugs:
Us = 0,35 /-go- = 0,424 m/s (round nosed slugs) (2)
Us = 0,35 /~ = 0,600 m/s (wall slugs) (3)
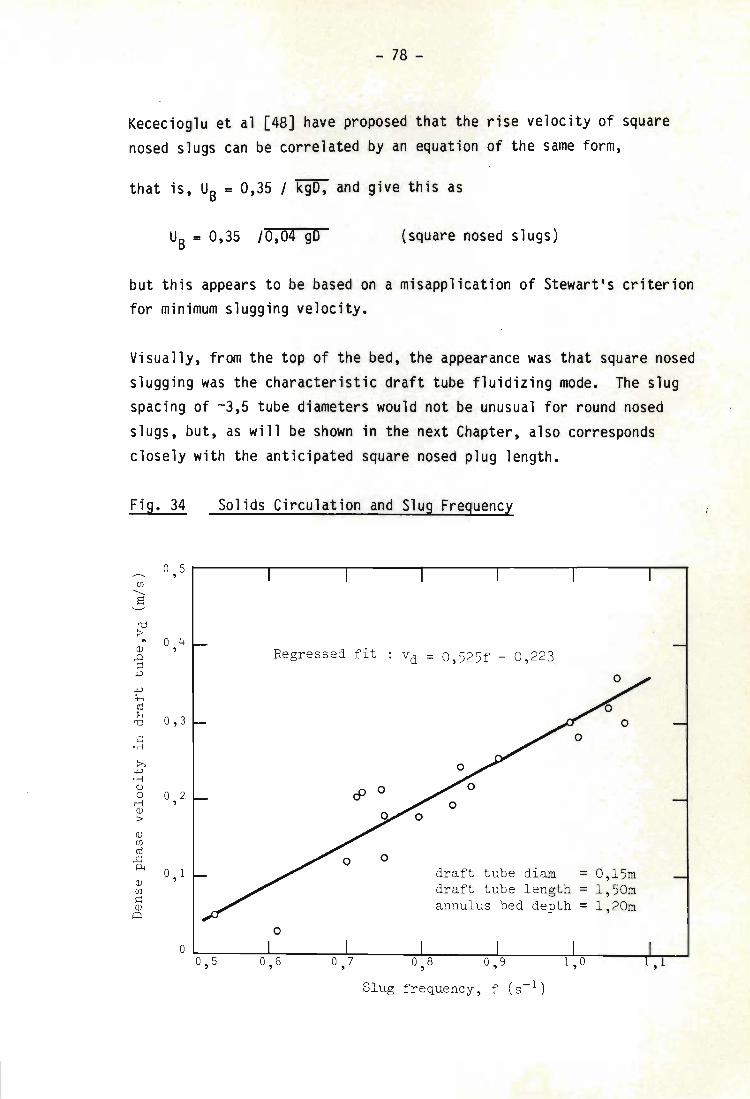
- 78 -
Kececioglu et al [48] have proposed that the rise velocity of square nosed slugs can be correlated by an equation of the same form,
that is, UB = 0,35 / kgO, and give this as
UB = 0,35 /0,04 gO (square nosed slugs)
but this appears to be based on a misapplication of Stewart's criterion for minimum slugging velocity.
Visually, from the top of the bed, the appearance was that square nosed slugging was the characterist i c draft tube fluidizing mode. The slug spacing of -3,5 tube diameters would not be unusual for round nosed slugs, but, as will be shown in the next Chapter, also corresponds closely with the anticipated square nosed plug length.
Fig. 34 Solids Circulation and Slug Frequency
0 5 , Ul
......... S
'd > .. 0 4 (lJ ,
Regressed fit vd = 0 , 525f - 0 , 223 .0 ;j
+> +> Ct-< ro H
0 , 3 'd 0
~ ' rl
» +> · rl ()
c9 0 0 0 2 rl , (lJ
> (lJ Ul ro
0 .c p..
0 1 draft tube diam = 0 , 15m (lJ
draft tube lengt h 1 , 50m Ul = ~ annulus bed depth = 1 , 20m (lJ
A
0
0 0 , 5 0 , 6 0 , 7 0 8 0,9 1 , 0 , 1 ,
Slug frequency , f (s-l )
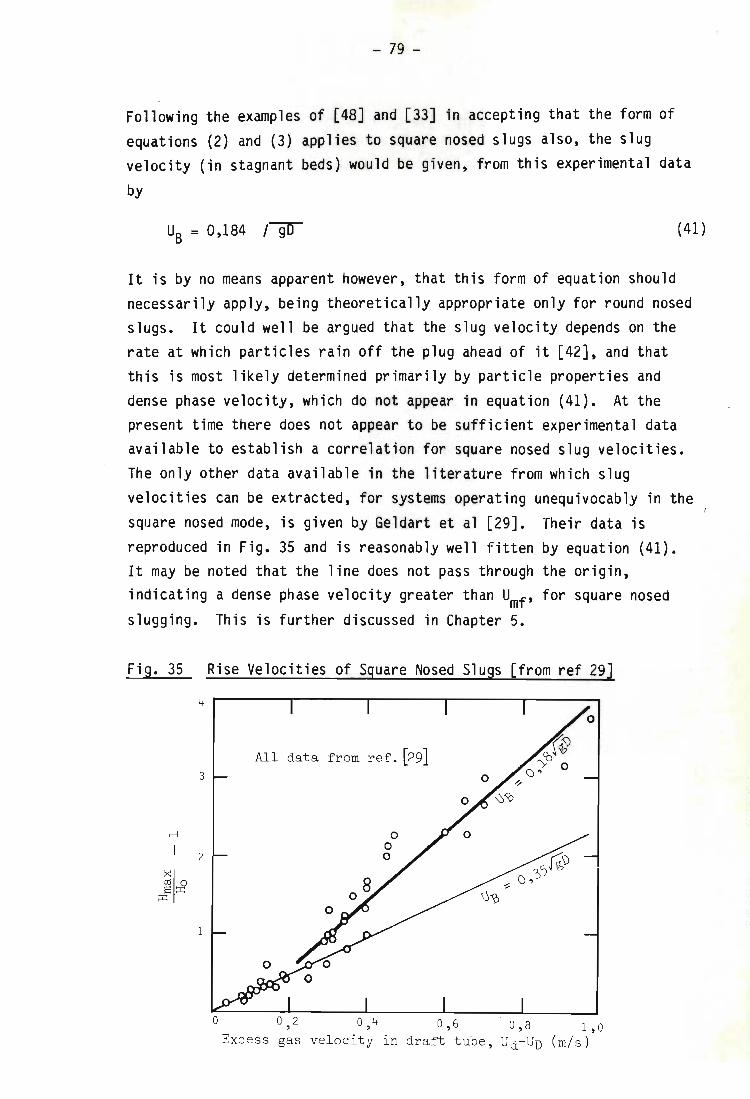
- 79 -
Following the examples of .[48] and [33] in accepting that the form of equations (2) and (3) appl ies to square nosed slugs also, the slug velocity (in stagnant beds) would be given, from this experimental data
by
Us = 0,184 ,-go- (41)
It is by no means apparent however, that this form of equation should necessarily apply, being theoretically appropriate only for round nosed slugs. It could well be argued that the slug velocity depends on the rate at which particles rain off the plug ahead of it [42], and that this is most likely determined primarily by particle properties and dense phase velocity, which do not appear in equation (41). At the present time there does not appear to be sufficient experimental data available to establish a correlation for square nosed slug velocities. The only other data available in the literature from which slug velocities can be extracted, for systems operating unequivocably in the square nosed mode, is given by Geldart et al [29]. Their data is reproduced in Fig. 35 and is reasonably well fitten by equation (41). It may be noted that the line does not pass through the origin, indicating a dense phase velocity greater than Umf , for square nosed slugging. This is further discussed in Chapter 5.
Fig. 35 Rise Velocities of Square Nosed Slugs [from ref 29]
rl
4 ~------r-------r-------~------~----~
3
2
1
°
All data from ref . [29]
o o o
0 , 2 0,4 0 , 5 0 , 8 1 , 0 Excess gas velocity in dra~ tube , Uj- UD (m/s)
- 80 -
The scale of experiment and the powder used unfortunately closely resemble the system employed in the experiments conducted here and a firm conclusion therefore cannot be drawn.
Satija and Fan [33J have recently measured slug velocities in square nosed slugging systems and report that the experimentally observed velocities are lower than would be anticipated for round nosed slugs. They correlate their data by an equation of the form
but unfortunately accept k1 = 0,35 to 0,5 (as for round nosed or wall slugs) and hence obtain values for k2 «1. A theoretical
(42)
justification for this approach, or for any k2 < 1, is not apparent. Insufficient data has been published in their article to enable a close examination of the trends, for example to test equation (41), and ther~ i
also appears to be some contradiction between the data which is presented and the commentary.
From equation (19)
(43)
Using the experimentally measured values presented in equations (39) and (40), the particular relationship for this apparatus and powder system may be obtained:
(S.I. units) (44)
showing that the circulation rate is directly related to the total gas flow through the draft tube.
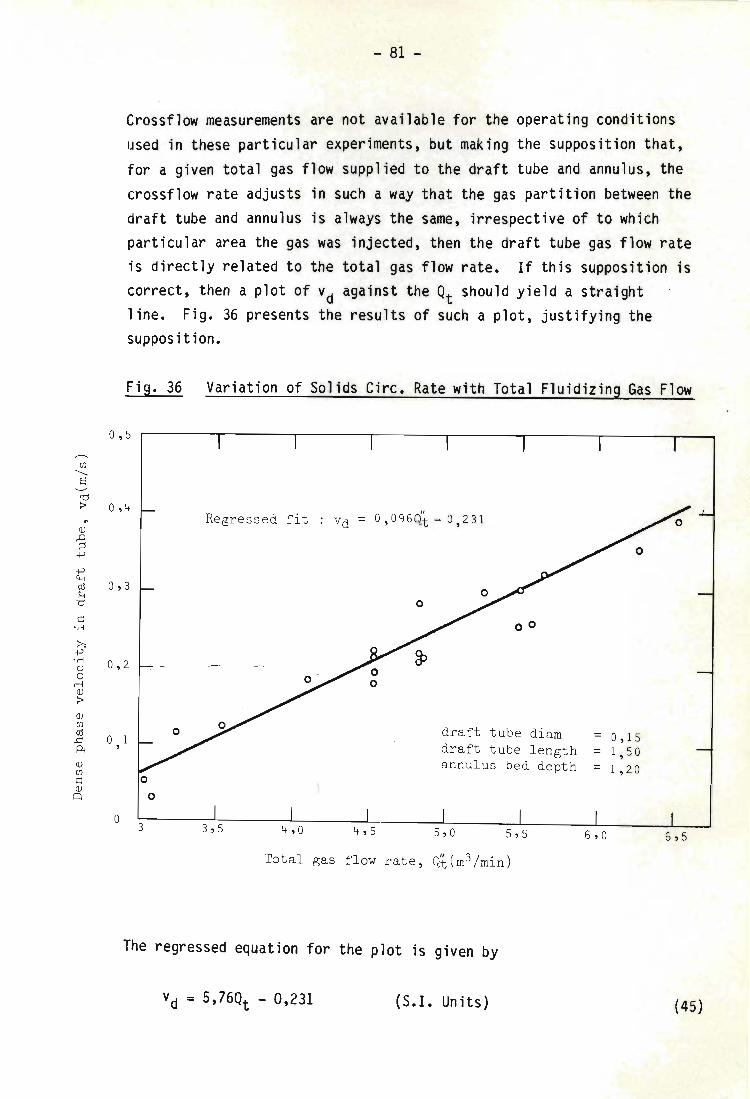
OJ "-s
cO
- 81 -
Crossflow measurements are not available for the operating conditions used in these particular experiments, but making the supposition that, for a given total gas flow supplied to the draft tube and annulus, the crossflow rate adjusts in such a way that the gas partition between the draft tube and annulus is always the same, irrespective of to which particular area the gas was injected, then the draft tube gas flow rate is directly related to the total gas flow rate. If this supposition is correct, then a plot of vd against the Qt should yield a straight line. Fig. 36 presents the results of such a plot, justifying the supposition.
Fig. 36 Variation of Sol ids Circ. Rate with Total Fluidizing Gas Flow
0 , 5 r-------.-------,--------r-------r-------.-------.-------,--~
:> 0 , 4 Regressed fit vd = 0 ,096Qt - 0 , 231 " Q)
'§ +'
+' Cr-I cO 0,3 H
cO
~ 'rl
Q) OJ ~ Q)
~
0 , 2
° 1 ,
°
o o
3
o
3 , 5
o
4 , 0
00
draft tube diam = 0 , 15 draft tube length = 1,50 annulus bed depth = 1 20 ,
5 , 0 5 , 5
Total gas flow rate , Qt(m3/min)
The regressed equation for the plot is given by
Vd = 5, 76Qt - 0,231 (S.l. Units) (45)
- 82 -
which, when combined with equation (44) relates the total gas rate to
the gas rate (including crossflow) up the draft tube:
(S.l. Units) (46)
This equation is naturally specific to the apparatus and powder used in
these experiments.
Since
(21)
(S.l. Units) (44)
£s = 0,65 (47)
irrespective of the gas flow rate up the draft tube. The validity of this result, which is based on the experimental measurement of slug frequency and solids velocity, can be simply checked by experimental
determination of the draft tube bubble fractions at different gas supply
rates to the annulus and draft tubes. This was done by rapidly shutting off the air flows to both annulus and draft tube legs and measuring the
height of powder in the draft tube. The results are given in Table 4.
The scatter of the data is quite high, but this is to be expected considering the errors introduced through the approximate equations (38) and (44). Nevertheless there does not seem to be any significant pattern in the scatter. An interesting point is that the measured bubble fraction of -0,65 to 0,7 (where most of the values lie) corresponds to a plug length of 500 - 525 mm, agreeing well with the value obtained earlier from equation (39) by a different method, and suggesting that there is only a single plug in the draft tube, at a
time. This also agrees with the argument put forward in Section 4.3.7, that the solids circulation rate would vary to damp out draft tube pressure fluctuations (ie. roughly, to maintain the draft tube solids inventory).
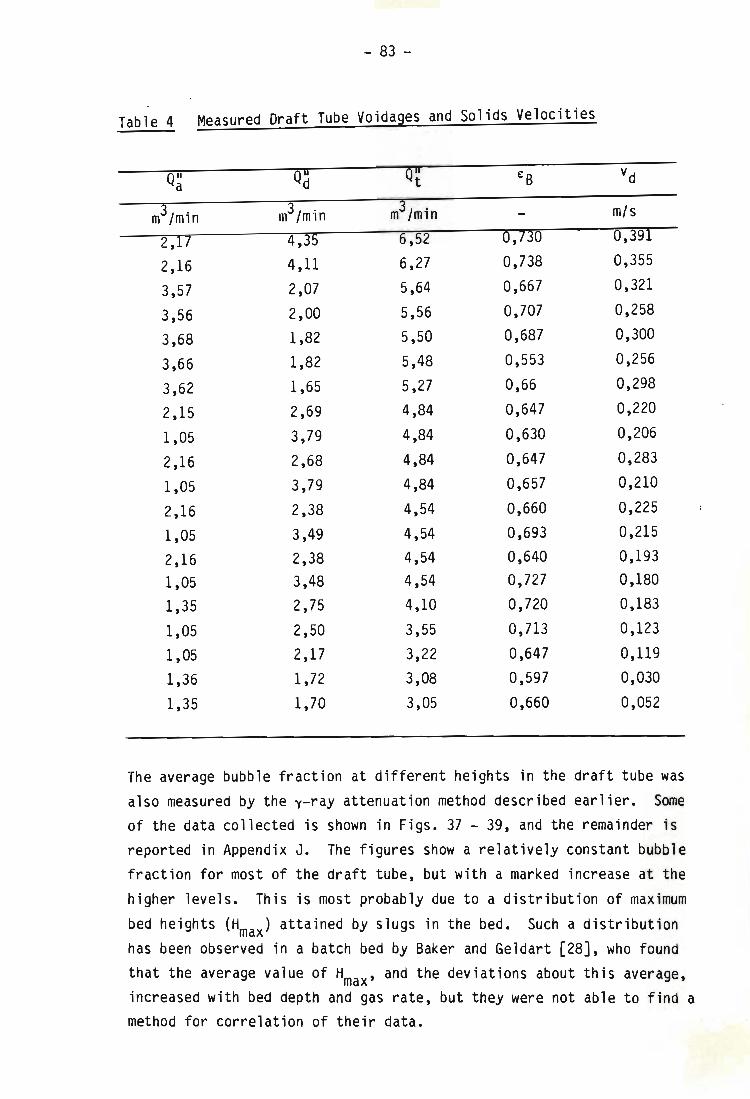
- 83 -
Table 4 Measured Draft Tube VOidages and Solids Velocities
Q" a Qd Qt ES vd
m3/min m3/min m3/min m/s 2,17 4,35 6,52 0,730 0,391 2,16 4,11 6,27 0,738 0,355 3,57 2,07 5,64 0,667 0,321 3,56 2,00 5,56 0,707 0,258 3,68 1,82 5,50 0,687 0,300 3,66 1,82 5,48 0,553 0,256 3,62 1,65 5,27 0,66 0,298 2,15 2,69 4,84 0,647 0,220 1,05 3,79 4,84 0,630 0,206 2,16 2,68 4,84 0,647 0,283 1,05 3,79 4,84 0,657 0,210 2,16 2,38 4,54 0,660 0,225 1,05 3,49 4,54 0,693 0,215 2,16 2,38 4,54 0,640 0,193 1,05 3,48 4,54 0,727 0,180 1,35 2,75 4,10 0,720 0,183 1,05 2,50 3,55 0,713 0,123 1,05 2,17 3,22 0,647 0,119 1,36 1,72 3,08 0,597 0,030 1,35 1,70 3,05 0,660 0,052
The average bubble fraction at different heights in the draft tube was
also measured by the y-ray attenuation method described earlier. Some of the data collected is shown in Figs. 37 - 39, and the remainder is reported in Appendix J. The figures show a relatively constant bubble fraction for most of the draft tube, but with a marked increase at the
higher levels. This is most probably due to a distribution of maximum
bed heights (Hmax) attained by slugs in the bed. Such a distribution has been observed in a batch bed by Saker and Geldart [28J, who found
that the average value of Hmax' and the deviations about this average, increased with bed depth and gas rate, but they were not able to find a method for correlation of their data.
. I
- 84 -
Qualitatively similar experimental observations have also been made by Gel'perin et al [34], also without analysis.
Correctly, this distribution of bed heights should be taken into account in the circulation model proposed in this Chapter, but this requires an understanding of the relationships wh ich govern this distribution.
In these experiments the lowest height which all the slugs attain - that is, the height at which the draft tube bubble fraction begins to increase - seems to be linearly related to the draft tube gas flow rate (and hence by equation (46) to the total gas flow), as shown in Fig. 40. This corresponds with the observations of Baker and Geldart. However, the apparatus used here was not suitable for this kind of experimental work, which could be more easily and accurately carried out in a simple batch bed, and this aspect was therefore not pursued further.
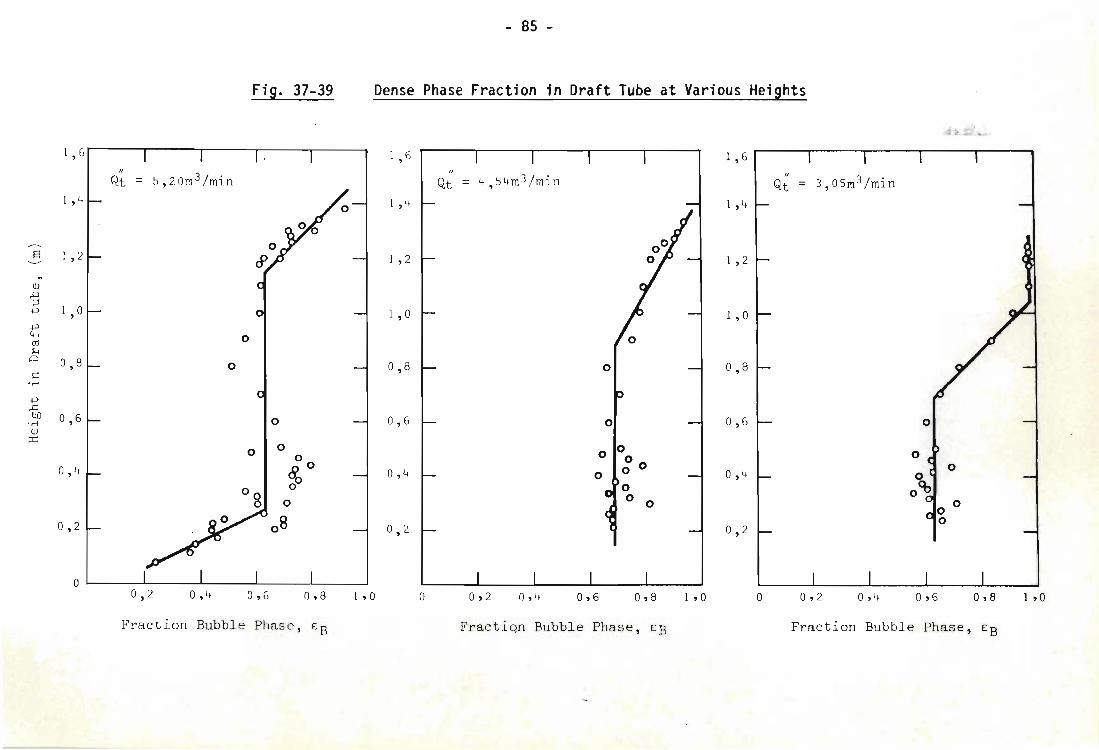
1 ,6 1
1 , 4 ~
S 1 , 2 r ~
.. Q)
.g 1 , 0 r +'
+' ", CIl H
Q 0,8 ~
\:! . ,-j
+' .c till 0 , 6 ~ .,-j
Q)
::r::
0 , 4 ~
0,2 I-
°
- 85 -
Fig. 37-39 Dense Phase Fraction in Draft Tube at Various Heights
r-- I ,
~J If _ 3 ' Qt - 5 , 20m /mln
~( 1 OJ -1
0
0 -4
10 -I
0 0
J 00
<S6 0 8
0
0
0 8 -I
0,2 0,4 0 , 6 0 , 8 1 , ° Fraction Bubble Phase , ER
1 6 ,
I· Q; = 4 , 5 l fm 3 /min
1 , 4
1 , 2 I / 1 , 0 I r
0,8 r- 01
0,6 ~ 01
0,4 L or 00 o 0
0, 2 ~ q
° 0 , 2 0 , 4 0 , 6 0 , 8
Fractio~ Bubble Phase , EB
1 , 6
1 , 4
1 1 , 2
-1 1 , °
~ 0 , 8
-I 0,6
J 0 , 4
-I 0 , 2
1 , ° °
/I
Qt = 3 , 05m 3 /min
0 , 2 0 , 4
0
0 , 6
.;to' ~ • ..........
0 , 8
Fraction Bubble Phase , EB
1 , °
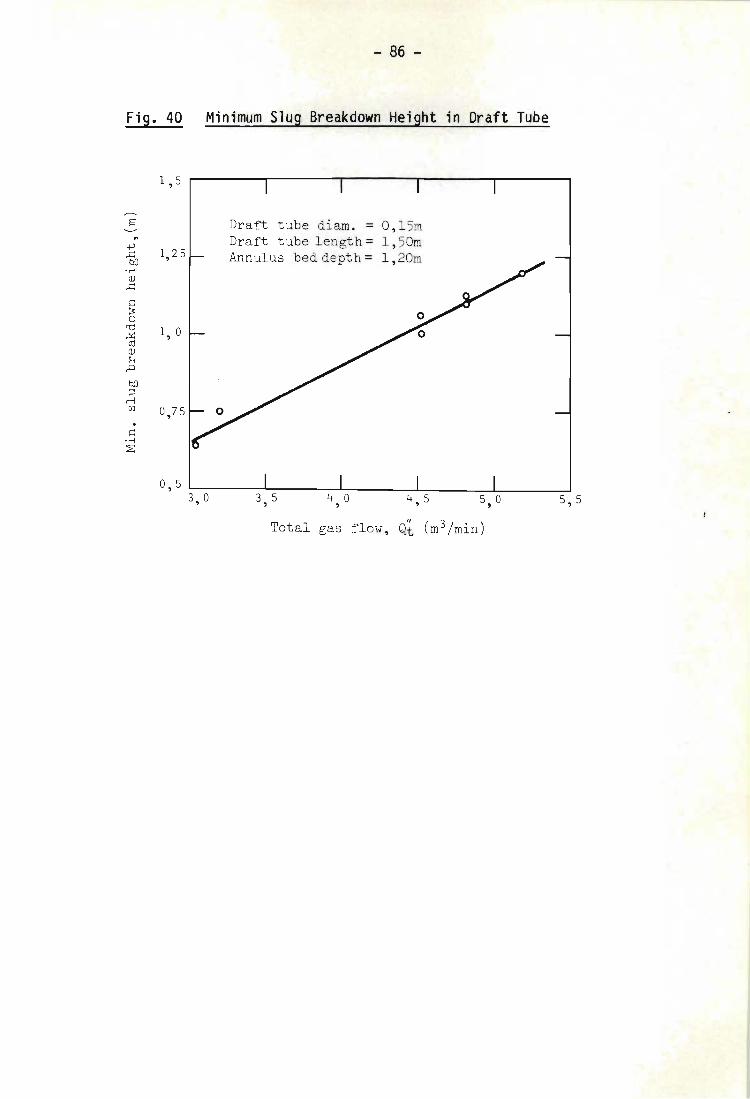
- 86 -
Fig. 40 Minimum Slug Breakdown Height in Draft Tube
1 , 5
~ Draft tube diam. = O,1 5m .. Draft tube length = 1, 5Om +" ..s:::: 1, 25 Annulus bed depth = 1, 20m bO '.-1 Q)
..s::::
Q ~ a cd
1, ° ..!:4 al Q)
H P
bO ;:j rl Ul 0,75 . Q
• .-1 :2:
0 , 5
3, ° 3, 5 4 , ° 4 , 5 5 , ° 5 , 5 . I
Total II
(m3/min) gas flow, Qt
- 87 -
4.5 CONCLUSION
The dominant slugging regime for the system investigated here has been found to be square nosed slugging. The slug rise velocity and dense phase plug length have been experimentally determined.
A theory has been developed which quantitatively accounts for the transport of solid material up a transporting fluidized bed operating in the slugging mode, with special reference to a draft tube fluidized bed. The particle circulation rate, bubble fraction and gas and solids residence times for the different slugging regimes - round nosed, square
nosed and wall slugs - are accounted for.
In order for the theory to have predictive value two pieces of information are outstanding. Firstly, it is necessary to esta~lish the relationships between plug length and slug velocity on the one hand, and particle and tube properties on the other. While this information is largely available for round nosed slugs and partially so for wall slugs, no such theory has appeared in the literature for square nosed slugging, despite the fact that this seems to be particularly favourable mode for gas-solid contacting.
Secondly, the actual gas flow rate up the draft tube must be known. Except under special circumstances, a proportion of the gas supplied to the draft tube may crossflow and pass up the annulus (reducing the actual draft tube gas velocity), or alternatively gas may enter from the annulus side into the draft tube (and contribute to the flow). A qualitative theory of crossflow has been presented in Chapter 3, but to quantify this the draft tube pressure drop must be evaluated.
In the next Chapter, a theory is formulated which enables the length of dense phase plugs in the draft tube to be predicted and from this the actual draft tube flow rate to be obtained. The pressure balance may thus be quantitatively solved, allowing the crossflow and solids circulation rate to be calculated.
- 88 -
CHAPTER 5
DRAFT TUBE FLUIDIZATION BEHAVIOUR
5.1 INTRODUCTION
The two-phase theory, in its simplest form, neglects the effects of interparticle or particle-wall forces [26]. Indeed, the disappearance of mechanical interparticle friction has been used as a definition of minimum fluidization velocity [49]. For the system under consideration here, however, neither the draft tube nor the annulus regions are necessarily operating as fully fluidized systems in the above sense. In the draft tube, the square nosed plugs of dense phase material act more like packed than fluidized beds, and interparticle forces are cansequently of major significance in their formation and behaviour. As far as the annulus is concerned, the gas rate may be less than Umf , and the bed of powder is partially supported by the stresses transmitted through the particles.
In this Chapter mechanical stress theory is used to determine the stress fields set up in powder beds at different degrees of fluidization. The application of this theory allows the length of plugs in the draft tube to be obtained as well as the minimum velocity at which such slugging can be initiated. The force balance around the draft tube - annulus circuit can thus be resolved and the gas flow distribution up the draft tube and annulus, as well as the solids circulation rate, predicted for different operating conditions.
The Chapter concludes with some discussion on the formation of square nosed slugs. Some of the important factors which determine the slugging mode are identified and qualitatively explained with reference to the mechanical stress fields in the powder; however, their effects and interactions are not sufficiently understood to enable a prediction of slugging mode, purely on the basis of powder and bed properties.
- 89 -
5.2 LENGTH OF PLUGS
5.2.1 Introduction
In order to determine the maximum and minimum stable lengths for plugs of powder in fluidized beds, it is necessary to examine the stress distribution in the powder.
Any element under load contains a point through which there passes three mutually orthogonal planes on which no shear stresses act. These are the principal planes and principal stresses. For powders the tensile strength is generally very small and only compressive stresses are important; furthermore, only the largest and smallest of the stresses need to be taken into account in determining whether the powder will yield or not, and the intermediate stress is without significance [50, 51J.
These shear and compressive stresses on an element of powder can be represented by a Mohr circle, which illustrates the shear and stress forces on planes at any angle to the major principal plane, Fig. 41. Under certain stress conditions the powder will yield and the locus of these yield points (for different states of consolidation of the powder) can be drawn on the Mohr diagram as a yield locus, for example line
1 w-w .
For any position in a mass of powder, the Mohr circle representing the stresses on an element at that position can be drawn. If the circle lies inside the powder yield locus then the element is in a state of equilibrium and no failure will occur at that point, at those stress conditions. If the major and minor stresses (0 and 0 respectively) z x are such that the Mohr circle is just touching the yield locus line then the material is about to flow.
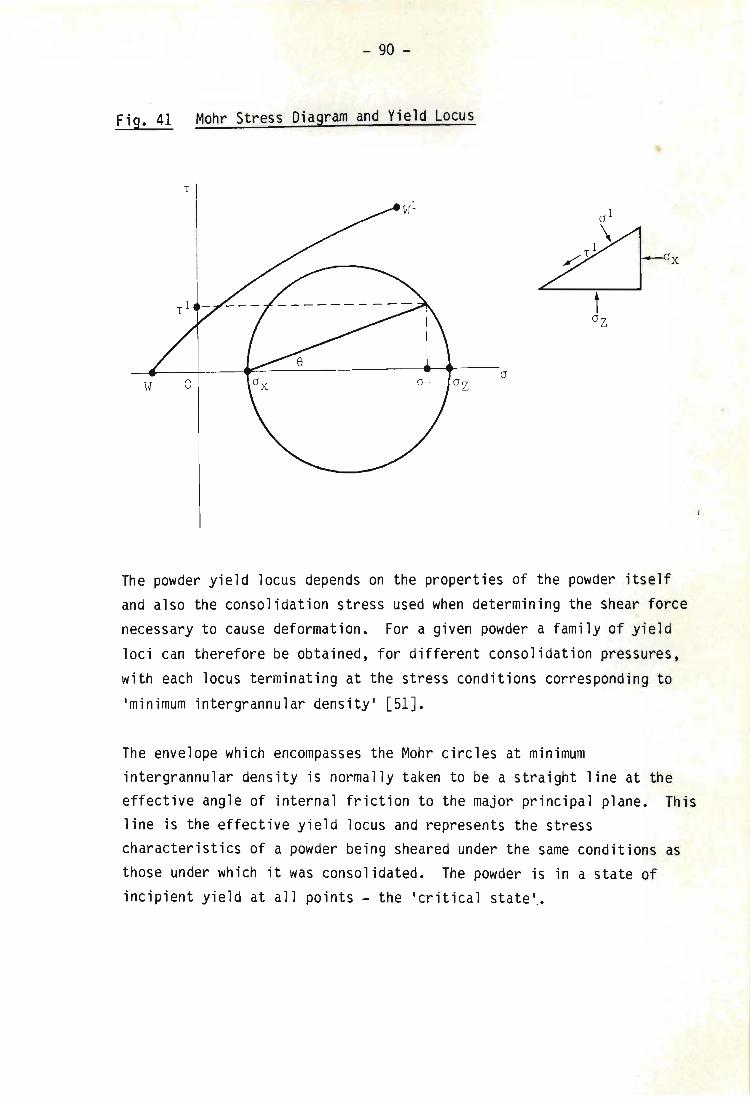
- 90 -
Fig. 41 Mohr Stress Diagram and Yield Locus
T
~~--~----~~--~----------~~t-----cr
The powder yield locus depends on the properties of the powder itself and also the consolidation stress used when determining the shear force necessary to cause deformation. For a given powder a family of yield
loci can therefore be obtained, for different consolidation pressures,
with each locus terminating at the stress conditions corresponding to
Iminimum intergrannular densityl [51J.
The envelope which encompasses the Mohr circles at minimum intergrannular density is normally taken to be a straight line at the effective angle of internal friction to the major principal plane. This line is the effective yield locus and represents the stress characteristics of a powder being sheared under the same conditions as those under which it was consolidated. The powder is in a state of incipient yield at all points - the Icritical state I .•
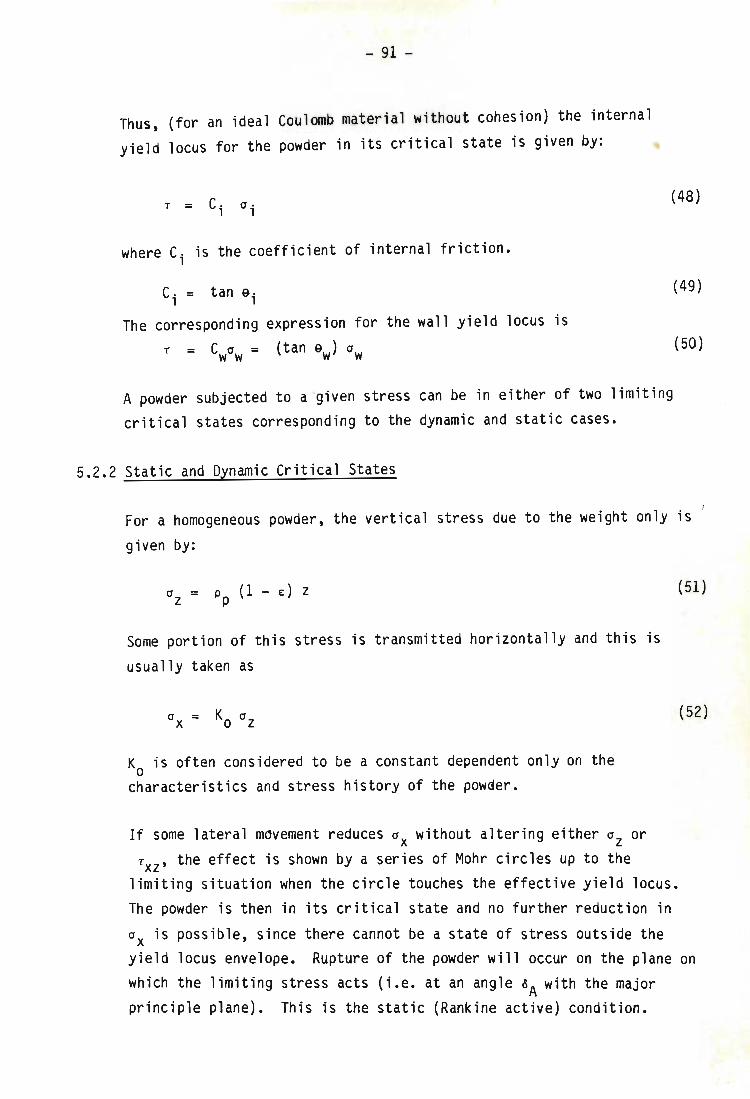
- 91 -
Thus, (for an ideal Coulomb material without cohesion) the internal yield locus for the powder in its critical state is given by:
T = C. a· 1 1
where Ci is the coefficient of internal friction.
C. = tan 9· 1 1
The corresponding expression for the wall yield locus is
T = Cwaw = (tan 9w) aw
A powder subjected to a given stress can be in either of two limiting critical states corresponding to the dynamic and static cases.
5.2.2 Static and Dynamic Critical States
(48)
(49)
(50)
For a homogeneous powder, the vertica l stress due to the weight only is given by:
a = p (1 - E) Z Z P
Some portion of this stress is transmitted horizontally and this is usually taken as
KO is often considered to be a constant dependent only on the characteristics and stress history of the powaer.
If some lateral movement reduces ax without altering either 0z or TXZ ' the effect is shown by a series of Mohr circles up to the
limiting situation when the circle touches the effective yield locus. The powder is then in its critical state and no further reduction in
(51)
(52)
ax is possible, since there cannot be a state of stress outside the yield locus envelope. Rupture of the powder will occur on the plane on which the limiting stress acts (i.e. at an angle 0A with the major principle plane). This is the static (Rankine active) condition.
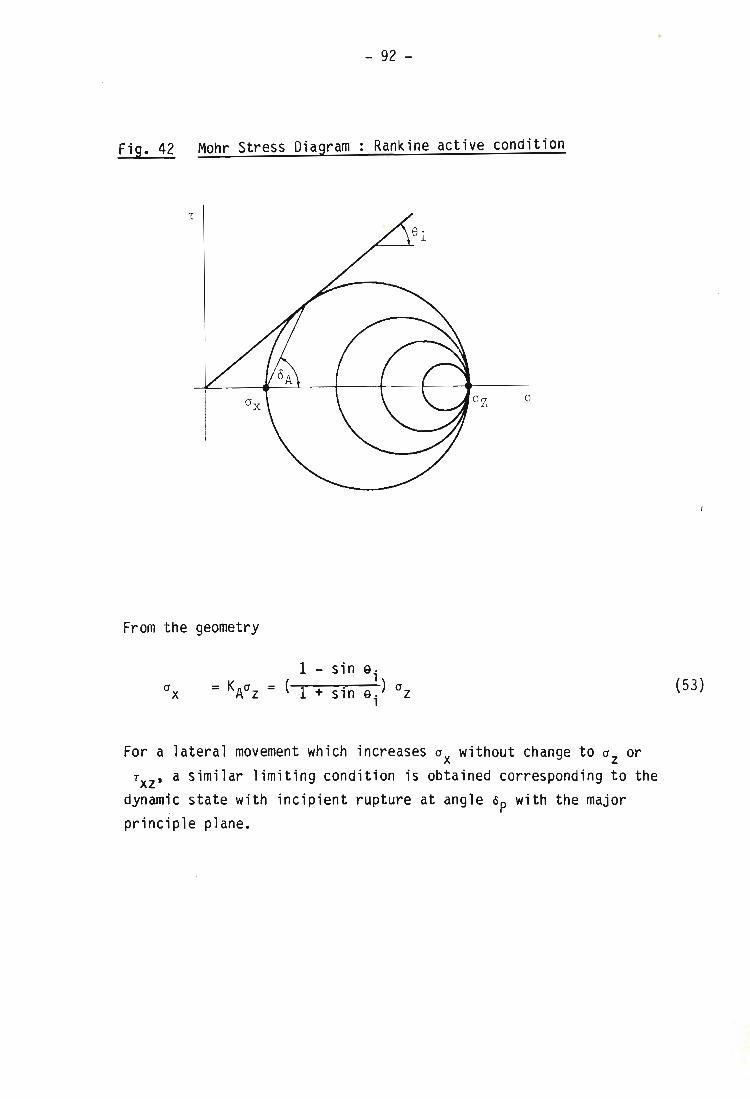
- 92 -
Fig. 42 Mohr Stress Diagram Rankine active condition
T
a
From the geometry
1 - sin 9. 1 ) = KAoz = 0 1 + sin 9 i z
For a lateral movement which increases Ox without change to Oz or TXZ ' a similar limiting condition is obtained corresponding to the
dynamic state with incipient rupture at angle op with the major principle plane.
(53)
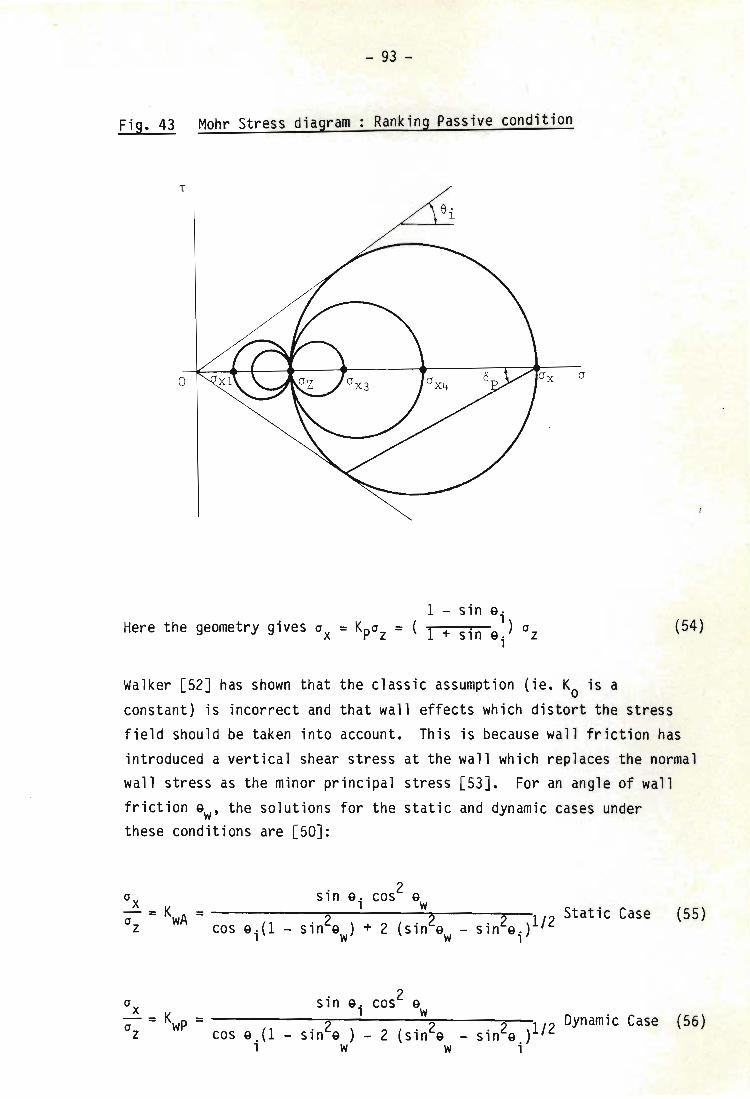
- 93 -
Fig. 43 Mohr Stress diagram Ranking Passive condition
T
o
e· 1
1 - sin 9 i Here the geometry gives Ox = Kpoz = ( I + sin 9i) 0z
(J
(S4)
Walker [S2J has shown that the classic assumption (ie. Ko is a
constant) is incorrect and that wall effects which distort the stress field should be taken into account. This is because wall friction has introduced a vertical shear stress at the wall which replaces the normal wall stress as the minor principal stress [S3J. For an angle of wall friction 9W' the solutions for the static and dynamic cases under these conditions are [SOJ:
Static Case sin29.)1/2
1
(SS)
Ox sin 9 i cos2 9w -0 = Kwp = 2 2. 2 1/2 Dynamic Case (56)
z cos 9.(1 - sin 9 ) - 2 (sin 9 - Sln 9.) 1 W W 1
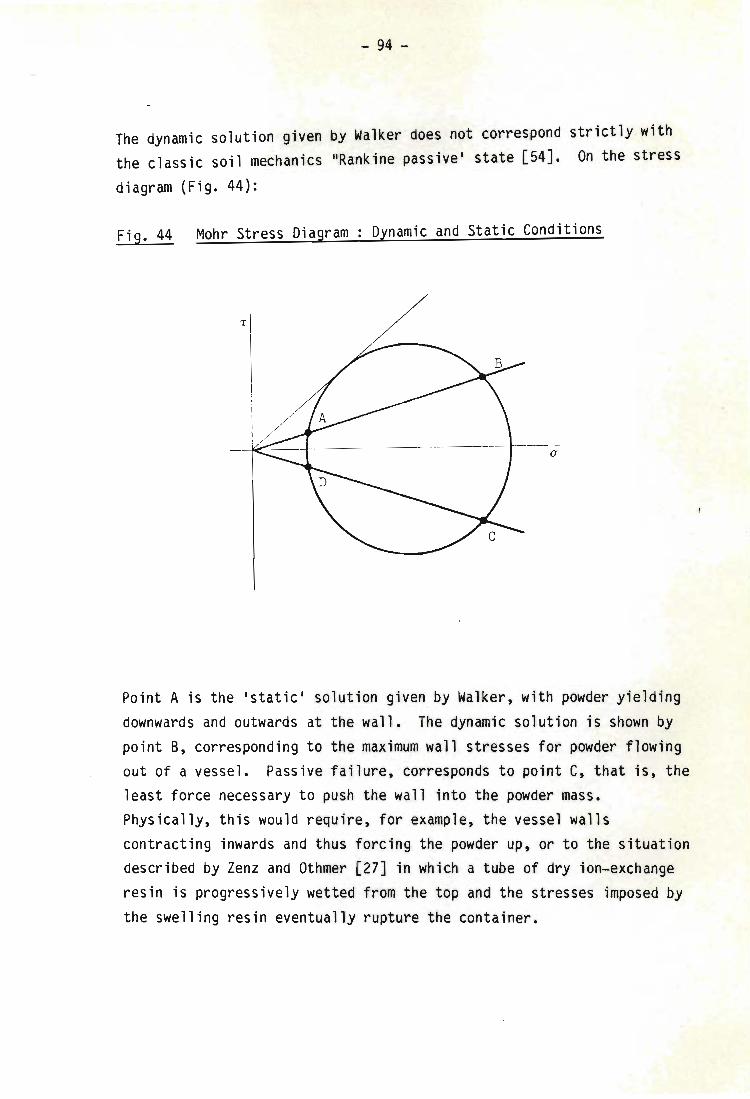
- 94 -
The dynamic solution given by Walker does not correspond strictly with the classic soil mechanics "Rankine passive' state [54]. On the stress diagram (Fig. 44):
F" 44 Mohr Stress D1"agram Dynamic and Static Conditions 19. _
a
Point A is the 'static' solution given by Walker, with powder yielding downwards and outwards at the wall. The dynamic solution is shown by point B, corresponding to the maximum wall stresses for powder flowing out of a vessel. Passive failure, corresponds to point C, that is, the least force necessary to push the wall into the powder mass. Physically, this would require, for example, the vessel walls contracting inwards and thus forcing the powder up, or to the situation described by Zenz and Othmer [27] in which a tube of dry ion-exchange resin is progressively wetted from the top and the stresses imposed by the swelling resin eventual ly rupture the container.
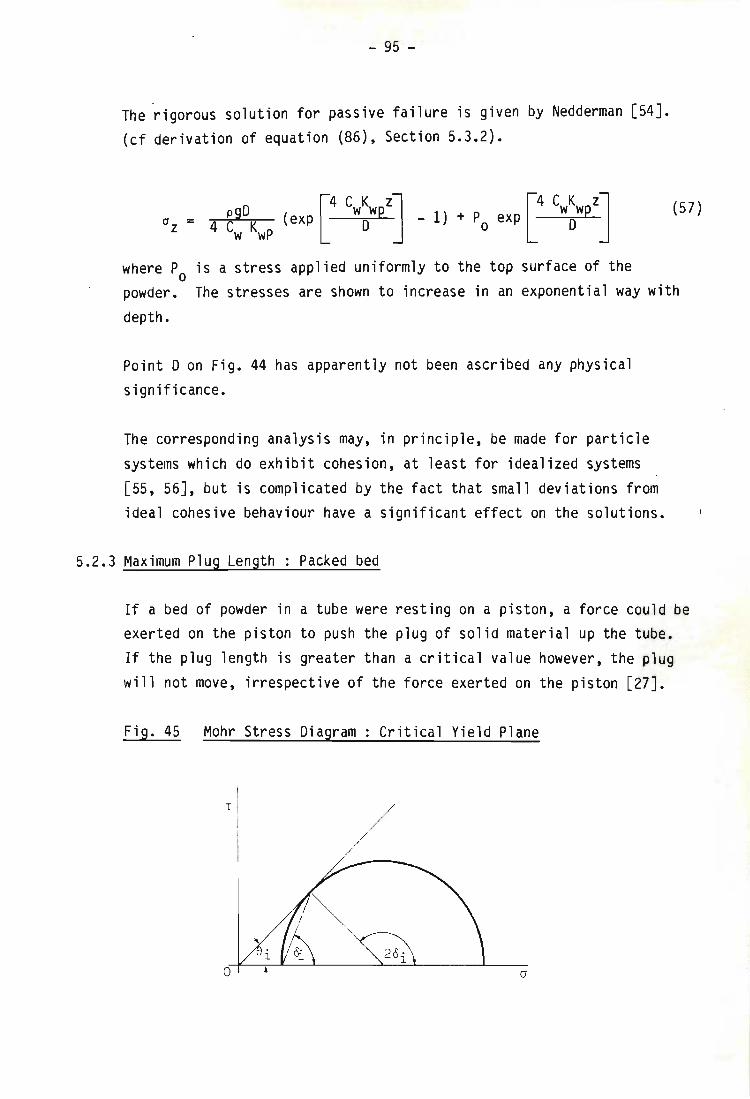
- 95 -
The rigorous solution for passive failure is given by Nedderman [54J. (cf derivation of equation (86), Section 5.3.2).
a = z (57)
where Po is a stress applied uniformly to the top surface of the powder. The stresses are shown to increase in an exponential way with
depth.
Point D on Fig. 44 has apparently not been ascribed any physical significance.
The corresponding analysis may, in principle, be made for particle systems which do exhibit cohesion, at least for idealized systems [55, 56J, but is complicated by the fact that small deviations from ideal cohesive behaviour have a significant effect on the solutions.
5.2.3 Maximum Plug Length: Packed bed
If a bed of powder in a tube were resting on a piston, a force could be exerted on the piston to push the plug of solid material up the tube. If the plug length is greater than a critical value however, the plug will not move, irrespective of the force exerted on the piston [27J.
Fig. 45 Mohr Stress Diagram: Critical Yield Plane
o a
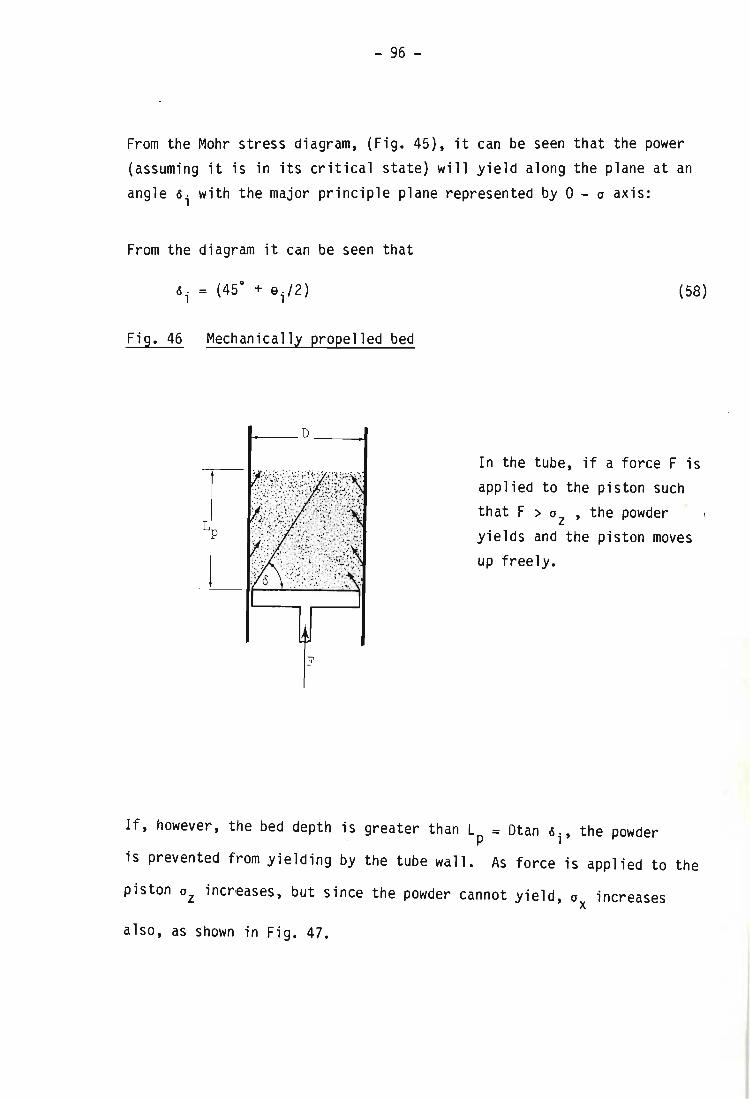
- 96 -
From the Mohr stress diagram, (Fig. 45), it can be seen that the power (assuming it is in its critical state) will yield along the plane at an angle 6. with the major principle plane represented by 0 - ° axis:
1
From the diagram it can be seen that
Fig. 46 Mechanically propelled bed
t-__ D _ _ -11
F
(58)
In the tube, if a force F is applied to the piston such
that F > 0z ' the powder yields and the piston moves up freely.
If, however, the bed depth is greater than L = Dtan 6., the powder - p 1
is prevented from yielding by the tube wall. As force is applied to the
piston 0z inc~eases, but since the powder cannot yield, ° increases x
also, as shown in Fig. 47.
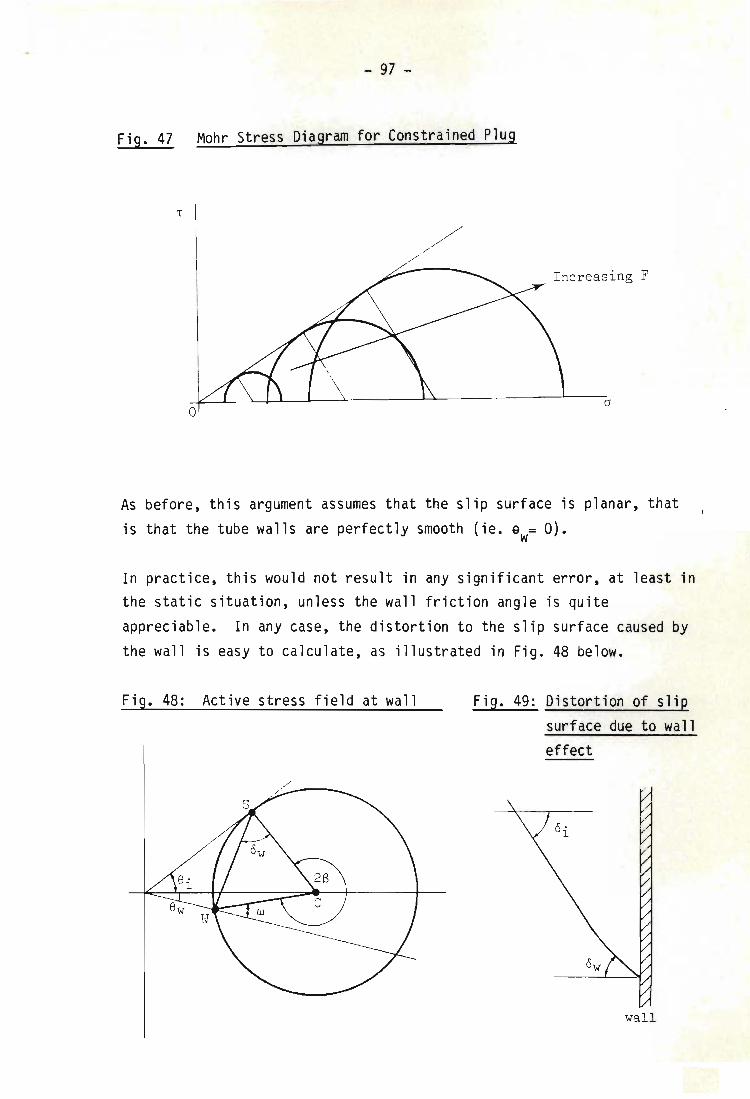
- 97 -
Fig. 47 Mohr Stress Diagram for Constrained Plug
T
Increasing F
a o
As before, this argument assumes that the slip surface is planar, that is that the tube walls are perfectly smooth (ie. 9w= 0).
In practice, this would not result in any significant error, at least in the static situation, unless the wall friction angle is quite appreciable. In any case, the distortion to the slip surface caused by the wall is easy to calculate, as illustrated in Fig. 48 below.
Fig. 48: Active stress field at wall Fig. 49: Distortion of slip surface due to wall effect
wall
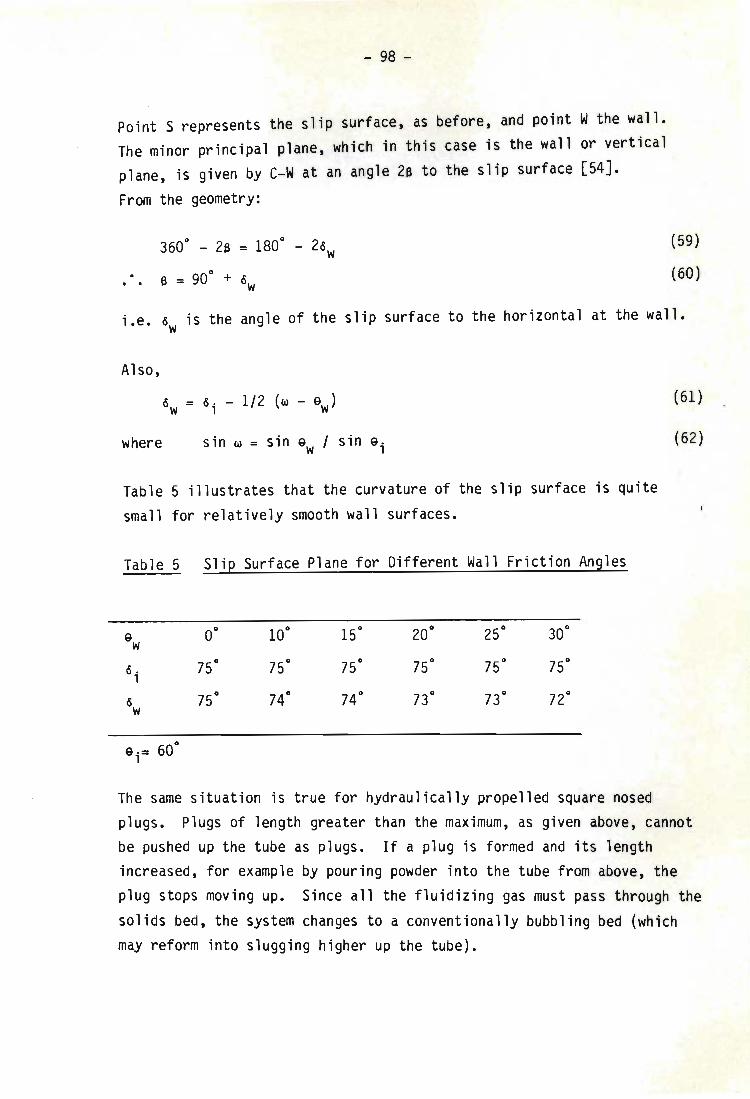
- 98 -
Point S represents the slip surface, as before, and point W the wall. The minor principal plane, which in this case is the wall or vertical plane, is given by C-W at an angle 28 to the slip surface [54J.
From the geometry:
(59)
(60)
i.e. 6w is the angle of the slip surface to the horizontal at the wall.
Also,
where sin w = sin 9w I sin 9 i
Table 5 illustrates that the curvature of the slip surface is quite small for relatively smooth wall surfaces.
Table 5 Slip Surface Plane for Different Wall Friction Angles
9 w 00
100
150
200
250
300
6. 1
750
750
750
750
750
750
6 750
74 0
740
730
73 0
72 0
w
9 i = 600
(61)
(62)
The same situation is true for hydraulically propelled square nosed plugs. Plugs of length greater than the maximum, as given above, cannot be pushed up the tube as plugs. If a plug is formed and its length increased, for example by pouring powder into the tube from above, the plug stops moving up. Since all the fluidizing gas must pass through the solids bed, the system changes to a conventionally bubbling bed (which may reform into slugging higher up the tube).
- 99 -
A further assumption which has been tacitly made in the above arguments is that the plug of solids is packed in its critical state. If the plug is fluidized to any degree, the plane of rupture is changed, as will be demonstrated in the next Section, and the maximum length of plug that
can be propelled is increased.
5.2.4 Stress Field in a Fluidized Bed
For a bed of cohesionless powder at its critical flow condition, it has
been shown that the yield plane is at an angle 0i to the major
principal plane, where
O. = (45 0
+ 9./2) , , (58)
If a fluid is passed up through the bed, the particles of solid in the bed are partially supported by the fluid drag and the powder may be expected to flow more easily, and to yield at on a different plane.
This is illustrated on the Mohr diagram shown in Fig. 50. With no fluidization, the critical yield point lies at Q, where the Mohr circle
touches the internal friction locus. With the powder partially fluidized, yield occurs more readily, that is, at lower stresses and
shears, but the yield point must still lie on the Mohr circle, for example at point P. The angles of the planes on which these forces act are also shown on the diagram: for the unfluized condition this is given by the angle of internal friction, 9 i ; and for the partially
fluidized condition by 9X
' Stresses in the powder act only in a direction normal to the friction plane and shear forces parallel to it.
If axes are set parallel and normal to the friction plane, the force balance on an element of powder in the bed may be formulated.
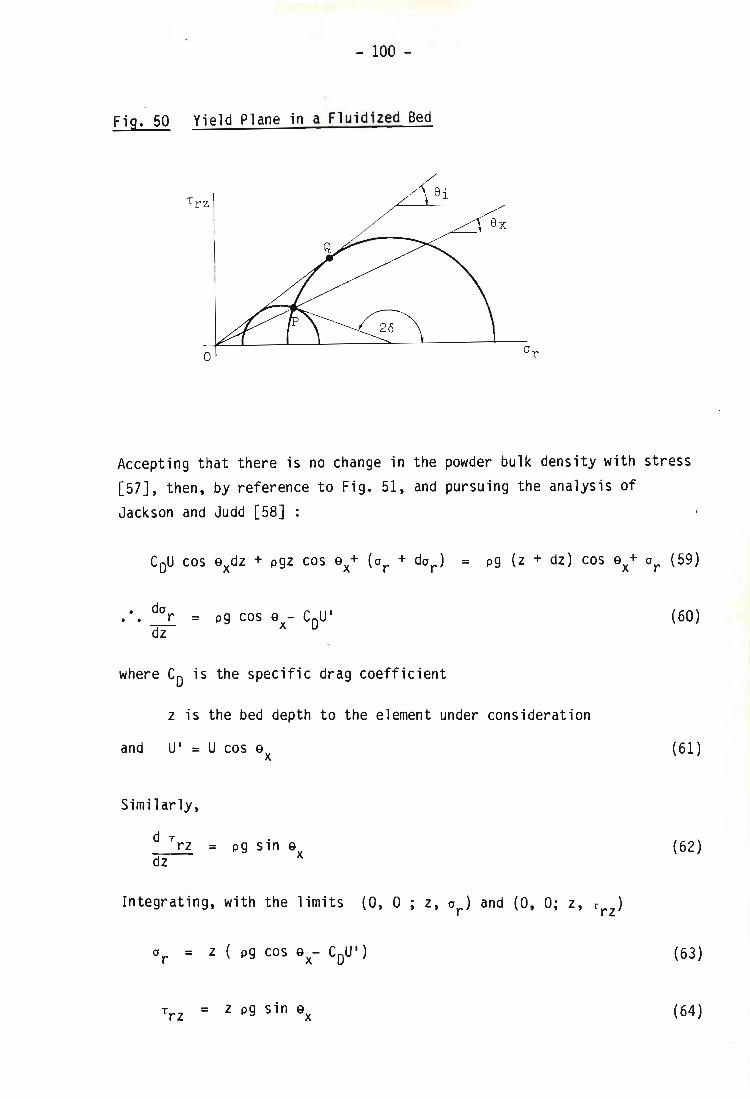
- 100 -
Fig. 50 Yield Plane in a Fluidized Bed
Trz
o
Accepting that there is no change in the powder bulk density with stress [57J, then, by reference to Fig. 51, and pursuing the analysis of Jackson and Judd [58J :
= pg (z + dz) cos a + a (59) X r
(60)
where Co is the specific drag coefficient
z is the bed depth to the element under consideration
and U' = U cos ax
Similarly,
d Trz __ . pg Sln ax
dz
Integrating, with the limits (0, 0 z, ar ) and (0, .0; z, T ) rz
(61)
(62)
(63)
(64)
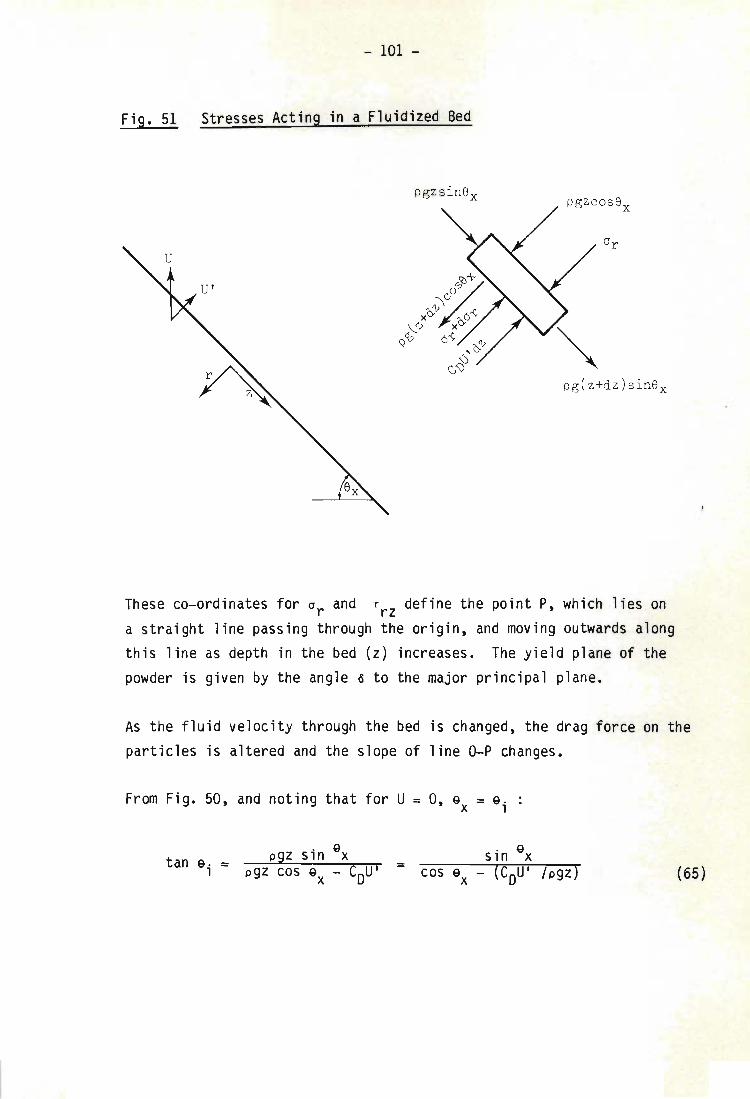
- 101 -
Fig. 51 Stresses Acting in a Fluidized Bed
pgzsin8x
pg(z+dz)sin8 x
These co-ordinates for or and Trz define the point P, which lies on a straight line passing through the origin, and moving outwards along this line as depth in the bed (z) increases. The yield plane of the powder is given by the angle 6 to the major principal plane.
As the fluid velocity through the bed is changed, the drag force on the particles is altered and the slope of line o-p changes.
From Fig. 50, and noting that for U = 0, Qx = Qi
tan Qi (65)
- 102 -
Two limiting conditions are apparent. For the case when there is no
fluid flow through the bed:
as U-o ex-ei 6 - (45 + e i /2)
Secondly, when the particles are fully supported by the fluid drag,
therefore from equation (65)
tan e = sin ex i --';;'~--:-:"U~, --
cos ex - /Umf
. sin-1 U' sin e i ) e = e. - (-. . X 1 Umf
Thus, as U - Umf e -x 0
U' Umf 6 - 90°
i.e.
(66)
(67)
(68)
It is therefore apparent that the maximum length of a plug of powder
that can be pushed up a tube as a plug increases with the degree of fluidization of the plug. In the limit, above the minimum bubbling velocity, this maximum length tends to infinity. This result has been experimentally observed [59] but without explanation in an apparatus in which a bed of powder was placed upon a porous piston. When the bed was fluidized there was apparently no limit to the depth of bed which could be moved by the piston.
The effective angle of friction of a powder is not changed by
fluidization as is often reported [e.g. 48, 60, 61J, being a property of
the powder only. The yield plane of the powder and the dynamic angle of
repose, ex' do however vary with the degree of fluidization.
- 103 -
5.2.5 Comparison of Predicted and Observed Plug Lengths
The experimentally determined dense phase plug lengths have been reported in Section 4.4.4, for a 150 mm diameter draft tube. From equation (38).
Lp = 0,525 m (39)
and this was further confirmed by direct measurement of the draft tube voidage which yielded the same value.
Assuming that the plug is a packed bed at its critical condition (which is reasonable since it is in the process of rupture as it moves up the draft tube), the effective angle of internal friction is given by:
The experimentally determined value [Appendix A] is -60 0
, which bears out the assumptions that the plug is packed and in its critical condition.
(69)
(70)
- 104 -
5.3 MINIMUM SLUGGING VELOCITY
5.3.1 Axisymetric Slugs
The average bubble size in a fluidized bed increases with increasing excess gas velocity and axisymetric (round nosed) slugging commences when the bubbles formed in the bed are sufficiently large for their behaviour to be dominated by wall effects [28J. A generally accepted criterion for the transition from bubbling to slug flow due to Stewart [24], proposes a minimum slugging velocity given by:
U - U f = 0,07 (gO) 1/2 (71) ms m
This has been amended for shallow beds (i.e. less than about 100 mm deep) by Baeyens and Geldart [25]:
U - U = ° 07 (gO)1/2 + 1 6 x 10⁻³ (H - H )2 ms mf' , 0 mf (72)
Alternative empirically defined criteria have also been presented, for
example, by Broadhurst and Becker [62J and . Leva et al [63J.
5.3.2 Square Nosed Slugs : Theoretical Evaluation of Minimum Slugging Velocity
For square nosed slugging, in which the gas void occupies the entire cross-section of the bed, the minimum gas rate to sustain this mode of fluidization may be obtained by the force balance over a dense phase plug. This requires an examination of the stress fields established in the plug.
For vertical flow, the forces acting on a differential slice of dense phase in a plug are shown in Fig. 52. The force balance gives:
n02 02 + 02 02 02 ~ pg dz + nO TW dz + ~ °z ~ P = ~ (oz + doz) + ~ (P + dP)
(73)
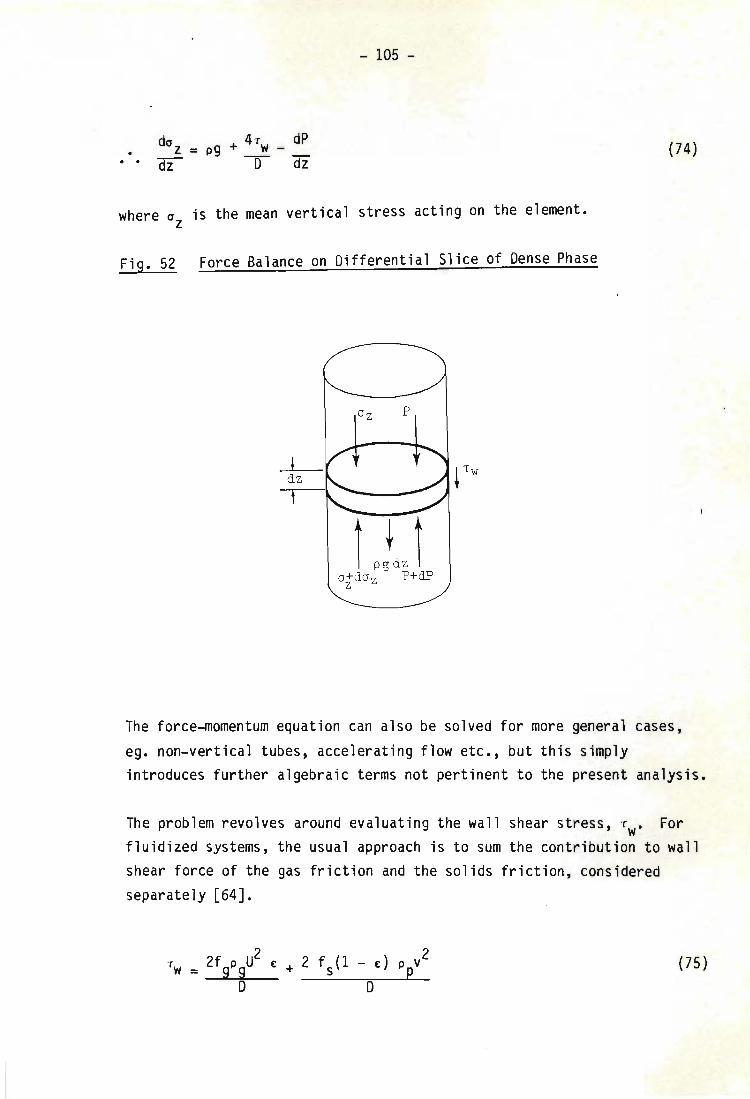
- 105 -
d 4T dP °z = pg + ~ -F D dz
(74)
where 0z is the mean vertical stress acting on the element.
Fig. 52 Force Balance on Differential Slice of Dense Phase
dz
The force-momentum equation can also be solved for more general cases,
ego non-vertical tubes, accelerating flow etc., but this simply introduces further algebraic terms not pertinent to the present analysis.
The problem revolves around evaluating the wall shear stress, TW. For fluidized systems, the usual approach is to sum the contribution to wall shear force of the gas friction and the solids friction, considered separately [64J.
(75)
- 106 -
Arastoopour et a1 [65J simplify the problem by ignoring the solids friction, but this is clearly only acceptable for systems in which the particle concentration is very low. A large number of empirical correlations are available for the evaluation of the solids friction factor and mixture voidage [reviewed in 66J, but there is some controversy over their completeness and the confidence with which they
may be extrapolated [64J.
As far as the draft tube is concerned, square nosed slugging is more like packed (i.e. non-fluidized) than fluidized flow. For non-fluidized dense phase flow, the wall shear stress term depends on the angles of wall friction, internal friction and average stress. The exact relationship is given with varying degrees of sophistication by the theories of Coulomb, Janssen [in 54J, Sokolovski [67J, Walker [52J and Walters [50J. The development of stress theory related to flow in silos and standpipes has been extensively reviewed by Jones [68J.
Since the dense phase plug behaves like a packed bed, stress analysis theory developed for powder flow in hoppers and silos may be adapted and applied. The fundamental difference between the plug flow in square nosed slugging beds and gravity flow of powders from silos, insofar as the wall shear is concerned, is that frictional forces act to support the solids for bulk flow out of a silo, while for plug flow they act with the powder weight to oppose the motion of the plug up the tube. The methods employed to evaluate the shear term are identical in both cases: only the direction in which the forces act, differs.
Following the treatment of Walker [52J and Walters [50J, the mean vertical stress and the vertical stress at the wall of the tube are related by the expression
(76)
- 107 -
where the distribution factor D depends on the angles of friction of the powder and wall, according to the equation [50]:
D =
with y = 3~ [1 - (1 - C)3/2]
(77 )
(78)
(79)
The solution given reflects the Rankine active (static) case which is relevant for square nosed plug flow. (The vertical stress is increased until failure occurs in the powder, while the horizontal stress is not changed, corresponding to Fig. 42 - the Rankine active condition).
Walters also shows that the wall shear, can be related to the vertical wall stress by the expression
. I
sin 9w cos2 9 i with B = ------~----___,.:___--____,::_______::~ (1 + sin2
9.) + 2 (sin2 9. - sin2 9 )1/2 1 1 w
T wz = B D (c z + P z)
Casting equation (74) into dimensionless form by defining the terms
Sz = (c z + Pz)/pgD
T = T /pgD w w
Z = z/D
. dSz = 48 D S + 1 . . d7 z
(80)
(81)
(82)
(83)
(84)
(85)
(86)
- 108 -
Integrating equation (86) for the limits (Z = 0, Sz = 0) and (Z, Sz)
S = (e 4BD Z_ 1) z 4B
(87)
(88)
This solution corresponds to point 0 on Fig. 44.
The minimum (square nosed) slugging velocity - at which slugging just commences - can now be calculated for any bed depth. If the bed depth is greater than the maximum plug length, then square nosed slugging is not/ a stable operating condition through the whole depth of bed, although plugs may form, burst into bubbles and reform within the tube (see Section 5.2.3).
At the onset of slugging the powder particles in the plug are just supported by the fluid drag up through it. Assuming that the fluid is incompressible and that the dense phase voidage remains constant throughout the bed, equation (74) may be integrated over the whole length of a plug to give
~p 4'fw L = pg + 0
P
Tw is the average wall shear over the length of the plug, and may be evaluated from equation (88).
J Lp/O
TW/ = T = 0 1/4 (e4B D Z _ 1) dZ pgO w -r; 0
.•. Tw = 16r BD (e + 4BD Lp/D - 4BD ~ - 1) p 0
(89)
(90)
(91)
(84)
- 109 -
The only upward force on the plug is the drag force due to the gas flow through it. Since the plug behaves like a packed bed, containing no bubbles, the pressure drop due to this drag may be calculated by, for example, the Ergun equation [21J. Assuming that the dense phase voidage is Emf' and designating the minimum slugging velocity Ums :
with K1 =
The downward forces on the plug are the weight of the powder and the shear force acting on the wall.
(92)
(93)
(94)
dPI = pg + pg (4 Tw ) = pg (1 + 4 Tw) -L- DOWN
. (95)
Since, at minimum fluidizat ion the pressure drop through the bed is equal to the weight of the bed:
(96)
(97)
Combining equations (92) and (97) allows the minimum slugging velocity to be calculated
- 110 -
There is very little experimental data reported in the literature concerning the onset of square nosed slugging against which equation (98) may be tested. Yutani et al have apparently experimentally measured the shear force between the walls of a vertical tube and a mass of powder flowing down within it and pouring out of the bottom [reported in 69]. They obtained the result that the shear force is equal to the weight of the particles remaining in the column. Based on this result Ho et al [69] have argued that the wall shear forces acting on a plug at the point of incipient (square nosed) slugging, are equal to the weight of the plug, since upflow and downflow are the same except for the direction in which the frictional forces act. They also present experimental measurements of minimum slugging velocities which support their proposal that wall shear forces are equal to the bed weight, and put forward an equation to calculate minimum slugging velocity as:
This is identical to equation (98) with 4T = 1. w
(99)
It would seem that this finding (that the shear forces are equal to the bed weight) is an entirely fortuitous result, for the powders which they used in their experiments. Sufficient data on the particle properties is not reported to check this closely, but using typical values for the materials which they used in their experiments, equation (88) yields a
result of 4Tw = 0,8, which is quite close to the value of 4Tw = 1, employed in equation (99).
The basis of their argument, namely Yutani et als experiments, is also not necessarily correct. In mass downflow of solids in a column, wall friction would be progressively mobilised against the solids flow, up to a maximum equal to the weight of the powder in the tube. The wall shear force is entirely reactionary so that provided that the maximum wall
- 111 -
shear force that can be mobilised is less than the solids weight, the experiment is conceptually correct, but if wall friction can potentially be greater than the weight of the powder, then only that proportion necessary to counteract the solids weight will be mobilised.
In upflow, on the other hand, friction is entirely mobilised before the mass movement of the dense phase plug can occur and wall shear forces are not restricted to a maximum value equal to the bed weight.
- 112 -
5.4 PRESSURE BALANCE AROUND A CIRCULATING SYSTEM
In a circulating system frictional resistance is mobilised to retard the bulk flow of dense phase material. The draft tube and annulus will be considered separately, because different mechanisms operate.
5.4.1 Annulus Side
As far as the annulus is concerned, the powder is partially fluidized and the shear force may be evaluated by the approximate theory of La Nauze [16]. Although this model is only tentative, it may be expected to overestimate the wall shear force, particularly if the bed is not fully fluidized.
According to this model the magnitude of the wall stress may be calculated from the energy dissipated by the partic)es striking the wall:
(100)
Assuming the average random particle velocity (vp) is at worst equivalent to the superficial gas velocity, the equation is reduced to:
(101)
In the system under consideration here , this corresponds to a pressure loss due to wall friction in the annulus of about 0,1 kPa, which is less than 1 percent of the total pressure drop over the annulus (Appendix K) and may consequently be neglected.
Strictly speaking the effect of gas expansion due to the reduction in pressure should also be allowed for. Once again the overall effect of this is relatively small (typically less than 5 percent change in the calculated pressure drop for the bed depths used in these experiments). The correction required is derived in Appendix E.
- 113 -
5.4.2 Draft Tube Side
The plug flow of dense phase in the draft tube could be modelled on the basis of either a viscous or a dry friction model. If the flow is assumed to be viscous a Bingham model could be applied [70, 71]. On the other hand Nedderman and Laohakul [72] have demonstrated that viscous flow models are not suitable for bulk flow of unfluidized grannular particles. Although they do observe a shear region next to the vessel walls, they attribute this to particle-wall geometrical effects, because the region is very narrow (about six particle diameters) and remains constant, irrespective of flow conditions. Similarly, the flow of unfluidized particles over relatively smooth inclined surfaces has been shown to occur as slide [73], supporting the use of a simple dry friction model. Certainly, the visual appearance is that the plug slides up the tube as a single unified mass.
When the plug is just about to slide, the pressure drop through it is given by equation (95). For a moving plug this force balance may be amended to:
pg (1 + 4 Tw) + F s (102)
Where Fs is the additional pressure drop due to the bulk movement of solids. From equation (75), and neglecting the very small contribution due to gas frict ion
(103)
where v is the relative velocity between the dense phase and the wall, given by
(104)
The problem now revolves around obtaining a suitable value for f the s'
particle-wall friction factor. Accepting the dry friction model, it may
- 114 -
be expected that fs will be a constant, irrespective of the gas rate or solids circu lation rate, dependent only on the particle and wall properties. Since there is no general theory available to predict dry friction, it is necessary to evaluate this factor empirically.
5.4.3 Pressure Balance around the Circuit
We are now in a position to mathematically solve the pressure balance around the draft tube annulus circuit, from which the gas distribution between the two legs as well as the solid circulation rate may be predicted •
. On the draft tube side, the pressure drop is given by the sum of the contributions due to:
(a) the pressure drop necessary to initiate square nosed slugging
and T Dd (e + 4BD Lp/Dd _ 480 Ln _ 1) w = 16LpBD -L
Dd
(89)
(69)
(91)
(b) the pressure drop due to accelleration of the dense phase material
(105)
(25)
and (43)
(c) the pressure drop due to sliding friction
(103)
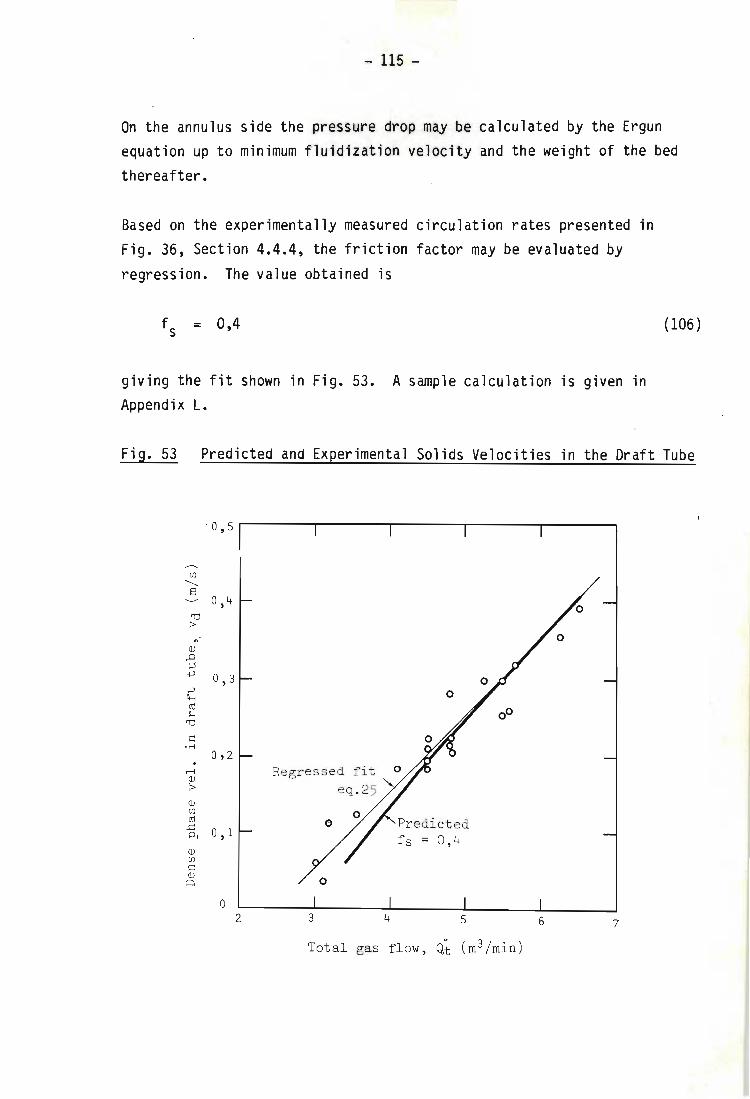
- 115 -
On the annulus side the pressure drop may be calculated by the Ergun equation up to minimum fluidization velocity and the weight of the bed
thereafter.
Based on the experimentally measured circulation rates presented in Fig. 36, Section 4.4.4, the friction factor may be evaluated by
regression. The value obtained is
fs = 0,4 (106)
giving the fit shown in Fig. 53. A sample calculation is given in Appendix L.
Fig. 53 Predicted and Experimental Solids Velocities in the Draft Tube
' 0 , 5
UJ
---S 0 , 4
'd >
",-
Q) p ~ +' 0 , 3 +' c" ro >-< 'd
C 'M
0 , 2 . rl Q)
> Q) UJ ro .c o , 1 P< Q) UJ C Q)
~
0 2
o
Regressed fit 0
eq . 25 "
o
3 4
Predicted fs = 0,4
5
Total gas flow , Qt (m3/min)
6 7
- 116 -
The only comparable result reported in the literature appears to be by
Legel and Schwedes [74] investigating dense phase pneumatic conveying of
plugs in horizontal lines. They define a 'wedge number' from which the component of pressure drop due to sliding friction may be extracted.
This frictional component is given by:
taP L = X(Fr) "g (107)
where X is the 'wedge number', vs is the gas/solid slip velocity
and i Fr = s (108) gO
By comparison of equations (103) and (107) it may be seen that . I
X = 2f s (109)
The wedge number is then empirically correlated [74J by the equation
x = K1 (Fr) K2
K1 = 2,9 tan 9W K2 = -0,75
empirically determined constant
empirically determined constant
Substituting suitable values into equation (108) for the experiments performed in the present study, and with typical solids velocities varying from about 0,6 to 1,3 mIs,
fs = 0,6 to 1,5 by equation (110)
(110 )
(111 )
(112)
This compares reasonably well with the friction factor obtained in this
study given by equation (106).
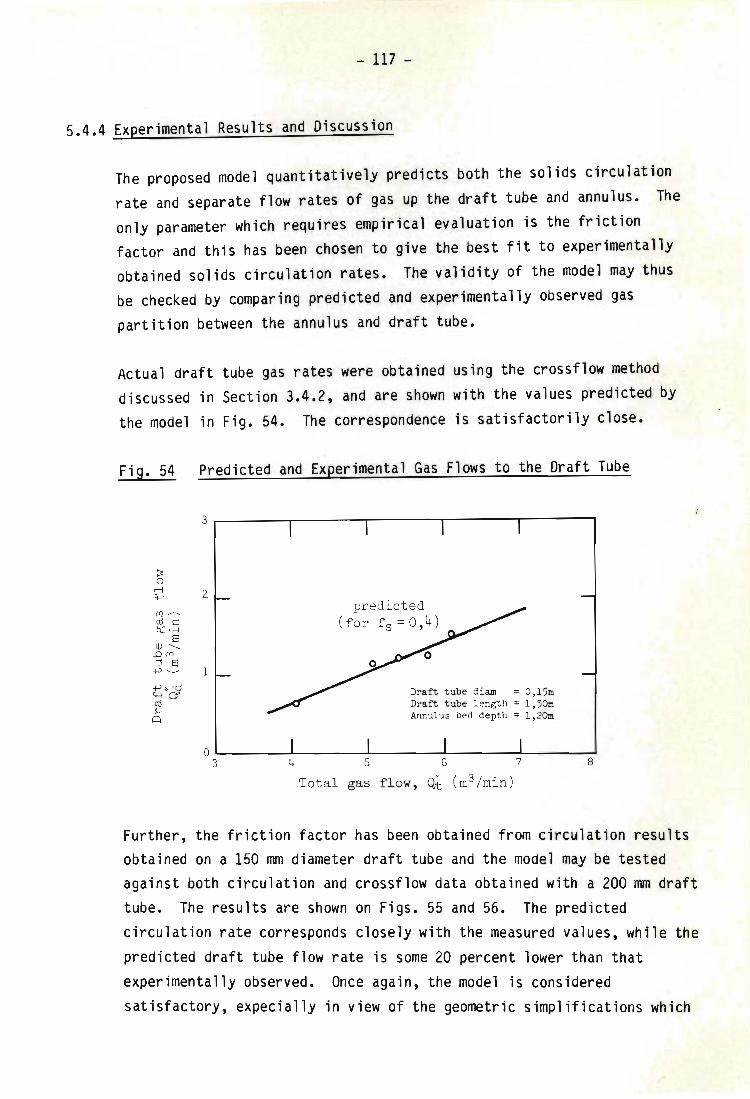
- 117 -
5.4.4 Experimental Results and Discussion
The proposed model quantitatively predicts both the solids circulation rate and separate flow rates of gas up the draft tube and annulus. The only parameter which requires empirical evaluation is the friction factor and this has been chosen to give the best fit to experimentally obtained solids circulation rates. The validity of the model may thus be checked by comparing predicted and experimentally observed gas partition between the annulus and draft tube.
Actual draft tube gas rates were obtained using the crossflow method discussed in Section 3.4.2, and are shown with the values predicted by the model in Fig. 54. The correspondence is satisfactorily close.
Fig. 54 Predicted and Experimental Gas Flows to the Draft Tube
~ a rl Ct--:
rJl~
(1j C q:: . rl
S QJ ........
,DC") ~ S +' ~
+,.rc1 <"+-leY (1j H
(::)
3 r-------.-------.-------,--------r------~
2
0 3
predicted (for f s = 0 , 4 )
Draft tube diam = a , 15m Draft tube length = l,5Om Annulus bed depth = l,2Om
4 5 6 7 8
Total gas flow , Qt (m3/min)
Further, the friction factor has been obtained from circulation results obtained on a 150 mm diameter draft tube and the model may be tested against both circulation and crossflow data obtained with a 200 mm draft tube. The results are shown on Figs. 55 and 56. The predicted circulation rate corresponds closely with the measured values, while the predicted draft tube flow rate is some 20 percent lower than that experimentally observed. Once again, the model is considered satisfactory, expecially in view of the geometric simplifications which
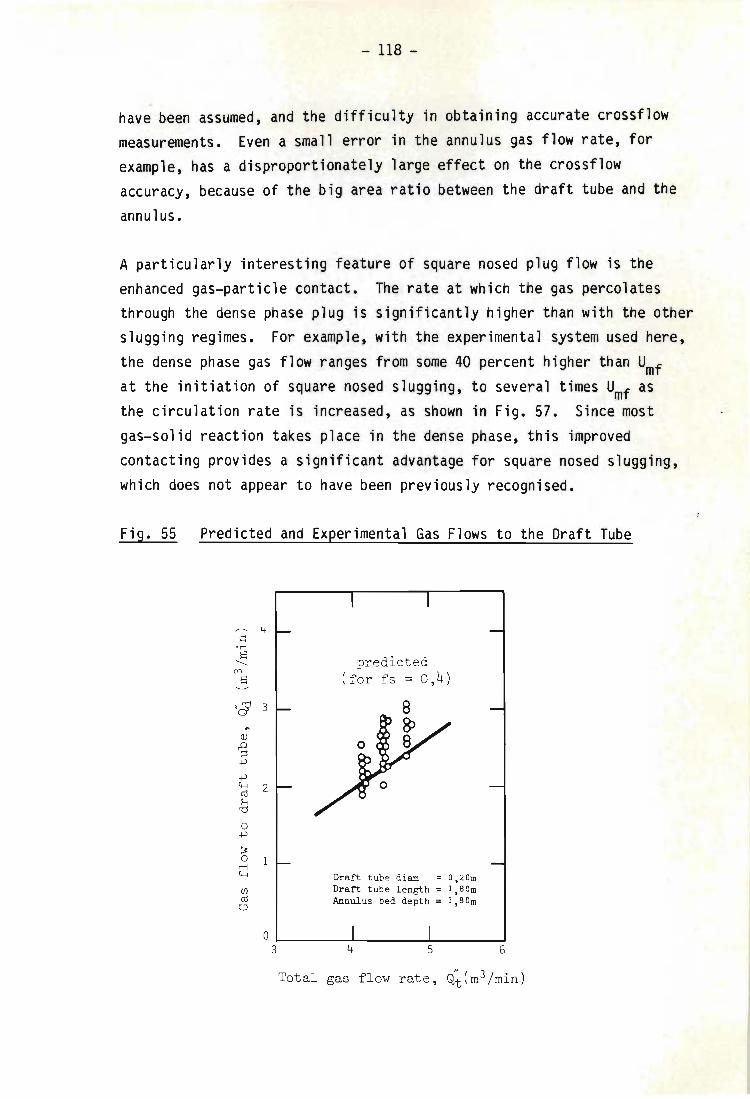
- 118 -
have been assumed, and the difficulty in obtaining accurate crossflow measurements. Even a small error in the annulus gas flow rate, for example, has a disproportionate ly large effect on the crossflow accuracy, because of the big area ratio between the draft tube and the
annulus.
A particularly interesting feature of square nosed plug flow is the enhanced gas-particle contact. The rate at which the gas percolates through the dense phase plug is significantly higher than with the other slugging regimes. For example, with the experimental system used here, the dense phase gas flow ranges from some 40 percent higher than Umf at the initiation of square nosed slugging, to several times Umf as the circulation rate is increased, as shown in Fig. 57. Since most gas-solid reaction takes place in the dense phase, this improved contacting provides a significant advantage for square nosed slugging, which does not appear to have been previously recognised.
Fig. 55 Predicted and Experimental Gas Flows to the Draft Tube
~3 ~
~
~ ~
~
~ 2 H ~
o ~
~
~ 1 ~
predicted (for fs = 0,4)
Draft tube diam = O,20m Draft tube length = 1, 80m Annulus bed depth = 1,80m
o ~ ______ ~ ______ ~ ____ ~ 3 4 5 6
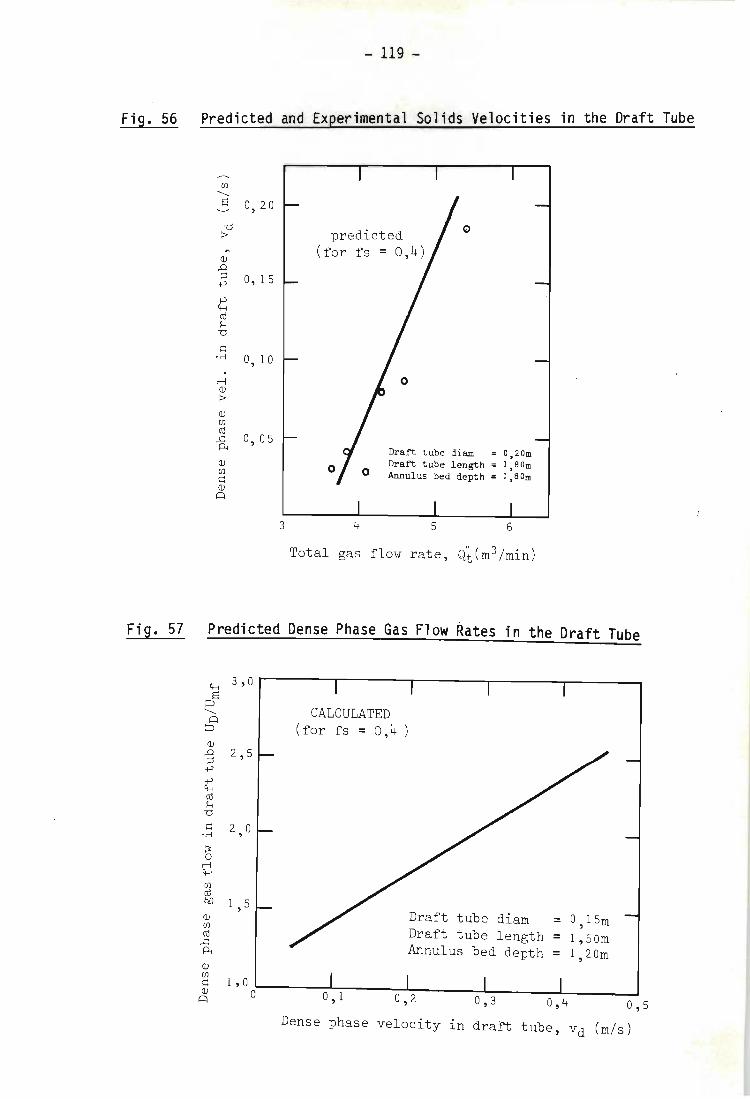
Fig. 56
Fi g. 57
- 119 -
Predicted and Experimental Solids Velocities in the Draft Tube
rl <lJ ~
0, 20
0, 15
0, 10
<lJ en (\j
-& 0, 05
<lJ en s:: <lJ ~
3
predicted (for fs = 0 , 4)
o
o o
4
o
Draft tube diam = O, 20m Draft tube l ength = I, BOm Annulus bed depth = I,BOm
5 6
Predicted Dense Phase Gas Fl ow Rates in the Draft Tube
~ 3, 0 r--------.---------r--------,---------r-------~ ~S
..........
5 <lJ .g 2 , 5 +'
~ (\j H 'd
s:: 2 ° "r! ,
~ rl ~
en (\j
bO 1 , 5 <lJ en (\j
..s:: p,
Q)
CALCULATED (for fs = 0,4 )
Draft tube diam = 0, I5m Draft tube lengt h = 1, 50m Annulus bed depth = I , 20m
~ I , O ~------~,_----~~~----~~~------L--------J ~ ° 0, 1 0 , 2 0 , 3 0 4 , 0, 5 Dense phase velocity ln draft tube , vd (m/s)
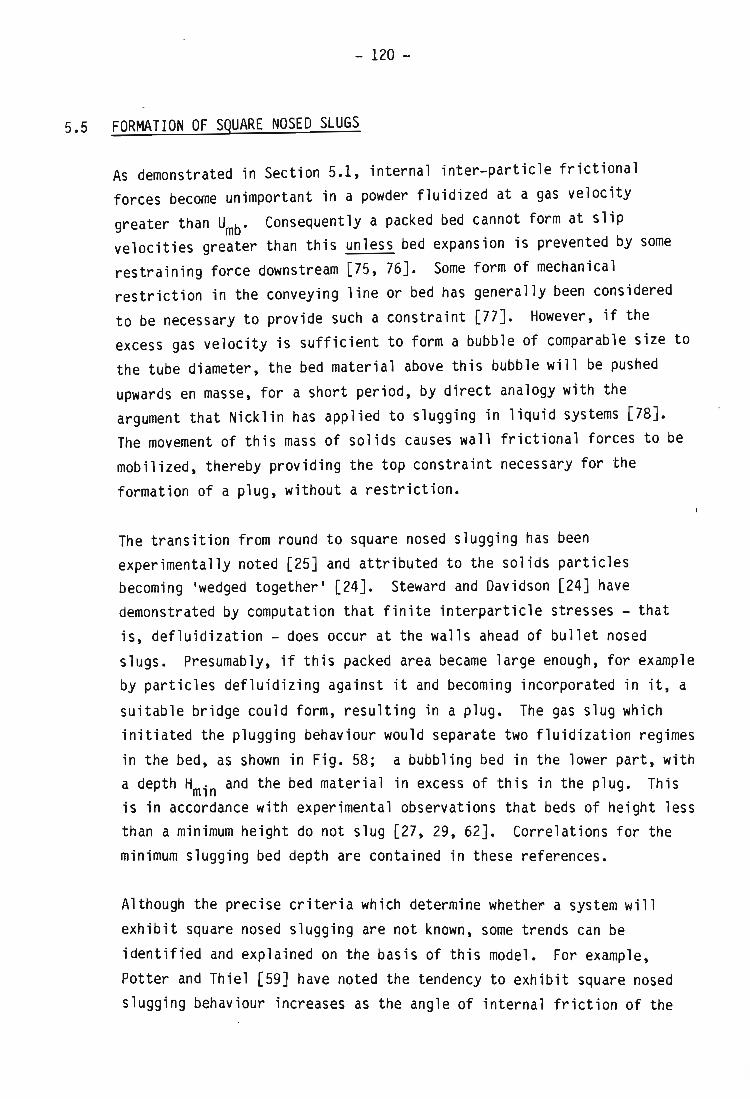
- 120 -
5.5 FORMATION OF SQUARE NOSED SLUGS
As demonstrated in Section 5.1, internal inter-particle frictional forces become unimportant in a powder fluidized at a gas velocity greater than Umbo Consequently a packed bed cannot form at slip velocities greater than this unless bed expansion is prevented by some restraining force downstream [75, 76J. Some form of mechanical restriction in the conveying line or bed has generally been considered to be necessary to provide such a constraint [77J. However, if the excess gas velocity is sufficient to form a bubble of comparable size to the tube diameter, the bed material above this bubble will be pushed upwards en masse, for a short period, by direct analogy with the argument that Nicklin has applied to slugging in liquid systems [78J. The movement of this mass of solids causes wall frictional forces to be mobilized, thereby providing the top constraint necessary for the formation of a plug, without a restriction.
The transition from round to square nosed slugging has been experimentally noted [25J and attributed to the solids particles becoming 'wedged together' [24J. Steward and Davidson [24J have demonstrated by computation that finite interparticle stresses - that is, defluidization - does occur at the walls ahead of bullet nosed slugs. Presumably, if this packed area became large enough, for example by particles defluidizing against it and becoming incorporated in it, a
suitable bridge could form, resulting in a plug. The gas slug which initiated the plugging behaviour would separate two fluidization regimes in the bed, as shown in Fig. 58; a bubbling bed in the lower part, with a depth Hmin and the bed material in excess of this in the plug. This is in accordance with experimental observations that beds of height less than a minimum height do not slug [27, 29, 62J. Correlations for the minimum slugging bed depth are contained in these references.
Although the precise criteria which determine whether a system will exhibit square nosed slugging are not known, some trends can be identified and explained on the basis of this model. For example, Potter and Thiel [59J have noted the tendency to exhibit square nosed slugging behaviour increases as the angle of internal friction of the
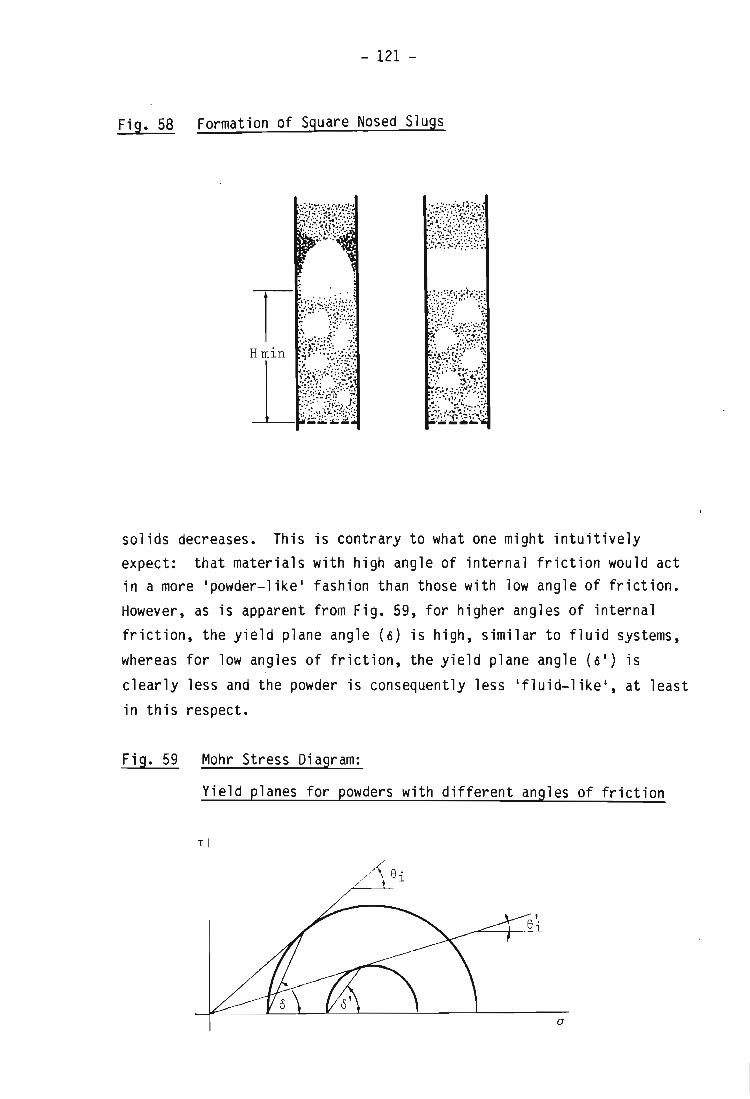
- 121 -
Fig. 58 Formation of Square Nosed Slugs
solids decreases. This is contrary to what one might intuitively expect: that materials with high angle of internal friction would act in a more 'powder-like ' fashion than those with low angle of friction. However, as is apparent from Fig. 59, for higher angles of internal friction, the yield plane angle (6) is high, similar to fluid systems, whereas for low angles of friction, the yield plane angle (6 1
) is clearly less and the powder is consequently less 'fluid-like ' , at least in this respect.
Fig. 59 Mohr Stress Diagram:
Yield planes for powders with different angles of friction
T
e· 1
a
- 122 -
Baker and Geldart [28J found that wall roughness had no effect on the tendency of a powder to form square nosed slugs and this might be anticipated from the very small effect that wall friction has on the stress field, for reasonably smooth-walled tubes (see Section 5.2.3).
Surface roughness on the particles, on the other hand, will exert an important effect, since this influences the angle of friction. This effect becomes increasingly important, the smaller the particles [51J. Thus, for example, Verloop [49J calculates that surface peaks of 3p on 1 mm particles will affect the angle of repose only slightly (_4°), while the same roughness on 0,2 mm particles changes the angle by a much greater extent (-10°). The increased tendency for beds of large particles to form square nosed slugs has been reported [28J, but this could be due to an actual particle size effect or to a change in internal friction angle, or some combination.
Clearly, the important factors and their influence on slug formation are , not well understood, so that while particle properties such as angle of internal friction, size, density and minimim fluidizing velocity, and bed properties such as tube diameter may all be important determinants of slugging behaviour, a coherent model of the effects and interactions is not available, at this time.
- 123 -
5.6 SUMMARY 'AND CONCLUSIONS
Mechanical stress theory has been applied to fluidized beds operating in - the square nosed slugging regime. Based on this the length of the plugs
may be obtained by simple relation to the internal failure plane of the
powder.
The minimum square nosed slugging velocity has been derived from the force balance operating on the plug and by application of the theories derived for stress fields in silos and hoppers. The pressure drop over the draft tube leg of the circulating bed may be obtained by summing the contributions due to the weight of the solids, the static friction, the acceleration of the particles and the dynamic friction. The first three terms may be ca lculated from a knowledge of the system and powder properties only. To evaluate the last term, a friction factor must be empirically determined. If the plug is assumed to slide up the walls of the draft tube, in accordance with visual observation, then a dry friction model (which implies a constant value for the friction factor irrespective of experimental conditions) would be appropriate, and this is shown to fit the experimental data well. The friction factor for the system used in these experiments has been evaluated.
Based on this, a model is established for the pressure balance around the annulus - draft tube loop, which when solved, allows the crossflow and solids circulation rates to be calculated. The predictions of the model accord satisfactorily with the experimentally obtained values for these rates, for two different draft tube sizes.
Square nosed slugging is identified as potentially having significant advantages over other bubbling modes, because of improved gas-solid, contacting due to high dense phase gas flow rates through the plug.
The soil mechanics approach qualitatively explains some experimental observations for square nosed slugging systems, but there is a deficiency in knowledge concerning slug behaviour in this regime.
- 124 -
Having established the principles for gas separation in a circulating fluidized bed with a draft tube, operating in the square nosed slugging mode, the system may be applied to coal gasification and this forms the subject of the next Chapter.
- 125 -
CHAPTER 6
APPLICATION TO COAL GASIFICATION
6.1 INTRODUCTION
The pilot plant apparatus used in this work was originally built as a fluid bed combustor [79], the design and development of which have been reported by Meihack [12]. The purpose of the draft tube in this application is solely to induce solids ci rculation, in order to disperse coal feed in the bed and to increase the residence time of fine material. The unit was subsequently adapted for gasification [80], in which fines retention is also advantageous, but initially with poor results [81].
Nevertheless, in view of the many potenti al advantages that might be obtained by using a draft tube fluidized bed for gasification which have already been alluded to (Section 1.3), further investigation in order to assess the feasibility of the system in this application was undertaken.
Mechanical and instrument improvements to the pilot plant evolved throughout the experimental program. For example, offline manual gas analysis was replaced by continuous gas analysing instruments; the computer logging system was incorporated [12] and the radio-active circulation tracking system was developed. Some problems have not yet been entirely solved but progressive improvements have increased reliability e.g. the coal screw-feeder system; others have required considerable trial and error experimentation to find suitable methods, for example suitable probes for continuous sampling of hot, wet, dusty gases.
The initial gasification results remained disappointingly poor however, and the cause for this was identified as crossflow of reactant gases. This led to the closer examination of the hydrodynamics of the system, seeking in particular a means of minimising crossflow while retaining
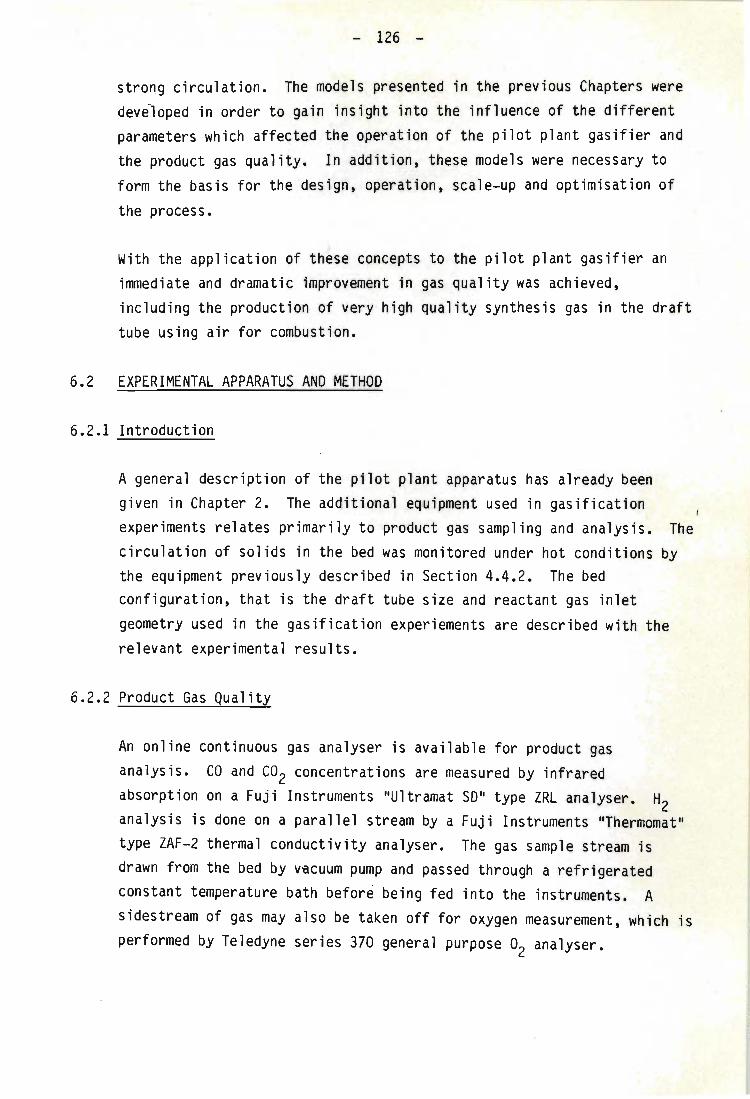
- 126 -
strong circulat ion. The models presented in the previous Chapters were developed in order to gain insight into the influence of the different parameters which affected the operation of the pilot plant gasifier and the product gas quality. In addition, these models were necessary to form the basis for the design, operation, scale-up and optimisation of
the process.
With the application of these concepts to the pilot plant gasifier an immediate and dramatic improvement in gas quality was achieved, including the production of very high quality synthesis gas in the draft tube using air for combustion.
6.2 EXPERIMENTAL APPARATUS AND METHOD
6.2.1 Introduction
A general description of the pilot plant apparatus has already been given in Chapter 2. The additional equipment used in gasification experiments relates primarily to product gas sampling and analysis. The circulation of solids in the bed was monitored under hot conditions by the equipment previously described in Section 4.4.2. The bed configuration, that is the draft tube size and reactant gas inlet geometry used in the gasification experiements are described with the relevant experimental results.
6.2.2 Product Gas Quality
An online continuous gas analyser is available for product gas analysis. CO and CO2 concentrations are measured by infrared absorption on a Fuji Instruments "Ultramat SO" type ZRL analyser. H2 analysis is done on a parallel stream by a Fuji Instruments "Thermomat" type ZAF-2 thermal conductivity analyser. The gas sample stream is drawn from the bed by vacuum pump and passed through a refrigerated constant temperature bath before being fed into the instruments. A sidestream of gas may also be taken off for oxygen measurement, which is performed by Teledyne series 370 general purpose O
2 analyser.
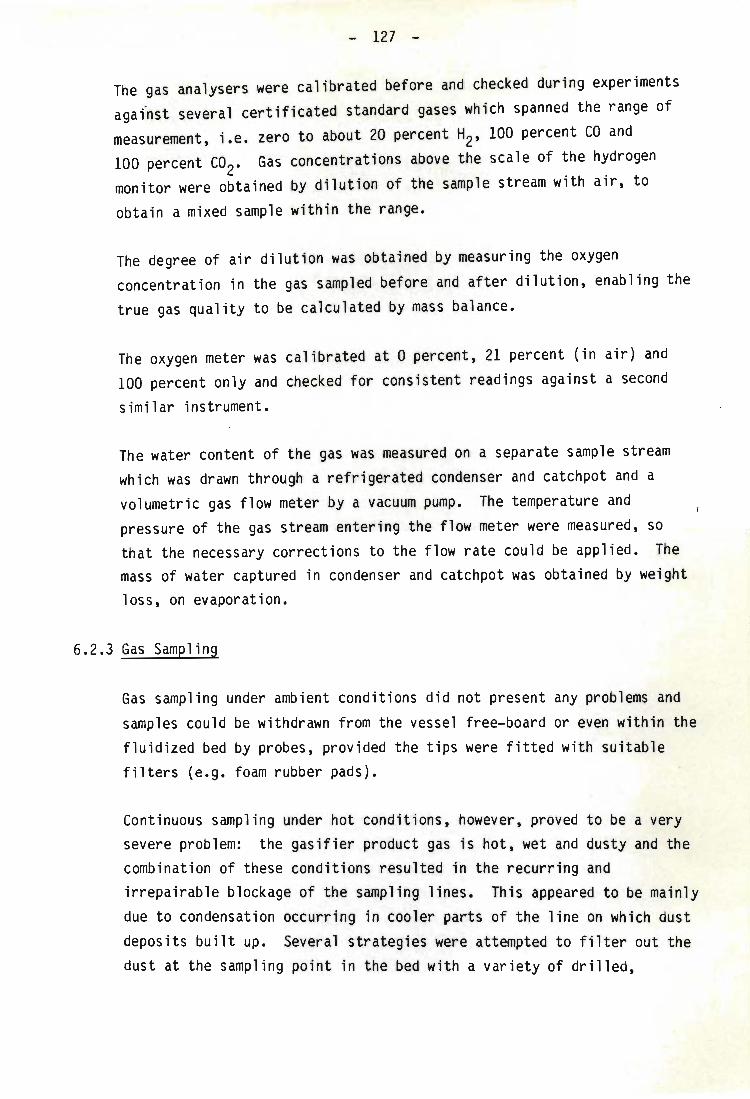
- 127 -
The gas analysers were calibrated before and checked during experiments aga~st several certificated standard gases which spanned the range of measurement, i.e. zero to about 20 percent H2, 100 percent CO and 100 percent CO2• Gas concentrations above the scale of the hydrogen monitor were obtained by dilution of the sample stream with air, to obtain a mixed sample within the range.
The degree of air dilution was obtained by measuring the oxygen concentration in the gas sampled before and after dilution, enabling the true gas quality to be calculated by mass balance.
The oxygen meter was calibrated at a percent, 21 percent (in air) and 100 percent only and checked for consistent readings against a second similar instrument.
The water content of the gas was measured on a separate sample stream which was drawn through a refrigerated condenser and catch pot and a volumetric gas flow meter by a vacuum pump. The temperature and pressure of the gas stream entering the flow meter were measured, so that the necessary corrections to the flow rate could be applied. The mass of water captured in condenser and catchpot was obtained by weight loss, on evaporation.
6.2.3 Gas Sampling
Gas sampling under ambient conditions did not present any problems and samples could be withdrawn from the vessel free-board or even within the fluidized bed by probes, provided the tips were fitted with suitable filters (e.g. foam rubber pads).
Continuous sampling under hot conditions, however, proved to be a very severe problem: the gasifier product gas is hot, wet and dusty and the combination of these conditions resulted in the recurring and irrepairable blockage of the sampling lines. This appeared to be mainly due to condensation occurring in cooler parts of the line on which dust deposits built up. Several strategies were attempted to filter out the dust at the sampling point in the bed with a variety of drilled,
- 128 -
slotted, sintered stainless and porous ceramic tipped probes. None of these was entirely successful: drilled or slotted ends allowed powder through, the pores in the sintered steel rapidly sandblasted closed at the high temperatures and the porous ceramics blocked up with small flyash dust. Eventually a combination of a very large open ended sampling line with wet scrubbing directly outside the gasifier vessel, was found to be reasonably reliable. A sketch of the scrubbing pot is shown in Fig. 60.
Fig. 60 Gas Sample Scrubber
Cooling I'Tat er in out
Gas sample out --~----------
H~
Gas sample in -
Gas samples have also been obtained from within the fluidized bed in the annulus using a ceramic sampler large enough to accommodate blockage as sampling continued. The sampler is inserted in a crossflow
configuration to prolong its useful life and is backflushed when not in use - Fig. 61.
- 129 -
Fig. 61 Annulus Gas Scrubber
_ 25rnm sample to scrubber .
-- insulation
liner
Such large probes in the fluidized bed are not ideal, because of the hydrodynamic disturbance which is caused to the system, but seem to be necessary in order to obtain at least reasonably reliable samples.
6.2.4 Experimental Procedure
For a gasification experiment the reactor is initially preheated to coal combustion temperature (about 500°C) by LPG burner mounted on the bottom of the plenum under the bed support plate (Fig. 62). This burner also supplies most of the fluidizing gas during the start-up, although some dilution with excess air is required, in order to reduce the temperature to within the operating limits of the plenum materials. The solids level in the bed is initially very low and is progressively increased until a reasonable inventory of material (about 500mm deep) is at about 500°C. The bed material is the same silica sand used in the crossflow experiments (details in Section 3.4.2). At this stage coal is fed into the bed and combusion commenced by adding excess air. The bed must be vigorously fluidized to disperse the coal in the inert sand. The burner is usually kept on even after this to speed up the heating process.
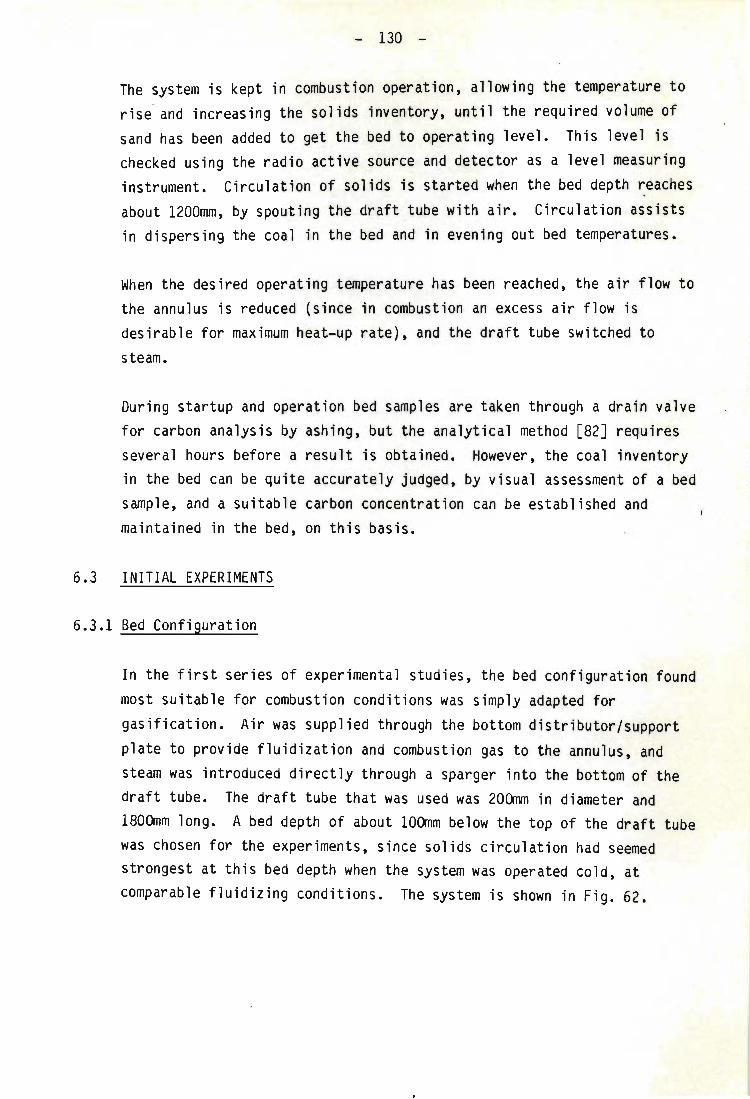
- 130 -
The system is kept in combustion operation, allowing the temperature to rise- and increasing the solids inventory, until the required volume of sand has been added to get the bed to operating level. This level is checked using the radio active source and detector as a level measuring instrument. Circulation of solids is started when the bed depth reaches about 1200mm, by spouting the draft tube with air. Circulation assists in dispersing the coal in the bed and in evening out bed temperatures.
When the desired operating temperature has been reached, the air flow to the annulus is reduced (since in combustion an excess air flow is desirable for maximum heat-up rate), and the draft tube switched to
steam.
During startup and operation bed samples are taken through a drain valve for carbon analysis by ashing, but the analytical method [82J requires several hours before a result is obtained. However, the coal inventory in the bed can be quite accurately judged, by visual assessment of a bed sample, and a suitable carbon concentration can be established and maintained in the bed, on this basis.
6.3 INITIAL EXPERIMENTS
6.3.1 Bed Configuration
In the first series of experimental studies, the bed configuration found most suitable for combustion conditions was simply adapted for gaSification. Air was supplied through the bottom distributor/support plate to provide fluidization and combustion gas to the annulus, and steam was introduced directly through a sparger into the bottom of the draft tube. The draft tube that was used was 200mm in diameter and 1800mm long. A bed depth of about 100mm below the top of the draft tube was chosen for the experiments, since solids circulation had seemed strongest at this bed depth when the system was operated cold, at comparable fluidizing conditions. The system is shown in Fig. 62.
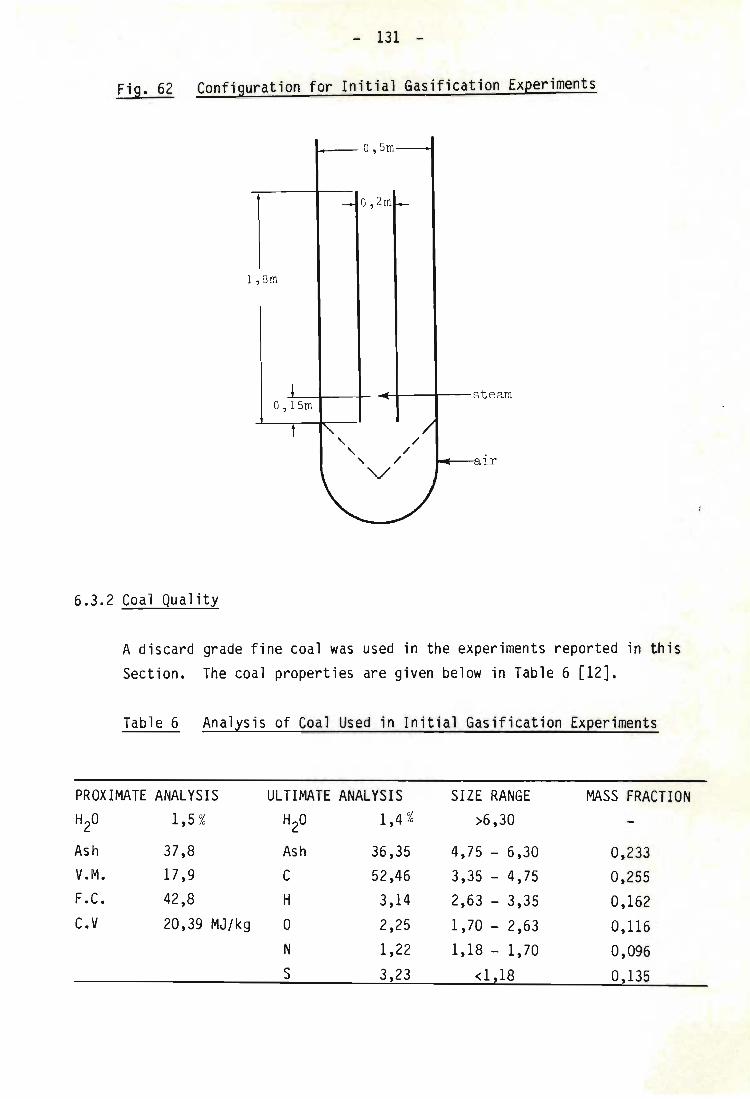
- 131 -
Fig. 62 Configuration for Initial Gasification Experiments
1-- O, 5m
O, 2m
1 , 8m
...l--+--t- ~f----t--steam O, 15m
air
6.3.2 Coal Quality
A discard grade fine coal was used in the experiments reported in this Section. The coal properties are given below in Table 6 [12J.
Table 6 Analysis of Coal Used in Initial Gasification Experiments
PROXIMATE ANALYSIS ULTIMATE ANALYSIS SIZE RANGE MASS FRACTION H2O 1,5 % H2O 1,4 % >6,30
Ash 37,8 Ash 36,35 4,75 - 6,30 0,233 V.M. 17,9 C 52,46 3,35 - 4,75 0,255 F.C. 42,8 H 3,14 2,63 - 3,35 0,162 C.V 20,39 MJ/kg 0 2,25 1,70 - 2,63 0,116
N 1,22 1,18 - 1,70 0,096 S 3223 <1 218 0,135
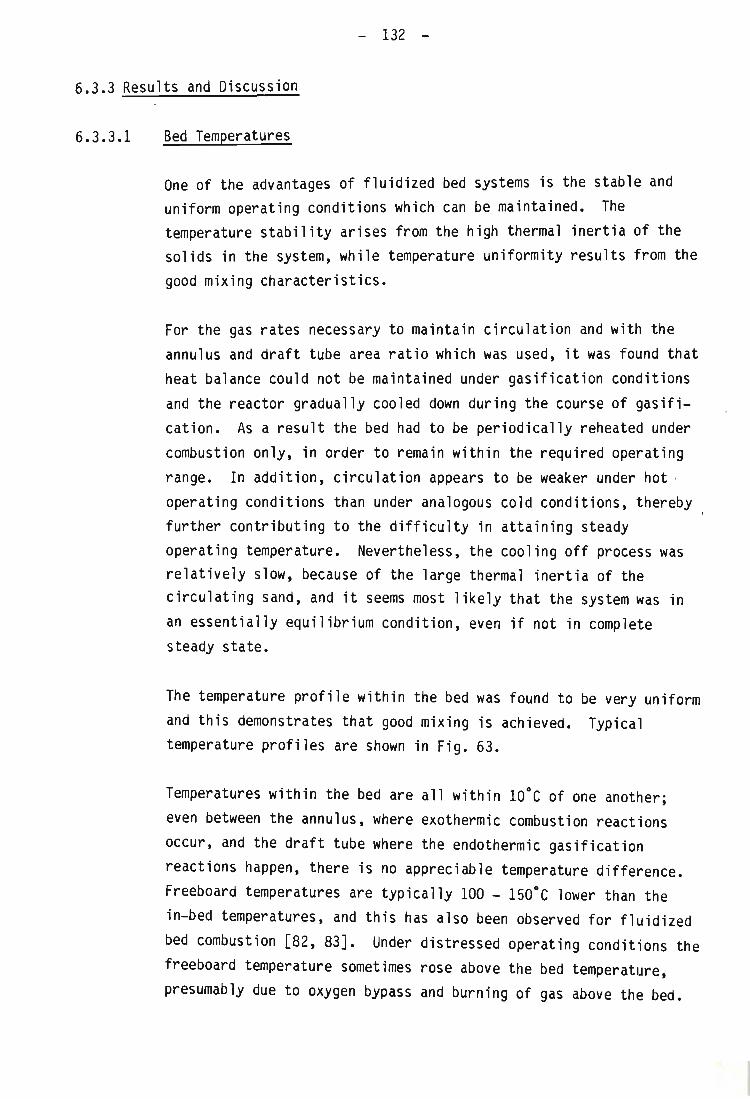
- 132 -
6.3.3 Results and Discussion
6.3.3.1 Bed Temperatures
One of the advantages of fluidized bed systems is the stable and uniform operating conditions which can be maintained. The temperature stability arises from the high thermal inertia of the solids in the system, while temperature uniformity results from the good mixing characteristics.
For the gas rates necessary to maintain circulation and with the annulus and draft tube area ratio which was used, it was found that heat balance could not be maintained under gasification conditions and the reactor gradually cooled down during the course of gasification. As a result the bed had to be periodically reheated under combustion only, in order to remain within the required operating range. In addition, circulation appears to be weaker under hot , operating conditions than under analogous cold conditions, thereby further contributing to the difficulty in attaining steady operating temperature. Nevertheless, the cooling off process was relatively slow, because of the large thermal inertia of the circulating sand, and it seems most likely that the system was in an essentially equilibrium condition, even if not in complete steady state.
The temperature profile within the bed was found to be very uniform and this demonstrates that good mixing is achieved. Typical temperature profiles are shown in Fig. 63.
Temperatures within the bed are all within 10 0 e of one another; even between the annulus, where exothermic combustion reactions occur, and the draft tube where the endothermic gasification reactions happen, there is no appreciable temperature difference. Freeboard temperatures are typically 100 - 1500 e lower than the in-bed temperatures, and this has also been observed for fluidized bed combustion [82, 83]. Under distressed operating conditions the freeboard temperature sometimes rose above the bed temperature, presumably due to oxygen bypass and burning of gas above the bed.
6.3.3.2
- 133 -
Fig. 63 Typical Bed Temperature Profile during Gasification
3 , a
~ 2 , 5 FREEBOARD
+ .... ... ..... 2 , 0 SPLASH ZONE ' .....
+ , 0
" ... ... ~
S 1 , 5 FLUIDISED +> ..c: BED
bO ' M
D OJ • II:
1 , a
• Draft tube 0 , 5 o Annulus
a ~------~------~------~------~--~ 800 8 5 0 900 950 1 000
Temperature ( OC)
Circulation
The importance of maintain ing solids circulation in the bed was especially apparent on several occasions when circulation ceased. This invariably led to the formation of agglomerates (up to 250mm in size), often at the coal inlet with subsequent failure of the coal screw-feeder. Hot spots occurred around these agglomerates and on some occasions the bed liner plate was damaged. These difficulties did not arise when circulation was steadily maintained.
In one run, as a result of a screw-feeder speed control failure, coal additions had to be made manually on to the top of the bed.
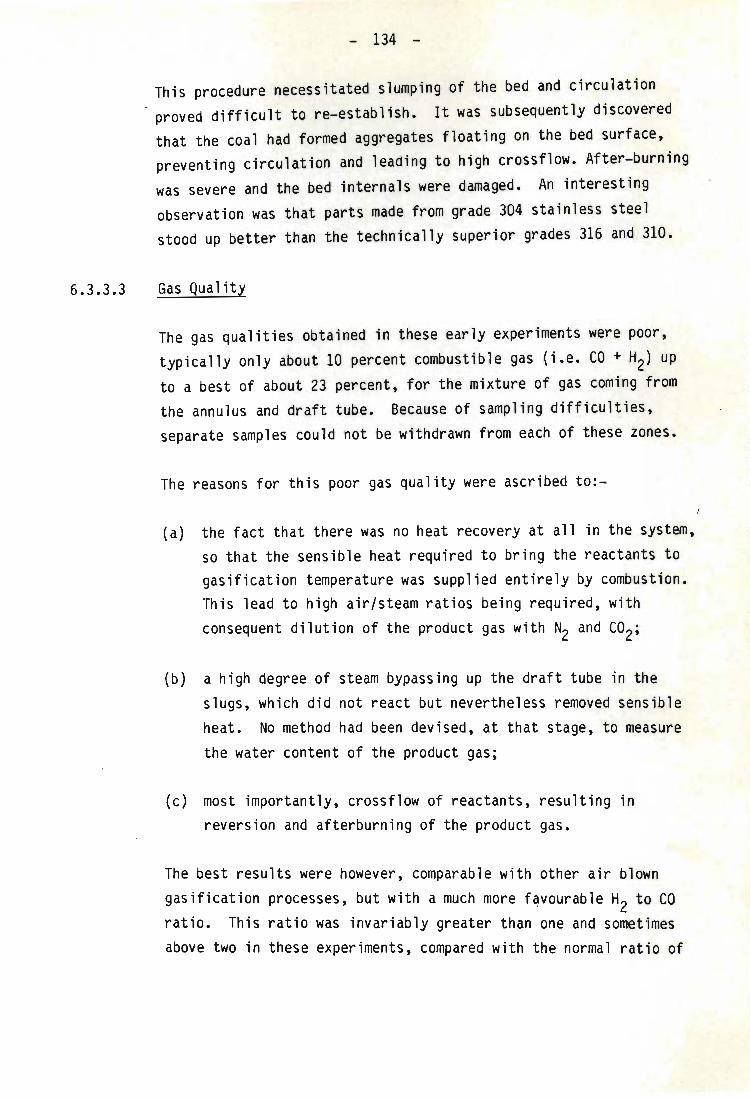
6.3.3.3
- 134 -
This procedure necess i tated slumping of the bed and circulation proved difficult to re-establish. It was subsequently discovered that the coal had formed aggregates floating on the bed surface, preventing circulation and leading to high crossflow. After-burning was severe and the bed internals were damaged. An interesting observation was that parts made from grade 304 stainless steel stood up better than the technically superior grades 316 and 310.
Gas Quality
The gas qualities obtained in these early experiments were poor, typically only about 10 percent combustible gas (i.e. CO + H2) up to a best of about 23 percent, for the mixture of gas coming from the annulus and draft tube. Because of sampling difficulties, separate samples could not be withdrawn from each of these zones.
The reasons for this poor gas quality were ascribed to:-
(a) the fact that there was no heat recovery at all in the system, so that the sensible heat required to bring the reactants to gasification temperature was supplied entirely by combustion. This lead to high air/steam ratios being required, with consequent dilution of the product gas with N2 and CO2;
(b) a high degree of steam bypassing up the draft tube in the slugs, which did not react but nevertheless removed sensible heat. No method had been devised, at that stage, to measure the water content of the product gas;
(c) most importantly, crossflow of reactants, resulting in reversion and afterburning of the product gas.
The best results were however, comparable with other air blown gasification processes, but with a much more favourable H2 to CO ratio. This ratio was invariably greater than one and sometimes above two in these experiments, compared with the normal ratio of
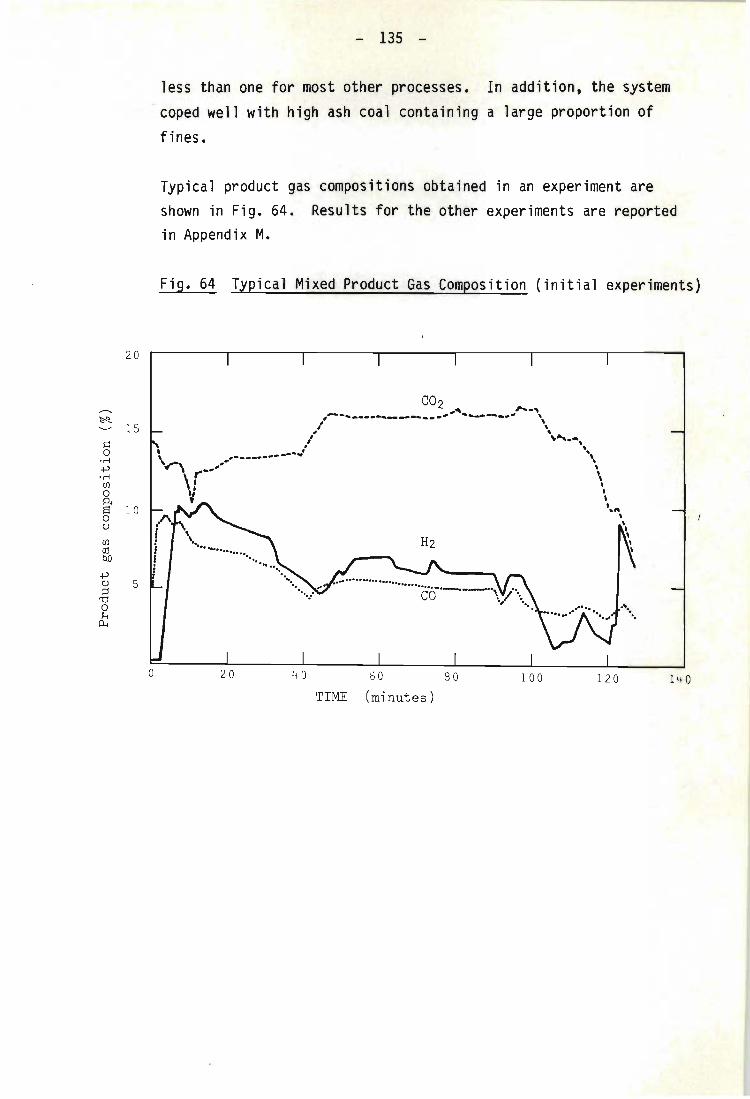
20
* 1 5 ~ 0
'rl +' ' rl en 0 ~ S 10 0 C)
en ttl bJ)
+' C) 5 ;:J
'D 0 !-4 p..,
o
- 135 -
less than one for most other processes. In addition, the system coped well with high ash coal containing a large proportion of fines.
Typical product gas compositions obtained in an experiment are shown in Fig. 64. Results for the other experiments are reported in Appendix M.
Fig. 64 Typical Mixed Product Gas Composition (initial experiments)
CO2 ,,.._ ... _____________ .. - ~""'---... I""-\ I \ , .
/ ~-. .. '---.. ' , \ .. -~~------ \ ~ / , .',..." \
\' I , I ~ ,
I,,,
\ .... .............
20
........ ". ....
'. ..... :
40 60 80 100
TIME (minutes ) 120
, , , , , I
140
- 136 -
6.4 RESULTS AND DISCUSSION
6.4.1 Bed Configuration
As a result of the initial set of experiments which highlighted the problem of reactant gas crossf10w, the investigation described in the earlier Chapters to clarify and eliminate this phenomenon was conducted. A suitable bed configuration, which it was believed would minimise crossflow while retaining strong circulation, and with the draft to annulus area ratio approximately correct for heat balance, was established on the basis of these experiments and the theory derived from them.
This configuration is shown schematically in Fig. 65. The draft tube size is 150mm internal diameter by 1500mm long, and the bed depth about 100mm below the top of the draft tube.
The annulus gas was fed into the bed through spargers in the annulus 300mm above the bottom of the draft tube. The draft tube fluidizing gas, that is the steam, was supplied via the plenum and through the tuyeres in the distributor into the bed. The outer ring of tuyeres was blanked off, in order to reduce the tendency to negative crossf10w.
Since steam was to be introduced into the bottom plenum, the startup burner which was the lowest part of the assembly, would be subject to flooding with condensate. As a result, when the bed was hot and operating smoothly under combustion, the burner was removed and replaced by a blank flange fitted with a steam trap and manual condensate drain.
6.4.2 Coal Properties
The coal chosen for this series of experiments was Bossjespruit coal, used in the Saso1 II andSaso1 III plants for gasification by Lurgi gasifiers. The coal used in these experiments was unsuitable for the Lurgi reactors because of its size range and high proportion of fines. The properties and analysis are given in Table 7 below:
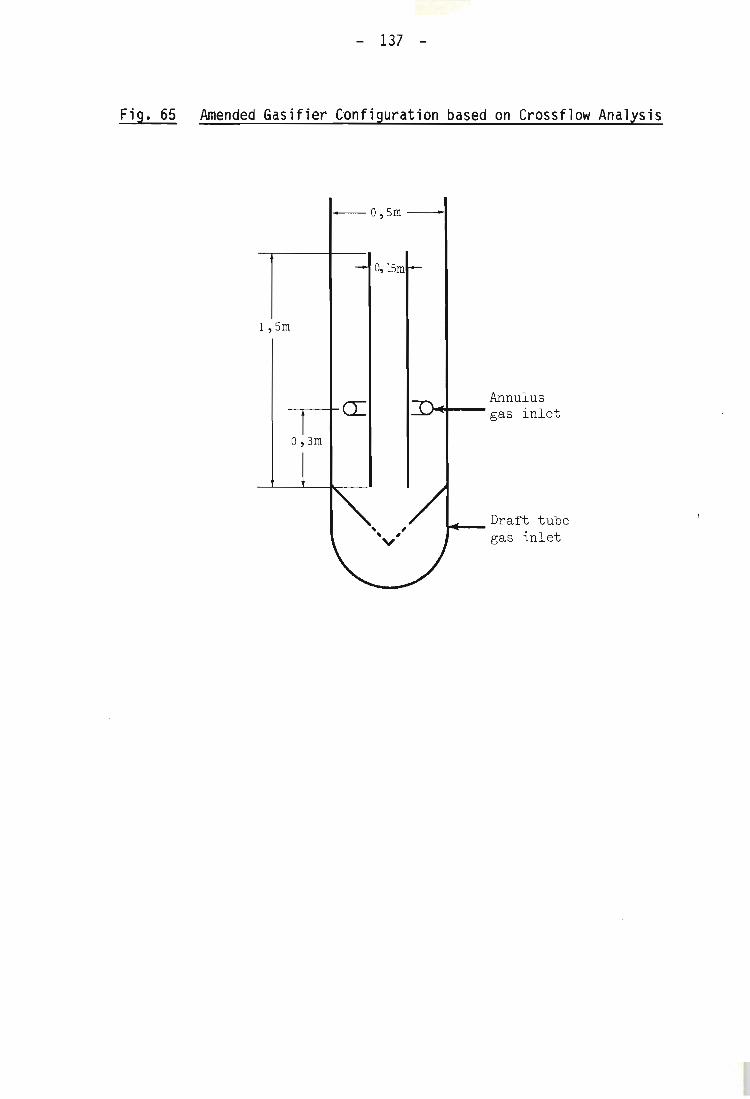
- 137 -
Fig. 65 Amended Gasifier Configuration based on Crossflow Analysis
1, Sm
0 , 3m
-O,sm-
0, 15m
Annulus ~I--- gas inlet
Draft tube gas inlet
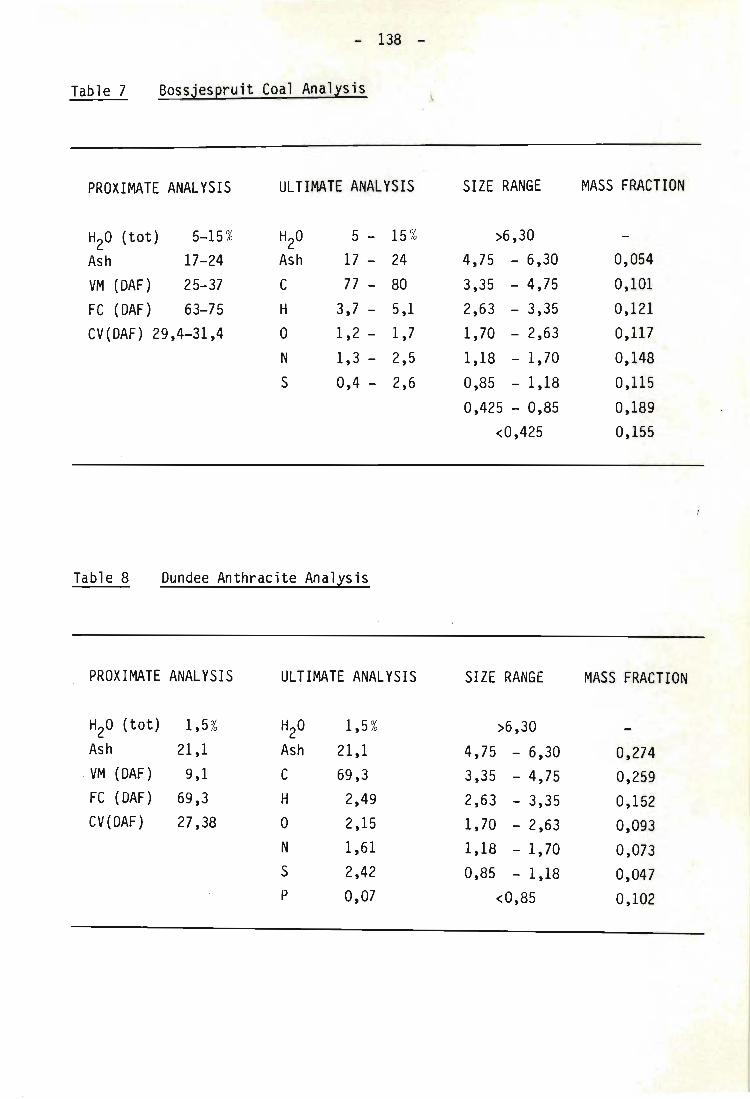
- 138 -
Table 7 Bossjespruit Coal Analysis
PROXIMATE ANALYSIS ULTIMATE ANALYSIS SIZE RANGE MASS FRACTION
H20 (tot) 5-15 % H2O 5 - 15 % >6,30
Ash 17-24 Ash 17 - 24 4,75 - 6,30 0,054
VM (OAF) 25-37 C 77- 80 3,35 - 4,75 0,101
FC (OAF) 63-75 H 3,7 - 5,1 2,63 - 3,35 0,121
CV(DAF) 29,4-31,4 0 1,2 - 1,7 1,70 - 2,63 0,117
N 1,3 - 2,5 1,18 - 1,70 0,148
S 0,4 - 2,6 0,85 - 1,18 0,115
0,425 - 0,85 0,189 <0,425 0,155
Table 8 Dundee Anthracite Analysis
PROXIMATE ANALYSIS ULTIMATE ANALYSIS SIZE RANGE MASS FRACTION
H20 (tot) 1,5% H2O 1,5 % >6,30 Ash 21,1 Ash 21,1 4,75 - 6,30 0,274
. VM (OAf) 9,1 C 69,3 3,35 - 4,75 0,259 FC (OAF) 69,3 H 2,49 2,63 - 3,35 0,152 CV(DAF) 27,38 ° 2,15 1,70 - 2,63 0,093
N 1,61 1,18 - 1,70 0,073 S 2,42 0,85 - 1,18 0,047 p 0,07 <0,85 0,102
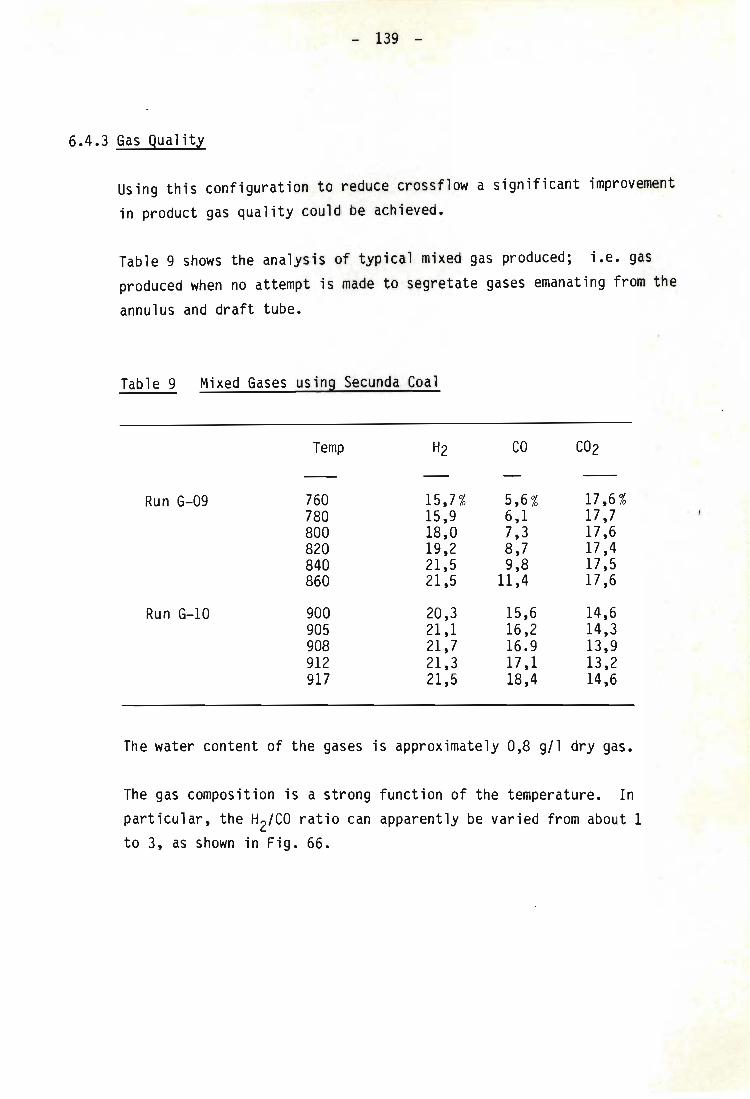
- 139 -
6.4.3 Gas Quality
Using this configuration to reduce crossflow a significant improvement
in product gas quality could be achieved.
Table 9 shows the analysis of typical mixed gas produced; i.e. gas
produced when no attempt is made to segretate gases emanating from the
annulus and draft tube.
Table 9 Mixed Gases using Secunda Coal
Temp H2 CO CO2
Run G-09 760 15,7 % 5,6 % 17,6 % 780 15,9 6,1 17,7 800 18,0 7,3 17,6 820 19,2 8,7 17,4 840 21,5 9,8 17,5 860 21,5 11,4 17 ,6
Run G-10 900 20,3 15,6 14,6 905 21,1 16,2 14,3 908 21,7 16.9 13,9 912 21,3 17,1 13,2 917 21,5 18,4 14,6
The water content of the gases is approximately 0,8 gIl dry gas.
The gas composition is a strong function of the temperature. In particular, the H2/CO ratio can apparently be varied from about 1 to 3, as shown in Fig. 66.
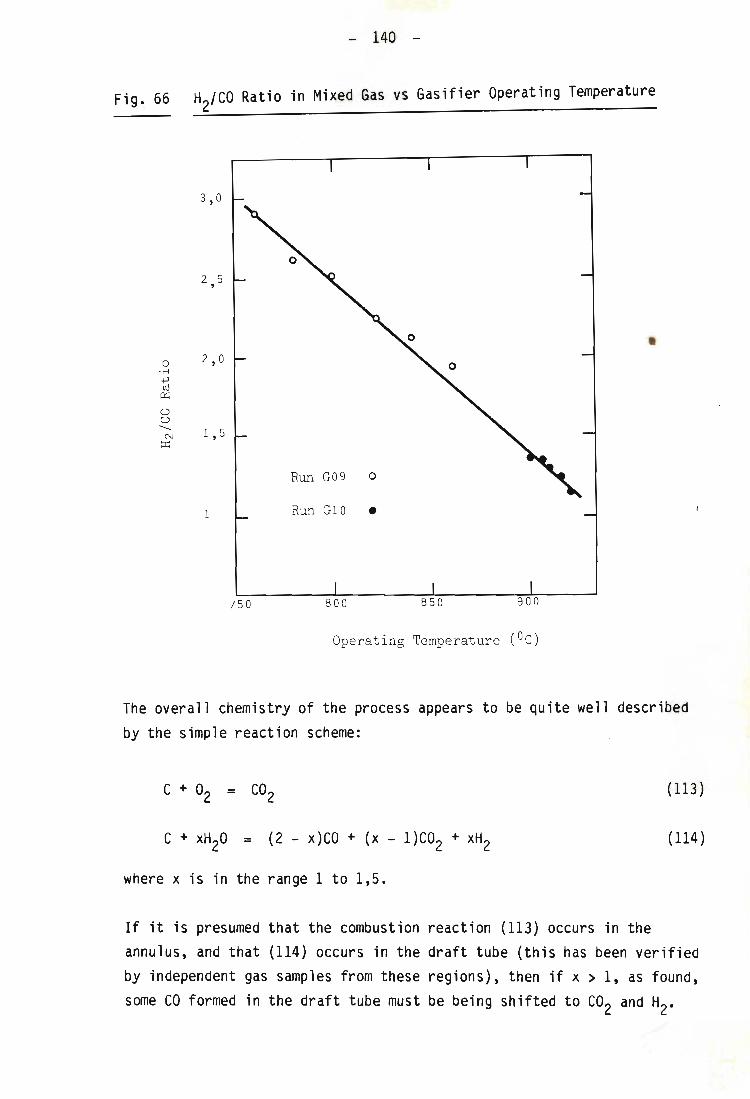
- 140 -
Fig~ 66 H2/CO Ratio in Mixed Gas vs Gasifier Operating Temperature
3 , 0
2 5 ,
• 2 , 0
1 , 5
Run G09 0
Run GIO •
750 800 850 900
Operating Temperature (OC)
The overall chemistry of the process appears to be quite well described by the simple reaction scheme:
(113 )
C + xH20 = (2 - x)CO + (x - 1)C02 + xH2 (114 )
where x is in the range 1 to 1,5.
If it is presumed that the combustion reaction (113) occurs in the annulus, and that (114) occurs in the draft tube (this has been verified by independent gas samples from these regions), then if x > 1, as found, some CO formed in the draft tube must be being shifted to CO
2 and H
2•

- 141 -
Thi~ would explain the temperature effect on the H2/CO ratio, since the equilibrium of the shift reaction is displaced towards the H2 side at lower temperatures and the CO side at higher temperatures, as shown in Fig. 67 (from [1]). An additional source of CO in the mixed gas may be from the annulus, where gasification with CO2 can occur (C + CO2 = 2CO), but this reaction is generally considered to be too slow to be of appreciable importance at temperatures below 900°C [83, 85].
The reason why shift occurs in this particular situation but not in other gasification processes is not known at this time. It may be a consequence of the separation of the reactions (113) and (114), or it may be some catalytic effects of the coal ash.
Fig. 67 Shift Reaction EqUilibrium
100 ~------r-------r-------~------~--------------
80 From r ef . [1 ]
50
C'J 0 U
+ 40 C'J
::r:: ~
rl 0 :> CO + H20 = H2 + CO2 20
O~--__ ~~ ____ ~ ______ -L~~ __ -L ______ ~ ____ ~
300 500 700 900 1100 1 300 1500
Temperature , 0c
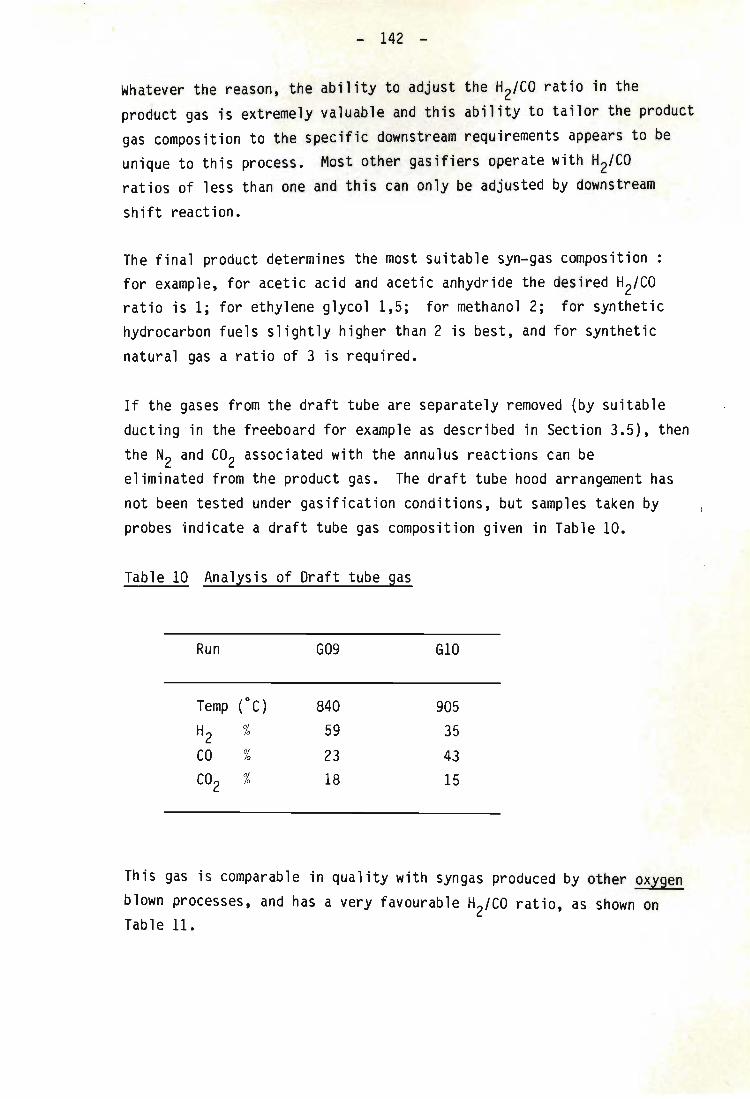
- 142 -
Whatever the reason, the ability to adjust the H2/CO ratio in the product gas is extremely valuable and this ability to tailor the product gas composition to the specific downstream requirements appears to be unique to this process. Most other gasifiers operate with H2/CO ratios of less than one and this can only be adjusted by downstream
shift reaction.
The final product determines the most suitable syn-gas composition : for example, for acetic acid and acetic anhydride the desired H2/CO ratio is 1; for ethylene glycol 1,5; for methanol 2; for synthetic hydrocarbon fuels slightly higher than 2 is best, and for synthetic natural gas a ratio of 3 is required.
If the gases from the draft tube are separately removed (by suitable ducting in the freeboard for example as described in Section 3.5), then the N2 and CO2 associated with the annulus reactions can be eliminated from the product gas. The draft tube hood arrangement has not been tested under gasification conditions, but samples taken by probes indicate a draft tube gas composition given in Table 10.
Table 10 Analysis of Draft tube gas
Run G09 G10
Temp (OC) 840 905
H2 % 59 35 CO % 23 43 CO2 % 18 15
This gas is comparable in quality with syngas produced by other oxygen blown processes, and has a very favourable H2/CO ratio, as shown on Table 11.
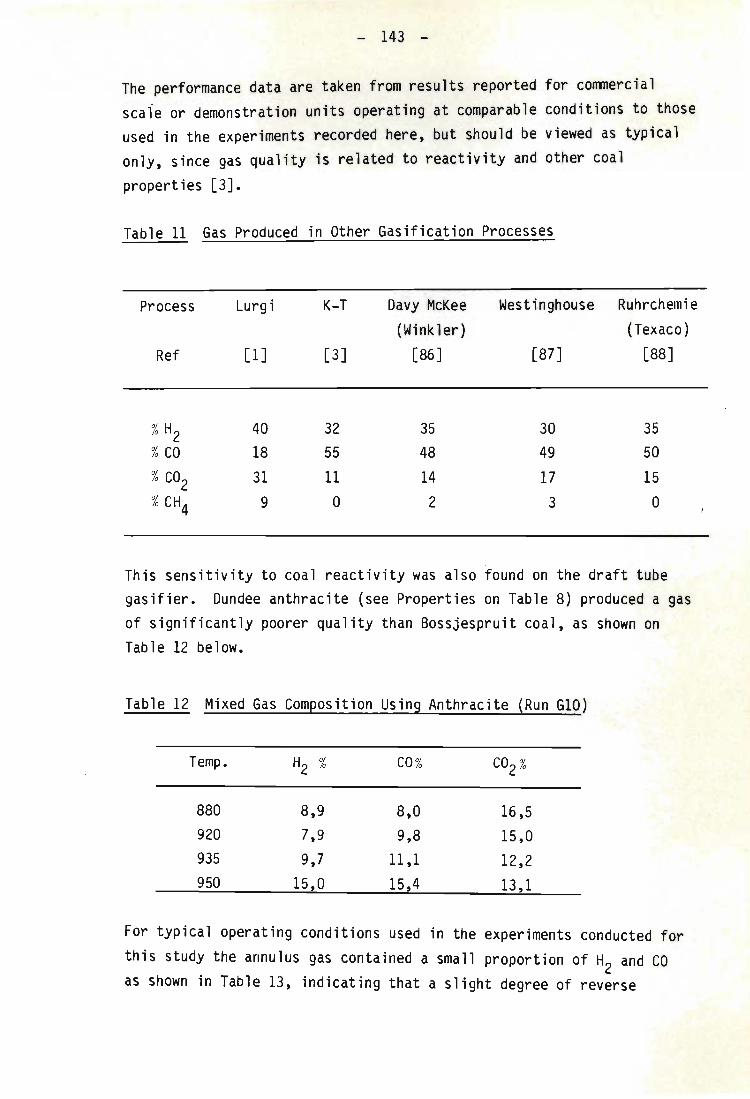
- 143 -
The performance data are taken from results reported for commercial scale or demonstration units operating at comparable conditions to those used in the experiments recorded here, but should be viewed as typical only, since gas quality is related to reactivity and other coal
properties [3J.
Table 11 Gas Produced in Other Gasification Processes
Process Lurgi K-T
Ref [IJ [3]
% H2 40 32 % CO 18 55 % CO2 31 11 % CH4 9 0
Davy McKee (Winkler)
[86]
35 48 14 2
Westinghouse Ruhrchemie (Texaco)
[87] [88]
30 35 49 50 17 15 3 0
This sensitivity to coal reactivity was also found on the draft tube gasifier. Dundee anthracite (see Properties on Table 8) produced a gas of significantly poorer quality than Bossjespruit coal, as shown on Table 12 below.
Table 12 Mixed Gas Com~osition Using Anthracite (Run G10)
Temp. H2 % CO % CO2%
880 8,9 8,0 16,5 920 7,9 9,8 15,0 935 9,7 11 ,1 12,2 950 15,0 15,4 13 ,1
For typical operating conditions used in the experiments conducted for this study the annulus gas contained a small proportion of H and CO
2 as shown in Table 13, indicating that a slight degree of reverse
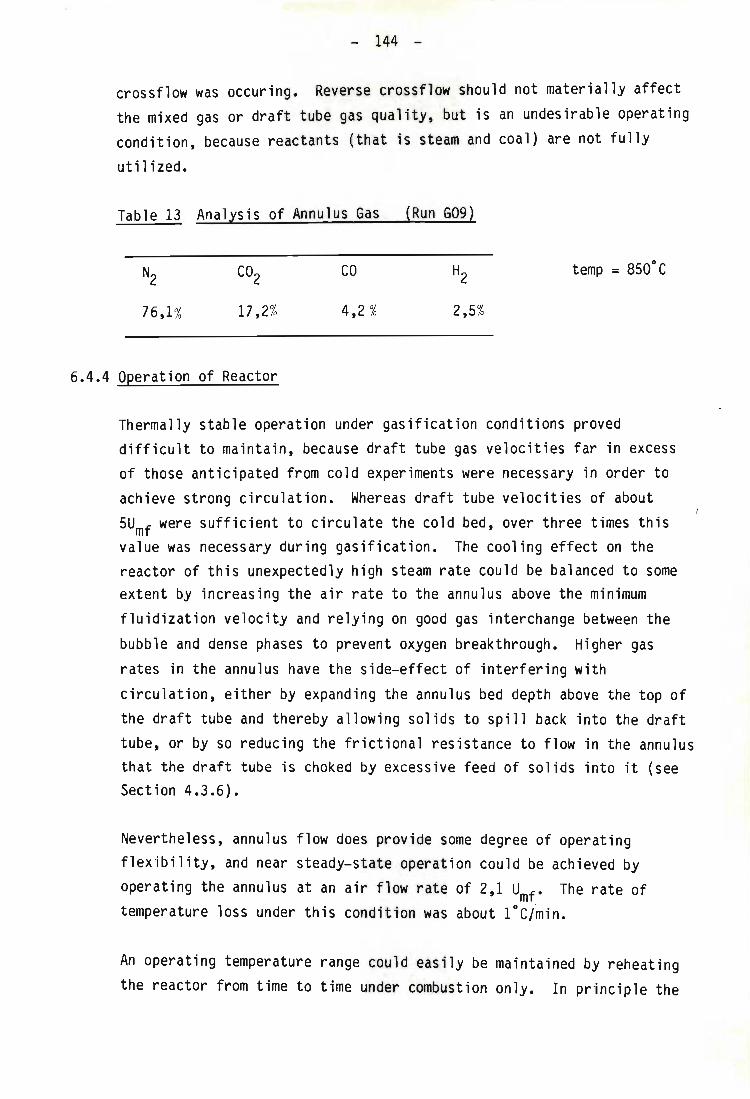
- 144 -
crossflow was occuring. Reverse crossflow should not materially affect the mixed gas or draft tube gas quality, but is an undesirable operating condition, because reactants (that is steam and coal) are not fully
utilized.
Table 13 Analysis of Annulus Gas (Run G09)
co
76,1% 17,2% 4,2 % 2,5%
6.4.4 Operation of Reactor
Thermally stable operation under gasification conditions proved difficult to maintain, because draft tube gas velocities far in excess of those anticipated from cold experiments were necessary in order to achieve strong circulation. Whereas draft tube velocities of about 5U f were sufficient to circulate the cold bed, over three times this m , value was necessary during gasification. The cooling effect on the reactor of this unexpectedly high steam rate could be balanced to some extent by increasing the air rate to the annulus above the minimum fluidization velocity and relying on good gas interchange between the
bubble and dense phases to prevent oxygen breakthrough. Higher gas rates in the annulus have the side-effect of interfering with circulation, either by expanding the annulus bed depth above the top of the draft tube and thereby allowing solids to spill back into the draft tube, or by so reducing the frictional resistance to flow in the annulus that the draft tube is choked by excessive feed of solids into it (see Section 4.3.6).
Nevertheless, annulus flow does provide some degree of operating flexibility, and near steady-state operation could be achieved by operating the annulus at an air flow rate of 2,1 Umf • The rate of temperature loss under this condition was about 1°C/min.
An operating temperature range could easily be maintained by reheating the reactor from time to time under combustion only. In principle the
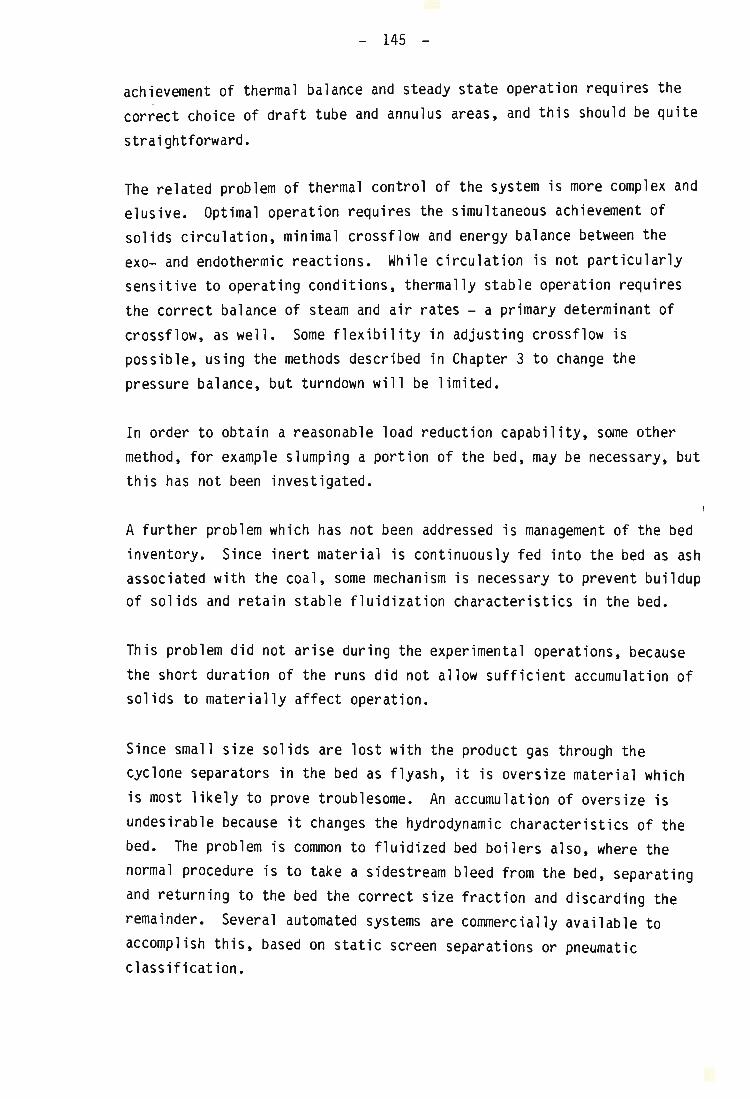
- 145 -
achievement of thermal balance and steady state operation requires the -
correct choice of draft tube and annulus areas, and this should be quite
straightforward.
The related problem of thermal control of the system is more complex and elusive. Optimal operation requires the simultaneous achievement of solids circulation, minimal crossflow and energy balance between the exo- and endothermic reactions. While circulation is not particularly sensitive to operating conditions, thermally stable operation requires the correct balance of steam and air rates - a primary determinant of crossflow, as well. Some flexibility in adjusting crossflow is possible, using the methods described in Chapter 3 to change the pressure balance, but turndown will be limited.
In order to obtain a reasonable load reduction capability, some other method, for example slumping a portion of the bed, may be necessary, but this has not been investigated.
A further problem which has not been addressed is management of the bed inventory. Since inert material is continuously fed into the bed as ash associated with the coal, some mechanism is necessary to prevent buildup of solids and retain stable fluidization characteristics in the bed.
This problem did not arise during the experimental operations, because the short duration of the runs did not allow sufficient accumulation of solids to materially affect operation.
Since small size solids are lost with the product gas through the cyclone separators in the bed as flyash, it is oversize material which is most likely to prove troublesome. An accumulation of oversize is undesirable because it changes the hydrodynamic characteristics of the bed. The problem is common to fluidized bed boilers also, where the normal procedure is to take a sidestream bleed from the bed, separating and returning to the bed the correct size fraction and discarding the remainder. Several automated systems are commercially available to accomplish this, based on static screen separations or pneumatic classification.
- 146 -
The most common alternative procedure is to operate the system above the ash -melting temperature, thereby removing the excess material either as slag (e.g. in Koppers and BG Lurgi gasifiers) or as agglomerates which sink to the bottom of the bed and are removed (as in the Westinghouse and U-gas processes).
Neither of these methods is particularly attractive. Both suffer from the fact that there may be a carbon loss with the ash, thereby reducing the overall conversion efficiency of the gasifier. The former involves awkward materia ls handling, while the latter limits the range of coals suitable for gasification to those with the desired ash softening characteristics, and requires tight temperature control. Furthermore, the higher operating temperatures and potential chemical attack by molten slag present materials of construction problems.
- 147 -
6.5 CONCLUSIONS
A draft tube fluidized bed has been applied to coal gasification, on a pilot scale. By using the correct geometrical configuration and operating conditions, the combustion and gasification reactions have been kept separate, in the annulus and draft tube regions of the bed respectively, while maintaining a strong circulation of solid material between these zones.
As a result of the achievement of this zonal separation, air has been used as the oxidizing medium in the annulus, with concurrent production of synthesis quality gas in the draft tube. This draft tube product gas is of comparable quality to that made in other coal gasification processes which use oxygen (rather than air) as the combustion gas. In addition the H2/CO ratio of the gas produced in the gasifier developed here is higher than that obtained in these alternative processes, and may be varied over a considerable range, to match the quality of the gas produced to that of the downstream process requirements.
Separation of the gases discharged from the draft tube and annulus, by means of the hood arrangement described earlier (Section 3.5), was not attempted.
Higher draft tube gas flow rates were found to be necessary under hot gasification conditions, to maintain solids circulation, than were anticipated on the basis of the cold experiments. As a result, steam feed rates during the gasification experiments were higher than expected and steady thermal operation of the apparatus could not be achieved, because of the increased sensible heat load.
A high bulk flow of solids with in the bed is desirable, not only to disperse fresh coal feed into the bed, but is necessary because the solids provide the heat carrier from the combustion to the gasification zones. The temperature stability and high thermal inertia of the system are demonstrated by the insignificant temperature differences between different parts of the bed.
- 148 -
CHAPTER 7
CONCLUSIONS AND RECOMMENDATIONS
7.1 ACHIEVEMENTS OF THIS WORK
In this thesis a fluidized bed containing a draft tube has been studied, both experimentally and theoretically, with the aim of developing this apparatus for coal gasification. The principal results of the work are summarized below:
A fluidized bed containing a draft tube may be operated as two separate and independent reaction zones, one contained within the draft tube and the other in the annulus, while still sustaining circulation of solid material between these two zones. This entails keeping separate the gases supplied to the draft tube and annulus regions and also those emitted from them.
The partition of fluidizing gas between the draft tube and annulus legs of a fluidized bed containing a draft tube, is determined by the pressure drops over these legs being equalized. In order to achieve zonal separation (such that gas supplied to the draft tube all flows up the draft tube only, and gas supplied to the annulus all flows up the annulus only), this pressure balance must be achieved by utilizing an appropriate bed geometrical configuration and operating conditions. Based on this pressure ' balance analysis a number of strategies to minimise crossflow between the bed regions have been put forward and experimentally tested.
A theoretical model to describe the bulk transfer of solid material through a transporting fluidized bed operating in the slugging mode, has also been presented. Based on this theory, the solid circulation rate, the bubble fraction and the residense times of the gas and solid material in the draft tube can be predicted, provided that the relationships between slugging behaviour and particle properties are known.
- 149 -
The necessary relationships have been reported in the literature for round nosed and wall slugs, but not for square nosed slugs, which was found to be the characteristic operating mode for the draft tube, in this apparatus. This mode of slugging has not received significant attention in the literature.
In consequence, a further theory, using mechanical stress analysis, has been formulated for the square nosed slugging regime. Based on this theory, the plugs of dense phase separating square nosed slugs, operate as packed beds sliding up the walls of the draft tube. Using a dry friction model, a constant friction factor (which has been evaluated for this experimental system) may be used to calculate the frictional contribution to the bed pressure drop. The other contributions to pressure drop, namely the weight of the dense phase and the acceleration term, are easily calculated. Square nosed slugging appears to have significant advantages over other slug flow regimes, because the dense phase gas flow rate is up to several times greater, allowing improved gas - solid contacting.
Used together, these three models describe the operation of a draft tube fluidized bed. The predictions of the model closely approximate the experimentally observed operation, in terms of both the solid circulation rate and the gas crossflow.
The draft tube fluidized bed process, employing these principles, has very many demonstrable advantages when applied to coal gasification. On a pilot plant scale apparatus a synthesis quality gas has been produced, using air rather than oxygen as the oxidizing medium. Furthermore, the H2-CO ratio can be controlled at any value between about 1 and 3, by varying the operating conditions of the gasifier. The process is well suited to handling high fines loads in the coal feedstock and holds the promise (untested at this stage) of being capable of processing discard quality coals.

- 150 -
7.2 RECOMMENDATIONS FOR FURTHER RESEARCH
The lack of mechanical reliability of many of the components and ancillaries on the pilot plant has not allowed prolongued continuous operation (i.e. more than about 24h) under hot conditions and indeed, a major limitation encountered in this research program has been in overcoming these, often apparently trivial, mechanical problems. However, since this thesis deals mainly with the process development of this gasifier, the recommendations for further work presented here are limited to those necessary to extend and refine the process.
On a fundamental level, two broad areas of research may be identified as most pertinent for the advancement of this project.
In the field of fluidization the square nosed slugging regime has received very little attention in the literature. Indeed, even the way in which a particular system will slug - be it wall, round nosed or square nosed - cannot be predicted with the present state of knowledge. I
The effects of temperature and pressure on slugging behaviour also requires investigation. About square nosed slugs and plugs themselves very little appears to be known; even rise velocities, the rainoff of particles at interfaces, minimum stable plug lengths and so on need definition.
The second area of investigation is the kinetic behaviour of the reactor. Although reaction kinetics for coal combustion and gasification provide a major field in themselves, more parochial knowledge such as the rate limitations of the draft tube gasifier need to be evaluated. For example, it seems that the throughput of the apparatus may be limited, in the pilot unit, by the fluidization hydrodynamic constraints of the bed material, i.e. the rate at which gas reactants are supplied to the bed, rather than by the 'reaction kinetics ' • The fluidizing velocities can of course be changed, by altering the particle properties, and so the throughput of the reactor can presumably be increased until some other limiting step becomes
- 151 -
dominant. Kinetics also affect the product gas composition: the significant shift reaction which appears to be occuring in this reactor, but not in other processes, and which allows the H2/CO ratio to be changed, is a very important but unexplained bonus for this process.
In conclusion, the technical feasibility of using a draft tube fluidized bed for coal gasification and the many important advantages of this system over alternative processes have been demonstrated on pilot scale. On the basis of these encouraging results, the most important recommendation arising from this thesis is that the system needs to be demonstrated under continuous and prolongued operation under pressure, so that its economic viability can be evaluated.
Such operation will also enable process optimization to be carried out, control strategies for operation and turndown to be formulated and mechanical hardware development to proceed.
- 152 -
BIBLIOGRAPHY
1. SCHILLING, H 0, BONN, B and KRAUSS, U. Coal gasification. London, Graham and Trotman Ltd, 1981.
2. HOWARD-SMITH, I and WERNER, G J. Coal conversion technology. Chemical Technology Review No. 66. New Jersey, Noyes Data Corp., 1976.
3. SHIRES, M J and McMAHON, J F. Review of coal gasifiers for syngas production. Int. coal conversion conf. Pretoria, South Africa, 1982.
4. ANDERSON, L L and TILLMAN, 0 A. Synthetic fuels from coal : overview and assesment. New York, John Wiley and Sons, 1979.
5. BENN, F R, EDEWOR, J 0 and McAULIFFE, C A. Production and utilization of synthetic fuels: an energy economics study. London, Applied Science Pub., 1981.
6. WEN, C Y and LEE, E S (eds). Coal conversion technology. Mass., Addison Wesley Pub. Co., 1979.
7. TECHNICAL INFORMATION SERVICE OF THE CSIR. Nationa'l Institute for coal research (NICR). Pretoria, South Africa. Technical information for industry, Vol. 21, No.6, 1983. pp. 1-6.
8. DE KLERK, F W. Opening Address. ERI fluidized combustion conference. Cape Town, South Africa, 1981.
9. YATES, J G. Fundamentals of fluidized bed chemical processes. London, Butterworths, 1983.
10. JUDD, M R and RUDOLPH, V. Fluidized bed combustion and gasification of coal. Paper presented at the 1984 Coal Technology Symposium. Israel, 1984.
- 153 -
BIBLIOGRAPHY (Continued)
11. JUDO, M R, MASSON, Hand MEIHACK, W. Solid circulation and gasification experiments in a fluidized bed with a draught tube. in FLUIDIZATION. Kunii, D and Toei, R (eds). New York, Pub. by Engineering Foundation,
1983.
12. MEIHACK, W FAT. Combustion of high ash coal in fluidized combustor with a draught tube. MSc Thesis. University of Natal, 1984.
13. YANG, W C and KEAIRNS, D L. Studies on the solid circulation rate and gas bypassing in a spouted fluid-bed with a draft tube. Can. J Chern. Eng. Vol. 61, 1983. pp. 349 - 355.
14. YANG, W C and KEAIRNS, D L. Design of recirculating fluidized beds for commercial applications. AIChE Symposium Series No. 176. Vol. 74, . 1978. pp. 218 - 228.
15. LA NAUZE, R D and DAVIDSON, J F. The flow of fluidized solids. in FULIDATION TECHNOLOGY. Keairns, D L (ed.) Vol. 2. Washington, Hemisphere Pub. Co. 1976. pp. 113 - 124.
16. LA NAUZE, R D. A circulating fluidized bed. Powder Technol. Vol. 15, 1976. pp. 285 - 292.
17. GELDART, D. Types of gas fluidization. Powder Technol. Vol. 7, 1973. pp. 285 - 292.
18. KUNII, 0 and LEVENSPIEL, O. Fluidization Engineering. New York, Robert E Krieger Pub. Co., 1977.
~ 19. RIGBY, G R, CALLCOTT, T G, SINGH, B and EVANS, B R. New distributor for gas fluidized beds. Trans Inst. Chern. Eng. Vol. 55, 1977. pp. 68 - 70.
- 154 -
BIBLIOGRAPHY (Continued)
20. SOUTH AFRICAN INVENTIONS DEVELOPMENT CORPORATION Operation of a circulating fluidized bed having a draught tube.
Provo Pat. no. 84/8067. 1984.
21. ERGUN S. Fluid flow through packed columns. Chem. Eng. Prog. Vol 48,
No 2, 1952. pp. 89 - 94.
22. YANG, W C and KEAIRNS, D L. Recirculating fluidized bed reactor data utilizing a two-dimensional cold model. AIChE Symposium Series No.
141. Vol. 70, 1974. pp. 27 - 40.
23. SINGH, B. Theory of slugging lifters. Powder Technol. Vol. 21, 1978.
pp. 81 -89.
24. STEWART, P S B and DAVIDSON, J F. Slug flow in fluidized beds. Powder
Technol. Vol. 1, 1967. pp. 61 - 81.
25. BAEYENS, J and GELDART, D. An investigation into slugging fluidized beds. Chem. Eng. Sci. Vol 29, 1974. pp. 255 - 265.
26. DAVIDSON, J F and HARRISON, D. Fluidization. London, Academic Press,
1971.
27. ZENZ, F A and OTHMER, D F. Fluidization and fluid-particle systems. New York, Reinholt Publishing Co., 1960.
28. BAKER, C G J and GELDART, D. An investigation into the slugging characteristics of large particles. Powder Technol. Vol. 19, 1978.
pp. 77 - 187.
. I
29. GELDART, D, HURT, J M and WADIA, P H. Slugging in beds of large particles. AIChE Symposium Series No. 176. Vol. 74, 1978. pp. 60 - 66.
30. CANADA, G S, McLAUGHLIN, M H and STAUB, F W. Flow regimes and void fraction distribution in gas fluidization of large particles in beds without tube banks. AIChE Symposium Series No. 176. Vol. 74, 1978. pp. 14 - 26.
- 155 -
BIBLIOGRAPHY (Continued)
31. CANADA, G S and McLAUGHLIN, M H. Large particle fluidization and heat transfer at high pressures. AIChE Symposium Series No. 176. Vol. 74,
1978. pp. 27 - 37.
32. TOOMEY, R 0 and JOHNSTONE, H F. Gaseous fluidization of solid particles. Chem. Eng. Prog. Vol. 48, No.5, 1952. pp. 220 - 226.
33. SATIJA, S and FAN, L S. Characteristics of slugging fluidized beds of large coarse particles. Proceedings Symposium on Separation Technology, Taipei, 1983.
34. GEL'PERIN, N I, AINSHTEIN, V G and SUKHANOVA, L I. Some hydrodynamic characteristics of fluidization in the piston regime. Theoretical Found. of Chem. Eng. Vol. 4, 1970. pp. 123 - 129.
35. BIRKHOFF, G and CARTER, D. Rising plane bubbles. J Rat Mech. Anal. Vol. 6, 1957. pp. 769 - 773.
36. KEHOE, P W K and DAVIDSON, J F. Chemeca 70. Chemical Engineering Conference. Melbourne, Australia. Butterworths, 1970.
37. MATSEN, J M and TARMY, B L. Scale-up of laboratory fluid-bed data: the significance of slug flow. Chem. Eng. Prog. Symposium Series No. 101. Vol. 66, 1970. pp. 1 - 7.
38. BROADHURST, T E and BECKER, H A. Measurement and spectral analysis of pressure fluctuations in slugging beds. in FLUIDIZATION TECHNOLOGY. Keairns, D L (ed). Vol. 1 Washington, Hemisphere Pub. Co., 1976. pp. 63 - 85.
39. MATSEN, J M, HOVMAND, S and DAVIDSON, J F. Expansion of fluidized beds in slug flow. Chem. Eng. Sci. Vol. 24, 1969. pp. 1743 - 1754.
40. VERLOOP, J and HEERTJES, P M. Periodic pressure fluctuations in a
fluidized bed. Chem. Eng. Sci. Vol. 29, No.4, 1974. pp. 1035 - 1042.
- 156 -
BIBLIOGRAPHY (Continued)
41. FAN, L T, HO, T C, HIRAOKA, Sand WALAWENDER, W P. Pressure fluctuations in a fluidized bed AIChE J. Vol. 27, No.3, 1981.
pp. 338 - 396.
42. THIEL, W J and POTTER, 0 E. Slugging in fluidized beds. Ind. Eng. Chern. Fundam. Vol. 16, No.2, 1977. pp. 242 - 247.
43. FAN, L T, HO, T C and WALAWENDER, W P. Measurements of the rise velocities of bubbles, slugs and pressure waves in a gas-solid fluidized bed using pressure fluctuation signals. AIChE J. Vol. 29, No.1, 1983. pp. 338 - 396.
44. HIKITA, K, IKEDA, M and ASANO, H. Upward transportation of particles in dense phase. in FLUIDIZATION. Kunii, D and Toei, R (eds). New York, Pub. by Engineering Foundation, 1983.
45. ISHIDA, M and SHIRAI, T. Circulation of solid particles within the fluidized bed with a draft tube. J. Chern. Eng. Japan. Vol. 8, No.6, 1975. pp. 477 - 481.
46. YANG, W C and KEAIRNS, D L. Comparison of recirculating performance in two-dimensional and three-dimensional beds. in FLUIDIZATION TECHNOLOGY. Keairns, D L (ed). Vol. 2 Washington, Hemisphere PUb. Co., 1976. pp. 51 - 64.
47. MASSON, H, DANG-TRAN, K and RIOS, G. Circulation of a large isolated sphere in a gas solid fluid bed. Preprint from Inst. Chern. Eng. Symposium Series No. 65, 1982.
48. KECECIOGLU, I, YANG, W C and KEAIRNS, D L. Fate of solids fed pheumatically through a jet into a fluidized bed. AIChE J. Vol. 30, No.1, 1984. pp. 99 - 106.
49. VERLOOP, J. The origin of bubbles in fluidized systems. PhD Thesis. Technische Hogeschool Delft, 1971.
- 157 -
BIBLIOGRAPHY (Continued)
50. WALTERS, J K. A theoretical analysis of stresses in silos with vertical walls. Chern. Eng. Sci. Vol. 28, 1973. pp. 13 -21
51. HARR, M E. Mechanics of particulate media. New York, McGraw - Hill,
1977.
52. WALKER, 0 M. An approximate theory for pressures and arching in hoppers. Chern. Eng. Sci. Vol. 21, 1966. pp. 975 - 997.
53. JUDD, M R. Bins and Hoppers. Paper presented to the S A Inst. Chern. Engrs. Cape Town, 1974.
54. NEDDERMAN, R M. The theoretical prediction of stress distribution in hoppers. Trans. Inst. Chern. Eng. Vol. 60, No.5, 1982. pp. 259 - 275.
55. MOLERUS, O. Theory of yield of cohesive powders. Powder Technol. Vol. I
12, 1975. pp. 259 - 275.
56. MOLERUS, O. Effect of interparticle cohesive forces on the flow behaviour of powders. Powder Technol. Vol. 20, 1978. pp. 161 - 175.
57. HEERTJES, P M, KHOE, G K and KUSTER, D. A condition diagram for some non-cohesive round glass particles. Powder Technol. Vol. 20, 1978. pp. 161 - 175.
58. JACKSON, R and JUDD, M R. Further consideration of the effect of aeration on the flowability of powders. Trans. Inst. Chern. Eng. Vol. 59, 1981. pp. 119 - 121.
59. POTTER, 0 E and THIEL W. Solids mixing in slugging fluidized beds. in FLUIDATION TECHNOLOGY. Keairns, 0 L (ed). Vol. 2 Washington, Hemisphere Pub. Co., 1976. pp. 185 - 192.
- 158 -
BIBLIOGRAPHY (Continued)
60. DONSI, G, FORMISANI, B, VALENTINO, Rand VOLPICELLI, G. The measurement of characteristic angles in the prediction of their behaviour in the gas fluidized state. Powder Technol. Vol. 37, 1984. pp. 39 - 47.
61. EMERY, R B. Concepts of multiphase flow related to the Jenike design method. Trans. ASME. Aug, 1974. pp. 936 - 939.
62. BROADHURST, T E and BEKKER, H A • Onset of fluidization and slugging in beds of uniform particles. AIChE J. Vol. 21, 1975. pp. 238 - 247.
63. LEVA, M, WEINTRAUB, M, GRUMMER, M POLLCHIK, M, and STORCH, H.H. US Bureau of Mines Bulletin 504. 1951. cited in [62J.
64. LEUNG, L S. The ups and downs of gas-solid flow - a review. in FLUIDIZATION. Grace, J M and Matsen, J M (eds). New York, Plenum Press
1980. pp. 25 - 68.
65. ARASTOOPOUR, Hand GIDASPOW, D. Vertical pheumatic conveying using four hydrodynamiC models. Ind. Eng. Chem. Fundam. Vol. 18, No.2, 1979. pp. 123 - 130.
66. MODI, M V, TALWALKER, A T and PUNWANI, 0 V. Pressure drop correlations for designing vertical dilute-phase gas-solid lift lines for materials used in coal conversion processes. Proceedings Int. Powder and Bulk Solids Handling and Process ing Conference. Chicago. 1978.
67. SOKOLOVSKI, V V. Statics of granular media. New York, Pergammon Press, 1965.
68. JONES, P J. Downflow of gas-solid mixtures in bottom restrained vertical standpipes. PhD Thesis. U. Queensland, 1980.
69. HO, T C, YUTANI, N, FAN, L T and WALAWENDER, W P. The onset of slugging in gas-solid fluidized beds with large particles. Powder Technol. Vol. 35, No.2, 1983. pp. 249 - 257.
- 159 -
BIBLIOGRAPHY (Continued)
70. CONWIN, S C. A theory for the flow of granular materials. Powder Technol. Vol. 9, 1974. pp. 61 - 69.
71. HOGG, R and AUGENSTEIN, D A. - Rheology of free-flowing powders. Int. Powder and Bulk Solids Handling and Processing: Proceedings of Technical Program. Rosemont, Ill., 1978.
72. NEDDERMAN, R M and LAOHOKUL, C. The thickness of the shear zone of flowing granular materials. Powder Technol. Vol. 25, 1980.
pp. 91 - 100.
73. AUGENSTEIN, D A and HOFF, R. An experimental study of the flow of dry powders over inclined surfaces. Powder Technol. Vol. 19, 1978. pp. 205 - 215.
74. LEGEL, D and SCHWEDES, J. Investigation of pheumatic conveying of plugs , of cohesionless bulk solids in horizontal pipes. Bulk Solids Handling. Vol. 4, 1984. pp. 399 - 405.
75. LEUNG, L S, WILES, R J and NICKLIN, D J. Transition from fluidized to packed bed flow in vertical hydraulic conveying. Trans. Inst. Chern. Eng. Vol. 47, 1969. pp. 271 - 278.
76. MATSEN, J M. A phase diagram for gas-particle flow. in FLUIDIZATION. Kunii, D and Toei, R (eds). New York, Pub. by Engineering Foundation, 1983.
77. CALVERT, S and MILLER, R H. Flow of dense pastes in vertical tubes. Ind. Eng. Chern. Vol. 52, 1958. pp. 1793 - 1798.
78. NICKLIN, D J. Two phase bubbly flow. Chern. Eng. Sci. Vol. 17, 1962. pp. 693 - 702.
- 160 -
BIBLIOGRAPHY (Continued)
79. JUDD, M Rand MEIHACK, W FAT. A deep pressurized combustion facility with an internal draught tube. ERI fluidized combustion conference.
Cape Town, South Africa, 1981.
80. JUOD, M R. Development of a new fluidized bed gasifier. Gasification of coal for general industry symposium. Johannesburg, South Africa,
1981.
81. JUDD, M Rand MEIHACK, W FAT. High pressure combustion and gasification in a fluidized bed with a draft tube. CHEMSA, 1983.
pp. 224 - 226.
82. INTERNATIONAL STANDARDS ORGANIZATION. Solid mineral fuels -determination of ash. Ref. ISO 1171 - 1976. 1976.
83. YAVUZKURT, S, GUTFINGER, C and DAYAN, J. Fluidized combustion of oil shale in FLUIDIZATION. Grace, J R and Matsen, J M (eds) Vol. 1 New York, Plenum Press, 1980. pp. 143 - 150.
84. SCHACHTER, 0, BASEVI, E, CLARK, ELand GOTTESMAN, E. Pilot plant experiments on combustion of Israel oil-shale. Proc. 4th World Petroleum Congress. Sec. III/H. Rome, Carlo Colombo Publishers, 1980.
84. CAMPBELL, E K and DAVIDSON, J F. The combustion of coal in fluidized beds. Inst. of Fuel Symposium Series No.1: Fluidized combustion. London, 1975.
86. BOGNER, F and STIRLAND, C K. Large-scale gaSification of coal fines. Int. Coal Conversion Conference. Pretoria, South Africa, 1982.
87. ARTHURS, M J. The Westinghouse fluidized bed coal gaSification process. CHEMSA, 1982. pp. 85 - 91.
- 161 -
BIBLIOGRAPHY (Continued)
88. CORNILS, B, HIBBEL, J, RUPRECHT, P, LANGHOFF, J and DURRFELD, R. Coal gasification as a syngas source for the chemical industry. Int. Coal Conversion Conference. Pretoria, South Africa, 1982.
89. WEN, C Y and YU, Y H. A generalized method for predicting the minimum fluidization velocity. AIChE J. Vol. 12, No.3, 1966. pp. 610 - 612.
90. JUDD, M R. Private communication.
91. ZENZ, F A, ZENZ, F E and ZENZ J A. Riser design considerations under slug flow conditions. Powder Technol. Vol. 38, 1984. pp. 205 - 210.
92. ORMISTON, R M, MITCHELL, F R F and DAVIDSON, J F. The velocities of slugs in fluidized beds. Trans. Inst. Chern. Eng. Vol. 43, 1965. pp. 209 - 216.
93. DRY, R J and JUDD, M R. Bubble velocities in fluidized beds of fine, dense powders. Powder Technol. Vol. 39, 1984. pp. 69 - 75.
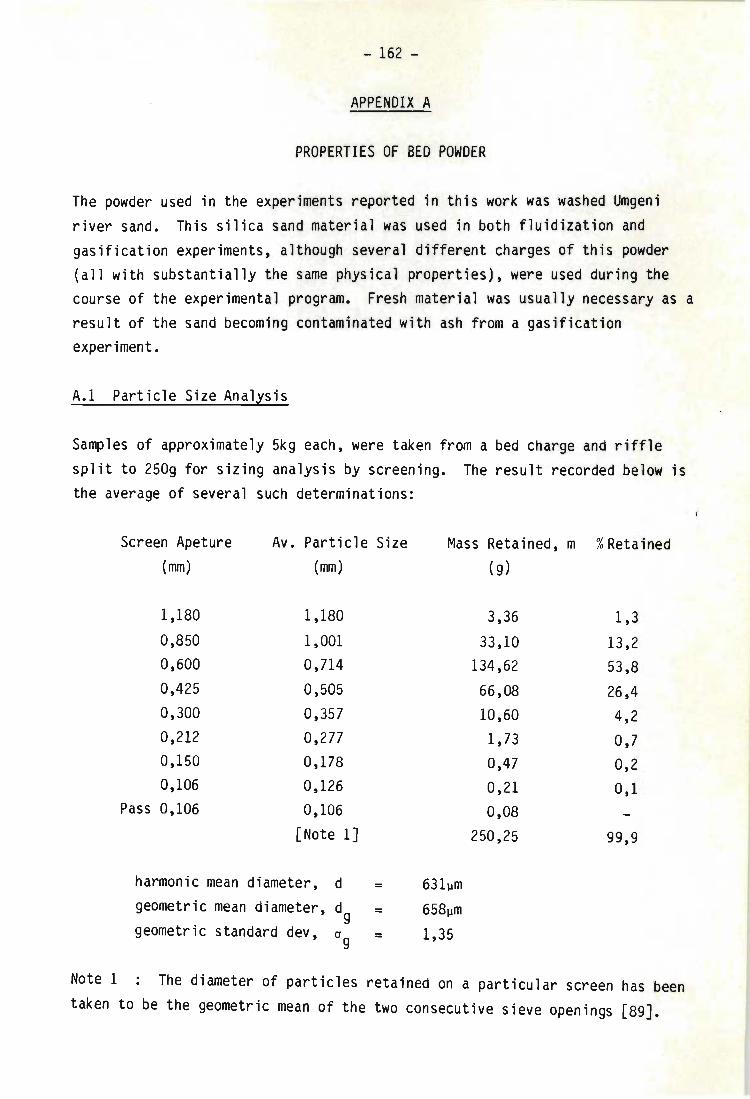
- 162 -
APPENDIX A
PROPERTIES OF BED POWDER
The powder used in the experiments reported in this work was washed Umgeni river sand. This sil ica sand material was used in both fluidization and gasification experiments, although several different charges of this powder (all with substantially the same physical properties), were used during the course of the experimental program. Fresh material was usually necessary as a result of the sand becoming contaminated with ash from a gasification experiment.
A.l Particle Size Analysis
Samples of approximately 5kg each, were taken from a bed charge and riffle split to 250g for sizing analysis by screening. The result recorded below is the average of several such determinations:
Screen Apeture Av. Particle Size Mass Retained, m % Retained (mm) (mm) (g)
1,180 1,180 3,36 1,3 0,850 1,001 33,10 13,2 0,600 0,714 134,62 53,8 0,425 0,505 66,08 26,4 0,300 0,357 10,60 4,2 0,212 0,277 1,73 0,7 0,150 0,178 0,47 0,2 0,106 0,126 0,21 0,1
Pass 0,106 0,106 0,08 [Note IJ 250,25 99,9
harmonic mean diameter, d = 631llm geometric mean diameter, dg = 658llm geometric standard dev, 0g = 1,35
Note 1 The diameter of particles retained on a particular screen has been taken to be the geometric mean of the two consecutive sieve openings (89J.
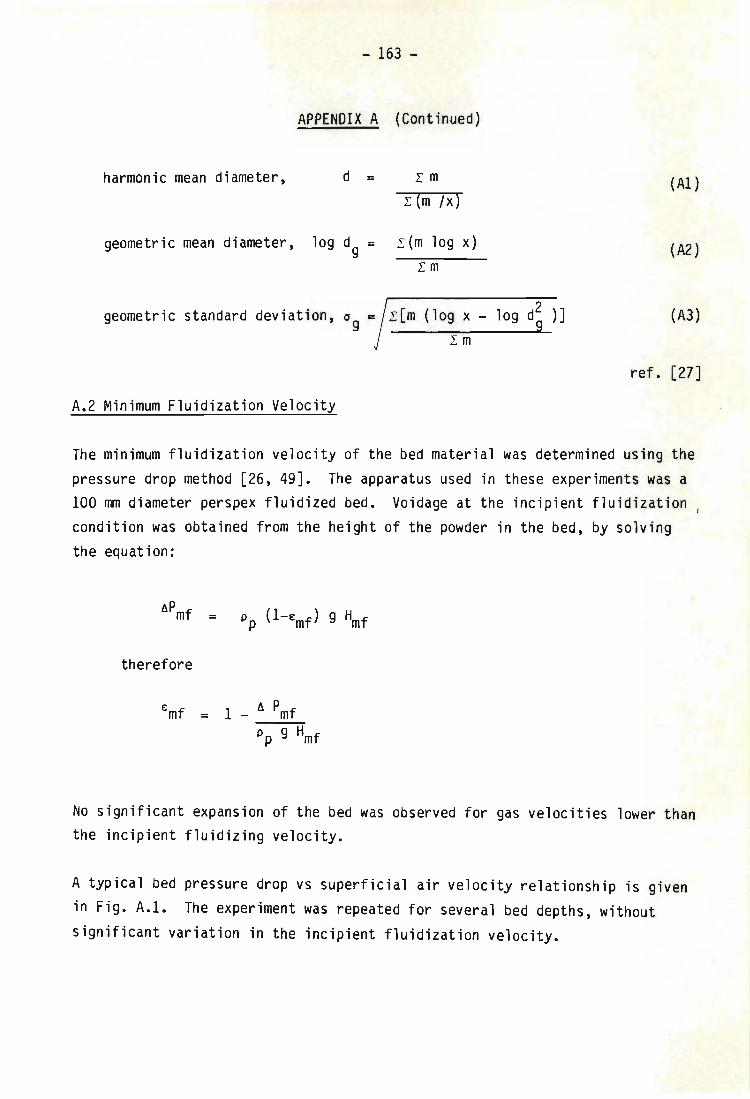
- 163 -
APPENDIX A (Continued)
harmonic mean diameter, d = r m
r (m Ix)
geometric mean diameter, log dg = r (m log x) r m
geometric standard deviation, 0g = r em (log x - log d~ )] r m
A.2 Minimum Fluidizat ion Velocity
(AI)
(A2 )
(A3)
ref. [27]
The minimum fluidization velocity of the bed material was determined using the
pressure drop method [26, 49]. The apparatus used in these experiments was a 100 mm diameter perspex fluidized bed. Voidage at the incipient fluidization I
condition was obtained from the height of the powder in the bed, by solving
the equation:
therefore
Emf = 1 _ a Pmf Pp g Hmf
No significant expansion of the bed was observed for gas velocities lower than the incipient fluidizing velocity.
A typical bed pressure drop vs superficial air velocity relationship is given
in Fig. A.l. The experiment was repeated for several bed depths, without
significant variation in the incipient fluidization velocity.
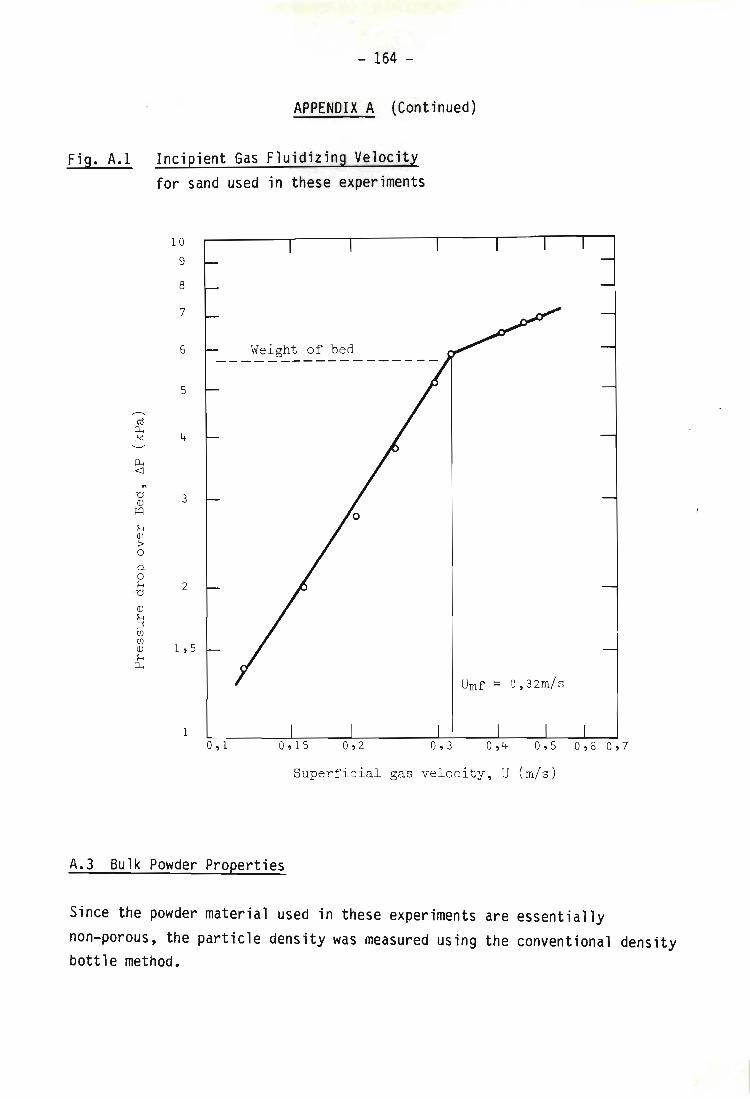
Fig. A.1
" 'd OJ
I=Q
H OJ :> o p.. o H 'd
OJ H ;:s Ul Ul OJ H
p..,
164 -
APPENDIX A (Continued)
Incipient Gas Fluidizing Velocity for sand used in these experiments
10
9
8
7
6 We i ght of bed ------------------
5
3
2
1 , 5
0 , 1
Umf = 0 , 32m/s
Superficial gas vel ocity , U (m/s)
A.3 Bulk Powder Properties
Since the powder material used in these experiments are essentially non-porous, the particle density was measured using the conventional density bottle method.
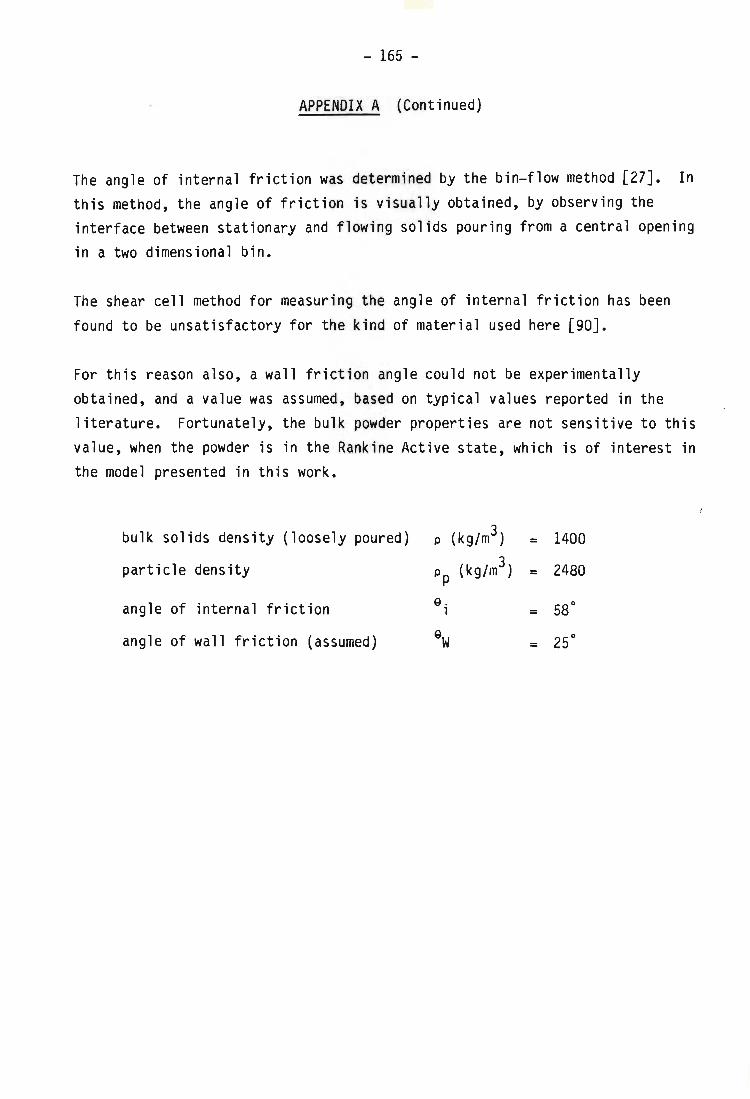
- 165 -
APPENDIX A (Continued)
The angle of internal friction was determined by the bin-flow method [27]. In this method, the angle of friction is visually obtained, by observing the interface between stationary and flowing solids pouring from a central opening in a two dimensional bin.
The shear cell method for measuring the angle of internal friction has been found to be unsatisfactory for the kind of material used here [90J.
For this reason also, a wall friction angle could not be experimentally obtained, and a value was assumed, based on typical values reported in the literature. Fortunately, the bulk powder properties are not sensitive to this value, when the powder is in the Rankine Active state, which is of interest in the model presented in this work.
bulk solids density (loosely poured) p (kg/m3) = 1400
particle density Pp (kg/m3) = 2480
angle of internal friction 9. 58° 1 = angle of wall friction (assumed) 9W = 25°
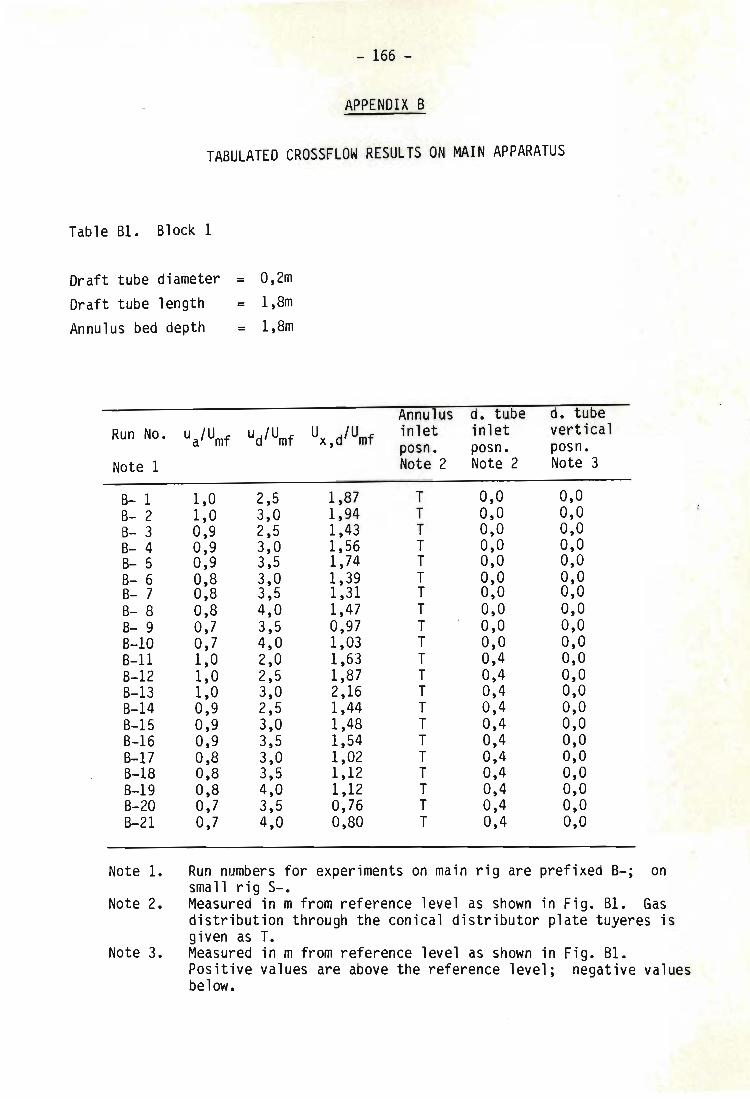
- 166 -
APPENDIX B
TABULATED CROSSFLOW RESULTS ON MAIN APPARATUS
Table B1. Block 1
Draft tube diameter Draft tube length Annulus bed depth
Run No. ua,Umf
Note 1
B- 1 1,0 B- 2 1,0 B- 3 0,9 B- 4 0,9 B- 5 0,9 B- 6 0,8 B- 7 0,8 B- 8 0,8 B- 9 0,7 B-I0 0,7 B-11 1,0 B-12 1, ° B-13 1,0 B-14 0,9 B-15 0,9 B-16 0,9 B-17 0,8 8-18 0,8 B-19 0,8 B-20 0,7 B-21 0,7
= 0,2m
= 1,8m
= 1,8m
ud,Umf
2,5 3,0 2,5 3,0 3,5 3,0 3,5 4,0 3,5 4,0 2,0 2,5 3,0 2,5 3,0 3,5 3,0 3,5 4,0 3,5 4,0
Note 1. Run numbers for sma 11 rig S-.
Note 2.
Ux d,Umf ,
1,87 1,94 1,43 1,56 1,74 1,39 1,31 1,47 0,97 1,03 1,63 1,87 2,16 1,44 1,48 1,54 1,02 1,12 1,12 0,76 0,80
experiments
Annulus d. tube d. tube inlet inlet vertical posn. posn. posn. Note 2 Note 2 Note 3
T 0,0 0,0 T 0,0 0,0 T 0,0 0,0 T 0,0 0,0 T 0,0 0,0 T 0,0 0,0 T 0,0 0,0 T 0,0 0,0 T 0,0 0,0 T 0,0 0,0 T 0,4 0,0 T 0,4 0,0 T 0,4 0,0 T 0,4 0,0 T 0,4 0,0 T 0,4 0,0 T 0,4 0,0 T 0,4 0,0 T 0,4 0,0 T 0,4 0,0 T 0,4 0,0
on main rig are prefixed B-' , on
Gas Measured in m from reference level as shown in Fig. B1. distribution through the conical distributor plate tuyeres is given as T.
Note 3. Measured in m from reference level as shown in Fig. B1. Positive values are above the reference level; negative values below.
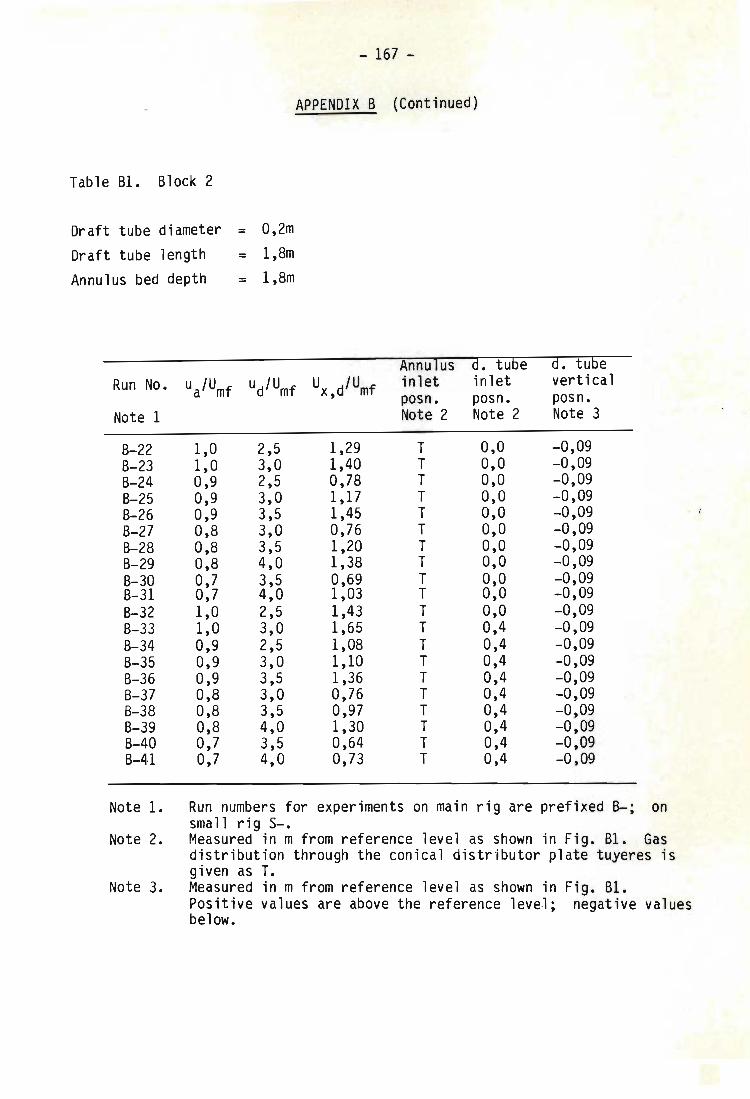
- 167 -
APPENDIX B (Continued)
Table B1. Block 2
Draft tube diameter = 0,2m Draft tube length = 1,8m Annulus bed depth = 1,8m
Annulus d. tube d. tube Run No. ua,Umf ud,Umf Ux d,Umf inlet inlet vertical , posn. posn. posn. Note 1 Note 2 Note 2 Note 3
B-22 1,0 2,5 1,29 T 0,0 -0,09 B-23 1,0 3,0 1,40 T 0,0 -0,09 B-24 0,9 2,5 0,78 T 0,0 -0,09 B-25 0,9 3,0 1,17 T 0,0 -0,09 B-26 0,9 3,5 1,45 T 0,0 -0,09 B-27 0,8 3,0 0,76 T 0,0 -0,09 8-28 0,8 3,5 1,20 T 0,0 -0,09 B-29 0,8 4,0 1,38 T 0,0 -0,09 B-30 0,7 3,5 0,69 T 0,0 -0,09 B-31 0,7 4,0 1,03 T 0,0 -0,09 B-32 1,0 2,5 1,43 T 0,0 -0,09 B-33 1,0 3,0 1,65 T 0,4 -0,09 B-34 0,9 2,5 1,08 T 0,4 -0,09 B-35 0,9 3,0 1,10 T 0,4 -0,09 B-36 0,9 3,5 1,36 T 0,4 -0,09 B-37 0,8 3,0 0,76 T 0,4 -0,09 B-38 0,8 3,5 0,97 T 0,4 -0,09 8-39 0,8 4,0 1,30 T 0,4 -0,09 8-40 0,7 3,5 0,64 T 0,4 -0,09 8-41 0,7 4,0 0,73 T 0,4 -0,09
Note 1. Run numbers for experiments on main rig are prefixed 8-' on , sma 11 rig $-.
Note 2. Measured in m from reference level as shown in Fig. B1. Gas distribution through the conical distributor plate tuyeres is given as T.
Note 3. Measured in m from reference level as shown in Fig. B1. Positive values are above the reference level; negative values below.
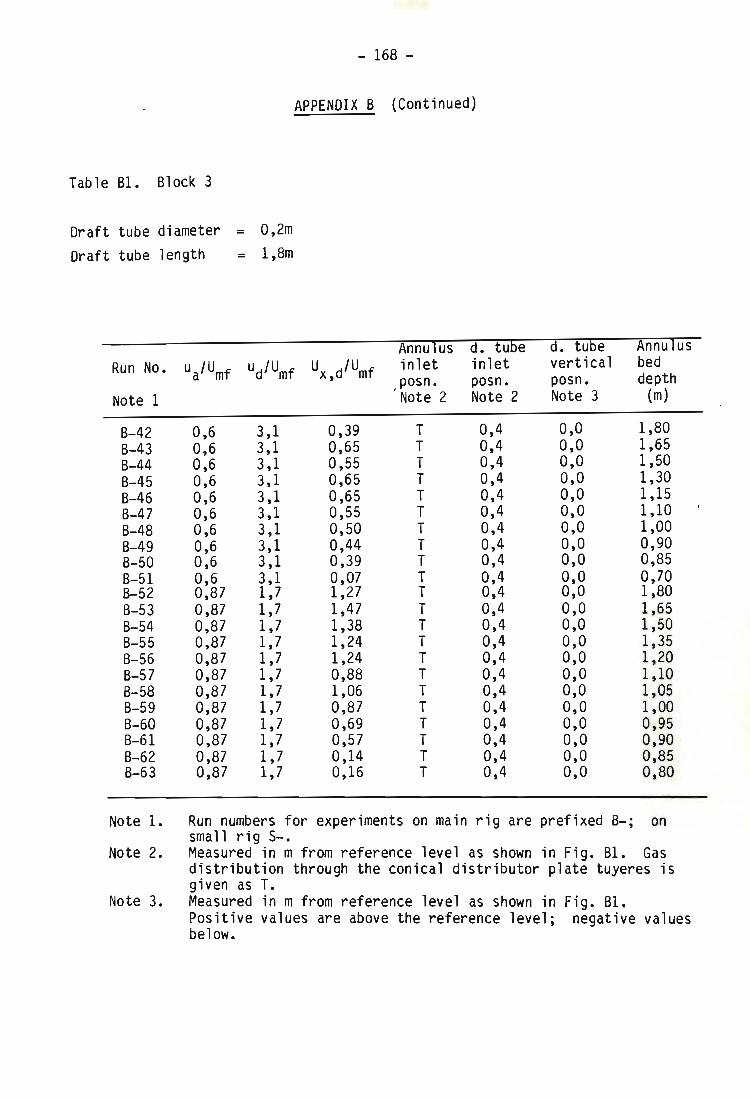
- 168 -
APPENDIX B (Continued)
Table B1. Block 3
Draft tube diameter = 0,2m Draft tube length = 1,8m
Run No. ua,Umf ud,Umf
Note 1
B-42 0,6 3,1 8-43 0,6 3,1 B-44 0,6 3,1 B-45 0,6 3,1 B-46 0,6 3,1 B-47 0,6 3,1 B-48 0,6 3,1 B-49 0,6 3,1 8-50 0,6 3,1 8-51 0,6 3,1 8-52 0,87 1,7 8-53 0,87 1,7 B-54 0,87 1,7 8-55 0,87 1,7 8-56 0,87 1,7 8-57 0,87 1,7 8-58 0,87 1,7 8-59 0,87 1,7 8-60 0,87 1,7 8-61 0,87 1,7 B-62 0,87 1,7 8-63 0,87 1,7
Note 1. Run numbers for small rig S-.
Note 2.
Annulus d. tube d. tube Ux,d,Umf inlet inlet vertical
posn. posn. posn. ' Note 2 Note 2 Note 3
0,39 T 0,4 0,0 0,65 T 0,4 0,0 0,55 T 0,4 0,0 0,65 T 0,4 0,0 0,65 T 0,4 0,0 0,55 T 0,4 0,0 0,50 T 0,4 0,0 0,44 T 0,4 0,0 0,39 T 0,4 0,0 0,07 T 0,4 0,0 1,27 T 0,4 0,0 1,47 T 0,4 0,0 1,38 T 0,4 0,0 1,24 T 0,4 0,0 1,24 T 0,4 0,0 0,88 T 0,4 0,0 1,06 T 0,4 0,0 0,87 T 0,4 0,0 0,69 T 0,4 0,0 0,57 T 0,4 0,0 0,14 T 0,4 0,0 0,16 T 0,4 0,0
experiments on main rig are prefixed 8-· ,
Annulus bed depth
(m)
1,80 1,65 1,50 1,30 1,15 1,10 1,00 0,90 0,85 0,70 1,80 1,65 1,50 1,35 1,20 1,10 1,05 1,00 0,95 0,90 0,85 0,80
on
Measured in m from reference level as shown in Fig. 81. Gas distribution through the conical distributor plate tuyeres is given as T.
Note 3. Measured in m from reference level as shown in Fig. 8l. Positive values are above the reference level; negative values below.
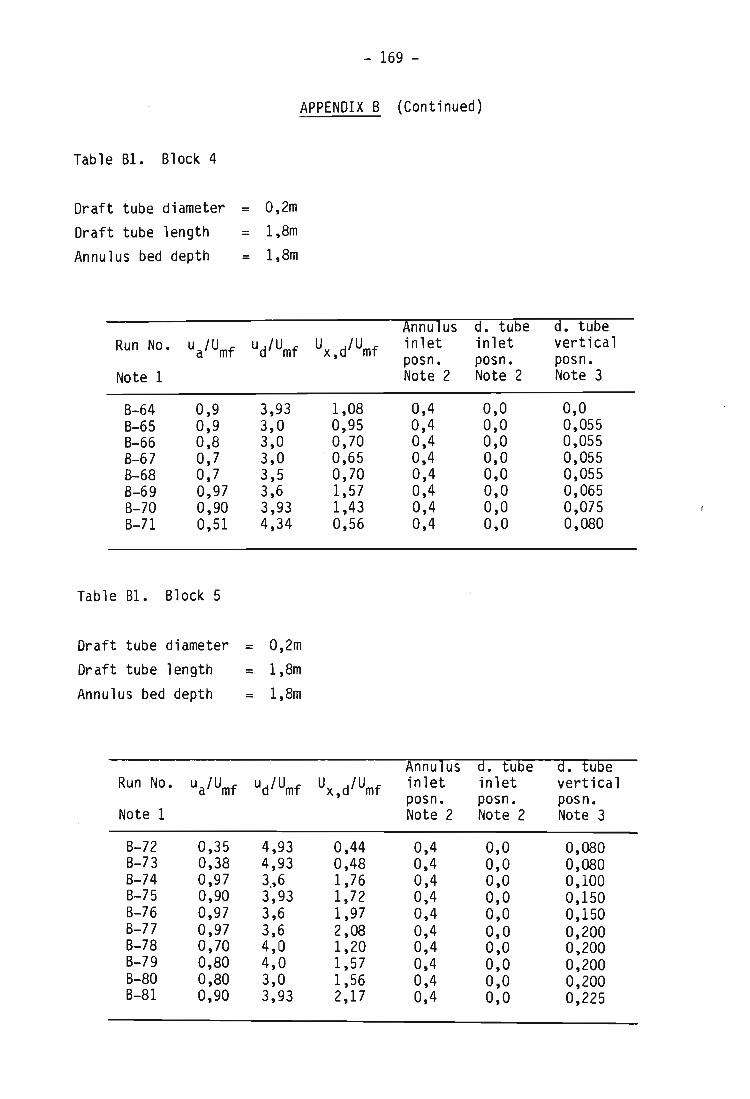
- 169 -
APPENDIX B (Continued)
Table B1. Block 4
Draft tube diameter = 0,2m Draft tube length = 1,8m Annulus bed depth = 1,8m
Run No. ua/Umf
Note 1
B-64 0,9 B-65 0,9 B-66 0,8 B-67 0,7 8-68 0,7 B-69 0,97 B-70 0,90 B-71 0,51
Table B1. Block 5
Draft tube diameter Draft tube length Annulus bed depth
Run No. ua/Umf Note 1
B-72 0,35 B-73 0,38 B-74 0,97 B-75 0,90 B-76 0,97 B-77 0,97 B-78 0,70 B-79 0,80 B-80 0,80 B-81 0,90
ud/Umf
3,93 3,0 3,0 3,0 3,5 3,6 3,93 4,34
= O,2m = 1,Bm = 1,8m
ud/Umf
4,93 4,93 3,,6 3,93 3,6 3,6 4,0 4,0 3,0 3,93
Annulus d. tube Ux,d/Umf inlet inlet
posn. posn. Note 2 Note 2
1,08 0,4 0,0 0,95 0,4 0,0 0,70 0,4 0,0
· 0,65 0,4 0,0 0,70 0,4 0,0 1,57 0,4 0,0 1,43 0,4 0,0 0,56 0,4 0,0
Annulus d. tube Ux,d/Umf inlet inlet
posn. posn. Note 2 Note 2
0,44 0,4 0,0 0,48 0,4 0,0 1,76 0,4 0,0 1,72 0,4 0,0 1,97 0,4 0,0 2,08 0,4 0,0 1,20 0,4 0,0 1,57 0,4 0,0 1,56 0,4 0,0 2,17 0,4 0,0
d. tube vertical posn. Note 3
0,0 0,055 0,055 0,055 0,055 0,065 0,075 0,080
d. tube vertical posn. Note 3
0,080 0,080 0,100 0,150 0,150 0,200 0,200 0,200 0,200 0,225
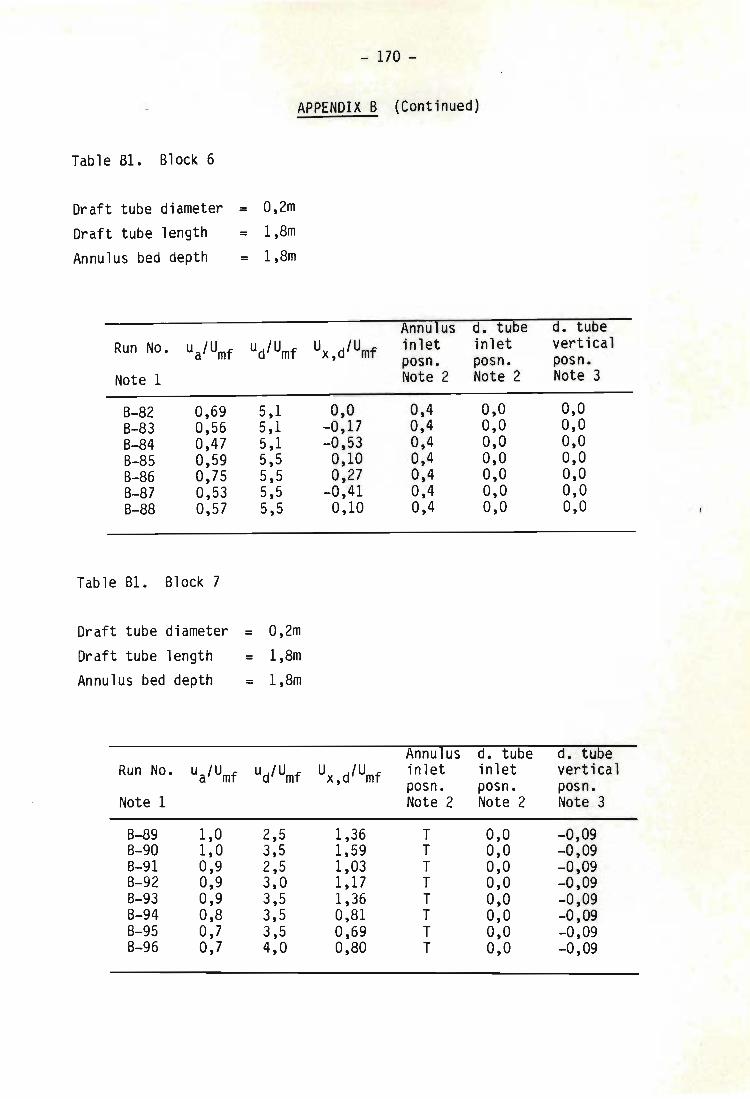
- 170 -
APPENDIX 6 (Continued)
Table 61. 6lock 6
Draft tube diameter = 0,2m Draft tube length = 1,8m Annulus bed depth = 1,8m
Run No. ua,Umf
Note 1
6-82 0,69 6-83 0,56 6-84 0,47 6-85 0,59 6-86 0,75 6-87 0,53 6-88 0,57
Table 61. 6lock 7
Draft tube diameter Draft tube length Annulus bed depth
Run No. ua'Umf Note 1
6-89 1,0 B-90 1,0 6-91 0,9 B-92 0,9 6-93 0,9 B-94 0,8 B-95 0,7 B-96 0,7
ud,Umf
5,1 5,1 5,1 5,5 5,5 5,5 5,5
= 0,2m
= 1,8m
= 1,8m
ud,Umf
2,5 3,5 2,5 3,0 3,5 3,5 3,5 4,0
Annulus d. tube Ux,d,Umf inlet inlet
posn. posn. Note 2 Note 2
0,0 0,4 0,0 -0,17 0,4 0,0 -0,53 0,4 0,0 0,10 0,4 0,0 0,27 0,4 0,0
-0,41 0,4 0,0 0,10 0,4 0,0
Annulus d. tube Ux,d,Umf inlet inlet
posn. posn. Note 2 Note 2
1,36 T 0,0 1,59 T 0,0 1,03 T 0,0 1,17 T 0,0 1,36 T 0,0 0,81 T 0,0 0,69 T 0,0 0,80 T 0,0
d. tube vertical posn. Note 3
0,0 0,0 0,0 0,0 0,0 0,0 0,0
d. tube vertical posn. Note 3
-0,09 -0,09 -0,09 -0,09 -0,09 -0,09 -0,09 -0,09
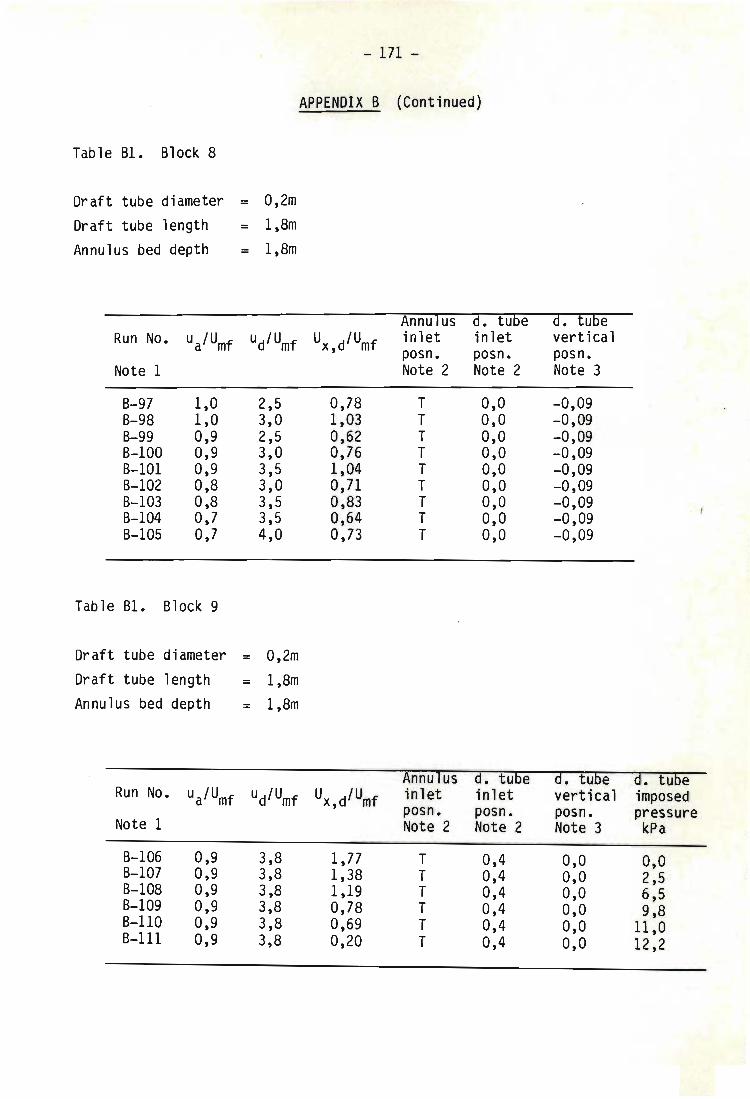
- 171 -
APPENDIX B (Continued)
Table B1. Block 8
Draft tube diameter = 0,2m Draft tube length = 1,8m Annulus bed depth = 1,8m
Run No. ua/Umf
Note 1
B-97 1,0 B-98 1,0 B-99 0,9 B-100 0,9 B-101 0,9 B-102 0,8 B-103 0,8 B-104 0,7 B-105 0,7
Table B1. Block 9
Draft tube diameter
Draft tube length Annulus bed depth
Run No. ua/Umf
Note 1
B-106 0,9 B-107 0,9 B-108 0,9 B-109 0,9 B-110 0,9 B-111 0,9
ud/Umf
2,5 3,0 2,5 3,0 3,5 3,0 3,5 3,5 4,0
= O,2m = 1,8m = 1,8m
ud/Umf
3,8 3,8 3,8 3,8 3,8 3,8
Annulus d. tube Ux,d/Umf inlet inlet
posn. posn. Note 2 Note 2
0,78 T 0,0 1,03 T 0,0 0,62 T 0,0 0,76 T 0,0 1,04 T 0,0 0,71 T 0,0 0,83 T 0,0 0,64 T 0,0 0,73 T 0,0
Annulus d. tube Ux,d/Umf inlet inlet
posn. posn. Note 2 Note 2
1,77 T 0,4 1,38 T 0,4 1,19 T 0,4 0,78 T 0,4 0,69 T 0,4 0,20 T 0,4
d. tube vertical posn. Note 3
-0,09 -0,09 -0,09 -0,09 -0,09 -0,09 -0,09 -0,09 -0,09
d. tube d. tube vertical imposed posn. pressure Note 3 kPa
0,0 0,0 0,0 2,5 0,0 6,5 0,0 9,8 0,0 11 ,0 0,0 12,2
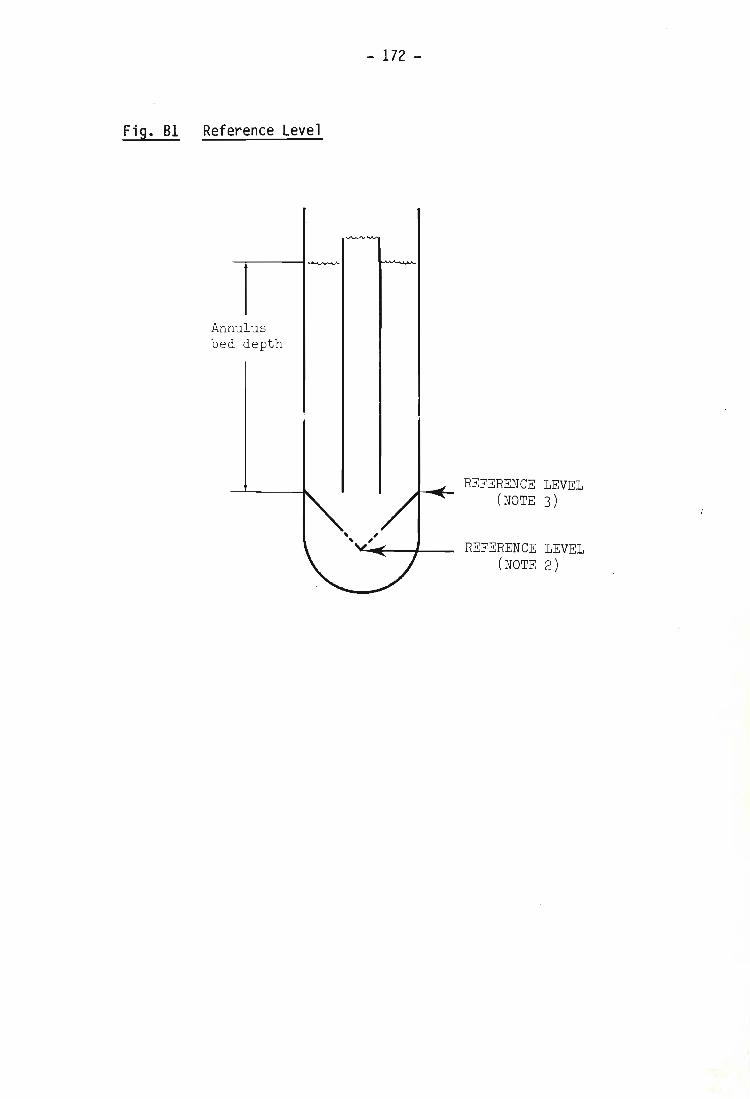
Fig. 81 Reference Level
Annulus bed depth
- 172 -
REFERENCE LEVEL (NOTE 3)
REFERENCE LEVEL (NOTE 2)
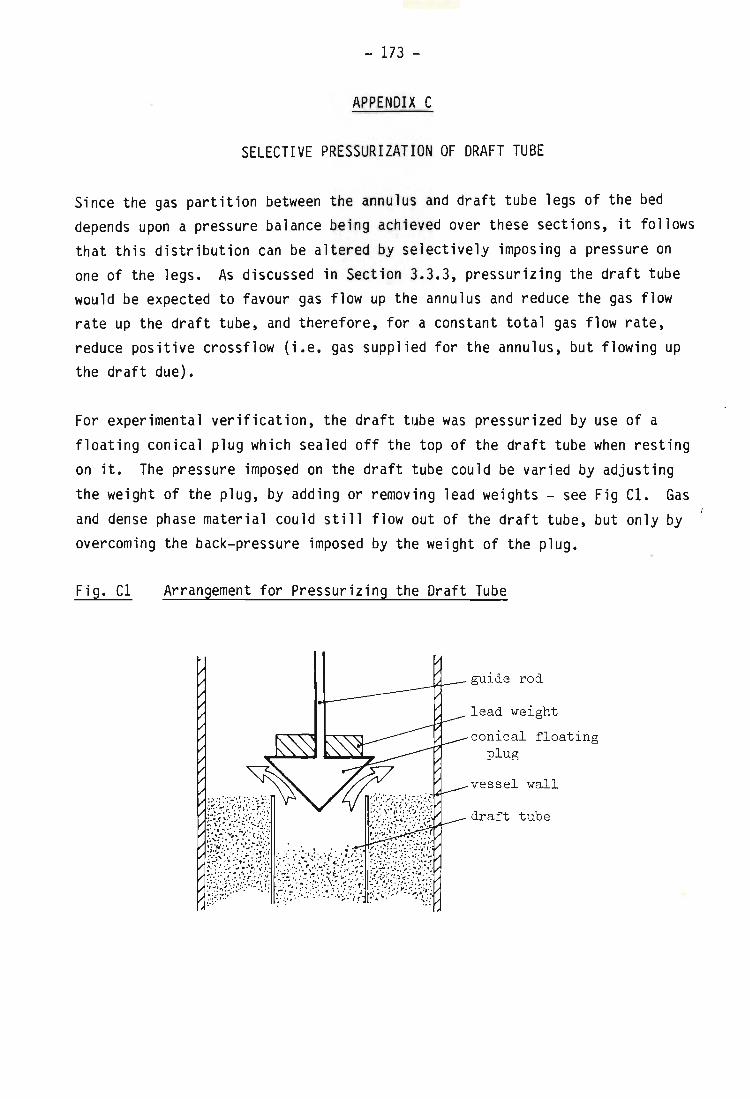
- 173 -
APPENDIX C
SELECTIVE PRESSURIZATION OF DRAFT TUBE
Since the gas partition between the annulus and draft tube legs of the bed depends upon a pressure balance being achieved over these sections, it follows that this distribution can be altered by selectively imposing a pressure on one of the legs. As discussed in Section 3.3.3, pressurizing the draft tube would be expected to favour gas flow up the annulus and reduce the gas flow rate up the draft tube, and therefore, for a constant total gas flow rate, reduce positive crossflow (i.e. gas supplied for the annulus, but flowing up the draft due).
For experimental verification, the draft tube was pressurized by use of a floating conical plug which sealed off the top of the draft tube when resting on it. The pressure imposed on the draft tube could be varied by adjusting the weight of the plug, by adding or removing lead weights - see Fig C1. Gas and dense phase material could still flow out of the draft tube, but only by overcoming the back-pressure imposed by the weight of the plug.
Fig. C1 Arrangement for Pressurizing the Draft Tube
guide rod
lead weight
conical f loating plug
vessel wall
draft tube
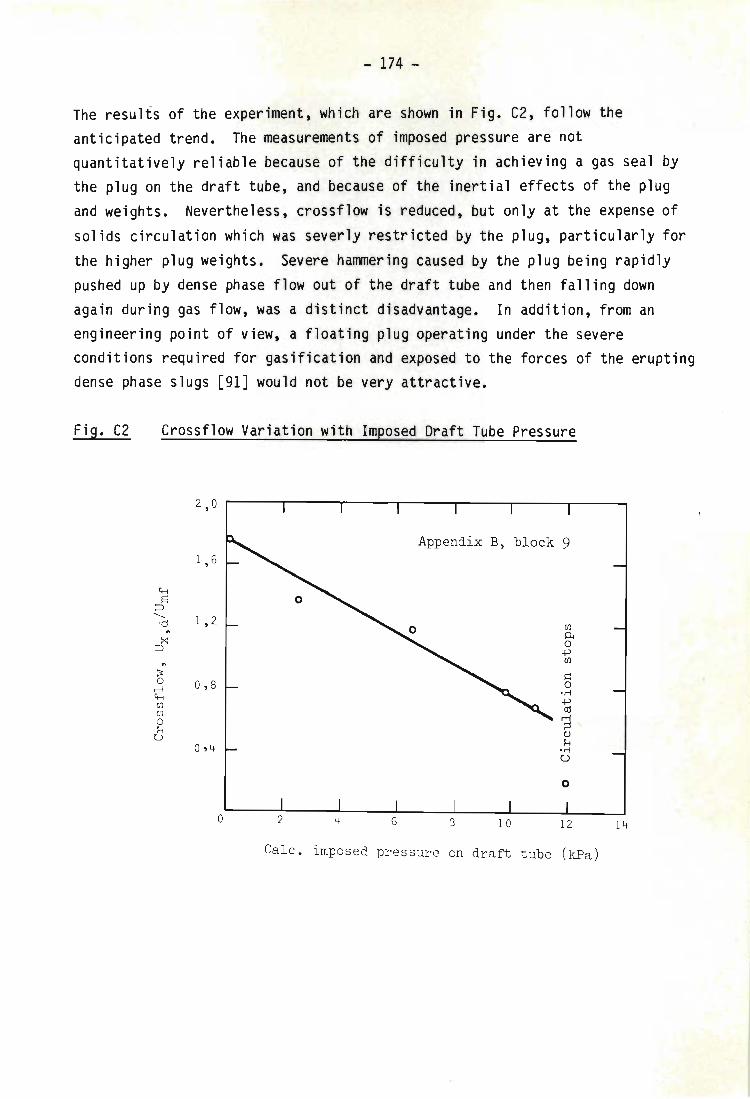
- 174 -
The results of the experiment, which are shown in Fig. C2, follow the anticipated trend. The measurements of imposed pressure are not quantitatively reliab le because of the difficulty in achieving a gas seal by the plug on the draft tube, and because of the inertial effects of the plug and weights. Nevertheless, crossflow is reduced, but only at the expense of solids circulation wh i ch was severly restricted by the plug, particularly for the higher plug weights. Severe hammering caused by the plug being rapidly pushed up by dense phase flow out of t he draft tube and then falling down again during gas flow , was a distinct disadvantage. In addition, from an engineering point of view, a floating plug operating under the severe conditions required for gasification and exposed to the forces of the erupting dense phase slugs [91 J would not be very attractive.
Fig. C2 Crossflow Variation with Imposed Draft Tube Pressure
2 , 0 ~----.-----~----,-----~----~----~----~
Appendi x B, block 9 1 , 6
1 , 2 Ul PI 0
+> Ul
J:: 0
'r-! 0 , 8
+> cd
3 ()
1-< 'r-! U
0
o 3 10 12 14
Calc . imposed pressure on draft tube (kPa)
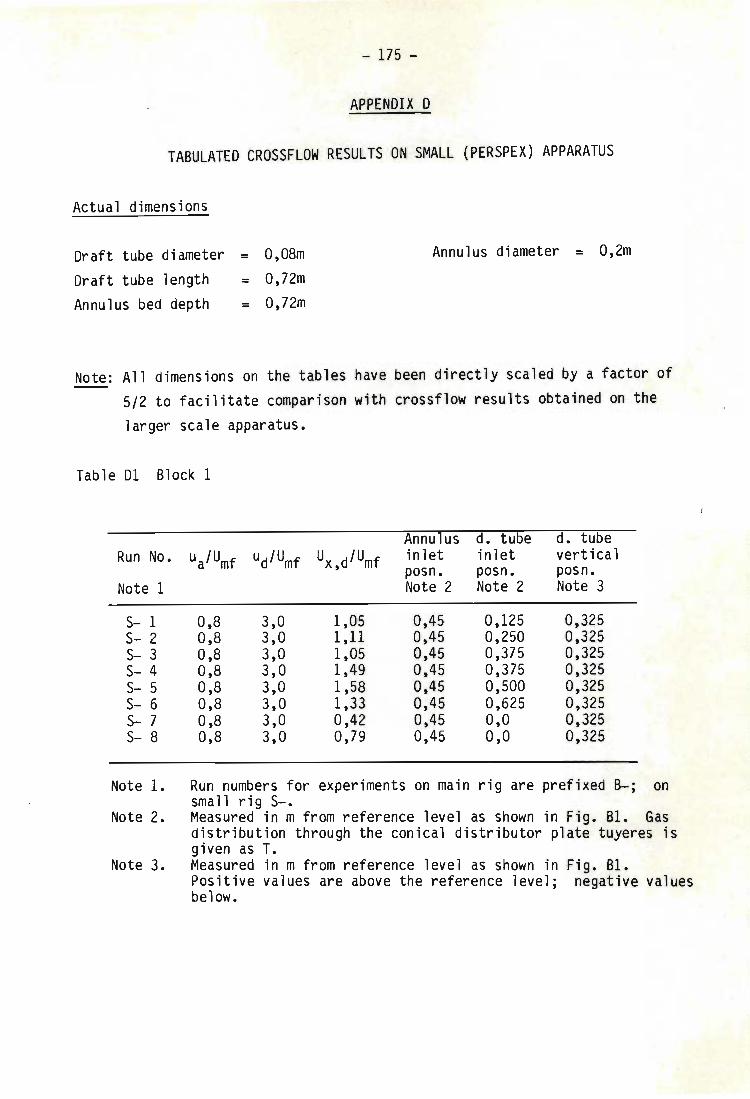
- 175 -
APPENDIX 0
TABULATED CROSSFLOW RESULTS ON SMALL (PERSPEX) APPARATUS
Actual dimensions
Draft tube diameter Draft tube length Annulus bed depth
= O,08m
= O,72m = 0,72m
Annulus diameter = O,2m
Note: All dimensions on the tables have been directly scaled by a factor of 5/2 to facilitate comparison with crossflow results obtained on the
larger scale apparatus.
Table 01 Block 1
Annulus d. tube d. tube Run No. ua/Umf ud/Umf Ux,d/Umf inlet inlet vertical
posn. posn. posn. Note 1 Note 2 Note 2 Note 3
S- 1 0,8 3,0 1,05 0,45 0,125 0,325 S- 2 0,8 3,0 1,11 0,45 0,250 0,325 S- 3 0,8 3,0 1,05 0,45 0,375 0,325 S- 4 0,8 3,0 1,49 0,45 0,375 0,325 S- 5 0,8 3,0 1,58 0,45 0,500 0,325 S- 6 0,8 3,0 1,33 0,45 0,625 0,325 S- 7 0,8 3,0 0,42 0,45 0,0 0,325 S- 8 0,8 3,0 0,79 0,45 0,0 0,325
Note 1. Run numbers for experiments on main rig are prefixed 8-. , on sma 11 rig S-.
Note 2. Measured in m from reference level as shown in Fig. B1. Gas distribution through the conical distributor plate tuyeres is given as T.
Note 3. Measured in m from reference level as shown in Fig. Bl. Positive values are above the reference level; negative values below.
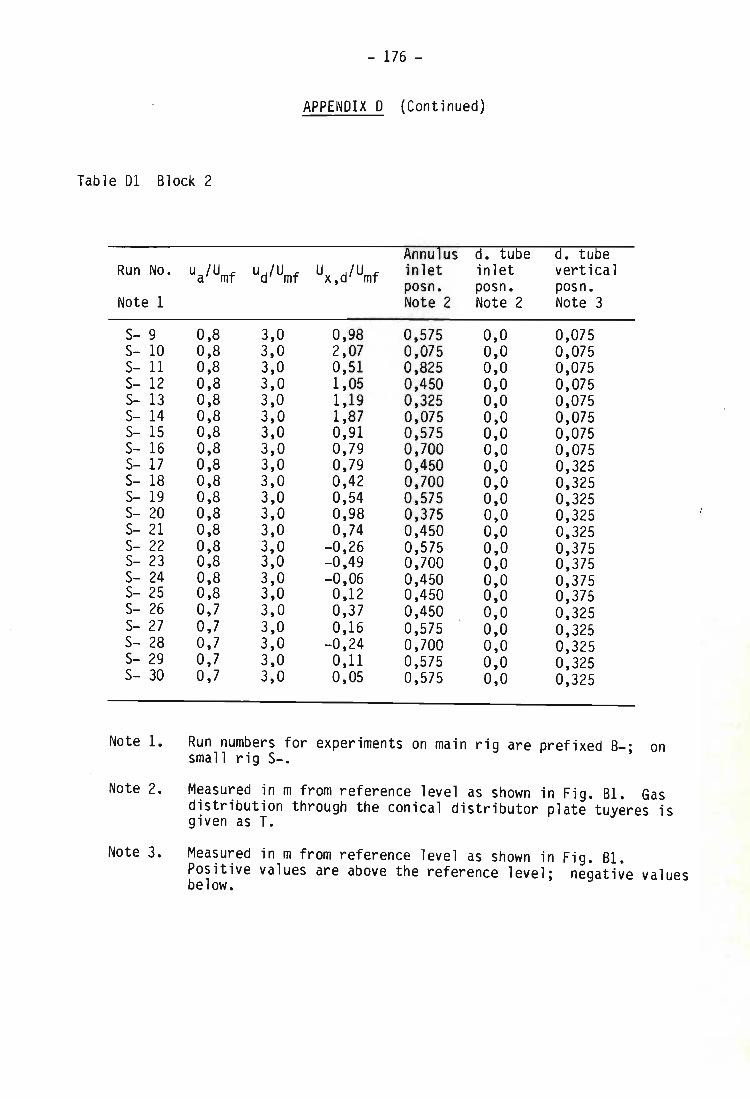
- 176 -
APPENDIX 0 (Continued)
Table 01 Block 2
Annulus d. tube d. tube Run No. ua,Umf ud,Umf Ux d,Umf inlet inlet vertical , posn. posn. posn. Note 1 Note 2 Note 2 Note 3
S- 9 0,8 3,0 0,98 0,575 0,0 0,075 s- 10 0,8 3,0 2,07 0,075 0,0 0,075 S- 11 0,8 3,0 0,51 0,825 0,0 0,075 S- 12 0,8 3,0 1,05 0,450 0,0 0,075 s- 13 0,8 3,0 1,19 0,325 0,0 0,075 S- 14 0,8 3,0 1,87 0,075 0,0 0,075 s- 15 0,8 3,0 0,91 0,575 0,0 0,075 s- 16 0,8 3,0 0,79 0,700 0,0 0,075 S- 17 0,8 3,0 0,79 0,450 0,0 0,325 s- 18 0,8 3,0 0,42 0,700 0,0 0,325 S- 19 0,8 3,0 0,54 0,575 0,0 0,325 S- 20 0,8 3,0 0,98 0,375 0,0 0,325 S- 21 0,8 3,0 0,74 0,450 0,0 0,325 S- 22 0,8 3,0 -0,26 0,575 0,0 0,375 S- 23 0,8 3,0 -0,49 0,700 0,0 0,375 S- 24 0,8 3,0 -0,06 0,450 0,0 0,375 S- 25 0,8 3,0 0,12 0,450 0,0 0,375 S- 26 0,7 3,0 0,37 0,450 0,0 0,325 S- 27 0,7 3,0 0,16 0,575 0,0 0,325 S- 28 0,7 3,0 -0,24 0,700 0,0 0,325 S- 29 0,7 3,0 0,11 0,575 0,0 0,325 S- 30 0,7 3,0 0,05 0,575 0,0 0,325
Note 1. Run numbers for experiments on main rig are prefixed 8-; on small r ig s-.
Note 2. Measured in m from reference level as shown in Fig. 81. Gas distribution through the conical distributor plate tuyeres is given as T.
Note 3. Measured in m from reference level as shown in Fig. 81. Positive values are above the reference level; negative values below.
. I
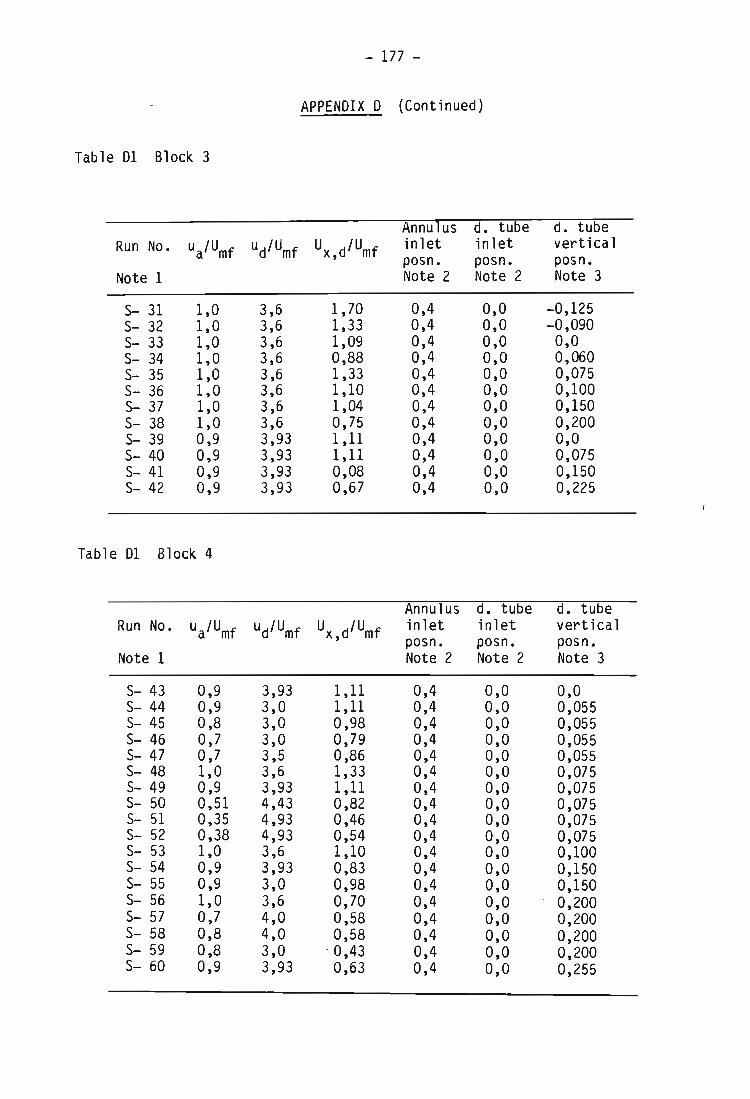
- 177 -
APPENDIX 0 (Continued)
Table 01 Block 3
Annulus d. tube d. tube Run No. ua'Umf ud,Umf Ux,d,Umf inlet inlet vertical
posn. posn. posn. Note 1 Note 2 Note 2 Note 3
S- 31 1,0 3,6 1,70 0,4 0,0 -0,125 $- 32 1,0 3,6 1,33 0,4 0,0 -0,090 $- 33 1,0 3,6 1,09 0,4 0,0 0,0 $- 34 1,0 3,6 0,88 0,4 0,0 0,060 $- 35 1,0 3,6 1,33 0,4 0,0 0,075 $- 36 1,0 3,6 1,10 0,4 0,0 0,100 $- 37 1,0 3,6 1,04 0,4 0,0 0,150 $- 38 1,0 3,6 0,75 0,4 0,0 0,200 $- 39 0,9 3,93 1,11 0,4 0,0 0,0 $- 40 0,9 3,93 1,11 0,4 0,0 0,075 $- 41 0,9 3,93 0,08 0,4 0,0 0,150 $- 42 0,9 3,93 0,67 0,4 0,0 0,225
Table 01 Block 4
Annulus d. tube d. tube Run No. ua,Umf ud,Umf Ux,d,Umf inlet inlet vertical
posn. posn. posn. Note 1 Note 2 Note 2 Note 3
$- 43 0,9 3,93 1,11 0,4 0,0 0,0 $- 44 0,9 3,0 1,11 0,4 0,0 0,055 $- 45 0,8 3,0 0,98 0,4 0,0 0,055 $- 46 0,7 3,0 0,79 0,4 0,0 0,055 $- 47 0,7 3,5 0,86 0,4 0,0 0,055 $- 48 1,0 3,6 1,33 0,4 0,0 0,075 S- 49 0,9 3,93 1,11 0,4 0,0 0,075 $- 50 0,51 4,43 0,82 0,4 0,0 0,075 s- 51 0,35 4,93 0,46 0,4 0,0 0,075 $- 52 0,38 4,93 0,54 0,4 0,0 0,075 $- 53 1,0 3,6 1,10 0,4 0,0 0,100 $- 54 0,9 3,93 0,83 0,4 0,0 0,150 $- 55 0,9 3,0 0,98 0,4 0,0 0,150 s- 56 1,0 3,6 0,70 0,4 0,0 0,200 $- 57 0,7 4,0 0,58 0,4 0,0 0,200 $- 58 0,8 4,0 0,58 0,4 0,0 0,200 $- 59 0,8 3,0 · 0,43 0,4 0,0 0,200 $- 60 0,9 3,93 0,63 0,4 0,0 0,255
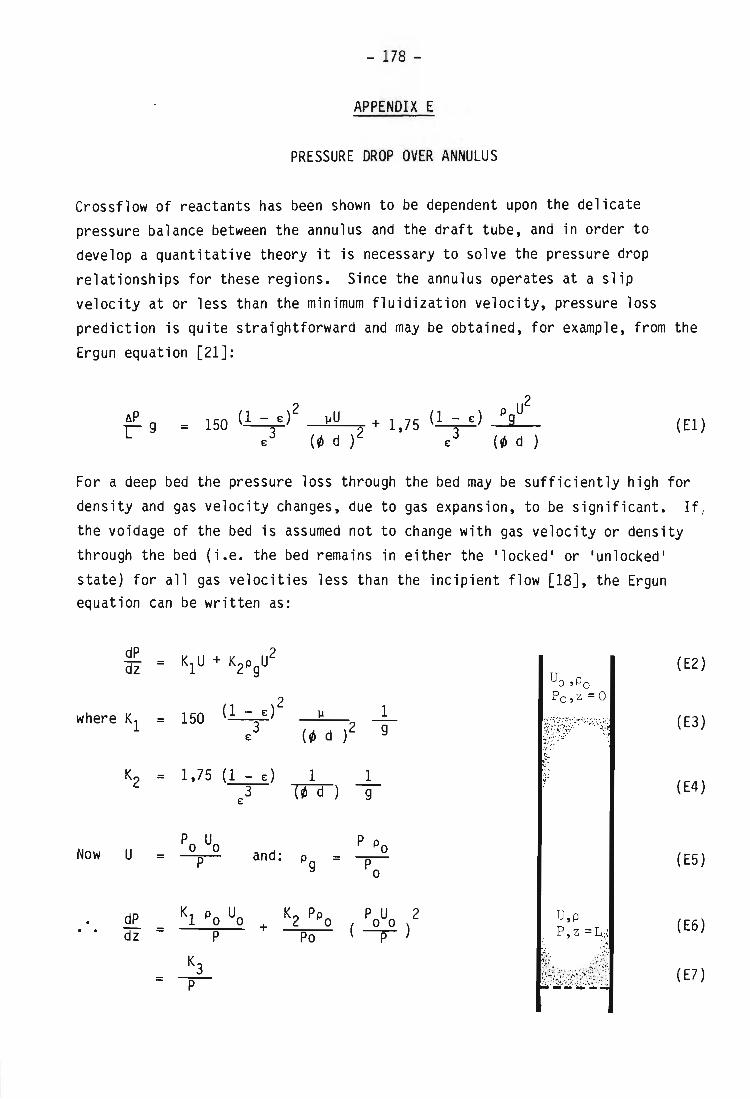
- 178 -
APPENDIX E
PRESSURE DROP OVER ANNULUS
Crossflow of reactants has been shown to be dependent upon the delicate pressure balance between the annulus and the draft tube, and in order to develop a quantitative theory it is necessary to solve the pressure drop relationships for these regions. Since the annulus operates at a slip velocity at or less than the minimum fluidization velocity, pressure loss prediction is quite straightforward and may be obtained, for example, from the
Ergun equation [21J:
~P g 2
150 (1 - £) = 3 £
2 ~U + 1 75 (1 - £) PgU
2 ' 3 (~ d ) £ (~ d ) (El)
For a deep bed the pressure loss through the bed may be sufficiently high for density and gas velocity changes, due to gas expansion, to be significant. If f the voidage of the bed is assumed not to change with gas velocity or density through the bed (i.e. the bed remains in either the 'locked ' or 'unlocked ' state) for all gas velocities less than the incipient flow [18J, the Ergun equation can be written as:
dP 2 dz = K1U + K2PgU (E2)
2 1 where Kl 150 (1 - £) ~ = 3 )2 £ (~ d g ?:;J~~;;:'~':' :;'; ':'~r (E3)
:". , ~;
K2 = 1,75 (1 £) 1 1 3 (~ d g £
(E4)
Now U Po Uo and:
P Po = P Pg = ~
(E5)
dP Kl Po Uo + K2 PPo PoUo 2
dz = P Po (-p ) U, p P , z =L.:,;
: .. , (E6)
K3 = -p-
,;, . .~.~: ,:!:: .:~ .: .....
!J~bfitj~::;T ( E7)
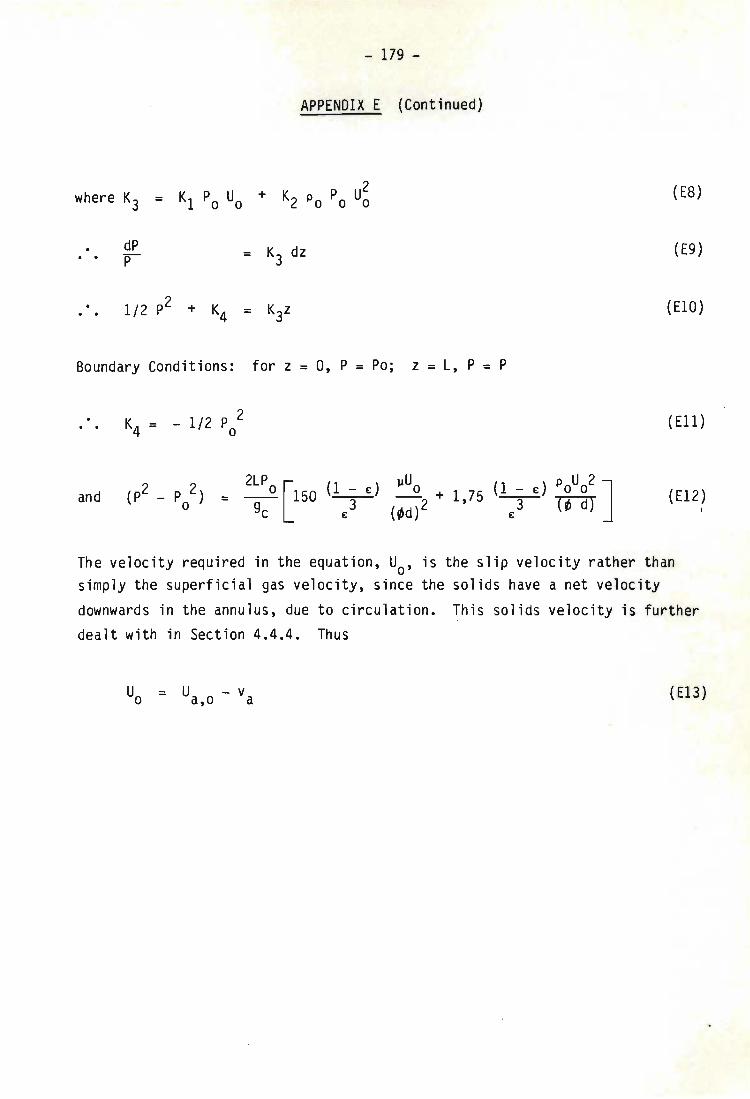
where K3
dP P
- 179 -
APPENDIX E (Continued)
Boundary Conditions: for z = 0, P = Po; z = L, P = P
and
(E8)
(E9)
(£10)
(£12) I
The velocity required in the equation, Uo' is the slip velocity rather than simply the superficial gas velocity, since the solids have a net velocity downwards in the annulus, due to circulation. This solids velocity is further dealt with in Section 4.4.4. Thus
( El3)

- 180 -
APPENDIX F
SLUG RISE VELOCITY IN CONTINUOUSLY BUBBLING BEDS
The result given by equation (12) for the absolute slug rise velocity is the same as that obtained by Nicklin's argument [78, 26J, but using a different
logic.
Attempts to verify this result experimentally are usually correlated by an
equation of the form:
(F1)
where the factor k for gas slugs rising through liquids is generally taken
as [78J
k = 1,2 (F2)
For fluidized beds there is some uncertainty about this factor, which is usually found to be unity for slugs of stable size far from the gas
distributor [92J, but has higher values just above the distributor [26J, and in fine particle systems [93J. The physical origin of the factor has variously been ascribed to the non-uniform velocity profile in the tube [78J, slug coalescence [26J or a combination of these factors [39J.
The derivation of equation (13), used here, may be extended to provide some insight into the meaning of this factor.
If the slugs do not occupy the whole cross section of the tube then, with reference to Fig. F1, it is apparent that the average bubble fractions for the areas marked A1 and A2 (Fig. F1) are respectively:
from equation (13) (F3)
= 0 (F4)
. . .
From continuity
=
- 181 -
APPENDIX F (Continued)
Substituting into equation (F6)
From which
(F5)
(F6)
(F7)
(F8)
(F9)
Equation (FlO) shows that the factor k arises from the cross-sectional area of the tube occupied by the slug. The other reasons, given above, are important, but only insofar as they affect the area ratio. For example, the rounded shape of the slug nose reduces the average cross-section occupied by the bubble, particularly for short slug lengths. On this basis short slugs may be expected to have higher velocities than very long slugs (for which the end effect of the nose shape is unimportant). In the same way, coalescence would affect the slug length and small, short slugs, found close to the gas injection point, would be expected to have higher absolute rise velocities than large, long slugs resulting from coalescence, higher up in the bed.
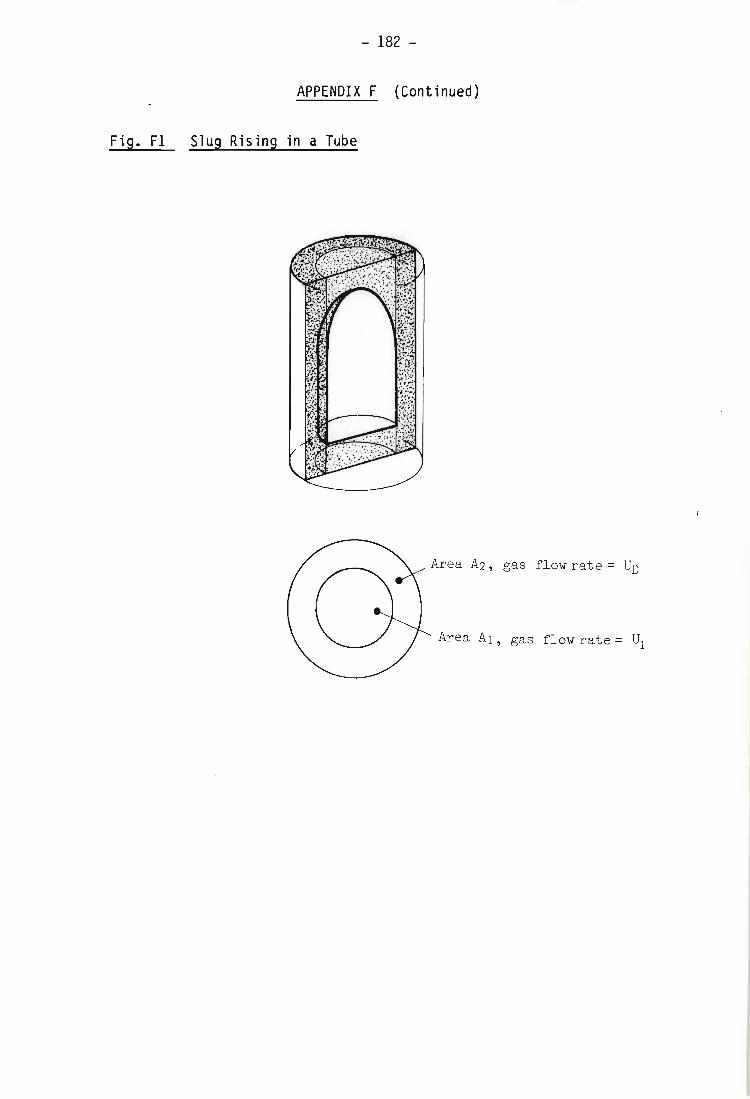
- 182 -
APPENDIX F (Continued)
Fig. Fl Slug Rising in a Tube
Area A2 , gas flow rate = UD
Area AI , gas f l ow rate = 01
- 183 -
APPENDIX G
LEAD SHIELDING FOR CIRCULATION MONITOR
The lead shields which define the viewing windows are detailed in Figures G1 and G2. The requirements for the shielding design were that the edges of the window should be sharply defined and as near parallel through the width of the bed as possible; that there should be no ambiguity whether the radioactive source was inside the window or not; and that the whole window assembly could be moved up or down to view different parts of the bed.
There is a degree of conflict between these requirements since, for the first the detector should ideally be far away from the bed, while for the second it should be close, but with good sh ielding. The compromise shown in the figures was found empirically, and required some 70 mm of lead shielding to provide the necessary discrimination between the presence or absence of the pill in the window. The two extreme cases are when the pill is inside the window but on the far side of the bed (so that the signal is diminished by the distance from the detector and attenuated by the bed material, and when the pill is on the near side of the bed, but just outside the window.
Separate shields around the detector itself and near the bed to define the window, were used in order to reduce the weight of lead in the assembly.
See also Fig. 33 in Section 4.4.3.
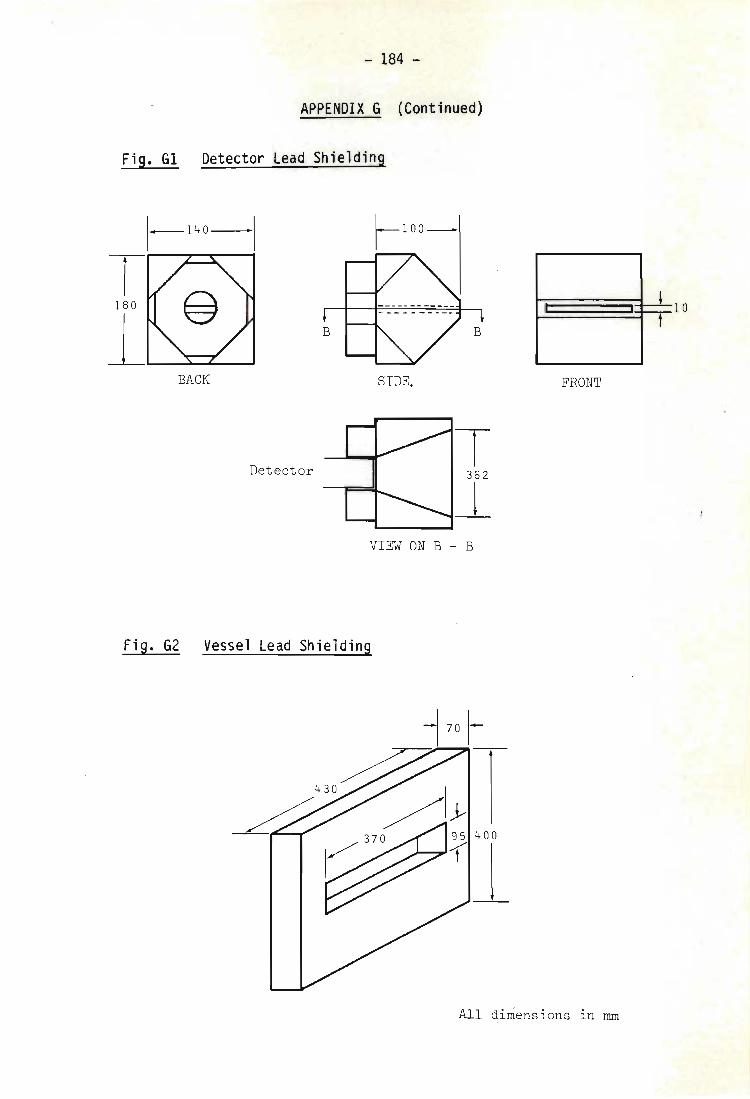
- 184 -
APPENDIX G (Continued)
Fig. G1 Detector Lead Shielding
\_140 -\
1 10
BACK SIDE. FRONT
Detector
VIEW ON B - B
Fig. G2 Vessel Lead Shielding
All dimensions In rom
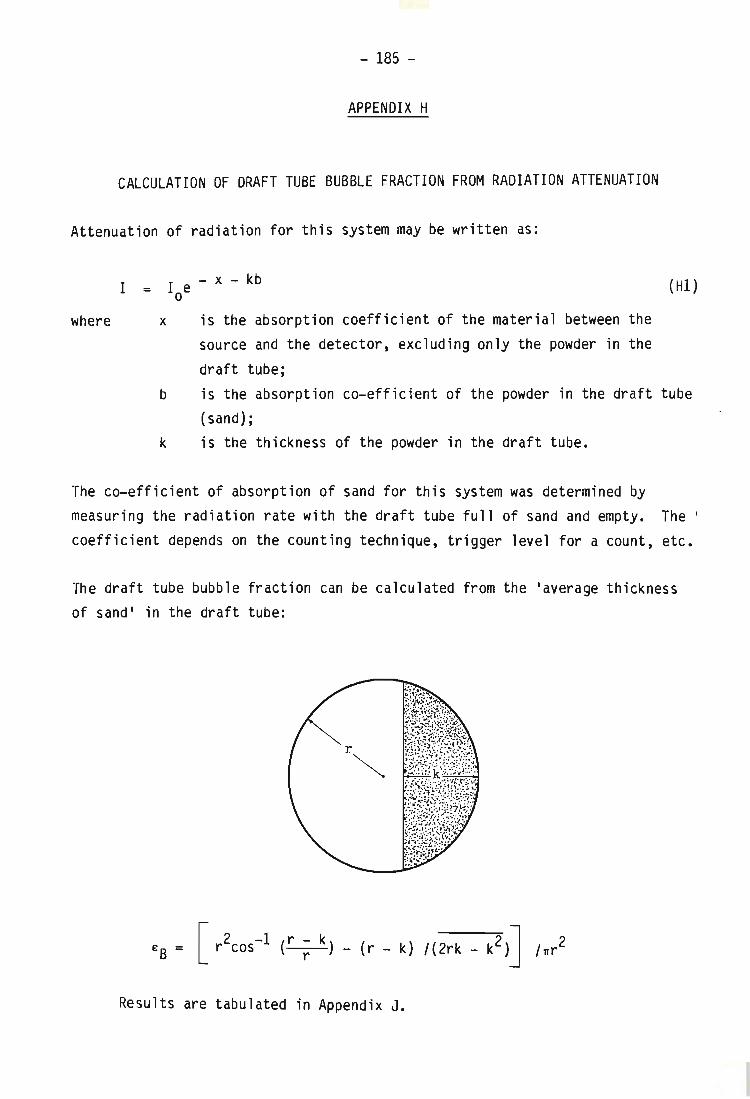
- 185 -
APPENDIX H
CALCULATION OF DRAFT TUBE BUBBLE FRACTION FROM RADIATION ATTENUATION
Attenuation of radiation for this system may be written as:
where
I = I e - x - kb o
x is the absorption coefficient of the material between the source and the detector, excluding only the powder in the draft tube;
(HI)
b is the absorption co-effic ient of the powder in the draft tube (sand);
k is the thickness of the powder in the draft tube.
The co-efficient of absorption of sand for this system was determined by measuring the radiation rate with the draft tube full of sand and empty. The I
coefficient depends on the counting technique, trigger level for a count, etc.
The draft tube bubble fraction can be calculated from the laverage thickness of sandi in the draft tube:
[ 2 -1 (r - k 2 ] 2 £B = r cos r) - (r - k) 1{2rk - k) Inr
Results are tabulated in Appendix J.
- 186 -
APPENDIX I
DENSE PHASE CIRCULATION RATES
The solids circulation rate was measured using the system described in Section 4.4.2. The two windows were placed 850mm apart and the dense phase velocity calculated from the t ime taken for the radio-active source to move from one window to the other. An electronic decoding system allowed the position of the pill (that is, above window A, in window A, between windows A and B, in window B or below window B) to be determined, as well as the direction of motion [11, 47]. An average of a number of such measurements, as shown in the tables below, was used as the dense phase velocity.
Slug frequencies were obtained by measuring the time taken for 20 slugs to erupt at the top of the draft tube, counted visually. The frequency given is the average of three such counts.
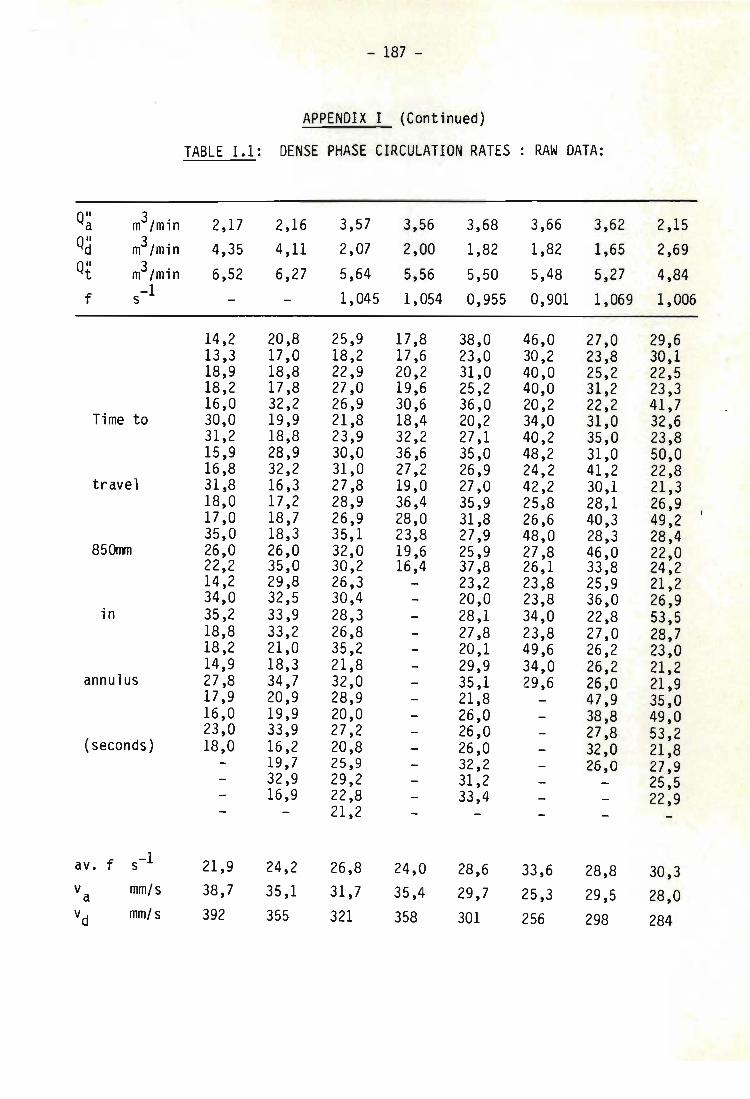
- lS7 -
APPENDIX I (Continued)
TABLE 1.1: DENSE PHASE CIRCULATION RATES RAW DATA:
Q" a m3/min 2,17 2,16 3,57 3,56 3,6S 3,66 3,62 2,15 Qd m3/min 4,35 4,11 2,07 2,00 1,S2 1,S2 1,65 2,69 Qt m3/min 6,52 6,27 5,64 5,56 5,50 5,4S 5,27 4,S4
f s -1 1,045 1,054 0,955 0,901 1,069 1,006
14,2 20,S 25,9 17,S 3S,0 46,0 27,0 29,6 13,3 17,0 lS,2 17,6 23,0 30,2 23,S 30,1 lS,9 IS,S 22,9 20,2 31,0 40,0 25,2 22,5 lS,2 17,S 27,0 19,6 25,2 40,0 31,2 23,3 16,0 32,2 26,9 30,6 36,0 20,2 22,2 41,7
Time to 30,0 19,9 21,S lS,4 20,2 34,0 31,0 32,6 31,2 IS,S 23,9 32,2 27,1 40,2 35,0 23,S 15,9 2S,9 · 30,0 36,6 35,0 4S,2 31,0 50,0 16,S 32,2 31,0 27,2 26,9 24,2 41,2 22,S
travel 31,S 16,3 27,S 19,0 27,0 42,2 30,1 21,3 lS,O 17,2 2S,9 36,4 35,9 25,S 2S,1 26,9 17 ,0 lS,7 26,9 2S,0 31,S 26,6 40,3 49,2 35,0 lS,3 35,1 23,S 27,9 4S,0 2S,3 2S,4
S5()rrn 26,0 26,0 32,0 19,6 25,9 27,S 46,0 22,0 22,2 35,0 30,2 16,4 37,S 26,1 33,S 24,2 14,2 29,S 26,3 23,2 23,S 25,9 21,2 34,0 32,5 30,4 20,0 23,S 36,0 26,9
in 35,2 33,9 2S,3 2S,1 34,0 22,S 53,5 IS,S 33,2 26,S 27,S 23,S 27,0 28,7 lS,2 21,0 35,2 20,1 49,6 26,2 23,0 14,9 18,3 21,S 29,9 34,0 26,2 21,2
annulus 27,S 34,7 32,0 35,1 29,6 26,0 21,9 17,9 20,9 2S,9 21,S 47,9 35,0 16,0 19,9 20,0 26,0 38,S 49,0 23,0 33,9 27,2 26,0 27,S 53,2
(seconds) lS,O 16,2 20,S 26,0 32,0 21,S 19,7 25,9 32,2 26,0 27,9 32,9 29,2 31,2 25,5 16,9 22,S 33,4 22,9
21,2
avo f -1 21,9 24,2 26,S 24,0 2S,6 33,6 28,S s 30,3 va mm/s 3S,7 35,1 31,7 35,4 29,7 25,3 29,5 2S,0 vd mm/s 392 355 321 35S 301 256 29S 2S4
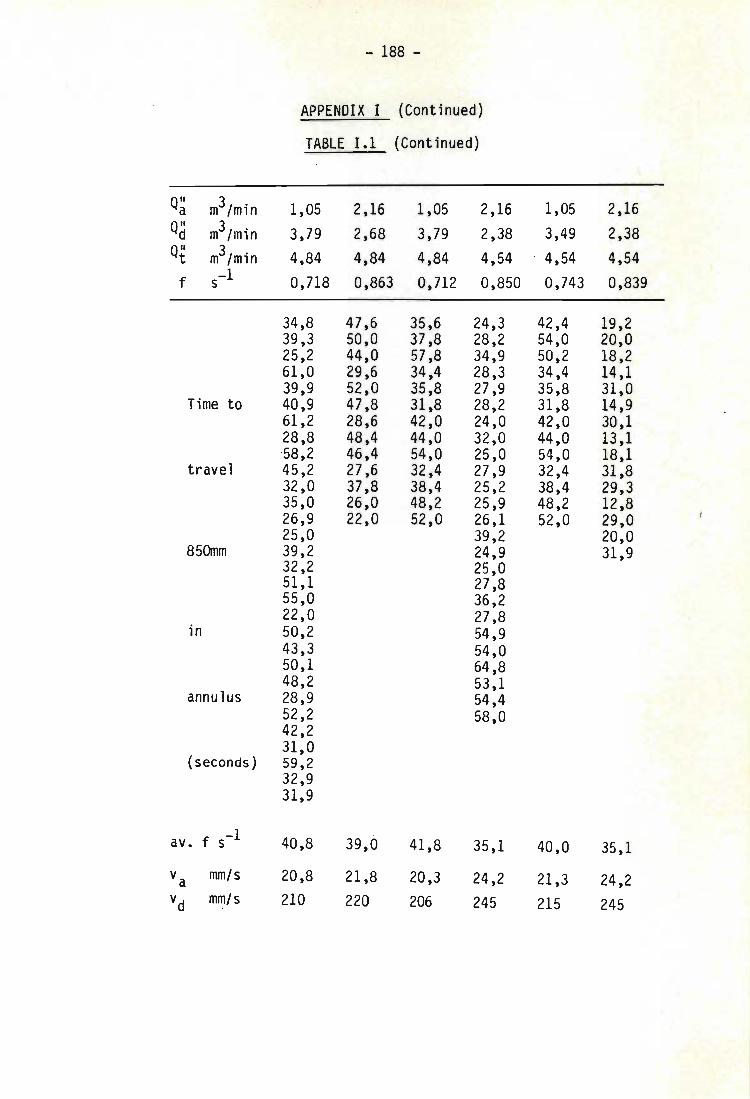
Q" a m3/min Qd m3/min Q" t m3/min
f s -1
Time to
travel
850mm
in
annulus
(seconds)
avo f s-l
va mm/s
vd mm/s
- 188 -
APPENDIX I (Continued)
TABLE 1.1 (Continued)
1,05 2,16 1,05 2,16 3,79 2,68 3,79 2,38 4,84 4,84 4,84 4,54 0,718 0,863 0,712 0,850
34,8 47,6 35,6 24,3 39,3 50,0 37,8 28,2 25,2 44,0 57,8 34,9 61,0 29,6 34,4 28,3 39,9 52,0 35,8 27,9 40,9 47,8 31,8 28,2 61,2 28,6 42,0 24,0 28,8 48,4 44,0 32,0 -58,2 46,4 54,0 25,0 45,2 27,6 32,4 27,9 32,0 37,8 38,4 25,2 35,0 26,0 48,2 25,9 26,9 22,0 52,0 26,1 25,0 39,2 39,2 24,9 32,2 25,0 51,1 27,8 55,0 36,2 22,0 27,8 50,2 54,9 43,3 54,0 50,1 64,8 48,2 53,1 28,9 54,4 52,2 58,0 42,2 31,0 59,2 32,9 31,9
40,8 39,0 41,8 35,1
20,8 21,8 20,3 24,2 210 220 206 245
1,05 2,16 3,49 2,38 4,54 4,54
0,743 0,839
42,4 19,2 54,0 20,0 50,2 18,2 34,4 14,1 35,8 31,0 31,8 14,9 42,0 30,1 44,0 13,1 54,0 18,1 32,4 31,8 38,4 29,3 48,2 12,8 52,0 29,0
20,0 31,9
40,0 35,1
21,3 24,2 215 245

- 189 -
APPENDIX I (Continued)
TABLE 1.1 (Continued)
Q" a m3/m i n 1,05 1,35 1,05 1,05 1,36 1,35 Qd m3/m in 3,48 2,75 2,50 2,17 1,72 1,70 QII t m3/m in 4,54 4.10 3,55 3,22 3,08 3,05 f s -1 0,792 0,749 0,749 0,700 0,612 0,529
49,5 44,4 68,4 87,2 290 111,6 58,2 67,6 56,0 72,0 184 118,2 36,2 36,4 68,4 72,8 374 176,0 53,0 38,4 96,4 60,0 169 364,0 29,2 68,4 79,8 64,0 328 180,4
Time to 47,0 38,0 49,8 80,8 330 100,4 48,8 40,4 48,4 84,0 329 156,0 55,0 73,8 49,8 64,0 376 312,0 55,9 61,8 74,0 68,8 162 119,8
travel 31,2 58,0 50,4 61,2 124,6 38,9 44,4 50,4 80,9 185,8 58,0 40,4 64,4 62,0 114,4 40,0 40,0 94,4 81,8 122,0 43,9 35,81 102,6 131,8
850mm 37,0 52,4 71,8 31,8 34,0 58,0 36,9 41,8 100,2 48,8 35,8 58 39,2 36,0 49,8
in 64,0 28,0 52,0 42,1 48,0 66,0 58,9 70,0 56,4 49,0 68,0 105,6
annulus 56,1 52,4 56,0 40,0 52,4 96,4 46,0 52,0 59,9 32,0
(seconds) 56,9 40,0 62,1 31,8 60,4
avo f s-l 47,8 47,0 69,6 72,3 282 165,6 v mm/s 17,8 18,1 12,2 11 ,8 3,0 5,1 a
vd mm/s 180 183 123 119 31 52
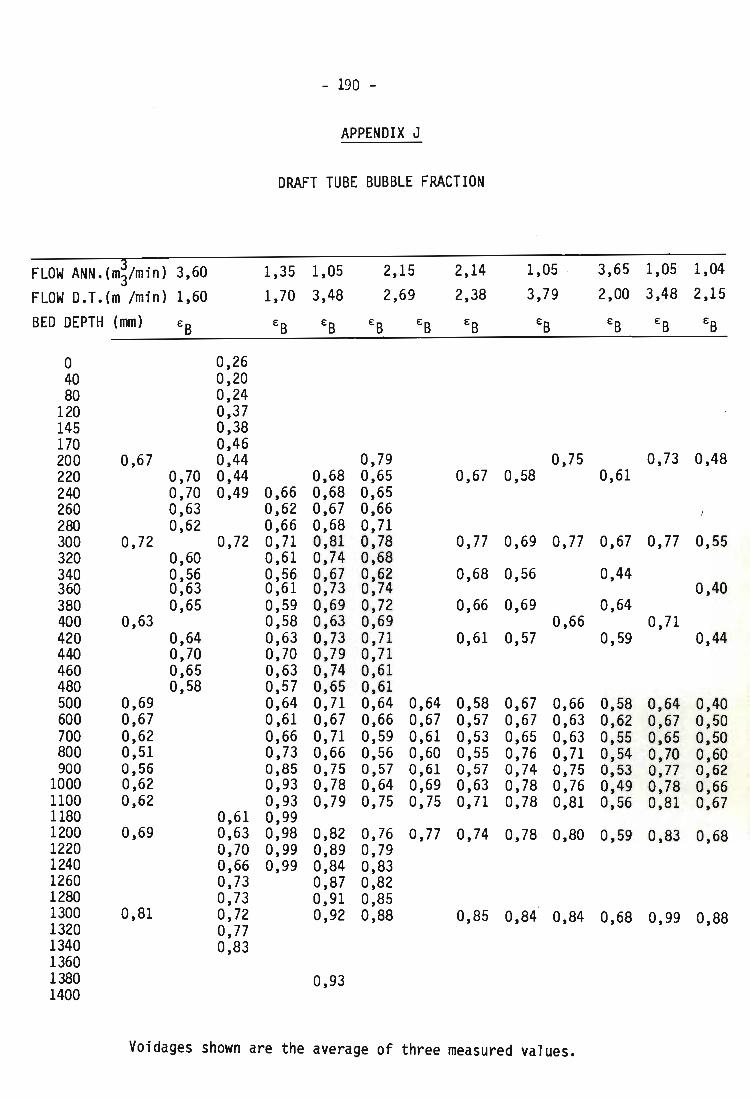
- 190 -
APPENDIX J
DRAFT TUBE BUBBLE FRACTION
FLOW ANN.(m~/min) 3,60 1,35 1,05 2,15 2,14 1,05 . 3,65 1,05 1,04
FLOW D.T.(m Imin) 1,60 1,70 3,48 2,69 2,38 3,79 2,00 3,48 2,15
BED DEPTH (nun) €B €B €B €B €B €B €B €B €B €B
° 0,26 40 0,20 80 0,24
120 0,37 145 0,38 170 0,46 200 0,67 0,44 0,79 0,75 0,73 0,48 220 0,70 0,44 0,68 0,65 0,67 0,58 0,61 240 0,70 0,49 0,66 0,68 0,65 260 0,63 0,62 0,67 0,66 280 0,62 0,66 0,68 0,71 300 0,72 0,72 0,71 0,81 0,78 0,77 0,69 0,77 0,67 0,77 0,55 320 0,60 0,61 0,74 0,68 340 0,56 0,56 0,67 0,62 0,68 0,56 0,44 360 0,63 0,61 0,73 0,74 0,40 380 0,65 0,59 0,69 0,72 0,66 0,69 0,64 400 0,63 0,58 0,63 0,69 0,66 0,71 420 0,64 0,63 0,73 0,71 0,61 0,57 0,59 0,44 440 0,70 0,70 0,79 0,71 460 0,65 0,63 0,74 0,61 480 0,58 0,57 0,65 0,61 500 0,69 0,64 0,71 0,64 0,64 0,58 0,67 0,66 0,58 0,64 0,40 600 0,67 0,61 0,67 0,66 0,67 0,57 0,67 0,63 0,62 0,67 0,50 700 0,62 0,66 0,71 0,59 0,61 0,53 0,65 0,63 0,55 0,65 0,50 800 0,51 0,73 0,66 0,56 0,60 0,55 0,76 0,71 0,54 0,70 0,60 900 0,56 0,85 0,75 0,57 0,61 0,57 0,74 0,75 0,53 0,77 0,62
1000 0,62 0,93 0,78 0,64 0,69 0,63 0,78 0,76 0,49 0,78 0,66 1100 0,62 0,93 0,79 0,75 0,75 0,71 0,78 0,81 0,56 0,81 0,67 1180 0,61 0,99 1200 0,69 0,63 0,98 0,82 0,76 0,77 0,74 0,78 0,80 0,59 0,83 0,68 1220 0,70 0,99 0,89 0,79 1240 0,66 0,99 0,84 0,83 1260 0,73 0,87 0,82 1280 0,73 0,91 0,85 1300 0,81 0,72 0,92 0,88 0,85 0,84 0,84 0,68 0,99 0,88 1320 0,77 1340 0,83 1360 1380 0,93 1400
Voidages shown are the average of three measured values.
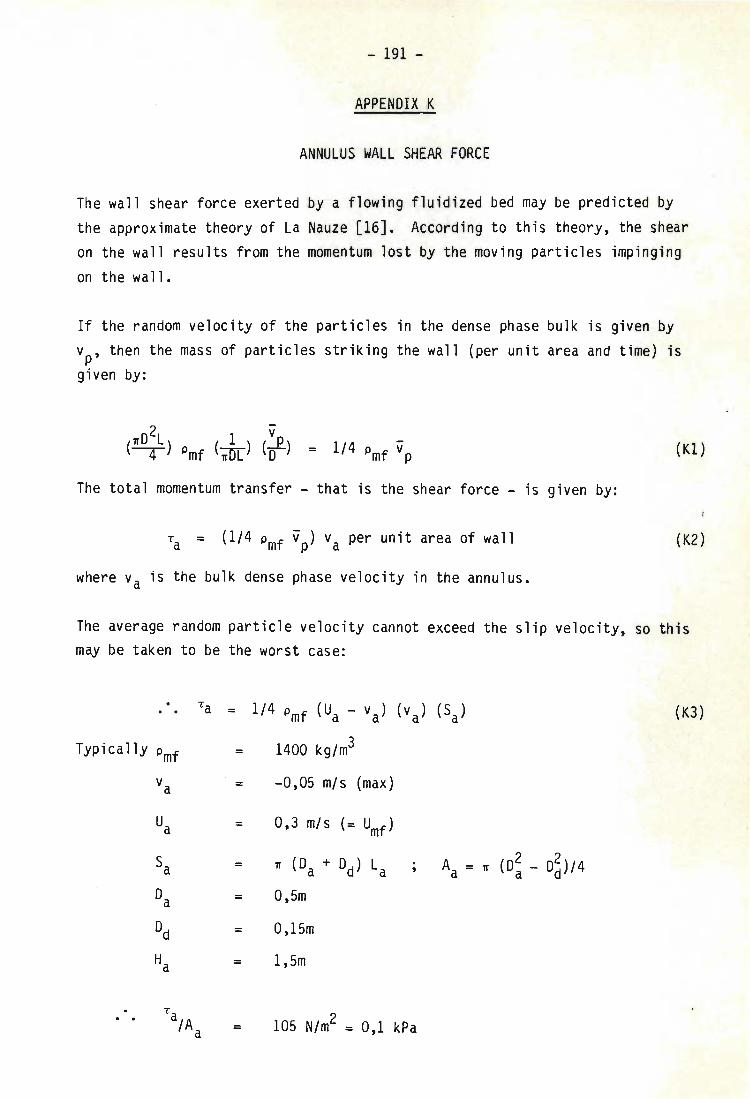
- 191 -
APPENDIX K
ANNULUS WALL SHEAR FORCE
The wall shear force exerted by a flowing fluidized bed may be predicted by the approximate theory of La Nauze [16J. According to this theory, the shear on the wall results from the momentum lost by the moving particles impinging on the wall.
If the random velocity of the particles in the dense phase bulk is given by vp' then the mass of particles striking the wall (per unit area and time) is given by:
The total momentum transfer - that is the shear force - is given by:
Ta = (1/4 Pmf vp) va per unit area of wall
where va is the bulk dense phase velocity in the annulus.
(K1)
(K2)
The average random particle velocity cannot exceed the slip velocity, so this may be taken to be the worst case:
Ta = 1/4 Pmf (Ua - va) (va) (Sa) (K3)
Typically Pmf = 1400 kg/m3
va = -O,OS m/s (max)
Ua = 0,3 m/s (= Umf )
Sa = 1r (Da + Dd) La 2 2 Aa = 1r (Da - Dd)/4
Da = O,Sm
Dd = O,lSm
Ha = 1,Sm
. T lOS N/m2 = 0,1 kPa
. . a/A = a
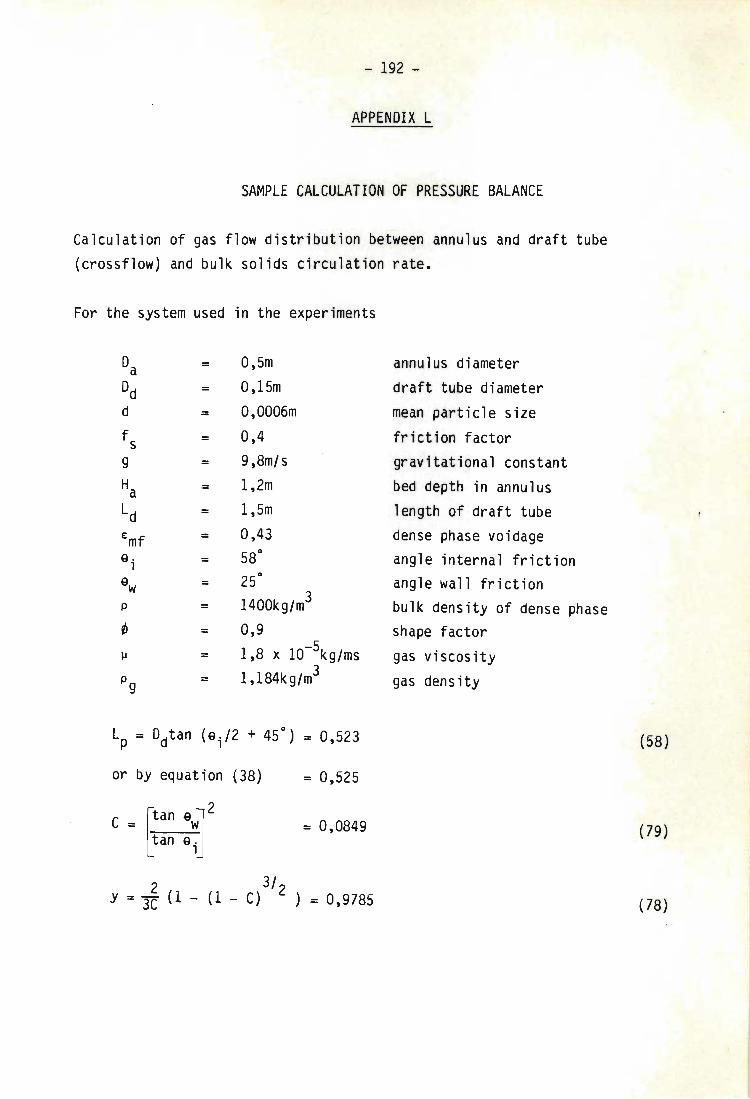
- 192 -
APPENDIX L
SAMPLE CALCULATION OF PRESSURE BALANCE
Calculation of gas flow distribution between annulus and draft tube (crossflow) and bulk solids circulation rate.
For the system used in the experiments
Da = 0,5m annulus diameter
Dd = 0,15m draft tube diameter d = 0,0006m mean particle size f = 0,4 friction factor s g = 9,8m/s gravitational constant
Ha = 1,2m bed depth in annulus
Ld = 1,5m length of draft tube
Emf = 0,43 dense phase voidage 9·
1 = 58° angle internal friction 9w = 25° angle wall friction
" = 1400kg/m3 bulk density of dense phase
rfJ = 0,9 shape factor -5
\.I = 1,8 x 10 kg/ms gas viscos ity
"g = 1 ,184kg/m3 gas density
or by equation (38) = 0,525
= 0,0849
2 3/2 y = 3C (1 - (1 - C) ) = 0,9785
(58)
(79)
(78)
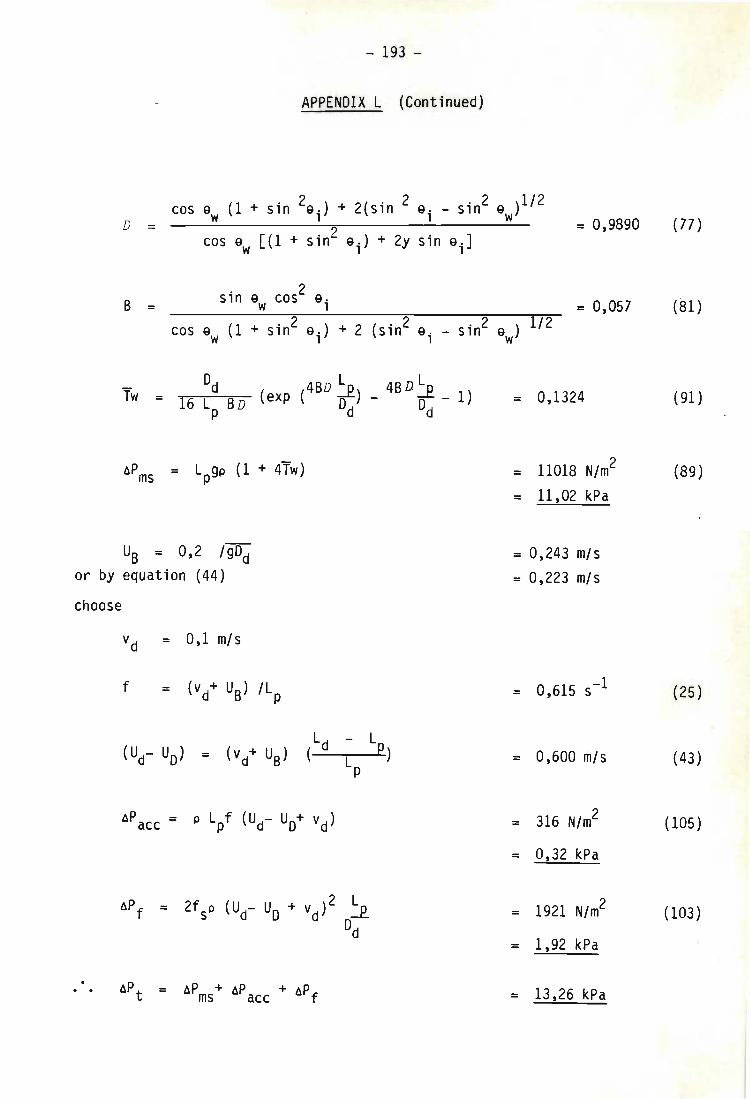
- 193 -
APPENDIX L (Continued)
D =
cos 9w (1 + sin 29 i ) + 2(sin 2 9i
- sin2 9w)1/2 = 0,9890
cos 9w [(1 + sin2 9i ) + 2y sin 9iJ
B =
Dd L D L -Tw (( 4BD .=.e.) 4B ~ 1) = 1 exp 0 - 0-6 Lp B D d d
UB = 0,2 /gDd or by equation (44)
choose
Vd = 0,1 m/s
f
= 0,057
= 0,1324
= 11018 N/m2
= 11 ,02 kPa
= 0,243 m/s = 0,223 m/s
= 0,615 s-l
= 0,600 m/s
= 316 N/m2
= 0,32 kPa
= 1921 N/m2
= 1,92 kPa
= 13,26 kPa
(77)
(81)
(91)
(89 )
(25)
(43)
(105)
(103)
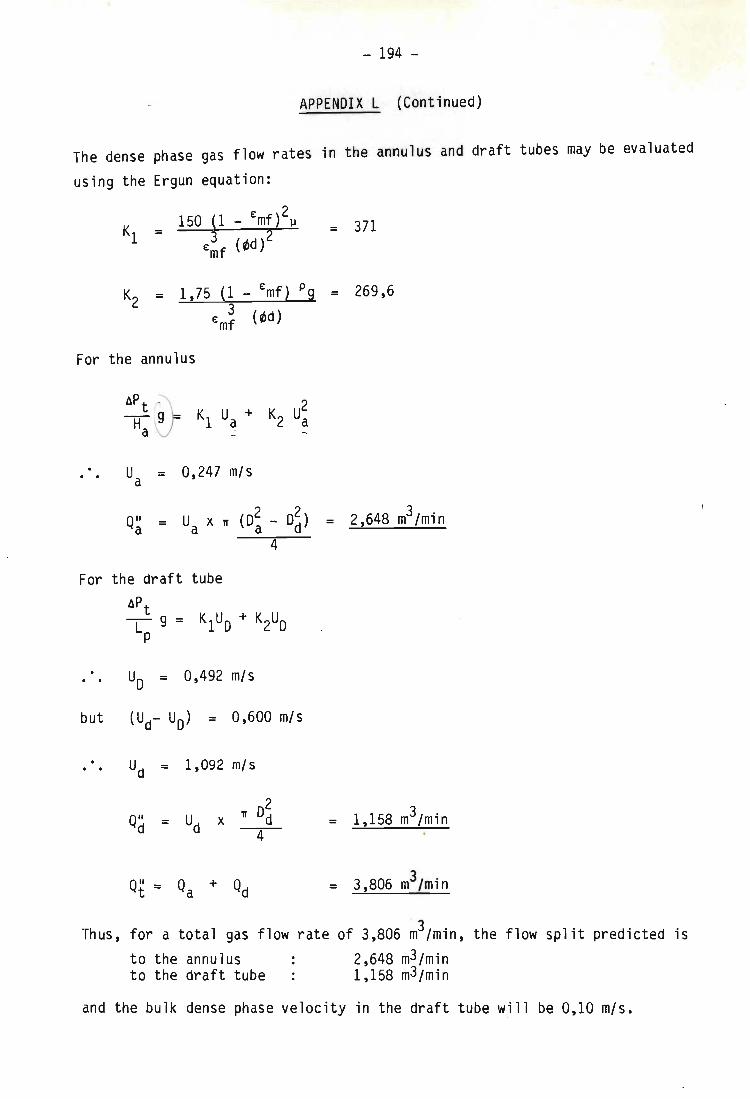
- 194 -
APPENDIX L (Continued)
The dense phase gas flow rates in the annulus and draft tubes may be evaluated
using the Ergun equation:
= 371
K2 = 1,75 (1 - €mf) Pg = 269,6
€m~ (~d)
For the annulus
••• Ua = 0,247 m/s
Q~ = Ua x n (D~ - D~) = 2,648 m3/min 4
For the draft tube lIP t --L-- g = K1UD + K2UD
P
•.• Uo = 0,492 m/s
1,092 m/s
2 Q" = U
d x n 0d
d 4
Thus, for a total gas flow rate of 3,806 m3/min, the flow split predicted is to the annulus 2,648 m3/min to the draft tube 1,158 m3/min
and the bulk dense phase velocity in the draft tube will be 0,10 m/s.
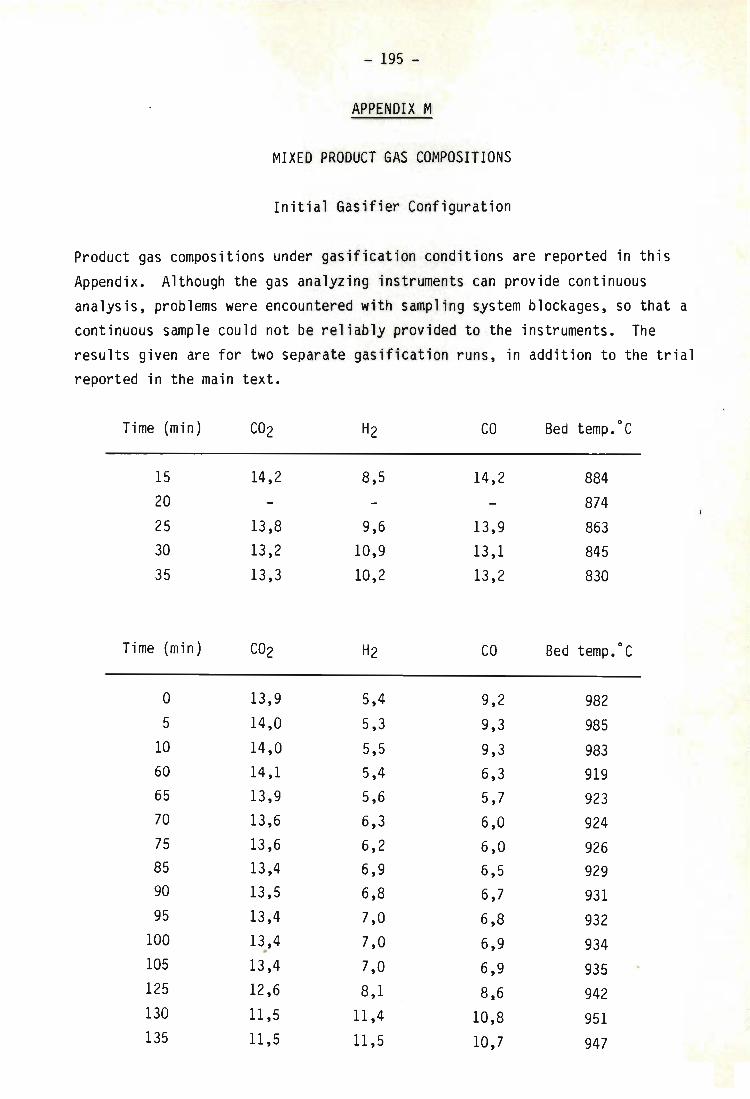
- 195 -
APPENDIX M
MIXED PRODUCT GAS COMPOSITIONS
Initial Gasifier Configuration
Product gas compositions under gasification conditions are reported in this
Appendix. Although the gas analyzing instruments can provide continuous analysis, problems were encountered with sampling system blockages, so that a continuous sample cou ld not be reliably provided to the instruments. The results given are for two separate gasification runs, in addition to the trial reported in the main text.
Time (min) CO2 H2 CO Bed temp.oC
15 14,2 8,5 14,2 884 20 874 25 13,8 9,6 13,9 863 30 13,2 10,9 13,1 845 35 13,3 10,2 13,2 830
Time (min) CO2 H2 CO Bed temp.oC
0 13,9 5,4 9,2 982 5 14,0 5,3 9,3 985
10 14,0 5,5 9,3 983 60 14,1 5,4 6,3 919 65 13,9 5,6 5,7 923 70 13,6 6,3 6,0 924 75 13,6 6,2 6,0 926 85 13,4 6,9 6,5 929 90 13,5 6,8 6,7 931 95 13,4 7,0 6,8 932
100 13,4 7,0 6,9 934 105 13,4 7,0 6,9 935 125 12,6 8,1 8,6 942 130 11 ,5 11 ,4 10,8 951 135 11,5 11 ,5 10,7 947