zirconium metal-water oxidation kinetics iv. reaction rate ... · ornl/nureg-17 dist. category...
TRANSCRIPT

ORNL/NUREG-1 7
Zirconium Metal-Water Oxidation Kinetics IV.Reaction Rate Studies
J. V. CuthcartR. E. PawelR. A. McKeeR. E. DruschelG. J. YurekJ. J. CampbellS. H. Jury
Prepared for the U.S. Nuclear Regulatory CommissionOffice of Nuclear Regulatory Research
Under Interagency Agreements 40-551-75 and 40-552-75
0.1
Al
- `)

U MI
Printed in the United States of America. Available fromNational Technical Information Service
U.S. Department of Commerce5285 Port Royal Road, Springfield, Virginia 22161
Price: Printed Copy $7.75; Microfiche $3.00
KU
IU
This report was prepared as an account of work sponsored by the United StatesGovernment. Neither the United States nor the Energy Research and DevelopmentAdministration/United States Nuclear Regulatory Commission, nor any of theiremployees, nor any of their contractors, subcontractors, or their employees, makesany warranty, express or implied, orassumes any legal liabilityorresponsibilityfortheaccuracy, completeness or usefulness of any information, apparatus, product orprocess disclosed, or represents that its use would not infringe privatelyowned rights.

ORNL/NUREG-17Dist. Category NRC-3
Contract No. W-7405-eng-26
METALS AND CERAMICS DIVISION
4ZIRCONIUM METAL-WATER OXIDATION KINETICS IV.
REACTION RATE STUDIES
J. V. Cathcart, R. E. Pawel, R. A. McKee, R. E. Druschel,G. J. Yurek, J. J. Campbell, and S. H. Jury
Manuscript Completed - July 19, 1977
Date Published - August 1977
Prepared for theU.S. Nuclear Regulatory Commission
Office of Nuclear Regulatory ResearchUnder Interagency Agreements 40-551-75 and 40-552-75
OAK RIDGE NATIONAL LABORATORYOak Ridge, Tennessee 37830
operated byUNION CARBIDE CORPORATION
for theENERGY RESEARCH AND DEVELOPMENT ADMINISTRATION

iii
Ku CONTENTS
SUMMARY . . . . . . . . . . . . . . . . . . . . . . . . . . .
ABSTRACT ..........................
INTRODUCTION . . . . . . . . . . . . . . . . . . . . . . . .
EXPERIMENTAL PROCEDURES ...................
Thermocouple Selection and Calibration . . . . . . . . .
Thermocouple-Specimen Compatibility . . . . . . . . . .
Apparatus Description-MaxiZWOK . . . . . . . . . . . . .
MaxiZWOK Temperature Control and Recording Systems
Apparatus Description-MiniZWOK . . . . . . . . . . . . .
. . * vii
. . . 1
. . . 2
. . . 3
. . . 4
. . . 6
. . . 10
. . . 14
. . . 14 4MiniZWOK Temperature Control-and Recording Sys
Potential Errors in Temperature Measurements . . .
Thermal Shunting . . ... . . . . . . . . . .
Thermal Shunting in the MiniZWOK Apparatu
Thermal Shunting in the MaxiZWOK Apparatu
Electrical Shunting . . . . . . . . . . . .
Parasitic EMF's . . . . . . . . . . . . . .
Data Acquisition System Errors . . . . . .
Thermocouple Calibration Errors . . . . . .
Temperature Gradients in the Sample . . . .
Decalibration of Thermocouples . . . . . .
Tab Attachment Effects . . . . . . . . . .
Evaluation of Temperature Errors . . . . . . . .
Determinant Errors . . . . . . . . . . . .
Indeterminant Errors . . . . . . . . . . .
Indeterminant Errors in MiniZWOK
Indeterminant Errors in MaxiZWOK
Total Error Estimates . . . . . . . . . . .
;tem . . . . 17
. . . . . . 18
... . . . ... 19
is . . . . . 20
Is . . . . . 21
. . . . . . 22
. . . . . . 22
. . . . . . 23
. . . . . . 23
. . . . . . 23
. . . . . . 25
. . . . . . 25
. . . . . . 27
. . . . . . 27
. . . . . . 27
... . . . ... 29
. . . . . . 34
. . . . . . 34
. . . . . . 35
. . . . . . 38
... . . . . 39
. . . . . . 40
. . . . . . 40
. . . . . . 43
.
Weight Gain Tests . . . . . . . . . . . .
Characterization of Zircaloy-4 PWR Tube Specimens
EXPERIMENTAL RESULTS FOR ISOTHERMAL OXIDATION . . . . .
Primary Isothermal Data Set - MiniZWOK Apparatus
Time-Temperature Cycles . . . . . . . . . . .
Normalization of Time-Temperature Excursions
-'U

iv
Metallographic Procedures . . . . . . . . . . . . .
Phase Thickness Measurements . . . . . . . . . . .
Results . . . . . . . . . . . . . . . . . . . . . .
Correlation of the Data . . . . . . . . . . . . . .
Oxide-Alpha Thickness Ratios . . . . . . . . . . . . . .
Comparison of Isothermal Kinetic Data . . . . . . . . .
Scoping Tests . . . . . . . . . . . . . . . . . . . . .
Isothermal Oxidation Tests in MaxiZWOK . . . . . .
Data and Results . . . . . . . . . . . . . . .
Correlation of Data and Comparisons . . . . .
Mixed Gas Experiments . . . . . . . . . . . . . . .
Alloy Composition Variation . . . . . . . . . . . .
Summary of Isothermal Scoping Test Results . . . .
COMPUTER CODES AND TRANSIENT-TEMPERATURE OXIDATION . . . . .
Isothermal Model Verification . . . . . . . . . . . . .
Mixed-Temperature Experiments . . . . . . . . . . .
Transient Temperature Oxidation Experiments . . . . . .
Anomalous Transient Temperature Oxidation . . . . .
CONCLUSIONS AND RECOMMENDATIONS . . . . . . . . . . . . . . .
ACKNOWLEDGMENTS . . . . . . . . . . . . . . . . . . . . . . .
REFERENCES . . . . . . . . . . . . . . . . . . . . . . . . .
APPENDIX A-ERROR ANALYSIS .................
INTRODUCTION ........................
STATISTICAL TREATMENT OF ISOTHERMAL OXIDATION RATE DATA . . .
Data . . . . . . . . . . . . . . . . . . . . . . . . . .
Prediction Equations for Rate Constants. . . . . . . . .
Confidence Intervals at the 95% Level . . . . . . . . .
Individual Confidence Limits . . . . . . . . . . .
(Upper 95%/Upper 90%) for Estimator A. . . . .
(Upper 95%/Upper 90%) for Q . . . . . . . . .
Joint Confidence Intervals . . . . . . . . . . . .
MAXIMUM ABSOLUTE ERROR LIMITS FOR EXPERIMENTAL PROCEDURES
Temperature Measurement Errors . . . . . . . . . . . . .
Time Measurement Errors ................
. . .
'. .
45
46
50
58
72
73
76
76
79
81
85
93
98
98
100
102
105
109
117
120
121
125
125
125
126
126
140
140
141
143
144
144
144
150
Utj
.. .
* . *
v
Thickness Measurement Errors . . . . . . . . . . .
Uncertainty in Parabolic Rate Constants . . . . . * . . * .
Uncertainties in A and Q . . . . . . . . . . . . . .
Indeterminant Errors . . . . . . . . . . . . . . . .
SIGNIFICANCE OF ABSOLUTE ERROR ESTIMATES . . . . . . . .
REFERENCES . . . . . . . . . . . . . . . . . . . . . . .
APPENDIX B - HYDROGEN ANALYSES FOR OXIDIZED SPECIMENS . .
INTRODUCTION . . . . . . . . . . . . . . . . . . . . . .
ANALYTICAL RESULTS ................. ..
EVALUATION OF ANALYTICAL DATA . . . . . . . . . . . . . .
DISCUSSION OF THE ANALYTICAL RESULTS . . . . . . . . . .
As-Received Tubing . . . . . . . . . . . . . . . . .
Two-Sided Oxidation ................
One-Sided Oxidation ................
Mechanism of Hydrogen Absorption . . . . . . . . . .
Transient Temperature Oxidation . . . . . . . . . .
POSSIBLE EFFECTS OF DISSOLVED HYDROGEN ON OXIDATION RATES
Indirect Evidence .................
Self-Consistency of Rate Data . . . . . . . . .
Comparison with Other Data . . . . . . . . . .
Experiments in Pure Oxygen . . . . . . . . . . . . .
Analysis of Possible Effects . . . . . . . . .
Effects in the Alpha and Beta Phases . . .
Effects in the Oxide . . . . . . . . . . .
Experimental Results for Oxidation in Oxygen
Discussion of Results . . . . . . . . . . . . .
Hydrogen Effects in the Beta Phase Only
Effects in the Oxide Only . . . . . . . .
CONCLUSIONS . . . . . . . . . . . . . . . . . . . . . ...
REFERENCES . . . . . . . . . . . . . . . . . . . . . . .
. . ..
. . ..
. . ..
* . ..
. . .
. . .
. . .
151
156
158
158
160
162
163
163
163
168
169
169
169
169
170
173
173
174
174
174
175
175
176
178
179
181
181
185
196
197
4
. . .
. . .
. . .
. . .
. . .

vii
SUMMARY-
The isothermal reaction rates of steam and Zircaloy-4 were deter-
mined at 500C (900F) intervals from 900 to 15000C (1652-27320F). The
following correlations were obtained for oxide, alpha, and Xi layer
growth and for total oxygen coisumption:
,62L(7U 62/2 = 0.01126 exp(-35890/RT) cm2/s for 1000%C < T < 15000 C, GX;J
6 /2 = 0.7615 exp(-48140/RT) cm2/s for 9000C < T < 15000C, O'
62/2 = 0.3412 exp(-41700/RT) cm2/s for 10000C < T < 15000C, 662/2 = 0.1811 exp(-39940/RT) (g/cm2 ) 2 /s for 10000C < T < 15000C,
where the 62/2 are the parabolic rate constants (62/2 = K dK/dt), 4,K K
a, E refer to oxide, alpha and Xi layer growth, respectively, and T
represents total oxygen cons)Med. The correlations for 4, (, and T
are not valid below 'X' 1000°C (1832°F) because below this temperature
the oxide layer growth does not follow parabolic kinetics.
The conditions under which these data were obtained were carefully
characterized and the experimental procedures fully documented, especially
with regard to the accuracy of temperature, time, and phase thickness
measurements. The data were subjected to a rigorous statistical analysis,
and at the midpoint of the reciprocal temperature determinations
[",. 1200°C (2192°F)] the uncertainty on 62/2 at the 90% confidence level
was 2.5, 5.8, 1.5, and 1.7% for the oxide, alpha, Xi, and total oxygen
rate constants, respectively. At the extremes of the temperature range
these uncertainties were somewhat greater; e.g., at 15000C (2732°F)
values of 4.3, 10.1, 2.6, and 2.9%, respectively, were obtained. An
absolute error analysis is also supplied. Within the limits thus
established and for the comparatively ideal oxidation conditions used,
we consider this isothermal data set to be highly reliable.
A series of scoping tests demonstrated that neither steam flow
rate (above steam starvation levels); steam temperature; the presence
of reasonable concentrations of oxygen, nitrogen, or hydrogen in the
steam; nor small variations in alloy composition significantly influence
the isothermal oxidation rate of Zircaloy-4.

viii
Two computer codes, SIMTRAN and BILD5, were written that together X
successfully predict the thickness of the compact oxide and oxygen-
stabilized alpha layers formed and total oxygen consumed during most
transient temperature oxidation experiments. Exceptions involve certain
postulated two-peak LOCAs where the phenomenon of "anomalous transient
temperature oxidation" is observed. The probable mechanism of this
effect is discussed in detail in the body of the report. The computer
codes also do not model the formation of alpha incursions or precipi-
tates in the beta regions of the fuel tubes during the cooling phase of
a temperature transient.
Areas in which it is suggested that further correlations be
developed or additional research performed include: (1) the effect of
fuel tube deformation on oxidation rate; (2) the phenomenon of the
formation of alpha incursions as related to the mechanical properties
of Zircaloy-4; and (3) anomalous transient temperature oxidation effects.
\ ,;Lfl

ZIRCONIUM METAL-WATER OXIDATION KINETICS IV.REACTION RATE STUDIES
J. V. Cathcart, R. E. Pawel, R. A. McKee, R. E. Druschel,G. J. Yurek,* J. J. Campbell, and S. H. Juryt
ABSTRACT
The isothermal rates of oxide, oxygen-stabilized alpha,and Xi layer growth and of total oxygen consumption ofZircaloy-4 in steam were determined from 900 to 1500 0C(1652-27320 C) and described in terms of analytical expres-sion for the appropriate parabolic rate constants. Compar-ison of the results with existing rate data demonstratesthe relative conservatism of the Baker-Just correlation.Scoping tests of the effects on isothermal oxidation ratesof such system parameters as steam flow rate, injectiontemperature, and purity and of small changes in alloycomposition showed these variables to have small ornegligible effects. Experimental transient temperatureoxidation behavior was found to be predictable by com-puter codes designed for that purpose; the only exceptionfound was the case of certain hypothetical two-peak LOCA's.The probable cause for this exception is discussed in termsof the monoclinic-tetragonal phase transformation of theoxide. An error analysis of the oxidation data is presentedin both statistical and analytical terms, and possible kineticeffects of hydrogen dissolved in oxidized samples areconsidered and concluded to be negligible.
*Dept. of Materials Science and Engineering, Massachusetts Instituteof Technology, Cambridge, MA 02139.
tConsultant, University of Tennessee, Knoxville, TN.

'I t
2
INTRODUCTION XJ
Models of hypothetical loss-of-coolant accidents for light water
nuclear power reactors generally involve an excursion in temperature
for parts of the reactor core in which the reaction of the Zircaloy
fuel rods with the steam environment may become appreciable. The
effects of the Zircaloy-steam reaction must be considered in the
emergency core cooling system design because of their potential influence
on both the thermal and mechanical behavior of the system. Thus, it has
been considered important to establish a capability to evaluate and pre-
dict quantitatively the extent of the oxidation reaction during transient
temperature exposures.
The primary purpose of the present program is to provide reliable
kinetic measurements describing the reaction of Zircaloy with steam at
high temperatures. This information will provide a basic data set to
be used as input to computer codes to predict the oxidation behavior of
LWR fuel cladding during the various temperature excursions anticipated
for hypothetical LOCA's. This report constitutes the final report of
the oxidation kinetics phase of this research. Previous reports of
this work, which contain many of the details not emphasized here, are
the Quarterly Report series,1 several topical reports,2 -5 and other
publications. 6-7
The oxidation of Zircaloy at temperatures above the alpha-beta
transformation will generally result in two distinct product layers
growing into the host beta: the outermost oxide phase, and an inter-
mediate layer of oxygen-stabilized alpha. During cooling of the speci-
men to room temperature, the beta core transforms back to alpha. However,
the metallographic appearance of this material is significantly different
from that of the oxygen-stabilized alpha, and the "prior beta" is easily
recognized. The growth rates of these product layers are conveniently
measured parameters that may be used to describe the oxidation kinetics.
In addition, it is possible to utilize the phase thickness measurements,
in conjunction with other information, to calculate the total oxygen
consumption. The bulk of the experimental effort in this program was
directed at obtaining kinetic data for these parameters over the

3
temperature range 900-1500'C. In addition, computer codes were developed
that utilized these data to predict oxidation behavior during transient
temperature reactions.
EXPERIMENTAL PROCEDURES
The accurate measurement of reaction kinetics at elevated tempera-
tures requires a considerable effort in order to keep experimental
errors within acceptable limits. The apparatuses and procedures
utilized in this program were developed with these problems in mind, and
particular attention was directed throughout the research to assure that
accurate temperature measurements would be characteristic of all
experiments.
In order to accomplish all of the necessary tests, two experimental
steam oxidation apparatuses were constructed. Both apparatuses utilized
the multispecimen technique to examine the reaction kinetics. The first,
called MaxiZWOK, was based on a high thermal inertia furnace system, with
steam at or near the desired reaction temperature being passed over the
specimen. In this apparatus, the temperature of the specimen was not
controlled directly but was governed by its response to the heat trans-
fer from its steam and furnace environment. With this apparatus tests
could be conducted at comparatively high steam flow rates and insertion
temperatures. The second apparatus, called MiniZWOK, was based on a
low thermal inertia furnace system in which the specimen was heated in
flowing steam by a powerful radiant heating furnace. In this case,
the specimen temperature was controlled directly by regulating the
power to the furnace. A temperature programming capability for this
system made it convenient for performing both isothermal and transient-
temperature oxidation experiments.
Both apparatuses were developed and improved during the course of
this investigation and the chronology of these changes can'be followed
in the Quarterly Reports.1 The most important changes came about in
an effort to improve the accuracy of temperature measurements of the
specimen during oxidation. For example, the original MiniZWOK apparatus
was designed to oxidize both inner -and outer surfaces of the Zircaloy

I r1
4
tube specimens. Preliminary experiments with this apparatus uncovered
a number of problems involving temperature measurements that were
alleviated when the system was modified to allow oxidation on
the outer tube surfaces only.
Thermocouple Selection and Calibration
A prime goal in the Thermometry Task of this program was to provide
temperature measurements traceable to the International Practical
Temperature Scale of 1968 (IPTS-68). In the temperature range 900 to
15000C (1652-27320F), the IPTS-68 is based on two instruments: (1) the
Pt vs Pt-10% Rh thermocouple, which spans the range 630.74 to 1064.430C
(a 1167-19480 F), and (2) above 1064.430C (% 19480F), a radiation
pyrometer using the Planck Law of radiation with 1064.430C (N 19480F),
as the reference temperature and a value of 0.014388 meter-kelvin for
C2 in the radiance equation.8
Because of its convenience and superior characteristics for both
the oxidation and diffusion experiments, nominal Pt vs Pt-10% Rh thermo- -1lcouples (type S) were used as our primary means for determining tempera-
ture. The supplies of platinum and Pt-10% Rh reference grade thermocouple
wire were obtained from the Sigmund Cohn Corporation.* Individual lots
were fabricated from the same heat in order to minimize calibration
differences. Several wire diameters were specified, but subsequent
testing revealed no differences in the performance of thermocouples
made from 0.008, 0.025, and 0.051 cm (0.003, 0.010, 0.020 in.) diam
wires. Therefore, for the sake of ease of handling, the 0.025 cm
(0.010 in.) diam wire was used exclusively in all later experiments.
Prior to calibration all thermocouple wires were subjected to an
air anneal. The initial annealing schedule, 6 hr at 13000C (23720F),
produced no difficulties with the pure platinum wire, but the tensile
strength of the Pt-10% Rh was reduced by 30% and its total elongation
by 45%. This deterioration of mechanical properties was shown metallo-
graphically to be related to excessive grain growth in the wire during
*Sigmund Cohn Corp., 121 S. Columbus Ave., Mt. Vernon, NY, 10553.

-
5
the anneal; the average grain size after anneal was about half the wire
diameter. Therefore, a less demanding annealing schedule was adopted:
2 min at 1400'C (25520F), 20 min at 1200'C (21920F), 1 hr at 1000'C
(18320 F), and 2 hr at 5000 C (9320F). This treatment produced wires
composed of relatively small, equiaxed grains, and the mechanical
properties of the wires were not degraded.
The actual calibration of the various thermocouple combinations
was carried out in the Metrology Research and Development Laboratory,
Instruments and Controls Division, Oak Ridge National Laboratory. The
procedure used involved several comparison calibrations of the thermo-
couple wires to 1500'C (27320F). Several thermocouples, including two
NBS-calibrated Pt vs Pt-10% Rh thermocouples, were connected to a common
hot junction and the emf values of various pairs compared with the
standards. A detailed description of the calibration procedure was
given in a previous report.3
The data obtained indicated that the thermoelectric properties of
our wires were excellent. The Pt vs Pt-10% Rh wire behaved very much
like the NBS-calibrated thermocouples.
This calibration procedure represented an attempt to achieve, under
ideal conditions, measurements of temperature with maximum uncertainty
of ±20C (3.60F) on IPTS-68 at 15000C (27320F). Below 1064%C (19470F),
estimated uncertainties of thermocouple calibrations were less than
+0.20C (0.36°F) at fixed points and less than ±0.3 0C (0.54°F) for table
values between fixed points.9 These uncertainties increased above
1064-C (1947°F). At 14500C (26460F) an uncertainty of ±10C (1.80F)
is given for an NBS calibrated Pt vs Pt-10% Rh thermocouple, and we
estimated an uncertainty of ±1.5°C (2.7°F) for our thermocouples at
1500°C (2732°F). Thus our goal of an uncertainty of ±20C (3.60F) at
1500°C (27320F) appears to be realized except for possible problems
associated with thermocouple decalibration during installation and use.
We addressed this latter concern by submitting for recalibration
a Pt vs Pt-10% Rh thermocouple that had been used in several experiments
between 900 and 1475°C (1652-2687°F) for approximately 3 hr. This
thermocouple was tested to 1000°C (1832°F), and the results of the

6
recalibration gave no evidence of decalibration problems. Portions of
a similar thermocouple were also submitted for chemical analysis. There
was no indication of significant contamination which might lead to
decalibration of the thermocouples.
A feature of our experimental procedure that mitigates decalibration
difficulties is the fact that in a normal experiment the thermocouple
hot junction is made by welding the thermocouple leads to a small tab
of tantalum that is in turn welded directly to the specimen. At the
end of an experiment the leads are clipped off just below the hot
junction, and an entirely new hot junction is formed on the next speci-
men. Thus any contaminants near the hot junction are eliminated before
they have time to diffuse far enough along the thermocouple wires to
produce problems.
Thermocouple-Specimen Compatibility
The Zircaloy-steam reaction is highly exothermic (AH I 140 kcal/mole
in the temperature range of interest), and significant self-heating of a
Zircaloy specimen can occur under conditions where the rate of oxidation
is high. Therefore, in order to monitor accurately the temperature of
an oxidizing sample, we considered it essential that metal-to-metal
contact be maintained at all times between the specimen and the
thermocouples.
Unfortunately, platinum-base thermocouples cannot be attached
directly to Zircaloy specimens used in experiments above X. 1150'C
(2102'F) because of the formation of a low melting [11850C (21650F)]
Pt-Zr eutectic (see Fig. 1). We circumvented this problem by inserting
tantalum or iridium tabs [2 x 2 x 0.075 mm (0.08 x 0.08 x 0.003 in.)]
between the thermocouple and the specimen. The thermocouple leads were
first spot welded together on the tabs, and the tabs were then spot
welded to the specimen.
Tantalum proved to be an excellent tab material when used in
vacuum, as in our diffusion experiments, or in an inert gas, as in our
low thermal inertia oxidation apparatus (see below). A Zr-Ta eutectic
melting at x' 1850%C (33620F) has been reportedl but produced no problems.

7
Pt-Zr Platinum-Zirconiumcc Atomic Percentage Zirconium
10 20 30 40 50 60 70 80 90 Zr
2000 ti63. - hs Diag L
1800
1600 I __
2700F
1400 __ __ _
2300F- 8(-r
1200T210OF -6
1ooo1700F 82
8007
600 __
Pt 10 20 30 40 50 60 70 80 9 0 ZrA. S. D. Weight Percentage Zirconium
'Fig. 1. Platinum-Zirconium Phase Diagram After Hawkins andHultgren.10
A narrow diffusion zone between a tab and a Zircaloy diffusion specimen
could be detected after a 30 min anneal at 14500C (26420C), but because
the junction between tab and specimen always consisted of metal with
good thermal conductivity, we see no reason to question the validity of
this form of thermocouple attachment. No Pt-Ta phase diagram appears
to be available, but metallographic examinations of the Pt-Ta interface
showed little evidence of interaction. The only disadvantage of the
tantalum tabs was the necessity to protect them from steam during our
oxidation experiments. A cross-section through a thermocouple-tab-
specimen weld area is shown in Fig. 2. The specimen was from an experi-
ment in the MiniZWOK apparatus, (S-74), in which oxidation for 339 s at
1153%C (2107'F) took place. A good connection between the thermocouple
bead, the tab, and the specimen is seen to exist.

I- -
8
'I
4 *
Fig. 2. Cross Section Through Thermocouple and Tantalum Tab SpotWelded to Zircaloy-4 Specimen. Outer surface of specimen tube wasoxidized 339 s at 11530C (2107'F). 75x.
Because it was much more difficult to protect the thermocouple tabs
in the preliminary version (two-sided oxidation) of the MiniZWOK appara-
tus, we originally employed iridium tabs for use in steam where, in the
temperature range of interest, iridium is inert. We were unable to find
a Zr-Ir phase diagram in the literature, and preliminary annealing
testsla in vacuum did indicate the formation of a Zr-Ir eutectic between
1200 and 1300%C (2192-23720F). However, in these tests the specimen was
heated at a rate of 4000C/hr (7200F/hr), thus providing ample time for
interdiffusion between the sample and tab. In-a much shorter test, at
a temperature of X' 14000C (25520 F) and carried out under the time-
temperature regime shown in Fig. 3, the thermocouple did remain attached
to the specimen throughout the experiment. Subsequent metallographic
examination of the specimen (Fig. 4) showed evidence of liquation in
both the tab and the specimen. However, melting was confined to the
immediate vicinity of the tab, the tab itself was not penetrated (thus fl0

9
ORNL-DWO 74-9733
1400.
1200
Z
-o 1000Id
> 800
600
400
200
I
0 1 2 3 4
TIME min.)
5 6
Fig. 3. Recorder Trace of Time-Temperatureof Iridium Thermocouple Tab on Zircaloy-4.
Regime Used in Test
-K->
7 WV IMP
Tqlkm v, - '. _'. ... -
Fig. 4. Cross Section of Zircaloy-4 PWR Tube Specimen-after Exposurein Steam According to the Temperature Cycle of Fig. 3. This illustratesthe interaction zone associated with the weld between the iridium tab (oninside of tube) and the specimen. As polished, bright field, 62x.

10
protecting the thermocouple leads from attack), and good physical and
thermal contact was maintained between the tab and specimen throughout
the experiment. For these reasons and because we anticipated oxidation
experiments of durations considerably less than 4 min at these very
high temperatures, we were confident that iridium tabs could have been
used successfully as needed in our oxidation rate studies. The modifi-
cation of the MiniZWOK apparatus to produce oxidation only on the outer
surface made it more practical to use the tantalum tabs.
Apparatus Description-MaxiZWOK
The MaxiZWOK steam oxidation apparatus is shown schematically in
Fig. 5. The main components of this system are the superheated steam
and distilled water supplies, the furnace and reaction tube, the speci-
men insertion device, and the instrumentation arrangements. The apparatus
provides for superheating steam at high flow rates and brings it in con-
tact with Zircaloy tubing specimens under well-documented conditions.
The incoming steam (65 psig) from the ORNL plant steam system
passes through a separator, is metered, and enters the superheater at a
pressure of 55-60 psig. Tests on the plant steam have revealed that the
oxygen is maintained at less than 0.5 ppm, total soluble gases are less
than 15 ppm, and total solids are approximately 0.4 ppm. The superheater
consists of two coils of 0.95 cm (3/8 in.) OD Inconel 600 tubes that are
resistance-heated. Power to the coils is furnished by four 5 KVA step-
down transformers each fed by a Variac. The temperature of the Inconel
at several points near the top (and hottest portion) of the superheater
is monitored at all times as part of the "surveillance" thermocouple
system. The superheater system is well-insulated with high temperature
material (Kaowool). This arrangement proved capable of delivering
approximately 1 lb/min of steam at temperatures up to 10000C (18320F)
to the reaction chamber. Inconel tube temperatures approaching 1200%C
(21920F) were common. At these mass flow rates, the linear velocity of
the steam was estimated to be about 20 m/s (66 ft/s) in the reaction
chamber, and a few hundred m/s in the superheater tube.

( C C'
ORNL-OWG 74-6057R
H-
I SUPERHEATER2 TRANSFORMER (4)3 VALVE4 STEAM FLOWMETER5 POWER6 STEAM SEPARATOR7 PLANT STEAM8 TRAP9 DRAIN
10 WATERII CONDENSERI? FILTER
13 ROTAMETER14 DISTILLED WATER15 HEADER16 REACTORi? STEAM AND WATER18 DESUPERHEATER19 OUENCH BATH
20 VENT21 STEAM
Fig. 5. Schematic Diagram of the MaxiZWOK Oxidation Apparatus.

I "
12
The steam enters the top of the reaction chamber through an Inconel
"header", where the steam temperature is measured by a Pt/Pt-10% Rh
thermocouple attached to a platinum support located in the middle of
the steam stream. The output of this thermocouple actuates a Speedomax H
recorder-controller system that maintains the inlet steam temperature at
the desired value by pulsing power to the superheater.
The reaction chamber consists of a 2" ID alumina tube surrounded
by a muffle furnace. The primary purpose of the furnace is to prevent
excessive heat losses from the steam before it contacts the specimen
and to prevent excessive radiation losses from the specimen to the
chamber wall. A thermocouple located in the annular region between the
furnace and the specimen tube is used in conjunction with another
Speedomax H system to control the power to the furnace. Generally, the
furnace temperature is set equal to (or slightly above) the inlet steam
temperature.
As shown in Fig. 5, a fraction of the steam leaving the separator
is condensed and cooled for use in the steam desuperheater and specimen
quench bath. Thus, all water coming in contact with the specimen in the /
apparatus is distilled water.
The surveillance thermocouple system consists of twelve Chromel-
Alumel thermocouples located at important points on the apparatus. A
twelve-point recorder operates continuously during the course of an
experiment, serving as an early warning system for incipient troubles
in critical parts of the apparatus. Particular attention needs to be
paid to temperatures in the superheater system in order to prevent
them from becoming excessive. The possibility of a rupture of a super-
heater tube operating at a high-temperature, high-flow condition creates
some interesting scenarios.
The specimen consists of a 46 cm (18 in.) length of Zircaloy tubing.
A small segment of the tube in close proximity to the thermocouple
stations actually serves as the basic specimen; the remainder functions
simply as support for the specimen and the thermocouple leads.
The specimen is cut from a standard PWR tube section. At a point
approximately 20 cm (8 in.) from the forward end, a series of staggered

13
"ventilation" slots is cut in the tube in order to provide a path for
the steam flow through the interior of the tube and to interfere with
heat conduction from the upper end of the tube to its cooler lower
portions. The tube is then cleaned thoroughly with a detergent solution,
washed in alcohol, rinsed with distilled water, and dried.
Three thermocouple installations are made on the specimen. Generally,
all three are located on the outside of the tube, 1200 apart, at a point
5 cm (2 in.) from the upper end. After oxidation, the tube is sectioned
at this elevation for appropriate metallographic measurements. If
desired, a different arrangement of the thermocouples can be made. As
mentioned previously, the thermocouples are 0.025 cm (0.010 in.)
Pt/Pt-10% Rh calibrated, reference-grade materials encased in high-
purity alumina to a distance of about 1.2 cm (0.5 in.) from the welded
junctions. The ceramic tubes are positioned along the axis of the
tube and are held in place with several Nichrome wires. The outputs
of the three thermocouples attached to the specimen are fed directly
to one single-channel and one two-channel Esterline-Angus recorders.
The specimen temperature from insertion to quench can thus be monitored
at various chart speeds and sensitivities. In addition, a switch is
available to read the specimen thermocouple output directly on a Leeds
and Northrup K-3 potentiometer.
The instrumented specimen is installed in the apparatus in a collet
chuck located atop the plunger of a small hydraulic ram that serves as
the insertion system. The thermocouple connections are completed via
terminals located on a bakelite cylinder beneath the chuck. With the
specimen in place, the panel door to the specimen chamber is fixed
tightly in place with clamps. Distilled water is circulated in the
specimen chamber to keep the specimen cool prior to its insertion into
the reaction tube; this arrangement, in conjunction with the spray
desuperheater, also serves as an efficient quench bath at the conclusion
of the experiment.
Very concisely, an experiment in MaxiZWOK is conducted as follows:
(1) The instrumented specimen is mounted in the specimen chamber.
(2) With steam flowing through the system, power to the steam superheater
coils is increased until the desired steam temperature is reached.

14
Concurrently, the furnace temperature, measured by a thermocouple located
in the annulus between the furnace wall and the reaction tube, is brought
into control at the desired value. (3) The hydraulic insertion system
is activated, driving the specimen into the reaction chamber. The time-
temperature response of the specimen is monitored. (4) At the conclusion
of the experiment, the specimen is withdrawn from the reaction chamber
into the quench bath. The oxidized specimen is now ready for metallo-
graphic analysis.
MaxiZWOK Temperature Control and Recording Systems
Power to the steam superheater is controlled by the signal from the
Pt vs Pt-10% Rh thermocouple located at the upper end of the reaction
tube. An ice bath cold junction is utilized, and control is provided by
an L&N Speedomax H recorder-controller. The furnace temperature is con-
trolled by the Chromel-Alumel thermocouple in the furnace annulus, again
using a Speedomax H controller with a built-in temperature compensator.
The outputs from measuring Pt vs Pt-10% Rh thermocouples are fed into
two Esterline Angus, Model 1102S recorders; one of the couples is wired
through an L&N DPDT, low-thermal-emf, copper switch so that its signal
can also be read on the K-3 potentiometer. The calibration of the
Esterline Angus recorders is checked before and after each experiment
using a portable potentiometer; however, as in the case of MiniZWOK, the
accepted temperatures are based on the K-3 potentiometer readings.
At the control temperature, a MaxiZWOK specimen is subjected to
temperature oscillations of about ±20C (3.60F). Two frequencies and
amplitudes of oscillations were observed related to the independent
control of the steam superheater and furnace temperatures.
Apparatus Description-MiniZWOK
The bulk of the reaction rate experiments were performed in the
MiniZWOK apparatus, a low thermal inertia system in which the tempera-
ture of the specimen (rather than that of its surroundings) is controlled
in a programmed time-temperature excursion. A schematic diagram of the
MiniZWOK steam oxidation apparatus is shown in Fig. 6. As mentioned

15
ORNL-DWG 75-1465R2
I QUAD-ELLIPTICAL. INFRARED RADIANTHEATING CHAMBER
2 ZIRCALOY-4 PWR TUBE SPECIMEN 133 Pt/Pt-10% Rh THERMOCOUPLES
4 QUARTZ REACTION CHAMBER
5 QUARTZ SPECIMEN SUPPORT a6 QUARTZ CENTERING PIECE7 STEAM IN
B He IN9 STEAM OUT
10 He OUT
I THERMOCOUPLE WELLS12 VITON O-RINGS
13 STEEL SPRING14 GROUND-GLASS JOINT
15 TEMPERATURE-POWER CONTROLLER PLUSTIME/TEMPERATURE PROGRAMMER
16 TWO-CHANNEL STRIP-CHART TEMPERATURERECORDER
17 ICE BATH
18 POTENTIOMETER
19 MULTIPOSITION SWITCH
20 TANTALUM RADIATION SHIELO
21 TANTALUM THERMOCOUPLE TAB
22 DOUBLE-BORE. A12 03 THERMOCOUPLEINSULATION
23 VARIABLE VOLTAGE SUPPLY
24 AMPLIFIER
25 CODAS 111, DATA ACOUISITIONi i ~~~COMPUTERi jl)l
-- ~~~~26 TELETYPE .|@ | |( , ,_ l27 COMPENSATING| | l l(ill
EXTENSION WIRESlll
Fig. 6. Schematic Diagram of the MiniZWOK Oxidation Apparatus.
previously, this apparatus has been-improved in a number of ways since'
its inception and has performed efficiently in producing well-
characterized experiments under rather extreme experimental conditions.
The reaction chamber consists of a 60 mm (2.36 in.) OD quartz tube
60 cm (23.6 in.) long with a Zircaloy-4 PWR tube sp'ecimen [30 mm-long
by 10.92 mm OD by 9.65 mm ID (1.18 x 0.430 x 0.380 in.)] supported at
its center between two smaller quartz tubes. During an experiment,
steam flows past the outside surface of the specimen, and a slight
/5 Vposit~ive-pressure of helium is maintained-inside the support tubes in

I Ft
16
order to prevent ingress of steam to the interior of the specimen. A
helium flow rate of X' 0.2 cc/s is used for this purpose. Steam is
generated in an all-glass boiler (not shown in the figure). For most
experiments the steam flow rate was adjusted to 30 g/min (0.066 lb/min)
which corresponds to a linear velocity of about 1 m/s (3 ft/s) past the
specimen in the reaction tube.
The furnace surrounding the reaction chamber is a Research, Inc.
quadelliptical radiant heating chamber, Model E-4, with a hot zone of
25.4 cm (10 in.). Specimen heating rates in excess of 150'C/s (270'F/s)
can be attained with this unit, and the response of both the furnace and
its controller is very fast. These characteristics, plus the fact that
the furnace is controlled directly by the specimen temperature, prevent
specimen over-heating and allow essentially isothermal conditions to be
maintained during oxidation.
The specimen is instrumented with three Pt vs Pt-10% Rh thermo-
couples. As described earlier, the hot junctions are formed by spot
welding the thermocouple leads to small tantalum tabs [2 x 2 x 0.075 mm
(0.08 x 0.08 x 0.003 in.)] that are in turn welded to the interior of
the sample near its midpoint. One thermocouple is connected to the
temperature controller, and the other two are used as measuring couples.
The two measuring couples are positioned 180 degrees apart at the same
elevation. Depending upon the duration of the experiment and the desired
sensitivity, the temperature-time excursion of the specimen as sampled
by each of the monitor thermocouples is determined by either a recorder
chart output, multiple readings on the standard L & N K-3 potentiometer,
or the CODAS (Computer Operated Data Acquisition System). These mea-
suring systems will be discussed later.
This general design was adopted so that the tantalum thermocouple
tabs could be protected from the steam and also-to minimize thermal
shunting effects. The latter purpose is also served by the tantalum
heat shield inserted into the upper portion of the specimen. A lower
heat shield is formed by the ends of the double-bore, DeGussit AL-23,
high-purity alumina insulators used to separate the lower portions of
the thermocouple leads. The upper parts of insulators are within the

17
furnace and also serve to preheat the helium before it reaches the
interior of the specimen.
An experiment in MiniZWOK may be described briefly as follows:
(1) The instrumented specimen is mounted in the apparatus as shown in
the illustration. (2) The steam and helium flow is started and sufficient
time is allowed to purge the air from the apparatus. During this period
the furnace is on at very low power to eliminate condensation in the
vicinity of the specimen, which is maintained at a temperature less than
200-C (3920F). (3) the CODAS is activated for the two monitor thermo-
couples. (4) The specimen is now driven through the desired time-
temperature cycle by means of the programmable controller which actuates
the quadelliptical radiant heating furnace surrounding the specimen.
Sufficient cooling is available to perform an effective quench at the
end of an "isothermal" experiment. (5) After the experiment, the
specimen is removed from the apparatus for analysis. The thermocouple
tabs are left in place so that the metallographic measurements can be
referenced to the monitor thermocouple positions.
MiniZWOK Temperature Control and Recording System
The instrumentation for this apparatus is more complex than that
for MaxiZWOK and is indicated schematically in Fig. 6. All Pt vs
Pt-10% Rh thermocouple wires are led out of the system uninterrupted
through ports sealed with silicone rubber or Teflon and from thence
to an ice bath where they join low thermal emf copper telephone wires.
Temperature control of the specimen is maintained with a Research,
Inc. Model D-30 MicroThermac Controller associated with a Data-Trak
Programmer for virtually any time-temperature regime. The signals from
the two measuring thermocouples, after passing through a thermal free,
multiposition switch (contact resistance < 0.001 ohm, thermal emf < 1 vV),
may be (1) read on an L & N K-3 potentiometer, (2) recorded by a two-
channel strip chart recorder (Esterline Angus, Model 1102S, a multi-span
unit with calibrated zero), or (3) fed to the computer operated data
acquisition system (CODAS). The CODAS system has been described in
detail elsewhere.12 In our system the CODAS computer periodically

I It
18
reads the thermocouple emf (25 readings in 2 msec), calculates an
average emf for a specified number of readings, converts the emf to
temperature according to the emf-temperature calibration for our particu-
lar Pt vs Pt-10% Rh thermocouple wires, and either prints the time and
the averaged temperature at specified intervals with the aid of a tele-
type or records this information on magnetic tape for later retrieval.
The CODAS system is calibrated directly before and after each experiment
with a Dial-A-Source voltage unit (General Resistance, Inc., Model
DAS-47A1) that itself is compared against our K-3 potentiometer.
Care was exercised in properly wiring, grounding, and shielding
the various components of the MiniZWOK control and recording system in
order to eliminate ground loops and other parasitic emf's. In addition
it was found that considerable high frequency noise was introduced into
the system by the operation of the silicon-controlled rectifiers of the
furnace power supply. For this reason a low band pass filter with a
cutoff above 50 Hz was installed between the multiposition switch and
the CODAS amplifier (items 19 and 24 in Fig. 6). The filter, installed
in each copper lead, consisted of a series-connected, 50 Q, manganin-wire
wound resistor grounded through a 60 pF mylar capacitor.
The temperature control capability exhibited by this system, for
both isothermal and transient-temperature experiments, was excellent.
In the isothermal control regions only small temperature fluctuations,
"+1±0C (±1.80F), about the control temperature were observed.
Potential Errors in Temperature Measurements
Considerable care must be exercised in the use of thermocouples at
high temperatures if serious temperature errors are to be avoided. This
caution is particularly relevant in systems where experimental require-
ments create less than ideal conditions. We have considered the following
list of potential error sources in relation to the ZMWOK program:
1. Thermal shunting
2. Electrical shunting
3. Parasitic emf's
4. Data acquisition system errors

19
5.
6.
7.
8.
In this
to each
Thermocouple calibration errors
Temperature gradients in the sample
Decalibration of thermocouples
Tab attachment effects.
section we discuss the error sources listed above as they apply
of the apparatuses used in the program.
Thermal Shunting
The term "thermal shunting" is used here to mean the shunting of
heat to or from the thermocouple hot junction by convection, conduction,
or radiation. The process is illustrated in Fig. 7 for the case of
thermal shunting by convection. Cool steam flowing past the thermocouple
leads reduces their temperature and causes a flow of heat from the hot
junction to the leads. As a result the hot-junction temperature is
lowered with a consequent reduction in the emf generated by the thermo-
couple, and the indicated specimen temperature is erroneously low.
ORNL-DWG 75-17704
Fig. 7. Schematic Model Illustrating Nature of Thermal ShuntingErrors.
l [II
20
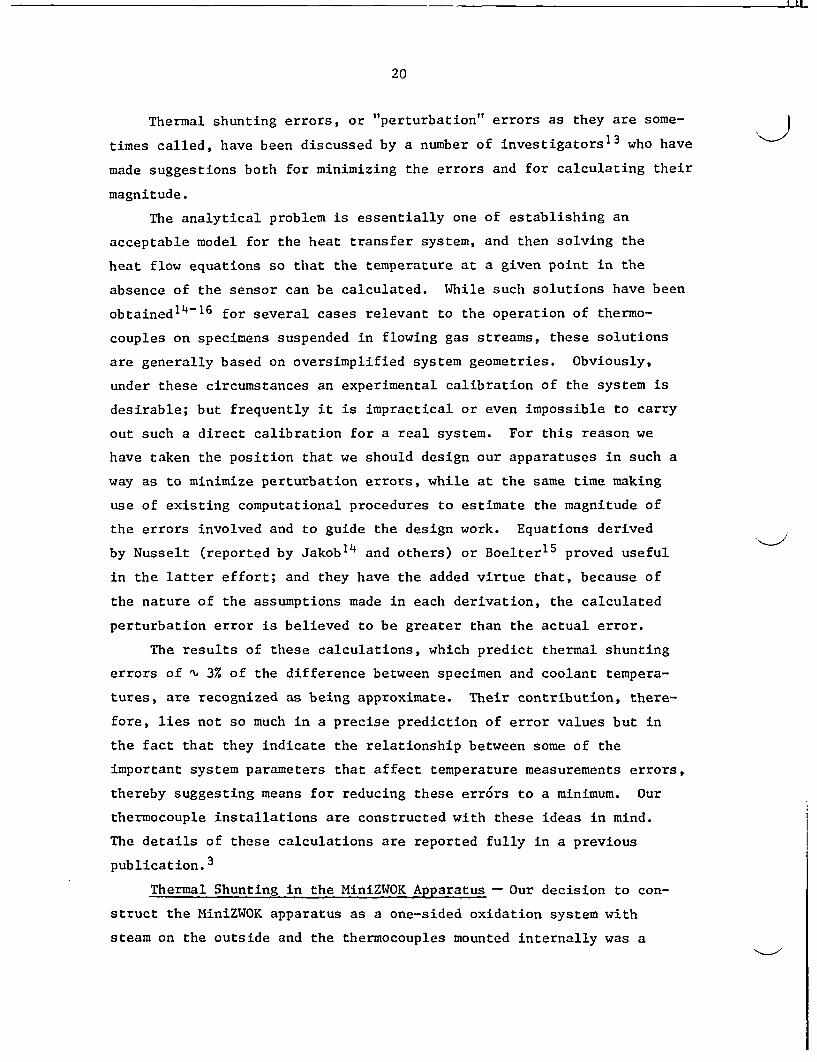
Thermal shunting errors, or "perturbation" errors as they are some-
times called, have been discussed by a number of investigators13 who have
made suggestions both for minimizing the errors and for calculating their
magnitude.
The analytical problem is essentially one of establishing an
acceptable model for the heat transfer system, and then solving the
heat flow equations so that the temperature at a given point in the
absence of the sensor can be calculated. While such solutions have been
obtained14t 16 for several cases relevant to the operation of thermo-
couples on specimens suspended in flowing gas streams, these solutions
are generally based on oversimplified system geometries. Obviously,
under these circumstances an experimental calibration of the system is
desirable; but frequently it is impractical or even impossible to carry
out such a direct calibration for a real system. For this reason we
have taken the position that we should design our apparatuses in such a
way as to minimize perturbation errors, while at the same time making
use of existing computational procedures to estimate the magnitude of
the errors involved and to guide the design work. Equations derived
by Nusselt (reported by Jakob14 and others) or Boelter15 proved useful
in the latter effort; and they have the added virtue that, because of
the nature of the assumptions made in each derivation, the calculated
perturbation error is believed to be greater than the actual error.
The results of these calculations, which predict thermal shunting
errors of X' 3% of the difference between specimen and coolant tempera-
tures, are recognized as being approximate. Their contribution, there-
fore, lies not so much in a precise prediction of error values but in
the fact that they indicate the relationship between some of the
important system parameters that affect temperature measurements errors,
thereby suggesting means for reducing these errors to a minimum. Our
thermocouple installations are constructed with these ideas in mind.
The details of these calculations are reported fully in a previous
publication.3
Thermal Shunting in the MiniZWOK Apparatus - Our decision to con-
struct the MiniZWOK apparatus as a one-sided oxidation system with
steam on the outside and the thermocouples mounted internally was a

21
direct consequence of the need to minimize thermal shunting effects.
Errors on the order of 1000C (1800F) have been observed in systems where
the thermocouples were exposed to rapidly flowing cool steam.17 A
discussion of the magnitude of such errors may also be found in Jakob. 14
In MiniZWOK the thermocouples are subjected only to very slowly flowing
helium, and the helium itself is preheated as it passes over the hot
A1203 thermocouple insulation in the lower portion of the apparatus. In
normal experiments the helium flow rate through the center tube of the
apparatus is 0.24 cc/s, and no changes in the measured emf's of the
thermocouples were noted when helium flow rates were varied from 0 to
4.9 cc/s (higher flow rates were not attempted) in the range of 900 to
13000C (1652-2372-F), indicating the absence of any significant con-
vective or conductive thermal shunting errors owing to the flow of
helium past the thermocouples.
In order to minimize the possibility of radiative thermal shunting,
a tantalum heat shield is located in the upper portion of the Zircaloy
specimen (see Fig. 6). The A1203 thermocouple insulation located in
the bottom specimen support tube also acts as a heat shield.
As already noted the thermocouples used in this apparatus are spot
welded to tantalum tabs, and the tabs, in turn, are carefully spot welded
to the interior of the specimen tubes. The thermocouple wires are led
away from the tab along the tube wall in a path parallel to the axis of
the tube to minimize conduction errors (see inset, Fig. 6). The verti-
cal sections of thermocouple wire between the tabs and the double-bore
A1203 insulation are covered with single-bore A1203 insulation.
These various design features and tests have led us to the conclusion
that thermal shunting errors in the MiniZWOK apparatus are negligible.
Thermal Shunting in the MaxiZWOK Apparatus - Thermal shunting
problems in this apparatus are relatively minor because in isothermal
experiments both the steam and the furnace are at the same temperature.
Thus, even though the thermocouples are exposed to rapidly flowing steam,
there can be no cooling effect. The possibility of thermal shunting
does arise in experiments in which substantial specimen self-heating
occurs and in which the-furnace temperature is higher than the steam

I I L
22
temperatures. We expect such errors to be minimal, however, because
(1) the difference between steam and specimen temperatures is relatively
small - at most in the neighborhood of 200'C (360'F), and (2) since the
furnace temperature in many cases is higher than the specimen tempera-
ture, the errors due to convective losses (steam effects) will be of
opposite sign to those related to radiative effects (furnace wall
temperature). In the worst case, using the perturbation error analysis
above, we estimate errors due to thermal shunting to be no more than
,Xj 50C (90F).
Electrical Shunting
Thermocouple errors may arise due to electrical leakage of the
thermocouple insulators or to thermionic emission between thermo-
elements or other metals in the system. These errors can be as large
as several hundred degrees Celsius in certain environments and at very
high temperatures [e.g., in argon at a pressure of 43 torr and at
temperatures near 180000 (3272oF)I.18 However, in the current work
this phenomenon was not a problem. For example, the resistance of
an open circuit thermocouple at 130000 (23720F) in the MiniZWOK apparatus
was 5 x 10⁵ ohms and 1.7 x 10⁵ ohms at 14550C (2651'F), which are much
too high values to allow significant electrical shunting. A similar
experiment in the MaxiZWOK apparatus produced a value of Xu 104 ohms.
The decrease in resistivity relative to that measured in MiniZWOK was
attributed to the fact that the lower ends of the MaxiZWOK thermocouples
are exposed to the distilled water of the quench bath for the apparatus;
however, a resistance of 104 ohms was still considered sufficiently
high to preclude the existence of significant electrical shunting.
Parasitic EMF's
Temperature measurement errors can be caused by the presence of
parasitic emf's in the electrical circuitry of thermocouples. Reference
here is made to such effects as ground loops, noise pickup, and problems
associated with the use of improper lead wires, reference junctions,
feedthroughs, etc. The elimination of such error sources requires con-
siderable care and the use of proper thermometry techniques. In

23
setting up the circuitry for all our systems we worked closely with
representatives of the Instruments and Controls Division of ORNL, and
the steps taken to overcome these problems have already been outlined.
Data Acquisition System Errors
Our primary standard used in measuring thermocouple emf's is a
carefully calibrated Leeds and Northrup K-3 potentiometer. The accuracy
of an individual measurements is given as 0.015% of the measured emf
plus 0.5 iV. Thus at 15000 C (27320F) for a Pt vs Pt-10% Rh thermocouple,
the potentiometer has an accuracy of X, 0.20C (0.360F).
For our MiniZWOK experiments, time and temperature are also recorded
with a Computer Operated Data Acquisition System (CODAS). This device
is calibrated against the K-3 potentiometer at the beginning of each
experiment, and recalibrations immediately after an experiment revealed
no change. Thus, for short periods of time the accuracy of CODAS appears
to be comparable to that of the K-3 itself.
Thermocouple Calibration Errors-
Thermocouple calibration procedures and uncertainty limits were
described in detail in an earlier section. This uncertainty is greatest
at temperatures above the gold point [10640C (19470F)], and we estimate
it to be ±1.50C (2.70F) at 15000C (27320F). Below the gold point the
uncertainty is ±0.80C (1.40F). In situ calibration at the gold point
was conducted in the MiniZWOK oxidation apparatus. This measurement
indicated that the system uncertainty was less than 20 C (3.6 0 F) at
these temperatures.
Temperature Gradients in the Sample
We have no evidence for the existence of temperature gradients
within samples in the critical part of the tubing used as the specimen
in the MaxiZWOK apparatus. The MiniZWOK samples, however, are not
completely isothermal. For example, at 12000C (21920F) we observed a
longitudinal gradient of "' 4VC/cm (70F/cm) from the center to the ends
of the specimens. There is also a circumferential variation (two-fold
symmetry) in temperature. The quadelliptical furnace is built in two

I L[
24
hinged sections that can be opened to allow the insertion of the reac-
tion tube. The hinge and corresponding opening on the other side of the
furnace are located along the vertical center line of two opposed
elliptic hemi-cylindrical reflecting surfaces. The positions of the
cooler regions on a specimen correspond to the positions of the hinge
and opening, leading to the conclusion that these imperfections in the
reflecting surfaces reduce the efficiency of the furnace in these areas.
These temperature gradients cause no particular problem for our
measurements of oxide and alpha layer thicknesses since we simply section
the specimen at the thermocouple tabs and make our metallographic mea-
surements in the immediate vicinity of the tabs where the temperature
is known. We did, however, investigate the possibility that, because
of the Seebeck effect, the existence of such thermal gradients could
lead to the generation in the thermocouple of an additional emf that
is proportional to the temperature difference between the two wires of
the thermocouple at the hot junction.
A calculation was performed for a thermocouple whose hot junction
consists of successive segments of Pt, Ta, and Pt-10% Rh. A temperature
gradient is assumed to exist across the junction with T, > T2 > T3,
T1, T2 and T3 being the temperatures at the Pt/Ta junction, the mid-
point of the Ta segment, and the Ta/Pt-10% Rh junction, respectively.
Let EM and ET be, respectively, the emf's generated by the thermocouple
and a similar thermocouple in which the Ta segment is removed. It can
be shown that
EM ET X (S Ta Spt)(T2- T1) + (STa - SPt/Rh)(T3 - T2) (1)
where the S x's are the appropriate absolute Seebeck coefficients. The
results of this calculation are tabulated in Table 1 for the case
T, - T3 = 10C (1.80F).
The "Worst Case Error" listed in the table was calculated on the
assumption that the thermocouple leads are welded at the edges of the
tabs, thus producing a hot junction length of X' 2 mm. The worst
temperature gradient in our sample is X 0.80C/mm (1.40F/mm), thus
creating a temperature gradient of 1.6°C (2.9°F) across the hot junction.

25
Table 1. Seebeck Effect Temperature Errors
Temperature EM - ET/0C (EM - ET''/")° Worst Case Errora
(0C) (pV/0C) (0C/0C) °(F/OC) (OC) (OF)
900 -13.70 -1.2 -2.2 -1.9 -3.4
1100 -18.60 -1.4 -2.5 -2.2 -4.0
1300 -22.70 -1.9 -3.4 -3.0 -5.5
1500 -26.2 -2.2 -4.0 -3.5 -6.3
aSee text.
In light of these findings we adopted the procedure of welding the
two thermocouple wires together and welding the junction thus formed to
a tantalum tab in the orientation shown in Fig. 2. Thus, for a well-
made thermocouple junction, the error due to the Seebeck effect is
expected to be negligible.
The calculations given above were made for a Pt/Ta/Pt-10% Rh
junction, whereas in actual practice the tantalum tab is attached to
the Zircaloy tube. Thus the Zircaloy might also be expected to con-
tribute to the Seebeck error. We have made a few rough determinations
of the absolute Seebeck coefficient for Zircaloy-4, however, and find
it to be approximately 1 pV greater than that for tantalum. Therefore,
Eq. (1) may also be expected to give a reasonable estimate of the
Seebeck effect temperature error for a Pt/Ta-Zr/Pt-10% Rh junction.
Decalibration of Thermocouples
This problem was discussed in the section on Thermocouple Calibra-
tion Procedures. As stated, we have found no indication of decalibration
during times much longer than the duration of our experiments.
Tab Attachment Effects
As already pointed out, at temperatures above about 1100'C (2012'F)
we find it necessary to insert small tantalum tabs between the Zircaloy
and the thermocouples in order to circumvent the problem of the

_I L
26
low-melting Pt-Zr eutectic. The success of this arrangement obviously
depends on establishing good thermal contact between the tabs and the
specimen, and our normal procedure is to spot weld the tab to the
specimen at several points. However, we have no way of determining
prior to an experiment just how good the tab attachment might be,
although in general it appears quite satisfactory. Note that "tab
attachment effects" represent a special case of thermal shunting.
We have attempted to establish an upper bound for tab attachment
errors in the MiniZWOK apparatus by performing an experiment in which
one measuring thermocouple was attached to the specimen in the normal
fashion while the second thermocouple was spot welded to a tab and the
tab positioned in the approximate center of the specimen tube. Tempera-
ture differences of 9, 11, 10, and 150C (16, 20, 18, and 270F) were
observed at 900, 1100, 1300, and 15000C (1652, 2012, 2372, and 27320F),
respectively. In this experiment the flow rate of helium through the
interior of the specimen was varied from 0 to X 5 cc/s at each tempera-
ture; no change in the thermocouple readings was noted except at 9000C
(16520F) where a temperature drop of loC (1.80F) was noted for the
unattached thermocouple. These results set the maximum limits for
temperature errors due to poor tab attachment.
Our regular experimental procedure requires an examination of
both thermocouples and tabs after each experiment. Any indication of
loose attachment, e.g., if the tab can be pulled loose with a pair of
tweezers, causes us to regard that experiment as suspect. Any accidental
leakage of steam into the interior of the specimen in quantities sufficient
to produce significant oxidation of the thermocouple tabs also leads to
a suspect experiment. Thus, in a normal experiment, errors due to poor
tab attachment are expected to be much smaller than the maxima given
above and should approach zero for good attachments.
One indication of the existence of tab attachment errors may be
obtained by comparing the temperatures indicated by the two measuring
thermocouples. Widely differing values suggest tab troubles. For
example, if the tab to which the control and the first measuring
thermocouple are attached makes poor thermal contact with the specimen,

27
the control thermocouple will sense a temperature lower than that of
the specimen. The temperature of the specimen will thus increase until
the emf required by the controller is generated by the control thermo-
couple. The first measuring thermocouple (attached to the same tab as
the control thermocouple) will indicate approximately the expected
temperature; however, the second measuring thermocouple (assumed to be
well attached) will indicate a relatively high temperature - in this
case the true temperature of the specimen.
The requirement that reasonable agreement exist between the two
measuring thermocouple temperatures is not an absolute measure of tab
attachment quality. Real temperature differences may exist in the
specimen or both tabs may be poorly attached. With regard to the latter
problem, the probability that the thermal attachment of both tabs will
be equally poor seems small, but, clearly, the only real cure for tab
attachment effects is to make sure that good bonding-is achieved between
tab and specimen, and we make every effort to see that that is done.
Evaluation of Temperature Errors
In this section we consider the magnitudes of the total temperature
measurement errors in our experimental systems.
Determinant Errors
Certain parts of the temperature measuring system used with a given
apparatus may be calibrated against external standards, and a quantita-
tive estimate of the error associated with each component can be obtained;
such errors are usually referred to as the determinant errors of the
system. The determinant temperature-errors for our steam oxidation
apparatuses are summarized in Table 2.
Indeterminant Errors
It is considerably more difficult to specify quantitatively the
indeterminant temperature measurement errors associated with our
experimental systems. Indeterminant errors are those related to pro-
cedures or apparatus features not susceptible to direct, independent

Table 2. Determinant Temperature Errors in the MiniZWOK and MaxiZWOK Apparatuses
Error Source Temperature Error, deg, at
9000C 16520F 12000C 2192OF 15000C 27320F(OC) (OF) (00) (OF) (OC) (OF)
Uncertainty relative to IPTS-68 ±0.3 ±0.5 ±0.7 ±1.3 ±1.0 ±1.8
Thermocouple material variability 0.5 0.9 0.5 0.9 0.5 0.9
Potentiometer 0.15 0.28 0.19 0.34 0.24 0.43
Potentiometer readout 0.33 0.59 0.33 0.59 0.33 0.59
Thermal emf in copper leads <0.01 <0.02 <0.01 <0.02 <0.01 <0.02
Reference (ice bath) temperature 0.01 0.02 0.01 0.02 0.01 0.02
TOTAL ±1.3 ±2.3 ±1.7 ±3.2 ±2.1 ±3.7
r'3
(, (__

29
calibration as are, for example, thermocouples. Examples of such errors
include the problems of thermal and electrical shunting, decalibration
of thermocouples, tab attachment effects, and spurious emf's associated
with temperature gradients across the thermocouple hot junctions (the
Seebeck effect).
Indeterminant Errors in MiniZWOK - On the basis of evidence cited
in the section on Potential Errors we felt that indeterminant errors in
temperature measurements in the MiniZWOK apparatus were acceptably small.
The quantification of such errors is, however, extremely difficult, and
the procedure finally adopted for that purpose in the Thermometry Report3
is admittedly rather arbitrary (see also the section on Total Error
Estimates below). For this reason and in consideration of the special
need for accurate temperature measurements in the ZWOK project we
continued throughout the entire program to perform experiments designed
to check our original estimates of ±40C (±70F) and W60C (±110F) as the
maximum total uncertainty in temperature measurements at 900 and 1500%C
(1652-27320F), respectively.
Particularly in the MiniZWOK apparatus, which was used to obtain
the base isothermal oxidation data set, these experimental checks have
been exhaustive. In addition to the external calibrations and tests
already described of the component parts of the thermometry assembly,
in situ tests were performed to evaluate the accuracy of thermometry
measurements under operating conditions. In one such experiment the
calibration of the thermocouples was checked at the gold point [1064.430C
(1947.90F)J. Using a standard MiniZWOK Zircaloy tube specimen, one
recording thermocouple (designated T/C #1) was installed in the usual
fashion, i.e., attached to a Ta tab that was welded to the inside wall
of the specimen. A second recording thermocouple (T/C #2) was formed
by attaching a Ta tab to a length of Pt wire, which was then located in
the center of the specimen along the tube axis out of contact with the
tube walls. One end of a thin gold wire was welded to the back of this
tab, and the other end of the wire was attached to the Ta tab of T/C #1.
The electrical circuit for T/C #2 was completed through the Pt-Rh leg of
T/C #1. The output of both thermocouples was recorded by the CODAS, the

I I i
30
purpose of T/C #2 being to indicate by a loss of electrical continuity
the time at which the gold wire melted. The output of the normal thermo-
couple, T/C #1, served to measure the temperature of the Ta tab at the
moment of melting of the gold. The temperature of the sample was slowly
increased to the expected melting point of gold, and melting occurred at
a temperature of 1064 ± 20C (1947 ± 4-F).
This test shows that the temperature of the thermocouple junction
accurately reflected the temperature of the Ta tab to which it was
attached. It demonstrates the accuracy of the external calibration of
the thermocouples and indicates that all potential sources of error,
save only thermal shunting, are small.
To evaluate thermal shunting errors, a specimen must be held at a
known temperature and that temperature compared to the apparent specimen
temperature as recorded by the thermocouple. This constraint was
satisfied in experiments in which we used the temperatures for the a-a
and a-y transformations in zirconium and iron, respectively, and the
melting point of gold as independent means of establishing the specimen
temperature.
For the ad- transformation in zirconium, a cylinder of crystal-bar
zirconium was machined into a tube having dimensions suitable for use
in MiniZWOK. This specimen was instrumented in the standard manner and
subjected to a steam oxidation experiment using techniques typical of
previous experiments. The initial portion of this experiment (which was
a transient-temperature test) involved a fast heat-up to 1400%C (25520F)
followed by a fast cool to 650'C (12020F). The CODAS output describing
the temperature-time response of the two monitor thermocouples during
this part of the cycle is shown in Fig. 8a. The initial heating rate
of the specimen was 200C/s (360'F/s), and the inflection in the heating
curve shown at about 860%C (1580'F) was a result of the endothermic
alpha-to-beta transformation of the Zircaloy, which, for the pure material,
takes place at 862 ± 50C (1584 ± 90F).

-
31
ORNL-DWG 76-40593
I I 1I I920 -EXPT. NO. S-ZOO
PURE Zr SPECIMEN_ 88 0 X 4 MINIZWOK APPARATUS
gr860 to840 -
8005 6 1 22 23 24 25 26
TIME (sec)
Fig-8a. Time-Temperature Excursion for Pure Zr Specimen in MiniZWOKApparatus. Note heating and cooling rates and a/I3 transition tempera-tures indicated by tab-mounted thermocouples.
The iron a-y phase transition experiment was performed in a some-
what similar manner. A sheet of high purity iron* was formed into a tube
of the same dimensions as a standard MiniZWOK specimen, and the thermo-
couples were welded directly to the specimen. The thermal arrest
obtained on heating through the a-y transition at a heating rate of
,,13°C/s occurred at 912.7 +0.1°C (1674.9 ± 0.2°F). While iron is by no
means a standard reference material for temperature calibration, the
accepted value for the a-y transition temperature is 912'C (1674°F).
*Marz Iron obtained-from Materials Research Corp. Vendor certifiedanalysis (ppm by wt): 12 C, 60 O. 1.0 H. 10 N. <0.1 Al, 1.6 Na, 0.87 Mg,0.70 P. 2.60 S. 0.80 Cl, 1.80 K, 0.80 Ca. 1.40 Ti, 0.60 Cu. <0.10 Si,1.60 Cr. <0.10 Ni, 1.90 Zn, <0.10 Ga, <0.10 Zr, <0.10 Nb, <0.10 Mo,<0.10 Pd. <0.10 Ag, <0.10 In, <0.10 Sn, <0.10 Sb, <0.10 Ta, <0.10 Pt,<0.10 Au, <0.10 Pb, others <0.10.

I IV
32
Perhaps the most convincing evidence that thermal shunting errors
were negligible in the MiniZWOK apparatus was provided by a test in
which the specimen was held at the gold melting temperature. In order
to avoid any lowering of the gold melting point as a result of the for-
mation of a Au-Zr solid solution, this measurement was carried out in a
special "Zircaloy oxide crucible" made by arranging a standard PWR
Zircaloy-4 specimen concentrically inside a BIWR tube of the same length,
both tubes being held in a Zircaloy jig as shown in Fig. 8b. Because
of the greater diameter of the BWR tube, an annular space approximately
0.075 cm (0.030 in.) was formed between the two tubes. The resulting
"specimen" was then instrumented in the standard fashion and mounted in
the MiniZWOK apparatus where the outer and inner BWR- and outer PWR-tube
surfaces were oxidized in pure oxygen at "10000C (18320F) to form surface
oxide layers %30 pm thick. The net result of this treatment was the
conversion of the annular region of the sample into a "Zircaloy-oxide"
ORNL-DWG 77-10953
1.4 cm
/ rBWR TUBING
4 v SPWR TUBING
iZIRCALOY"OXIDE
\ ZIRCALOY JIG./-THERMOCOUIPLE
Fig. 8b. Schematic Drawing of the "Zircaloy Oxide Crucible" Usedin the Gold-Point Determination.

33
crucible. Next the specimen-crucible was removed from the apparatus, a
gold foil of melting-point-standard purity* was inserted into the annular
crucible, and the entire assemblage was placed back in the MiniZWOK
apparatus. The subsequent melting of the gold was done with flowing
helium as an environment. The specimen was first driven through the
melting point of gold to bring the gold into intimate contact with the
oxide surface and then again driven through the transient pictured in
Fig. 8c. This mode of heating was identical to that in an oxidation
experiment except that when the temperature reached the melting point
of gold, a thermal arrest occurred, causing the oxide-gold interface
to be at a fixed and known temperature of 1064.4.3 It is at this time
*Marz Gold obtained from Materials Research Corp. Vendor certifiedanalysis (ppm by wt): 15C, <5.0 0, <1.00 H, <5.0 N, 0.20 Al, 0.10 Na,0.02 Mg, <0.01 P, 0.13 S, 0.16 Cl, 0.40 K, 0.30 Ca, 0.01 Ti, 0.73 Fe,1.30 Cu, 0.51 Si, <0.01 Cr, 0.05 Ni, 0.05 Zn, 0.06 Mo, 0.25 Pd, 4.20 Ag,<0.01 Sn, 0.02 Sb, <0.01 Pb.
ORNL-DWG 77-12042
1100
00 1050
1000
9500 10 20 30 40 50
TIME (sec)60
Fig. 8c. Time-Temperature Excursion for Gold-Pointin the MiniZWOK Apparatus.
Determination

____ ___ ___ ____ ___ ___ ___I LI
34
that the difference in the recorded thermocouple temperature and the
gold point is precisely the thermal shunting error. As is illustrated
in Fig. 8c, the thermal arrest at the gold point lasted for approximately
nine seconds, and with the temperature monitoring capability of CODAS,
seventy-five temperature measurements were made over this time interval,
the average temperature indicated by the thermocouple being 1064.4 ± 0.3°C.
Attempts were also made to perform an in situ nickel-point deter-
mination using the "Zircaloy-oxide" crucible and by other approaches.
In all cases, however, severe experimental difficulties were encountered,
for example, the melting down of the crucible as a result of the alloying
of the nickel and Zircaloy when the oxide coating on the crucible either
cracked due to thermal strains or because the oxide dissolved into the
underlying Zircaloy as the sample was heated to the Ni melting tempera-
ture. For this reason we were unable to obtain a completely unambiguous
comparison between indicated thermocouple temperatures and actual specimen
temperatures at the upper end of the temperature range investigated.
Nonetheless, the rather remarkable results obtained for the transforma-
tion temperatures of Zr and Fe and the melting point of gold strongly
suggest that thermal shunting effects in the MiniZWOK apparatus were
essentially negligible and that our estimates of maximum total tempera-
ture measurement uncertainties are valid and, if anything, somewhat
conservative.
Indeterminant Errors in MaxiZWOK - Again for reasons already given,
we believe that electrical shunting and thermocouple decalibrations
errors are negligible in this apparatus. Errors due to thermal shunting
are also very small for isothermal experiments, although we estimate
that such errors may reach 500 (90F) in our "mixed temperature" experi-
ments where the furnace temperature exceeds the steam temperature. The
relative ease with which thermocouples may be installed and the absence
of significant thermal gradients in this apparatus tend to minimize both
the tab and Seebeck effects.
Total Error Estimates
The total temperature error for a given apparatus is the sum of
the determinant and indeterminant errors for the system. The determinant
errors for the MiniZWOK and MaxiZWOK apparatuses are listed above and we
35
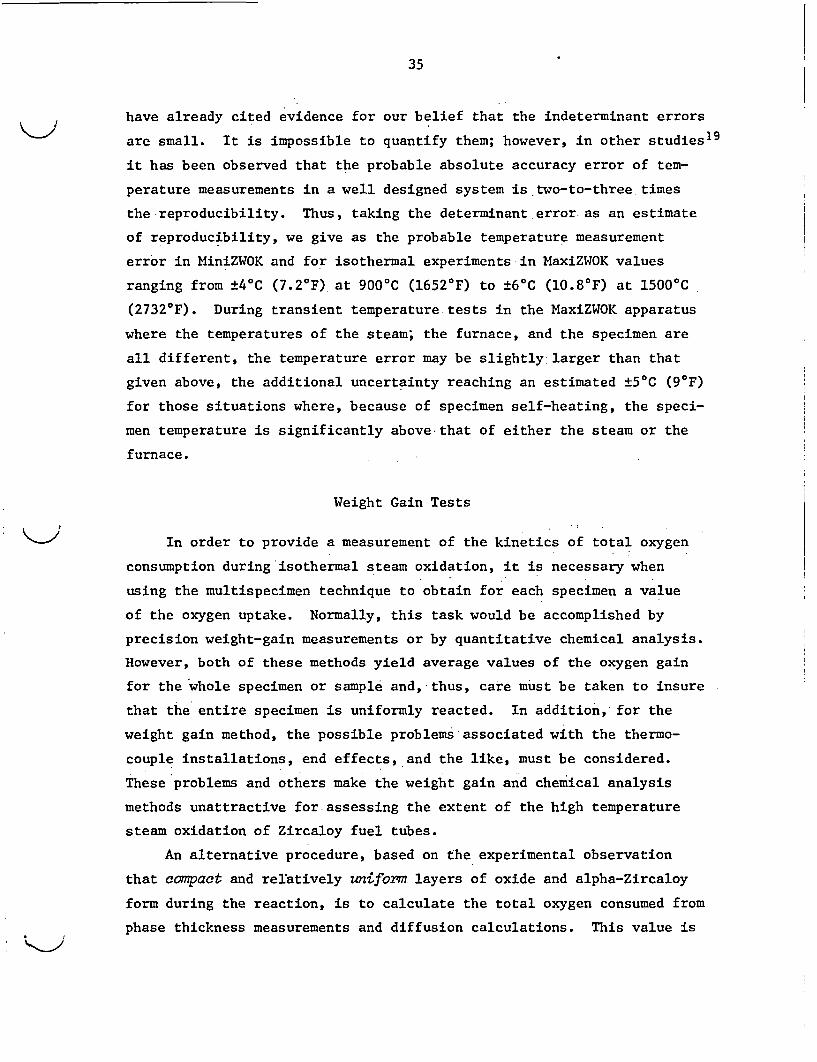
have already cited evidence for our belief that the indeterminant errors
are small. It is impossible to quantify them; however, in other studies19
it has been observed that the probable absolute accuracy error of tem-
perature measurements in a well designed system is two-to-three times
the reproducibility. Thus, taking the determinant error as an estimate
of reproducibility, we give as the probable temperature measurement
error in MiniZWOK and for isothermal experiments in MaxiZWOK values
ranging from W40C (7.20F) at 900%C (16520F) to W60C (10.80F) at 15000C
(27320F). During transient temperature tests in the MaxiZWOK apparatus
where the temperatures of the steam; the furnace, and the specimen are
all different, the temperature error may be slightly larger than that
given above, the additional uncertainty reaching an estimated ±50C (90F)
for those situations where, because of specimen self-heating, the speci-
men temperature is significantly above that of either the steam or the
furnace.
Weight Gain Tests
In order to provide a measurement of the kinetics of total oxygen
consumption during isothermal steam oxidation, it is necessary when
using the multispecimen technique to obtain for each specimen a value
of the oxygen uptake. Normally, this task would be accomplished by
precision weight-gain measurements or by quantitative chemical analysis.
However, both of these methods yield average values of the oxygen gain
for the whole specimen or sample and,-thus, care must be taken to insure
that the entire specimen is uniformly reacted. In addition, for the
weight gain method, the possible problems associated with the thermo-
couple installations, end effects, and the like, must be considered.
These problems and others make the weight gain and chemical analysis
methods unattractive for assessing the extent of the high temperature
steam oxidation of Zircaloy fuel tubes.
An alternative procedure, based on the experimental observation
that compact and relatively uniform layers of oxide and alpha-Zircaloy
form during the reaction, is to calculate the total oxygen consumed from
phase thickness measurements and diffusion calculations. This value is'<

I y
36
obtained by computing the total oxygen associated with the oxide, alpha,
and (prior) beta layers, and subtracting from this the amount of oxygen
originally in the specimen. A basic assumption is that equilibrium
values of the oxygen concentrations apply at the various interfaces.
(It is common in calculations of this type to consider the oxide to be
completely stoichiometric rather than having an oxygen gradient across
it. Since the defect structure of Zircaloy oxide is not well established,
a "conservative" estimate of total oxygen is obtained if the oxide is
assumed to be stoichiometric. Unless otherwise noted, as in the case
for calculating diffusion coefficients, we will report values of total
oxygen based on stoichiometric oxide. Furthermore, linear oxygen con-
centration gradients are assumed for the alpha phase, and a simplified
diffusion calculation is used to determine the amount of oxygen in the
beta phase. The accuracy of the latter calculation was checked for
several cases by a more sophisticated method and was found to be
satisfactory.)
We selected the following expressions to represent the equilibrium
solubility and diffusivity values for the Zircaloy-4-oxygen system over
the temperature range of our experiments:
a. The concentration of oxygen in the oxide at the gas interface
(stoichiometric oxide):
Cox/ga - 1.511 g/cm3 . (Ref. 20)
b. The concentration of oxygen in the oxide at the alpha phase
interface (used in calculations where an oxygen concentration gradient
across the oxide is considered):
C x/a = 1.517 - 7.5 x 10⁻⁵ T ['K] g/cm3 (Ref. 21)
c. The concentration of oxygen in the alpha phase at the oxide
interface:
Ca/ox = 0.4537 g/cm3 . (Refs. 22 and 23)

37
d. The concentration of oxygen in the alpha-phase at the beta
phase interface:
Cf = [-0.2263 + (T 1/2 3. C/$~ [0.263+ 63.385 - 16.877) ] .0649 g/cm3 (Ref. 24)
(T > 10730K)
e. The concentration of oxygen in the beta phase at the alpha
phase interface:
/ - 1081.7 .0649 g/cm3C/ = 491.159 (Ref. 24)
(T > 13730K)
C/a = [-.00428 + (T[FK - 3.1417)1/2] .0649 g/cm3 (Ref. 24)
(12330K < T < 13730F)
f. The diffusivity of oxygen in the beta phase:
D$ = .0263 exp(-28,200/RT['K]) cm2/s . (Ref. 4)
A direct comparison of the total oxygen values obtained by weight-
gain measurements and by calculations based on the metallographic phase
layer measurements is given in Table 3. These four experiments were
Table 3. A Comparison of Values for Total Oxygen Consumption byWeight-Gain and Metallographic Measurements. Oxidation of
Batch B PWR tubes in steam at 1200%C (21920F).
Layer Thickness Total Oxygen ConsumedTime Oxide Alpha Weight Gain Metallography(s) (Pm) (Pm) (mg/cm2) (mg/cm2)
62 25.3 33.0 5.31 5.29
142 36.5 50.8 7.61 7.76
171 38.9 51.7 8.17 8.22
188 41.4 57.0 8.73 8.80

lLL
38
conducted in an early version of the MiniZWOK apparatus, and particular
attention was paid to the weighing procedures for the specimen before
and after oxidation. The measured and calculated oxygen consumption
values are seen to exhibit very good agreement for each case, and we
regard this as further evidence that the metallographic method and
associated computational procedures are acceptably accurate, at least
for oxidation under isothermal conditions.
Characterization of Zircaloy-4 PWR Tube Specimens
The bulk of the oxidation experiments carried out in this program
were conducted with Reactor Grade Zircaloy-4 PIWR tubing from Sandvik
Special Metals Corporation. This material was part of a larger quantity
purchased specifically for use in a number of fuel cladding research
programs sponsored by the Division of Reactor Safety Research of the
Nuclear Regulatory Commission. The specifications and characterization
of this tubing have been published previously25 and will not be con-
sidered here. The partial chemical analyses of this material, along
with comparative values from a second lot, designated Batch B, is
presented in Table 4. The ORNL analyses for Fe and Cr were determined
Table 4. Nominal Analysis of Zircaloy-4 PWR Tubes Used inZWOK Steam Oxidation Experiments
ORNL Analysis ORNL Analysis Vendor Analysis Vendor AnalysisElement Batch B Tubes Sandvik Tubes Sandvik Tubes Sandvik Ingot
Sn 1.3 wt % 1.6 wt % 1.47 wt %
Fe 0.22 0.25 .21
Cr 0.10 0.12 .12
Ni <.02 <.0035
Si <.0015 .0080
0 1250 ppm 1200 ppm 1220 ppm 1240 ppm
C 100 90 110
N 15 30 33 32
H 15 25 20 5

39
by isotope dilution spark-source mass spectrometry-methods with a
probable error within 5 to 10% of the reported value. The Sn concen-
tration was determined photoelectrically with an uncertainty of about
5% of the reported value. The agreement between the vendor and ORNL
analyses for the Sandvik tubing is seen to be quite good. The concen-
trations of the metallic alloying elements in the Batch B material show
some small differences compared to the Sandvik tubing. The Batch B
tubing was used only in the preliminary oxidation studies and for one
of the scoping test sequences. The tube dimensions (Sandvik:
1.092 cm OD, .0635 cm wall thickness; Batch B: 1.067 cm OD, .0686 cm
wall thickness) were such that either could be used in our apparatuses
without modification.
EXPERIMENTAL RESULTS FOR ISOTHERMAL OXIDATION
The main objective of the Reaction Rate Task of the Zirconium
Metal-Water Oxidation Kinetic Program was to provide a basic set of
isothermal oxidation rate parameters for Zircaloy-4 in steam at temper-
atures from 900 to 1500 0C (1652 to 27320 F) obtained under carefully
controlled experimental conditions. A number of scoping tests were
also conducted. These were designed to establish the effect on the
isothermal rate of oxidation of Zircaloy-4 of (a) the steam injection
temperature, (b) steam flow rates, (c) the presence in the steam of
gaseous impurities such as oxygen, hydrogen, and nitrogen, and (d) small
variations in alloy composition. (Scoping tests of the effect of steam
pressure are presently in progress and their results will be described
in a subsequent report.) In addition, a number of transient- -
temperature oxidation tests were performed in order to provide a basis
for testing our code predictions based on the isothermal data.
The primary data set for isothermal oxidation was obtained using
the MiniZWOK oxidation apparatus. -This-apparatus proved to be extremely
versatile and was also used for many of the scoping tests. The MaxiZWOK
apparatus provided scoping test information (steam flow rate and insertion
temperature) for oxidation at the lower temperatures of interest. A few
"mixed-temperature" experiments, where the steam and furnace were

I LL
40
maintained at different temperatures, were also conducted in this
apparatus.
Primary Isothermal Data Set - MiniZWOK Apparatus
The kinetics of the reaction between the standard batch of Sandvik
Zircaloy-4 PWR fuel tubes and steam were studied under essentially
isothermal conditions over the temperature range 900-1500%C (1652-27320 F)
at 50%C (90'F) intervals. The MiniZWOK oxidation apparatus was utilized
to produce series of oxidized specimens that were then examined by
metallographic methods in order to obtain the basic kinetic parameters.
For each temperature investigated, at least ten specimens were oxidized.
The maximum oxidation time at each temperature was chosen to enable an
accurate description of the kinetics to be obtained yet to avoid problems
that arise at longer oxidation times where excessive oxygen solution in
the beta phase occurs.
Most of the data-gathering procedures have been discussed in detail
in previous Quarterly Reports.1 We will include here a general des-
cription of the techniques used emphasizing only those points that have
not previously received attention. The procedures outlined in the
preceeding chapter of this report describing the apparatus were followed.
For all of the experiments involved in the primary data set, the steam
flow rate was set at approximately 30 g/min (0.066 lb/min) corresponding
to a linear velocity of about 1 m/s (3 ft/s) past the specimen in the
apparatus.
Time-Temperature Cycles
The time-temperature cycles used to approximate the isothermal
exposures were set into the programmer for the temperature controller
prior to each experiment. Generally these experiments involved heating
the specimens to the desired temperature at rates in excess of 100'C/s
(180'F/s), holding the specimen at constant temperature, within about
+10C, for the required time, and finally cooling the specimen at
initial rates greater than 100'C/s (180'F/s). Two time-temperature
curves illustrating typical isothermal experiments are shown in

-
41
Figs. 9 and 10. A comparatively low-temperature, long-time experiment
is shown in Fig. 9, which is taken from a recorder trace of an oxidation
experiment conducted nominally at 1100'C (2012'F). The high degree to
which this cycle approximates an isothermal exposure is clear. Figure 10
is a similar recorder trace for a high-temperature, short-time experiment.
While equally fast heating and cooling rates were employed here, the very
short time-at-temperature suggests that a significant fraction of the
total oxidation process occurred during heating and cooling. It was
considered necessary to account for these contributions in all the iso-
thermal experiments. This process requires an accurate record of the
complete time-temperature cycle.
The connection of the CODAS to the temperature measuring circuit of
the MiniZWOK apparatus permitted a complete and sensitive record of the
I
ORNL-DWG 75-I7705
1 100
1000
900
800
0*. 700
< 600w0.
w_ 500
400
300
200
1000 60 120 180 240 300
TIME (sec)
360 *420 480
Fig. 9. Recorder Trace of Time-Temperature Record for a TypicalMiniZWOK Experiment at 11000C (2012'F). Inset shows fine scale tempera-ture fluctuations as recorded by CODAS.

IL i
42
ORNL-OWG 76-506015
14
13
12
E
W0
0
'i
io
9
8
7
60 5 10 45
TIME (sec)
20 25
Fig. 10. Time-Temperature Excursion for Isothermal Oxidation
Experiment in MiniZWOK Apparatus at Approximately 1400'C (2552 0F).
Main curve is drawn from recorder trace; inset curve is drawn fromdata taken from CODAS.

43
time-temperature history of each experiment to be obtained. The inter-
face circuitry was designed so that the temperatures sensed by the two
monitor thermocouples could be measured. Thermocouple emf's could be
gathered by the computer in time steps as small as 50 ms over the entire
duration of the experiment, stored, and recalled on demand. The CODAS
computer converted thermocouple emf's to temperature according to the
calibration for our Pt vs Pt-10% Rh thermocouples,3 and frequent
standardization procedures showed that the accuracy of the system was
equivalent to that of the Leeds and Northrup K-3 potentiometer. Both
teletype printout and paper tape records of the experiment histories
were utilized. The paper tape record was subsequently used in a com-
puter program, discussed below, for the normalization of the time-
temperature data and the establishment of effective times-at-temperature
for each set of isothermal experiments.
Normalization of Time-Temperature Excursions
The experimental determination of an isothermal rate constant using
a multispecimen technique - where a change in a parameter is measured as
a function of time - requires considerable care to insure that all
variables, save time, are equivalent for each measurement. For "iso-
thermal" experiments in either of our oxidation apparatuses, the problem
is two-fold. First, the heat-up, cool-down, and stabilization times
frequently constitute significant departures from isothermal conditions;
secondly, it is rare that any two experiments result in precisely the
same equilibrium temperature. These difficulties can be circumvented
by appropriate normalization of each of the individual time-temperature
excursions to an equivalent isothermal excursion at some assigned,
representative temperature.
The normalization is accomplished in a manner identical to that
employed by diffusion researchers to compensate for heat-up times and
small differences in annealing temperatures.26 If we assume that the
rate constants for the kinetic parameters of interest in the steam
oxidation of Zircaloy-4 are represented by Arrhenius relationships, we
can write for any known time-temperature excursion:

I LL
44
tf exp[-Q/RT(t)] dt
t(eff) = exp[-Q/RT (ff) (2)
where
t(eff) equivalent time, s, at an assigned temperature, T(ff)'
T(ff) = assigned temperature, OK,
T(t) = actual temperature, OK, as a function of time, t,
Q = activation energy (rate constant) cal/g-mol,
R = gas constant, 1.987 cal/g-mol-'K,
t = time, s.
This expression permits the calculation of the equivalent reaction time,
t(eff) at an arbitrary constant temperature, T(eff). for any given
temperature-time excursion. We have written a simple computer program
that accomplishes the above calculation.
For each set of isothermal experiments conducted in the oxidation
apparatuses, the average temperature of the set was determined, and the
equivalent time at that temperature was calculated according to Eq. (2)
for each experiment. In these calculations, an activation energy of
40 Kcal/mol was assumed to apply for each rate process. However,
sensitivity tests showed that the time corrections to most experiments
varied only slightly for values of Q in the range of 30 to 50 Kcal/mol.
Moreover, as part of a later iterative calculation check, rate constants
were computed for oxide and alpha layer growth at 1253 and 1504%C
(1287-27390F) using the actual Q values for each. The average change in
the range constant observed using the iterative method for computation
of the times was less than 0.5%; thus, we have concluded that Eq. (2)
performs accurate normalizations of the time-temperature excursions
using a mean value for the activation energy. Of course, the magnitude
of the correction and its sensitivity to the precise values of the
activation energy will depend upon the exact shape of the time-temperature
cycle in relation to the desired isothermal.
The calculations of the effective oxidation times according to
Eq. (2) were performed by computer. The CODAS system provided the
basic time-temperature function, T(t), which, for the very-short-time

.
45
experiments at the highest temperature, consisted of temperature readings
on each thermocouple every 50 ms. For longer experiments the CODAS
input to the program was appropriately modified with no appreciable loss
in accuracy. It should be pointed out that where temperature differences
existed between the monitor thermocouple positions during oxidation on
a single specimen, the equivalent-times associated with each position
were generally different. The self-consistency of the calculated
effective oxidation times in such cases was regarded as further evidence
of the accuracy of our temperature and layer-thickness measuring procedures.
Metallographic Procedures
In order to establish the growth kinetics of the oxide and oxygen-
stabilized alpha phases, it is necessary to measure accurately the
phase thicknesses on each specimen. Standard metallographic techniques
were relied upon to accomplish these measurements. Each oxidized
specimen was carefully sectioned in the transverse direction with a
slow-speed, diamond-impregnated wheel. The section was then mounted in
an epoxy resin mixture containing 40% (by weight) of 1 pm alumina
particles (Linde C) to aid in edge preservation during subsequent
polishing. Polishing was accomplished in two stages using a Syntron
vibratory polisher. The first stage consisted of a 24 hr polishing
period using 0.3 pm alumina (Linde A) on a new Buehler Pellon polishing
cloth. This was followed by a 12 to 36 hr period using 0.5 pm diamond
paste on a standard nylon polishing cloth. This procedure proved
particularly effective in preserving edges and the fine-structure
associated with the oxide layer.
For oxidation temperatures above about 1050%C (19220F) there
was no serious problem in defining the phase boundaries during
subsequent metallographic examination of specimens oxidized for
relatively short times. However, in comparatively long-time
oxidations, specimens exhibited irregular "incursions" of alpha
that affect an-observer's ability to define precisely the position of
the alpha-beta interface. Similarly, at lower oxidation temperatures,
notably for the series of specimens oxidized between 900 and 1000'C
(1652 and 18320F), the alpha-beta boundary was poorly defined, and a

I LL
46
certain degree of arbitrariness was involved in fixing its position. We
found that the degree of arbitrariness could be lessened by utilizing an
etch-anodization procedure to prepare the specimen for examination. This
procedure led to an improved definition (by interference color) between
the high-oxygen alpha phase and the low-oxygen (prior) beta phase in the
specimen. Measurements made in bright-field illumination using this
technique were more consistent, and variations in measurements made by
different individuals were greatly reduced. The method was also suitable
for examining specimens oxidized at the higher temperatures.
The etch-anodization procedure is as follows. The polished specimen
is etched for 10 to 15 s with swabbing and agitation in a diluted Kroll's
etchant consisting of 4 ml conc. HN0 3 and 2 ml conc. HF per liter of water.
The specimen is then anodized in a 1% KOH solution to 20 v and held at
this potential for 120 s by which time the current drops essentially to
leakage levels. Color micrographs are useful to illustrate the advantages
of this treatment; however, the improved sharpness of the alpha/beta
boundary is clearly evident even in the micrographs shown in Figs. 11
and 12, which are from cross-sections of specimens oxidized at 900 and
10050C (1652 and 1841'F).
Representative layer thickness measurements were determined for
each specimen. Several different measurement schemes were investigated
for obtaining these values, and both an image-shearing eyepiece and a
standard filar micrometer eyepiece have been utilized. The measurements
reported here were obtained using a calibrated filar micrometer eyepiece
on a small Bausch and Lomb bench metallograph.
Phase Thickness Measurements
After each steam-oxidation experiment was completed, the specimen
was removed from the apparatus, sectioned on a diamond-impregnated wheel,
mounted in epoxy, polished, and prepared for metallographic examination
by the etch-anodization treatment previously described. Care was taken
to insure that the final polished section was at the elevation which
included the weld positions of all three thermocouple installations.
Thus, the phase thickness measurements could be made in very close
proximity to the monitor thermocouple locations. In the light of the

-
47
Fig. 11. Cross-Section of Zircaloy-4 PWR Tube Oxidized in theMaxiZWOK Apparatus for 858 s at 900'C (1652 0F) (Expt. MAX-17). Outersurface. Etch-anodized specimen. Bright field illumination. 750x.
/__ ___
Fig. .12. Cross-Section of Zircaloy-4 PWR Tube Oxidized in theMaxiZWOK Apparatus for 99 s at 10050C (18410F) (Expt. MAX-23). Outersurface. Etch-anodized specimen. Bright-field illumination. 750x.

-- t 1*r
48
general observation that the temperature (and thus the product layer
thicknesses) of the specimens oxidizing in MiniZWOK exhibited a circum-
ferential variation, it was important to associate each phase thickness
measurement position with a point on the specimen having a known time-
temperature history.
The two monitor thermocouple stations on each specimen were always
located in the same relative position with respect to the heating lamps
within the furnace. These positions were generally the "hot" positions,
and, thus, the extent of the temperature variation around a specimen
could only be determined by rotating the specimen (or furnace) during
oxidation or inferred by measuring the circumferential variation in
product layer thicknesses after the experiment. At low temperatures,
these variations were small. A plot of oxide and alpha layer thicknesses
after oxidation at 11530C (21070F) as a function of angular position on
ORNL-DWG 76-40599
EXPT. S-71 130 105 sec AT 1153 0C (ALPHA)
EA 2lA A-
AL A A' A
~26(n
Z L
~222
I 32 1(OXIDE)
~28 "- '6_ _ ___
240 60 120 480 240 300 360
POSITION (RELATIVE TO TC NO. 2) (deg)
Fig. 13. Variation in Oxide and Alpha Thicknesses on Specimen S-71,Oxidized Nominally 105 s at 11530C (2107'F). Thermocouple No. 2 locatedat approximately 0° and thermocouple No. 3 at approximately 1800.

- -
49
the circumference of the specimens is presented in Fig. 13. While the
periodicity is evident, the magnitude of the variation is seen in this
case to be little more than the normal data scatter. At higher tempera-
tures, the effect was generally more pronounced. Figure 14 illustrates
the variation observed after an experiment at 15040C (27390F). Although
in this case the temperature-time cycles recorded by the two monitor
thermocouples (thermocouples Nos. 2 and 3) located at approximately 0
and 180 degrees were virtually the same, the thickness variations observed
over the whole specimen imply that a maximum temperature variation of
about ±15'C (270F) existed. The periodicity of the temperature variation
is consistent with the furnace geometry, and "cold" positions correspond
to the location of the two furnace seams. A case where the two monitor
thermocouples registered different temperatures is shown in Fig. 15.
Here, the measured temperature difference accounted accurately for the
72 ORNL-DWG 76-40600
EXPT. S-137
68 23sec AT 15040C (ALPHA)
Aj~64A.A!
E A AZL A
N A
LiX AA / A
~5 6A_ _ _ _ _ _ _ _ _ _ _ _
cc50
< (OXIDE)'46
42 --- j
3 8 -0 _ _ _ _ _ _ _ _ _ _ _
0 60 i20 M80 240 300 360
POSITION (RELATIVE TO TC NO.2) (deg)
Fig. 14. Variation in Oxide and Alpha Thicknesses on Specimen S-137,Oxidized Nominally 22 s at 1504%C (27390F). Thermocouple No. 2 locatedat approximately 0° and thermocouple No. 3 at approximately 1800.

I L
50
ORNL-DWG 76-40598YIz
88
E 84::t.
en
U,i 0
I 76a: 68
j 64
60
EXPT. S-136 I A-_A
NA 47 sec AT 1504 0C _ _
'A AA~A A A
= =(ALPHA)
00
(OXIDE)
-_
Jo
0 60 i20 180 240 300 360POSITION (RELATIVE TO TC NO.2) (deg)
Fig. 15. Variations in Oxide and Alpha Thicknesses on Specimen S-136,Oxidized Nominally 47 s at 1504'C (27390F). Thermocouple No. 2 locatedat approximately O0 and thermocouple No. 3 at approximately 1800.
measured phase thickness difference. The maximum variation in layer
thicknesses over the whole specimen can be accounted for by a temperature
variation of about ±200C (360F).
The existence of circumferential variations in temperature about a
specimen made it mandatory that layer thickness measurements be made at
points where the temperature is well known. Thus, layer thicknesses were
measured to coincide with each of the monitor thermocouple positions. In
order to reduce errors in the thickness measurements, the average of seven
measurements made at 50 intervals ±150 from each thermocouple position was
used.
Results
The procedures outlined above were used to obtain measurements of
oxide layer thickness and alpha layer thickness as functions of time
for each temperature investigated. In addition, the oxygen uptake for

-
51
each specimen was calculated from the layer thickness measurements on
the basis of the model discussed earlier that assumed that all the
oxide was stoichiometric, that a linear oxygen concentration gradient
existed in the alpha layer, and that a simple diffusion calculation
would suffice for determining the amount of oxygen in the beta phase.
The data obtained in this phase of-our investigation are presented
in Tables 5 to 17. We have discarded the results of experiments only
when the experiment was obviously flawed. These were very few in number.
The results of certain of the other experiments, also few in number, may
be regarded statistically as "outliers" but have nevertheless still been
included in the present data set. Additionally, for oxidation measure-
ments at and above 1400'C (25520F) instrumentation changes permitted
complete and independent measurements of time and temperature at two
positions on each specimen. For experiments below this temperature,
only measurements at the No. 2 thermocouple position were considered
in the analysis.
Table 5. Steam Oxidation of Sandvik Zircaloy-4 PWRTubing at 905'C (1661'F)
IK-~
E N Time Layer Thickness Total Oxygen(s) Oxide Alpha Consumed
(PM) (PM) (gc 2
S-15 791.9 13.5 13.2 2.37
S-16 776.6 13.8 13.5 2.42
S-17 2088.7 17.4 18.2 3.08
S-18 1148.8 15.8 16.5 2.80
S-19 420.3 11.5 9.4 1.97
S-20 2088.7 17.7 18.3 3.13
S-21 1228.2 15.1 14.1 2.63
S-22 1509.5 17.0 20.4 3.08
S-23 1623.4 17.2 21.0 3.12
S-24 370.7 11.2 10.0 1.94
, A-�

I 1
52
Table 6. Steam Oxidation of Sandvik Zircaloy-4 PWRTubing at 9560C (1752.8°F)
Time Layer Thickness Total OxygenExpt. No. Tim Oxide Alpha Consumed
(DM) (PM) (Mg/cm2)
S-49 1344.9 26.5 24.1 4.62
S-50 977.9 23.1 18.9 3.97
S-51 1595.7 26.2 25.2 4.61
S-52 690.6 21.3 15.7 3.62
S-53 774.6 22.5 16.9 3.83
S-54 1300.2 25.1 22.3 4.37
S-55 948.7 22.0 19.9 3.83
S-56 1634.5 26.3 26.4 4.65
S-57 412.2 17.9 13.0 3.04
S-58 428.7 18.0 15.3 3.11
Table 7. Steam Oxidation of Sandvik Zircaloy-4 PW4RTubing at 10010C (1833.80F)
Time Layer Thickness Total OxygenExpt. No. (s) Oxide Alpha Consumed
(Oim) (pm) (mg/cm2)
S-37 1130.5 40.5 23.7 7.04
S-38 725.2 32.6 23.1 5.77
S-39 301.1 22.5 15.2 3.95
S-40 925.0 37.4 24.6 6.57
S-41 300.2 20.9 14.4 3.69
S-42 483.4 26.5 18.0 4.67
S-43 678.6 29.9 20.8 5.30
S-44 1104.1 38.6 26.1 6.81
S-45 915.5 34.5 24.6 6.13
S-46 475.7 25.9 17.6 4.57
S-47 493.4 27.1 19.5 4.80
S-48 299.4 21.3 13.8 3.73

53
Table 8. Steam Oxidation of Sandvik Zircaloy-4 PWRTubing at 1050%C (19220F)
Time Layer Thickness Total OxygenExpt. No. s)Oie ApaConsumed(s) Oxm)e (lpma (mg/cm2)
S-59 576.4 40.7 32.7 7.50
S-61 518.6 38.6 24.3 6.93
S-62 663.5 43.1 35.6 7.98
S-63 351.4 32.1 27.7 5.97
S-64 482.7 37.4 27.6 6.83
S-65 338.6 30.9 24.5 5.69
S-66 833.2 48.4 36.0 8.85
S-67 763.0 44.7 35.7 8.26
S-68 204.7 24.2 23.4 4.57
S-69 209.0 24.6 23.4 4.63
Table 9. Steam Oxidation of Sandvik Zircaloy-4 PWRTubing at 1101%C (2013.80F)
Time Layer Thickness Total OxygenExpt. No. Consumed(s) Oxide Alpha (mg/cm2)
(Pm) (Pm)
S-25 495.6 45.7 41.6 8.77
S-26 252.7 33.5 33.0 6.49
S-27 313.4 36.6 36.6 7.12
S-28 512.4 47.1 45.4 9.10
S-29 348.1 37.2 37.0 7.25
S-30 383.4 40.8 37.1 7.82
S-31 252.1 33.3 24.5 6.22
S-32 159.5 26.0 23.1 4.97
S-33 173.9 29.4 26.9 5.61
S-35 449.3 45.7 43.5 8.79
S-36 458.9 44.6 44.5 8.66

I iI
54
Table 10. Steam Oxidation of Sandvik Zircaloy-4 PWRTubing at 11530 C (2107.40F)
I
Time Layer Thickness Total OxygenExpt. No. Consumed
(S) Oxide Alpha (mg/cm2)(pm) (pm)
S-70 269.5 43.0 40.6 8.42
S-71 104.8 28.9 27.9 5.64
S-72 343.3 50.2 47.7 9.82
S-73 193.7 37.6 38.0 7.42
S-74 339.0 48.9 46.7 9.59
S-76 249.4 42.4 42.6 8.36
S-77 108.6 29.1 29.5 5.73
S-78 169.9 37.0 37.4 7.27
S-79 388.2 53.2 46.5 10.29
S-80 29.6 16.8 15.8 3.24
S-81 29.9 16.9 15.9 3.26
Table 11. Steam Oxidation of Sandvik Zircaloy-4 PW4RTubing at 1203%C (2197.40F)
T Layer Thickness Total OxygenExpt. No. Consumed
(S) Oxide Alpha (mg/cm2)(PMn) (pm)
S-82 236.4 49.4 53.5 10.03
S-83 160.2 42.8 44.7 8.59
S-84 126.6 38.9 41.0 7.81
S-85 280.2 53.5 54.9 10.78
S-86 234.6 50.2 51.6 10.09
S-88 56.1 26.6 28.2 5.33
S-89 171.8 43.2 44.0 8.66
S-90 66.1 28.6 30.9 5.75
S-91 111.2 37.2 39.7 7.46

55
Table 12. Steam Oxidation of Sandvik Zircaloy-4 PWRTubing at 12530C (2287.40F)
Time Layer Thickness Total OxygenExpt. No. (s) Oxide Alpha Consumed
(s)Pxid AlPha (mg/cm2)
S-92 240.3 59.2 67.2 12.30
S-93 189.0 54.2 61.3 11.21
S-95 50.7 30.2 34.2 6.20
S-97 90.2 39.5 44.3 8.12
S-98 62.5 32.3 37.7 6.69
S-99 117.8 43.5 50.2 9.02
S-100 55.5 30.3 36.4 6.31
S-101 169.3 50.7 60.2 10.59
S-102 226.4 58.5 66.9 12.15
S-103 48.6 30.0 34.3 6.16
Table 13. Steam Oxidation of Sandvik Zircaloy-4 PWRTubing at 1304%C (2379.20F)
Time Layer Thickness Total OxygenExpt. No. Consumed
(s) Oxide Alpha (gc 2)(pm) (PM)
S-1 138.4 56.2 66.9 11.87
S-3 151.4 59.7 71.8 12.61
S-4 83.4 44.9 53.4 9.45
S-5 124.4 51.7 61.7 10.96
S-6 123.2 53.1 60.6 11.13
S-7 32.9 28.9 32.5 6.01
S-8 30.0 27.9 31.7 5.81
S-9 111.1 50.1 58.9 10.57
S-10 62.2 38.2 45.2 8.05
S-1l 79.9 41.2 48.6 8.72
S-12 - 59.3 36.4 42.8 7.68
S-13 57.7 36.5 42.2 7.67
S-14 34.3 28.0 32.4 5.89

_L LL
56
Table 14. Steam Oxidation of Sandvik Zircaloy-4 PWRTubing at 1352°C (2465.6°F)
I
Time Layer Thickness Total OxygenExpt. No. (s) Oxide Alpha Consumed
(PuM) (PM) (mg/cm2 )
S-104 112.8 62.3 78.1 13.36
S-105 80.8 52.7 66.9 11.33
S-106 69.5 46.9 60.5 10.16
S-107 73.1 49.8 63.2 10.71
S-108 28.3 31.8 41.3 6.85
S-109 90.1 53.7 70.3 11.66
S-110 32.4 32.5 39.6 6.96
S-ill 50.9 40.6 52.1 8.78
S-112 116.5 60.9 79.3 13.21
Table 15. Steam Oxidation of Sandvik Zircaloy-4 PWRTubing at 1404°C (2559.2°F)
Time Layer Thickness Total OxygenExpt. No. Oxid Consumed
(s) (PM) Alpha (mg/cm2)
S-114-TC-2 72.7 58.4 78.3 12.84S-114-TC-3 62.2 53.4 70.9 11.74S-115-TC-2 29.7 38.7 51.0 8.45S-115-TC-3 28.6 35.2 49.2 7.84S-116-TC-2 45.7 45.7 62.9 10.12S-116-TC-3 42.6 44.7 60.4 9.85S-117-TC-2 14.3 28.0 36.8 6.08S-117-TC-3 13.5 26.1 35.7 5.74S-118-TC-2 11.2 24.5 31.8 5.31S-118-TC-3 10.4 23.4 30.7 5.09S-l19.TC-2 56.4 51.6 67.5 11.29S-119-TC-3 54.2 48.8 65.7 10.79S-120-TC-2 44.8 47.1 62.2 10.29S-120-TC-3 43.4 45.1 60.4 9.92S-121-TC-2 27.5 39.1 51.1 8.47S-121-TC-3 29.8 39.2 51.4 8.53S-122-TC-2 74.1 59.0 77.3 12.92S-122-TC-3 78.9 60.3 77.6 13.18S-123-TC-2 29.3 39.0 50.4 8.46S-123-TC-3 26.5 35.1 47.2 7.73

57
Table 16. Steam Oxidation of Sandvik Zircaloy-4 PWRTubing at 1454°C (2649.2°F)
Time Layer Thickness Total OxygenExpt. No. Consumed(s) Oxide Alpha (mg/cm2)
(PM) (pm)
S-124-TC-2 57.1 61.8 81.4 13.64S-124-TC-3 54.0 -59.7 79.1 13.20S-125-TC-2 25.1 41.5 56.5 9.20S-125-TC-3 23.2 40.7 53.4 8.94-S-126-TC-2 27.9 45.5 59.4 9.96S-126-TC-3 26.1 42.2 57.4 9.36S-127-TC-3 53.3 58.7 78.0 13.01S-128-TC-2 27.3 42.8 58.7 9.52S-128-TC-3 26.4 42.5 57.4 9.41S-129-TC-2 13.7 32.6 42.4 7.11S-129-TC-3 14.9 32.6 42.0 7.14S-130-TC-2 43.5 54.5 72.6 12.04S-130-TC-3 43.1 54.6 72.2 12.03S-131-TC-2 47.2 56.4 74.3 12.44S-131-TC-3 42.0 52.6 68.9 11.61S-132-TC-2 15.3 32.3 41.8 7.10S-132-TC-3 14.5 31.0 40.6 6.84S-133-TC-2 36.8 49.7 64.9 10.95S-133-TC-3 34.5 47.5 62.9 10.51
Table 17. Steam Oxidation of Sandvik Zircaloy-4 PWRTubing at-1504°C (2739.2°F)
Time Layer Thickness Total OxygenExpt. No. Consumed
(s) Oxide Alpha (mg/cm2)(PM) (,pm)
S-134-TC-2 31.8 53.6 72.1 11.98S-134-TC-3 28.9 50.7 68.1 11.34S-135-TC-2 33.0 57.8 75.7 12.76S-135-TC-3 31.2 50.3 74.2 11.53S-136-TC-2 47.0 65.6 88.2 14.65S-136-TC-3 42.6 61.8 83.8 13.84S-137-TC-2 22.8 45.8 63.6 10.29S-137-TC-3 21.9 43.8 62.8 9.93S-138-TC-2 7.6 27.3 38.7 6.13S-138-TC-3 8.2 28.5 38.5 6.34S-139-TC-2 53.2 73.7 97.6 16.29S-141-TC-2 9.2 30.0 40.7 6.68S-141-TC-3 8.9 28.9 40.8 6.50S-142-TC-2 49:0 62.6 93.9 14.42S-142-TC-3 50.0 62.5 91.4 14.34S-143-TC-2 42.4 65.9 85.6 14.51S-143-TC-3 37.8 57.5 80.3 12.97S-150-TC-2 13.9 37.5 48.3 8.25S-150-TC-3 13.2 35.5 48.6 7.93

I H
58
Examples of the appearance of cross-sections of oxidized specimens
are given in Figs. 16-18. These are lOOx micrographs taken from specimens
oxidized at 1101, 1304, and 1504%C (2014, 2379, and 27390F) and represent
typical microstructures showing the oxide, alpha, and prior beta regions.
The tendency for separation within the oxide layer (along the tin-rich
particle line6) for the longer experiments at 1304 and 1504'C (2379-27390 F)
was aggravated by the particular method employed in mounting the speci-
mens. In the event of such a separation, separate measurements were made
of the two parts of the oxide and the results summed to give the total
oxide thickness.
Correlation of the Data
An examination of the rates of growth of the oxide and alpha layers
over the temperature range of this investigation revealed that parabolic
growth kinetics applied to both phases at temperatures above 10000C
(18320F) but only to the alpha phase below this temperature. For this
reason, parabolic rate constants will not be reported for oxide growth
at temperatures below 1000%C (18320F). Since the rate constants for
Xi (oxide + alpha) layer growth and for total oxygen consumed involve
the oxide growth parameter, they also are subject to this limitation.
The basic expression for the rate of a reaction where parabolic
kinetics control is
dK K 3dt =K (23
where
K is a kinetic parameter [i.e., oxide layer thickness, c; alpha
layer thickness, a; Xi (oxide + alpha) layer thickness, E; or total
oxygen consumed, T], and 2 is defined as the isothermal parabolic rate2
constant.*
*It should be emphasized, see Eq. (3), that we express the parabolicrate constants as 62/2. These values must be multiplied by two to givethe slope of a plot of K2 vs t [c.f., Eq. (4)]. Different authors useother conventions such as designating the parabolic rate constant asbeing the slope of a K2 vs t plot. The matter comes down to the questionof whether the factor of 1/2 obtained during the integration of KdK (i.e.,fK KdK = K2/2) in Eq. (3) is or is not incorporated in the rate constant.0

59
I I
100 200 MICRONS 600 7'I II I II 1OOX 1r I r
0.005 0.010 INCHES 0.020 0.025I I
Fig.Steam forand S-28.
16. Cross-Sections of Sandvik Zircaloy-4 PWR Tube Oxidized in(a) 160 s and (b) 512 s at 11010C (18340F). Experiments S-32Etch-anodized; bright-field; 100x.

i-u-
60
100 200 MICRONS 600 700I I I I I II I ' OOX I ' I
0.005 0.010 INCHES 0.020 0.025
Fig.Steam forand S-3.
17. Cross-Sections of Sandvik Zircaloy-4 PWR Tube Oxidized in(a) 30 s and (b) 151 s at 1304'C (2379 0F). Experiments S-8Etch-anodized; bright-field; 100x.

61
100 200 MICRONS 600 700i I I I I I II ' ' OOX ' ' II
0.005 0.010 INCHES 0.020 0.025
Fig. 18. Cross-Sections of Sandvik Zircaloy-4 PWR Tube Oxidized in: \_i Steam for (a) 14 s and (b) 47 s at 1504%C (27390F). Experiments S-150
and S-136. Etch-anodized; bright-field; 100X.

62
The integrated form of this equation is
K2 = K2 + 62 t , (4)o K
and, thus, a plot of K2 vs t should be linear with a slope of 62 and anKintercept of K2. Such plots of experimental data with nonzero values
0
of K2 might indicate deviations from strict parabolic behavior at short0
times, a pre-existing film or reaction layer on the specimen, or poor
determinations of time-at-temperature for the reaction.
Parabolic rate constants for the four kinetic parameters 4, a, i, and
T were determined, where applicable, at each reaction temperature from
the experimental data presented in Tables 5 through 17 by a least-squares
treatment based on Eq. (4). Although we investigated both approaches,
the present rate constants were calculated on the basis that K = 0,
which assumes "ideal" parabolic behavior. While the observed trend in
the data was for K0 to have small, positive values, virtually no loss in
statistical confidence was found as a result of this arbitrary assignment.
In fact, the Arrhenius correlation of the rate constants calculated in
this way exhibited a lower sum of squares of error, implying that this
procedure gives a more consistent final result.
Illustrations of the kinetic behavior for oxide and alpha growth
for temperatures from 1001 to 1504'C (1834 to 27390F) are given in
Figs. 19 to 24. At the lower end of this temperature range [1001-11010C
(1834-20140F)], a larger scatter exists for the alpha layer measurements.
This is in large part due to the uncertainties in locating precisely
the position of the alpha-beta interface at these temperatures. At
temperatures below 1400'C (25520F), each data set included measurements
from only one reference point per specimen (the No. 2 thermocouple
position); at higher temperatures, measurements were made at each of
the two monitor thermocouple positions on each specimen, and the high
degree of self-consistency of these measurements is evident. In each
of these cases, as in all cases for reaction above 1000 'C (18320F), the
growth rates of these phases are well represented by parabolic growth
kinetics. It should be pointed out that the kinetics for Xi (oxide
+ alpha) layer growth, i, and for total oxygen consumption, T, behave

-
63
2000
N
Et 1500
N
cnwzY 10000
Id
j - 500-J
ORNL-DWG 76-18302
MI NIZWOK DATAZIRC-4 PWR TUBING Z1001 'C %7
0- o OXIDE/
I -"- =_'
00 250 500 750 1000 1250
TIME (sec)Fig. 19. Steam Oxidation of Sandvik
MiniZWOK Apparatus at 1001°C (1834°F).Zircaloy-4 PWR Tubing in the
ORNL-DWG 76-182992500
- 2000E
Njn 1500tnwz
I 1000
w
J 500
00 100 200 300 400 500 600
TIME (sec)
Fig. 20. Steam Oxidation of Sandvik Zircaloy-4 PWRMiniZWOK Apparatus at 1101°C (20140F).
Tubing in the

I Ii
64
ORNL-DWG 76-482984000
N
E:- 3000
N
ZI,
wz
w-J
2000
4000
00 400 200
TIME (sec)
300
PIJR Tubing in theFig. 21. Steam Oxidation of Sandvik Zircaloy-4MiniZWOK Apparatus at 1203%C (2197 0F).
ORNL-DWG 76-8339
5000.
E 4000
N
(nV)
W 3000z
C-
a- 2000
-J
1000
0o0 20 40 60 80 100 120 140 160
TIME (sec)
Fig. 22. Steam Oxidation of Sandvik Zircaloy-4 PWR Tubing in theMiniZWlOK Apparatus at 1304%C (2379 0F).

-
65
7000
6000
N 5000E
:I-NVc 4000
zw
I' 3000
J 2000
1000
ORNL-DWG 76-8340
MINIZWOK DATA IZIRC-4 PWR TUBING I_1404 0C
o OXIDE, POS 2
O OXIDE, POS 3 _ __
a ALPHA, POS 2o ALPHA, POS 3
. el 0
Av 0 1o 20 30 40 50 60 70 80
TIME (sec)
Fig. 23. Steam Oxidation of Sandvik Zircaloy-4MiniZWOK Apparatus at 1404°C (2559°F).
PWR Tubing in the
ORN.LDW ?t-10401,l000
9000
8000
! 7000
. 6000
2Y 5000
P-
w 4000Jx
I I IMINIZWOK DATA
- ZIRC-4 PWR TUBING504 'C A Z-
O OXIDE, POS 2el OXIDE: INDS 3
- A ALPHA POS2 - -= ALPHA POS= 3
7 01730w -7- _ - -
2000
1000
aDE
/41- '9 .__ I - -
O .I 10 t 20 30 40
TIME ICe50 60
Fig. 24. Steam Oxidation of Sandvik Zircaloy-4 PWR Tubing in theMiniZWOK Apparatus at 1504°C (2739°F).

-aj4
66
similarly. Since most of the total oxygen consumed by a specimen is
located in the oxide layer, the kinetic response of this parameter is
virtually identical to that for oxide layer growth.
The data for steam oxidation at 905 and 956%C (1661 and 17530F)
differ from the higher temperature results in that non-parabolic growth
of the oxide layer was observed at both of these temperatures. The
data set for oxidation at 956%C (17530F) furnishes a good example of
these differences. These data are presented in Fig. 25. While the
growth of the alpha layer appears to be accounted for satisfactorily
by parabolic kinetics, departures from this behavior clearly exist for
the oxide layer growth. In fact, the growth rate of the oxide layer
at this temperature is more closely represented by a cubic rate expres-
sion, as shown in Fig. 26.
ORNL-OWG 76-9768
700
N_ 600E
At 5000N_
(nU)w 400zC)
M 300
> 200
-J
100
0
i 0 . . .T ..
ZIRC-4 PWR TUBE
96 __ o OXIDE LAYER
;la
0 400 800 1200 1600t (sec)
Fig. 25. Steam Oxidation of Sandvik Zircaloy-4 PIWR Tubing in theMiniZWOK Apparatus at 956 0C (1753 0F). Example of nonparabolic growthin oxide layer.

67
20,000
4 15,000
InU)U)
F- -
I
500
ORNL-DWG 766-97671 I I
ZIRC-4 PWR TUBE 'a , 0956 0C, MINIZWOK _ /* OXIDE LAYER
00
40
0 400 800 4200 1600/ (sec)
Fig. 26. Steam Oxidation of Sandvik Zircaloy-4 PWR Tubing in theMiniZWOK Apparatus at 956 0C (17530F). Cubic plot for oxide layer growth.
The parabolic rate constants from the present data sets are given
in Table 18. It is interesting to observe that the scatter in the
individual data, indicated by the statistical confidence in the rate
constants, actually improved as the temperature increased. Part of the
unexpected improvement must be associated with the fact that the mea-
surements of interface positions are relatively more accurate at the
higher temperatures because the system behaves more ideally.
Correlations of the rate constants in terms of simple Arrhenius
relationships were, except for the alpha layer growth, restricted to
the temperature range 1000-1500'C (1832-27320F). In fact, because the
rate constant for oxide growth at10010 C (18340F) appeared a little low
compared to the rest of the data set, the least-squares and statistical
representations were based on the data at and above 1050%C (19220F).
The four sets of parabolic rate-constants are plotted in Arrhenius
fashion in Figs. 27-30. The data are obviously well represented by
this relationship, although a critical examination seems to-indicate
JUv'
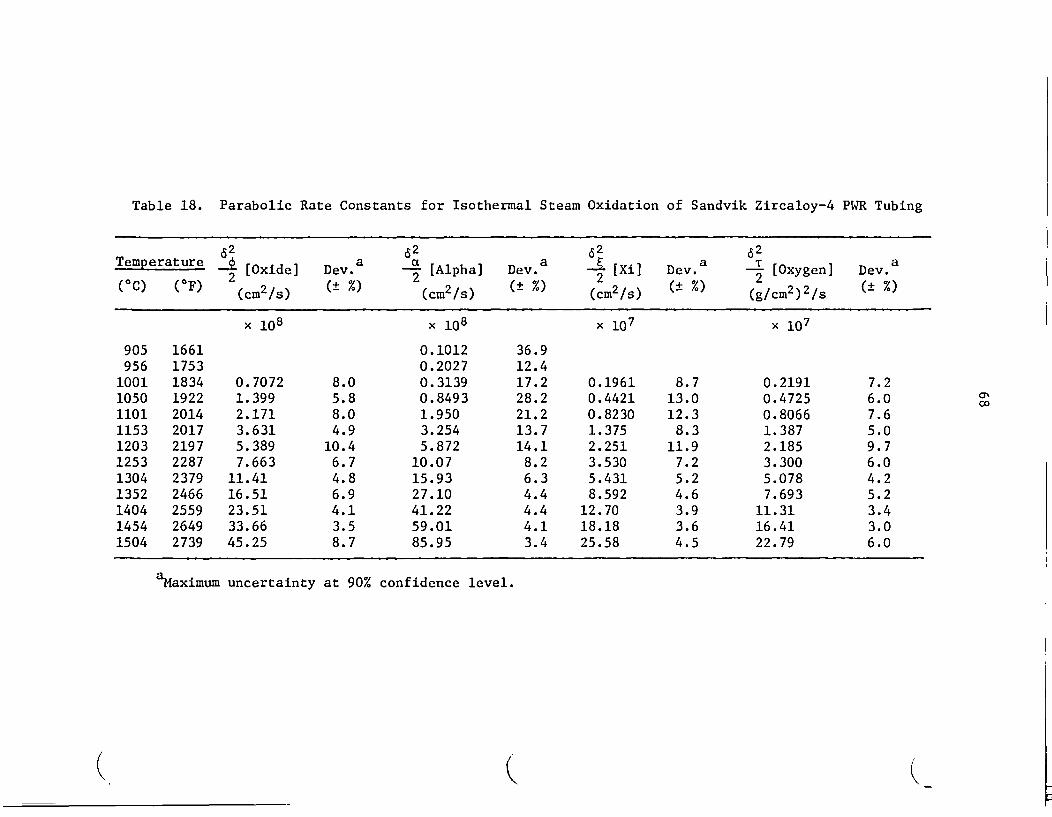
Table 18. Parabolic Rate Constants for Isothermal Steam Oxidation of Sandvik Zircaloy-4 PWR Tubing
62 62 62 62Temperature i a a [Alpa] ev.. aa. aTp t [Oxide] Dev. [Alpha] Dev. Xi] Dv. [Oxygen] Dev.
(0C) (OF) 2(2/s%) ( 2 (2s) %) (m2/s) %) (g/cm2)2/s %)
x lO8 x 108 x 107 x 107
905 1661 0.1012 36.9956 1753 0.2027 12.4
1001 1834 0.7072 8.0 0.3139 17.2 0.1961 8.7 0.2191 7.21050 1922 1.399 5.8 0.8493 28.2 0.4421 13.0 0.4725 6.01101 2014 2.171 8.0 1.950 21.2 0.8230 12.3 0.8066 7.61153 2017 3.631 4.9 3.254 13.7 1.375 8.3 1.387 5.01203 2197 5.389 10.4 5.872 14.1 2.251 11.9 2.185 9.71253 2287 7.663 6.7 10.07 8.2 3.530 7.2 3.300 6.01304 2379 11.41 4.8 15.93 6.3 5.431 5.2 5.078 4.21352 2466 16.51 6.9 27.10 4.4 8.592 4.6 7.693 5.21404 2559 23.51 4.1 41.22 4.4 12.70 3.9 11.31 3.41454 2649 33.66 3.5 59.01 4.1 18.18 3.6 16.41 3.01504 2739 45.25 8.7 85.95 3.4 25.58 4.5 22.79 6.0
C'
aMaximum uncertainty at 90% confidence level.
I.
I

69
ORNL-DWC 76-40594
TEMPERATURE (C)1500 4400 4300 4200 1400 4000 900
z 5
E 2
-J
a:
111 5
x0
; 22
V 40 8O'00
WI 5!-
2
-0-9 _5.5 7.0 7.5
4 . 0o/ r V K)
Fig. 27. Arrehnius Plot ofLayer Growth from 1000 to 15000CZircaloy-4 PWR tubing in steam.
1500 1400 1300lo-'
E 5 _ _IN
E
2 -_
4 5
20° 2 ---
S _
_
2 2-0.765
lo-IO I I5.5 60 6.5
Fig. 28. Arrhenius Plot ofLayer Growth from 900 to 15000C IZircaloy-4 PWR tubing in steam.
the Parabolic Rate Constants for Oxide(1832-2732°F). Oxidation of Sandvik
O A'S-05 6- 40o 5
TEMPERATURE (C)1200 4100 4000 900
9.0
the Parabolic Rate Constants for Alpha(1652-27320F). Oxidation of Sandvik
,j.1
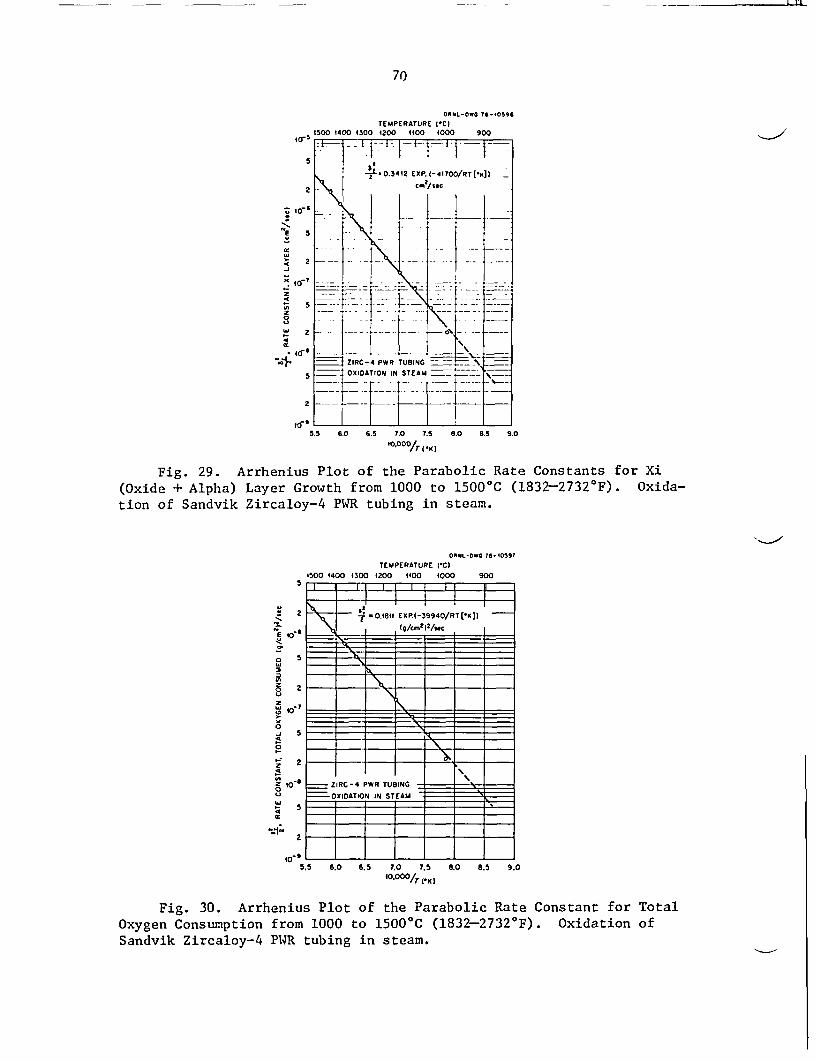
11
70
oaNL-.c-6 76--059TEMPERATURE VCI
t500 1400 4300 4200 1100 4000 9004a-, 1 -- t- _:--f-I -' 1-I - - I -
I ,
f ~ ~ 11 _ ATIO 0N41 SEXP A U __ ;T 'Kj)~
~ 2---
tion~ ofSnvkZrao-4... -IRtbn nsem
TEU-4 PERATUBRE ____
z 00 4010 20 50 10 0
- OXIDATION IN STEAM z 2..
5.5 6.0 6.5 7.0 7.5 0.0 8.5 9.010.OOO/r C*KI
Fig. 29. Arrhenius Plot of the Parabolic Rate Constants for Xi(Oxide + Alpha) Layer Growth from 1000 to 15000C (1832-27320 F). Oxida-tion of Sandvik Zircaloy-4 PW4R tubing in steam.
0661-DWG 76. 40387TEMPERATURE (,C)
9500 4400 4300 1200 4400 4000 9005r r--.--r.
2 0 EX P. (-39940/RT IK I a)
2 ;
S 2 -- -. -
0
o I-. i --si I H4 5 + --1 1 \ | l
0°' - - - - - -\\
Z 10- ZIRC -4 PWR TUBING
OXIDATION IN STEAM
.s 5 .9. 1e
4 I
T I I-
-"2 t -_-_
5.5 6.0 6.5 7.0 7.5 8.0 8.5 9.0
'°@°°°/r rK)
Fig. 30. Arrhenius Plot of the Parabolic Rate Constant for TotalOxygen Consumption from 1000 to 15000C (1832-27320F). Oxidation ofSandvik Zircaloy-4 PIWR tubing in steam.

71
that some minor but systematic deviations exist. It should be mentioned,
for example, that if the Arrhenius representation for the oxide and
alpha rate constants are each linear with different slopes, then the
corresponding representation for Xi must exhibit curvature. This effect
appears negligible in the present case, and we have determined all of
the expressions for the temperature dependence of the parabolic rate
constant on the basis of conformity to the Arrhenius equation.
Individual confidence intervals for the pre-exponential and activa-
tion energy terms of the Arrhenius expressions for the rate constants
were calculated. In addition, the joint confidence intervals for the
rate constants themselves were also calculated. The computation
procedures and significance of the statistical quantities have been
reported previously4 and will not be repeated here. Specifically, it
was shown that
62
2 .01126 [ 23%] exp(-35890[±2.2%]/RT) cm2/s , (5)
7615 % exp(-48140[+2.6%]/RT) cm2/s (6)2 765 3 5 7 ]
62 [+17%
= .3412 [ exp(-41700[±1.2%]/RT) cm2/s (7)(2 -1,)62
2 206%' exp(-39940[±1.4%]/RT)(g/cm2)2/s62
where each - is the parabolic rate constant for the kinetic parameter2 62 d
k calculated on the basis that k = k T-. The quantities in the brackets2 dt
refer to the individual 90% confidence limits on the pre-exponential
and activation energy terms.
While the individual confidence intervals are useful in describing
the statistics on the specific terms, the joint confidence intervals are
more meaningful descriptions of the accuracy of the specific rate con-
stants because the uncertainties on the pre-exponential and activation
energy terms are correlated. From constructions of the joint confidence
intervals, the ranges of k at the 90% level were calculated and are2I
given in Table 19. The confidence ranges for the rate constants shown
in Table 19 are considered to be excellent. Thus, the data are consistent

I 121
72
Table 19.Constants
90% Joint Confidence Intervals for the Parabolic Ratefor Oxide Layer Growth, Alpha Layer Growth, Xi Layer
Growth and Total Oxygen Consumption
Rate Constant Percent Deviation from Expected Value at62k 15000C (27320F) 12500C (22820F) 10500C (19220F)2
2 +4.3 +2.5 +4.92 -4.1 -2.4 -4.762
da +10.1 +6.1 +12.12 -9.2 -5.8 -10.8
62_ +2.6 +1.5 +3.02 -2.6 -1.5 -2.962
T +3.0 +1.7 +3.42 -2.9 -1.7 -3.3
with and represented accurately by the
(For a more complete exposition of the
data, see Appendix A.)
given Arrhenius relationships.
statistical treatment of the
Oxide-Alpha Thickness Ratios
As has been pointed out, the activation energies for oxide and
alpha layer growth are 35,890 and 48,140 cal/mole, respectively. This
difference is expected to produce differences in the relative rates of
growth of the two phases as a function of temperature, and such a
phenomenon is observed as shown in Fig. 31 where the oxide-alpha layer
thickness ratio (r/a) is plotted as a function of temperature. The
error bars represent two standard deviations from the mean of the ratios
observed.
It has been suggested that the 0/a ratio might be used as a measure
of oxidation temperature of specimens oxidized under approximately iso-
thermal conditions. Such an approach is certainly possible but must be
used with considerable caution. As the data demonstrate, even when

73
ORNL-DWG 76-19856
1.8 -
o 1.6 -
or
0 1.4 -
z
Ad1.2 _
as
\ 1.0 -
0w
0.6 -
900 4000 i100 4200 4300 i400TEMPERATURE ( 0C)
4500 4600
Fig. 31. Oxide/Alpha Thickness Ratios Plotted as a Function ofTemperature for Zircaloy-4 Specimens Oxidized in Steam.
jsamples are oxidized under carefully controlled conditions, a substantial
variation in the 4/a ratio is observed. This variation could lead to
errors in temperature estimates of 100'C (180'F) or greater.
The method certainly should not be used at temperatures below
1000 0C (1832 0F). At 900 and 950'C (1652-1742 0F) the oxide growth rate
is not parabolic, and, as a consequence, the +/a ratio changes as a
function of oxidation time as well as temperature. This effect is
illustrated in Fig. 32(b) where ¢/a is plotted against oxidation time.
At temperatures above 1000 C (18320F), however, this ratio does not
appear to vary significantly with time [see Fig. 32(a)).
Comparison of Isothermal Kinetic Data
A general comparison of the results of this investigation with
previous work can be made id terms of the parabolic rate constants for
total oxygen consumption, T. The temperature dependences reported by2
(or derived from the data of) a number of investigators are given below.
It should be remembered that we have defined these rate constants asI i

I V1
74
ORNL-DWG 76-198561.9
1.7
0 1.5
a:enW 1.3z 1.6
< 1.4a.-J
W 1.2a
0to1.0
0.8
1001 OC
_ -- 1- - - --.
9560 C2 I- _ tsS
1 S
D 2 4 6 8 10 12 14 16 (xio?)
TIME (sec)
Fig. 32. Oxide/Alpha Ratios Plotted as a Function of OxidationTime for Oxidation of Zircaloy-4 in Steam at 956 and 1001%C (1753-18340 F).
62
2 (g/cm2)2/s = T dt- where T is the total oxygen consumed in grams/cm2.
Present Investigation (Based on Stoichiometric Oxide):
62
2 = .1811 exp[-39940/RT(0 K)] (g/cm2)2/s
Present Investigation (Based on Stoichiometry Gradient in Oxide):
62
2 = .1680 exp[-39870/RT(0 K)] (g/cm2)2/s
HOBSON2 7 (Analysis of Complete Data Set):
62
2 = .1553 exp[-39290/RT(0K)] (g/cm2)2/s

75
HOBSON27 (Point-by-Point Analyses):
62
2 .008311 exp[-31110/RT(0K)] (g/cm2)2/s
BAKER-JUST28:
62
2 = 2.0496 exp[-45500/RT(0 K)] (g/cm2)2/s2
LEMMON29 :
62
2 = .028875 exp[-34000/RT(OK)] (g/cm2)2/s
BIEDERMAN, et al.17f:
KLEPFER30:
2 .02203 exp[-33500/RT(0K)] (g/cm2)2/s
KAWASAKI, et al.31:
62
2 .1994 exp[-40500/RT(0K)] (g/cm2)2/s
LEISTIKOW, et al.32 (approximated from graphical data)*
*The analytical expression derived for the data of Leistikow, etal. exhibits a comparatively large activation energy term, although theindividual experimental-rate constant values agree reasonably well withother recent data (see Appendix A). It appears that the high activationenergy stems from the inclusion in this data set of the very low valueof the parabolic rate constant determined at 9000 C -(16520F), which pro-duces a relatively steep slope for the Arrhenius plot. If this pointis neglected, as suggested by our results that indicate the kinetics tobe non-parabolic at this temperature, the activation energy decreases toless than 42000 cal/mole with a corresponding change in the pre-exponentialterm.
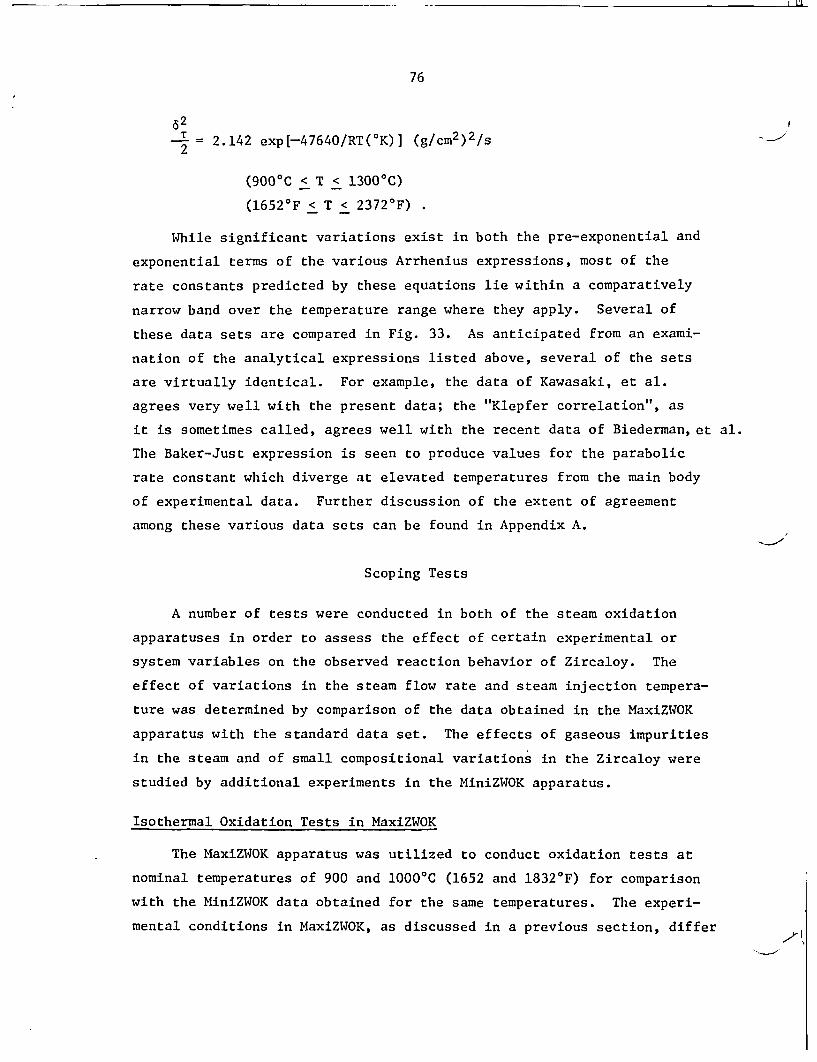
_ VI
76
T_ = 2.142 exp[-47640/RT(0 K)] (g/CM2)2/S2
(9000C < T < 13000C)
(16520 F < T < 23720F)
While significant variations exist in both the pre-exponential and
exponential terms of the various Arrhenius expressions, most of the
rate constants predicted by these equations lie within a comparatively
narrow band over the temperature range where they apply. Several of
these data sets are compared in Fig. 33. As anticipated from an exami-
nation of the analytical expressions listed above, several of the sets
are virtually identical. For example, the data of Kawasaki, et al.
agrees very well with the present data; the "Klepfer correlation", as
it is sometimes called, agrees well with the recent data of Biederman,et al.
The Baker-Just expression is seen to produce values for the parabolic
rate constant which diverge at elevated temperatures from the main body
of experimental data. Further discussion of the extent of agreement
among these various data sets can be found in Appendix A.
Scoping Tests
A number of tests were conducted in both of the steam oxidation
apparatuses in order to assess the effect of certain experimental or
system variables on the observed reaction behavior of Zircaloy. The
effect of variations in the steam flow rate and steam injection tempera-
ture was determined by comparison of the data obtained in the MaxiZWOK
apparatus with the standard data set. The effects of gaseous impurities
in the steam and of small compositional variations in the Zircaloy were
studied by additional experiments in the MiniZWOK apparatus.
Isothermal Oxidation Tests in MaxiZWOK
The MaxiZWOK apparatus was utilized to conduct oxidation tests at
nominal temperatures of 900 and 10000C (1652 and 18320F) for comparison
with the MiniZWOK data obtained for the same temperatures. The experi-
mental conditions in MaxiZWOK, as discussed in a previous section, differ

77
ORNL-DWG 76-18770
E_10C)00'1100 1000
PRESENT DATA5 -AKERIJUST
_ \ _ LEMMON.E .IEDEROAN ------- __/_.
w 2
F 2 \T'
>0 8 EA\5. 6 __ __ _ 6.5_____7._8 0
Cosmpin T. from__ SevraIvetiatrs2
5o
0
2
0 i0-7 * %. _ _ _
fo those ii iwtn
0 _ _ _ _ 0 _ _ _ 5 .1 1 7_5_ _
Fig.r or than Comparison maniud haaoigh~aerCt than corepndn vluOyes
2
Fieg ormorenthan ories of mpragntude higerateaons orrents fortalOen
fro thiZoseiK iiWKi woipratwy:() h ta neto
ducted at 900 and 1000p C (1652-1832tF) are showrain Figs. 34 and 35.
Upon insertion of the specimen into the reaction tube, the specimen

I -
78
ORNL-DWG 75-423294 000
800
0
t,
W
t--
i
I-
600
400
200
00 40 80 120 460 200 240 280
TIME (sec)
Fig. 34. Specimen Temperature as a Function of Time for MaxiZWOKOxidation Experiment at 9000C (1652°F). Steam flow rate was 0.8 lb/min(6.0 g/s).
ORNL-DWG 75-480291100
1000
G
w
a.M
F-
800
700
EXPT. NO. MAX- 25STEAM: 0.8 lb/min.
1025
- 4000 F
975
950----- -
20 30 40 I
_III _
o 50 100 450TIME (secl
200 250
Fig. 35. Specimen Temperature as aOxidation Experiment at 10000C (18320F).(6 g/s).
Function of Time for MaxiZWOKSteam flow rate was 0.8 lb/min

79
temperature increases rapidly to the system temperature. A perturbation
of the heating rate is observed due to the endothermic a-to-B transforma-
tion of the Zircaloy, which makes the rate of approach to temperature at
900%C (16520F) somewhat sluggish. For reaction at 10000C (18320F), the
exothermic heat of reaction is sufficient to drive the specimen temper-
ature above that of its environment, creating the "overshoot" that was
typical of MaxiZWOK experiments in this temperature range. In the
particular case illustrated in Fig. 35, an overshoot of about 18'C
(320F) was observed before the specimen temperature began to return to
its steady-state value, and several minutes were required for the effects
of specimen self-heating to be dissipated. At the termination of each
experiment, the specimen is withdrawn from the reaction chamber into the
quench bath, and the temperature drops rapidly.
Data and Results - The basic experimental phase thickness measure-
ments were obtained from the oxidized MaxiZWOK specimens using essentially
the same procedures discussed in connection with the MiniZWOK apparatus.
One exception in the procedure concerned the gathering of the phase
thickness measurements since this apparatus produced specimens oxidized
on both sides. Thus, measurements were made on each surface for
comparison.
In order to check on the uniformity of the reaction, phase thick-
ness measurements were made on several specimens as a function of
angular position around their circumferences. While there were obvious
local artifacts which affected the accuracy of some of the individual
measurements, the circumferential variation of the phase thicknesses
was considered small enough for MaxiZWOK specimens so that an "average"
layer thickness was meaningful. Circumferential layer thickness measure-
ments on the outer surfaces of two specimens oxidized at 900 and 1005'C
(1652-1841'F) in the MaxiZWOK apparatus are presented in Figs. 36 and 37.
Similar results were obtained for measurements on the inner surfaces.
While no statistical treatment of these data has been performed, we
have used such plots to justify the use of a simple data-gathering
procedure involving few measurements: this procedure was to make only
four measurements, approximately 90° apart, starting from a random
point for both inner and outer surfaces of the specimen tube. Care

I [l1
80
ORNL-DWG 75-1771628
26
24
22
- 20
- 18Ln 16U,z 14
I 12
C: 10
< 8-j 14
12
to
8
6
EXPT. NO. MAX-16 SECT.2383.4 sec AT 900-C
i fl Io I fl flK o .-. 1 -=,-._
._ !_|_ Ol 4_ .
t1 a _
__3_
-(ALPH-(OXIDE
0 30 60 90 120 150 180 210 240 270 300 330 360POSITION (deg)
Fig. 36. Oxide, Alpha, and & Layer Thickness Measurements on OuterSurface of Oxidized Zircaloy-4 PW4R Tube as a Function of Angular Position.Expt. MAX-16, 383.4 s at 900°C. Arrows indicate average values obtainedfrom four measurements 900 apart starting at a random point.
30
28
26
24
-E 22E~- 20
uI 16
z 14
:F 12
Cr 10
<s 8'5 18
16
14
12
10
ORNL-DWG 75-17715
E EXPT. NO. MAX-23, SECT. 299.4 sec AT 1005°C - - _ - | | -
(ALPHA)-| l l l l l l l l | -
S~~_ I--.of--
| o ID)I I~ I0
OXIDEI { I I I I 1 1 -1
0 |
0 30 60 90 120 150 180 210 240 270 300 330 360SITION [deg)
Fig. 37. Oxide, Alpha, and C Layer Thickness Measurements on OuterSurface of Oxidized Zircaloy-4 PWR Tube as a Function of Angular Position.Expt. MAX-23, 99.4 s at 1005°C. Arrows indicate average values obtainedfrom four measurements 900 apart starting at a random point.

81
was taken to avoid obviously nonrepresentative areas. The thickness of
each layer on each surface was then taken as a simple average of the
four measurements. The arrows in Figs. 36 and 37 indicate the average
thickness values obtained by this latter procedure for each layer.
They are seen to agree well with the mean value computed from the entire
data set. The MaxiZWOK data presented later in this report were obtained
by this four-point method.
The equilibrium temperatures for the set of MaxiZWOK experiments
nominally at 9000C (16520F) varied from 897 to 9020C (1647-16660F); at
10000C (18320F), the range was 1000 to 10090C (1832-18480F). Corresponding
isothermal temperatures of 900 and 1005-C (1652-1841'F) were chosen to
represent each of these data sets. On this basis, and the measured time-
temperature excursion for each experiment, the effective time at temper-
ature for a true isothermal oxidation was calculated as previously
described.
Correlation of Data and Comparisons - Values of the oxide and alpha
phase thickness measurements for the sets of oxidation experiments in
MaxiZWOK at 900 and 10050C (1652-18410F) are presented in Tables 20 and
21. Measurements for both outer and inner surfaces of the tube are
reported. It should be emphasized here that the consistency of the
alpha layer thickness measurements is not as high as that obtained
after oxidation at higher temperatures because of difficulties in
defining the a/0 or a/(a+$) interface.
A parabolic plot for the growth of the outer oxide layer at 900%C
(16520F) is given in Fig. 38, which shows the extent of the departure
from ideal parabolic behavior and also compares this data set with the
MiniZWOK results for oxide growth at 905'C (1661'F). (Note that four
additional points at short times were added to the MiniZWOK data set to
aid in this comparison. These four data points were not included in
Table 5.) The very good agreement between these two data sets is
regarded as evidence that steam flow rate and steam insertion tempera-
ture do not affect significantly the kinetics of the steam oxidation
of Zircaloy, at least in this temperature range.

l L
82
Table 20. Steam Oxidation of Sandvik Zircaloy-4 PWRTubing at 900'C (16520F) MaxiZWOK Data
Outer Surface Inner Surface
Expt. No. Time Oxide Alpha Total Oxygen Oxide Alpha Total Oxygen(s) (pm) (0m) Consumed (Pm) (Pm) Consumed
(mg/cm2 ) (mg/cm2 )
Max-li 637.3 12.8 15.3 2.314 12.0 14.1 2.163
Max-12 75.8 5.6 5.0 .968 4.9 4.7 .856
Max-13 1194.0 15.7 18.6 2.833 14.4 18.0 2.624
Max-14 136.4 7.0 7.9 1.253 6.6 7.9 1.193
Max-15 46.3 5.0 3.9 .852 3.8 3.9 .670
Max-16 383.4 9.9 11.3 1.776 9.4 11.0 1.693
Max-17 857.7 13.2 17.5 2.431 12.6 17.9 2.350
Max-28 2291.1 19.6 21.7 3.500 18.3 21.4 3.296
Table 21. Steam Oxidation of Sandvik Zircaloy-4 PWRTubing at 10050C (18410F) MaxiZWOK Data
Outer Surface Inner Surface
Expt. No. Time Oxide Alpha Total Oxygen Oxide Alpha Total Oxygen(S) (pm) (Pm) Consumed (Pm) (Pm) Consumed
(mg/cm2 ) (mg/cm2 )
Max-21 367.4 25.8 17.6 4.547 24.6 17.7 4.370
Max-22 866.5 40.6 26.0 7.104 38.3 24.9 6.727
Max-23 99.4 13.7 10.2 2.436 11.8 10.1 2.147
Max-24 640.5 35.3 22.6 6.173 33.3 22.3 5.865
Max-25 234.4 20.6 14.1 3.632 20.1 13.6 3.543
Max-26 512.4 31.0 19.3 5.410 30.4 18.3 5.292

83
N, 400
E
N 300-S
(I,J
zY 200
I
W 100
-J5-
--. 1
ORNL-DWG 76-5062R
ZIRC-4 PWR TUBE
00 0
0 0 OXIDE LAYER, MAXIZWOK, 9000 C
* OXIDE LAYER,MINIZWOK,905 0C
__ __ __ __ __ __ __ __ __ __ __ _I _ _ __I _ _ _ _ _ __I_ _ _ _ _ _
0 500 '1000 1500 2000 2500
TIME (sec)
Fig. 38. Non-Parabolic Growth of Oxide Layer on Zircaloy-4 PWRTube in the Mini- and MaxiZWOK Apparatuses at It 900'C (16520F).
The parabolic plot for the 1005%C (1841'F) MaxiZWOK data set is
presented in Fig. 39, which shows the behavior for both outer and inner
surfaces of the tube. The kinetic behavior at this temperature is
clearly parabolic with only minor differences observed for the layer
growth on the outer and inner surfaces. Small differences of this sort
may be due to geometrical effects or to the different final inner-outer
surface treatments used by the tube manufacturer.
A list of the parabolic rate constants for the-kinetic parameters
(where they apply) for oxidation in MaxiZWOK is given in Table 22.
While the 900'C data compare very favorably-with the values predicted
from the MiniZWOK data obtained at 905'C, the comparison is not as good
for the data sets at nominally 10000C. Although the MaxiZWOK'data at
this temperature suggest aslightly higher value for the parabolic rate
constant for oxide and alpha growth, it is interesting to observe that
the actual MiniZWOK rate constant values for reaction at 1001°C are

III-
84
ORNL-DWG 76-485462000
N
E
NZ,
W
U)
z
X
C..
a-
Uw
4600
1200
800
400
0
0 200 400
TIME (s600 800 4000
Fig. 39.at 10050C.
Oxidation of Zircaloy-4 PWR Tube in the MaxiZWOK Apparatus
Table 22. Parabolic Rate Constants for Oxidation of Sandvik Zircaloy-4PWR Tubes in MaxiZWOK Apparatus at 900 and 1005'C (1652-1841'F)
ParabolicTemperature Rate Constant Dev.
Parameter 62 x %'(0C) (OF) 2 108 (%)
900 1652 Oxide (outer) non-parabolic900 1652 Alpha (outer) .123 cm2/s 26.4900 1652 Xi (outer) non-parabolic900 1652 Total Ox. (outer) non-parabolic
900 1652 Oxide (inner) non-parabolic900 1652 Alpha (inner) .119 cm2/s 26.2900 1652 Xi (inner) non-parabolic900 1652 Total Ox. (inner) non-parabolic
1005 1841 Oxide (outer) .949 cm2/s 4.21005 1841 Alpha (outer) .393 cm2/s 9.91005 1841 Xi (outer) 2.562 cm2/s 4.21005 1841 Total Ox. (outer) 2.908 (g/cm2)2/s 3.6
1005 1841 Oxide (inner) .858 cm2/s 6.01005 1841 Alpha (inner) .368 cm2 /s 16.41005 1841 Xi (inner) 2.349 cm2/s 4.81005 1841 Total Ox. (inner) 2.649 (g/cm2)2/s 4.3
aMaximum uncertainty at 90% confidence level.

85
somewhat lower than those predicted by the Arrhenius curves considering
each data set as a whole. Additionally, the fact that this temperature
is within a very critical range regarding the crystal structure of the
growing oxide may be responsible for these small differences in rates.
This point will be discussed later with regard to transient-temperature
oxidation behavior. It should also be pointed out that one additional
experiment in MaxiZWOK, run under conditions where the furnace tempera-
ture was higher than the steam temperature, produced a single data point
at 1050'C that agreed within experimental uncertainty with the standard
data set.
Thus we argue that the variations in steam flow rate (at least for
flow rates above those necessary to prevent hydrogen blanketing) and
steam insertion temperature produce little effect on the isothermal rate
of oxidation of Zircaloy-4. Of course, steam flow rate and temperature
are recognized as important factors in determining the temperature
response (i.e., the extent of temperature rise due to specimen self-
heating) of a specimen in a given environment.
Mixed Gas Experiments
A number of scoping tests were performed in which specimens of
the standard Zircaloy-4 PWR tubes were oxidized in steam to which small
amounts of potentially reactive gases had been added. Experiments were
conducted at nominally 1101 and 1304'C (2014-23790F) with either
10 mole % N2, 10 mole % 02, or 5 mole % H2 added to the flowing steam.
These experiments were conducted in the MiniZWOK apparatus to which a
gas injection device had been added. The gas flow rates were monitored
with a calibrated flow-meter. In order to insure adequate mixing of
the impurity gases with the steam, they were injected at a point just
above the steam boiler.-
The oxidation and data-gathering procedures used in these tests
were identical to those reported previously for the basic set of iso-
thermal data. Oxide and alpha layer thicknesses were determined at
each monitor thermocouple position. The reaction time at the assigned
reaction temperature was calculated by an integration scheme which

86
utilized the CODAS output for the entire temperature excursion. These
data, plus a calculation of the total oxygen consumed by each specimen,
are presented in Tables 23 through 28.
The tabulated data are presented in graphical form in Figs. 40
through 45. These are plots of the square of the oxide and alpha layer
thicknesses as functions of time for the various experimental conditions.
In each figure, the straight lines represent the behavior predicted for
the rates of layer thickening by the analytical expressions derived from
the basic data set for oxidation in pure steam.
It will be noted that in some instances the individual data points
from the scoping tests differ from the baseline correlations. However,
because of the comparatively small number of tests used to define the
rate curves in the scoping experiments, we feel that these differences
are not significant with the possible exception of the results for
oxygen additions at 11010C (2014 0F).
For example, Fig. 40 compares the baseline data with those obtained
after oxidation at 11010C (2014 0F) in steam containing 10 mole % N2. It
is obvious in this case that the differences in the kinetic behavior for
oxide and alpha layer growth are insignificant. Indeed, the rate con-
stants for 4 and a calculated from the scoping test data are virtually
identical to the "standard" values. On the other hand, for tests at
11010C (20140F) in steam containing 10 mole % 02' Fig. 41 indicates a
small, but consistent effect: the oxide layer appears to grow a little
faster under these conditions, and because of the resulting enhancement
of the rate of movement of the oxide-alpha boundary, the rate of growth
of the alpha layer is reduced. However, while the rate constant for
oxide layer growth is about 19% larger, the statistical significance
of this difference is marginal. In Fig. 42, the addition of 5 mole % H2
to the steam is shown to exhibit a negligible effect on the oxidation
kinetics at 11010C (20140F).
The comparisons for the tests at 1304%C (23790F), shown in Figs. 43,
44 and 45, similarly indicate no dramatic kinetic effects of impurity
gas additions (at the levels studied) to the steam. Even for the case
of the 10 mole % oxygen addition, the comparison with the standard data
is very good. Thus, the only scoping test involving impurity gas

87
Table 23. Steam Oxidation of Sandvik Zircaloy-4 PWR Tubing at11010C (20140F) (10 mol % Nitrogen Added to Steam)
oTime Layer Thickness Total Oxygen
Expt. No. (s) Oxide Alpha (mg/cm2)(pm) (Om)
S-170-TC-2 168.1 27.7 25.5 5.31S-170-TC-3 161.7 28.4 25.9 5.42S-171-TC-2 147.1 28.9 25.2 5.45S-171-TC-3 162.2 27.5 23.4 5.21S-172-TC-2 556.6 49.2 43.3 9.39S-172-TC-3 543.1 48.6 42.8 9.28S-173-TC-2 519.6 48.1 43.2 9.20S-173-TC-3 523.3 47.2 40.0 8.97S-175-TC-2 26.5 12.6 11.7 2.39S-175-TC-3 28.5 13.5 12.1 2.55
Table 24. Steam Oxidation of Sandvik Zircaloy-4 PWR Tubingat 11010C (20140F) (10 mol % Oxygen Added to Steam)
Layer Thickness
Expt. No. Time Oxide Alpha Total Oxygen(s) (PM) (pM) (gC
S-188-TC-2 160.5 29.8 23.7 5.56S-188-TC-3 157.5 29.5 24.0 5.52S-189-TC-2 185.7 32.7 25.3 6.08S-189-TC-3 177.5 32.2 24.7 5.97S-191-TC-2 545.8 53.0 36.1 9.75-S-191-TC-3 510.0 51.2 34.1 9.40

_ _ !LL
88
Table 25. Steam Oxidation of Sandvik Zircaloy-4 PWR Tubingat 11010C (20140F) (5 mol % Hydrogen Added to Steam)
Time Layer Thickness Total OxygenExpt. No. (s) Oxide Alpha (mg/cm2)
(pm) (pm)
S-180-TC-2 169.8 28.2 25.5 5.39S-180-TC-3 171.1 28.1 26.1 5.39S-181-TC-2 182.4 29.1 27.2 5.58S-181-TC-3 181.6 29.4 27.0 5.62S-182-TC-2 579.9 52.0 43.2 9.82S-182-TC-3 523.6 51.0 39.8 9.54S-183-TC-2 585.3 51.0 42.4 9.66S-183-TC-3 546.0 48.1 39.3 9.10
Table 26. Steam Oxidation of Sandvik Zircaloy-4 PWR Tubingat 13040C (23790F) (10 mol % Nitrogen Added to Steam)
Time Layer Thickness Total OxygenExpt. No. (s) Oxide Alpha (mg/cm2)
(pm) (Pm)
S-174-TC-2 31.5 28.4 32.5 5.92S-174-TC-3 27.1 26.7 31.9 5.60S-176-TC-2 30.5 28.1 33.2 5.89S-176-TC-3 31.5 27.7 33.8 5.85S-177-TC-2 30.4 28.2 33.4 5.91S-177-TC-3 25.5 25.6 30.0 5.36S-178-TC-2 158.4 60.7 74.2 12.87S-178-TC-3 157.0 60.1 71.2 12.68S-179-TC-2 170.1 60.7 74.4 12.93S-179-TC-3 167.6 61.5 73.4 13.00

89
Table 27. Steam Oxidation of Sandvik Zircaloy-4 PWR Tubingat 13040C (23790F) (10 mol % Oxygen Added to Steam)
Time Layer Thickness Total OxygenExpt. No. (s) Oxide Alpha (mg/cm )
(Pm) (Im)
S-192-TC-2 27.6 26.3 29.7 5.48S-192-TC-3 26.5 26.6 31.2 5.55S-193-TC-2 25.8 26.6 28.3 5.46S-193-TC-3 24.7 27.2 28.4 5.54S-194-TC-2 147.5 57.7 65.7 12.10S-194-TC-3 128.0 56.2 62.0 11.67S-195-TC-2 143.1 57.0 63.2 11.90S-195-TC-3 147.3 58.8 66.2 12.28
Table 28. Steam Oxidation of Sandvik Zircaloy-4 PWR Tubingat 1304°C (23790F) (5 mol % Hydrogen Added to Steam)
Time Layer Thickness Total OxygenExpt. No. (s) Oxide Alpha (mg/cm )
(Pm) (Pm)
S-184-TC-2 33.8 29.5 35.1 6.19S-184-TC-3 34.4 29.1 35.7 -6.15S-185-TC-2 32.9 28.5 34.7 6.02S-185-TC-3 28.4 26.7 32.5 5.63S-186-TC-2 173.8 60.2 72.1 12.80S-186-TC-3 157.4 58.2 68.9 12.32S-187-TC-2 152.4 57.9 68.1 12.23S-187-TC-3 160.2 59.7 -70.5 12.61

i- U-
90
ORNL-OWG 76-152473000
2500 1
E
t 2000
Cl)
!-
C50WzIC 1500UXI.-
500
0
I I I I ISCOPING TEST: 10 mol % N 2 IN STEAMMINIZWOK EXPTS., SANDVIK TUBING, 11014C
0 OXIDE vI,_ ALPHA / ._'_a
OXIDE, PURE STEAM -
0/
A"
, .ALPHA, PURE STEAM
0 400 200 300 400
TIME (sac)500 600 700
Fig. 40. Oxidation of Sandvik Zircaloy-4 PWR Tubing at 11010C(2014'F) in Steam Containing 10 Mole % N2. Solid and dashed linesrepresent parabolic oxide and alpha layer growth in pure steam.
ORNL-DWG 76-15249
2500
Et. 2000
ct-U)
Z 1500YI
>- 10004-J
500
00 400 200 300
TIME (s400 500 600 700
Fig. 41. Oxidation of Sandvik Zircaloy-4 PIWR Tubing at 1101%C(2014'F) in Stam Containing 10 Mole % 02. Solid and dashed linesrepresent parabolic oxide and alpha layer growth in pure steam.

91
3000
2500
N
E._ 2000
N
tnU)
X
cr
U 4000Jzi
-J
500
0
ORNL-DWG 76-15250
0I ~ I-IVgSCOPING TEST: 5 moI % H2 IN STEAM
MINIZWOK EXPTS., SANDVIK TUBING41041C
0 OXIDE* ALPHA -00 A
OXIDE,PURE STEAM
.. " ALPHA, PURE STEAM&0
0 400 200 300 400TIME (sec)
500 600 700
Fig. 42. Oxidation of Sandvik Zircaloy-4 PW4R Tubing at 11010C(20140F) in Steam Containing 5 Mole % H2. Solid and dashed linesrepresent parabolic oxide and alpha layer growth in pure steam.
6000
5000
E2 4000
Cn(n
z 3000C
a:
W 2000.4-J
1000
0
ORNL-DWG 76-15248
SCOPING TEST: 10mol % N2 IN STEAM aMINIZWOK EXPTS.,SANDVIK TUBING ,1304 *C
o OXIDEA ALPHA
ALPHA PURE STEAM* -
- O X DE P U E S T E M - _ __ _ _
0 20 40 60 80 400 420 140TIME (sec)
460 480
Fig. 43. Oxidation of Sandvik Zircaloy-4 PWR Tubing at 13040C(23790F) in Steam Containing 10 Mole % N2. Solid and dashed linesrepresent parabolic oxide and alpha layer growth in pure steam.

92
ORNL-DWG 76-152546000
5000
Et 4000
Cn
z<3000
2000-j
1 000
00 20 40 60 80 400 420 140 460 480
TIME (sec)
Fig. 44. Oxidation of Sandvik Zircaloy-4 PWR Tubing at 1304%C(23790F) in Steam Containing 10 Mole % °2* Solid and dashed linesrepresent parabolic oxide and alpha layer growth in pure steam.
6000 .
SCOPING TEST: 5 mol % Hz IN STEAMMINIZWOK EXPTS., SANDVIK TUBING, 13040C
5000 0 OXIDEa ALPHA
ORNL-DWO 76-15252
N
9 4000 -
J.
U)Inw
1 3000 -X
I.-
>- 2000
1000
0-0 .20 40 60 80 100
TIME (sec)420 140 460 180
Fig.. 45. Oxidation of Sandvik Zircaloy-4 PIWR Tubing at 13040C(23790F) in Steam Containing 5 Mole % H2. Solid and dashed linesrepresent parabolic oxide and alpha layer growth in pure steam.

- -
93
additions to the steam in which (possibly) a kinetic effect was observed
was the set for oxidation at 1101'C (2014'F) in steam containing
10 mole % 02
While the number of experiments in these scoping tests was rela-
tively small, it is nevertheless possible, as mentioned above, to
compute parabolic rate constants from the oxide and alpha layer thick-
ness measurements for each set. These rate constant values are compared
with those of the baseline data set in Tables 29 and 30. With the one
exception, the maximum difference observed in the rate constants was
less than 10%, indicating again that for the particular concentration
levels studied, the influence of the gaseous impurities on the kinetics
of oxidation was very small.
Alloy Composition Variation
In order to assess the possible influence of small differences in
the alloy composition of reactor-grade Zircaloy-4 tubing on the oxida-
tion kinetics, measurements were made at two temperatures on specimens
obtained from an alternate tubing supply that we have designated
Batch B*. Using the identical equipment and procedures documented
previously, steam oxidation experiments were conducted at 1153 and
1504%C (2107-27390F) for comparison with the standard Sandvik tubing
data for these same temperatures.
The data obtained for oxidation of the Batch B tubing are given
in Tables 31 and 32. Also listed in these tables are the calculated
values for the total oxygen consumed by the specimens. Parabolic
plots for the thickening of the oxide and alpha layer are presented in
Figs. 46 and 47, which include the comparisons to the baseline Sandvik
tubing data taken from the analytical representations. These compari-
sons show insignificant differences in the rates of alpha layer growth
at these temperatures and small but apparently consistent differences
in the rates of oxide layer growth. Tabulated values of the rate
*Reactor grade PWR Zircaloy-4 tubing, Batch B. Composition(wt %): 1.3 Sn, 0.22 Fe, 0.10 Cr, 0.125 0, 0.010 C, 0.0015 N, and0.0015 H.

Table 29. Comparison of Parabolic Rate Constants for Oxidation in Steam at 11010C (20140F)(Impurity Gas Additions)
Parabolic bParabolicDaaStRate Constant aDifferenceb Rate Constant DifferenceDat2St*(oxide) (% (alpha) M%
2P
Basic (pure steam) 2.198 1.673
10 mol % N2 added 2.201 ± 5.4% .l1.698 ± 8.4% +1.5
10 mol % 02 added 2.618 ± 8.1% +19.1 1.269 ± 34.9% -24.1
5 mol % H2 added 2.289 ± 9.1% +4.1 1.564 ± 16.0% -.
aError limits indicate uncertainty at 90% confidence level.
b~erentdifference compared to baseline value.
%s
C .C.

(
Table 30. Comparison of Parabolic Rate Constants for Oxidation in Steam at 1304'C (23790F)(Impurity Gas Additions)
C
Parabolic b Parabolic
Data Set Rate Constant Difference Rate Constant DifferencebS2 (oxide) (%) (alpha) (%)
cm2/s x 107 -a, cm2 /s x 1072 c2s2'
Basic (pure steam). 1.194 1.619
10 mol % N2 added 1.136 ± 4.1% -4*9 1.652 ± 3.9% +2.0
10 mol % 02 added 1.170 ± 6.3% -2.0 1.467 ± 5.2% 9.3
5 mol % H2 added 1.087 ± 5.5% -9.0 1.531 ± 6.0% -5.4
a.
aError limits indicate uncertainty at 90% confidence level.
bPercent difference compared to baseline value.
MDAn

I r
96
Table 31. Steam Oxidation of Batch B Zircaloy-4at 11530C (2107 0F)
PIWR TubingJ-
Time Layer Thickness Total OxygenExpt. No. Cs) Oxide Alpha (mg/cm )
(Pm) (Pm)
AB-197-TC-2 239.4 37.4 39.5 7.51AB-197-TC-3 231.7 37.1 39.0 7.44AB-198-TC-2 103.5 24.2 30.7 5.01AB-198-TC-3 103.1 24.2 30.3 5.00AB-202-TC-2 182.4 32.8 35.1 6.59AB-202-TC-3 174.3 32.0 34.1 6.43AB-203-TC-2 294.4 41.0 43.9 8.26AB-203-TC-3 284.0 40.1 42.9 8.08AB-206-TC-2 246.6 37.6 37.2 7.48AB-206-TC-3 241.0 38.0 37.7 7.55AB-207-TC-2 181.6 33.4 36.7 6.73AB-207-TC-3 165.4 31.4 35.0 6.35AB-208-TC-2 386.0 46.4 46.0 9.25AB-208-TC-3 374.3 45.5 44.7 9.06AB-209-TC-2 101.8 25.7 29.3 5.19AB-209-TC-3 92.7 24.4 28.5 4.95
Table 32. Steam Oxidation of Batch B Zircaloy-4 PWR Tubing
at 15040C (2739 0F)
Time Layer Thickness Total oxygenExpt. No. (s) Oxide Alpha (mg/cm-)
(Pm) (Pm)
AB-210-TC-2 25.7 44.6 68.1 10.33AB-210-TC-3 27.0 44.9 70.8 10.50AB-211-TC-2 28.7 46.8 74.3 10.95AB-211-TC-3 26.3 44.7 68.2 10.37AB-212-TC-2 16.2 36.9 56.0 8.49AB-212-TC-3 16.2 36.9 54.7 8.45AB-213-TC-2 17.2 38.0 53.6 8.61AB-213-TC-3 16.8 36.4 56.9 8.47AB-214-TC-2 40.1 59.8 84.3 13.50AB-214-TC-3 37.5 54.0 81.6 12.48AB-215-TC-2 35.7 51.8 80.1 12.06AB-215-TC-3 34.2 51.8 77.1 11.93AB-216-TC-2 7.7 27.3 38.8 6.14AB-216-TC-3 8.1 27.4 38.5 6.17AB-217-TC-2 7.3 25.0 38.0 5.75AB-217-TC-3 6.9 24.5 36.3 5.60AB-218-TC-3 47.9 62.0 89.7 14.17AB-219-TC-2 51.4 61.6 94.8 14.34AB-219-TC-3 49.8 61.4 95.6 14.31

-
97
ORNL-DWG 76-152463000
2500
E:j2000
N
LI)z
1- 000tr
L-J
- 500
0
SCOPING TEST: BATCH "B" TUBING _MINIZWOK EXPTS., 1f53-C . 0
o OXIDE - ____ !~
* ALPHA -
OXIDE, SANDVIK . 4 8
ALPHA, SANDVIK-tjA
,_ ', ALPHA, BATCH "B"
- \ 'OXIDE, BATCH "B"
/_ II0 50 100 150 200 250 300 350
TIME (sec)400
Fig. 46. Steam Oxidation of Batch B Zircaloy-4 PWR Tubing at1153°C (2107°F). Dashed lines represent parabolic oxide and alphalayer growth on Sandvik tubing.
OtNL-D*W ?4-1524510.000
9000
8000
7000
E
- 6000
WIhiX 5000
10-W 4000
3000
2000
4000
* 00
SCOPING TEST * BATCH *B' TUBING_MINIZWOK EXPTS.. 1504-C
o OXIDE .* ALPHA /
ALPHA. SANDVIIC
£ LPHA. BATCH BS
OXIDE. SANDVIK-= ; 0
_ _ OiDE BATH
- I I40 20 30
TIME (sec)40 SO 60
Fig. 47. Steam Oxidation of Batch B Zircaloy-4 PWR Tubing at15040C (27390F). Dashed lines represent parabolic oxide and alphalayer growth on Sandvik tubing.

l M_
98
constants calculated from these data are given in Table 33. The
percentage difference in the rate constants for oxide layer growth for
the two batches of tubing is small in both cases, but is measurably
less at the higher temperature.
Summary of Isothermal Scoping Test Results
(1) Variations in the steam flow rate from about 1 m/s to about
18 m/s exhibited only minor effects on the oxidation of Zircaloy-4 PWR
tubing. A few preliminary testslc were run with steam velocities as
low as 0.2 m/s with similar results. These results are consistent with
those of Biederman, et al.17 who reported no effects even under conditios
of no forced steam flow (only convective currents). Kawasaki, et al.31
also reported no measurable effect of steam flow rate for experiments
at 10000C (1832 0F) where the flow rate was varied from about 0.2 to
1.6 m/s.
(2) Variations in the steam injection temperature from approximately
150'C (2020F) to above 1000'C (18320F) produced no significant pertur-
bation of the oxidation kinetics. Biederman, et al. 17 reported no
measurable effects for steam superheat temperatures from 66 to 316'C
(150-6000F).
(3) The composition of our alternate supply of PWR tubing was
slightly different from that of the standard Sandvik tubing, and this
compositional variation produced only a small but consistent variation
in the rate of growth of the oxide layer; alpha layer growth was
unchanged. Biederman, et al.,17 reported no significant differences
in oxidation behavior for three batches of tubing, perhaps because only
very small compositional variations existed.
(4) Additions of 10 mole % N2, 10 mole % 02 or 5 mole % H2 to the
steam were shown to have only minor, if any, effects on the oxidation
rate of Zircaloy tubing.
COMPUTER CODES AND TRANSIENT-TEMPERATURE OXIDATION
Two computer codes have been developed that permit, on the basis
of an ideal model, the calculation of important kinetic and oxygen

C C (C
Table 33. Comparison of Parabolic Rate Constants for Sandvik and Batch 1B' Tubing at 1153 and 1504'C
Parabolic ParabolicRate Constanta Difference Rate Constanta Differenceb
Data Set (oxide) (%) (alpha) (%)62 62!i cm2/s x 108 2' X x 1082' C2sx1 2'
Sandvik, 11530C 3.551 3.183Batch 'B', 1153-C 2.875 + 4.3% -19.0 3.112 + 16.6% -2.2
Sandvik, 1504%C 43.34 91.27Batch 'B', 15040C 39.16 ± 5.2% -9.6 89.17 + 3.4% -2.3
Error limits represent uncertainty at 90% confidence level.
bPercent difference compared to baseline value.
DO

I "Y
100
distribution parameters during any given temperature excursion for
Zircaloy in steam.
SIMTRAN is a Fortran IV computer program written for the IBM 360/91
system which solves SIMultaneously the TRANsport equations for both heat
and mass flow for the one dimensional, multiphase, moving boundary,
transient temperature transport problem in a finite geometry system
defined by cylindrical coordinates. The code utilizes an ideal diffu-
sion model based on a finite difference analysis that requires uniform
layer growth of all phases and assumes the existence of thermodynamic
equilibrium at all interfaces at all times.
BILD5 is a much simpler code that is a modified version of a program
used in some prior analyses of the oxidation of Zircaloy.33'34 It pre-
dicts oxide thickness, alpha thickness, and total oxygen consumption by
an integration of the various rate constants for a given time-temperature
cycle. A finite difference method is used to calculate the oxygen con-
tent and distribution within the beta region.
Isothermal Model Verification
The mass transport equations in our major computer code, SIMTRAN,
are solved using a model based on Fick's laws of diffusion and the
premise that thermodynamic equilibrium is maintained at all interfaces.
The basic input to this portion of the code consists of the oxygen
diffusion coefficients and equilibrium oxygen concentrations in each
of the phases. With the exception of numerical values for these important
input data, a detailed description of the code has been published as a
topical report2 and will not be considered here.
In order to obtain an acceptable verification of SIMTRAN for iso-
thermal oxidation, it is then necessary to supply consistent sets of
oxygen diffusivity and oxygen solubility data as functions of tempera-
ture that combine to yield good agreement with the experimental obser-
vations for layer thickness growth. Literature data for these quantities
for all phases of the Zircaloy-oxygen system at elevated temperatures
are scarce and are of generally unknown accuracy. Thus, care must be
exercised to insure that the predictions of the code, which rely on

101
this input, agree with the experimental results for isothermal oxidation
before comparisons are attempted for transient temperature reaction.
The equilibrium solubility values for oxygen utilized in the present
version of SIMTRAN are those listed in an earlier chapter of this report,
and were selected from the data of Ruh and Garrett,21 Gebhardt, et al.,22
Domagala and McPherson23 for the system Zr-0, and recent results from
ANL by Chung, Garde and Kassner24 for the system Zircaloy-0. The
effective oxygen diffusion coefficients were calculated from the data
generated in this program. The chemical diffusion coefficient for
oxygen in the beta phase of Zircaloy-4 was determined4 by direct mea-
surements as a function of temperature to be
D = 0.0263 exp(-28,200/RT['K]) cm2/s . (9)
The diffusion coefficients of oxygen in Zircaloy oxide and in alpha
Zircaloy were determined by a treatment of the kinetic phase-growth data
obtained in the present investigation. A topical report describing
these calculations and results has been issued.5 This treatment involved
a consideration of the system as a classical multiphase, moving boundary,
diffusion problem in which the diffusion coefficients were expressed
in terms of the reaction rate constants and solubility values. The
appropriate chemical diffusion coefficients for oxygen in the tetragonal
oxide phase and in the oxygen-stabilized alpha phase are, respectively,
Dox = 0.1387 exp(-34,680/RT['K]) cm2/s (10)
D 3.923 exp(-51,000/RT[0K]) cm2/s . (11)a
Using the above values for the oxygen solubilities and diffusivities,
a comparison between the SIMTRAN-predicted and the experimentally
observed values for oxide layer thickness, alpha layer thickness, and
oxygen consumed as a function of time was made over the temperature
range 1000-1500%C (1832-27320F). Temperatures lower than 1000'C (18320F)
were not included in this comparison because the non-parabolic kinetic
behavior observed for the oxide layer at these temperatures does not
conform to the SIMTRAN model, which requires diffusion controlled,
parabolic kinetics.

102
For isothermal oxidation at 1000 to 1500'C (1832-27320F) over the
range of times reported in our experiments, SIMTRAN predictions of the
important kinetic parameters compared to the parabolic representations
of the experimental data were considered to be excellent (which is not
surprising, since the SIMTRAN input was derived in part from the experi-
ments themselves). For example, SIMTRAN overpredicted the oxide layer
thickness by less than 3% over the whole temperature range; the agree-
ment for alpha growth and total oxygen consumption was even better.
Thus, with the noted exception for temperatures less than 1000'C (18320F),
we regard these results as a code or model verification for reaction
under isothermal conditions.
An isothermal oxidation verification is redundant in the case of
the BILD5 code since it makes direct use of the parabolic rate constants
to compute the rates of increase of the kinetic parameters. Of course,
this code in its present form also cannot be used to consider oxidation
where non-parabolic behavior exists. No direct experimental verification
of the accuracy of the BILD5 calculation of the oxygen distribution in
the beta phase is available except to note that it compares favorably
with the SIMTRAN calculation.
Mixed-Temperature Experiments
In addition to the isothermal experiments at 900 and 1005'C
(1652-1841'F), we conducted several experiments in MaxiZWOK in which
the steam and furnace temperatures were maintained at different values.
The purpose of such experiments was two-fold. First, the furnace and
steam temperatures are the principal variables governing the rate of
heat transfer mechanisms. Thus, the specimen heating and temperature
overshoot behavior could be examined over a range of conditions. Such
information is useful for comparison with the results of SIMTRAN, which
can predict such temperature excursions on the basis of an ideal model.
Secondly, these data permitted an additional evaluation of the effect
of inlet steam temperature, per se, on the kinetics of the steam-
Zircaloy reaction.
Three mixed-temperature experiments were conducted with the steam
temperatures varying from 894 to 9940C (1641-1821'F) and furnace

103
temperatures varying from 1040 to 1110%C (1904-2030'F). Except for
the degree of overshoot, the specimen temperature response in all three
runs was similar and is illustrated in Fig. 48. This drawing was made
from the recorder trace for the experiment in which the steam tempera-
ture was controlled at 9940C (18210F) while the furnace was maintained
at 11100C (20300F). In this environment the Zircaloy-4 PWR tube speci-
men experienced a 43%C (770F) temperature overshoot before its tempera-
ture decreased to an equilibrium value of 10570C (19350F). Thus, even
at this comparatively low temperature, it is evident that appreciable
specimen self-heating can occur. It would be anticipated that for
similar heat transfer characteristics, the extent of self-heating would
increase substantially with increasing temperature.
If the time of this pseudo-isothermal experiment is normalized to
an effective value for an isothermal experiment at 1050%C, we find that
ORNL-OWG 75-123301100
1000
900
Uj
cr:
a-:
IL
800
700
' gEXPT. MAX -20
t -FURNACE TEMPERATURE:11i10°Cl STEAM TEMPERATURE: 994eC
/ STEAM FLOW: :0.78 lb/mint ~SPECIMEN TEMPERATURE: -
PEAK 1100°CEQUIL. 1057°C
_I I I1100
1090
1080
1070
I1060
1050 I20 40 60
600
500
4000 20 40 60
TIME (sec)80 100 120
Fig. 48. Specimen Temperature as a Function of Time for MixedTemperature MaxiZWOK Oxidation Experiment. Detail of temperatureovershoot due to specimen self-heating is shown in inset.

I E
104
the measured values of oxide and alpha layer thicknesses (40.3 ± 1.9 and
37.5 ± 3.1 pm, respectively) agree within the uncertainty limits with
the standard experimental data set obtained in MiniZWOK for this temper-
ature (39.0 ± 1.1 and 31.0 ± 4.4 pm, respectively). This suggests that
our methods of time-temperature normalization are satisfactory and
offers an additional point where a good agreement exists for data
obtained in our two oxidation apparatuses.
This experiment was also used to test the temperature-time predictive
capability of SIMITRAN on the basis of the physical property, heat-of-
reaction and heat-transfer data input to the code. The specimen is
assumed to be inserted into an environment where it receives heat by
radiation from the furnace wall and by convection from the flowing
steam. It was found that very good agreement between the observed and
predicted temperature cycles could be obtained simply by varying the
convective (steam) heat-transfer coefficient within a reasonable range.
For example, a convective heat transfer coefficient of .00407 cal/s-cm2 _0C
(30 Btu/hr-ft2 -°F) used as input to SIMTRAN produced the result illus-
trated in Fig. 49, which is a comparison with the actual experiment.
ORNL-DWG 76-18517
1100
1000
o 900
I-D 800
a:
XT 700
600
500
400
F=~~~ IIII
-- ,-- -0 - -
SIMTRAN (hc 0.004 cal/sec-cm2 -C)-o-MAX-20
_ _ IL I I0 10 20 30 100 200 300 400 500 600
TIME (sec)
Fig. 49. A Comparison of the Observed and SIMTRAN-Predicted Time-Temperature Excursion for Expt. MAX-20. \2
105
The agreement is seen to be quite good, particularly in the light of the
assumptions which go into this calculation. Such agreement lends a
degree of confidence to the SIMTRAN predictions of time-temperature
behavior during exposure of Zircaloy tubes at higher temperatures under
known heat-transfer conditions.
Transient Temperature Oxidation Experiments
A variety of transient temperature oxidation experiments was
performed in order to test the predictions of our computer codes. The
temperature-time profiles used are shown in Fig. 50. The very simple
transients in Fig. 50(a) were designed to investigate the effects of
variations in heating and cooling rates on code predictions. The
profiles in Fig. 50(b) should reveal any effects on oxidation rate
related to changes in scale microstructure or other factors influenced
by an increase or decrease in temperature near the beginning or the
end of the transient. Curve No. 1 in Fig. 50(c) simulates a transient
calculated for a particular hypothetical LOCA; curve No. 2 is similar
except that the maximum temperature of the blow-down peak was increased
from 900%C (16520F) to 14000C (25520F).
Oxide and alpha phase thickness measurements were made for each of
the transient-temperature oxidation tests. For several representative
transients, as shown in Table 34, the predictions of the SIMTRAN and
BILD5 codes were compared with the experimental measurements. The code
predictions were made on the basis of approximate descriptions of the
exact time-temperature cycles, and the code results are, therefore,
thought to be slightly conservative. For the cases examined to date,
except as noted below for the "two-peak" transients, both codes predict
oxide thickness after transient oxidation to within about 10%. However,
the tendency for the formation of "alpha incursions", as opposed to
uniform alpha layer growth, during the cooling portion of a transient-
temperature oxidation test represents a growth situation that is not
properly modeled by the ideal growth schemes employed by the codes. In
SIMTRAN, for example, the alpha-beta boundary movement is accelerated
during cooling due to the changes in the equilibrium solubilities and

I 'N
106
1200
800
400
ORNL-DWG 76-10761
II %\I\ -
I%
\\I ~0
I-
a.
w
0
16000 90 180 270 360 450
1200
800
400
00 90 180 270 360 450
TIME (sec)
1 500
an
w 1000C-
wa.
~w 500
00 100 200 300 400
TIME (sec)500
Transient Temperature Experiments.
Fig. 50. Schematic Representations of the Time-Temperature Profilesof Transient Temperature Oxidation Tests.
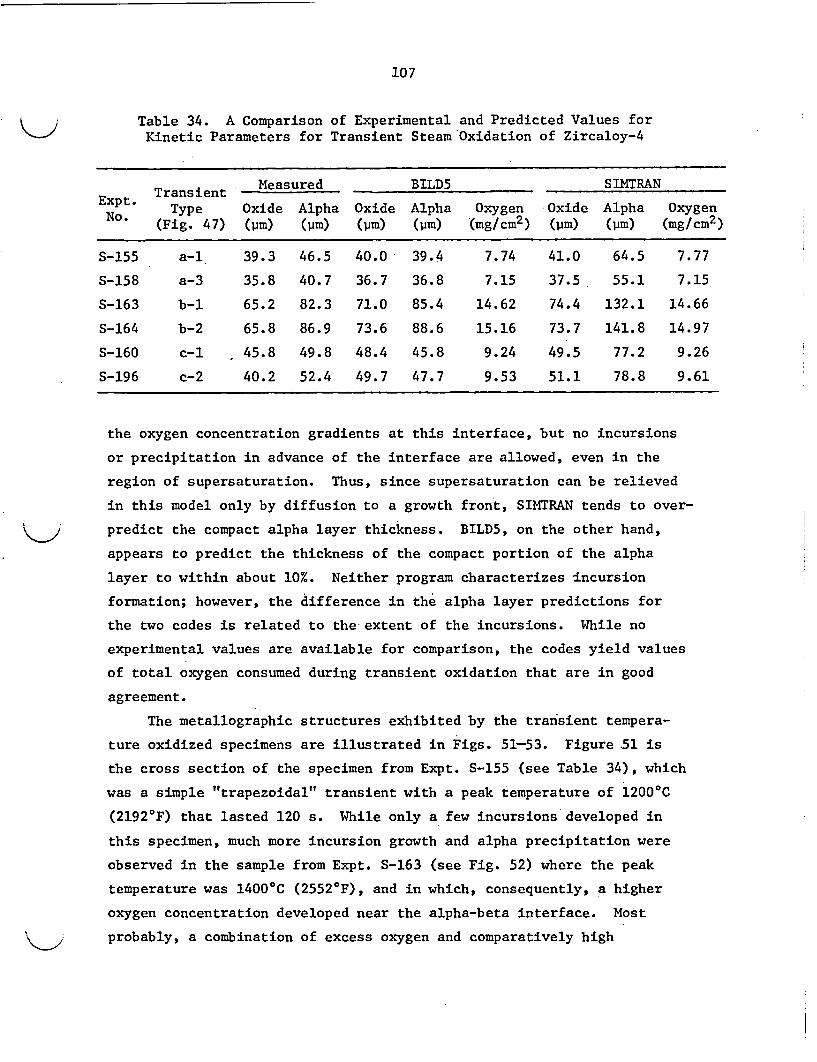
107
Table 34. A Comparison of Experimental and Predicted Values forKinetic Parameters for Transient Steam Oxidation of Zircaloy-4
Transient Measured BILD5 SIMTRAN
Expt. Type Oxide Alpha Oxide Alpha Oxygen Oxide Alpha OxygenNo. (Fig. 47) (pm) (pm) (pm) (pm) (mg/cm2) (pm) (pm) (mg/cm2)
S-155 a-l 39.3 46.5 40.0 39.4 7.74 41.0 64.5 7.77
S-158 a-3 35.8 40.7 36.7 36.8 7.15 37.5 55.1 7.15
S-163 b-i 65.2 82.3 71.0 85.4 14.62 74.4 132.1 14.66
S-164 b-2 65.8 86.9 73.6 88.6 15.16 73.7 141.8 14.97
S-160 c-i 45.8 49.8 48.4 45.8 9.24 49.5 77.2 9.26
S-196 c-2 40.2 52.4 49.7 47.7 9.53 51.1 78.8 9.61
the oxygen concentration gradients at this interface, but no incursions
or precipitation in advance of the interface are allowed, even in the
region of supersaturation. Thus, since supersaturation can be relieved
in this model only by diffusion to a growth front, SIMTRAN tends to over-
predict the compact alpha layer thickness. BILD5, on the other hand,
appears to predict the thickness of the compact portion of the alpha
layer to within about 10%. Neither program characterizes incursion
formation; however, the difference in the alpha layer predictions for
the two codes is related to the extent of the incursions. While no
experimental values are available for comparison, the codes yield values
of total oxygen consumed during transient oxidation that are in good
agreement.
The metallographic structures exhibited by the transient tempera-
ture oxidized specimens are illustrated in Figs. 51-53. Figure 51 is
the cross section of the specimen from Expt. S-155 (see Table 34), which
was a simple "trapezoidal" transient with a peak temperature of 12000C
(21920F) that lasted 120 s. While only a few incursions developed in
this specimen, much more incursion growth and alpha precipitation were
observed in the sample from Expt. S-163 (see Fig. 52) where the peak
temperature was 14000C (25520F), and in which, consequently, a higher
oxygen concentration developed near the alpha-beta interface. Most
probably, a combination of excess oxygen and comparatively high

I n'
108
\\)
Fig. 51. Cross-Section of Sandvik Zircaloy-4 PWR Tube Oxidizedin Steam According to Expt. S-155. Max. temp. = 12000C (21920F).Etch-anodized; bright-field; 100x.
Fig. 52. Cross-Section of Sandvik Zircaloy-4 PWR Tube Oxidizedin Steam According to Expt. S-163. Max. temp. = 14000C (25520F).Etch-anodized; bright-field; 100x.
K I

109
Fig. 53. Cross-Section of Sandvik Zircaloy-4 PWR Tube Oxidized inSteam According to Expt. S-160. Max. temp. = 1200%C (21920F). Etch-anodized; bright-field; 100x.
temperatures (high oxygen mobility) favors the formation and growth of
incursions on cooling. However, incursions apparently can also form
in advanced stages of an isothermal reaction as the beta phase nears
saturation. For example, for isothermal reaction of our Sandvik PWR
tubes on one side at 1200%C (21920F), significant numbers of incursions
were observed in the microstructures after oxidation times approaching
1200 s. This general phenomenon was previously discussed by Hobson.35
Figure 53 is the cross section of the specimen from Expt. S-160, the
LOCA-like transient shown in Fig. 50(c)-l. A few incursions are observed
in the microstructure.
In terms of the total oxygen consumed by a reacting specimen, the
alpha incursion modeling problem is likely to be comparatively minor.
From the standpoint of the mechanical response of an oxidized specimen,
however, the existence of incursions is considerably more important.35
Anomalous Transient Temperature Oxidation
The experimental results obtained for the two transient temperature
oxidation tests illustrated in Fig. 50(c) and reported in Table 34 offer

------ L w.
110
an example of apparently "anomalous" oxidation behavior for this
material. It was observed that the measured oxide layer thicknesses
for the two transients were inconsistent with their known time-temperature
histories: less oxide existed after transient (2) than for transient
(1). This result, which appears to be identical to the "preoxidation"
effect reported by Biederman, Ballinger and Dobson,17d f was confirmed
by subsequent experiments and, additionally, was found to exist for
oxidation of pure zirconium. Also-in accord with the Biederman obser-
vations was the result that the calculated values, using the BILD5
program, for the oxide layer thicknesses based on the isothermal oxida-
tion data were consistently higher than those observed. The results of
these experiments are listed in Table 35.
Since the anomalous behavior occurred only for specimens subjected
to transients of the type shown in Fig. 50(c), it seemed reasonable to
assume that some feature of the initial peak created the conditions
necessary to produce the observed oxidation characteristics. One
obvious difference from transients in which "normal" behavior is obtained
is the fast cool and reheat portion of this type of transient. Thus, in
order to define further the particular characteristic of the time-
temperature cycle which leads to this effect, a number of steam oxidation
Table 35. Experimental and Predicted Layer Thickness Values forTransients Illustrated in Fig. 47(c)
Layer Thickness
Expt. No. Material Transient Measured CalculatedTypea
Oxide Alpha Oxide Alpha("m) (Pm) (0m) (pm)
S-160-TC-2 Zirc-4 (1) 45.8 49.8 50.5 47.9
S-162-TC-2 Zirc-4 (1) 47.5 51.0 51.6 49.7
S-196-TC-2 Zirc-4 (2) 40.2 52.4 51.2 49.6
S-199-TC-2 Pure Zr (1) 32.6 61.4
S-200-TC-2 Pure Zr (2) 26.0 66.4
Type (1): First temperature maximum = 9000C (16520F); Type (2);First temperature maximum = 1400%C (25520F).

- -
ill
experiments were performed on Zircaloy-4 specimens in the MiniZWOK
apparatus in which several key parameters of a double-peak transient
were varied.
The general form of the transients used for this series of tests is
illustrated in Fig. 54, which may be described as follows. The specimen
is heated quickly (in approximately 10 s) to the first peak temperature
T1, and cooled, again in Xu 10 s, to a specified lower temperature, T2.
The specimen is then reheated to T3 (unless T2 = T3), held under iso-
thermal conditions for a time, t3, and finally cooled. The nominal
test conditions for this series are listed in Table 36. Included in
this table are values of the observed and calculated oxide thicknesses from
which it is possible to detect the occurrence of anomalous behavior. It
should be pointed out that the calculations, which utilized the BILD5 code,
were made on the basis of the CODAS output for each run and not on the basis
ORNL-DWG 76-45545
S -i
-~TI ME
Fig. 54. Schematic Representation of Double-Peak Transients Usedto Study Anomalous Transient Temperature Oxidation Effect. See Table 36for list of nominal times and temperatures.

Table 36. Nominal Test Conditions for Anomalous Transient Temperature Oxidation Tests
Maximum Temp. Minimum Temp. Plateau - Plateau
Expt. No. First Peak After Temperature Time Oxide Layer Thicknesses DifferenceTT T2 °3 t 3 Calculated Observed(0C) (0C) (0C) (s) (Pm) (pm)
S-224 1050 650 1050 210 25.2 12.2 107
S-225 1400 650 1050 210 27.2 12.6 116
S-226 1400 650 1200 110 38.8 36.3 7
S-227 1050 650 1400 55 52.9 50.2 5
S-228 1400 650 1400 55 56.7 54.0 5
S-229 1400 1200 1200 190 51.7 49.7 4
S-230 1400 1200 1200 210 50.0 48.4 3
S-231 1400b 1200 1200 160 54.9 53.1 3
S-232 1400b 1200 1200 100 61.4 60.6 1
S-238 1400 1050 1050 200 28.4 29.4 -3
S-239 1400 650 1090 165 28.2 10.5 169
aPercent difference between observed and calculated layer thicknesses.
bSlowly cooled from T1.
-.)
(. C

- -
113
of the nominal time-temperature descriptions given for each experiment
in Table 36.
Of the oxidation tests reported in Table 36, three exhibited
significant differences between the observed and calculated oxide
thickness values and were considered anomalous. Common to all three
of these experiments were the facts that (1) each was a "two-peak"
transient, (one in which the specimen was cooled significantly between
heating cycles), and (2) the temperature of the second peak was less
than 12000C (21920F). Important clues relating these facts to a viable
mechanism may be obtained by comparing several of the experimental
observations. For example, Expt. S-224 differs from a standard iso-
thermal experiment at 1050*C (19220F) only in that the specimen was
cooled to 650%C (1202'F) and then reheated to 1050%C (19220F). This
difference obviously was important. Expt. S-227 involved the same
initial peak as S-224, but subsequent oxidation took place at 1400%C
(25520F) rather than 1050%C (19220F). Anomalous behavior for this
experiment was not observed.
A similar sequence is found in which the initial peak temperature,
T1, was 1400%C (25520F). Expt. S-225 differs from S-238 only in that
the former specimen was cooled and reheated to the plateau temperature,
10500C (19220F), while the latter was simply cooled to the plateau
temperature from T1. The cooling-reheating sequence after the first
temperature maximum is thus a critical parameter. Expts. S-239, S-226
and S-228 differ from S-225 only in the temperature of the second peak
(or plateau), T3. For T3 = 1090%C (19940F), anomalous behavior was
observed; for T3 = 1200°C (2192°F) or 14000C (2552°F) the oxidation
was considered normal.
The results of these experiments constitute a convincing set of
evidence that points to the involvement of the monoclinic-tetragonal
phase transformation in the oxide in the mechanism responsible for the
anomalous transient temperature oxidation effect. The key characteris-
tic appears to be the extensive temperature hysteresis associated with
the transformation.36,37
This behavior is illustrated by the high-temperature x-ray diffrac-
tion results of Grain and Garvie,36 shown in Fig. 55, who also demonstrated

In,
114
ORNL-DWG 76-455441.0
0.8enw
a.-J
o 0.6or
t-WI-
o 0.4z
C.)
0. 2
0 e=500 700 900 1400
TEMPERATURE ("C)1300
Fig. 55. Hysteresis in the Monoclinic-Tetragonaltion in ZrO2. After Grain and Garvie.35 036
Phase Transforma-
that the details of the transformation depended upon the crystallite size.
Upon heating, the transformation is seen to take place over a narrow
temperature range near 1200'C (22040F). On cooling, the reverse trans-
formation is initiated near 1000 'C (1832 0F) but is not completed until
the temperature has fallen several hundred degrees. A number of
investigators have observed similar transformation behavior.37 -39 These
data were obtained for ZrO2 specimens of a specified purity and treat-
ment which are certainly different from those of the oxide formed on
Zircaloy-4 under oxidizing conditions. However, it is reasonable to
assume that the general features of the transformation shown in Fig. 55
will apply to the Zircaloy oxide system.
K>,z1

115
It has been suggested by Pemsler and others40 that tetragonal
zirconia may be stabilized at lower temperatures by stress, small grain
size, or high defect concentrations, and there is evidence that the
growing oxide scale on Zircaloy-4 may have a tetragonal structure at
temperatures lower than those indicated in Fig. 55. Thus our oxidation
rate data at 1050%C (19220F) and, to a slightly lesser extent, at 10000C
(18320F) are completely consistent with .the results at higher tempera-
tures where the oxide is certainly tetragonal, and one is led to the
idea that the oxide formed during our typical "isothermal" excursions
at these temperatures is predominantly tetragonal. This conclusion is
also consistent with the fact that oxidation rates observed during the
first minute or two at 900 and 950'C (1652-17420F) agree well with those
predicted by extrapolations of the high temperature data.
Following Pemsler's arguments,40 it appears likely that in the
initial stages of our isothermal experiments at temperatures where the
monoclinic oxide is normally stable, a thin layer of the tetragonal
oxide is formed due to favorable conditions of stress, grain size, or
defect structure. During further oxidation at 1000 to 12000C (1832-21920 F),
the presence of this initial tetragonal oxide layer is sufficient to
stabilize the additional oxide generated in the tetragonal structure as
well. The decreased oxidation rates that we observed below 1000%C
(18320F) may be rationalized in these same terms if it is assumed that
the diffusion flux across a monoclinic oxide layer is smaller than that
for a corresponding tetragonal scale.40 Thus, below 10000C (18320F),
despite the formation of an initial layer of tetragonal Zircaloy oxide,
continued oxidation eventually results in the transformation of part of
the oxide to the monoclinic structure, presumably due to stress-relief,
grain growth, etc. If this transformation resulted in the formation of
layers of tetragonal and monoclinic oxide whose thickness ratio varied
with time, one would expect to see the non-parabolic oxide growth
kinetics that we have actually observed at 900 and 950%C (1652-17420F).
Returning to the question of anomalous transient temperature-
oxidation, an explanation for the phenomenon can be put forward on the
basis of a set of assumptions derived from the arguments just given and
of the experimental results summarized in Tables 35 and 36.
I nm
116
1. The initial oxide formed during a typical isothermal experiment
has a tetragonal structure.
2. If the isothermal oxidation temperature is greater than X'u 10000C
(18320F), the subsequently formed oxide will also be stabilized in the
tetragonal structure.
3. If the initially formed tetragonal oxide is held at a sufficiently
low temperature ["' 900%C (16520F) or lower], it transforms to the mono-
clinic structure, and any subsequently formed oxide will also be pre-
dominantly monoclinic unless the temperature is raised to A, 1200%C
(21920F).
4. The diffusion flux across a growing monoclinic Zircaloy oxide
scale is smaller than that for the corresponding tetragonal oxide.
In these terms the following sequence of events may be visualized
in a typical two-peak LOCA such as that hypothesized in Fig. 47(c).
1. The oxide formed during heating to the first peak temperature,
T1, (see Fig. 54) is predominately tetragonal.
2. On cooling to T2, the oxide transforms to the monoclinic
structure.
3. During the heating phase of the second peak, because of the
existence of the monoclinic oxide, oxidation proceeds more slowly than
would be predicted on the basis of the high temperature isothermal data,
and this condition will persist until a temperature near 1200'C (21920F)
is reached, at which time the monoclinic oxide is converted to tetragonal.
Three critical features can be identified in this model for anomalous
transient temperature oxidation: the minimum temperature reached after
the first peak, the rate of heating from this minimum to the second peak
temperature, and the second peak temperature itself. If, after the first
peak temperature is attained, the temperature is maintained at a suf-
ficiently high level to preclude transformation to the monoclinic oxide,
the oxidation kinetics for the transient will be normal in the sense
that the extent of oxidation will be predictable on the basis of high
temperature isothermal oxidation data. Even in cases where the oxide
is converted to the monoclinic. structure, if the heating rate to the
second peak is sufficiently fast and if the second peak temperature is
sufficiently high, no perturbation of the final oxide thickness will be

117
observed provided the time at the second peak temperature is long enough
to produce significant oxide growth. Anomalous transient temperature
oxidation effects are favored by conditions where the oxide transforma-
tion occurs after the first peak, the heating rate for the second peak
is low, and/or the second peak temperature is below ". 12000C (21920F).
The existence of the anomalous transient temperature effect
obviously raises questions concerning the techniques currently being
used to predict transient temperature oxidation behavior. Computer
codes based on typical isothermal oxidation results will tend to over-
predict oxide layer thicknesses and, hence, total oxygen consumption
(although not necessarily the quantity of oxygen dissolved in the beta
region) for a hypothetical two peak LOCA such as those shown in Fig. 50(c).
The critical factors in such a case are the minimum temperature reached
after the first peak, the maximum temperature of the second peak, and
the rate at which this second temperature is reached. The prospects
for more precise predictions of oxidation behavior during single peak
LOCA's are better, although the rate at which the maximum temperature is
attained could also be important. Clearly, however, the problem of
transient temperature oxidation predictions deserves further study.
CONCLUSIONS AND RECOMMENDATIONS
A variety of conclusions may be drawn and recommendations made on
the basis of results obtained in the ZMWOK Program.
1. The Program has yielded a set of isothermal reaction rate data
for the oxidation of Zircaloy-4 in steam between 900 and 1500%C
(1652-2732 0F). The conditions under which these data were obtained have
been carefully characterized, and the experimental procedures used in
the study were fully documented. In addition the data were subjected
to an extensive statistical analysis in order to establish appropriate
confidence limits for the results, and an analysis of the maximum
absolute errors inherent in the procedures was performed. Within the
limits thus established and for the comparatively ideal set of oxidation
conditions used, we consider this data set to be highly reliable.

I P
118
2. The ZMWOK data set provides a basis for quantifying the degree
of conservatism of the Baker-Just correlation for the oxidation rate
of Zircaloy. Under the conditions used for our experiments, the Baker-
Just relationship predicts oxidation rate constants 32, 78, and 147%
higher than ours at temperatures of 1000, 1200, and 1500%C (1832, 2192,
and 27320F), respectively.
3. A study of the influence of deformation during oxidation on the
oxidation rate of Zircaloy is beyond the scope of the ZMWOK program.
The effects of deformation could, however, alter the oxidation behavior
of Zircaloy. Under hypothetical loss-of-accident conditions in a PWR,
ballooning and possibly some bending of the fuel rods is anticipated.
Any oxide on the surface of the rod at such a time would tend to undergo
cracking with a resulting increase in oxidation rate. Whether the total
oxygen consumption per cm2 during the LOCA is significantly increased
would depend to a large extent on the temperature and time into the
LOCA at which deformation occurred. If tube rupture and, hence,
ballooning, are complete at temperatures near 900'C (16520F),
then the influence of deformation on the high temperature
oxidation process might be restricted to increases in the rate at which
the beta regions of the tube fill up with oxygen, an increase related
to the thinning of the tube wall during ballooning. We recommend, how-
ever, that the effect of deformation on oxidation be taken into con-
sideration in best estimate computer codes such as FRAP-T. Data from
other RSR-sponsored projects, e.g., the Multirod Burst Test Program,
should provide useful information in this regard.
4. Oxide layer growth at 900 and 950%C (1652-17420F) is not
describable in terms of parabolic kinetics. Extrapolation below r' 1000'C
(18320F) of high temperature rate constant data for oxide or Xi layer
growth or total oxygen consumption will yield overpredictions of these
quantities. However, the error resulting from such an extrapolation is
likely to be negligible if the time of oxidation at the lower tempera-
tures does not exceed X 100 s (but see Par. 7 below).
5. Neither steam flow rate (above levels leading to steam starva-
tion); steam temperature; the presence in the steam of reasonable
concentrations of oxygen, nitrogen, or hydrogen; nor small variations

119
in alloy composition significantly influence the isothermal rate of
oxidation of Zircaloy-4. Obviously, however, both steam temperature
and flow rate are important parameters in heat transfer calculations,
and any failure to remove the heat of the Zircaloy-steam reaction from
the fuel cladding can result in an increase in the temperature of the
cladding. We have shown that the extent of this temperature increase
can be calculated with the SIMTRAN computer code given an input of
appropriate heat transfer coefficients.
6. Except as described in Par. 7 below, the SIMTRAN and BILD5
computer codes can be used together to provide adequate predictions of
the thickness of oxide and oxygen-stabilized alpha layers and probably
of total oxygen consumption during transient temperature oxidation.
Neither code, however, models the formation of alpha incursions or
precipitates in the beta regions of a sample during the cooling phase
of most transients. It is likely that the presence of such precipitates
will influence the mechanical properties of the prior-beta regions, and
we recommend that a further correlation be developed between alpha
incursion formation during transient temperature oxidation and the
mechanical properties of the Zircaloy fuel tubes.
7. The two computer codes also overpredict oxide thickness and,
therefore, total oxygen consumption in certain hypothetical two-peak
LOCAs. This phenomenon is described in the body of the text (see p. 109)
as "anomalous transient temperature oxidation". Its occurrence is
probably related to the manner in which the monoclinic-to-tetragonal
phase transformation occurs in the oxide and to the extent that the
tetragonal oxide is stabilized at low temperatures by stress, departures
from stoichiometry, and other factors. Accurate predictions of overall
oxidation rates under these conditions clearly require that additional
research be done. It should be emphasized, however, that while overall
oxygen consumption during anomalous transient temperature oxidation is
less than expected, there is every reason to believe that the rate of
oxygen solution in the beta phase continues to be that predicted on the
basis of calculations using the high temperature data, that is, a reduc-
tion in the rate of oxide formation does not reduce the rate of embrittle-
ment of the beta phase due to oxygen solution.

I n
120
ACKNOWLEDGMENTS
The authors gratefully acknowledge the help received from many sources
during the course of this research. The excellent metallographic work of
E. T. Rose and N. M. Atchley was essential to the program. R. L. Anderson,
T. G. Kollie, and J. L. Horton of the Metrology Research and Development
Laboratory, Instruments and Controls Division, ORNL, were responsible
for the calibration of the thermocouples used and contributed many
helpful suggestions regarding thermometry problems. D. L. McElroy and
R. K. Williams also worked on thermometry problems and supplied advice
concerning several phases of the program. R. S. Graves and F. J. Weaver
helped with instrumentation, and T. G. Godfrey made possible the use of
the CODAS to collect experimental data. C. K. Bayne of the Computer
Sciences Division, ORNL performed the statistical analysis included in
the Appendix. D. 0. Hobson and R. A. Perkins reviewed the manuscript
and made numerous helpful comments during the course of the research.
We also received invaluable assistance from many members of the Instruments
and Controls, Plant and Equipment, and Analytical Chemistry Divisons at
ORNL; it is impossible to list all these people but certainly special X
thanks are due to R. F. Stone, C. D. Wicker, R. W.. Tucker, Wayne King, and
Paul Stafford. We are appreciative of the patience and skill of
Mrs. Sharon Buhl in preparing this report. Finally, we wish to
acknowledge the support and advice given by several members of the
Fuel Behavior Branch, Division of Reactor Safety Research, NRC and of
M. L. Picklesimer in particular.

-
121
REFERENCES
1. Quarterly Progress Report on the Zirconium MetaZ-Water OxidationKinetics Program Sponsored by the NRC Division of Reactor SafetyResearch for
(a) April-June 1974, ORNL/TM-4655(b) July-September 1974, ORNL/TM-4729(c) October-December 1974, ORNL/TM-4805(d) January-March 1975, ORNL/TM-4914(e) April-June 1975, ORNL/TM-5021(f) JuZy-September 1975, ORNL/TM-5148(g) October-December 1975, ORNL/TM-5248(h) January-March 1976, ORNL/NUREG/TM-17(i) ApriZ-June 1976, ORNL/NUREG/TM-41(j) July-September 1976, ORNL/NUREG/TM-62.(k) October-December 1976, ORNL/NUREG/TM-87(1) January-March 1977, ORNL/NUREG/TM-110.
2. S. Malang, SIMTRAN I - A Computer Code for the Simultaneous CaZcuZa-tion of Oxygen Distributions and Temperature Profiles in ZircaZoyDuring Exposure to High-Temperature Oxidizing Environments, ORNL-5083(November 1975).
3. J. V. Cathcart, et al., Zirconium Metal-Water Oxidation Kinetics I.Thermometry, ORNL-5102 (February 1976).
4. R. A. Perkins, Zirconium Metal-Water Oxidation Kinetics II.Oxygen-18 Diffusion in O-ZircaZoy, ORNL/NUREG/TM-19 (July 1976).
5. R. E. Pawel, Zirconium MetaZ-Water Oxidation Kinetics 111. OxygenDiffusion in Oxide and Alpha Zircaloy Phases, ORNL/NUREG-5 (October1976).
6. G. J. Yurek, J. V. Cathcart, and R. E. Pawel, "Microstructures ofthe Scales Formed on Zircaloy-4 in Steam at Elevated Temperatures,"Oxidation of Metals 10:255 (1976).
7. R. E. Pawel, R. A. Perkins, R. A. McKee, J. V. Cathcart, G. J. Yurek,and R. E. Druschel, The Diffusion of Oxygen in Beta-ZircaZoy and theHigh Temperature Zircaloy-Steam Reaction, to be published in ASTMSymposium Book on "Zirconium in the Nuclear Industry," Quebec City,Canada, Aug. 19-12 (1976).
8. "The International Practical Temperature Scales of 1968," (adoptedby the Comite International des POids et Mesures) MetroZogia 5(2):35-44 (1969).
9. W. T. Gray and D. I. Finch, "Accuracy of Temperature Measurements"Temperature, Its Measurement and Control in Science and Industry,4(2): 1381-1392, ed. by Harmon H. Plumb, Society of America, 1972.
I ML
122
10. D. T. Hawkins and R. Hultgren, "Constitution of Binary Alloys," inMetals Handbook, Vol. 8, American Society for Metals, Metals Park,Ohio, 1973, p. 33.
11. M. Hansen, Constitution of Binary Alloys, McGraw Hill, New York,1958, p. 1226.
12. T. G. Kollie, D. L. McElroy, R. K. Adams, and J. M. Jansen,"Measurement Accuracy of a Computer-Operated-Data-AcquisitionSystem," in Temperature, Its Measurement and Control in Scienceand Industry, Vol. 4, Part 2, H. H. Plumb, ed., Instrument Societyof American, Pittsburg, PA, 1972, pp. 1457-1466.
13. Summaries of pertinent phenomena, approaches, and remedies are givenin (a) A. J. Otter, Thermocouples and Surface Temperature Measure-ment, AECL-3062 (March 1968) or (b) Manual on the Use of Thermo-couples in Temperature Measurement, American Society for Testingand Materials, Spec. Tech. Publ. 470A, Philadelphia, 1974,particularly Chapter 9.
14. M. Jakob, Heat Transfer, Vol. II, Wiley, NY, 1957, p. 147.
15. L.M.K. Boelter et al., An Investigation of Aircraft Heaters,XXVIII - Equations for Steady-State Temperature Distribution Causedby Thermal Sources in Flat Plates Applied to Calculation of Thermo-couple Errors, Heat-Meter Corrections, and Heat Transfer by Pin-FinPlates, NACA-TN-1452 (1948).
16. L.M.K. Boelter and R. W. Lockhart, Thermocouple Conduction ErrorObserved in Measuring Surface Temperatures, NACA-TN-2427 (1951).
17. R. R. Biederman, R. G. Ballinger and W. G. Dobson, A Study ofZircaZoy-Stecn Oxidation Reaction Kinetics, Research Project No.249-1, Electric Power Research Institute, Palo Alto, California.
(a) First Interim Progress Report, January-March 1975(b) Second Interim Progress Report, April-June 1975(c) Third Interim Progress Report, July-September 1975(d) Fourth Interim Progress Report, October-December 1975(e) Fifth Interim Progress Report, January-March 1976(f) Final Report, September 1976.
18. R. K. Williams, "A Study of the Resistivity of Zone-RefinedTungsten at High Temperatures," J. AppZ. Phys. 46: 475-490 (1975).
19. D. L. McElroy and J. P. Moore, "Radial Heat Flow Methods for theMeasurement of the Thermal Conductivity of Solids" in ThermalConductivity, Vol I, R. P. Tye, ed., Academic Press, New York,1969, p. 190.

123
20. On the assumption that the oxide at the oxide/gas interface willbe approximately stoichiometric ZrO2 with a density of 5.82 g/cm
3.
21. Calculated from phase diagram for Zr-O presented by R. Ruh andH. J. Garrett, "Nonstoichiometry of ZrO2 and Its Relation toTetragonal-Cubic Inversion in ZrO2," J. Am. Ceram. Soc. 50: 257(1967). It should be noted that it is possible that impurities(such as those found in the Zircaloy series of alloys) wouldinfluence the defect concentrations.
22. E. Gebhardt, H. D. Seghezzi and W. DUrrschnabel, "Untersuchungen inSystem Zirconium-Sauerstoff," J. NucZ. Mater. 4: 255 (1961).
23. R. F. Domagala and D. J. McPherson, "System Zirconium-Oxygen,"J. Met. 6:, Trans. AIME 200: 238 (1954).
24. Analytical representation of data of H. M. Chung, A. M. Garde,and T. F. Kassner, Argonne National Laboratory, by S. Malang,Gesellschaft fUr Kernforschung, Karlsruhe, W. Germany. Privatecommunication and ANL-75-58 (September 1975).
25. R. H. Chapman, Characterization of Zircaloy-4 Tubing Procured forFuel Cladding Research Programs, ORNL/NUREG/TM-29 (July 1976).
26. For example, S. H. Makin, A. H. Rowe, and A. D. LeClaire, "SelfDiffusion in Gold," Proc. Phys. Soc. 70: 545-52 (1957).
27. Unpublished results, D. 0. Hobson and R. E. Pawel, ORNL (1973).Original data from D. 0. Hobson and P. L. Rittenhouse, EmbrittZe-ment of Zircaloy-CZad Fuel Rods by Steam during LOCA Transients,ORNL-4758 (January 1972).
28. L. Baker and L. C. Just, Studies of Metal-Water Reactions at HighTemperatures; III. Experimental and Theoretical Studies of theZirconium-Water Reaction, ANL-6548 (May 1962).
( 9. A. W. Lemmon, Jr., Studies Relating to the Reaction Between ZirconiumMa and Water at High Temperatures, BMI-1154 (January 1957).
30. H. H. Klepfer, reported in G. J. Scatina, Fuel CZadding EmbrittZe-ment during a Loss-of-CooZant Accident, NEDO-10674 (October 1972).
31. S. Kawasaki, T. Furuta, and M. Hashimoto, Reaction of ZircaloyCladding with Steam under Simulated Loss-of-CooZant AccidentConditions, JAERI-M-6181 (July 1975).
32. S. Leistikow, H. v. Berg, and D. Jennert, "Comparative Studies ofZircaloy-4/High Temperature Steam Oxidation under Isothermal andTemperature Transient Conditions," in Proceedings, CSNT SpecialistMeeting on the Behavior of Water Reactor Fuel EZements underAccident Conditions, Spatind, Nord-Torpa, Norway, September 13-16,1976, in press.

124
33. R. E. Pawel, "Diffusion in a Finite System with a Moving Boundary,"J. Nuci. Mater. 49: 281 (1974).
34. R. E. Pawel, "Oxygen Diffusion in Beta Zircaloy during SteamOxidation," J. NucZ. Mater. 50: 247 (1974).
35. D. 0. Hobson, "Ductile-Brittle Behavior of Zircaloy Fuel Cladding"in TopicaZ Meeting on Water Reactor Safety, March 26-28, 1973,G. A. Freund, compiler, pp. 274-288. USAEC-TIC CONF 730304.
36. C. F. Grain and R. C. Garvie, Mechanism of the MonocZinic toTetragonaL Transformation of Zirconium Dioxide, U.S. Bureau ofMines Report 6619 (1965).
37. P. Kofstad and D. J. Ruzicka, "On the Defect Structure of ZrO2 andHfO2," J. Electrochem. Soc. 110: 181 (1963).
38. For example, F. A. Mupton and R. Roy, "Low Temperature EquilibriaAmong ZrO2, ThO2 and U02," J. Am. Ceram. Soc. 43: 234 (1960).
39. W. L. Baun, "Phase Transformation at High Temperatures in Hafniaand Zirconia," Science 140: 1330 (1963).
40. J. P. Pemsler, "The Kinetics and Mechanism of Oxide Film Growthon Zirconium," EVectrochem. Tech. 4: 128 (1966).
KJ

125
APPENDIX A
ERROR ANALYSIS
INTRODUCTION
The experimental method used in this study requires the deter-
mination of three parameters, viz., temperature, time, and phase
thicknesses, in order that a rate of oxidation may be estimated. In
this section we analyze the uncertainties associated with these mea-
surements in an effort to establish rational error limits for the data
presented.
Two basic approaches are used. In the first the data are subjected
to a statistical analysis to establish the degree of self-consistency
of the results. Such a treatment reflects the reproducibility of the
data and sets confidence limits on the overall results; however, it
provides no information concerning any possible systematic errors
inherent in the techniques used.
In the second approach an attempt is made to establish limits for
these systematic errors through an analysis of the determinant errors
associated with the measuring techniques used and through an estimate
of the indeterminant errors involved insofar as they are reflected in
the raw data. An overall estimate of the absolute error limits is then
obtained by summing the determinant and indeterminant errors. It should
be emphasized that the results of this procedure represents the maximum
possibZe error for the data; the difference between the measured and
true values of a given parameter is expected in a very large majority
of instances to be significantly less than this maximum error.
STATISTICAL TREATMENT OF ISOTHERMAL OXIDATION RATE DATA
A statistical analysis of the isothermal oxidation rate data
generated in this program was performed. The analysis provided estimates
of the parameters of the Arrhenius prediction equation and, in addition,
provided 90% joint and individual confidence intervals for the rate

I Fit
126
constants and the parameters. The details of these calculations were
outlined in a previous report1 covering the diffusion results and will
not be repeated here.
Data
The isothermal steam oxidation rate data were assumed to be
represented by the parabolic rate of reaction kinetic model in time (t):
62dK = 1 K (Al)dt K 27
where K is a kinetic parameter (i.e., oxide layer thickness, *; alphalayer thickness, a; Xi (oxide + alpha) layer thickness, i; and total
oxygen consumed, T) and 62/2 is defined as the isothermal parabolicK
rate constant. The isothermal parabolic rate constant can be estimated
from the integrated form of Eq. (Al): K2 = K + 62t by the method of
least squares. The estimated values of 62/2 were calculated on theK
basis that K = 0, which assumes "ideal" parabolic behavior, and these0
estimated values are tabulated in Table Al. The parabolic rate con-
stants in Table Al were rounded to three significant figures for the
statistical treatments outlined below. Thus, the prediction equations
from this analysis are not precisely those presented earlier where
rounding was not done. The differences in the statistical parameters,
however, are negligible.
The treatments for the rate constants for the oxide layer and
subsequently for the e layer and T were restricted to the temperature
range 1050-1504%C (1922-27390F) for reasons discussed in the body of
this report. The alpha layer rate constants were examined for the
temperature range of 905-1504%C (1661-27390F).
Prediction Equations for Rate Constants
The theoretical prediction equation for a rate constant, 62/2 is:K
62/2 = Aexp(-Q/RT) , (A2)K

-
127
Table Al. Parabolic Rate Constant Data,62/2'K
Oxide Alpha Oxide + Alpha TotalTmru Layer Layer Layer Oxygen(*C) (cm2/s x 108) (cm2/s x 108) (cm2/s x 107) [(g/cm2)2/s] x 107
905 .101
956 .203
1001 .314
1050 1.40 .849 .442 .472
1101 2.17 1.95 .823 .807
1153 3.63 3.25 1.38 1.39
1203 5.39 5.87 2.25 2.18
1253 7.66 10.1 3.53 3.30
1304 11.4 15.9 5.43 5.08
1352 16.5 27.1 8.59 7.69
1404 23.5 41.2 12.7 11.3
1454 33.7 59.0 18.2 16.4
1504 45.2 85.9 25.6 22.8
where A and Q are constants to be determined from experimental data,
R[1.987 cal/(mole * kelvin)] is the gas constant and T is temperature
(kelvin). Equation (A2) is linearized by taking logarithms, in 62/2K
= in A - (Q/R) l/T, and, assuming-this linear model is the correct
representation of the data, the following computations can be made:
1. Calculate by the method of least squares a prediction equation:
in 62/2 = knAA - (Q/R) l/TK
2. Calculate the individual and joint 90% confidence intervals
on the expected values of the estimates knAA and (Q/R).
3. Calculate the 90% confidence interval for the expected pre-
dicted values of kn'42/2.K-4. Calculate the 90% confidence interval for the expected values
of A and Q.

I Fm
128
The symbol "^" over a letter means "the estimate of". For example,
Xn'A is "the estimate of" the constant In A.
Let Y = gn(62/2)i be the predicted value of the logarithm of a
rate constant at temperature Ti where i = 1, 2, ... , n (number of data
points) and let Yi be the observed experimental value of the logarithm
of a rate constant at temperature Ti. The correct model for the observed
values is assumed to be Y E{Y } + Ce, where the error random variables,
its, are independent and identically distributed with zero mean and
iiconstant variance Wa), and E'{Y} represents the expected value of the
predicted value. In addition, the errors are assumed to be normally
distributed for the purposes of calculating confidence intervals.
The estimates of the constants in the prediction equation are found
by minimizing the sum of the squares for error:
n 2=n2SSE = Z Ce= Z (Y y ) 2
i-l il1
The solutions to this minimization for each rate constant are tabulated
in Table A2.
Table A2. Prediction Equations for the Logarithm of the Rate Constants
Model Prediction Equation Applicable Range(0C)
Oxide in 62/2 =-4.48868 - 18060(1/T) 1050-1504
Alpha in 64/2 = -0.27230 - 24230(1/T) 905-1504
Oxide + Alpha in 62/2 = -1.07462 - 20990(1/T) 1050-1504
Total Oxygen in 62/2 = -1.70986 - 20100(1/T) 1050-1504
The observed and predicted values of the rate constants and the 90%
confidence intervals for the predicted values are tabulated in Table A3.
Columns 5 and 7 of the table express the confidence interval as a per-
centage of the predicted values at the extremes and approximate mean of
the observed reciprocal temperatures. These same data are displayed
graphically in Figs. A1-A4. The confidence interval lines (dashed lines)

-
129
Table A3. Observed and Predicted Values and 90% C~nfidenceIntervals for the Predicted Values of in 6
2
Temperature Observed Predicted Lower 90% Cl Uncertainty Upper 90% C1 Uncertainty
(C) Value Value For Mean (Z) (x) (X)
1050110111531203125313041352140414541504
905956
10011050110111531203125313041352140414541504
1050110111531203125313041352140414541504
1050110111531203125313041352140414541504
-18.0842-17.6459-17.1314-16.7361-16.3846-15.9870-15.6173-15.2636-14.9031-14.6095
-20.7133-20.0152-19.5790-18.5843-17.7528-17.2420-16.6508-16.1081-15.6543-15.1211-14.7022-14.3431-13.9674
-16.9345-16.3128-15.7960-15.3071-14.8567-14.4261-13.9674-13.5764-13.2166-12.8755
-16.8688-16.3325-15.7887-15.3387-14.9241-14.4927-14.0781-13.6932-13.3208-12.9913
-18.1381-17.6315-17.1523-16.7234-16.3225-15.9398-15.6016-15.2571-14.9453-14.6511
-20.8375-19.9842-19.2880-18.5838-17.9042-17.2613-16.6858-16.1481-15.6347-15.1810-14.7187-14.3005-13.9058
-16.9371-16.3484-15.7915-15.2930-14.8271-14.3824-13.9894-13.5890-13.2267-12.8848
-16.8993-16.3356-15.8023-15.3249-14.8789-14.4530-14.0766-13.6932-13.3463-13.0189
Oxide
-18.1862-17.6705-17.1837-16.7498-16.3468-15.9649-15.6296-15.2894-14.9825-14.6934
-4.0
-2.4
-4.1
Alpha
-20.9520 -10.8-20.0801-19.3699-18.6535-17.9649-17.3174-16.7419 -5.4-16.2075-15.6999-15.2530 -
-14.7989-14.3888-14.0022 -9.3
Oxide + Alpha
-16.9666 -2.9-16.3722-15.8107-15.3092-14.8420 -1.5-14.3978-14.0065-13.6088-13.2495-12.9107 -2.6
Total Oxygen
-16.9322 -3.2-16.3622-15.8238-15.3430-14.8955 -1.6-14.4702-14.0957-13.7153-13.3717-13.0478 -2.9
-18.0899-17.5925-17.1208-16.6969-16.2982-15.9148-15.5737-15.2247-14.9081-14.6088
-20.7229-19.8883-19.2061-18.5141-17.8434-17.2051-16.6298-16.0887-15.5895-15.1089-14.6386-14.2122-13.8094
-16.9076-16.3245-15.7722-15.2768-14.8123-14.3671-13.9723-13.5691-13.2039-12.8589
-16.8664-16.3089-15.7808-15.3068-14.8623-14.4359-14.0576-13.6711-13.3209-12.9900
+5.0
+2.5
+4.3
+12.1
+5.8
+10.1
+3.0
+1.5
+2.6
+3.3
+1.7
+2.9

I MI
130
OXIDE
1 0-6 _2 . I
6 = 0.01124 Exp(-35890/RT[OK])
C-)
1-1 4
Ad~ 3 __ ___II
IJl 2 XX
Z-3
LU
X I0 _ 7 _
cc
z 64
C-)
cc 2
6 7 8 910, 000/T (K)
Fig. Al. Prediction Equation and 90% Confidence Intervals (DashedLines) for the Parabolic Rate Constants for Oxide Layer Growth from1050 to 15040C (1922-27390 F). Oxidation of Sandvik Zircaloy-4 PWRtubing in steam.

131
RLPHR
10-62'' E
S 62/2 = 0.76163 Exp(-48140/RT['K])
a:a-Ja:
S-J v0- ___
1I-
lo-8 4<
Cc)
,,log W1 V 1
Z:S
6 7 810,000/T(K)
Fig. A2. Prediction Equation and 90%-Confidence Intervals (DashedLines) for the Parabolic Rate Constants for Alpha Layer Growth from 905to 15040C (1661-27390 F). Oxidation of Sandvik Zircaloy-4 PWR tubinginto steam.
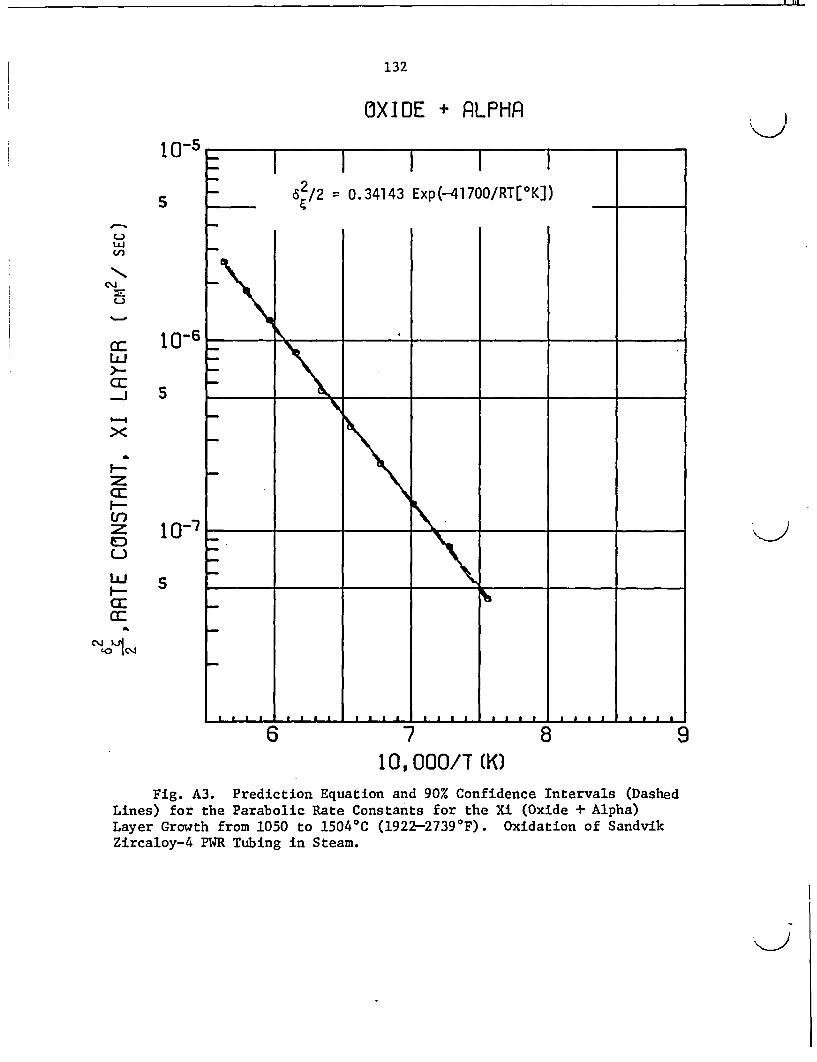
132
OXIDE + ALPHA
I0-s
S
LUV)
CQj
C-
LU-CC:
-J
z
L)J
C:Cr_
10-6
5
S
10,000/T (K)Fig. A3. Prediction Equation and 90% Confidence Intervals (Dashed
Lines) for the Parabolic Rate Constants for the Xi (Oxide + Alpha)Layer Growth from 1050 to 1504'C (1922-27390F). Oxidation of SandvikZircaloy-4 PWR Tubing in Steam.
j

133
TOTAL OXYGEN
S
,..anN,
LrO
M
U:I-x
I-a
zCC
I--
CE
I--
a:
CDJ-
10-6
S
5
10. 000/T (K)Fig. A4. Prediction Equation and 90% Confidence Intervals (Dashed
Lines) for the Parabolic Rate Constant for Total Oxygen Consumption from1050 to 1504 0C (1922-27390F). Oxidation of Sandvik Zircaloy-4 PWRtubing in steam.

In
134
in the figures are so narrow for the i and T measurements that it is
difficult to distinguish them from the prediction lines.
The estimated values, Zn A and (Q/R) are unbiased estimates of the
true values of Zn A and (Q/R). The 90% confidence intervals for the
individual expected values of the estimators are listed in Table A4.
Table A4. Individual 90% Confidence IntervalsValues of kn A and (Q/R)
for the Expected
Estimator Lower 90% Estimated Upper 90%Confidence Interval Value Confidence Interval
OxideLi A -4.74691 -4.48868 -4.23045(O/R) 17670 18060 18460
AlphaLin A -0.70658 -0.27230 0.16198(&/R) 23600 24230 24850
Alpha + OxideLin A -1.23275 -1.07462 -0.91649(Q/R) 20750 20990 21230
Total Oxygenfin A -1.88638 -1.70986 -1.53334(O/R) 19830 20100 20370
The individual confidence intervals on in A and (Q/R) are appropriate
for specifying ranges for an individual estimator irrespective of the
value of the other estimator. To interpret the possible values of the
estimators of Zn A and (Q/R) simultaneously, which takes into account
the covariance and the relative sizes of the variances of the two
estimators, joint 90% confidence regions are given in Figs. A5-A8.
Each pair of points (Zn A, (Q/R)) inside the confidence region (the
ellipse) determines a prediction line contained inside the confidence
interval about the corresponding prediction line in Fig. Al-A4. Those
points on the confidence region boundary in Figs. A5-A8 determine pre-
diction lines which are tangent to the confidence interval boundaries
on the corresponding prediction lines.

135
I71 TIT fln no I/ r-rMK1C IT nCfKlr'ir cr` T PiNIC-17500
-17600
-17700
-17800
-17900
-18000
N.
-18100
-18200
-18300
-18400
-18S00
JU.IN I ZIU/ UUINV IULINUL nLUIUINJ
ND
- N-- …- \ - -- 1
D IU NA TL E
C VO A
N L
DENC
E
_--- INDIVIDUAL CONFIDENCE INTERVAL. ' ' ' :. .~~~~~~~~~~~~~~~~... ..... .. ,..,..Li..,.., .. 1.. 1..,.f,..
__.. 1 -4.8 .- -4.7 -4. 6 -4.5LN A
-4. 4 -4.3 -4.2 -4.1
Fig. A5. Joint Confidence Region for the Coefficients of the OxideModel: £i 62/2 = -4.48868 - 18060 (1/T).

I pi
136
JOINT 90X CONFIDENCE REGIONS-23400
-23600
I-\
-23800
-24000
-24200
-24400
-24600
II-.I
N'D
IVIDIU NAT
RLCV
Q0ANL
:FI
-DEN
E
II
_ I_ 1_1 I \l _ __L
-Z4duu I-200 IN _ _ _ = =
-szvuu N
| INDIVIDUAL CONFIDENCE INTERVAL-.. .*I . . . .. . ..... I.... } . . .. I. .. . -1... I. -,.- , - .- -- ,- , . _,-.-
-1.0 -0. a -U.6 -0.4LN A
O.U OD. 2 0 .4
Fig. A6.Alpha Model:
Joint Confidence Region for the Coefficients of theQn 62/2 = -0.27230 - 24230 (l/T).

137
JOINT 90/ CONFIDENCE REGIONS-20600 I I I I
III u I I - F -
-20800
-20900
cc'-c21000
-21100
-21200
.N
.D7I1VI ID NUTAELLR
- VCCAO L
--NF
-I7D-E
:E
\ IY
IA i
-
4 I I 4. 4. 4 4 -a.-- �
\
| -+INDIVIDUAL CONFIDENCE INTERVAL__ _ _ __ ,_ . __ __ . __ . . I . ._ I . . . . .
__
-1.30 - -1.25 -1.20 . -1.15 -1.10 -1.05. -1.00 -0.95 -0.9o0 -0.85
LN AFig. A7. Joint Confidence Region for the Coefficients of the
(Alpha + Oxide) Model: nfi 62/2 -- 1.07462 - 20990 (l/T).

138
-19700JOINT 90X CONFIDENCE REGIONS-19700
-19800 ____ _
ND
-20000 IVI
U'cc:tO A N = = X4= = =,,,20100 L T
C3 ECR \__O VN A
-20200 FL --
D
EN
-20300 C _ - - -=-E
-20400 -- __
, |.e- INDIVIDUAL CONFIDENCE INTERVAL. . . . . . . . . . . . . . _. _ ._
-2.0 -1.9 -1.8 -1.7LN A
-1.6 -1.5 -1.4
Fig. A8. JointTotal Oxygen Model:
Confidence Region for the Coefficients of thekin 62/2 = -1.70986 - 20100 (1/T).
T

139
Because the evaluation of confidence intervals and confidence
regions depend on the assumption that the errors are normally distributed,
the residuals (observed values - predicted values), were examined to see
if there was any indication that this assumption might be false.
The residuals were standardized by dividing by the estimated
standard deviation (S) of the error random variables and then plotted
versus the predicted value. None of the residuals is three standard
deviations from zero, and, except for one residual point for the alpha
layer data, all remaining points are within two standard deviations
from zero. Therefore, there are no apparent outliers. To test for
normality, Bowman and Shenton's test2 on the skewness and kurtosis'
statistics was used at the 10% significance level with no significant
results for any of the data sets. There did appear to be some trends
in the residual plots but because of the small number of points, only
gross deviations from the assumption could have been detected. The
examination of the residuals did not indicate that any assumptions were
false.
To estimate the constants A and Q in Eq. (A2), the estimators
kfi A and (Q/R) from the linear prediction equations are used. The
estimators of the two constants are:
A = exp{fi Al, and (A3)
Q = R(QR) . (A4)
The estimator Q is an unbiased estimate of Q but A is a slightly biased
estimator of A with the expected value of A being exp[(ac2/2)A], where
a2 is the variance of Yfi A. If the estimate of a2 is used, the bias0 0
can be shown to be less than 1% of'the true value for all'four data
sets. Since the bias is so small, the correction for bias will not
be used. Table A5 lists the values of A and Q and their corresponding
confidence' intervals.

140
Table A5. Estimated Values and 90% Confidence Intervalsfor A and Q
j
Estimator Lower 90% Estimated Upper 90%Confidence Interval Value Confidence Interval
OxideA 0.00868 0.01124 0.01455Q 35100 35890 36670
AlphaA 0.49333 0.76163 1.17584
46900 48140 49390
Alpha + OxideA 0.29149 0.34143 0.39992
41220 41700 42190
Total OxygenA 0.15162 0.18089 0.21581Q 39400 39930 40470
Confidence Intervals at the 95% Level
Throughout this report we have chosen to discuss statistical
uncertainties on the data in terms of 90% confidence levels. As
pointed out in the introduction to this appendix, the basic purpose
of a statistical analysis of a data set is to provide an objective
measure of the self-consistency and reproducibility of the data. From
this point of view, the particular confidence level selected for use is
to a large degree a matter of individual judgment, the 90% confidence
level being one frequently chosen by many experimenters. On the other
hand, the 95% level is also popular, and in this section we summarize
our statistical results based on calculations at that confidence level.
Individual Confidence Limits
Values for the upper and lower individual 90% confidence limits
on A and Q are listed in Table A5 for oxide, alpha, oxide + alpha, and
total oxygen. To change the upper and lower 90% levels to the 95%
levels, we can multiply the uncertainty, in each upper value by the ratio
(upper 95%/upper 90%) and each lower value by the ratio (lower 95%/lower
90%). Since the arguments given below for deriving these two ratios are

- -
141
symmetrical and the numerical values of the ratios are identical, only
the ratio (upper 95%/lower 90%) is derived. Note also that the ratios
given below may be used only when the uncertainties at the 90% confidence
level are expressed as a percentage uncertainty in the estimator; they
are not directly applicable in converting the absolute numerical values
of the 90% confidence limits to corresponding values at the 95% level.
(Upper 95%/Upper 90%) for Estimator A - For a (l-a)% confidence
interval, an upper (l-a)% value for the estimator A, expressed as a frac-
tion of A, is defined by
exp[kn A + ta/2 (v) S - exp(Yn A)upper (l-a)% =( A) (A5)
where
1-a, expressed as percent, represents the desired confidence level,
in A is the estimator of in A (see Tables A4 and A6). (Note that
the value of in A is independent of the value of a chosen.),
SI is the standard deviation of in A for the given data set (see
Table A6), and
ta/2(v) is the a/2 percentage point of the t-distribution with (v)
degrees of freedom.
Therefore,
upper 95% exp(to. 0 25 (v) S 1)upper 90% exp(to.0 5(v) S) - 1 (A6)
Evaluation of the ratio in Eq. (A6) requires knowledge of the appropriate
values of the ta/2 ()'s and of the standard deviations for the estimators.
These quantities are listed in Table A6; note that t a/2(v) is dependent
on the degrees of freedom and, hence, the number of observations for a
given data set. Substituting these quantities in Eq. (A6), one obtains
the desired ratios, which are tabulated in Table A7. As may be seen,
the change from a 90% to a 95% confidence interval increases the
uncertainties on A by amounts varying from about 26 to 31%; e.g., if
the uncertainty on the A value in the expression for the oxide parabolic
rate were ±10% at the 90% confidence level, it is ±12.8% at the 95% level.
Numerical values for the upper and lower limits for the 95% individ-
ual confidence intervals for A are given in Table A8.

I PI
142
Table A6.MN A and
Values of and the Standard Deviations for the Estimators(Q/R) and the Degrees of Freedom and Appropriate ta/2(M)
Values for the Various Data Sources
Estimated Estimator DegreesSource Estimator Value Standard of t 0 5(M) t 02 5(M)
Deviation Freedom
Oxide 8 1.860 2.306On A -4.48868 0.13883(Q/R) 18060 212
Alpha 11 1.796 2.201tn A -0.27230 .24180(Q/R) 24230 348
Xi 8 1.860 2.306(oxide + alpha) Zn A -1.07462 0.08501
(Q/R) 20990 130
Total Oxygen 8 1.860 2.306Y£n A -1.70986 0.09490(Q/R) 20100 145
Table A7. Ratios to be Used in Converting UncertaintiesConfidence Level to Uncertainties at the 95% ConfidenceConversion Applicable to Individual Confidence Limits
at the 90%Level.Only
Source Ratio(Upper 95%/Upper 90%)
Oxide 1.281
Alpha 1.314
Xi 1.264
Total Oxygen 1.267
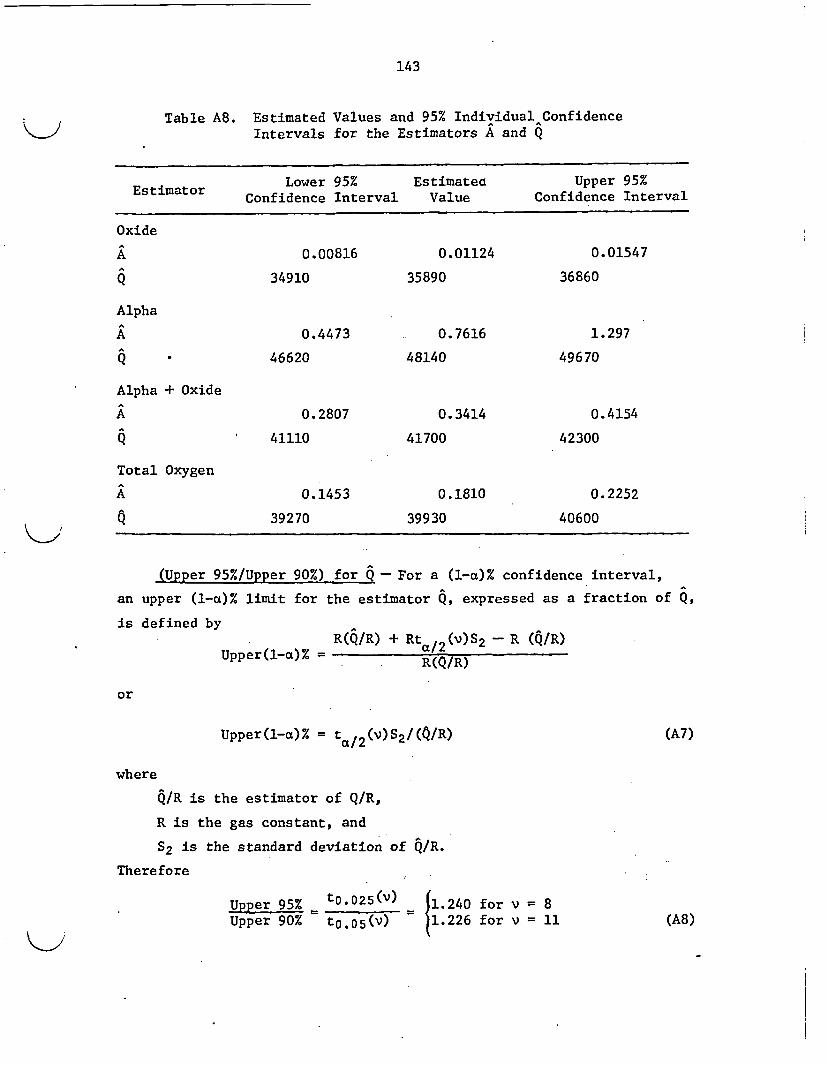
143
Table A8. Estimated Values and 95% Individual ConfidenceIntervals for the Estimators A and Q
Estimator Lower 95% Estimatea Upper 95%Confidence Interval Value Confidence Interval
Oxide
A 0.00816 0.01124 0.01547
Q 34910 35890 36860
Alpha
A 0.4473 0.7616 1.297
Q 46620 48140 49670
Alpha + Oxide
A 0.2807 0.3414 0.4154
Q 41110 41700 42300
Total Oxygen
A 0.1453 0.1810 0.2252
39270 39930 40600
(Upper 95%/Upper 90%) for Q - For a (l-a)% confidence interval,
an upper (1-a)% limit for the estimator Q, expressed as a fraction of Q.
is defined by e
Upper(l-a)% =R(Q/R) + Rt a 2 (v)S2 - R (Q/R)
R(Q/R)
or
Upper(l-a)% = ta/22(v)S2/(O/R) (A7)
where
Q/R is the estimator of Q/R,
R is the gas constant, and
S2 is the standard deviation of Q/R.
Therefore
Upper 95% t0.025() _1.240 for v = 8Upper 90% to.05(v) 11.226 for v = 11 (A8)

I n
144
The numerical values at the right of Eq. (A8) were obtained by inserting
appropriate values of t /2(v) from Table A6. See Table A8 for numerical
values of the 95% confidence limits on Q.
Joint Confidence Intervals
The joint confidence interval on d/2, in contrast to the individual
confidence limits for A and Q, varies over the width of an Arrhenius
plot, being minimum at the mean of the reciprocal temperature observa-
tions. For this reason no single conversion factor can be used to
convert uncertainties at the 90% level to corresponding values at the
95% level. We have, therefore, recalculated these confidence intervals
using the F-distribution statistics appropriate for the 95% level. The
results are given in Table A9, which may be compared to Table A3 where
the corresponding 90% level values are summarized. Graphical represen-
tations of these data in the form of joint confidence ellipses are
presented in Figs. A9-A12. The joint confidence regions at the 90%
level are also displayed.
MAXIMUM ABSOLUTE ERROR LIMITS FOR EXPERIMENTAL PROCEDURES
Temperature Measurement Errors
Temperature measurement errors in this program were extensively
analyzed in a previous report.3 Potential error sources considered
included thermal shunting, electrical shunting, parasitic emf's, data
acquisition system errors, thermocouple calibration errors, temperature
gradients in the sample, decalibration of thermocouples, and tab attach-
ment effects. It was concluded that the maximum probable temperature
measurement error in the MiniZWOK apparatus ranged from ±40C (7.20F) at
9000C (16520F) to ±60C (10.80F) at 1500*C (2732 0F). The validity of
these limits was confirmed by the subsequent in situ determination of
the alpha-to-beta phase transformation temperature for pure zirconium (see
p. 30); the additional in situ melting point determination (p. 31) did not
bear directly on the question of the extent of thermal shunting errors,
but this result did show that the contributions of the other potential
error sources to the uncertainties of temperature measurements lie well
within the limits given above.

145
Table A9. Predicted Values for the Estimators in '2/2 and 95%
Confidence Intervals for the Expected Predicted Values.Percentage Uncertainties on 62/2 are Also Shown
Temperature in 62I2 Lower 95% CL Uncertainty Upper 95Z CL Uncertainty
(°C) Observed Predicted For In 82/2 on P/2 For In 82/2 on 82/2
Value Value
Oxide
1050110111531203125313041352140414541504
905956
10011050110111531203125313041352140414541504
1050110111531203125313041352140414541504
-18.0842-17.6459-17.1314-16.7361-16.3846-15.9871-15 .6173-15.2636-14.9031-14.6095
-20.7133-20.0152-19.5790-18.5843-17.7528-17.2420-16.6508-16.1081-15.6543-15.1211-14.7022-14.3431-13.9674
-16.9345-16.3128-15.7960-15. 3071-14.8567-14.4261-13.9674-13.5764-13.2166-12.8755
-18.1381-17.6315-17.1523-16.7234-16.3225-15.9398-15.6016-15.2571-14.9453-14.6511
-18.1978-17.6798-17.1913-16.7562-16.3527-15.9710-15.6363-15.2972-14.9915-14.7036
-5.8
-3.0
-5.1
-18.0784-17.5832-17.1133-16.6905-16.2924-15.9087-15.5670-15.2169-14.8992-14.5987
+6.1
+3.1
+5.4
Alpha
-20.8375-19.9842-19.2880-18.5838-17.9042-17.2613-16.6858-16.1481-15.6347-15.1810-14.7187-14.3005-13.9058
-16.9371-16.3484-15.7915-15.2930-14.8271-14.3824-13.9894-13.5890-13.2267-12.8848
-20.9779-20.1017-19.3884-18.6692-17.9786-17.3301-16. 7545-16.2209-15.7147-15.2693-14.8170-14.4087-14.0240
-13.1
-6.6
-11.1
-20.6970-19.8666-19.1876-18.4984-17.8297-17.1925-16.6172-16.0753-15.5548-15.0927-14.6205-14.1923-13.7877
-16.9005-16.3188-15.7676-15.2729-14.8087-14. 3634-13.9682-13.5644-13.1984-12.8526
+15.1
+7.1
+12.5
+3.7
+1.9
+3.3
Oxide + Alpha
-16.9737 -3.6-16.3780-15.8153-15.3131-14.8456 -1.8-14.4015-14.0106-13.6135-13.2549-12.9169 -3.2
Total Oxygen
-16.9401 -4.0-16.3686-15.8289-15.3474-14.8995 -2.0-14.4743-14.1003-13.7206-13.3779-13.0548 -3.5
1050110111531203125313041352140414541504
-16.8688-16.3325-15.7887-15.3387-14.9241-14.4927-14.0781-13.6932-13.3208-12.9913
-16.8993-16.3356-15.8023-15.3249-14.8789-14.4530-14.0766-13.6932-13.3463-13.0189
-16.8585-16.3025-15.7756-15.3025-14.8583-14.4318-14.0530-13.6658-13.3148-12.9830
-4.2
+2.1
+3.7

I EL
C3
146
7400 JONT CNF DENLCE 1RELGI N
79005X
17800
.8000
1 8200 = == =____=
18600
'l . . . . .I .. ' . .' .' . . . . .I . .' . .* . . . . ' '.. . . .. ..-4.9 -4.8 -4.7 -4.6 -4.5 -4.4 -4.3 -4.2 -4.1
LN A
Fig. A9. Joint Confidence Region for the Coefficients of the OxideModel: Zn 62/2 = -4.48868 - 18060.28 (l/T).
i.0

147
-- J( ITNT CfflNFIfl _NrF RBFnTINS-i3zuu I
-23400
-23600
-23800
-24000
cc:_.. --
<-_ 95%
I-
._ X 90%
- ---
I
-2440D…
-24600 _00 - -X
-2580D0 ttt2
----- N
S * * . * - * - I - 4 ~ ~ h ~ *- -- - I------ ---1.0 -- 0.8 -0.6 -0. 4. -0.2
.LN A0.0 0.2 0.4 0.6
Fig. A10. Joint Confidence Region for the Coefficients of the AlphaModel: nin 62/2 = -0.27230 - 24228.91 (1/T).
a

Il?
148
IflTTNT PFINFTfnFNPF RFrlTF1NcN
95%
- - -- 90%_ _ _
-20700 --
-20800 - -
-20900
DI ~~nnn - - - -a-.-"-,&-S
-21100
-21200
=_ = ==N 'A =_ X v
==== ===_ NN
-91Rnn I I I I I NI
\
I, .I. .J.. .-- F-1. 4 -1.2
LN A-1. 0 -U..9 t.8
Fig. All. Joint Confidence Region for the Coefficients of the(Alpha + Oxide) Model: in 62 /2 = -1.07462 - 20988.50 (1/T).xi

-
149
JOINT CONFIDENCE REGIONS-1960 ^ I
- fu
-Is70C
-1980C
h - - Ir-- - -
-,- .90_ _
-I1 fI I - 4 - 1U4yN
-20000
N:20100(2
4-
N1 4- 4 4-J � 4 4
11tj
-e-uuu J _ _ I
-1 1u ._ - . a
-20 Ann.1 -I IK7W
_ . . - I | . I *|t. . .... .. .. . *-. -. .. _ . .-.
-2.0
Fig. A12.Oxygen Model:
-1.9 -1.8 -1.7 -1.6 -1.5LN A
Joint Confidence Region for the Coefficients of the TotalIfi 62/2 - -1.70986 - 20097.96 (1/T).
T
-1 . 4

*14-_
150
Time Measurement Errors
Absolute measurements of time in virtually all experiments were
made using the Computer Operated Data Acquisition System (CODAS). CODAS
utilizes a quartz crystal clock whose accuracy is warranted to +13 us.
There is, however, an uncertainty as large as 2 ms in the time of
triggering of the CODAS clock at the beginning of an experiment, and
2 ms may thus be regarded as the maximum error in our absolute time
measurements. The effect of this error on the oxidation results is
obviously negligible.
A second source of error in the oxidation times reported stems
from the necessity for normalizing the time-temperature record for each
experiment to an equivalent time of isothermal oxidation at some average
temperature. The technique used, which is described in detail in the
body of the report (p. 43), utilizes the expression
ft exp[-Q/RT(t)]dt
(eff) exp[-Q/RT ] (A9)(eff)
where t(eff) is the equivalent oxidation time for strictly isothermal
conditions, T(eff) is the temperature (0K) to which the data are to be
normalized, T(t) is the actual temperature of the experiment expressed
as a function of time, Q is the activation energy for the process, and
R is the gas constant. Application of Eq. (A9) thus allows one to
correct for oxidation during heat-up and cool-down and for small varia-
tions in set-point position of the temperature controller in experiments
performed at some nominal temperature.
Implicit in Eq. (A9) is the assumption that the reaction being
considered, e.g., the growth of the oxide layer, can be described in
terms of a single process (i.e., single activation energy) over the
entire temperature range of interest. Inspection of the Arrhenius
plots for the oxide and alpha layer kinetic data (Figs. 27 and 28)
shows that this assumption is surely valid from "'1000 to 1500'C
(1832-27320F). Below this temperature range a change in oxidation
mechanism does occur at relatively long oxidation times; however, the

151
amount of oxidation taking place at temperatures below 1000'C (18320F)
at heating rates of "'100 0C/s (180*F/s) will be small. Furthermore, as
shown below, changes in teff produced by relatively large changes in
the'value of Q used in Eq. (A9) occasioned only minor changes in the
62/2 values calculated from K2 vs t(eff) plots; thus, unless the true
activation energy below 1000'C (18320F) is radically different from
that at higher temperatures, the time correction given by Eq. (A9)
should be approximately valid.
As experimental data were gathered during the course of this study,
it was, of course, necessary to use Eq. (A9) to construct oxidation
rate curves and, ultimately, the Arrhenius plots from which values of
the activation energy could be obtained. Since accurate values of Q
were not available at that time, we chose 40,000 cal/mole as a
reasonable approximation. Strictly speaking, once experimental values
of Q were determined, these new values of Q could have been used in
Eq. (A9) and an iterative procedure applied to the entire data set to
obtain the best possible evaluation of Q. However, when the experi-
mental activation energies (35,890 and 48,140 cal/mole for oxide and
alpha layers, respectively) were used, tests on several representative
data sets revealed that the resulting small changes in oxidation time
never produced changes greater than "'1% in the slopes of the oxidation
rate curves. Thus the time corrections made are rather insensitive
to the precise value of Q used in Eq. (A9), and we concluded that time
corrections are responsible for no more than a 1% error in the parabolic
rate constants.
Thickness Measurement Errors
Errors in the measurements of oxide and alpha layer thickness can
arise from several sources. For well-defined, uniform scales the
reproducibility of readings with the filar eyepiece used in these
determinations was 'v±0.25 pm, producing thickness uncertainties ranging
from ±2.0 to ±0.25% in thickness determinations for the thinnest and
thickest scales measured. In some instances the interface between

152
different phases, particularly the alpha/prior-beta boundary at low
temperatures was ill defined, and measurement uncertainties under these
conditions were somewhat greater.
Accurate phase thickness measurements require that specimens be
mounted so that they can be sectioned perpendicular to the tube wall.
The maximum mounting error was 15°, resulting in a thickness uncertainty
of +0.4%.
As described in the body of the report, oxide and alpha layer
thicknesses represent the average of seven measurements made at 5°
intervals over a 30° arc centered on the bead of a measuring thermo-
couple. This procedure was adopted because of the circumferential
temperature gradient in the specimens and because of the existence of
small variations in layer thicknesses over short distances caused by
other factors. We consider that this procedure minimizes uncertainties
in layer thickness.
An estimate of these uncertainties was made by computing the mean
±2a, where a is a standard deviation, for the seven layer thicknesses
measured in each experiment. The 2a's were then expressed as a percentage
of the mean thickness. A typical data set at 12030C (21970F) is shown
in Table A10.
From 10 to 20 individual mean thickness determinations were used
to define the rate curve at each temperature, and the values of ±2aK/K,
where K represents the mean thickness of either the oxide or the alpha
layer, were summed and averaged and a value for two standard deviations,
2a', for the mean computed. The resulting quantity, ±2ao K + 2ac, for
each temperature is to be interpreted as the maximum uncertainty
(expressed as a percentage of K) in thickness measurements at the con-
fidence level (approximately 95%) represented by two standard deviations.
Tables All and A12 list values for this maximum uncertainty at several
temperatures under the heading "Thickness Variability". It should be
noted that 2aK/K ± 2a' contains the uncertainties related to the
reproducibility of individual measurements but does not take into
account the possibility that the measured section was not cut precisely
perpendicular to the specimen wall.

- -
153
Table A10. Estimates of Mean Oxide and Alpha Layer Thicknesses andTheir Standard Deviations for Experiments at 1203'C (21970F)
-(a)cr� (c) 2a 2aExpt. No. (b)a(b) 2a
(Pm) (pm) (%) (Pm) (pm) (%)
S-82 49.46 ±1.64 ±3.3 53.54 ±1.04 ±2.0
S-83 43.13 2.32 5.4 44.74 1.06 2.4
S-84 38.86 1.63 4.2 40.97 0.96 2.3
S-85 53.52 1.33 2.5 54.62 1.35 2.5
S-86 50.22 1.96 3.9 51.66 1.04 2.0
S-87 58.10 1.35 2.3 64.79 0.91 1.4
S-88 26.64 1.41 5.3 28.23 0.55 2.0
S-89 43.21 1.37 3.2 44.01 1.06 2.4
S-90 28.79 1.23 4.3 30.87 0.81 2.6
S-91 37.23 1.03 2.8 39.74 2.61 6.6
±2VF /± 2a' = ±3.72 2.18%
±2a /a ± 2ao = ± 2.62 ± 2.88%a a
(a)T = mean oxide layer thickness.
(b) K = standard deviation of layer thicknesssingle experiment; K = * or a.
(c)a = mean alpha layer thickness.
measurements in a
( a' = standard deviation of the mean 2a' /K; K = ¢ or a.x K
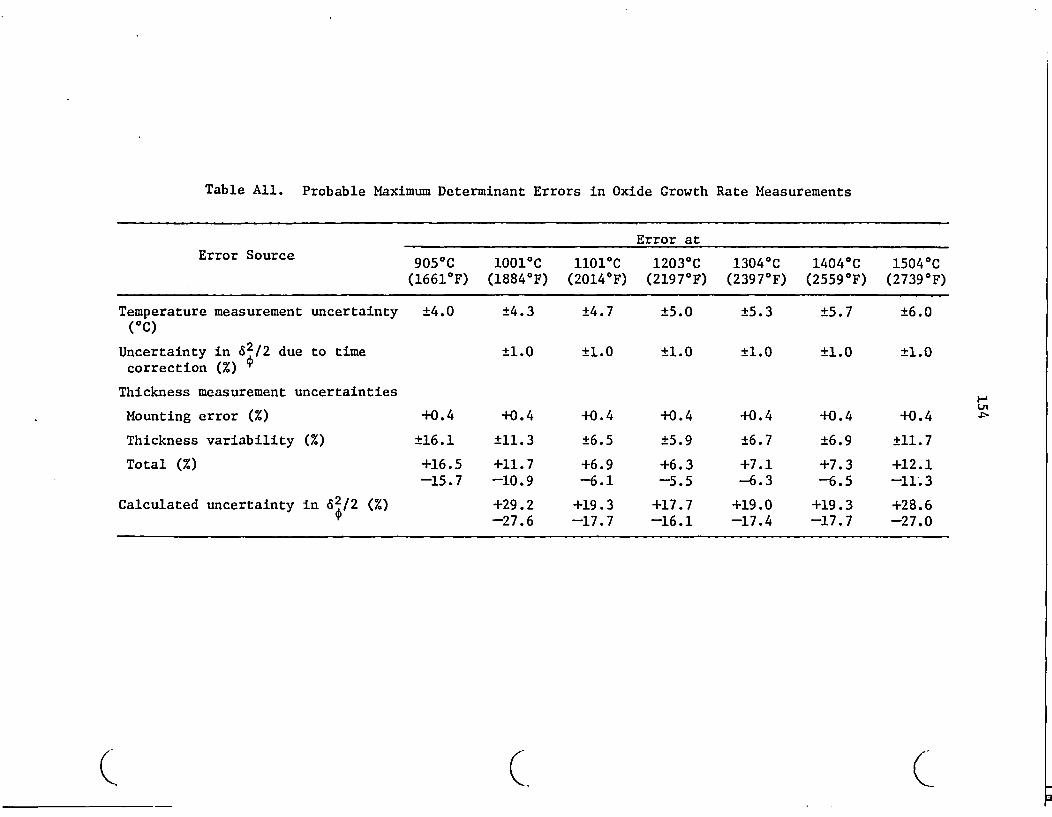
Table All. Probable Maximum Determinant Errors in Oxide Growth Rate Measurements
Error atError Source 9050 C 10010C 11010C 12030C 1304 0C 14040C 15040C
(16610F) (18840F) (20140F) (21970F) (23970F) (2559 0F) (27390F)
Temperature measurement uncertainty ±4.0 ±4.3 ±4.7 ±5.0 ±5.3 ±5.7 ±6.0(0C)
Uncertainty in 62/2 due to time +1.0 ±1.0 ±1.0 ±1.0 ±1.0 ±1.0correction (%) +
Thickness measurement uncertainties
Mounting error (%) +0.4 +0.4 +0.4 +0.4 +0.4 +0.4 +0.4
Thickness variability (%) ±16.1 ±11.3 ±6.5 ±5.9 ±6.7 ±6.9 ±11.7
Total (%) +16.5 +11.7 +6.9 +6.3 +7.1 +7.3 +12.1-15.7 -10.9 -6.1 -5.5 -6.3 -6.5 -11.3
Calculated uncertainty in 62/2 (%) +29.2 +19.3 +17.7 +19.0 +19.3 +28.6-27.6 -17.7 -16.1 -17.4 -17.7 -27.0
in
Q, C C

C C
Table A12. Probable Maximum Determinant Errors in Alpha Layer Growth Measurements.
C
Error atError Source 905 0C 1001 0C 11010C 1203 0C 1304 0C 1404%C 15040C
(1661 0F) (18840F) (20140F) (2197 0F) (23970F) (25590F) (27390F)
Temperature measurement uncertainty ±4.0 +4.3 ±4.7 ±5.0 ±5.3 ±5.7 ±6.0(CC)
Uncertainty in 62/2 due to time ±1.0 +1.0 ±1.0 ±1.0 ±1.0 ±1.0 ±1.0correction (%) a
Thickness measurement uncertainties
Mounting error (%) +0.4 +0.4 +0.4 +0.4 +0.4 +0.4 +0.4
Thickness variability (%) ±22.6 ±15.6 ±13.2 ±5.5 ±6.4 ±4.9 ±3.9
Total (%) +23.0 +16.0 +13.6 +5.9 +6.8 +5.3 +4.3-22.2 -15.2 -12.8 -5.1 -6.0 -4.5 -3.5
Calculated uncertainty in d2/2 (%) +54.0 +39.4 +34.2 +18.4 +19.8 +16.5 +14.2a -52.4 -37.8 -32.6 -16.8 -18.2 -14.9 -12.6
I-aL'Ln
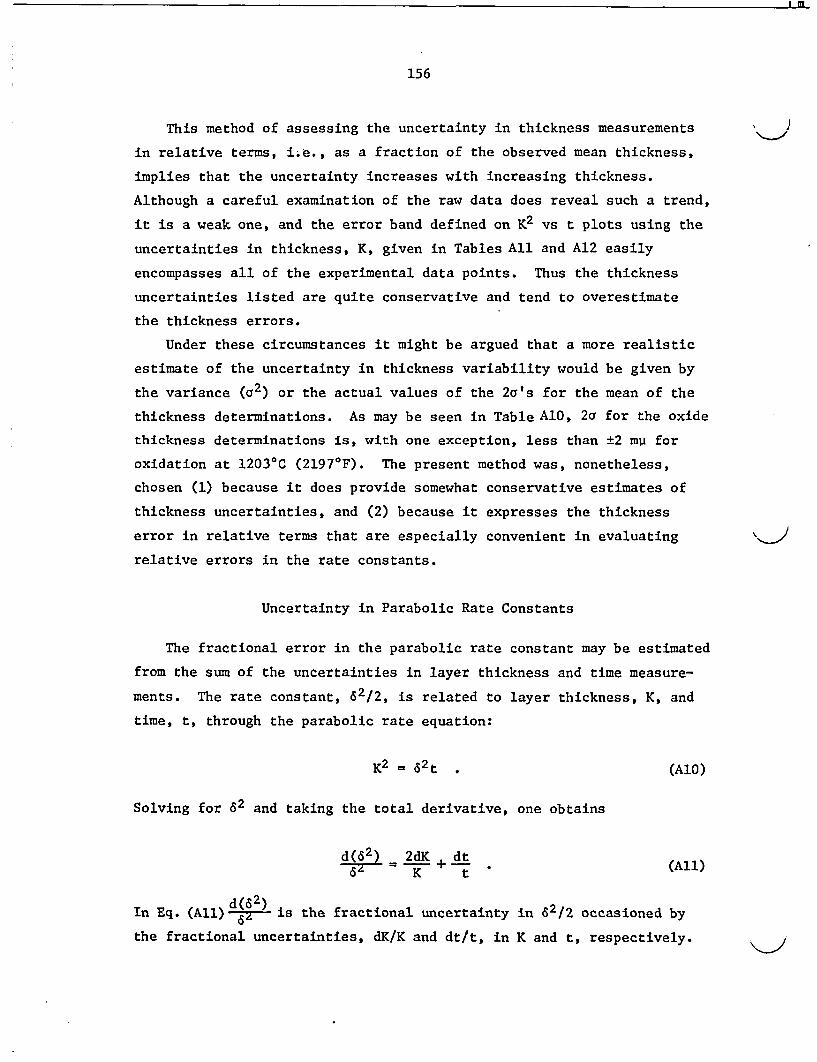
IFM
156
This method of assessing the uncertainty in thickness measurements )
in relative terms, i.e., as a fraction of the observed mean thickness,
implies that the uncertainty increases with increasing thickness.
Although a careful examination of the raw data does reveal such a trend,
it is a weak one, and the error band defined on K2 vs t plots using the
uncertainties in thickness, K, given in Tables All and A12 easily
encompasses all of the experimental data points. Thus the thickness
uncertainties listed are quite conservative and tend to overestimate
the thickness errors.
Under these circumstances it might be argued that a more realistic
estimate of the uncertainty in thickness variability would be given by
the variance (a2) or the actual values of the 2a's for the mean of the
thickness determinations. As may be seen in Table AlO, 2a for the oxide
thickness determinations is, with one exception, less than ±2 mu for
oxidation at 1203'C (21970F). The present method was, nonetheless,
chosen (1) because it does provide somewhat conservative estimates of
thickness uncertainties, and (2) because it expresses the thickness
error in relative terms that are especially convenient in evaluating
relative errors in the rate constants.
Uncertainty in Parabolic Rate Constants
The fractional error in the parabolic rate constant may be estimated
from the sum of the uncertainties in layer thickness and time measure-
ments. The rate constant, 62/2, is related to layer thickness, K, and
time, t, through the parabolic rate equation:
K2 = 62t . (Alb)
Solving for 62 and taking the total derivative, one obtains
d(62) 2dK+ dt (All)6z K t
d(62) 6/ caindbIn Eq. (All)-{-- is the fractional uncertainty in 62/2 occasioned by
the fractional uncertainties, dK/K and dt/t, in K and t, respectively.

157
All signs on the right hand side of Eq. (All) are taken as positive on
the assumption that in the worst possible case all errors are additive.
While Eq. (All) provides an estimate of the errors in 62/2 due to
uncertainties in K and t, it should be noted that implicit in Eqs. (AlO)
and (All) is the assumption that the temperature, .T, is known exactly.
Such, of course, is never the case, and an additional uncertainty in
62/2 arises from uncertainties in T. Consider, for example, a situation
in which K and t can be measured exactly but where T is measurable only
to T ± c, where ±c is the uncertainty in the temperature measurement.
If a series of experiments is performed in which specimens are oxidized
for various times at the nominal temperature T but in which the true
temperature varies randomly about T in the range ±c, then a plot of K2
versus t, whose slope is proportional to the rate constant, will show
a scatter of data points about the best estimate line. Thus even though
K and t are known exactly, an uncertainty in 62/2 will exist because of
the uncertainty, ±c, in the measurements of T.
The contribution of these temperature uncertainties may be estimated
by making use of the Arrhenius equation:
62/2 = A exp(-Q/RT) * (A12)
Again taking the total derivative of 62/2, one obtains
d 6 dT (A13)6 RT T
where the last term on the right gives the contribution of the fractional
uncertainty in temperature, dT/T, to the uncertainty in 62/2.
We, therefore, take as the maximum possible determinant error in
62/2 the sum
d(62)/62= 2dg/E + dT/t + (Q/RT)(dT/T) . (A14)
The resulting calculated uncertainties in 62/2 are summarized in
Tables All and A12.

I L
158
Uncertainties in A and Q
Treating the quantities A and Q in Eq. (A12) as variables and
differentiating as before, it can be shown that
dQ + RT dA RT d(62) dTQ Q A Q 62 T * (AlS)
The terms on the left side contain the uncertainties dQ/Q and dA/A in
the activation energy, Q, and the pre-exponential term, A, respectively,
and the equation expresses these quantities in terms of errors in 62/2
and T. The right hand side may be evaluated using information from
Tables All and A12. For example, for oxide layer growth at 12030C (21970F),
(RT/Q)(d(62)/62)is .015 and dT/T = 0.003. Assuming all errors to be
additive, dQ/Q + RT/Q dA/A = 0.018 or 1.8%. However, Eq. (A15) contains
two unknowns, dQ/Q and dA/A, and it is impossible to specify either
uniquely. For estimates of dQ/Q and dA/A, therefore, we rely on the
statistical analysis given in the first part of the Appendix.
Indeterminant Errors
Any experimental program is subject to indeterminant errors, i.e.,
errors that by definition are not known to exist but may be present and
may be either systematic or random. In general, the only way their
presence can be detected is through the comparison of a given data
set with a comparable set determined by an independent method.
The only internal evidence for the lack of indeterminant errors in
the present program is the relatively good agreement between results
obtained in the MiniZWOK and MaxiZWOK apparatuses.
Table A13 gives a comparison of the parabolic rate constants for
total oxygen consumption found in the present results with correlations
obtained by other investigators. There is excellent agreement between
our results and those of Kawasaki.4 The agreement with the Hobson dataS
set is also reasonable. Less good agreement exists with the results of
Biederman,6 Klepfer,7 and Lemmon.8 The activation energies determined
by the latter three workers are all somewhat smaller than that reported
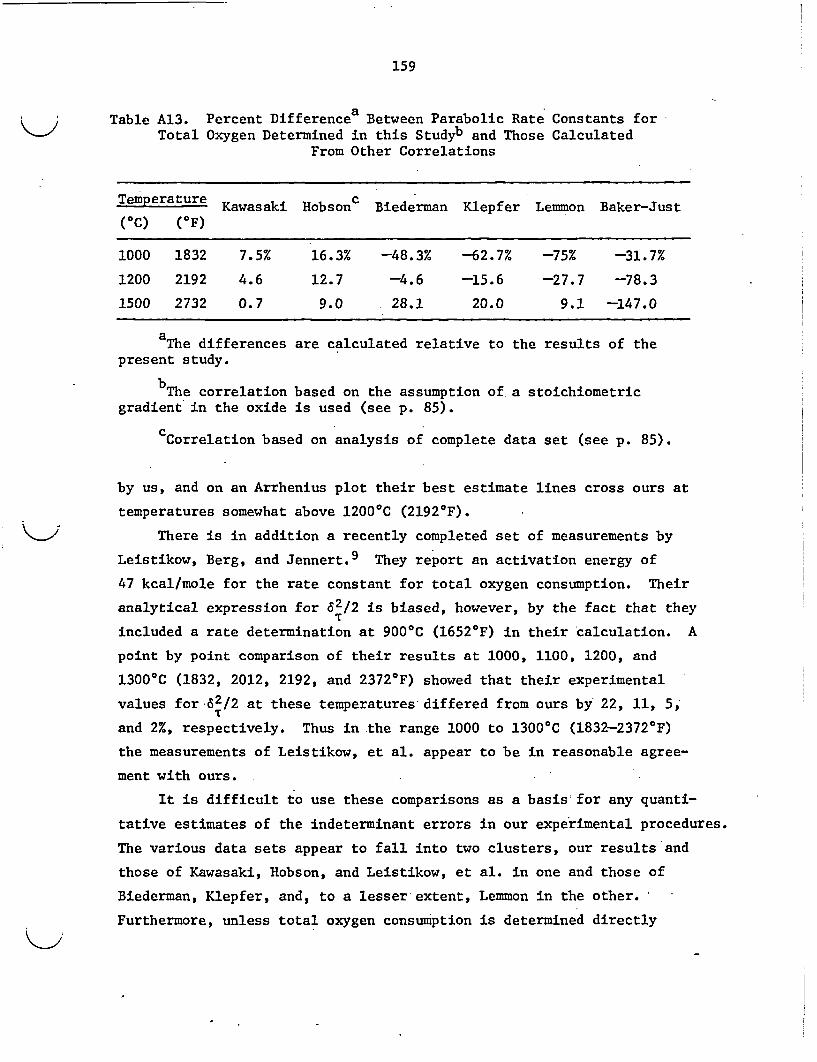
-
159
Table A13. Percent Differencea Between Parabolic Rate Constants forTotal Oxygen Determined in this Studyb and Those Calculated
From Other Correlations
Temperatre c__ Kawasaki Hobson Biederman Klepfer Lemmon Baker-Just(0C) (*F)
1000 1832 7.5% 16.3% -48.3% -62.7% -75% -31.7%
1200 2192 4.6 12.7 -4.6 -15.6 -27.7 -78.3
1500 2732 0.7 9.0 28.1 20.0 9.1 -147.0
The differences are calculated relative to the results of thepresent study.
bThe correlation based on the assumption of a stoichiometricgradient in the oxide is used (see p. 85).
cCorrelation based on analysis of complete data set (see p. 85).
by us, and on an Arrhenius plot their best estimate lines cross ours at
temperatures somewhat above 1200%C (21920 F).
There is in addition a recently completed set of measurements by
Leistikow, Berg, and Jennert.9 They report an activation energy of
47 kcal/mole for the rate constant for total oxygen consumption. Their
analytical expression for 62/2 is biased, however, by the fact that they
included a rate determination at 900'C (16520 F) in their 'calculation. A
point by point comparison of their results at 1000, 1100, 1200, and
13000C (1832, 2012, 2192, and 23720F) showed that their experimental
values for 62/2 at these temperatures differed from ours by' 22, 11, 5,
and 2%, respectively. Thus in the range 1000 to 13000C (1832-23720F)
the measurements of Leistikow, et al. appear to be in reasonable agree-
ment with ours.
It is difficult to use these comparisons as a basis for any quanti-
tative estimates of the indeterminant errors in our experimental procedures.
The various data sets appear to fall into two clusters, our results and
those of Kawasaki, Hobson, and Leistikow, et al. in one and those of
Biederman, Klepfer, and, to a lesser extent, Lemmon in the other.
Furthermore, unless total oxygen consumption is determined directly

I n1
160
(i.e., gravimetrically or by hydrogen release), quantitative comparisons
of data sets are somewhat uncertain unless specific information is
available on the computational technique and oxygen solubility data used
in the calculation of total oxygen. For these reasons we have chosen
not to include any estimate of the magnitude of indeterminant errors in
our total absolute error calculations. We feel, in any case, that such
errors are small.
SIGNIFICANCE OF ABSOLUTE ERROR ESTIMATES
The theory of propagation of errors1 0 requires that for a calculated
quantity, x,
x = f(a,b,c,...)
where a, b, c,... are experimentally measured variables, the error in
x be taken as the sum of the errors related to each measured variable.
Thus this procedure describes the worst possible case: all measurement
errors are assumed to be maximum and systematic and to have the same
sign. The purpose of the exercise is not to give a realistic estimate
of the magnitude of the actual error in x but rather to set a maximwn
upper bound for that error.
This absolute error analysis is included in this report in order
to provide such an upper bound. It must be borne in mind, however,
that it is highly unlikely that the various experimental errors dis-
cussed did, in fact, occur systematically and were of the same sign.
To the extent that the various experimental measurement errors are
random, the uncertainty on 62/2 would be best described by the confi-
dence limits derived from a statistical treatment of the data. In
other words, errors in thickness, time, or temperature measurements
for any given single oxidation specimen would tend to be averaged out
in the 10 to 20 such sets of measurements used to define the oxidation
rate curve and, hence, 62/2, at any temperature. Furthermore, a similar
averaging occurs during the construction of an Arrhenius plot, thus
minimizing further the effects of random errors.

161
As already noted in the section on indeterminant errors, it is
impossible to prove absolutely that unknown, systematic errors do not
exist in our data. For the reasons already given, however, we believe
that such errors, if they exist at all, are small, and we feel that
the best available description of the uncertainties in the data is that
derived from the statistical treatment of the results. Thus, although
the absolute error analysis yields uncertainties in the parabolic rate
constant for oxide growth of n±16% at 10500C (19220F), '~±19% at 12500C
(22820F) and "'±28% at 15000C (27320F), a better approximation to the
real uncertainty is given by the statistical results: "'±5% at 10500 C
(19220F), "'±2.5% at 1250*C (22820F), and "'±4% at 1500'C (27320F).

I "'
162
REFERENCES
1. R. A. Perkins, Zirconium Metal-Water Oxidation Kinetics II. Oxygen-18Diffusion in a-ZircaZoy, ORNL/NUREG/TM-19 (July 1976).
2. K. 0. Bowman and L. R. Shenton, "Omnibus Test Contours for Departurefrom Normality Based on v'bj and b2," Biometrika 62: 243-250 (1975).
3. J. V. Cathcart, D. L. McElroy, R. E. Pawel, R. A. Perkins,R. K. Williams, and G. J. Yurek, Zirconium MetaZ-Water OxidationKinetics, I. Thermometry, ORNL-5102 (February 1976).
4. S. Kawasaki, T. Furnta, and M. Hashimoto, Reaction of ZircaZoyCladding with Steam under Simulated Loss-of-Coolant AccidentConditions, JAERI-M-6181 (July 1975).
5. D. 0. Hobson and R. E. Pawel, unpublished results, ORNL (1973).Original data from D. 0. Hobson and P. L. Rittenhouse, EmbrittZe-ment of ZircaZoy-Clad Fuel Rods by Steam during LOCA Transients,ORNL-4758 (January 1972).
6. R. R. Biederman, R. G. Ballinger, and W. G. Dobson, A Study ofZircaZoy-Steam Oxidation Reaction Kinetics, Research Project No.249-1, Electric Power Research Institute, Palo Alto, Calif., FinalReport, September 1976.
7. H. H. Klepfer, reported in G. J. Scatina, Fuel Cladding Embrittle-ment during a Loss-of-Coolant Accident, NEDO-10674 (October 1972).
8. A. W. Lemmon, Jr., Studies Relating to the Reaction Between Zirconiumand Water at High Temperatures, BMI-1154 (January 1957).
9. S. Leistikow, H. v. Berg, and D. Jennert, "Comparative Studies ofZircaloy-4/High Temperature Steam Oxidation under Isothermal andTemperature Transient Conditions," in Proceedings, CSNI SpecialistMeeting on the Behavior of Water Reactor Fuel Elements under AccidentConditions, Spatind, Nord-Torpa, Norway, September 13-16, 1976, inpress.
10. See, for example, S. L. Meyer, Data Analysis for Scientists andEngineers, John Wiley and Sons, New York, N.Y., 1975, p. 39.
'\,J

163
APPENDIX B
HYDROGEN ANALYSES FOR OXIDIZED SPECIMENS
.INTRODUCTION
Hydrogen, like oxygen, can dissolve in large quantities in zirconium
or Zircaloy and in certain circumstances is capable of embrittling
Zircaloy seriously. Because hydrogen is one of the products of the
steam-Zircaloy reaction, one is always concerned about the possibility
of hydrogen pick-up during steam oxidation. Fortunately, the presence of
an oxide film greatly retards the rate at which hydrogen is absorbed by
Zircaloy; nonetheless, we considered it important to obtain a series of
hydrogen analyses for specimens used in the present investigation.
These analyses showed that many of the MiniZWOK specimens had
absorbed considerable quantities of hydrogen during oxidation.- In this
Appendix the analytical results are summarized, the manner in which the
hydrogen entered the specimens is discussed, and experimental evidence is
cited to show that the presence of hydrogen did not significantly influence
the observed rates of oxidation of the samples.
ANALYTICAL RESULTS
A variety of samples were submitted for hydrogen analysis. Included
were sections of as-received tubes as well as samples oxidized on both
sides (two-sided oxidation) in several different apparatuses. This
latter set contained standard MaxiZWOK samples, specimens from the high
pressure steam apparatus (SuperZWOK), and several tubes o'xidized in a
preliminary version of MiniZWOK where specimens were oxidized on both
the inside and outside surfaces. In addition analyses were obtained for
a large number of samples oxidized under both isothermal and transient
temperature conditions in'the standard MiniZWOK apparatus where oxida-
tion occurred primarily on the outer surfaces of the specimens (one-sided
oxidation). Also included in the category of one-sided oxidation experi-
ments were three specimens oxidized in a specially modified version of

l ?
164
MiniZWOK; these samples, designated as "MiniZWOK, full length", were
cut to such a length that their ends extended beyond the top and bottom
of the apparatus. These tubes were held in place with 0-rings, and the
interior of the tubes was filled with slowly flowing, high purity helium.
This design made it possible to exclude steam rigorously from the interior
of the tubes.
Samples to be submitted for hydrogen analyses were obtained from
oxidized specimens in the following manner. A ring section, approximately
0.5 cm (3/16 in.) wide and containing the tabs to which the thermocouples
are attached, was cut from the approximate center of the specimen and was
used for metallographic evaluation of oxide and alpha layer thicknesses.
A second ring section of about the same dimensions was then removed from
that end of the remaining portions of the specimen that was adjacent to
the section removed for metallographic purposes, and this ring, after
being cut in half, was submitted for analysis. In general, the analytical
laboratories cut smaller aliquots from the sample submitted before per-
forming the actual analysis. It should also be noted that in some
instances where multiple analyses were obtained on the same specimen,
a second ring section, further removed from the central specimen, was
used.
Prior to submission for analysis, all specimens were washed in a
detergent solution, rinsed thoroughly with alcohol and water, and dried
to make certain that no organic surface contaminants were left on the
samples. Specimens were analyzed in both the as-oxidized condition and
after both the outside and inside surfaces had been machined down to
bare metal. No significant differences in reported hydrogen concentra-
tions were noted for specimens prepared in these two different ways.
Because the initial hydrogen analyses obtained for the standard
MiniZWOK specimens showed considerable scatter, samples were submitted
for analysis at three different laboratories: the Analytical Chemistry
Division, ORNL; the Analytical Laboratory of the Wah Chang, Albany Corp.;
and the Plant Analytical Laboratory at the Y-12 facility in Oak Ridge.
Techniques used in the analyses included vacuum fusion, inert-gas fusion,
and hot, vacuum extraction. The results of these analyses are summarized
in Table Bl.

C C
Table BI. Hydrogen Analyses of Zircaloy-4 Specimens
Experimental
Description of Specimen Expt. No. Conditions Tubing Hydrogen Content (ppm by wt)t(s) T(°C) Source ORNL Wah Chang Y-12a Y-12b
As-received tubes SandvikSandvikSandvikSandvikBatch "B"
20,23,26,19,20,25,26,22,17,24,14,14,11
15,17 23
As-received tubes
Two-Sided Oxidation
MiniZWOKcMini.ZWOKcMiniZWOKcMiniZWOKcMiniZWOKcMiniZWOKCMiniZWOKcMiniZWOKc
10-16-114210-16-140810-18-105110-18-140410-18-143810-11-104210-11-131810-11-1533
188142546171
62565065
120012001180120012001210
.11901204
BatchBatchBatchBatchBatchBatchBatchBatch
"B""B""#B""B"
"B"
"B"
14,1616,321516,1717102326
14oHONLn18
MaxiZWOKMaxiZWOK
Max-26Max-24
383 900 Sandvik 27,28,24 19640 1005 Sandvik 35,26,25 17 21
SuperZWOK Z-13 380 905 Sandvik 36,27 40 18
One-Sided Oxidation
MiniZWOK,MiniZWOK,MiniZWOK,
full-lengthdfull-lengthdfull-length
SL-244SL-246SL-247
170 1038180 1068
65 1153
SandvikSandvikSandvik
252722
112521

Table B1. (Continued)
ExperimentalDescription of Specimen Expt. No. Conditions Tubing Hydrogen Content (ppm by wt) -
t(s) T(°C) Source ORNL Wah Chang Y-12 Y-12
One-Sided Oxidation (Continued)
MiniZWOK,MiniZWOK,MiniZWOK,MiniZWOK,MiniZWOK,
standardstandardstandardstandardstandard
S-80S-71S-73S-76S-79
30105194249388
11531153115311531153
SandvikSandvikSandvikSandvikSandvik
981
380320740
933681504251096
MiniZWOK,MiniZWOK,MiniZWOK,MiniZWOK,MiniZWOK,
standardstandardstandardstandardstandard
S-118S-115S-116S-119S-122
S-19S-23
S-90S-82
11 140430 140446 140456 140474 1404
SandvikSandvikSandvikSandvikSandvik
3546
14692
187
50130366175
207330
21377
a'
MiniZWOK, standardMiniZWOK, standard
MiniZWOK, standardMiniZWOK, standard
420 905 Sandvik 109,67 5001623 905 Sandvik 119,103 230
MiniZWOK, standardMiniZWOK, standard
MiniZWOK, 5% H2 addedMiniZWOK, 5% H2 added
S-138S-136
S-180S-185
66 1203 Sandvik 42,45 43236 1203 Sandvik 294,449,427
8 1504 Sandvik 37,37 3047 1504 Sandvik 30,188 190
170 1101 Sandvik 255,130 32033 1304 Sandvik 48,160,83 32
( (1 I

C C'
Table B1. (Continued)
C+
Experimental
Description of Specimen Expt No Conditions Tubing Hydrogen Content (ppm by wt)DsrpinoSpcmnEp.N.Source a bt(s) T(°C) ORNL Wah Chang Y-12 Y-12
Transient Temperature Oxidation (One-Sided)
MiniZWOK, 2-peak LOCA S-160 Sandvik 940 1140MiniZWOK, 2-peak LOCA S-196 Sandvik 978 1160MiniZWOK, trapezoidal transient S-155 Sandvik 487MiniZWOK, trapezoidal transient S-156 Sandvik 509MiniZWOK, 1400/1100°C transient S-163 Sandvik 497MiniZWOK, l-100/1400 0C transient S-164 Sandvik >827
aY-12 high vacuum, hot extraction analysis.
bY-12 inert gas fusion analysis.
c Preliminary MiniZWOK experiments, Batch B tubing.
dModified MiniZWOK apparatus; see text.
a'

Il l
168
EVALUATION OF ANALYTICAL DATA
Inspection of Table B1 will reveal a considerable scatter in the
data obtained from the three laboratories for standard MiniZWOK speci-
mens. Two causes for this variability suggest themselves: (1) inaccuracies
in the analytical procedures and (2) an inhomogeneous distribution of
hydrogen in the samples.
All laboratories cited uncertainties of nx±10 to 20% of reported
values for the results of vacuum- or inert-gas fusion techniques, with
the higher uncertainties being applicable in the 20 ppm H2 range. The
hot extraction methods are thought to be somewhat more accurate,
especially the High Vacuum Hot Extraction technique employed by the Y-12
Plant Laboratory where uncertainties less than 1 ppm are claimed in the
1 to 20 ppm range. These error estimates appear to be more or less
consistent with the relatively small variations in hydrogen content
reported for the as-received Zircaloy tubes and for specimens subjected
to oxidation on both sides. They are not sufficiently large to allow
the variations in the reported hydrogen contents of the MiniZWOK samples
to be reconciled, however.
Given the manner in which hydrogen gets into the specimens (see
below), it is possible that hydrogen is not distributed homogeneously
throughout a sample despite the very high diffusion rates expected for
hydrogen in Zircaloy at high temperatures. Lack of homogeneity would
certainly lead to varying results for the hydrogen concentrations mea-
sured. Furthermore, there is no a priori reason to assume that the
hydrogen content of one oxidized sample will be completely consistent
with that for another, and this type of variability could contribute
to the apparent inconsistency of some of the results as well. This
question is considered further in connection with the mechanism of
hydrogen solution in the samples.
While it has not been possible to exorcise all doubts concerning
the accuracy of the hydrogen analyses, particularly at high hydrogen
concentrations, we have concluded that rather high hydrogen concentra-
tions existed in many of the MiniZWOK samples and that a substantial

169
part of the variability in the results is attributable to an inhomo-
geneous distribution of hydrogen in the samples.
DISCUSSION OF THE ANALYTICAL RESULTS
As-Received Tubing
As already pointed out, analyses of the as-received tubes were quite
self-consistent (see Table B1). Sandvik tubing exhibited hydrogen con-
centrations ranging from 15 to 26 ppm, twelve determinations yielding a
mean value of 21.3 ppm with a standard deviation of ±3.6 ppm. The
hydrogen content of the "Batch B" tubing was somewhat smaller: 11 to
14 ppm.
Two-Sided Oxidation
Specimens oxidized on both sides, whether made of the "Batch B" or
the standard Sandvik tubing and whether oxidized in the MaxiZWOK,
SuperZWOK, or preliminary MiniZWOK apparatuses, yielded hydrogen con-
centrations in this same general range. This result is in agreement
with the previously reported data of Biederman, et al.1 and Kawasaki,
et al.2 for Zircaloy-4. This result is also consistent with the obser-
vations of Gulbransen and Andrew3 who found that hydrogen absorption by
zirconium was greatly impeded by the presence of a surface oxide film.
For a further discussion of this question, see a recent review by Cox.4
Thus it seems clear that as long as the oxygen potential over a Zircaloy
sample is high enough to produce' significant oxide formation, the rate
of hydrogen pickup will be very small, at least for short time oxidation
at high temperatures.
One-Sided Oxidation
The situation with regard to specimens oxidized on the outside only
is quite different. Virtually all of the standard MiniZWOK specimens
exhibited a tendency to pick up hydrogen, and many exhibited hydrogen
concentrations in the range 100 to 300 ppm.

I
170
An exception to this general statement is to be found in the analyti-
cal results for the three specimens designated "MiniZWOK, full length"
(see Expts. SL-224, 246, and 247, Table Bl). The hydrogen concentrations
in these specimens are very close to those for the as-received Sandvik
tubes, and the agreement between the analyses obtained at ORNL and those
from the Y-12 laboratory is quite satisfactory. It will be recalled
that the "MiniZWOK, full length" experiments were designed so that steam
was rigorously excluded from the interior of the sample tubes, and these
analytical results demonstrate that when no source of hydrogen is present
in the interior of a specimen, no more hydrogen is absorbed by the
Zircaloy sample during one-sided oxidation than would be the case for
two-sided oxidation. These same results also strongly suggest that the
hydrogen present in the standard MiniZWOK specimens must have been
absorbed through the surface of the inner wall of the specimen tube.
Further clues as to the manner in which hydrogen enters the samples
may be obtained from Figs. Bl and B2. In Fig. Bl hydrogen concentration
is plotted as a function of total oxygen consumed, T, by the isothermally-
oxidized, standard MiniZWOK samples. The very considerable scatter of
the data is evident, but within this scatter there is no discernible
correlation between hydrogen concentration and T when data at all tempera-
tures are considered together. Such a result is not surprising in light
of the fact that we have already concluded that hydrogen does not enter
the specimen in significant quantities through the heavily oxidized outer
surface of the tube.
Figure B2 shows hydrogen concentration as a function of oxidation
time for the same set of samples. Here, despite the scatter in the data,
a trend may be detected; the longer the oxidation time, the greater is
the chance that high hydrogen concentrations will be observed.
Mechanism of Hydrogen Absorption
The standard specimen used in the MiniZWOK apparatus is a 3 cm
(1.2 in.) long PWR Zircaloy tube held between two specially ground quartz
tubes in the center of a steam-filled reaction chamber. A slight posi-
tive pressure of helium is maintained inside the specimen to prevent
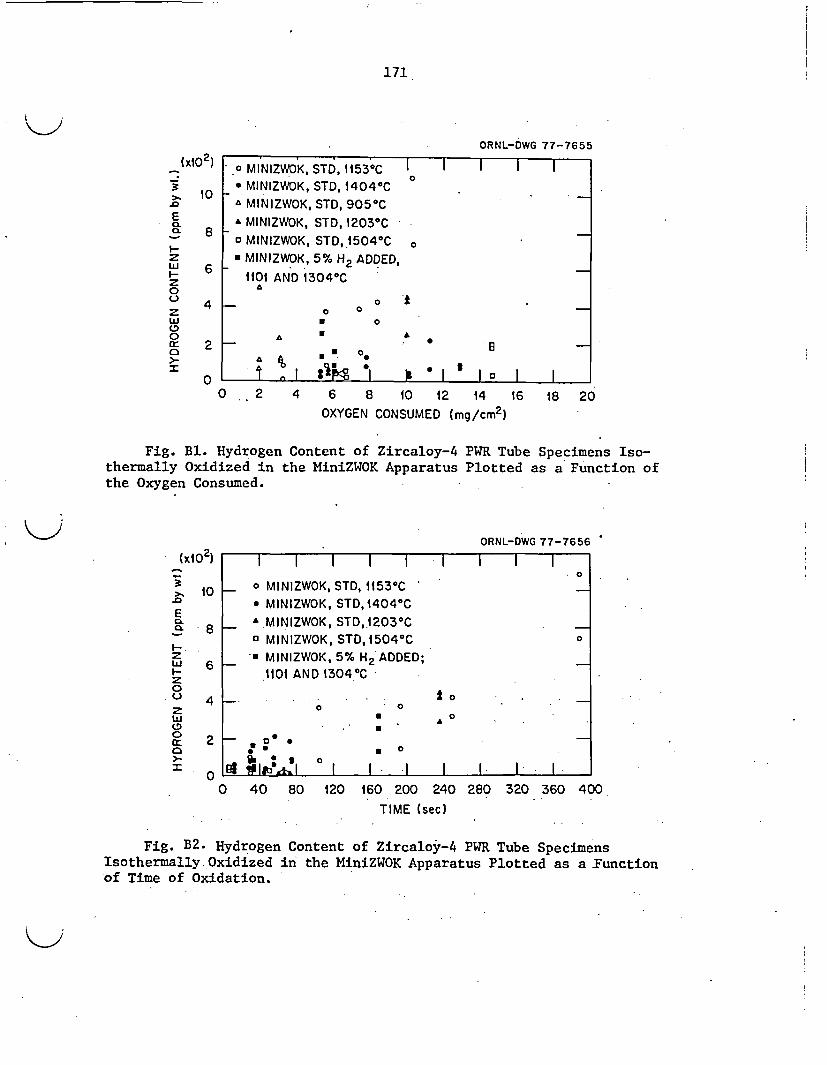
171
ORNL-DWG 77-7655
(x102 )
-CLE
0.z
Liz
0wa
I
10
8
6
4
2
0
° MINIZWOK, STD, 1153°C0
* MINIZWOK, STD, 1404 0CA MINIZWOK, STD, 905°C* MINIZWOK, STD, 1203°C° MINIZWOK, STD,1504C o* MINIZWOK, 5% H2 ADDED,
1101 AND 1304 0C
0o o* 0
' . I A0
0 .2 4 6 8 10 12 14 16 18 20
OXYGEN CONSUMED (mg/cm 2)
Fig. B1. Hydrogen Content of Zircaloy-4thermally Oxidized in the MiniZWOK Apparatusthe Oxygen Consumed.
PWR Tube Specimens Iso-Plotted as a Function of
ORNL-DWG 77-7656
(xlO2)
>, 10.0
ECL
tt 6Z0
z0C:: 2
Io
_ o MINIZWOK, STD, 1153°C* MINIZWOK, STD, 14040C_ *MINIZWOK, STD,1203°C -
° MINIZWOK, STD,1504°C °_ MINIZWOK, 5% H2 ADDED;
1101 AND 1304 °C
- o t .o0 *
U
0 40 80 120 160 200 240TIME (sec)
280 320 360 400
Fig. B2. Hydrogen Content of Zircaloy-4 PWR Tube SpecimensIsothermally Oxidized in the MiniZWOK Apparatus Plotted as a Functionof Time of Oxidation.

I rl
172
ingress of steam to the inner surface of the tube. Thin tantalum washers,
which oxidize when the temperature is increased to the desired oxidation
range, also help in sealing off the ends of the specimen.
However, despite these precautions small amounts of steam have been
known to leak into the center of the specimens in some experiments.
Observations on longitudinal sections through oxidized specimens
have, in fact, revealed the presence of a thin layer of oxide on the
inner surface of the tube; this oxide layer is thickest at the end of
the tube and tapers down to nothing as the center of the tube is approached.
Thus it appears that in many MiniZWOK experiments small amounts of steam
have leaked around the ends of the specimens and reacted at the inner
surface of the tube, creating oxide and releasing hydrogen. The Zircaloy
acts as an efficient getter for the steam so that the center of the
specimen is under virtual steam starvation conditions. The Zircaloy
surface there is either free of oxide or covered by only a thin oxide
layer. Under these conditions hydrogen is easily absorbed as has been
shown by Kawasaki, et al.2
This scenario explains a number of observations relative to hydrogen
absorption. The amount of hydrogen absorbed will depend in two ways on
the leak rate of steam into the center of the specimen. To begin with,
to obtain significant hydrogen absorption the leak rate must be less
than a certain maximum value; above this level the entire inner surface
of the specimen will be oxidized, steam starvation conditions will not
prevail, and little hydrogen pickup will be observed. The comparatively
low hydrogen concentrations observed for the specimen oxidized for
1623 min at 905%C (1661'F) (see Expt. S-23, Table Bl) may, perhaps, be
accounted for on this basis.
For leak rates below this maximum, the extent of hydrogen absorption
should depend primarily on absolute magnitude of the leak rate and on the
time of oxidation. This conclusion can account for the correlation with
time noted in Fig. B2 and for the scatter in the analytical results.
Variations in leak rate could produce variations in the extent of
coverage by oxide of the inner specimen surface, thus also accounting
for the apparently inhomogeneous distribution of hydrogen in the specimens.

-
173
Transient Temperature Oxidation
As may be noted in Table Bi, specimens subjected to transient tem-
perature oxidation exhibited particularly high hydrogen levels. The most
likely explanation of this phenomenon rests on the fact that the coef-
ficient of expansion of a Zircaloy specimen is much larger than that of
the quartz tubes that hold it in place in the oxidation apparatus. Thus
when the specimen expands or contracts in the various stages of a transient,
the upper quartz tube, which is lightly spring loaded, must move up and
down if the seal between it and the specimen is to be maintained. It
seems plausible that such motion could produce a slight unseating of the
tantalum gaskets at the ends of the specimen, thus increasing the steam
leak rate slightly and enhancing hydrogen absorption.
Another mechanism that cannot be discounted involves our explanation
of anomalous transient temperature oxidation (see p. 109 of the main body
of this report). We suggested the possibility of the transformation of
an initially tetragonal oxide scale to a monoclinic structure during
portions of certain types of temperature transients, e.g., the two-peak
LOCA's tested in Experiments S-160 and S-196 (see Table Bi). Evidence
exists5 that during oxidation at relatively low temperatures where the
monoclinic oxide is stable, hydroxyl ions may diffuse through the oxide,
releasing hydrogen at the oxide-metal interface. We can cite no evidence
in support of this mechanism as a means for introducing hydrogen into
our specimens, but it remains a possibility.
POSSIBLE EFFECTS OF DISSOLVED HYDROGEN ON OXIDATION RATES
Having established that the rather high hydrogen concentrations
observed in many MiniZWOK specimens in all probability were the result
of a characteristic of the apparatus, we considered it important to
address the question of whether hydrogen dissolved in the metal phases
of the specimens might have influenced the measured rates of oxidation.
There is a considerable body of indirect evidence that suggests that no
such perturbation of the oxidation rates occurred, but as an additional
check we also carried out a special series of oxidation experiments in

'I
174
which the MiniZWOK specimens were oxidized in pure oxygen rather than
steam. In this section we describe these various observations and results
and conclude finally that the presence of hydrogen in the metal did not,
within the sensitivity of our measurements, influence oxidation rates.
Indirect Evidence
Self-Consistency of Rate Data
Inspection of Table Bl and Figs. Bl and B2 shows that the hydrogen
content of the MiniZWOK specimens tended to increase with the total time
of oxidation essentially independent of temperature or total oxygen con-
sumption. Thus when a series of specimens was oxidized for varying
lengths of time at a fixed temperature in order to generate an oxidation
rate curve, the specimens oxidized for shorter times contained, in
general, less hydrogen than those oxidized for longer periods [cf.,
MiniZWOK specimens oxidized at 11530C (2107'F), Table Bl]. Yet no
significant deviation from parabolic behavior was observed in the
corresponding rate curves as might have been expected had hydrogen
dissolved in the metal had a major effect on the kinetics.
A similar argument may be made regarding oxidation at different
temperatures. Specimens oxidized at 14040C (25590F), for example,
contained less hydrogen than those oxidized at 11530C (2107'F) (see
Table B1) because oxidation times at the higher temperatures were shorter.
However, inspection of the Arrhenius plots of the rate data shows that
the high temperature results are entirely consistent with those obtained
at lower temperatures, again suggesting that the hydrogen dissolved in
the metallic phases of the Zircaloy had no effect on oxidation rates.
We conclude, therefore, that the self-consistency of the oxidation
rate data is itself evidence against spurious oxidation results relating
to the absorption of hydrogen by the MiniZWOK specimens.
Comparison with Other Data
Oxidation rate data obtained with the MiniZWOK apparatus (relatively
high hydrogen contents) agrees well with data obtained in the MaxiZWOK
apparatus (low hydrogen) at 900 and 1000%C (1652-18320F) and in the high

- -
175
pressure apparatus (SuperZWOK) where the hydrogen content of the specimens
was also low (cf., Table Bl). Similar good agreement can be cited-between
our data and those of Kawasaki, et al.6 and Leistikow, et al.,7 both the
latter investigations involving specimens with low hydrogen contents.
Thus a comparison of our MiniZWOK results with other data sets also
supports the conclusion that hydrogen dissolved in Zircaloy has no
appreciable effect on its oxidation rate.
Experiments in Pure Oxygen
Although the indirect evidence just cited suggests strongly that the
hydrogen found in the MiniZWOK specimens did not influence their oxida-
tion rate, we felt that the possibility of "hydrogen effects" actually
occurring should not be dismissed out of hand. For example, the forma-
tion of O-H complexes, which could-alter the diffusion rates of oxygen,
has been observed near room temperature'and below in niobium containing
hydrogen and oxygen.8 *9 These complexes tend to dissociate at tempera-
tures slightly above room temperature, making remote the likelihood of
their existence in Zircaloy at temperatures of interest in this study.
Nevertheless, we have performed experiments in pure oxygen in order to
provide a reference state against which possible hydrogen effects in
Zircaloy can be judged.
Analysis of Possible Effects
At high temperatures ZrO2 is generally assumed to be an n-type con-
ductor with diffusion proceeding via an anion vacancy mechanism. Thus
if hydrogen dissolved in the metal phases of a specimen has no effect
on the-oxidation rate and if no changes in stoichiometry, defect con-
centration, or ionic mobilities occur in the oxide, oxidation in pure
oxygen should be identical with that observed for steam oxidation in the
MiniZWOK apparatus. On the other hand, changes in mobility or equilibrium
oxygen solubilities in oxide, alpha, or beta phases should cause oxidation
behavior in pure oxygen to be different from that in steam, and it is
possible to predict trends in the growth rates of oxide and oxygen-
stabilized alpha layers on the basis of any such differences.

I I,
176
The velocity of any phase boundary in an oxidizing Zircaloy specimen
is proportional to the difference between the oxygen fluxes into and out
of the boundary. For example, the velocity, vi j of the ij boundary is
given by
9i j =(Ji i Jj iJ)/A i,; (Bl)
and
J -DiVcij (B2)
where J ; is the oxygen flux to the ij boundary, the first subscript
indicating the phase in which the flux is measured; Vcij is the oxygen
concentration gradient in the i'th phase at the ij boundary; Di is the
diffusion coefficient in the itth phase; and Aci; = ci - c; with ci
and c. being the equilibrium oxygen concentrations in the i'th and j'th
phases, respectively, at the ij boundary. Thus any change in ij must
involve changes in diffusion coefficients or equilibrium oxygen concen-
trations or both. (Strictly speaking, the denominator of Eq. (Bl) should
be written as Vi j Ci - Cji' where Vi is the ratio of equivalent
volumes of the i'th to the j'th phase. At the oxide-alpha boundary V
has a value of 1.5 and is essentially unity at the a/a interface. In
the discussion to follow the actual value of V ; does not enter into
consideration, and for the sake of notational simplicity we shall use
Eq. (Bl) in the form shown with the understanding that AC Vi j Ciiii ~
Effects in the Alpha and Beta Phases - It would appear that the
only possible effect of hydrogen on D or Da would be that of decreasing
the diffusivities. As mentioned previously, changes in the diffusion
coefficient for oxygen in Nb containing dissolved hydrogen could be
brought about by the formation of the O-H complexes observed at low
temperatures. It is most unlikely, however, that such complexes could
retain any degree of stability in Zircaloy at the high temperatures used
in this study; but if they do, the presence of the complexes should, if
anything, reduce oxygen mobility. Both oxygen and hydrogen diffuse

- - .
177
interstitially in Zircaloy, and the jump frequency, y OH' for an 0-H
pair is related to the jump frequencies, n% and (H, of isolated oxygen
and hydrogen atoms, respectively, by
TO-H = QOH/(0 + DH) = no/(l + no/YH) , (B3)
and nH > DO Therefore,
- *(B4)
Thus the formation of 0-H pairs should either reduce the diffusivity of
oxygen or leave it unchanged. D or D might also be decreased if, as a
result of the presence of hydrogen, the correlation factor for oxygen
were reduced below the value of unity expected for Interstitial diffusion.
An increase in the diffusivity, on the other hand, would require that the
strain field associated with dissolved hydrogen produce an increase in
the jump frequency, nO, for oxygen. In light of the smallness of the
hydrogen atoms and their high rate of diffusion, however, such a possi-
bility is dismissed, -and we conclude that only decreases in Da and D can
occur as a result of the presence of hydrogen.
C.Roy 1O reports that when a crystal-bar zirconium sample, previously
charged with 44 ppm tritium, was oxidized in oxygen at 500 0C (932*F) long
enough to produce an oxide film 2.5 pm thick, subsequent autoradiographs
revealed no tritium in the oxide or in the underlying metal zone highly
enriched in oxygen. When the oxidized specimens were annealed at 8000C
(14720F) to dissolve the oxide scale and then either slow cooled or
quenched, "very little hydrogen was found in the thick'layer of metal
enriched in oxygen". Clearly, the introduction of oxygen into a Zircaloy
specimen will reduce the solubility of hydrogen in the metal, and this
result suggests the existence of a solubility product relationship
lao][aHI k ,(B5)
where aO and aH are the activities of oxygen and hydrogen, respectively,
and k is the solubility product. 'Roy's experimental results indicate
that the magnitude of any hydrogen effect in the'alpha will surely be

I ri
178
small, and the solubility product relationship suggests that hydrogen in
the beta phase could only reduce the equilibrium oxygen solubility.
Since a reduction of the solubility of oxygen in the beta would also
lead to a reduction in Vca ,a we can conclude that solubility changes
due to hydrogen in the beta will produce only decreases in the oxygen
flux, Ja a' into the beta [cf.,Eq. (B2)].
Effects in the Oxide - Kofstad's1l summary of the properties of ZrO2
makes it clear that transport mechanisms in ZrO2 are not fully under-
stood. The predominant characteristics of ZrO2 are those of an oxygen-
deficit, n-type semiconductor with material transport occurring via anion
vacancy diffusion. Given the great stability of zirconia, the assumption
of most investigators that ZrO2 is stoichiometric in either steam or oxygen
at one atmosphere might appear justified. With regard to the possible
effects of the hydrogen liberated by the steam-Zircaloy reaction, we
have already cited evidence for the limited solubility of hydrogen in
ZrO2,10 and any effect of such small quantities of hydrogen on the
vacancy diffusion rate in the oxide should be insignificant. On the
basis of such arguments one would predict that oxygen mobilities and
interfacial concentrations in the oxide would be the same during oxida-
tion in oxygen or in steam.
On the other hand, electrical conductivity measurements at 1550%C
(28220 F) and below provide somewhat controversial evidence for a component
of p-character in the conductivity of ZrO2. In such a case, the rate of
oxidation might be some function of oxygen pressure. Furthermore,
McClaine and Coppel1 2 reported differences in the conductivity of ZrO2
measured in H2-H20 atmospheres as compared to data obtained in CO-CO2
mixtures having the same oxygen partial pressure. They attributed their
results to hydrogen entering the ZrO2 as an interstitial positive ion
with an associated electron. These observations raise the possibility
that during oxidation of Zircaloy in steam, small quantities of hydrogen
dissolve in the oxide and change its defect concentration. For example,
either an interstitial proton or a proton trapped on a vacant cation site
would produce an increase in the oxygen vacancy concentration in the
oxide. The influence of such hydrogen impurity atoms would be most

179
important at the gas-oxide interface where the intrinsic vacancy con-
centration is virtually zero; at the oxide-alpha interface, however, the
intrinsic vacancy concentration is so high (X8%) as to make extrinsic
contributions negligible. The net effect, then, of hydrogen dissolved
in the oxide would be that of reducing slightly the defect concentration
gradient across the scale by reducing the oxygen concentration in the
oxide at the oxide-gas interface. For additional information see also
Refs. 4 and 5.
The above comments relate to the properties of relatively pure ZrO2.
The oxide formed on Zircaloy contains small amounts of various alloying
additions such as Sn, Fe, and Cr. Depending on their oxidation state,
these impurity elements could contribute to the extrinsic defect con-
centration in Zircaloy oxide. However, in principle, at least, the
various arguments given above should apply to both pure ZrO2 and the
oxide formed on the alloy.
We conclude from this discussion that it is difficult to suggest a
mechanism by which oxygen mobility in the oxide can be affected by the
oxidizing medium. However, the possibility of a variation in equilibrium
solubilities cannot be dismissed. If such a change does occur, one
should recognize that it is a natural consequence of oxidizing Zircaloy
in two widely differing media, and the change should not be described as
a "hydrogen effect" in the sense of possible effects on oxidation rates
produced by hydrogen dissolved in the alpha or beta regions.
Experimental Results for Oxidation in Oxygen
With these various possibilities in mind, oxidation rate curves were
determined for Zircaloy-4 in 5-9's oxygen at 1253 and 1404%C (2287-25590F).
Ten specimens were used to define each curve, and the specimens and pro-
cedures used were identical .to those employed in the standard MiniZWOK
experiments except that pure oxygen at one atmosphere pressure was sub-
stituted for steam.
The results obtained are summarized in Table B2 in terms of parabolic
rate constants for oxide and a-layer growth. The uncertainties listed are
for the 90% confidence level. For ease of comparison the corresponding
rate constants obtained for oxidation in steam are also listed. Values

Table B2. Parabolic Rate Constants for the Oxidation of Zircaloy-4in Oxygen and Steam at 1253 and 1404'C (2287-29950F)
2a2aa aTemperature 62/2 Dev.a 62/2 Dev.a 62/2 Dev. 62/2 Dev.t T
[QC (OFM] (cm2/s x 107) (% (CM2/cs x 107) (% (cm2/s x~ 107) M [(g/cm2)2/g x 107] M%
Oxidation in Oxygen
1253 (2287) 0.9275 ±3.1 0.9875 ±4.9 3.827 ±2.0 3.5847 ±1.9
1404 (2559 2.681 ±2.6 3.830 ±5.2 12.92 ±3.1 11.55 ±2.1
Oxidation in Steam
1253 (2287) 0.7663 ±6.7 1.007 ±8.2 3.530 +7.2 3.300 ±6.0
1404 (2559) 2.351 ±4.1 4.122 ±4.4 12.70 ±3.9 11.31 ±3.4
aUncertainty (%) at the 90% confidence level.
00
bKinetic parameters in steam calculated from actual data at each temperature.
( ( C

181
of oxidation times, observed oxide and alpha layer thicknesses, and total
oxygen consumed (calculated) are tabulated in Tables B3 and B4.
Discussion of Results
Inspection of Table B2 shows that the rate of oxide growth is
smaller in steam than in oxygen, while the rate of alpha growth is slightly
greater in steam than in oxygen. At both temperatures investigated the
differences in the two data sets are small, but for 62/2 and 62/2 these
differences lie outside the statistical uncertainty limits at the 90%
confidence levels. The uncertainty intervals of 62/2 and 62/2 do over-a
lap at the 90% level. For both these parameters, however, the trends
in the experimental data are clear; the growth rate of the alpha
layer is slightly greater in steam than in oxygen, while the reverse
is true for Xi layer growth. We conclude, therefore, that the oxida-
tion behavior of Zircaloy-4 in oxygen is not equivalent to oxidation
in steam, and that
FIH 2O,H < °1 (B6)
I20 H °12 (B7)
where 4 and a are the oxide and alpha layer thicknesses, respectively.
One may also infer from Eq. (B6) that
vf aJHOH ' V ,aJ2 (B8)
Hydrogen Effects in the Beta Phase Only - The most immediate explan-
ation that suggests itself for these differences is the possibility of a
hydrogen effect in the beta phase. As already pointed out, most of the
hydrogen in the MiniZWOK specimens must have been concentrated in the
beta phase, and reasonable arguments can be made that other effects in
the oxide and alpha layers should be minor. Consider, therefore, the
following postulate, which we will prove false.
Postulate I. A hydrogen effect occurs in the beta phase only.
It follows from the postulate that mobilities and equilibrium oxygen
concentrations are undisturbed in the oxide and alpha layers.

I m
182
Table B3. Oxidation of Sandvik Zircaloy-4 PWR Tubingin Pure Oxygen at 12530C (22870 F)
Time Oxide Layer Alpha Layer Total OxygenExpt. No. (s) (uM) (0m) (mg/cm2)
S-255-TC-2 31.5 25.1 23.8 4.854
S-255-TC-3 34.1 25.6 24.7 4.972
S-256-TC-2 259.5 68.9 75.1 13.676
S-256-TC-3 254.5 67.1 73.4 13.351
S-257-TC-2 273.1 69.4 74.2 13.76
S-257-TC-3 266 70.1 71.3 13.755
S-258-TC-2 168.6 57.5 54.6 11.131
S-258-TC-3 158.7 55.7 53.5 10.802
S-259-TC-2 162.6 55.4 55.7 10.839
S-259-TC-3 152.9 54.3 54.4 10.606
S-260-TC-2 100.6 45 44.7 8.758
S-260-TC-3 103 45.4 44.1 8.809
S-261-TC-2 8.6 15.5 14.4 2.94
S-261-TC-3 9.5 15.8 14 2.985
S-262-TC-2 110.3 46.1 45.7 8.99
S-262-TC-3 102.8 44.9 44.7 8.753
S-263-TC-2 99.4 43.5 41.8 8.448
S-263-TC-3 100.2 43.2 40.4 8.366
S-264-TC-2 23.5 23.2 20.2 4.401
S-264-TC-3 23 23.1 21.6 4.424

183
Table B4. Oxidation of Sandvik Zircaloy-4 PWRPure Oxygen at 1404'C (25590F)
Tubing in
Time Oxide Layer Alpha Layer Total OxygenExpt. No. (s) (Pm) (Pm) (mg/cm )
S-265-TC-2 53 53.8 62 11.085
S-265-TC-3 52.2 53.3 61.3 10.979
S-266-TC-2 59.6 56.3 69.5 11.763
S-266-TC-3 60.5 57 66.4 11.777
S-267-TC-2 52.5 52.4 62.3 10.885
S-267-TC-3 53 53.3 62.6 11.03
S-268-TC-2 57.6 54.9 65.6 11.415
S-268-TC-3 57.9 55.4 68.8 11.59
S-269-TC-2 41.6 47 58.4 9.832
S-269-TC-3 41.5 46.8 57.7 9.78
S-270-TC-2 11.7 26.8 31.8 5.511
S-270-TC-3 - 12 27 30.5 5.495
S-271-TC-2 11.9 27.6 31.5 5.623
S-271-TC-3 12.7 28.1 33.6 5.783
S-272-TC-2 23.6 35.4 43 7.375
S-272-TC-3 23.8 36.4 43.4 7.535
S-273-TC-2 27.3 38.5 48.8 8.073
S-273-TC-3 27.6 38.4 45.8 7.97
S-274-TC-2 41.7 47.9 56.4 9.901
S-274-TC-3 38.9 45.6 53.8 9.446
We shall now examine the experimental results for oxidation in
steam and oxygen. The pertinent data are represented schematically in
Fig. B3 where the positions of the various phase boundaries are referenced
to the original metal surface. We consider the relative velocities of
the oxide-alpha (¢-a) interfaces in steam and oxygen.
I a(J -Ja ) /AC4, ~ a a,4 *,c (B9)
Therefore,

I ML
184
I ~-K 2 O,H
IE '1 _I ;OXIDE IALPHA BETA
Fig. B3. Schematic Representation of Oxygen Concentration Gradientsin Oxide and Oxygen-Stabilized Alpha Layers. The linear gradient shownin the oxide is a very good approximation of reality; the gradient in thealpha layer is certainly curved but is shown as linear in order to emphasizethe differences in slope in steam as compared to oxygen. The argumentspresented in the text turn on the relative values of VC at the variousinterfaces, and the relative differences in the values are the same whetherthe actual gradient across the phase is linear or a function of position.
z-,aH20,H ° ,a%02 IAC1 [t §,aH20,H 02
Term 1
(i aflIH20,H Ja,4102)] (B10)
Term 2
It can be seen in Fig. B3 that Vc +,a|H20,H > f sa'02 an c,,¢ H20,
< VC a o2, and recalling that Jj = DiVC i,
J+.,JH20.H > 0a102 (Bll)
and
a,4lH 20,H a,+ °(B12)

185
Referring Eqs. (Bli) and (B12) to Eq. (BlO), it is evident that
Postulate I requires the right side of Eq. (B10) to be a positive
quantity, while the experimental observation [cf. Eq. (B8)] shows that
the left side of the equation is negative. Therefore, Postulate I is
false; the differences between oxidation in steam and in oxygen cannot
be explained in terms of a hydrogen effect in the beta alone.
Effects in the Oxide Only - We consider now a second postulate con-
cerning the possibility that the-decrease in oxide growth rate and the
increase in the alpha growth rate in steam relative to oxygen is due to
a decreased oxygen flux into the oxide for oxidation in steam. We shall
show that this idea is consistent with the experimental results.
Postulate II. The oxygen flux into the oxide is smaller in steam
than in oxygen, and oxygen mobilities in the a and S phase remain
unchanged as do the equilibrium oxygen concentrations at the *,a and
ad, boundaries.
This postulate is consistent with the experimental observations as
may be seen from the following arguments. By Postulate II
<~atH2OH , 02 (B13)
therefore, the first term on the right side of Eq. (BlO) is negative.
Referring again to the oxygen concentration gradients in the alpha phase
(Fig. B3), it is evident that Eq. (B12) holds in this case also; there-
fore, the second term on the right of Eq. (B10) is negative and makes a
net positive contribution in light of the negative sign in front of it.
The left side of the equation is negative, requiring only that
ITerm 11 > ITerm 21
in order to satisfy the experimental observations.
This type of analysis can also be extended to take into account the
relative velocities of the a/6 interface.

. CL
186
ValH 2 OH a,0I0 2 AC a [ a'a H20,H a' 02)
Term 1
- (i ,a'H20,H - 1,02)] (B14)
Term 2
The experimental observation is that
EIH20,H ' 102 (B15)
where C is the combined oxide and alpha layer thickness, and when the
position of the a/a interface was referenced to the original metal
surface, we found
Ma,01H20,H - Va.012 (B16)
Therefore, the left side of Eq. (B14) is equal to or slightly less than
zero. As previously, Term 1 on the right side of Eq. (B14) is negative.
Since the position of the a,$ boundary is almost the same in the two
oxidizing media, it is likely that Term 2 in Eq. (B14) is close to zero,
but in any event, we only require that ITerm 11 > ITerm 21. Thus we
conclude that Postulate II is consistent with the experimental results.
It is, in fact, possible to offer supplementary evidence that changes
in oxide stoichiometry are responsible for the observed differences for
oxidation in steam and in oxygen. This additional evidence involves the
observation that a line of metallic particles, rich in tin, is found in
cross sections through the oxide formed on Zircaloy tubes oxidized in
either steam or oxygen. This phenomenon has been reported in detail
previously,13 and the key fact is that the oxide is divided into inner
and outer regions by the particle line with the ratio of the inner oxide
layer thickness, *,i to that of the outer layer, %0, being essentiallyconstant with oxidation time. Since the oxygen concentration gradient
across the oxide is virtually linear, the constancy of fo/4i indicates
that the metallic particles must form and move along a plane of constant
oxygen potential in the oxide. _.4

187
Values of 4 and 4i were obtained for specimens oxidized in steam0
and in oxygen at 1253 and 1404%C (2287-2559 0F), and the results are
summarized in Table B5. In both oxidizing media the ratio of inner to
outer oxide thickness, i/4) , is constant with both time and total oxide
thickness; however, the inner oxide is relatively thicker in steam than
oxygen.
These results underscore some interesting aspects of the differences
in the oxidation behavior of Zircaloy in steam and oxygen. Assuming only
that the constant oxygen potential at which the metallic particles form
is the same in both media, the fact that 4 is different in the two
cases means that the equilibrium oxygen content of the oxide at one or
both interfaces is different in steam than in oxygen. Furthermore, as
will be demonstrated graphically below, the fact that i/0 O H
> indicates that the difference between the oxygen concentration
Table B5. Comparison of Growth Rates and Thickness Ratios of Inner and OuterOxide Layers Formed in Steam and Oxygen
Temperature (0C (0F)1
-1253 (2287) 1404 (2559)
62/21o x 108 (outer oxide) 3.44 + 10.6% 8.47 ± 11.8%
62/21o2 x 108 (inner oxide) 1.45 + 5.9% 5.12 ± 4.9%
62/2lH2 0H x 108 (outer oxide) 2.33 + 9.7% 7.40 ± 6.9%
62/2IH2OH x 108 (inner oxide) 1.55 + 7% 5.25 ± 3.2%
fi/ 0102 .-649 .777
0i/ I001H2 0,H .815 -. 842
*i/"o 'H2 0,H .449 .457
''NJ - - - .

IEl.
188
at the oxide-gas interface, c g, and that, c , at the oxide-alpha
interface in steam is less than the corresponding difference,
f -C in oxygen. This condition is precisely one of the phenomena
in the oxide previously suggested as a cause of the differences in the
oxidation behavior of Zircaloy in oxygen and steam.
These experimental results can be used as a quantitative basis for
assessing the extent and nature of the "hydrogen effect" in the oxide.
Figure B4 is a schematic representation of the oxygen concentration
gradient across a Zircaloy oxide scale. Note that the triangle
C ,AC a is similar to the triangle CBC a; therefore,
C-C C -C= a .(B17)
0i fT
or
0i C (B18)
T C g C,a
where T = 0 + i is the total oxide thickness. Equation (B18) is valid
for oxidation in either steam or oxygen. Note also that Eq. (B18)
demonstrates that the ratio *i/OT is independent of any effect attributable
to the presence of dissolved hydrogen in the oxygen-stabilized a or the
S phases.
One may now form the ratio
0 C -gCQ~*cC - C
(i/ T IH92O = M.gH2OH Coma
(O 4 )IO(B19)(i/ T |2 C - coba (Bl
CM102 - ,0a
or
(Oi /0 T~ 'H2,,H C 0 ~C= ,g O> 0'a (B20)
(O /0 )102 CO,g H20,H - C,ai~ X

-
189
ALPHAg OXIDE
* I
zI0
IC
A -- ~ -~ - C#,d
PARTICLE LINE -*-4
Fig. B4. Schematic Representation of Oxygen Concentration Gradientin the Oxide Layer Showing Position of the Tin-Rich Particle Line.
L\_

1=
190
On the basis of phase diagram information the equilibrium oxygen
concentrations at the oxide-alpha boundary, C a' are 1.403 and
1.391 gm/cc at 1253 and 1404'C (2287-2559 0F), respectively. 1 4 Taking
the oxide at the oxide-gas interface to be stoichiometric in pure oxygen
(C gI0 2 = 1.511 gm/cc), the appropriate experimental values of fi/fT
(Table B5) may be used to calculate Cc g'HzO H. The result at both
temperatures is C ,gI1 20,H = 1.50 gm/cc, which is equivalent to ZrOj.99.
The "particle line" observations thus indicate that oxidation in
steam produces a reduction in VC a as compared to oxidation in oxidation
in oxygen. However, the flux across the oxide-gas interface is the
product of VC a and the chemical diffusion coefficient, D, for the
oxide.
J -D VC . (B21)
We now demonstrate that the variation of VC deduced from the particle
line observations can alone account for the differences in oxidation in
oxygen as compared to steam, in other words, that D = D0IH2OH.
An analytical expression for D may be obtained from Eq. (B21) by
noting that the gradient in the oxide is essentially linear. Thus14
Jf g = D VC =a-D (C g - Ca )/4 = dT/dt , (B22)
where T is the total oxygen consumed by the sample. From the fundamental
equations describing parabolic oxidation kinetics, we have
dT/dt = (6 2 /2)/T , (B23)
=6T Ft (B24)
and
=6 Ft .(B25)
Using Eqs. (B23) and (B24),
dT/dt = 6T/2(B , (B26)

191
and substituting Eq. (B26) into Eq. (B22), using Eq. (B25), and solving
for D, , we obtain
D 6 /2(C -c ) (B27)
Equation (B27) is valid for both oxidizing media; therefore, we may form
the ratio
D Ol,2 0 H (T 4)H 2 0,H rc -o C4 , 1D | ( 6 ) C ' - C (B28)
(°T d1°02 f,gIH2 OdH ,a
If the diffusion coefficient in the oxide is the same for oxidation in
steam as in oxygen, obviously, the ratio D4 |H2O HI/D,102 must be unity.
We evaluate Eq. (B28) using the value of C gH OH = 1.50 gm/cc
obtained from the "particle line" observations; values for C a are based
on the phase diagram data already cited; Ci gIO = 1.511 gm/cc; and 6T
and 6 values are derived from the oxidation data for oxidation in oxygen
(see Table B2) and from the values for 62/2 and 62/2 obtained from the
standard MiniZWOK data set at 1253 and 1404%C (2287-25590 F) (see pp. 51-57
of this report). The results obtained were
-D 4, H2O H/D1O2 = 0.971 at 1253%C (22870F) (B29)
and
D=/D¢102 1.02 at 14040C (25590F) (B30)
These results show that the ratio of oxide diffusion coefficients
is certainly unity within experimental uncertainty, and it is interesting
to dwell on the implications of this conclusion. Unlike Eq. (B20), where
all quantities on the left side of the equation are direct observations
and independent of hydrogen effects in either the a or 0 regions, the
right side of Eq. (B28) involves the product of 6T and 6 , both of which
could be influenced by hydrogen effects in the a and 0. Furthermore,
while 6 is an experimental quantity based on observations of oxide thick-
ness as a function of time, 6T is a calculated value in our study. Its

192
evaluation requires not only direct measurements of oxide and alpha layer
thicknesses, but also information concerning oxygen diffusivity in the
beta and oxygen interfacial equilibrium concentrations in the various
phases. All the latter values were determined (by us or others) in the
absence of hydrogen. Thus the numerical evaluation of the right side of
Eq. (B28) as we have performed it is "biased" in the sense that a sig-
nificant hydrogen effect in the a or a phases, if it existed, would cause
the real value of 6 to be different from that which we calculated withT
the result that the ratio of diffusivities would depart from unity.
However, no such bias is evident in the results shown in Eqs. (B29) and
(B30), and we are led to the following conclusions.
1. The value of VC g for oxidation in oxygen is greater than that
in steam because of a reduction in C g during oxidation in steam.
2. The differences in oxidation behavior in the two media may be
rationalized solely in terms of a variation in VCf g; Df remains unchanged.
3. Implicit in these results is the conclusion that hydrogen dis-
solved in the alpha and beta phases does not change the oxygen inter-
facial concentrations in either the a or 0, nor does it influence oxygen
diffusivity in the beta.
This last conclusion may be tested more directly through a calcula-
tion of the diffusivity, Da, for oxygen in the alpha. Pawel1 4 has shown
that Da may be expressed as
aa'
a 2 a,| 2a,
[a 0 0C,a / 1B 2] (31+ _+[ (c :C) [exp (ik6) }(B31)
_a V a,-Ca La r 2 + ]
where
C is the initial oxygen concentration in the beta phase, anda

-
193
d + 1 \2
a I a-exp -
F = a 1 /
erf X - erf
Inspection of Eq. (B31) shows that all the parameters on the right side,
except V, could, in principle, be changed by the existence of a hydrogen
effect in the alpha or beta phases. Note also that the 6 ts are quantitiesi
derived directly from our experimental data, while values for D and the
equilibrium oxygen concentrations have been obtained only in the absence
of significant amounts of dissolved hydrogen in the a and 0 phases. Thus
the use of Eq. (B31) to evaluate D aI2 and D 0 is "biased" in the
sense that the existence of any hydrogen effect that changes D0 or the
oxygen concentration terms would produce a change in the calculated D
Consequently, if one finds, on the basis of Eq. (B31), that
D 'c 0 D aIH OHe a hydrogen effect in the alpha or beta is stronglysuggested. On the contrary, the finding that DalO equals DaIH2OH
provides compelling evidence that no significant hydrogen effect exists.
Substitution of appropriate values for the parameters in Eq. (31)
yields the results shown in Table B6. Clearly, within experimental
accuracy D JO = Da J ,H and we conclude as before that the presence
of dissolved hydrogen in the a and a phases had no significant effect
on the observed rates of oxidation-of our standard MiniZWOK specimens.
Table B6. Comparison of Da Calculated from OxidationRate Data Obtained in Steam and Oxygen
Temperature Dal1 a H2 0 Diff.Cb)0C (OF) (cm2/s x 107) (cm2/s x 107) (%)
1253 (2287) 1.99 1.95 2.1
1404 (2559) 8.67 8.86 -2.1
(a)Values calculated from analytical expressions for diffu-sion coefficients derived from standard MiniZWOK data (see Ref. 14).
(b)Difference relative to oxidation in steam.

I Is
194
The arguments presented thus far demonstrate that the differences
observed in oxidation behavior of Zircaloy in oxygen and in steam are
consistent with differences in the oxygen flux into the oxide in the two
media and are inconsistent with the existence of an appreciable hydrogen
effect in the a or 0 phases. One final test of the experimental results
can be cited in support of this conclusion. We again suggest an oxida-
tion model (that will be shown to be incorrect) that is not inconsistent
with the interface velocity equations [Eqs. (B10) and (B14)], and we
require the following assumptions:
*,a 0H20,H Jsa'02 (B32)
ia,01H 20,H Ja,0 102 (B33)and
J10,a H20,H < ,a'° 2 . (B34)
This model cannot be correct, however, because, as we shall now demon-
strate, the conditions contained in Eqs. (B32)-(B34) require a departure
from parabolic growth kinetics for both oxide and alpha layer growth.
Consider the implications of Eq. (B32)-(B34). Not only is the flux
into the oxide different in steam compared to oxygen [Eq. (B32)], but
the hydrogen dissolved in the alpha and beta regions is also assumed to
reduce the oxygen flux into these phases. We suppose now that the
Zircaloy is oxidized in steam under conditions where no hydrogen dissolves
in the metallic phases of the specimen, and we contrast the resulting
oxidation behavior to that exhibited when 'hydrogen effects" are present
in both the a and 0. Since steam is the oxidizing medium in both cases,
we expect no differences in interfacial equilibrium oxygen concentrations
or mobilities in the oxide. By contrast, the postulate that hydrogen
dissolved in the specimen reduces the flux of oxygen in the a and 0
phases means that the "hydrogen effect", by reducing J ,,s actually
increases the velocity of the oxide-alpha interface relative to its
velocity in steam in the absence of dissolved hydrogen; that is
V',a H20,H > ,I H20 (B35)
K7f

195
where the notation "111H0" refers to steam oxidation in the absence of
dissolved hydrogen. In other words, if Eqs. (B32)-(B34) are valid, the
rate of oxide growth in steam in the absence of dissolved hydrogen is
less than that in the case where hydrogen is present. The resulting
oxidation rate curves are shown schematically in Fig. B5.
As already noted, hydrogen analyses of oxidized MiniZWOK specimens
exhibited considerable variability, but there was a general tend for
hydrogen content to increase with oxidation time. The analytical data
are not good enough to establish a functional relationship between
hydrogen content and time, but in n6 case is there any evidence that the
specimens become saturated with hydrogen (cf., Table Bl). Therefore, it
follows from the model that the rate of oxide growth for a specimen
oxidized for a short time should be less influenced by hydrogen than
would be the case for a relatively long oxidation time. The resulting
rate curve would then be expected to have the form defined by the points
A, B, and C in Fig. B5; short-time specimens should yield oxide thicknesses
close to those predicted by Curve 1 (e.g., point A). On the other hand
C
CURVE 2 C
CUIRVE1I
TIMEFig. B5. Schematic Representation of Hypothetical Oxide Growth Rates
for Zircaloy Without Dissolved Hydrogen (Curve 1) and with Dissolved Hydro-gen (Curve 2). The dashed line shows the expected rate curve assuming a"hydrogen effect" and given the condition that the hydrogen contentincreases with time.

Ila
196
a long-time specimen should produce a datum such as point C near Curve 2.
The net result would be an oxidation rate curve that is concave upward.
Inspection of the oxidation rate curves (see Figs. 19-24, pp. 63-;6
in the main body of the report) show no such trend. We estimate that a
"hydrogen effect" that led to a maximum increase in oxide thickness of
10% for long time samples would produce a very obvious upward curvature
in the rate curve and that a 5% effect should be detectable. Clearly,
the postulated "hydrogen effects" either do not exist or are, at worst,
small.
Another way of stating the above argument is to note that a "hydrogen
effect" that increases with time would perturb the kinetics of oxidation,
causing a departure from the Parabolic Rate Law. Thus the discussion
above relative to the growth rate of the oxide is also applicable to the
growth of the alpha layer. As in the case of oxide, inspection of the
alpha-layer rate curves shows that they are well represented by a
parabolic oxidation model and exhibit no indication of a hydrogen effect.
CONCLUSIONS
The dissolved hydrogen detected in MiniZWOK specimens was shown to
be an artifact of the experimental procedure used. A variety of tests
were performed to determine whether this dissolved hydrogen influenced
the measured rates of oxidation. These tests included
1. The internal consistency of the data;
2. Comparisons with other data sets (our own and those of other
investigators);
3. Oxidation rate measurements in pure oxygen.
In no case was any evidence of a "hydrogen effect" found, and we conclude
that within the limits of experimental uncertainty our measured values
of oxide and alpha layer growth rates were unaffected by the presence
of hydrogen in the metallic phases of the specimens.
K-f

197
REFERENCES
1. R. R. Biederman, R. G. Baliinger, and W. G. Dobson, A Study ofZircaZoy-Steam Oxidation Kinetics, Research Project No. 249-1,Electric Power Research Institute, Palo Alto, California, FinalReport, September 1976.
2. S. Kawasaki, T. Furuta, and K. Homma, Progress of the LWR ReactorSafety Research in JAERI, Reactor Safety Research Center, JapanAtomic Energy Research Institute, September 1976.
3. E. A. Gulbransen and K. F. Andrew, J. EZectrochem. Soc. 101: 348(1954).
4. B. Cox, "Oxidation of Zirconium and Its Alloys," Advances in CorrosionScience and Technology, Vol. 5, M. G. Fontana and R. E. Staehle, Eds.,Plenum Press, 1976, pp. 173-391.
5. K. Hauffe and V. Martinez, "Oxidation and Corrosion of Tin-CoatedZircaloy-4," J. Electrochem. Soc. 123: 595-602 (1976).
6. S. Kawasaki, T. Furuta, and H. Hashimoto, Reaction of ZircazoyCladding with Steam Under Simulated Loss-of-CooZant-AccidentConditions, JAERI-M-6181 (July 1975).
i 7. S. Leistikow, H. v. Berg, and D. Jennert, "Comparative Studies ofZircaloy-4/High Temperature Steam Oxidation Under Isothermal andTemperature Transient Conditions," in Proceedings, CSNT SpecialistMeeting on the Behavior of Water Reactor Fuel EZements under AccidentConditions, Spatind, Nord-Torpa, Norway, September 13-16, 1976, inpress.
8. R. F. Mattas and H. K. Brinbaum, "Isotopic Effects on the Motion ofO-H Clusters in Nb," Acta Met. 23: 973-77 (1975).
9. C. Baker and H. K. Birnbaum, "Anelastic Studies of Hydrogen Diffusionin Niobium," Acta Met. 21: 865-72 (1973).
10. C. Roy, "An Experiment to Clarify the Effect of Dissolved Oxygen onthe Terminal Solubility-of Hydrogen in Zirconium," J. NucZ. Mater.13: 275-7 (1964).
11. P. Kofstad, Nonstoichiometry, Diffusion and Electrical Conductivity*in Binary Metal Oxides, Wiley-Interscience, New York, N.Y., 1972,pp. 152-165.
12. L. A. McClaine and C. P. Coppel, "Electrical Conductivity Studies ofTetragonal Zirconia," J. EZectrochem. Soc. 113: 80-85 (1966).
''

198
13. G. J. Yurek, J. V. Cathcart, and R. E. Pawel, "Microstructures ofthe Scales Formed on Zircaloy-4 in Steam at Elevated Temperatures,"Oxidation of Metals 10: 255-76 (1976).
14. R. E. Pawel, Zirconiwn MetaZ-Water Oxidation Kinetics III. OxygenDiffusion in Oxide and Alpha ZircaZoy Phases, ORNL/NUREG-5(October 1976).
K-'
/ d1

199
ORNL/NUREG-17Dist. Category NRC-3
INTERNAL DISTRIBUTION
1.2.3.4.5.
6-31.32.33.34.35.36.37.38.39.40.41.
42-44.45.46.47.48.
C. K. BayneM. BenderJ. R. BuchananJ. J. CampbellK. R. CarrJ. V. CathcartR. H. ChapmanW. B. CottrellF. L. CullerD. G. DavisR. E. DruschelG. G. FeeD. E. FergusonJ. H. FreelsJ. A. HawkR. A. HedrickM. R. HillD. 0. HobsonG. HoffmanS. H. JuryT. G. Kollie
49.50.51.52.53.54.55.56.57.58.59.60.61.62.63.64.65.
66-67.68.
69-73.74.
B. C. LeslieT. S. LundyF. C. MaienscheinD. L. McElroyC. .J. McHargueR. A. McKeeC. S. MeadorsF. H. NeillR. E. PawelR. A. PerkinsH. PostmaE. T. RoseR. L. ShippD. B. TraugerJ. R. WeirR. K. WilliamsPatent OfficeCentral Research LibraryDocument Reference SectionLaboratory Records DepartmentLaboratory Records, RC
EXTERNAL DISTRIBUTION
75-79. Director, Division of Reactor Safety Research, NuclearRegulatory Commission, Washington, DC 20545
80. Director, Reactor Division, ERDA, ORO81. Director, Research and Technical Support Division, ERDA, ORO
82-84. R. F. Fraley, ACRS85. M. Levenson, Electric Power Research Institute, 3412 Hillview
Avenue, P.O. Box 10412, Palo Alto, CA 9430586-87. W. Loewenstein, Electric Power Research Institute, 3412 Hillview
Avenue, P.O. Box 10412, Palo Alto, CA 9430588. H. Seipel, Der Bundesminister fur Forschung and Technologie,
53 Bonn 12, Postfach 120370, Federal Republic of Germany89-408. Given distribution as shown in NRC category 3 (25 copies - NTIS)
* US.GOVERNMENT PRINTING OFFICE: 1977.748-189/174