zika virus real-time rt-pcr · pdf filethe viracor eurofins’s zika virus real-time...
TRANSCRIPT

February 28, 2017 Page 1 of 49
Zika Virus Real-time RT-PCR
Viracor Eurofins
For use under an Emergency Use
Authorization only
Instructions for Use

February 28, 2017 Page 2 of 49
Table of Contents
Introduction .................................................................................................................................................. 3
Specimens .................................................................................................................................................... 5
Equipment and Consumables ...................................................................................................................... 6
Quality Control ............................................................................................................................................ 7
Nucleic Acid Extraction ................................................................................................................................ 8
Real-time RT-PCR Test ................................................................................................................................. 9
Interpreting Test Results ........................................................................................................................... 19
Test Limitations ......................................................................................................................................... 20
Performance Characteristics ..................................................................................................................... 22
References ................................................................................................................................................. 47

February 28, 2017 Page 3 of 49
Introduction This document describes the use of Viracor Eurofins’ Zika Virus Real-time RT-PCR test for the in-vitro qualitative detection of RNA from Zika Virus in human serum, plasma, or urine (collected alongside a patient matched serum or plasma specimen). Intended Use The Viracor Eurofins’s Zika Virus Real-time RT-PCR test is a real-time RT-PCR test intended for the qualitative detection of RNA from the Zika virus in serum, plasma, or urine (collected alongside a patient-matched serum or plasma specimen) from individuals meeting Centers for Disease Control and Prevention (CDC) Zika virus clinical criteria (e.g., clinical signs and symptoms associated with Zika virus infection) and/or CDC Zika virus epidemiological criteria (e.g., history of residence in or travel to a geographic region with active Zika transmission at the time of travel, or other epidemiologic criteria for which Zika virus testing may be indicated). Testing is limited to Viracor Eurofins’s laboratory in Lee’s Summit, MO, or other laboratories designated by Viracor Eurofins that are also certified under the Clinical Laboratory Improvement Amendments of 1988 (CLIA), 42 U.S.C. §263a, to perform high complexity tests. Test results are for the identification of Zika viral RNA. Zika virus RNA is generally detectable in serum during the acute phase of infection (approximately 7 days following onset of symptoms, if present). Positive results are indicative of current Zika virus infection. Viracor Eurofins is required to report all positive results to the appropriate public health authorities. Negative results do not preclude Zika virus infection and should not be used as the sole basis for patient management decisions. Negative results must be combined with clinical observations, patient history, and epidemiological information. The Zika Virus Real-time RT-PCR test is intended for use by trained clinical laboratory personnel qualified by state and federal regulations who have received specific training on the use of the Zika Virus Real-time RT-PCR test. The test is only for use under the Food and Drug Administration’s Emergency Use Authorization. Protocol Use Limitations Viracor Eurofins’ Zika Virus Real-time RT-PCR test has not been extensively tested with clinical specimens. Modifications of this test (i.e., use of PCR instruments or chemistries other than those described) are not permitted.

February 28, 2017 Page 4 of 49
Test Principle Viracor Eurofins’ Zika Virus Real-time RT-PCR test is a real-time reverse transcription polymerase chain reaction (RT -PCR) test. The Zika virus primer and probe set is designed to detect RNA from the Zika virus in plasma, serum or urine (collected alongside a patient matched serum or plasma specimen) from patients presenting signs and symptoms of the Zika virus infection in conjunction with epidemiological risk factors. Following patient specimen collection and receipt by the laboratory, nucleic acids are isolated and purified from serum, plasma, or urine (collected alongside a patient-matched serum or plasma specimen) using the bioMerieux NucliSENS easyMag extraction platform using a protocol for total nucleic acid extraction. The purified nucleic acid is reverse transcribed and amplified using Life Technologies TaqPath™ 1-step RT-qPCR master mix reagent with thermocycling and detection in an ABI 7500 real-time PCR instrument. In the process, the probe anneals to a specific target sequence located between the forward and reverse primers. During the extension phase of the PCR cycle, the 5’ nuclease activity of Taq polymerase degrades the probe, causing the reporter dye to separate from the quencher dye, generating a fluorescent signal. With each cycle, additional reporter dye molecules are cleaved from their respective probes, increasing the fluorescence intensity. Fluorescence intensity is monitored at each PCR cycle by the ABI 7500 real-time PCR instrument. The following controls will be used with the Zika Virus Real-time RT-PCR test:
1. A “no template” (negative) control (NTC) is included in each RT-PCR run to ensure that all amplification reagents are free of target RNA or amplicon and is used to demonstrate that detection of target Zika genomic RNA is not due to false positive results.
2. Two Zika virus positive amplification curve controls (S2 and S4) are included in each RT-PCR run
to ensure that the target Zika genomic RNA can be detected by the RT-PCR test and are used to demonstrate that the anticipated level of sensitivity has been achieved.
3. A Zika virus negative extraction control (NEC), which is a known-negative sample, is included in
each run to ensure that all extraction and amplification reagents are free of target RNA or amplicon and is used to demonstrate that detection of target Zika genomic RNA is not due to false positive results.
4. A Zika virus positive extraction control (PEC), which is a known-negative sample spiked with live
Zika whole virus (Zeptometrix #0810092CF), is included in each extraction and RT-PCR run to ensure that extraction and amplification procedure was carried out accurately. The PEC demonstrates that detection of target Zika genomic RNA achieved expected results and the test performance is within the performance specifications.

February 28, 2017 Page 5 of 49
5. An internal control (IC), bacteriophage MS2, is added to each sample prior to extraction. Detection of the MS2 RNA in the final extracted nucleic acid demonstrates that lysis and extraction steps were correctly performed for each sample. A lack of fluorescence signal, or a delay in the occurrence of a detectable fluorescence signal, for the internal control indicates that either nucleic acid extraction was not effective or that PCR inhibitors are present.
Specimens Acceptable Specimens
• Serum, Plasma and Urine (collected alongside a patient matched serum or plasma specimen) Specimen Handling and Storage
• For serum, collect 4-5 mL whole blood in a red top tube, centrifuge and transfer 2 mL serum to sterile, screw top tube (minimum volume 1 mL). Specimens can be shipped at ambient or refrigerated temperature Monday through Friday. Specimens shipped at ambient temperature must be received within 96 hrs of collection.
• For plasma, collect 4-5 mL whole blood in an EDTA or ACD tube, centrifuge and transfer 2 mL plasma to sterile, screw top tube (minimum volume 1 mL). Specimens can be shipped at ambient or refrigerated temperature Monday through Friday. Specimens shipped at ambient temperature must be received within 96 hrs of collection.
• For urine, 2 mL sample collected in a sterile urinalysis container then transferred to sterile, screw top tube for shipment (minimum volume 1 mL). Specimens can be shipped at ambient or refrigerated temperature Monday through Friday. Specimens shipped at ambient temperature must be received within 96 hrs of collection.
• Please refer to http://www.viracor-eurofins.com/zika for additional specimen collection and handling requirements.
Safety Precautions Strict universal safety precautions must be taken and good laboratory practice is compulsory for all activities that require handling of clinical specimens that may be biohazardous and infectious.
• The Zika virus positive extraction control (PEC) contains live Zika virus, and all specimens should be treated as potentially infectious. All controls, samples and equipment coming into contact with these specimens should be considered potentially infectious and decontaminated or disposed of with proper biohazard precautions. CDC and the National Institutes of Health recommend that potentially infectious agents be handled at the Biosafety Level 2. The Biosafety in Microbiological and Biomedical Laboratories states that Zika virus is considered a BSL-2 pathogen.
• Lab coat and gloves must be worn by all personnel while handling clinical specimens. • Generation of aerosols, splashes, and spills of potentially infectious material should be avoided.
February 28, 2017 Page 6 of 49
• All laboratory glassware, equipment, disposable materials and wastes suspected or known to be biohazardous must be decontaminated, preferably in an autoclave.
• Sample preparation must be performed in biological safety cabinet. • Work surface should be decontaminated using a fresh 10% aqueous solution of bleach at the
end of each use. • Specially cleaned equipment, racks, etc. are designated specifically for nucleic acid extraction,
reagent preparation or PCR use. Such materials are not to be removed from their respective locations.
• Real-time PCR reactions are performed in sealed 96-well plates. Real-time PCR reactions are to be disposed immediately after amplification.
Equipment and Consumables MATERIALS PROVIDED BY VIRACOR EUROFINS
• Zika Virus Real-time RT-PCR test
o Oligonucleotide primers - Biosearch Technologies, 81 Digital Drive, Novato, CA 94949-5728
o Dual-labeled hydrolysis probes (TaqMan) FAM-BHQ-1 labeled and Quasar670-BHQ-2 labeled oligonucleotide probes:
Biosearch Technologies, 81 Digital Drive, Novato, CA 94949-5728 o Bacteriophage MS2 - American Type Culture Collection (ATCC), 10801 University
Boulevard, Manassas, VA 20108 o Zika virus stock - 0810092CF with a concentrated titer of 1.15x10⁷ TCID50/mL,
Zeptometrix, 878 Main Street, Buffalo, NY 14202 o pIDTBlue modified plasmid with inserted nucleotide regions from the Zika strain
KU497555 (Brazil, 2015) - Reference ID 143425698 ZIKV_519-723_918-1049_1168-1330, Integrated DNA Technologies, Inc. 1710 Commercial Park Coralville, Iowa 52241
MATERIALS REQUIRED BUT NOT PROVIDED
• Biomerieux easyMAG reagents, (lysis buffer, cat. # 280134; buffer 1, cat. # 280130; buffer 2, cat. # 280131; buffer 3, cat. # 280132; magnetic silica, cat. # 280133):
Note: There is a product recall for certain lots of easyMAG extraction reagents. Though no shifts in performance associated with use of these reagents were observed when using them in combination with Viracor Eurofins’ Zika Virus Real-time RT-PCR, each lot of affected easyMAG extraction reagents should be evaluated at least weekly before use in extraction of diagnostic specimens. Laboratories should also closely monitor for any trend in Ct values of the internal MS2 control, the Zika virus positive extraction control and the Zika virus positive amplification curve controls during testing. Laboratories should refer to bioMérieux Product Safety Correction Notices for a list of impacted lots and advice for end users.

February 28, 2017 Page 7 of 49
• easyMAG Magnetic Silica (bioMérieux catalog #280133) • easyMAG Buffer 1 (bioMérieux catalog #280130) • easyMAG Buffer 2 (bioMérieux catalog #280131) • easyMAG Buffer 3 (bioMérieux catalog #280132) • easyMAG Lysis Buffer (bioMérieux catalog #280134)
• TaqPath™ 1-step RT-qPCR master mix, CG; (Life Technologies, catalog # A15299 or A15300) • Zika virus negative serum, plasma, urine Zika virus positive control, Zika virus stock – 0810092CF,
Zeptometrix, diluted to working concentration of ~4,000 copies/mL • Zika virus positive amplification curve controls (S2 and S4) • RNase-, DNase-free water, Fisher Scientific, cat # BP561-1
EQUIPMENT
• Biomerieux easyMAG instrument with disposables • ABI 7500 standard Instrument with disposables • Freezer (manual defrost) at -10 to -30°C (for kit component frozen storage) • Freezer (manual defrost) at -10 to -30°C (for specimen frozen storage) • Refrigerator at 2 to 8°C • Class II Biosafety cabinet (BSC) for specimen handling prior to extraction • Bench top centrifuge for low speed centrifugation of 96-well plates or other reaction vessels • Microcentrifuge • Vortex mixer
CONSUMABLES
• RNase/DNase-free 5 mL tubes • RNase/DNase-free 1.5 mL polypropylene microcentrifuge tubes and racks • RNase/DNase-free 96 well thermocycler plate rack or appropriate tube rack • 96-well optical reaction plate or other reaction vessels • Optical adhesive cover (for use with 96-well optical reaction plate) • Appropriate personal protective equipment (PPE) including disposable, powder-free gloves • Cooler racks for 1.5 mL microcentrifuge tubes and 96-well 0.2 mL PCR reaction tubes or plates • Single or multi-channel micropipette(s) with an accuracy range between 1-10 μL, 10-100 μL and
100-1000 μL. NOTE: A separate set of micropipettes is required for extraction, sample addition and amplification areas.
• Pipette tips with aerosol barrier: 10 μL, 200 μL, and 1000 μL sizes Quality Control Real-Time RT-PCR is a sensitive method and should be conducted following strict quality control and quality assurance procedures. Following these guidelines will help minimize the chance of false-

February 28, 2017 Page 8 of 49
negative and false-positive results TEST CONTROLS
• Zika Virus Positive Extraction Control: A Zika virus positive extraction control (PEC), which is a known-negative sample spiked with live Zika whole virus, is included in each extraction and RT-PCR run to ensure that extraction and amplification procedure was carried out accurately. The PEC demonstrates that detection of target Zika genomic RNA achieved expected results and the test performance is within the performance specifications. The PEC should have CT values > 29 but < 32.
• Zika Virus Positive Amplification Curve Controls (low and high concentrations): Two Zika virus positive amplification curve controls (S2 and S4) are included in each RT-PCR run to ensure that the target Zika genomic RNA can be detected by the RT-PCR tests and are used to demonstrate that the anticipated level of sensitivity has been achieved. The low concentration positive amplification curve control (S2) should have CT values > 28 but < 30. The high concentration positive amplification curve control (S4) should have CT values > 21 but < 23.
• Zika Virus Negative Extraction Control: A Zika virus negative extraction control (NEC), which is a known-negative sample, is included in each run to ensure that all extraction and amplification reagents are free of target RNA or amplicon and is used to demonstrate that detection of target Zika genomic RNA is not due to false positive results. The NEC should have no detectable signal after 45 cycles of amplification in each reaction mix.
• No Template Control: A “no template” (negative) control (NTC) is included in each RT-PCR run to ensure that all amplification reagents are free of target RNA or amplicon and is used to demonstrate that detection of target Zika genomic RNA is not due to false positive results. The NTC should have no detectable signal after 45 cycles of amplification in each reaction mix.
• Internal Control: An internal control (IC), bacteriophage MS2, is added to each sample prior to extraction. Detection of the MS2 RNA in the final extracted nucleic acid demonstrates that lysis and extraction steps were correctly performed for each sample. A lack of a fluorescence signal, or a delay in the occurrence of a detectable fluorescence signal, for the internal control indicates that either nucleic acid extraction was not effective or that PCR inhibitors are present. The expected CT value for MS2 is ≤ 35. In samples with no Zika target detected, a CT value less than or equal to this value for MS2 RNA demonstrates that effective nucleic acid extraction has been achieved and the absence of RT-PCR inhibition.
Nucleic Acid Extraction Notes on Extraction
• Only acceptable specimens extracted using the prescribed extraction method may be run with this test.
• One extraction positive and one extraction negative control will be included in each run. • Internal control RNA is added to the sample after lysis buffer addition and is co-purified and co-

February 28, 2017 Page 9 of 49
detected in each specimen and control. • Retain specimen RNA extracts in cold block or on ice until testing.
Automated Extraction
• bioMerieux NucliSENS easyMAG extraction • Clinical specimens are extracted using the protocol for total nucleic acid extraction. Follow the
manufacturer’s instructions using reagents specified by cat # 2801403 (lysis buffer, cat. # 280134; buffer 1, cat. # 280130; buffer 2, cat. # 280131; buffer 3, cat. # 280132; magnetic silica, cat. # 280133).
• Extraction uses the following volumes: o Specimen input volume: 500 µL o Elution volume: 100 µL
Storage of Nucleic Acid Specimens Store the extracted RNA for up to 15 minutes refrigerated prior to use. Extracted RNA should be frozen at -60°C or colder if longer storage is required before use and may be stored at least 2 weeks at -60°C or colder.
Real Time RT-PCR Test Quality Control
• Internal Amplification Control
o To ensure the absence of non-specific PCR inhibition of a sample, an internal control (IC) RNA is added to the easyMAG Lysis Buffer prior to nucleic acid extraction. A sample can be interpreted as negative only if the IC CT. value is within the acceptable range but no signal from target reporter dye has been detected. The acceptable range for each new lot/preparation of the internal control will be set at ±3 CT from the mean (29) of the internal control CT values obtained from 20 replicates (data generated from negative and positive controls over multiple runs). The acceptance ranges will be generated for each lot of Internal Control.
• Controls Use Frequency
o A Zika virus positive extraction control (PEC), which is a known-negative sample spiked
with live Zika whole virus, is included in each extraction and RT-PCR run to ensure that extraction and amplification procedure was carried out accurately.
• Controls Tolerance Limits
o Negative Controls (NEC and NTC) should be listed as “Not detected” for the RT-PCR reaction. If the Negative Control is positive (CT value < 45), then this control is invalid.
February 28, 2017 Page 10 of 49
This indicates possible contamination of prepared samples. Positive patient results cannot be reported. Positive specimens on this run must be repeated. Negative specimens may be reported given that all other test run criteria are met.
o If the Zika Virus Positive Controls (PEC, S2, and S4) CT values are within the acceptable range, the Positive Control is considered valid and acceptable. If the Zika Virus Positive Control CT values are above or below the acceptable range for one or both mixes, the Positive Control is considered invalid and unacceptable. All patient specimens must be re-tested.
• Review Patient Data
o Review patient results for unusual patterns, trends or distributions in patient results,
such as an unusually high percentage of abnormal results, or unusually high percentage of Not Detected, or positive results.
Procedure For all procedures involving specimens, buttoned lab coats, gloves, and face protection are required minimum personal protective equipment. Nucleic Acid extraction (to be performed in the Extraction Room) Startup easyMAG Startup
1. Verify each reagent loaded on the easyMAG is within expiration date. 2. Login to the instrument software. 3. Document daily startup on maintenance log.
Reagent Preparation Lysis Buffer Preparation for Off-Board Extraction
For RNA PCR tests:
1. Add 2 mL lysis buffer to each sample vessel well. Add 5 µL of the working stock of MS2 dilution 4 (1:10,000 dilution) per 2 mL lysis buffer.
2. Alternatively, for RNA PCR tests, add 2 mL of lysis buffer containing the appropriate internal control to an easyMAG cartridge (as shown in example below).
3. Visually verify every cartridge well has the correct volume of Lysis buffer.
Preparation of Silica Bead Mix
Each EMP (Biohit Electronic Multipipettor) program is set to prepare and dispense silica for eight specimens. Repeat steps as needed for each sample strip of eight.

February 28, 2017 Page 11 of 49
EMP Program 1 is set to aspirate and dispense 550 µL of buffer (molecular grade water) and silica solution. For this program, load EMP with one tip.
1. Place the tip in molecular grade water and hit start button once to aspirate 550 µL. 2. Place tip in 2 mL aliquot tube and hit start button once to dispense 550 µL of molecular
grade water. Discard tip by hitting eject button twice. 3. Vortex silica tube. Load EMP with new tip and place in silica tube. Hit start button once to
aspirate 550 µL of silica solution. 4. Place tip in 2 mL tube from step 2 above and hit start button once to dispense 550 µL of
silica solution. 5. Discard tip by hitting eject button twice.
EMP Program 2 is set to transfer 8 volumes of silica mix to 8-well ELISA strip. For this program, load the EMP with one tip.
1. Place the tip in the silica mix prepared above in Preparation of Silica Bead Mix. Hit start button once to aspirate 1050 µL of the mix.
2. Leave the tip in the tube and hit start once to dispense 25 µL back into the reservoir to reset the pipette.
3. Place the tip sequentially into the wells of the ELISA strip and hit start button once for every 125 µL dispense step.
4. Place the tip back in the container holding the silica mix and hit start button once to discard the remaining 25 µL solution.
5. Discard tip by hitting eject button twice.
easyMAG Extraction Procedure All extraction runs require a Positive extraction control (PEC) and Negative extraction control (NEC).
1. Refer to easyMAG Extraction Chart below for appropriate controls, volumes, and protocols for each type of sample/test.
2. Determine number of extraction wells required per sample and extraction run according to the chart below:
Tests per Sample or per extraction run easyMAG extraction wells for sample and controls ≤ 6 tests 1 well (single extract)
7 - 12 tests 2 wells (double extract) ≥ 13 tests 3 wells (triple extract)
3. Vortex capped sample aliquot. 4. Pipette appropriate volume of sample into cartridge. Visually verify correct volumes in
cartridges. 5. Record lot numbers, Lysis time and CLS performing extraction, loading of instrument and
elution transfer on the easyMAG run map.

February 28, 2017 Page 12 of 49
easyMAG EXTRACTION CHART
*500 µL for full volume extraction. Notate any low sample volume samples on map. ** Zika virus extraction requires the use of plasma NEC for both plasma and urine extractions. Additional instructions for specific specimen types or tests Urine samples:
Urine specimens must be segregated and extracted on a separate easyMAG run from other specimen types due to the high viremia that may be present and the potential for contamination.
Positive Identification checks for manual pipetting of samples into easyMAG Cartridges
Maintain positive identification when pouring off specimens into aliquot tubes and when pipetting samples into cartridges according to identifiers shown on the easyMAG run map.
a. Ensure the master tube and aliquot tubes match by patient name, date of collection, time of collection.
b. Do not combine multiple samples into the same aliquot tube unless the sample type, patient name, date of collection, and time of collection all match.
c. Refer to posted Clinical Processing Guide, Pre-processing Procedures for ID tests and Pre-processing Temperature Requirements for ID and AI and Hemolysis chart when determining acceptability of samples and handling and testing requirements for different sample types.
Programming easyMAG for Off Board Lysis
1. Insert the sample strips and aspirator disposables into the instrument in the order indicated on the easyMAG Run Map, ensuring tips are seated properly.
2. In easyMAG Software, check to ensure adequate volume is in each reagent.
3. Document easyMAG instrument number and the next sequential run number on the map.
On the touch screen, touch the Settings icon, software defaults to Application Settings. The screen will prompt for entries in the following parameters; Default Request, Run Name Prefix, Sample ID Prefix, Sample Type, and Sample Addition Guidance. Options
Enter the following:
Default Protocol: Chose appropriate extraction protocol per easyMAG extraction Chart
NEC POS CTRL
(as applicable)
Internal Control (volume/well)
Control and
Sample volume
Easy-MAG protocol
Onboard or Offboard
(2mL lysis/well +
internal control)
Elution volume
Zika virus** Plasma NEC** ZIKA PEC
MS2(1:10,000 dilution of stock)
(5 µL) 500 µL*
Plasma CSF Other
or Urine
Onboard or Offboard 100 µL

February 28, 2017 Page 13 of 49
On the touch screen, touch the Settings icon, software defaults to Application Settings. The screen will prompt for entries in the following parameters; Default Request, Run Name Prefix, Sample ID Prefix, Sample Type, and Sample Addition Guidance. Options
Enter the following:
Run Name Prefix Type: Literal
Run Name Prefix : Date E<instrument number>-<run number>. 021214 E9-1 021214 EOF9-1
Sample ID Prefix: Leave blank Sample Type: Lysed selected Workflow Defaults: On Board silica incubation
selected Reagent Tracking: none selected Starting the easyMAG extraction run
1. Hold the Load easyMAG sample strip by the indent and slide the edges of the strip into the sample strip carriage arms, beneath the tabs in either arm as shown above. Slide the strip back until the lock tab at the back clicks into the slot. Ensure the lock tabs are aligned correctly.
2. Load the Aspirator disposables and ensure they are clipped into the instrument in order for the instrument to aspirate fluid from the sample strips. There must be an aspirator disposable in the corresponding position for each sample easyMAG sample strip.
3. Verify samples entered in the software screen are in the same order as easyMAG run map. 4. For specimens with input volumes less than the default input volume, select accession number
in easyMAG and enter the adjusted input volume. 5. For specimens that require comments, select accession number and enter the appropriate
comment using the Add Remark icon in Define Extraction Request menu in the easyMAG software. Once entered, verify the comment was added by viewing the window below for each example.

February 28, 2017 Page 14 of 49
6. Comments must be entered exactly as written below or the comments will not appear on the ABI map. Do not add additional spaces before or after the comments indicated as doing so may cause the easyMAG run to fail.
Comments Indicates
HEMO Hemolysis
BLDY Bloody
SUPV Supervisor
RXT Re-extract
PALS Patient Advocates for Laboratory Services
Free text Comment by coordinator/supervisor
7. To assign specimens to a run touch Organize Run icon. Touch Create Run icon and name the run
in the following format: <Date> <Instrument number>-<run number>. a. Ex. 010112 E1-2
8. Move accession numbers from Unassign to Layout. 9. Touch Load Run icon. Select desired run. Print worklist by touching Print Worklist icon. Verify
that protocol, accession numbers, and order of samples match run map. Verify that low volumes have been entered. Correct any errors before scanning cartridges.
10. Scan cartridge locations (i.e. A, B, C), then scan the cartridge barcode for each location; verify barcodes scanned correctly.
11. Verify Lysis incubation is >10 minutes per time noted on the extraction map. 12. Obtain silica mix contained in 8-well ELISA strip plate. EMP Program 3 on Biohit electronic
multipipettor is set to transfer and mix 8 volumes of silica mix to 8 wells of the easyMAG sample strip.
13. Verify that 10 minutes of Lysis incubation has completed, then perform the following steps: a. Load the EMP with 1-8 tips, depending on the number of sample vessel wells in use.

February 28, 2017 Page 15 of 49
b. Place the tips in the ELISA wells containing the silica mix and hit start button once more to mix and aspirate 100 µL of the silica mixture.
c. Place the tips in the wells of the sample vessel strip and hit start button once to aspirate an additional 800 µL out of the sample vessel and perform 3 mix cycles.
d. Place pipette above biohazard waste container and press eject button twice to discard tips.
14. Start Run. Complete run map documentation. 15. As appropriate make copy of extraction map for mapmaker or for lab assistant to create labeled
nucleic acid microcentrifuge tubes. 16. Enter adjusted volumes and disclaimer comments in LIMS Software. Refer to Correction Factors
for Specimen Input and Elution Volume Changes for acceptable input volumes. Elution Transfer Positive Identification prior to Removing Final Product
1. Ensure elution is transferred within 30 minutes of run completion so the bead pellet does not drop into elution volume.
2. Magnets may be used to pull the beads out of the elution volume. 3. Verify elution volumes are as expected and beads are uniform for each well of cartridges. If
elution volumes and/or bead size are not as expected, inform a coordinator or supervisor. 4. Print easyMAG map and select “yes” to assess run. 5. Review and verify the content on the extraction map, load map and the easyMAG run report :
a. The physical instrument number. b. Run number on the map. c. Accession numbers scanned correctly into the software. d. Correct input volumes are printed. e. Correct comments are printed. f. Protocol setting is correct. g. Cartridge barcodes scanned correctly into the software, and match the order loaded on
easyMAG. Setting Up Real-time RT-PCR Reactions
1. Create ABI Plate Map a. Obtain a printed copy of a Run-Result Map and write the accession numbers of patient
samples and controls to be tested on the run b. Include a minimum of one well for a NEC, NTC, and positive control for each run.
Include a minimum of one well each for positive amplification curve controls (S2 and S4). On the plate map, record the run-map number and date. Add accession numbers of patient samples tested.
c. Patient samples are to be run in single well. d. Include any extraction or elution volume differences requiring additional calculation on
the run map.
2. Prepare Master Mix for ABI PCR plate - Master Mix room

February 28, 2017 Page 16 of 49
a. Prepare master mix only in designated laboratory space (master mix room) with designated pipettes and disposables. Do not bring in disposables or pipettes into the master mix room from other areas of the lab.
b. Complete appropriate master mix form. Record the number of wells for each test requiring master mix. Calculate the amount of master mix and primers/probe preparation required for each test by multiplying the number of wells by the volume of master mix reagents and primers/probe (P/P) per well.
c. Record the run date and lot numbers and expiration dates for primer/probe mix and master mix on master mix Reagent Log. If a new lot of reagent is placed in use, record the map run numbers containing new lot of reagent at the end of the Master Mix Reagent Log form.
d. Label epMotion trough or 2 mL screwtop tube for master mix with the map number and the test name.
e. Prepare master mix for each test according to calculations and add each test’s master mix to appropriate wells as designated on the Run-Result Map. Use master mix volume per well specified on the master mix calculation sheet. Note: TaqPath 1-step RT-qPCR Master Mix is stored at -25°C to -15°C. The master mix will not freeze but gelling may occur. Thirty (30) minutes before assembling the plate, allow master mix to thaw in the refrigerator, protected from light. It is normal for this master mix to have a faint yellow hue. TaqPath 1-step RT-qPCR Master Mix is a 4X formulation and it is more viscous than most master mixes. Pipette slowly and be sure that master mix, primers and probes, and water are thoroughly mixed before transfer into PCR plate.
f. Record master mix completion time and initial for preparation of master mix on the form. Circle the dead air box used during master mix preparation.
g. Obtain appropriate ABI PCR plate per form i. Place ABI Fast PCR plates in cold plate holder (silver 96 well cold plate stored in
refrigerator). Ensure prepared master mix is labeled with the test name and map number.
ii. Place ABI Standard PCR plate in frozen cold block for reaction assembly. Ensure prepared master mix is labeled with the test name and map number. Prepared plate must be loaded with nucleic acid templates immediately following preparation for Superscript and TaqPath reactions.
h. Vortex master mix prior to use. i. Pipette master mix volume per well as specified on the master mix calculation sheet.
Add each test’s master mix to appropriate wells as designated on the Run-Result Map. i. For Post EVO maps with tests greater than 2 columns in the ABI plate map, each
test master mix must be placed in a epMotion reagent reservoir(s) labeled with test and map number. Master mix is then added to the ABI plate by epMotion instrument in the plating room. Circle the epMotion used to deliver master mix.
ii. For Post EVO maps with tests less than or equal to 2 columns in the ABI plate map, each test master mix must be placed in a 2 ml screwtop skirted tube labeled with test and map number. Master mix is then plated into the ABI plate in the plating room DAB. Circle the DAB used to pipette master mix.
Add Nucleic Acid – Plating room

February 28, 2017 Page 17 of 49
IMPORTANT: This step requires a high level of accuracy and precision. Great care must be taken to ensure that the precise amount of template is added to wells designated on the plate map. Potential for cross contamination is significant and care must be taken not to create aerosols during addition of patient nucleic acid or standards. A new pipette tip is required for each transfer of nucleic acid or master mix in the plating room.
Prior to the start and at the end of any of the following pipetting steps, visually verify the proper volume of master mix or nucleic acid is added to the ABI plate according to the run map.
Addition of Nucleic Acid 1. Obtain plate prepared with master mix placed in cold plate holder, Plate Map, Calculation Sheet,
and samples to be analyzed according to the Plate Map. 2. In laminar flow hood or dead air box add patient nucleic acid or controls to the wells indicated
on the Run-Result Map. On the Master Mix Calculation Sheet, circle all dead air boxes used during run preparation.
Add Amplification Curve Controls and Negative Template Control – Amplification Room 1. Place ABI plate into a cold plate holder. 2. Verify all Amplification Curve Controls are in date. Expiration date is 1 year from open date
unless the manufacturer expiration date is earlier. 3. Document Amplification Curve Controls lot numbers, expiration dates, ABI map number on
Standards Log. 4. Vortex standards. 5. Use minicentrifuge for a few seconds to spin droplets to bottom of standards vial. 6. Pipette volume of Amplification Curve Controls to the ABI plate per map (refer to master mix
calculation sheet for appropriate volume of Amplification Curve Controls to use). 7. Pipette volume of Negative Template Control (RNAse and DNAse free water).
Note: RNAse and DNAse free water has an expiration date of 24 hours upon open. 8. Circle the dead air box used to pipette the Amplification Curve Controls, initial STDs plated by on
ABI map. 9. Visually verify all wells have appropriate volume per map. 10. Seal ABI plate with ABI Optical Sealer ensuring all wells are sealed 11. Vortex ABI plate at 2 opposing corners. Do not place wells directly on vortex platform. 12. Centrifuge ABI plate at 3500 rpm for 30 seconds using program 5.
Manually enter map into ABI software, Load plate and Start Run 1. Power on Laptop, ABI instrument, Open ABI software. 2. Click Create New Document. 3. Click Browse. 4. Select Desktop Shortcut to Assay Template. Select the appropriate Assay Template 5. Click Finish.

February 28, 2017 Page 18 of 49
Manual Entry of Maps into ABI software 1. In the Set Up> Plate window use the Well Inspector (View>Well Inspector) to modify settings for
each well to include: ‘Analyte code-accession number’ and appropriate detector(s) for target analyte and UIC or MS2 if multiplexing. See Analyte Targets for appropriate Analyte Codes and detectors. Note: Multiplexed reactions require selection of all applicable detectors for standards as well as test patients.
Load ABI plate 1. Verify ABI Software map matches content of ABI printed map and verify that ABI wells are filled
appropriately according to ABI printed map. 2. Verify plate seal is applied and load ABI plate with well A1 matching the A1 indicator on the
instrument. Load Plate. Close door.
Start ABI run 1. Click Instrument tab on ABI software. 2. Verify map name on ABI computer matches ABI map. 3. Click Start. 4. The ABI run is confirmed to have started appropriately if the countdown of elapsed run time
begins. 5. Document ABI instrument ID, start time and initial on the ABI map. 6. Save the plate document.
Single Well 1. When run is complete, press OK and Disconnect. 2. From Results>Amplification Plot Tab, Analysis Settings, set threshold and baseline. 3. Verify correct analysis settings. 4. Set Line Color: Detector Color. 5. Select Analyze. Initial map to document settings are correct.
Amplification Curve Controls: 1. Verify Amplification Curve Control values are within established ranges listed in Acceptable
Assay Standard Control Values. Document whether the values are within criteria with either “Accept” or “Alert” in STD Accept or Alert section on the ABI Map for each test.
2. Review the Negative Template Control (NTC) for each test. Document the absence of test target signal in each of the NTC wells on the ABI plate map.
3. Document the absence of test target signal in the Negative Extraction Control (NEC) as Not Detected with the CT value.
Patient Wells:

February 28, 2017 Page 19 of 49
1. Review each patient well for valid amplification curves. Visually examine the amplification plot of each patient reaction.
a. Curves cross the threshold at its exponential phase. b. If pathogen target amplifies, verify that the exponential phase is parallel to the
exponential phase of the standard curve for that range. c. For patient wells with no target amplification and an internal control CT value >35:
2. If there is a questionable curve, check Component view. 3. Review each patient well for any background amplification that crosses the threshold, if
Component view confirms background amplification, enter “0” in the Report column and enter “background” under Result Override column. After reviewing each well, select each column and/or the whole plate and review for any background amplification. This additional review is required to ensure all background curves are correctly identified.
4. Notate the well for background on the map, date and initial. 5. Omit any well which contain plating errors or invalid curves. Document the omission on the ABI
plate map, date and initial. Notate the well for plating error on the map, date and initial. 6. After review of each of the wells on the map, review for background amplification again by
selecting each column or the entire map.
Interpreting Test Results REPORTING RESULTS AND REPEAT CRITERIA
• Clinical laboratory personnel qualified by applicable state and/or federal regulations must review all individual test results and quality control data prior to releasing results.
• All test controls must be examined prior to interpretation of patient results. If the controls are not valid, the patient results cannot be interpreted.
• A CT value will be assigned for each amplification reaction occurring in a reaction well. The CT value indicates the cycle at which fluorescence in the well exceeds the set threshold. A CT value can be the result of amplification of the desired target or can be the result of non- specific fluorescence (“NSF”).
• Amplification plots are reviewed for each reaction to verify that curves cross the threshold at the exponential phase. Component data should be examined for samples that do not cross at the exponential phase to ensure that non-specific fluorescence (NSF) is correctly identified. If the amplification plot shows an exponential increase of fluorescence crossing the threshold and the component plot shows an increase in fluorescence of the detector, the target has been amplified. If the amplification plot does not exhibit an exponential increase crossing the threshold or the component plot does not show an increase in fluorescence, amplification of the target has not occurred.
• If a CT value has been assigned to a well but the amplification plot does not exhibit an exponential increase crossing the threshold or the component plot does not show increase in fluorescence, the CT value is the result of non-specific fluorescence the CT value as “NSF” on the worksheet). “NSF” results are considered not to be interpretable and sample analysis must be repeated.

February 28, 2017 Page 20 of 49
• An internal control (IC) is included with every sample. The IC CT value of all negative samples must have a CT value < 35. This criterion must be met in order for the result to be valid. A CT value greater than 35 or non-amplification of the IC indicates possible inhibition of PCR reaction (due to presence of inhibitors co-purified with the nucleic acids).
Examine the Zika Virus Positive and Negative Controls
• If the Negative Control (NTC or NEC) is: o Positive (CT value < 45 and has a valid amplification curve), then this control is invalid.
This indicates possible contamination of prepared samples. Positive patient results cannot be reported. Positive specimens on this run must be repeated. Negative specimens may be reported given that all other test run criteria are met.
o Negative (CT values listed as “Not detected”), then this control is valid and acceptable. • Zika Virus Positive Control (PEC)
o If the Zika Virus Positive Control CT values are above or below the acceptable range, the Positive Control is considered invalid and unacceptable. All patient specimens must be re-tested.
o If the Zika Virus Positive Control CT values are within the acceptable range, the Positive Control is considered valid and acceptable.
• Zika Amplification Curve Positive Controls o If the Zika Amplification Curve Positive Control CT values are above or below the
acceptable range, the controls are considered invalid and unacceptable. All patient specimens must be re-tested.
o If the Zika Amplification Curve Positive Control CT values are within the acceptable range, the controls are considered valid and acceptable.
Examination of Patient Specimen Results
• Zika Virus RNA positive results must be reported to the appropriate Public Health authorities. • Please note, a patient-matched serum specimen is required for serological follow up testing of
negative RT-PCR results, per the CDC testing algorithm (found at http://www.cdc.gov/zika/index.html).
• Examination of clinical specimen results should be performed after the Negative and Positive Controls have been examined and determined to be valid and acceptable. Zika virus results must be examined for each patient specimen.
• If the Zika virus results of a patient specimen are listed as “Not detected” and the IC CT values for the specimen are < 35, the result is reported as “Not Detected.”
February 28, 2017 Page 21 of 49
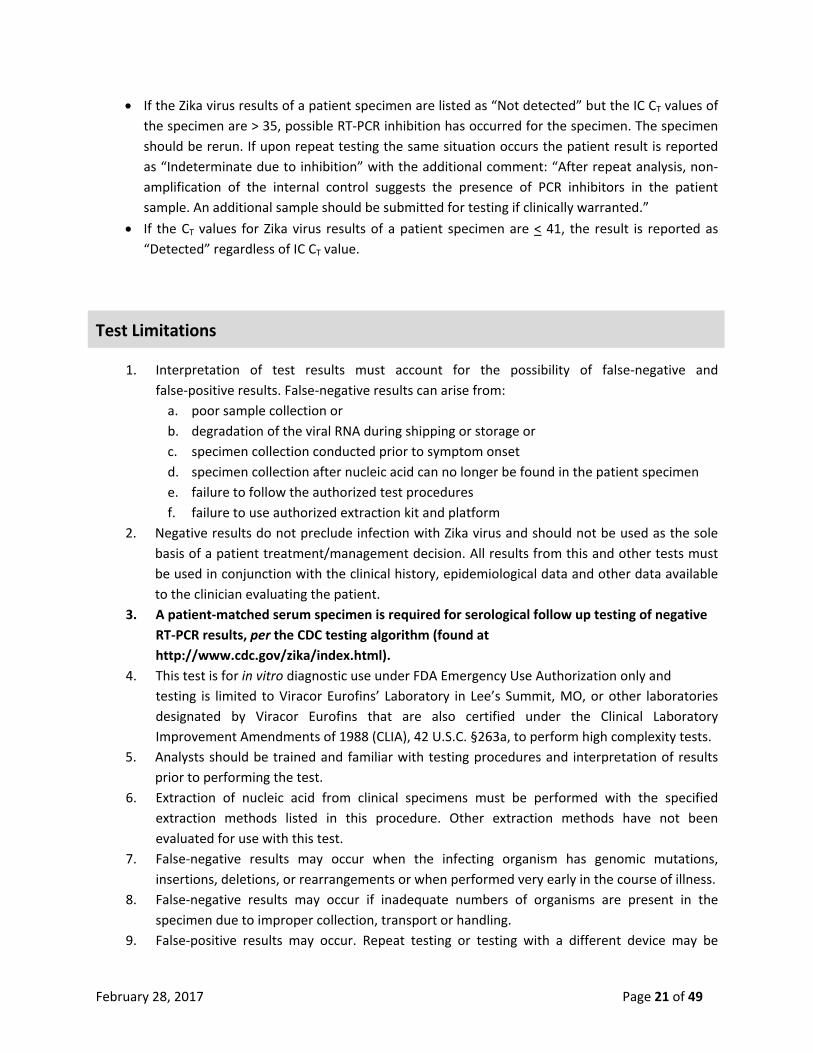
• If the Zika virus results of a patient specimen are listed as “Not detected” but the IC CT values of the specimen are > 35, possible RT-PCR inhibition has occurred for the specimen. The specimen should be rerun. If upon repeat testing the same situation occurs the patient result is reported as “Indeterminate due to inhibition” with the additional comment: “After repeat analysis, non-amplification of the internal control suggests the presence of PCR inhibitors in the patient sample. An additional sample should be submitted for testing if clinically warranted.”
• If the CT values for Zika virus results of a patient specimen are < 41, the result is reported as “Detected” regardless of IC CT value.
Test Limitations
1. Interpretation of test results must account for the possibility of false-negative and false-positive results. False-negative results can arise from:
a. poor sample collection or b. degradation of the viral RNA during shipping or storage or c. specimen collection conducted prior to symptom onset d. specimen collection after nucleic acid can no longer be found in the patient specimen e. failure to follow the authorized test procedures f. failure to use authorized extraction kit and platform
2. Negative results do not preclude infection with Zika virus and should not be used as the sole basis of a patient treatment/management decision. All results from this and other tests must be used in conjunction with the clinical history, epidemiological data and other data available to the clinician evaluating the patient.
3. A patient-matched serum specimen is required for serological follow up testing of negative RT-PCR results, per the CDC testing algorithm (found at http://www.cdc.gov/zika/index.html).
4. This test is for in vitro diagnostic use under FDA Emergency Use Authorization only and testing is limited to Viracor Eurofins’ Laboratory in Lee’s Summit, MO, or other laboratories designated by Viracor Eurofins that are also certified under the Clinical Laboratory Improvement Amendments of 1988 (CLIA), 42 U.S.C. §263a, to perform high complexity tests.
5. Analysts should be trained and familiar with testing procedures and interpretation of results prior to performing the test.
6. Extraction of nucleic acid from clinical specimens must be performed with the specified extraction methods listed in this procedure. Other extraction methods have not been evaluated for use with this test.
7. False-negative results may occur when the infecting organism has genomic mutations, insertions, deletions, or rearrangements or when performed very early in the course of illness.
8. False-negative results may occur if inadequate numbers of organisms are present in the specimen due to improper collection, transport or handling.
9. False-positive results may occur. Repeat testing or testing with a different device may be

February 28, 2017 Page 22 of 49
indicated in some settings. 10. The performance of this test has not been established for monitoring treatment of Zika virus
infection. 11. This test cannot rule out diseases caused by other bacterial or viral pathogens. 12. This test has not been validated with specimens except serum, plasma, and urine.

February 28, 2017 Page 23 of 49
Performance Characteristics Analytical Sensitivity Analytical sensitivity – Limit of detection (LOD) studies were performed to determine the lowest detectable concentration of Zika virus at which approximately 95% of all (true positive) replicates test positive. LOD Study #1 (Zika Virus Strain of the African Lineage): The LOD was initially determined by limiting dilution studies using a Zika viral stock 0810092CF (Zeptometrix lot# 307586) with a concentrated titer of 1.15x10⁷ TCID50/mL, processed in an identical manner to clinical specimens, and Probit analysis. The concentration of Zika virus sub-stock of approx. 2,000 copies/mL or 2.3x10² TCID50/mL used for LOD was determined in four independent experiments, with in vitro transcribed RNA (independently quantified by a Ribogreen dye binding method) used as standard curve material. The replicate experiments for Zika virus stock concentration determination were performed at a concentration of approx. 2,000 copies/mL and exhibited a %CV of 6.96% for plasma samples and 2.67% for urine samples based on log10 copies/mL values. Following determination of the Zika virus stock concentration, 20 replicates of a two-fold dilutions series across eight dilutions were analyzed (using the entire test system over multiple extraction and amplification runs), beginning at approximately 390 copies/mL in Zika virus negative human plasma and urine. The results for individual dilutions for plasma and urine are shown in Tables 1 and 2, respectively. The plasma LOD based on these results is 97 copies/mL and the urine LOD is 98 copies/mL. Table 1. Replicate results for Zika virus LOD determination in plasma using a Zika viral stock 0810092CF
Expected TCID50/mL
Expected copies/mL
No. Replicates
No. Positive %
Positive
27.56 387 20 20 100% 13.78 194 20 20 100% 6.89 97 20 20 100% 3.44 48 20 18 90% 1.72 24 20 14 70% 0.86 12.10 20 10 50% 0.43 6.05 20 4 20% 0.22 2.98 20 3 15%

February 28, 2017 Page 24 of 49
Table 2. Replicate results for Zika virus LOD determination in urine using a Zika viral stock 0810092CF
Expected TCID50/mL
Expected copies/mL
No. Replicates
No. Positive % Positive
27.56 392 19 19 100% 13.78 196 20 20 100% 6.89 98 20 19 95% 3.44 49 20 13 65% 1.72 25 20 12 60% 0.86 12.26 20 8 40% 0.43 6.13 20 4 20% 0.22 2.52 20 7 35%
LOD Study #2 (Zika Virus Strain of the Asian Lineage): Additional experiments for LOD demonstration were performed using a characterized Zika Asian lineage strain (Zika Virus strain PRVABC59, ATCC VR-1843 Lot 64104231). Initially, a range finding study was performed in which the Zika virus stock was spiked into negative human plasma using 0.3x log10-fold dilutions starting at 2.6 log10 copies/mL (398 copies/mL) down to 1.1 log10 copies/mL (13 copies/mL). Three replicates were prepared for each dilution and tested throughout the entire test system. The lowest concentration at which all three replicates were positive was treated as the tentative LOD. In plasma, the lowest concentration at which Viracor Eurofins’ Zika Virus Real-time RT-PCR test detected 3/3 replicates was 25 copies/mL, as shown in Table 3. After the range finding study was completed the LOD confirmation study was performed using the same Zika virus stock (strain PRVABC59). The LOD was then confirmed by spiking 20 replicates in negative human plasma using five 0.15xlog10-fold dilutions above the tentative LOD (25 copies/mL), and one dilution below the tentative LOD. All replicates were tested throughout the entire test system. The lowest concentration at which > 95% of replicates were positive was considered the confirmed LOD for plasma. As shown in Table 4, the concentration at which >95% of replicates were positive was 50 copies/mL. Table 3. Summary of LOD range finding results in plasma using Zika Virus strain PRVABC59
Sample Name Nominal
copies/mL Mean CT Zika RNA
No. Tested
No. Detected
% Detection Mean Int. control CT
ZIKV PL 398 398 35.76 3 3 100% 23.04
ZIKV PL 200 200 36.84 3 3 100% 22.99
ZIKV PL 100 100 37.28 3 3 100% 23.44
ZIKV PL 50 50 38.53 3 3 100% 24.49
ZIKV PL 25 25 39.01 3 3 100% 24.20
ZIKV PL 13 13 38.59 2 3 66.7% 23.45

February 28, 2017 Page 25 of 49
Table 4. Summary of LOD confirmation results in plasma using Zika Virus strain PRVABC59
Sample Name Nominal
copies/mL Mean CT Zika RNA
No. Tested
No. Detected
% Detection Mean Int. control CT
ZIKV PL 141 141 36.48 20 20 100% 27.40
ZIKV PL 100 100 36.15 20 20 100% 27.09
ZIKV PL 71 71 37.59 20 19 95% 28.11
ZIKV PL 50 50 37.92 20 19 95% 27.29
ZIKV PL 35 35 38.16 20 15 75% 26.88
ZIKV PL 25 25 38.34 20 10 50% 26.84
ZIKV PL 18 18 38.35 20 11 55% 26.50
For urine, a range finding study was performed in which the Zika virus stock (strain PRVABC59) was spiked into negative human urine using 0.3xlog10-fold dilutions starting at 2.6 log10 copies/mL (398 copies/mL) down to 1.1 log10 copies/mL (13 copies/mL). Three replicates were prepared for each dilution and tested throughout the entire test system. The lowest concentration at which all three replicates were positive was treated as the tentative LOD. The lowest concentration at which Viracor Eurofins’ Zika Virus Real-time RT-PCR test detected 3/3 replicates was 13 copies/mL, as shown in Table 5. After the range finding study was completed the LOD confirmation study was performed using the same Zika virus stock (strain PRVABC59). The LOD was confirmed by spiking 20 replicates in negative human urine using three 0.15xlog10-fold dilutions above the tentative LOD (13 copies/mL). All replicates were tested throughout the entire test system. The lowest concentration at which > 95% of replicates were positive was considered the confirmed LOD. As shown in Table 6, the concentration at which > 95% of replicates were positive was 35 copies/mL. Table 5. Summary of LOD range finding results in urine using Zika Virus strain PRVABC59
Sample Name Nominal
copies/mL Mean CT Zika RNA
No. Tested
No. Detected
% Detection Mean Int. control CT
ZIKV UR 398 398 33.11 3 3 100% 22.38
ZIKV UR 200 200 34.12 3 3 100% 22.35
ZIKV UR 100 100 34.71 3 3 100% 22.43
ZIKV UR 50 50 36.25 3 3 100% 22.34
ZIKV UR 25 25 37.51 3 3 100% 22.34 ZIKV UR 13 13 35.73 3 3 100% 22.51
Table 6. Summary of LOD confirmation results in urine using Zika Virus strain PRVABC59
Sample Name Nominal
copies/mL Mean CT Zika RNA
No. Tested
No. Detected
% Detection Mean Int. control CT
ZIKV UR 35 35 36.67 20 20 100% 25.73
ZIKV UR 25 25 37.71 20 18 90% 26.09
ZIKV UR 18 18 37.68 20 17 85% 26.02
February 28, 2017 Page 26 of 49
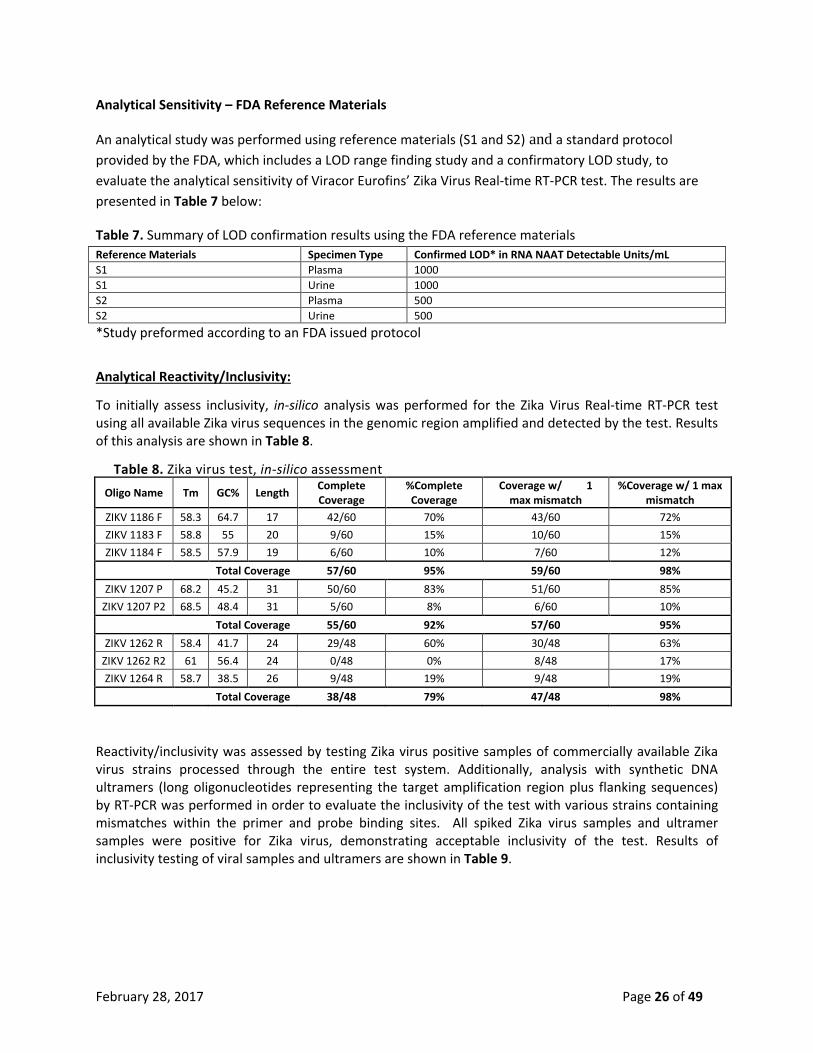
Analytical Sensitivity – FDA Reference Materials
An analytical study was performed using reference materials (S1 and S2) and a standard protocol provided by the FDA, which includes a LOD range finding study and a confirmatory LOD study, to evaluate the analytical sensitivity of Viracor Eurofins’ Zika Virus Real-time RT-PCR test. The results are presented in Table 7 below:
Table 7. Summary of LOD confirmation results using the FDA reference materials Reference Materials Specimen Type Confirmed LOD* in RNA NAAT Detectable Units/mL S1 Plasma 1000 S1 Urine 1000 S2 Plasma 500 S2 Urine 500 *Study preformed according to an FDA issued protocol
Analytical Reactivity/Inclusivity: To initially assess inclusivity, in-silico analysis was performed for the Zika Virus Real-time RT-PCR test using all available Zika virus sequences in the genomic region amplified and detected by the test. Results of this analysis are shown in Table 8.
Table 8. Zika virus test, in-silico assessment Oligo Name Tm GC% Length Complete
Coverage %Complete Coverage
Coverage w/ 1 max mismatch
%Coverage w/ 1 max mismatch
ZIKV 1186 F 58.3 64.7 17 42/60 70% 43/60 72% ZIKV 1183 F 58.8 55 20 9/60 15% 10/60 15% ZIKV 1184 F 58.5 57.9 19 6/60 10% 7/60 12%
Total Coverage 57/60 95% 59/60 98% ZIKV 1207 P 68.2 45.2 31 50/60 83% 51/60 85%
ZIKV 1207 P2 68.5 48.4 31 5/60 8% 6/60 10% Total Coverage 55/60 92% 57/60 95%
ZIKV 1262 R 58.4 41.7 24 29/48 60% 30/48 63% ZIKV 1262 R2 61 56.4 24 0/48 0% 8/48 17% ZIKV 1264 R 58.7 38.5 26 9/48 19% 9/48 19%
Total Coverage 38/48 79% 47/48 98%
Reactivity/inclusivity was assessed by testing Zika virus positive samples of commercially available Zika virus strains processed through the entire test system. Additionally, analysis with synthetic DNA ultramers (long oligonucleotides representing the target amplification region plus flanking sequences) by RT-PCR was performed in order to evaluate the inclusivity of the test with various strains containing mismatches within the primer and probe binding sites. All spiked Zika virus samples and ultramer samples were positive for Zika virus, demonstrating acceptable inclusivity of the test. Results of inclusivity testing of viral samples and ultramers are shown in Table 9.

February 28, 2017 Page 27 of 49
Table 9. Analytical inclusivity
ID Source Organism / Strain Zika Virus Real-time
RT-PCR CT
0810092CF Zeptometrix ZIKV (strain ID unavailable; not Asian) 29.08
VR-1838 ATCC ZIKV MR 766 (Uganda 1947) 16.09
VR-1839 ATCC ZIKV IB H 30656 (Nigeria 1968) 16.35
VR-1843 ATCC ZIKV PRVABC59 (Puerto Rico 2015) 17.44
143450369 IDT ZIKV HQ234500 Ultramer (Nigeria 1968) 28.36
143450370 IDT ZIKV HQ234501 Ultramer (Senegal 1984) 30.36
143450371 IDT ZIKV KF268948 Ultramer (CAR 1976) 35.13
143450367 IDT ZIKV KU497555 Ultramer (Brazil 2015) 28.38
143450368 IDT ZIKV NC_012532 Ultramer (Uganda 1947) 29.09
Cross Reactivity: Potential cross-reactivity was evaluated with various pathogens that could cause similar symptoms, pathogens closely related to Zika virus due to sequence identity, and pathogens transmitted by the same mosquito vector. No signal was detected for the non-target organisms tested with the Zika Virus Real-time RT-PCR test as shown in Table 10. Additional in silico analysis of key pathogens demonstrated a lack of cross-reactivity as shown in Table 11.
Table 10. Analytical specificity – cross-reactivity
ID Source Organism Concentration Zika Virus Real-time RT-PCR CT
NATWNV-0005 Zeptometrix West Nile Virus 5,000 copies/mL ND 1 0810088CF Zeptometrix Dengue Virus serotype 1 5.01X10³ TCID50/mL ND 0810089CF Zeptometrix Dengue Virus serotype 2 5.01X10³ TCID50/mL ND 0810090CF Zeptometrix Dengue Virus serotype 3 4.17X10³ TCID50/mL ND 0810091CF Zeptometrix Dengue Virus serotype 4 9.55X10⁴ TCID50/mL ND
NATCHIKV-ST Zeptometrix Chikungunya virus 1.25X10⁶ TCID50/mL ND 0810095CF Zeptometrix Yellow Fever Virus strain 17D 2.19X10⁴ TCID50/mL ND
VR-73 ATCC Ilheus virus 1.26X10⁶ LD50/mL ND VR-1277 ATCC Mayaro virus 1.58X10⁶ LD50/mL ND
0810093CF Zeptometrix Banzi Virus 2.45X10³ TCID50/mL ND
VR-1265CAF ATCC St. Louis Encephalitis Virus ascetic fluid V-524-401-562 N.A.2 ND
VR-837 ATCC BK virus 1.4x10⁴ TCID50/mL ND 53592 ATCC Chlamydophila pneumoniae 7.9x10⁴ TCID50/mL ND VR-807 ATCC Cytomegalovirus 1.4x10³ TCID50/mL ND
0810047CF Zeptometrix Enterovirus 9x10⁴ TCID50/mL ND 081008CF Zeptometrix Epstein-Barr virus 3x10⁷ copies/ mL ND
VR-15 ATCC Adenovirus 3.16x10⁶ TCID50/mL ND 950150 Acrometrix Hepatitis B virus >1.0X10⁵ TCID50/mL ND 950350 Acrometrix Hepatitis C virus >1.0X10⁵ TCID50/mL ND
25 000411 Viracor Eurofins Hepatitis D virus 1x10⁴ copies/ mL ND
6329/10 WHO Hepatitis E virus >1.0X10⁴ TCID50/mL ND 081006CF Zeptometrix Herpes simplex virus-1 6.6X10⁴ TCID50/mL ND

February 28, 2017 Page 28 of 49
081005CF Zeptometrix Herpes simplex virus-2 1.0X10⁷ TCID50/mL ND 960406 Acrometrix HIV 8.10x10⁸ copies/mL ND VR-1480 Zeptometrix Human herpesvirus-6 N.A. ND
0810071CF Zeptometrix Human herpesvirus-7 1.1X10⁵ TCID50/mL ND 0810104CF Zeptometrix Human herpesvirus-8 1.0X10⁴ TCID50/mL ND
VR-1583 ATCC JC virus 7.9x10⁴ TCID50/mL ND
1498735 Clinical specimen Parvovirus B19 1.0x10⁸ copies/mL ND
0801512 Zeptometrix Group A strep >1.0X10⁴ CFU/mL ND 30932 ATCC Plasmodium falciparum N.A. ND 35210 ATCC Borrelia burdorferi N.A. ND
VR-1796 ATCC Influenza H1N1 2009 Pandemic >1.0X10³ TCID50/mL ND VR-95 ATCC Influenza A H1N1 Seasonal 7.9X10⁶ TCID50/mL ND
VR-822 ATCC Influenza H3N2 Seasonal 7.9X10⁵ TCID50/mL ND 0810037CF Zeptometrix Influenza B >1.0X10³ TCID50/mL ND
VR-26 ATCC RSV A >1.0X10³ TCID50/mL ND VR-24 Zeptometrix Measles virus 5.8X10⁵ TCID50/mL ND
0810048CF Zeptometrix Rubella virus >1.0X10³ TCID50/mL ND VR-1367 ATCC Varicella-Zoster virus 4.5x10⁴ TCID50/mL ND
1 ND, Not Detected 2 N.A., Not Available
Table 11. Organisms analyzed in silico for cross-reactivity with the Zika Virus Real-time RT-PCR primers and probes
query name
ZIKV 1183 F
ZIKV 1184 F
ZIKV 1186 F
ZIKV 1262 R
ZIKV 1262 R2
ZIKV 1264 R
ZIKV 1207 P
ZIKV 1207 P2
query function
Forward primer-1
Forward primer-2
Forward primer-3
Reverse primer-1
Reverse primer-2
Reverse primer-3 Probe-1 Probe-2
query length 20 19 17 24 24 26 31 31 strand match plus/plus plus/plus plus/plus plus/minus plus/minus plus/minus plus/plus plus/plus
Organism tax ID Percent homology for alignment with lowest E value for each analysis (vector sequences
excluded)
Dengue virus 1 11053 65% 89% 94% 50% 50% 46% N.A.a N.A.
Dengue virus 2 11060 90% 89% 100% 46% 46% 42% N.A. N.A.
Dengue virus 3 11069 65% 53% 59% 54% 50% 46% N.A. N.A.
Dengue virus 4 11070 55% 58% 65% 46% 46% 42% N.A. N.A.
Yellow Fever 40005 50% 58% 65% 54% 54% 46% 55% N.A.
West Nile Virus 11082 65% 53% 76% 50% 58% 42% N.A. N.A.
Chikungunya Virus 37124 50% 65% 59% 38% 42% 42% N.A. N.A.
Mayaro Virus 59301 50% 53% 59% 46% 46% 42% N.A. 35%
St Louis encephalitis virus 11080 45% 53% 59% 54% 54% 50% 45% 45% Japanese encephalitis
virus 11071 55% 58% 65% 54% 58% 50% N.A. N.A.
Spondweni Virus 64318 40% 58% 65% 33% 33% 31% 42% 42% Eastern equine encep.
virus 11021 50% 53% 59% 54% 54% 50% N.A. N.A.

February 28, 2017 Page 29 of 49
Western equine encep. virus 11039 45% 42% 47% 42% 42% 38% 35% 35%
Ross River Virus 11029 45% 47% 53% 38% 38% 35% 45% 61%
Barmah Forest Virus 11020 40% 42% 47% 33% 33% 31% 39% 42%
O'nyong-nyong Virus 11027 40% 42% 47% 38% 38% 35% 32% 58% a No significant similarity found
Matrix Equivalency between Serum and Plasma :
To demonstrate that the performance characteristics of the Zika Virus Real-time RT-PCR test are equivalent for serum and plasma, paired serum and plasma samples from individual donors were spiked using Zika Virus Culture Fluid ATCC VR-1843 (strain PRVABC59, lot 64104231). A total of 56 samples were spiked at 1.6xLOD (20 samples), 2xLOD (20 samples) or 5xLOD (16 samples). Ten (10) unspiked plasma samples were used as negative controls. All samples were blinded and randomized for testing. As shown in Table 12, only one expected positive serum sample, spiked at 1.6xLOD, returned a result of “Not detected”. All 10 known negative samples (negative controls) returned a result of “Not detected”. The matrix equivalency study results indicated that the performance characteristics of the Zika Virus Real-time RT-PCR test are similar for serum and plasma.
Table 12. Summary of results for matrix equivalency using contrived individual, paired plasma and serum samples using Zika virus strain PRVABC59
Fold of LOD Specimen pair No. Tested No. Detected % Detected Mean Zika virus CT
1.6 Plasma 10 10 100% 35.44
Serum 10 9 90% 36.14
2.0 Plasma 10 10 100% 33.89
Serum 10 10 100% 35.76
5.0 Plasma 8 8 100% 32.57
Serum 8 8 100% 34.81
TOTAL 56 55
0 (unspiked) Plasma 10 0 0% N/A
Interference Studies Interference studies were not performed since conventional, well-established methods were used for both nucleic acid extraction and RT-PCR amplification.

February 28, 2017 Page 30 of 49
Clinical Evaluation Contrived Clinical Specimens Testing: Accuracy of the Zika Virus Real-time RT-PCR test was assessed for both plasma and urine using contrived and negative samples. Testing was completed using spiked (contrived) specimens from unique individual donor samples for both plasma and urine specimens. A total of 145 samples, 75 plasma and 60 urine, were tested through the entire test system (Tables 13 and 14). For plasma specimens, 10 un-spiked negative plasma samples were tested along with 10 samples spiked at 0.3xLOD, 20 samples at 0.5xLOD, 10 samples at 1.0xLOD, 10 samples at 1.6xLOD, 15 samples at 2.0xLOD, and 10 at 5.0xLOD. For urine samples, 5 samples were spiked at 1.5xLOD, 3 samples at 5.0xLOD, and 2 samples at 10.0xLOD. All spiked samples were contrived using the Zika Virus Culture Fluid ATCC VR-1843 Lot 64104231 (strain PRVABC59). All samples were blinded and randomized for testing. As shown in Table 13, Zika virus was detected in 90.1% of all reactions, and 100% of reactions spiked at >1.6xLOD. For spiked urine samples, Zika virus was detected in 100% of all reactions. Table 13. Summary of accuracy results using contrived plasma and urine samples using Zika virus strain PRVABC59
Fold of LOD Specimen No. Tested No. Detected % Detected 0.3 Plasma 10 7 70% 0.5 Plasma 20 17 85% 1.0 Plasma 10 9 90% 1.6 Plasma 10 10 100% 2.0 Plasma 15 15 100% 5.0 Plasma 10 10 100%
TOTAL 75 68 90.1% 1.5 Urine 5 5 100% 5.0 Urine 3 3 100%
10.0 Urine 2 2 100% TOTAL 10 10 100%
0 (unspiked) Plasma 10 0 0%
Additionally, 25 urine samples were spiked at 1.5xLOD, 10 samples at 5.0xLOD, and 5 samples at 10.0xLOD, with 10 negative (unspiked) urine controls; all urine samples were collected from unique individual donors. For this second set of spiked urine samples, testing was also performed with a comparator RT-PCR test under an EUA. The results are summarized in Table 14. For the urine samples tested by both Viracor Eurofins’ Zika Virus Real-time RT-PCR test and the comparator RT-PCR test, 100% Zika virus detection (100% agreement) was observed for all contrived samples at 1.5x, 5.0x and 10.0xLOD. All 10 un-spiked known negative urine samples returned a result of “Not Detected” for both tests.

February 28, 2017 Page 31 of 49
Table 14. Summary of accuracy results using contrived urine samples using Zika virus strain PRVABC59 and testing by Viracor Eurofins’ Zika Virus Real-time RT-PCR test and a comparator RT-PCR test under an EUA
Fold of LOD
Specimen No. Tested
No. Detected
% Agreement
Viracor Eurofins’ Zika Virus Real-
time RT-PCR test
Comparator test
1.5 Urine 25 25 25 100% 5.0 Urine 10 10 10 100%
10.0 Urine 5 5 5 100% TOTAL 40 40 40 100%
0 (unspiked) Urine 10 0 0 100%
All contrived clinical specimen testing data combined, the performance of Viracor Eurofins’ Zika Virus Real-time RT-PCR against the expected results stratified by specimen type is presented in Tables 15, and 16.
Table 15. Summary performance of Viracor Eurofins’ Zika Virus Real-time RT-PCR against the expected results - Plasma
Plasma - Specimen Category
Viracor Eurofins’ Zika Virus Real-time RT-PCR
Number Tested Zika RNA Positive
Zika RNA Negative
Contrived Zika Positive (0.3 X LOD) 10 7 3
Contrived Zika Positive (0.5 X LOD) 20 17 3
Contrived Zika Positive (1 X LOD) 10 9 1
Contrived Zika Positive (1.6 X LOD) 10 10 0
Contrived Zika Positive (2.0 X LOD) 15 15 0
Contrived Zika Positive (5.0 X LOD) 10 10 0
Un-spiked Zika Negative 10 0 10
Positive Percent Agreement 90.7% (68/75); 95% CI (82.0% - 95.4%)
Negative Percent Agreement 100% (10/10); 95% CI (72.2% - 100%)

February 28, 2017 Page 32 of 49
Table 16. Summary performance of Viracor Eurofins’ Zika Virus Real-time RT-PCR against the expected results - Urine
Urine - Specimen Category
Viracor Eurofins’ Zika Virus Real-time RT-PCR
Number Tested Zika RNA Positive
Zika RNA Negative
Contrived Zika Positive (1.5 X LOD) 30 30 0
Contrived Zika Positive (5.0 X LOD) 13 13 0
Contrived Zika Positive (10.0 X LOD) 7 7 0
Un-spiked Zika Negative 10 0 10
Positive Percent Agreement 100% (50/50); 95% CI (92.9% - 100%)
Negative Percent Agreement 100% (10/10); 95% CI (72.2% - 100%)
Natural Clinical Specimens Testing: The performance characteristics of the Zika Virus Real-time RT-PCR test were further evaluated using retrospectively collected natural clinical samples. Multiple serum and plasma samples were collected in a surveillance study from Colombia, South America. Eleven (11) plasma samples and 32 serum samples were from Zika presumptive-positive patients (as determined by clinical presentation), 30 plasma samples were from asymptomatic individuals considered to be at risk since they were geographically located in mosquito infested areas where Zika is currently endemic (Colombia, South America). In addition, a total of three natural clinical samples (two serum and one urine) collected from symptomatic individuals residing in the United States of America were also included in the performance evaluation. A total of 80 expected Zika RNA negative specimens were from asymptomatic normal donors in the United States. These expected Zika RNA negative samples were composed of 30 serum, 20 plasma, and 30 urine specimens collected from individual healthy donors from multiple ages, gender, and race from different geographic areas within the United States. A summary of the number of samples tested in each group and the positivity rate as determined by Viracor Eurofins’ Zika Virus Real-time RT-PCR test is shown in Table 17.

February 28, 2017 Page 33 of 49
Table 17. Samples distribution and positivity rate as determined by Viracor Eurofins’ Zika Virus Real-time RT-PCR test for retrospectively collected individual patient/subject samples from Colombia and the United States a
Sample Distribution Plasma -
No. positive/No. tested (% positive)
Serum - No. positive/No.
tested (% positive)
Urine - No. positive/No.
tested (% positive)
Symptomatic - Colombian origin (clinical signs compatible with Zika infection)
3/11 (27.3%) 3/32 (9.4%) N/A
Asymptomatic - Colombian origin (high risk surveillance area)
17/30 (56.6%) N/A N/A
Symptomatic - United States origin N/A 2/2 (100%) 1/1 (100%) Asymptomatic - United States origin 0/20 (0%) 0/21 a (0%) 0/30 (0%)
a Results shown do not include 9 samples with an Invalid results (i.e., internal control CT values >35 and no Zika virus detected). Basic information such as specimen collection date, date of onset of symptoms (if any), clinical diagnosis, demographics, and gestational time (if applicable) were collected at the time of donation. All natural clinical samples, presumptive positives, asymptomatic samples, and negative samples were blinded and randomized at the time of testing at VIBT and samples tested for confirmatory and comparator testing purposes was handled in the same manner. All clinical samples were processed as previously described utilizing the entire workflow. Results of testing by Viracor Eurofins’ Zika Virus Real-time RT-PCR test, as well as a comparator test (under an EUA), are shown in Tables 18, 19, 20 and 21. Table 18. Summary of Zika virus natural clinical samples collected from symptomatic individuals in Colombia, South America with compatible clinical signs of Zika virus infection
Viracor Eurofins’ Zika Virus Real-time RT-PCR Result Comparator Test a Result
Blinded ID
Sample Specimen ZIKV CT Result Internal
control CT ZIKV CT Result
Internal control CT
3 ZIKV Acc 3 Plasma ND Not detected 26.99 ND Negative 29.97
8 ZIKV Acc 8 Plasma 29.17 Detected 27.5 27.10 Positive 29.67
67 ZIKV Acc 67 Plasma ND Not detected 25.69 ND Negative 29.13
79 ZIKV Acc 79 Plasma ND Not detected 26.08 ND Negative 29.44
109 ZIKV Acc 109 Plasma ND Not detected 27.86 ND Negative 30.04
61 ZIKV Acc 61 Plasma ND Not detected 30.04 ND Negative 28.91
90 ZIKV Acc 90 Plasma 39.08 Detected 30.27 36.83 Positive 29.44
66 ZIKV Acc 66 Plasma 39.97 Detected 25.96 ND Negative 31.02
126 ZIKV Acc 126 Plasma ND Not detected 28.54 ND Negative 29.60
27 ZIKV Acc 27 Plasma ND Not detected 25.85 ND Negative 30.00
5 ZIKV Acc 5 Plasma ND Not detected 29.47 ND Negative 29.80
88 ZIKV Acc 88 Serum ND Not detected 26.02 ND Negative 29.09
89 ZIKV Acc 89 Serum ND Not detected 26.74 ND Negative 29.74
114 ZIKV Acc 114 Serum ND Not detected 27.08 ND Negative 30.06
10 ZIKV Acc 10 Serum ND Not detected 26.44 ND Negative 29.38
37 ZIKV Acc 37 Serum ND Not detected 25.45 ND Negative 29.65
30 ZIKV Acc 30 Serum ND Not detected 26.94 ND Negative 30.02

February 28, 2017 Page 34 of 49
65 ZIKV Acc 65 Serum ND Not detected 26.05 ND Negative 29.88
34 ZIKV Acc 34 Serum ND Not detected 26.52 ND Negative 30.68
93 ZIKV Acc 93 Serum ND Not detected 26.11 ND Negative 29.48
23 ZIKV Acc 23 Serum ND Not detected 26.53 ND Negative 29.69
150 ZIKV Acc 150 Serum ND Not detected 28.35 ND Negative 29.51
19 ZIKV Acc 19 Serum ND Not detected 26.99 ND Negative 29.94
58 ZIKV Acc 58 Serum ND Not detected 26.83 ND Negative 29.24
40 ZIKV Acc 40 Serum ND Not detected 26.07 ND Negative 30.06
83 ZIKV Acc 83 Serum ND Not detected 26.29 ND Negative 29.78
142 ZIKV Acc 142 Serum ND Not detected 26.26 ND Negative 29.52
35 ZIKV Acc 35 Serum ND Not detected 26.1 ND Negative 30.00
7 ZIKV Acc 7 Serum 37.38 Detected 25.76 35.44 Positive 28.84
51 ZIKV Acc 51 Serum ND Not detected 27.27 ND Negative 29.42
100 ZIKV Acc 100 Serum ND Not detected 26.42 ND Negative 29.44
80 ZIKV Acc 80 Serum ND Not detected 25.68 ND Negative 29.71
111 ZIKV Acc 111 Serum ND Not detected 27.13 ND Negative 30.52
71 ZIKV Acc 71 Serum ND Not detected 26.24 ND Negative 30.10
146 ZIKV Acc 146 Serum ND Not detected 26.94 ND Negative 29.45
52 ZIKV Acc 52 Serum ND Not detected 28.84 ND Negative 29.92
22 ZIKV Acc 22 Serum 27.90 Detected 25.35 27.61 Positive 29.41
38 ZIKV Acc 38 Serum 31.22 Detected 27.01 ND Negative 29.71
145 ZIKV Acc 145 Serum ND Not detected 27.54 ND Negative 29.85
36 ZIKV Acc 36 Serum ND Not detected 26.41 ND Negative 29.86
14 ZIKV Acc 14 Serum ND Not detected 27.12 ND Negative 30.04
129 ZIKV Acc 129 Serum ND Not detected 27.92 NAb NA NA
18 ZIKV Acc 18 Serum ND Not detected 26.82 ND Negative 29.59 a Comparator test under an EUA b NA – Not Applicable
Table 19. Summary of Zika virus natural clinical samples collected from asymptomatic individuals in Colombia, South American residing in high-risk Zika virus surveillance areas
Viracor Eurofins’ Zika Virus Real-time RT-PCR Result Comparator Test a Result
Blinded ID
Sample Specimen ZIKV CT Result Internal
control CT ZIKV CT Result
Internal control CT
17 ZIKV Acc 17 Plasma ND Not detected 26.62 36.94 Positive 29.43
20 ZIKV Acc 20 Plasma 38.51 Detected 26.39 ND Negative 29.61
28 ZIKV Acc 28 Plasma 39.17 Detected 32.77 36.58 Positive 30.14
32 ZIKV Acc 32 Plasma ND Not detected 26.2 ND Negative 30.15
43 ZIKV Acc 43 Plasma ND Not detected 27.02 ND Negative 30.97
44 ZIKV Acc 44 Plasma 34.19 Detected 28.48 33.05 Positive 30.00
45 ZIKV Acc 45 Plasma 40.16 Detected 41.6 34.90 Positive 29.70
48 ZIKV Acc 48 Plasma 36.22 Detected 26.84 34.34 Positive 30.02
50 ZIKV Acc 50 Plasma 25.93 Detected 27.12 25.54 Positive 28.96
54 ZIKV Acc 54 Plasma 30.22 Detected 30.56 28.49 Positive 29.87
55 ZIKV Acc 55 Plasma 36.04 Detected 28.11 34.35 Positive 29.80
59 ZIKV Acc 59 Plasma 29.50 Detected 27.06 28.25 Positive 29.58
70 ZIKV Acc 70 Plasma ND Not detected 31.16 ND Negative 30.05
73 ZIKV Acc 73 Plasma 39.01 Detected 29.54 37.05 Positive 31.17

February 28, 2017 Page 35 of 49
76 ZIKV Acc 76 Plasma ND Not detected 25.58 ND Negative 30.16
82 ZIKV Acc 82 Plasma 31.22 Detected 32.73 28.79 Positive 30.11
86 ZIKV Acc 86 Plasma ND Not detected 25.72 ND Negative 29.96
87 ZIKV Acc 87 Plasma ND Not detected 25.56 ND Negative 29.21
91 ZIKV Acc 91 Plasma ND Not detected 33.61 ND Negative 29.42
92 ZIKV Acc 92 Plasma 35.15 Detected 26.88 33.35 Positive 29.87
97 ZIKV Acc 97 Plasma 32.79 Detected 28.12 31.83 Positive 30.30
99 ZIKV Acc 99 Plasma 34.05 Detected 25.91 33.60 Positive 29.74
101 ZIKV Acc 101 Plasma ND Not detected 30.64 ND Negative 29.39
112 ZIKV Acc 112 Plasma 40.11 Detected 31.99 ND Negative 29.69
124 ZIKV Acc 124 Plasma ND Not detected 27.02 ND Negative 29.39
134 ZIKV Acc 134 Plasma ND Not detected 26.44 ND Negative 29.58
136 ZIKV Acc 136 Plasma 32.98 Detected 28.13 32.38 Positive 31.05
144 ZIKV Acc 144 Plasma ND Not detected 31.71 ND Negative 29.49
147 ZIKV Acc 147 Plasma 39.06 Detected 29.32 36.89 Positive 30.22
148 ZIKV Acc 148 Plasma ND Not detected 26.97 ND Negative 29.36 a Comparator test under an EUA
Table 20. Summary of Zika virus natural clinical samples collected from symptomatic individuals residing in the United States of America
Viracor Eurofins’ Zika Virus Real-time RT-PCR
Result Comparator Test a Result Blinded
ID Sample Specimen ZIKV CT Result Internal
control CT ZIKV CT Result Internal
control CT 154 ZIKV 50 VIBT Serum 38.2 Detected 25.28 35.03 Positive 29.55
155 ZIKV 51 VIBT Serum 36.7 Detected 26.56 36.99 Positive 29.74
156 ZIKV 51 VIBT Urine 31.2 Detected 28.74 31.24 Positive 30.83 a Comparator test under an EUA
Table 21. Summary of Zika virus natural clinical samples collected from asymptomatic individuals residing in the United States of America
Viracor Eurofins’ Zika Virus Real-time RT-PCR
Result Comparator Test a Result
Blinded ID
Sample Specimen ZIKV CT Result Internal
control CT ZIKV CT Result
Internal control CT
2 ZIKV Acc 2 Plasma ND Not detected 25.6 ND Negative 29.70
15 ZIKV Acc 15 Plasma ND Not detected 25.56 ND Negative 29.13
47 ZIKV Acc 47 Plasma ND Not detected 26.14 ND Negative 29.49
49 ZIKV Acc 49 Plasma ND Not detected 26.16 ND Negative 29.50
68 ZIKV Acc 68 Plasma ND Not detected 25.19 ND Negative 29.51
74 ZIKV Acc 74 Plasma ND Not detected 25.2 ND Negative 30.07
81 ZIKV Acc 81 Plasma ND Not detected 25.38 ND Negative 29.69
94 ZIKV Acc 94 Plasma ND Not detected 25.19 ND Negative 29.76
96 ZIKV Acc 96 Plasma ND Not detected 25.3 ND Negative 30.22
103 ZIKV Acc 103 Plasma ND Not detected 25.38 ND Negative 29.83
106 ZIKV Acc 106 Plasma ND Not detected 25.54 ND Negative 29.21
115 ZIKV Acc 115 Plasma ND Not detected 25.56 ND Negative 29.05
121 ZIKV Acc 121 Plasma ND Not detected 25.44 ND Negative 29.43
125 ZIKV Acc 125 Plasma ND Not detected 25.8 ND Negative 29.05

February 28, 2017 Page 36 of 49
127 ZIKV Acc 127 Plasma ND Not detected 25.74 ND Negative 29.06
130 ZIKV Acc 130 Plasma ND Not detected 25.92 ND Negative 28.56
140 ZIKV Acc 140 Plasma ND Not detected 25.56 ND Negative 28.84
143 ZIKV Acc 143 Plasma ND Not detected 25.66 ND Negative 28.81
151 ZIKV Acc 151 Plasma ND Not detected 25.69 ND Negative 28.82
152 ZIKV Acc 152 Plasma ND Not detected 25.89 ND Negative 28.85
9 ZIKV Acc 9 Serum ND Not detected 34.95 ND Negative 29.70
11 ZIKV Acc 11 Serum ND Not detected 26.16 ND Negative 31.27
12 ZIKV Acc 12 Serum ND Invalid 35.9 NAb NA NA
13 ZIKV Acc 13 Serum ND Not detected 28.24 ND Negative 31.08
21 ZIKV Acc 21 Serum ND Not detected 27.12 ND Negative 30.17
33 ZIKV Acc 33 Serum ND Not detected 31.62 ND Negative 29.77
53 ZIKV Acc 53 Serum ND Invalid 43.14 NA NA NA
56 ZIKV Acc 56 Serum ND Invalid 36.81 NA NA NA
60 ZIKV Acc 60 Serum ND Invalid 35.93 NA NA NA
62 ZIKV Acc 62 Serum ND Not detected 26.23 ND Negative 30.88
64 ZIKV Acc 64 Serum ND Invalid 37.16 NA NA NA
69 ZIKV Acc 69 Serum ND Not detected 25.52 ND Negative 29.69
72 ZIKV Acc 72 Serum ND Not detected 32.9 ND Negative 29.56
75 ZIKV Acc 75 Serum ND Not detected 31.04 ND Negative 29.65
77 ZIKV Acc 77 Serum ND Not detected 25.32 ND Negative 30.03
85 ZIKV Acc 85 Serum ND Not detected 25.12 ND Negative 31.37
95 ZIKV Acc 95 Serum ND Not detected 32.4 ND Negative 29.87
98 ZIKV Acc 98 Serum ND Not detected 29.88 ND Negative 31.03
102 ZIKV Acc 102 Serum ND Invalid 35.57 NA NA NA
116 ZIKV Acc 116 Serum ND Not detected 25.71 ND Negative 30.59
117 ZIKV Acc 117 Serum ND Invalid 35.43 NA NA NA
119 ZIKV Acc 119 Serum ND Not detected 25.97 ND Negative 29.75
128 ZIKV Acc 128 Serum ND Invalid 41.55 NA NA NA
132 ZIKV Acc 132 Serum ND Not detected 27.6 ND Negative 30.06
135 ZIKV Acc 135 Serum ND Not detected 25.82 ND Negative 30.42
137 ZIKV Acc 137 Serum ND Not detected 25.76 ND Negative 30.80
138 ZIKV Acc 138 Serum ND Not detected 31.84 ND Negative 29.38
139 ZIKV Acc 139 Serum ND Not detected 29.01 ND Negative 30.64
141 ZIKV Acc 141 Serum ND Invalid 35.95 NA NA NA
149 ZIKV Acc 149 Serum ND Not detected 26.98 ND Negative 31.91
1 ZIKV Acc 1 Urine ND Not detected 25.26 ND Negative 30.00
4 ZIKV Acc 4 Urine ND Not detected 29.11 ND Negative 30.25
6 ZIKV Acc 6 Urine ND Not detected 29.61 ND Negative 30.53
16 ZIKV Acc 16 Urine ND Not detected 29.03 ND Negative 30.46
24 ZIKV Acc 24 Urine ND Not detected 27.15 ND Negative 30.48
25 ZIKV Acc 25 Urine ND Not detected 24.06 ND Negative 30.41
26 ZIKV Acc 26 Urine ND Not detected 24.55 ND Negative 30.56
29 ZIKV Acc 29 Urine ND Not detected 25.91 ND Negative 30.57
31 ZIKV Acc 31 Urine ND Not detected 28.82 ND Negative 30.82
39 ZIKV Acc 39 Urine ND Not detected 26.03 ND Negative 30.23
41 ZIKV Acc 41 Urine ND Not detected 27.04 ND Negative 31.16
42 ZIKV Acc 42 Urine ND Not detected 25.14 ND Negative 29.91
46 ZIKV Acc 46 Urine ND Not detected 28.57 ND Negative 29.54
57 ZIKV Acc 57 Urine ND Not detected 26.35 ND Negative 29.24

February 28, 2017 Page 37 of 49
63 ZIKV Acc 63 Urine ND Not detected 25.34 ND Negative 30.13
78 ZIKV Acc 78 Urine ND Not detected 24.26 ND Negative 29.51
84 ZIKV Acc 84 Urine ND Not detected 29.05 ND Negative 29.88
104 ZIKV Acc 104 Urine ND Not detected 26.82 ND Negative 30.48
105 ZIKV Acc 105 Urine ND Not detected 24.09 ND Negative 29.19
107 ZIKV Acc 107 Urine ND Not detected 27.27 ND Negative 30.09
108 ZIKV Acc 108 Urine ND Not detected 26.02 ND Negative 30.90
110 ZIKV Acc 110 Urine ND Not detected 23.95 ND Negative 29.55
113 ZIKV Acc 113 Urine ND Not detected 28.41 ND Negative 30.26
118 ZIKV Acc 118 Urine ND Not detected 23.89 ND Negative 30.64
120 ZIKV Acc 120 Urine ND Not detected 26.4 ND Negative 30.01
122 ZIKV Acc 122 Urine ND Not detected 29.05 ND Negative 29.62
123 ZIKV Acc 123 Urine ND Not detected 27.45 ND Negative 30.00
131 ZIKV Acc 131 Urine ND Not detected 27.17 ND Negative 29.93
133 ZIKV Acc 133 Urine ND Not detected 27.4 ND Negative 29.96
153 ZIKV Acc 153 Urine ND Not detected 27.46 ND Negative 29.56 a Comparator test under an EUA b NA – Not Applicable
Confirmation of a subset of “detected” results shown in Tables 18-21 was performed by bidirectional dideoxy (Sanger) nucleotide sequencing of approx. 400 bases from the Zika virus envelop protein gene. Characteristics and the region sequenced for these samples are shown in Table 22. A total of 15 positives were tested and all were found to match 100% to the current Asian Zika virus strain circulating in the Americas. Table 22. Confirmation of positive samples by Sanger Sequencing
Sample Name Date of
collection Date of symptoms or
Asymptomatic (origin) Days post
onset Specimen
Type ZIKV CT
Int. Control CT
Nucleotides Sequenced 1
ZIKV Acc 8 12/18/2015 12/14/2015 6 Plasma 29.17 27.50 659-1259
ZIKV Acc 22 1/28/2016 1/18/2016 10 Serum 27.90 25.35 659-1259
ZIKV Acc 38 1/28/2016 1/18/2016 10 Serum 31.22 27.01 659-1259
ZIKV Acc 50 12/15/2015 Asymptomatic at risk -
Surveillance (Colombia) Unk Plasma 25.93 27.12 659-1259
ZIKV Acc 54 12/9/2015 Asymptomatic at risk -
Surveillance (Colombia) Unk Plasma 30.22 30.56 659-1259
ZIKV Acc 59 12/10/2015 Asymptomatic at risk -
Surveillance (Colombia) Unk Plasma 29.50 27.06 659-1259
ZIKV Acc 82 12/5/2015 Asymptomatic at risk -
Surveillance (Colombia) Unk Plasma 31.22 32.73 659-1259
ZIKV Acc 44 12/10/2015 Asymptomatic at risk -
Surveillance (Colombia) Unk Plasma 34.19 28.48 659-1259
ZIKV Acc 48 12/5/2015 Asymptomatic at risk -
Surveillance (Colombia) Unk Plasma 36.22 26.84 659-1259
ZIKV Acc 55 12/11/2015 Asymptomatic at risk -
Surveillance (Colombia) Unk Plasma 36.04 28.11 659-1259
ZIKV Acc 92 12/7/2015 Asymptomatic at risk -
Surveillance (Colombia) Unk Plasma 31.22 32.73 659-1259
ZIKV Acc 97 12/9/2015 Asymptomatic at risk -
Surveillance (Colombia) Unk Plasma 35.15 26.88 659-1259
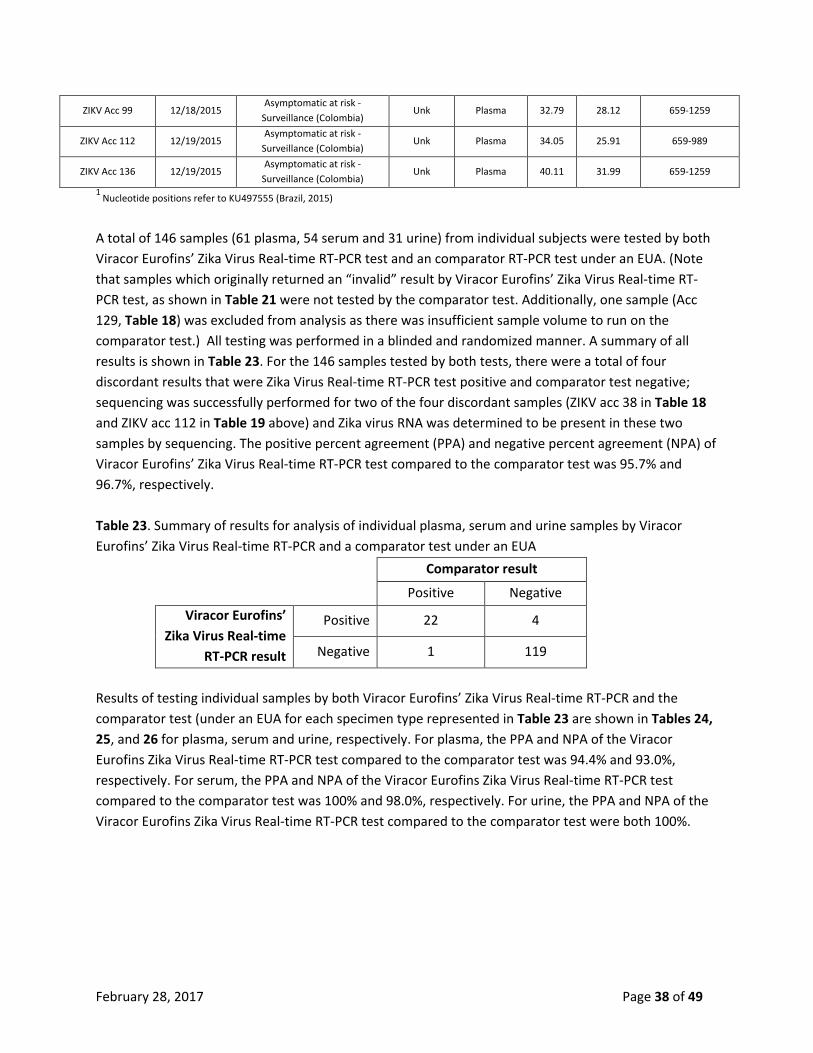
February 28, 2017 Page 38 of 49
ZIKV Acc 99 12/18/2015 Asymptomatic at risk -
Surveillance (Colombia) Unk Plasma 32.79 28.12 659-1259
ZIKV Acc 112 12/19/2015 Asymptomatic at risk -
Surveillance (Colombia) Unk Plasma 34.05 25.91 659-989
ZIKV Acc 136 12/19/2015 Asymptomatic at risk -
Surveillance (Colombia) Unk Plasma 40.11 31.99 659-1259
1 Nucleotide positions refer to KU497555 (Brazil, 2015) A total of 146 samples (61 plasma, 54 serum and 31 urine) from individual subjects were tested by both Viracor Eurofins’ Zika Virus Real-time RT-PCR test and an comparator RT-PCR test under an EUA. (Note that samples which originally returned an “invalid” result by Viracor Eurofins’ Zika Virus Real-time RT-PCR test, as shown in Table 21 were not tested by the comparator test. Additionally, one sample (Acc 129, Table 18) was excluded from analysis as there was insufficient sample volume to run on the comparator test.) All testing was performed in a blinded and randomized manner. A summary of all results is shown in Table 23. For the 146 samples tested by both tests, there were a total of four discordant results that were Zika Virus Real-time RT-PCR test positive and comparator test negative; sequencing was successfully performed for two of the four discordant samples (ZIKV acc 38 in Table 18 and ZIKV acc 112 in Table 19 above) and Zika virus RNA was determined to be present in these two samples by sequencing. The positive percent agreement (PPA) and negative percent agreement (NPA) of Viracor Eurofins’ Zika Virus Real-time RT-PCR test compared to the comparator test was 95.7% and 96.7%, respectively. Table 23. Summary of results for analysis of individual plasma, serum and urine samples by Viracor Eurofins’ Zika Virus Real-time RT-PCR and a comparator test under an EUA
Comparator result Positive Negative
Viracor Eurofins’ Zika Virus Real-time
RT-PCR result
Positive 22 4
Negative 1 119
Results of testing individual samples by both Viracor Eurofins’ Zika Virus Real-time RT-PCR and the comparator test (under an EUA for each specimen type represented in Table 23 are shown in Tables 24, 25, and 26 for plasma, serum and urine, respectively. For plasma, the PPA and NPA of the Viracor Eurofins Zika Virus Real-time RT-PCR test compared to the comparator test was 94.4% and 93.0%, respectively. For serum, the PPA and NPA of the Viracor Eurofins Zika Virus Real-time RT-PCR test compared to the comparator test was 100% and 98.0%, respectively. For urine, the PPA and NPA of the Viracor Eurofins Zika Virus Real-time RT-PCR test compared to the comparator test were both 100%.
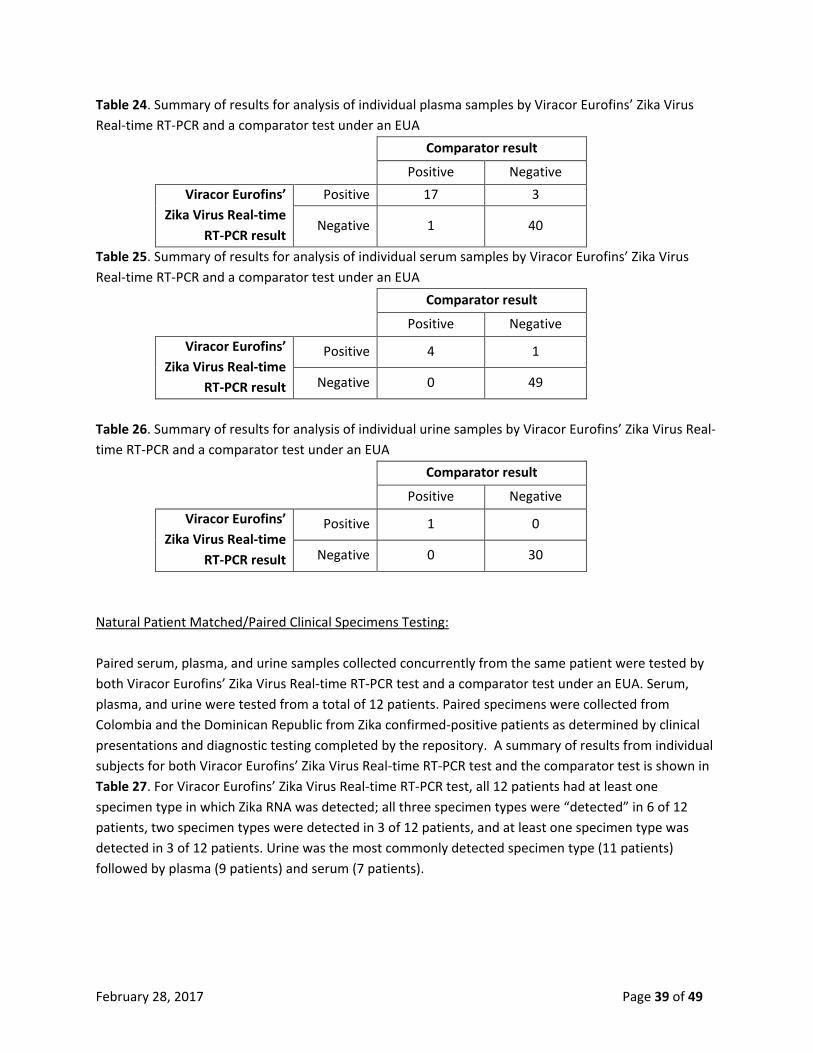
February 28, 2017 Page 39 of 49
Table 24. Summary of results for analysis of individual plasma samples by Viracor Eurofins’ Zika Virus Real-time RT-PCR and a comparator test under an EUA
Comparator result Positive Negative
Viracor Eurofins’ Zika Virus Real-time
RT-PCR result
Positive 17 3
Negative 1 40
Table 25. Summary of results for analysis of individual serum samples by Viracor Eurofins’ Zika Virus Real-time RT-PCR and a comparator test under an EUA
Comparator result Positive Negative
Viracor Eurofins’ Zika Virus Real-time
RT-PCR result
Positive 4 1
Negative 0 49
Table 26. Summary of results for analysis of individual urine samples by Viracor Eurofins’ Zika Virus Real-time RT-PCR and a comparator test under an EUA
Comparator result Positive Negative
Viracor Eurofins’ Zika Virus Real-time
RT-PCR result
Positive 1 0
Negative 0 30
.. Natural Patient Matched/Paired Clinical Specimens Testing: Paired serum, plasma, and urine samples collected concurrently from the same patient were tested by both Viracor Eurofins’ Zika Virus Real-time RT-PCR test and a comparator test under an EUA. Serum, plasma, and urine were tested from a total of 12 patients. Paired specimens were collected from Colombia and the Dominican Republic from Zika confirmed-positive patients as determined by clinical presentations and diagnostic testing completed by the repository. A summary of results from individual subjects for both Viracor Eurofins’ Zika Virus Real-time RT-PCR test and the comparator test is shown in Table 27. For Viracor Eurofins’ Zika Virus Real-time RT-PCR test, all 12 patients had at least one specimen type in which Zika RNA was detected; all three specimen types were “detected” in 6 of 12 patients, two specimen types were detected in 3 of 12 patients, and at least one specimen type was detected in 3 of 12 patients. Urine was the most commonly detected specimen type (11 patients) followed by plasma (9 patients) and serum (7 patients).

February 28, 2017 Page 40 of 49
Table 27. Summary of paired serum, plasma, and urine samples collected concurrently from 12 individual patients.
Patient number
Specimen Type
Viracor Eurofins’ Zika Virus Real-time RT-PCR Result Comparator Test a Result
1
Plasma Detected Positive
Serum Detected Positive
Urine Detected Positive
2
Plasma Detected Negative
Serum Not detected Negative
Urine Detected Positive
3
Plasma Detected Negative
Serum Not detected Negative
Urine Not detected Negative
4
Plasma Not detected Negative
Serum Detected Negative
Urine Detected Positive
5
Plasma Not detected Negative
Serum Not detected Negative
Urine Detected Positive
6
Plasma Detected Positive
Serum Detected Positive
Urine Detected Negative
7
Plasma Detected Positive
Serum Detected Positive
Urine Detected Positive
8
Plasma Detected Positive
Serum Detected Positive
Urine Detected Positive
9
Plasma Not detected Positive
Serum Not detected Negative
Urine Detected Negative
10
Plasma Detected Negative
Serum Not detected Negative
Urine Detected Positive
11
Plasma Detected Positive
Serum Detected Positive
Urine Detected Positive
12
Plasma Detected Positive
Serum Detected Positive
Urine Detected Positive a Comparator test under an EUA

February 28, 2017 Page 41 of 49
Test performance for paired serum, plasma, and urine samples collected concurrently from the same patient by each specimen type tested is shown in Tables 28, 29 and 30. For plasma, the PPA and NPA of Viracor Eurofins’ Zika Virus Real-time RT-PCR test compared to the comparator test was 85.7% and 40%, respectively. For serum, the PPA and NPA of Viracor Eurofins’ Zika Virus Real-time RT-PCR test compared to the comparator test was 100% and 83.3%, respectively. For urine, the PPA and NPA of Viracor Eurofins’ Zika Virus Real-time RT-PCR test compared to the comparator test was 100% and 33.3%, respectively. Table 28. Summary of results for analysis of individual plasma samples by Viracor Eurofins’ Zika Virus Real-time RT-PCR and a comparator test (under an EUA)
Comparator result
Positive Negative
Viracor Eurofins’ Zika Virus Real-time RT-
PCR result
Positive 6 3
Negative 1 2
Table 29. Summary of results for analysis of individual serum samples by Viracor Eurofins’ Zika Virus Real-time RT-PCR and a comparator test (under an EUA)
Comparator result
Positive Negative
Viracor Eurofins’ Zika Virus Real-time RT-
PCR result
Positive 6 1
Negative 0 5
Table 30. Summary of results for analysis of individual urine samples by Viracor Eurofins’ Zika Virus Real-time RT-PCR and a comparator test (under an EUA)
Comparator result
Positive Negative
Viracor Eurofins’ Zika Virus Real-time RT-
PCR result
Positive 9 2
Negative 0 1
Additionally, Viracor Eurofins’ Zika virus real-time RT-PCR test performance by each specimen type relative to the patient infected status is shown in Tables 31, 32 and 33 for the paired serum, plasma, and urine samples. Patient infected status is positive when at least one of the two FDA authorized (under an EUA) paired specimen types (serum and urine) is positive as determined by the comparator test, and patient infected status is negative when none of the two FDA authorized (under an EUA) paired specimen types (serum and urine) is positive as determined by the comparator test. For plasma, serum
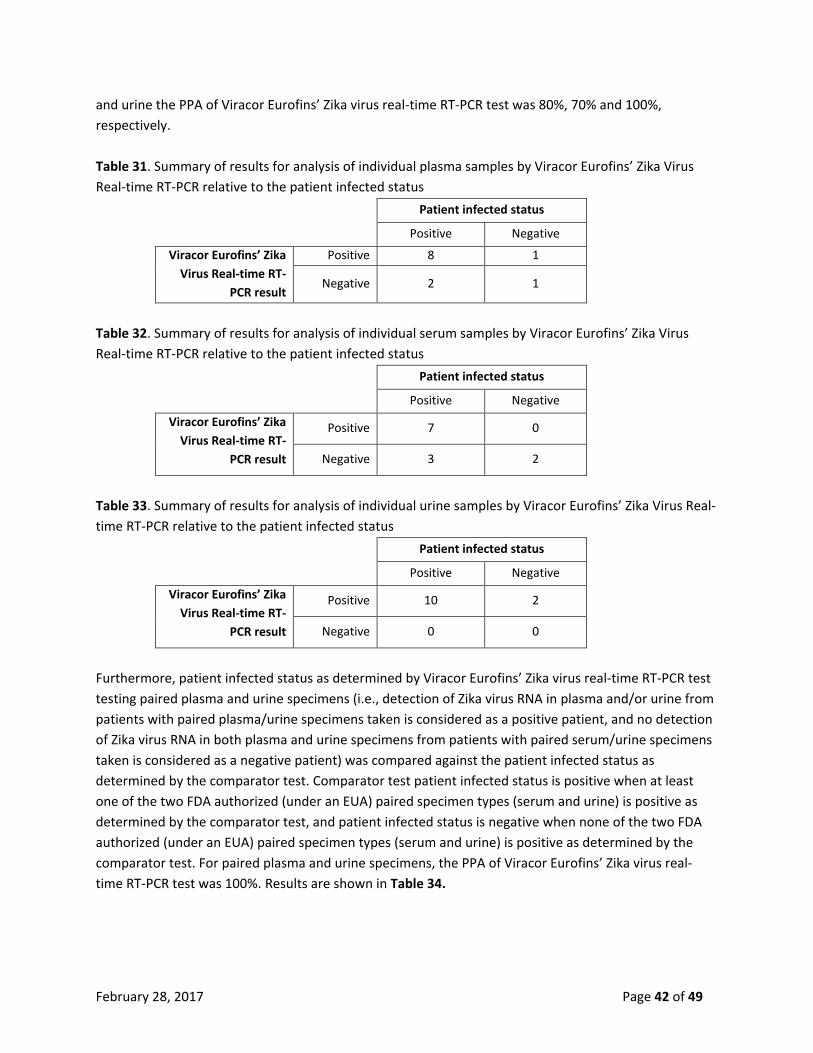
February 28, 2017 Page 42 of 49
and urine the PPA of Viracor Eurofins’ Zika virus real-time RT-PCR test was 80%, 70% and 100%, respectively. Table 31. Summary of results for analysis of individual plasma samples by Viracor Eurofins’ Zika Virus Real-time RT-PCR relative to the patient infected status
Patient infected status
Positive Negative
Viracor Eurofins’ Zika Virus Real-time RT-
PCR result
Positive 8 1
Negative 2 1
Table 32. Summary of results for analysis of individual serum samples by Viracor Eurofins’ Zika Virus Real-time RT-PCR relative to the patient infected status
Patient infected status
Positive Negative
Viracor Eurofins’ Zika Virus Real-time RT-
PCR result
Positive 7 0
Negative 3 2
Table 33. Summary of results for analysis of individual urine samples by Viracor Eurofins’ Zika Virus Real-time RT-PCR relative to the patient infected status
Patient infected status
Positive Negative
Viracor Eurofins’ Zika Virus Real-time RT-
PCR result
Positive 10 2
Negative 0 0
Furthermore, patient infected status as determined by Viracor Eurofins’ Zika virus real-time RT-PCR test testing paired plasma and urine specimens (i.e., detection of Zika virus RNA in plasma and/or urine from patients with paired plasma/urine specimens taken is considered as a positive patient, and no detection of Zika virus RNA in both plasma and urine specimens from patients with paired serum/urine specimens taken is considered as a negative patient) was compared against the patient infected status as determined by the comparator test. Comparator test patient infected status is positive when at least one of the two FDA authorized (under an EUA) paired specimen types (serum and urine) is positive as determined by the comparator test, and patient infected status is negative when none of the two FDA authorized (under an EUA) paired specimen types (serum and urine) is positive as determined by the comparator test. For paired plasma and urine specimens, the PPA of Viracor Eurofins’ Zika virus real-time RT-PCR test was 100%. Results are shown in Table 34.

February 28, 2017 Page 43 of 49
Table 34. Summary of results for comparison of patient the infected status as determined by Viracor Eurofins’ Zika virus real-time RT-PCR test (plasma and urine) against the patient infected status as determined by the comparator test
Patient infected status – Comparator test
Positive Negative
Patient infected status - Viracor Eurofins’ Zika Virus Real-time
RT-PCR Plasma/urine result
Positive 10 2
Negative 0 0
Patient infected status as determined by Viracor Eurofins’ Zika virus real-time RT-PCR test testing paired serum and urine specimens (i.e., detection of Zika virus RNA in serum and/or urine from patients with paired serum/urine specimens taken is considered as a positive patient, and no detection of Zika virus RNA in both serum and urine specimens from patients with paired serum/urine specimens taken is considered as a negative patient) was also compared against the patient infected status as determined by the comparator test (as described previously). For paired serum and urine specimens, the PPA of Viracor Eurofins’ Zika virus real-time RT-PCR test was 100%. Results are shown in Table 35. Table 35. Summary of results for comparison of patient the infected status as determined by Viracor Eurofins’ Zika virus real-time RT-PCR test (serum and urine) against the patient infected status as determined by the comparator test
Patient infected status – Comparator test
Positive Negative
Patient infected status - Viracor Eurofins’ Zika Virus Real-time
RT-PCR Serum/urine result
Positive 10 1
Negative 0 1
Summary of Clinical Performance:
For all natural clinical specimen testing data combined, the performance of Viracor Eurofins’ Zika Virus Real-time RT-PCR against the comparator test under an EUA stratified by specimen type is presented in Tables 36, 37, and 38.

February 28, 2017 Page 44 of 49
Table 36. Summary performance of Viracor Eurofins’ Zika Virus Real-time RT-PCR against the comparator test (under an EUA – Plasma)
Plasma - Specimen Category Viracor Eurofins’ Zika Virus Real-time RT-PCR
Number Tested Zika RNA Positive Zika RNA Negative Natural specimens collected from Zika presumptive-positive patients (as determined by clinical presentation) in Colombia, South America
11 3 7
Natural specimens collected from asymptomatic individuals in Colombia, South America that were considered to be at risk since they were geographically located in mosquito infested areas where Zika is currently endemic
30 17 13
Patient matched/paired specimens collected from Colombia and the Dominican Republic from Zika confirmed-positive patients as determined by clinical presentations and diagnostic testing completed by the repository
12 9 3
Expected Zika RNA negative specimens that were collected from asymptomatic normal donors in the United States
20 0 20
Positive Percent Agreement 92.0% (23/25); 95% CI (72.5% - 98.6%) Negative Percent Agreement 87.5% (42/48); 95% CI (74.1% - 94.8%)
Table 37. Summary performance of Viracor Eurofins’ Zika Virus Real-time RT-PCR against the comparator test (under an EUA – Serum)
Serum - Specimen Category Viracor Eurofins’ Zika Virus Real-time RT-PCR
Number Tested Zika RNA Positive Zika RNA Negative Natural specimens collected from Zika presumptive-positive patients (as determined by clinical presentation) in Colombia, South America
32 3 29
Natural specimens collected from Zika presumptive-positive patients (as determined by clinical presentation) in the United States
2 2 0
Natural specimens collected from asymptomatic individuals in Colombia, South America that were considered to be at risk since they were geographically located in mosquito infested areas where Zika is currently endemic
NA NA NA
Patient matched/paired specimens collected from Colombia and the Dominican Republic from Zika confirmed-positive patients as determined by clinical presentations and diagnostic testing completed by the repository
12 7 5
Expected Zika RNA negative specimens that were collected from asymptomatic normal donors in the United States.
21 0 21
Positive Percent Agreement 100% (12/12); 95% CI (69.8% - 100) Negative Percent Agreement 96.4% (54/56); 95% CI (86.6% - 99.4%)

February 28, 2017 Page 45 of 49
Table 38. Summary performance of Viracor Eurofins’ Zika Virus Real-time RT-PCR against the comparator test (under an EUA – Urine)
Urine - Specimen Category Viracor Eurofins’ Zika Virus Real-time RT-PCR
Number Tested Zika RNA Positive Zika RNA Negative Natural specimens collected from Zika presumptive-positive patients (as determined by clinical presentation) in Colombia, South America
NA NA NA
Natural specimens collected from Zika presumptive-positive patients (as determined by clinical presentation) in the United States
1 1 0
Natural specimens collected from asymptomatic individuals in Colombia, South America that were considered to be at risk since they were geographically located in mosquito infested areas where Zika is currently endemic
NA NA NA
Patient matched/paired specimens collected from Colombia and the Dominican Republic from Zika confirmed-positive patients as determined by clinical presentations and diagnostic testing completed by the repository
12 11 1
Expected Zika RNA negative specimens that were collected from asymptomatic normal donors in the United States.
30 0 30
Positive Percent Agreement 100% (11/11); 95% CI (67.9% - 100%) Negative Percent Agreement 93.9% (31/33); 95% CI (78.4% - 98.9%)
For all natural and contrived clinical specimen testing data combined, the performance of Viracor Eurofins’ Zika Virus Real-time RT-PCR against the comparator test (under an EUA) or the expected results, stratified by specimen type is presented in Tables 39, 40, and 41.
Table 39. Summary performance of Viracor Eurofins’ Zika Virus Real-time RT-PCR against the comparator test (under an EUA) results or expected results - Plasma
Plasma - Specimen Category
Viracor Eurofins’ Zika Virus Real-time RT-PCR
Number Tested Zika RNA Positive
Zika RNA Negative
Natural specimens collected from Zika presumptive-positive patients (as determined by clinical presentation) in Colombia, South America
11 3 7
Natural specimens collected from asymptomatic individuals in Colombia, South America that were considered to be at risk since they were geographically located in mosquito infested areas where Zika is currently endemic
30 17 13
Patient matched/paired specimens collected from Colombia and the Dominican Republic from Zika confirmed-positive patients as determined by clinical presentations and diagnostic testing completed by the repository
12 9 3
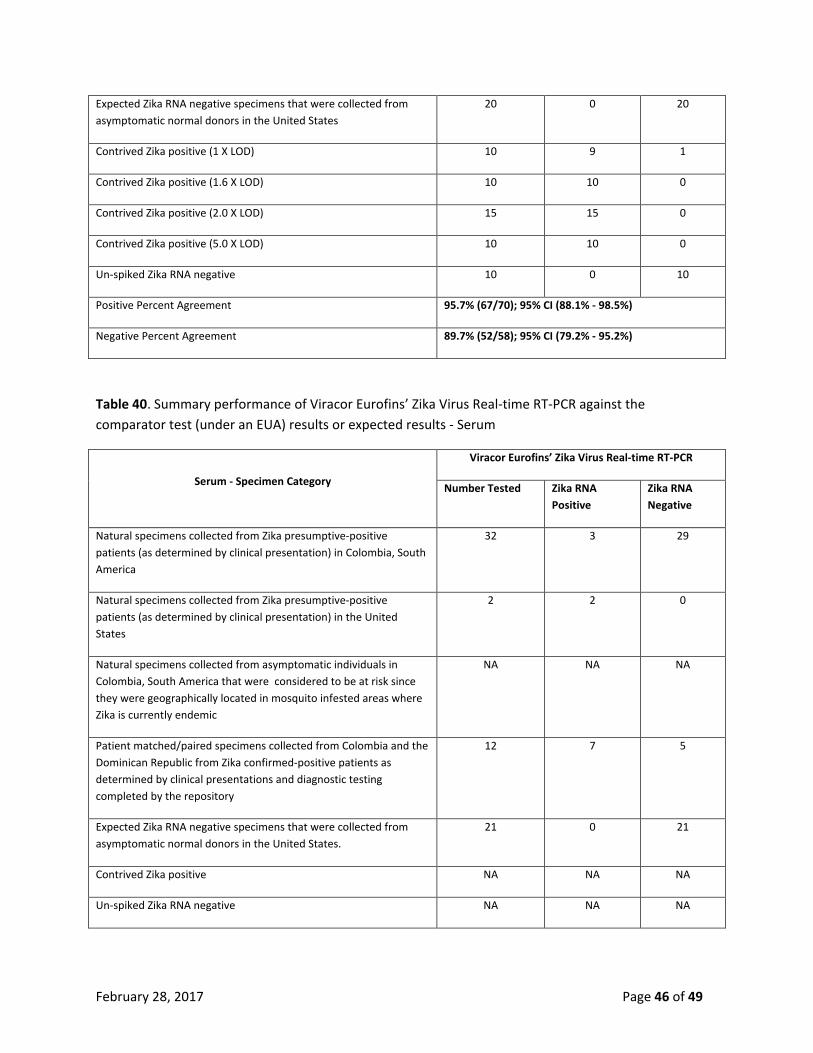
February 28, 2017 Page 46 of 49
Expected Zika RNA negative specimens that were collected from asymptomatic normal donors in the United States
20 0 20
Contrived Zika positive (1 X LOD) 10 9 1
Contrived Zika positive (1.6 X LOD) 10 10 0
Contrived Zika positive (2.0 X LOD) 15 15 0
Contrived Zika positive (5.0 X LOD) 10 10 0
Un-spiked Zika RNA negative 10 0 10
Positive Percent Agreement 95.7% (67/70); 95% CI (88.1% - 98.5%)
Negative Percent Agreement 89.7% (52/58); 95% CI (79.2% - 95.2%)
Table 40. Summary performance of Viracor Eurofins’ Zika Virus Real-time RT-PCR against the comparator test (under an EUA) results or expected results - Serum
Serum - Specimen Category
Viracor Eurofins’ Zika Virus Real-time RT-PCR
Number Tested Zika RNA Positive
Zika RNA Negative
Natural specimens collected from Zika presumptive-positive patients (as determined by clinical presentation) in Colombia, South America
32 3 29
Natural specimens collected from Zika presumptive-positive patients (as determined by clinical presentation) in the United States
2 2 0
Natural specimens collected from asymptomatic individuals in Colombia, South America that were considered to be at risk since they were geographically located in mosquito infested areas where Zika is currently endemic
NA NA NA
Patient matched/paired specimens collected from Colombia and the Dominican Republic from Zika confirmed-positive patients as determined by clinical presentations and diagnostic testing completed by the repository
12 7 5
Expected Zika RNA negative specimens that were collected from asymptomatic normal donors in the United States.
21 0 21
Contrived Zika positive NA NA NA
Un-spiked Zika RNA negative NA NA NA

February 28, 2017 Page 47 of 49
Positive Percent Agreement 100% (12/12); 95% CI (69.8% - 100)
Negative Percent Agreement 96.4% (54/56); 95% CI (86.6% - 99.4%)
Table 41. Summary performance of Viracor Eurofins’ Zika Virus Real-time RT-PCR against the comparator test (under an EUA) results or expected results – Urine
Urine - Specimen Category
Viracor Eurofins’ Zika Virus Real-time RT-PCR
Number Tested Zika RNA Positive
Zika RNA Negative
Natural specimens collected from Zika presumptive-positive patients (as determined by clinical presentation) in Colombia, South America
NA NA NA
Natural specimens collected from Zika presumptive-positive patients (as determined by clinical presentation) in the United States
1 1 0
Natural specimens collected from asymptomatic individuals in Colombia, South America that were considered to be at risk since they were geographically located in mosquito infested areas where Zika is currently endemic
NA NA NA
Patient matched/paired specimens collected from Colombia and the Dominican Republic from Zika confirmed-positive patients as determined by clinical presentations and diagnostic testing completed by the repository
12 11 1
Contrived Zika positive (1.5 X LOD) 30 30 0
Expected Zika RNA negative specimens that were collected from asymptomatic normal donors in the United States.
30 0 30
Contrived Zika positive (2.0 X LOD) 13 13 0
Contrived Zika positive (10.0 X LOD) 7 7 0
Un-spiked Zika RNA negative 10 0 10
Positive Percent Agreement 100% (61/61); 95% CI (94.1% - 100%)
Negative Percent Agreement 95.3% (41/43); 95% CI (84.5% - 98.7%)

February 28, 2017 Page 48 of 49
References Balm et al. A Diagnostic Polymerase Chain Reaction Assay for Zika Virus. J Med Virol 2012; 54:1501-1505. Basic Method Validation, 3rd Edition. JO.Westgard, Ph.D. Westgard QC, Inc. Madison, WI. 2008. Burd EM. Validation of laboratory-developed molecular tests for infectious diseases. Clin Microbiol Rev. 2010 Jul;23(3):550-76. Burns MJ, Nixon GJ, Foy CA, Harris N. Standardization of data from real-time quantitative PCR methods – evaluation of outliers and comparison of calibration curves. BMC Biotechnology. 2005 Dec 7;5:31. Calvet, G. et al. Detection and sequencing of Zika virus from amniotic fluid of fetuses with microcephaly in Brazil: a case study. The Lancet Infectious Diseases 2016. Published online February 17, 2016 http://dx.doi.org/10.1016/S1473-3099 (16)00095-5 CLIA Interpretive Guidelines 493.1252. CDC, DHHS. CLIA Current Regulations.01/24/2004. www.cdc.gov/clia/regs/toc.aspx EP-2A2. Evaluation of Precision Performance of Quantitative Measurement Methods. Approved Guideline.Clinical and Laboratory Standards Institute. EP6-AEvaluation of the Linearity of Qualitative Measurement Procedures: A Statistical Approach. Approved Guideline Clinical and Laboratory Standards Institute. EP14-A2.Vol 25 No.4.replaces EP14-A vol.21 No.3. Evaluation of Matrix effect; Approved Guideline – Second edition.Clinical and Laboratory Standards Institute. EP17-A Vol 24 No 34, replaces EP17-P. Protocols for Determination of Limits of Detection and Limits of Quantitation; Approved Guideline.Clinical and Laboratory Standards Institute. EP21-A, Vol 23 No.20, replaces EP21-P. Estimation of Total Analytical Error for Clinical Laboratory Methods; Approved Guideline.Clinical and Laboratory Standards Institute. EP25-A Evaluation of Stability of In Vitro Diagnostic Reagents. Approved Guideline.Clinical and Laboratory Standards Institute. Espy MJ, Uhl JR, Sloan LM, Buckwalter SP, Jones MF, Vetter EA, Yao JD, Wengenack NL, Rosenblatt JE, Cockerill FR 3rd, Smith TF. Real-time PCR in clinical microbiology: applications for routine laboratory testing. Clin Microbiol Rev. 2006 Jan;19(1):165-256. Review. Erratum in: Clin Microbiol Rev.2006Jul;19(3):595 Faye, Oumar, et al. "Quantitative Real-Time PCR Detection of Zika Virus And Evaluation With Field-Caught Mosquitoes." Virology Journal 10.(2013): 311. MEDLINE with Full Text. Web. 5 Apr. 2016.
February 28, 2017 Page 49 of 49
Guidance for Industry; Bioanalytical Method Validation. U.S. Department of Health and Human Services, FDA Food and Drug Administration, Center for Drug Evaluation and Research Center for Veterinary Medicine, May 2001 BP. Lanciotti et al. Genetic and Serologic Properties of Zika Virus Associated with an Epidemic, Yap State, Micronesia, 2007. Emerg Infect Dis 2008; (14)8:1232-1239. MM3-A2, Vol. 26 No.8. Molecular Diagnostics Methods for Infectious Diseases; Approved Guideline, Second Edition, Clinical and Laboratory Standards Institute. Wayne, PA. 2006. MM06-A2, Vol. 30 No.22. Quantitative Molecular Diagnostics Methods for Infectious Diseases; Approved Guideline, Second Edition, Clinical and Laboratory Standards Institute. Wayne, PA. 2010 Molecular Microbiology: Diagnostic Principles and Practice, Second Edition. David H. Persing. ASM Press. 2011. Washington, D.C. Motulsky HM and Brown RE. Detecting outliers when fitting data with nonlinear regression-a new method based on robust nonlinear regression and the false discovery rate. BMC Bioinformatics 2006, 7:123. Submission guidelines for nucleic acid amplification tests for infectious agents, State of New York Department of Health. February, 2011. TaqMan is a registered trademark of Roche Molecular Systems, Inc.