zen and the search for high-redshift galaxies
TRANSCRIPT
www.elsevier.com/locate/newastrev
New Astronomy Reviews 50 (2006) 70–74
ZEN and the search for high-redshift galaxies
Jon Willis a,*, Frederic Courbin b, Jean-Paul Kneib c, Dante Minniti d
a Department of Physics and Astronomy, University of Victoria, Victoria, Canada V8P 5C2b Laboratoire d’Astrophysique, Ecole Polytechnique Federale de Lausanne (EPFL), Observatoire, 1290 Sauverny, Switzerland
c Laboratoire d’Astrophysique de Marseille, Traverse du Siphon, B.P.8 13376 Marseille Cedex 12, Franced Departamento de Astronomıa y Astrofısica, Pontificia Universidad Catolica de Chile, Vicuna Mackenna 4860 Casilla 306, Santiago 22, Chile
Available online 4 January 2006
Abstract
We present the ZEN (z equals nine) survey: a deep, narrow J-band search for proto-galactic Ly a emission at redshifts z � 9. In thefirst phase of the survey, dubbed ZEN1, we combine an exceptionally deep image of the Hubble Deep Field South, obtained using anarrow-band filter centred on the wavelength 1.187 lm, with existing deep, broad band images covering optical to near infrared wave-lengths. Candidate z � 9 Ly a-emitting galaxies display a significant narrow-band excess relative to the Js-band that are undetected atoptical wavelengths. We detect no sources consistent with this criterion to the 90% point source flux limit of the NB image,FNB = 3.28 · 10�18 ergs s�1 cm�2. The survey selection function indicates that we have sampled a volume of approximately340 h�3 Mpc3 to a Ly a emission luminosity of 1043 h�2 ergs s�1. When compared to the predicted properties of z � 9 galaxies basedupon no evolution of observed z � 6 Ly a-emitting galaxies, the �volume shortfall� of the current survey, i.e., the volume required todetect this putative population, is a factor of at least 8–10. We also discuss continuing narrow J-band imaging surveys that will reducethe volume shortfall factor to the point where the no-evolution prediction from z � 6 is probed in a meaningful manner.� 2005 Elsevier B.V. All rights reserved.
Contents
1. Introduction . . . . . . . . . . . . . . . . . . . . . . . . . . . . . . . . . . . . . . . . . . . . . . . . . . . . . . . . . . . . . . . . . . . . . . . . . . . . . . . 702. Constructing the experiment: going deep and rejecting interlopers . . . . . . . . . . . . . . . . . . . . . . . . . . . . . . . . . . . . . . . . . 713. The ZEN1 data set . . . . . . . . . . . . . . . . . . . . . . . . . . . . . . . . . . . . . . . . . . . . . . . . . . . . . . . . . . . . . . . . . . . . . . . . . . 724. A ZEN paradox: what is the significance of detecting no Ly a emitters at z = 9?. . . . . . . . . . . . . . . . . . . . . . . . . . . . . . . 735. Continuing efforts . . . . . . . . . . . . . . . . . . . . . . . . . . . . . . . . . . . . . . . . . . . . . . . . . . . . . . . . . . . . . . . . . . . . . . . . . . . 74
References . . . . . . . . . . . . . . . . . . . . . . . . . . . . . . . . . . . . . . . . . . . . . . . . . . . . . . . . . . . . . . . . . . . . . . . . . . . . . . . . 74
1. Introduction
Determining during which epoch and under what condi-tions the first galaxies and stars formed is a key goal of gal-axy evolution studies. Observations of distant galaxies
1387-6473/$ - see front matter � 2005 Elsevier B.V. All rights reserved.
doi:10.1016/j.newar.2005.11.029
* Corresponding author.E-mail address: [email protected] (J. Willis).
currently extend to redshifts z � 7 (Kneib et al., 2004). Inaddition, a number of studies have demonstrated thatselecting faint galaxies displaying i � z colours characteris-tic of the Lyman Break signature at redshifts z � 6 is aneffective method to identify significant (>10 galaxies) sam-ples of high-redshift galaxies (Bouwens et al., 2004a; Dick-inson et al., 2004; Stanway et al., 2004; Malhotra et al.,2005). The addition of a narrow-band (NB) filter to suchbroad band observations robustly identifies Ly a-emitting
J. Willis et al. / New Astronomy Reviews 50 (2006) 70–74 71
galaxies at redshifts that place the emission line in the filterbandpass (Hu et al., 2004; Kodaira et al., 2003; Rhoadset al., 2004). In the case of Ly a-emitting galaxies atz > 5, NB filters can exploit narrow spectral regions freefrom bright night sky emission lines. The main benefit ofthis approach is that the spectral location and profile ofthe Ly a emission line can be identified in a relativelystraightforward manner – leading to samples of galaxieswith very high spectral completeness (e.g., Hu et al.,2004). The main drawback of course is that the narrowspectral region viewed by the NB filter greatly reducesthe volume sampled compared to a broad band survey ofcomparable depth and field.
The properties of individual z � 6 galaxies now providerelatively detailed constraints upon the very earliest epochsof star formation (SF) – pointing to an earlier epoch ofvery intense SF just beyond the redshift limit of current,optical surveys. Two of the brightest galaxies known atz � 6 have been detected at 3.6 and 4.5 lm using the Spit-
zer infrared space telescope (Eyles et al., 2005). Analysis ofthe rest-frame UV to optical spectral energy distribution(SED) of these galaxies indicates the presence of stellarpopulations of masses �3 · 1010 Mx and ages �400 Myr.Within the cosmological model assumed in these proceed-ings (see below) the epoch corresponding to the onset ofSF in these galaxies is z � 9.
A key factor that determines the visibility of Ly a-emit-ting galaxies at z > 6 is the ionisation state of the inter-galactic medium (IGM). As the neutral fraction ofuniformly distributed hydrogen gas in the Universeincreases beyond 1 part in 105 the associated optical depthat rest wavelengths blueward of 1216 A exceeds unity(Gunn and Peterson, 1965). Observations of ‘‘darkregions’’ – consistent with an IGM optical depth s > 1 –in redshift z > 6.2 QSOs suggest that we may be witnessingthe onset of neutrality in the IGM at these redshifts (Beckeret al., 2001; Fan et al., 2002). As the IGM neutral fractionincreases further, the absorption profile develops a strongdamping wing extending to rest wavelengths k > 1216 A –potentially absorbing the Ly a feature in high-redshift SFgalaxies. However, the observation of a Ly a-emitting gal-axy at redshift z = 6.56 (Hu et al., 2002) is not inconsistentwith observation of a possible GP effect in lower redshiftQSOs. Haiman (2002), Santos (2004) and Barton et al.(2004) describe the ionising effect of a star forming galaxyembedded in a neutral IGM and note that, depending uponthe exact assumptions made regarding the mass and starformation properties of the source and the physical condi-tions present in the IGM, the galaxy will form a local HIIregion of sufficient size to permit transmission of a partiallyattenuated Ly a line and associated continuum.
The visibility of Ly a emission in high-redshift SF galax-ies is important as, although z > 7 galaxies will appear ascontinuum drop-out sources, e.g., z � J (Bouwens et al.,2004b), confirming the redshift of such faint candidates(H > 27) on the basis of continuum features observed indeep near infrared (NIR) spectra is challenging to the point
of being impractical. Therefore, a NIR NB survey for Ly a-emitting galaxies at z > 7 has the potential to detect Ly a-bright galaxies for which obtaining a spectroscopic redshiftvia follow-up NIR spectroscopy using 8–10 m class tele-scopes is a realistic goal. In the remainder of these proceed-ings we describe a dedicated search for high-redshift starforming galaxies, employing an extension of broad andnarrow-band selection techniques applied at optical wave-lengths to the NIR wavelength regime. In particular wefocus upon the application of a narrow J-band filter cen-tred at k = 1.187 lm to detect the signature of Ly a-emit-ting galaxies located about a redshift z = 8.8 (termedz � 9 in the following text).
In these proceedings we adopt a cosmological modeldescribed by the parameters XM = 0.3, XK = 0.7, h = H0/100 km s�1 Mpc�1 = 0.7. All magnitudes are quoted usingthe AB system.
2. Constructing the experiment: going deep and rejecting
interlopers
We assume that a redshift z � 9 Ly a-emitting galaxywill display a significant narrow-band excess relative tothe J-band, in addition to displaying a continuum breakconsistent with almost complete attenuation of photonsat rest-frame k < 1216A. In order to generate an effectivesurvey for such sources certain additional factors must beconsidered:
(1) NIR continuum imaging data must achieve a limitingdepth of AB P 25.5. The brightest emission line gal-axies confirmed at redshifts z = 5.7 display AB mag-nitudes z 0 � 24.5 � 25 (Hu et al., 2004). Theadditional distance modulus between a redshiftz = 5.7 and z = 8.8 results in a relative dimming termof 1 magnitude.
(2) Optical imaging data must reach a limiting depth typ-ically 1.5 magnitudes fainter than NIR data. Early-type galaxies located at redshifts z � 2 can generatea spectral discontinuity between optical and NIRcontinuum bands of amplitude D � 1.5 mag. (Stan-way et al., 2004). Failure to identify the continuumbreak directly could lead to the misidentification ofredshifted [OII]3727 emission in such sources as can-didate z � 9 Ly a emission.
Following these considerations the Hubble Deep FieldSouth (HDFS; Williams et al., 2000) Wide field PlanetaryCamera 2 (WFPC2) apex pointing (a = 22h32m55s.64,d = � 60�33 00500.01, J2000) was selected as the target fieldin order to exploit the high quality of optical to NIR imagedata available for the field. In particular, the combinationof HDFS WFPC2 and Very Large Telescope (VLT) Infra-red Spectrometer And Array Camera (ISAAC; Moorwood,1997) observations of the field provide images to typicaldepths AB = 28 and AB = 26 in optical and NIR band-passes, respectively (Labbe et al., 2003).
NB106 Js
J
NB119
1 1.1 1.2 1.30
0.2
0.4
0.6
0.8
1
8 109
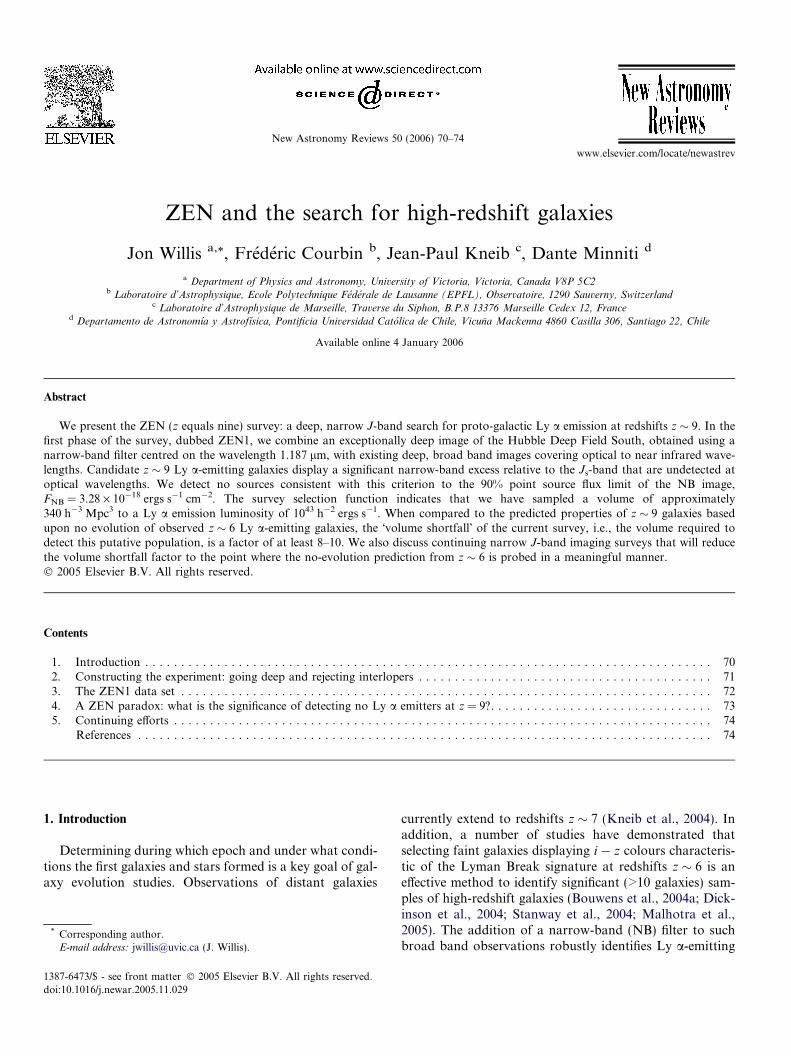
Fig. 1. Left panel: Filter response functions for the NB106, NB119, J, and Js VLT/ISAAC filters. Right panel: The central wavelength locations of theNB106 and NB119 filters (vertical red dotted line) are compared to the NIR night sky emission spectrum (solid back line; Rousselot et al., 2000) andthe atmospheric transmission measured at two epochs to illustrate temporal transmission variations (red and blue solid lines). (For interpretation of thereferences to colour in this figure legend, the reader is referred to the web version of this article.)
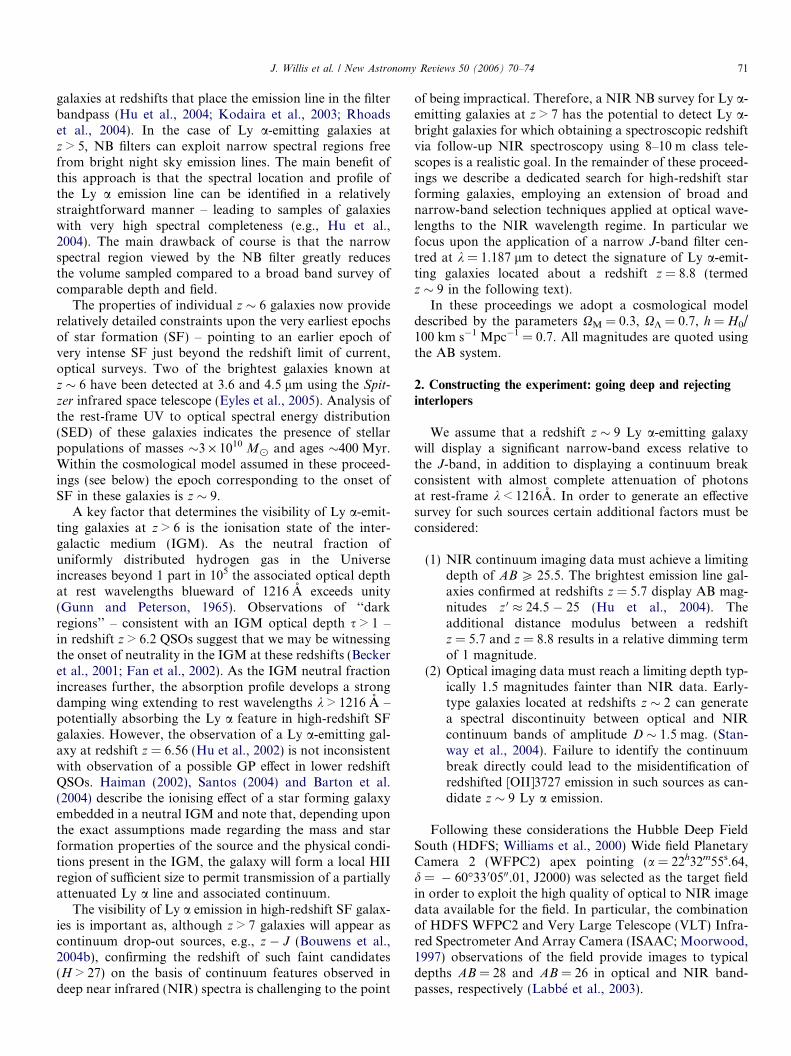
Fig. 2. Greyscale NB119 image of the HDFS. The image orientation isNorth up and East left. The field geometry of the NIR broad band data setis identical to the NB image. The field geometry of the HST WFPC2 fieldis indicated. Note that the Planetary Camera (shaded region) data doesnot contribute to the final catalogue. The total field area contributing tothe NB excess catalogue is 4 arcmin2. The location of the two NB excesssources identified from the catalogue are indicated (see text for details).
72 J. Willis et al. / New Astronomy Reviews 50 (2006) 70–74
VLT/ISAAC further provides a suitable combinationof narrow and broad band filters for the ZEN survey:the NB119 filter (see Fig. 1) is well placed within theresponse of both the J and Js NIR bandpasses. In addi-tion the NB119 filter samples a spectral region free fromboth strong atmospheric emission and absorption fea-tures. The NB119 filter has an effective width of 89.5 Aand is centred at a wavelength 1.187 lm (correspondingto the location of Ly a emission at a redshift z = 8.76).While the NB106 filter samples similarly ‘‘dark’’ skyregions, it is not well placed with respect to the broadJ-band filters – complicating the estimation of NB excessfor individual sources.
3. The ZEN1 data set
Narrow J-band observations of the HDFS WFPC2pointing were obtained during ESO Period 69 (May 19thto September 17th 2002) employing the VLT/ISAAC facil-ity. The total NB data set consists of 420 · 300 s spatiallydithered exposures. Imaging data were: (a) corrected forvarying pixel response using twilight sky exposures; (b)sky-subtracted having masked array regions containingobjects detected above a specified ADU level; (c) correctedfor both high- and low-frequency spatial artefacts; (d)shifted to a common pixel scale and coadded using a suit-able pixel weighting and rejection algorithm. The applieddata reduction techniques are broadly similar to thosedescribed in Labbe et al. (2003) for deep JsH Ks observa-tions of the HDFS. A more complete description of theNB data reduction and analysis can be found in Willisand Courbin (2005) (the reduced image is shown in Fig. 2.)
The photometric zero point for the NB119 image wascomputed employing 500 diameter aperture photometry of47 bright, isolated sources common to the NB119 andFIRES Js-band images. Assuming that the SEDs of thesecalibration sources display no strong discontinuities, theJs-band flux density provides an accurate estimate of the
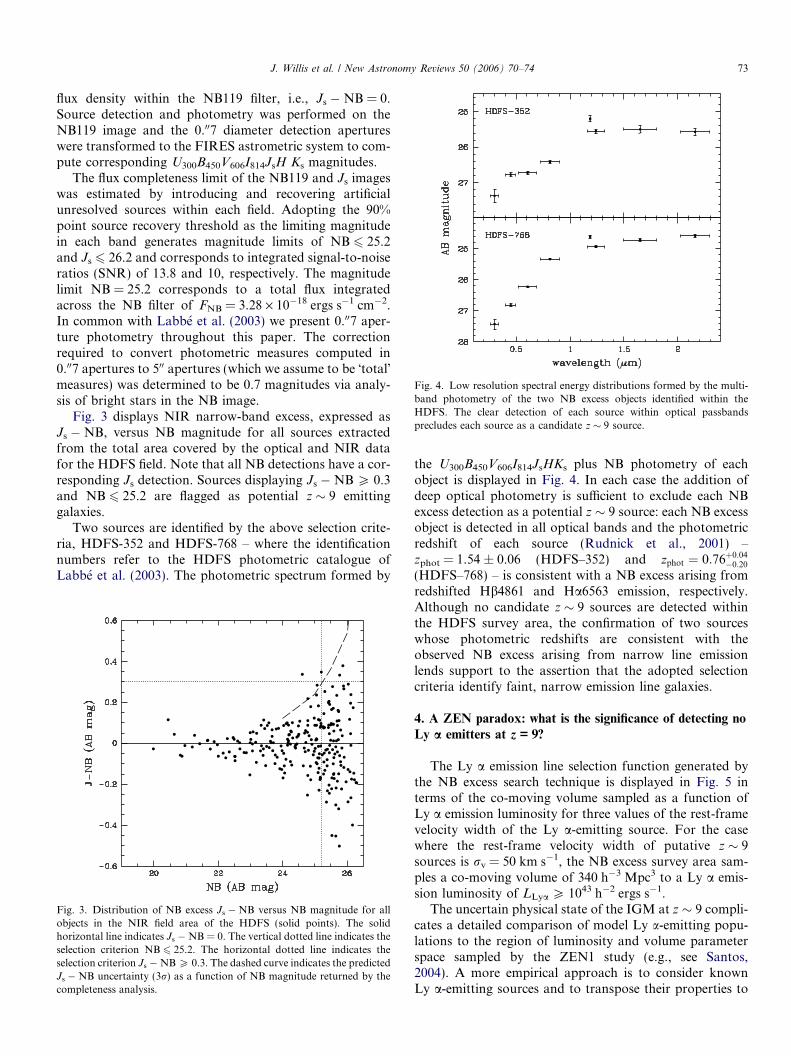
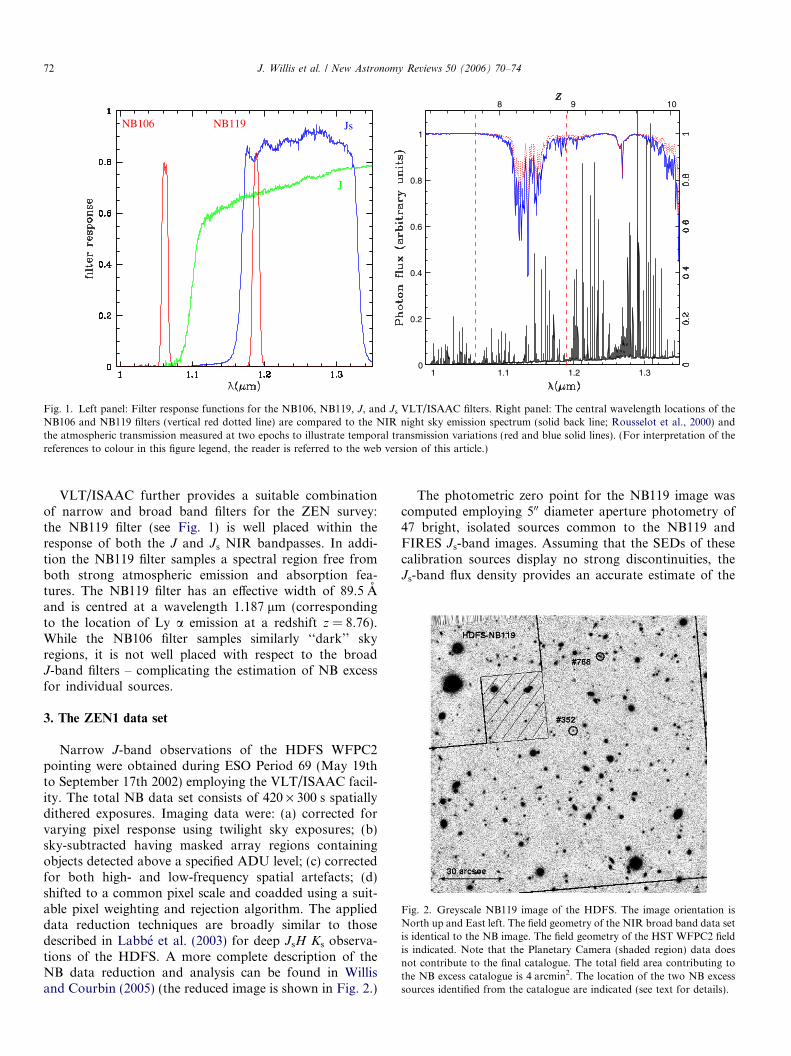
Fig. 4. Low resolution spectral energy distributions formed by the multi-band photometry of the two NB excess objects identified within theHDFS. The clear detection of each source within optical passbandsprecludes each source as a candidate z � 9 source.
J. Willis et al. / New Astronomy Reviews 50 (2006) 70–74 73
flux density within the NB119 filter, i.e., Js � NB = 0.Source detection and photometry was performed on theNB119 image and the 0.007 diameter detection apertureswere transformed to the FIRES astrometric system to com-pute corresponding U300B450V606I814JsH Ks magnitudes.
The flux completeness limit of the NB119 and Js imageswas estimated by introducing and recovering artificialunresolved sources within each field. Adopting the 90%point source recovery threshold as the limiting magnitudein each band generates magnitude limits of NB 6 25.2and Js 6 26.2 and corresponds to integrated signal-to-noiseratios (SNR) of 13.8 and 10, respectively. The magnitudelimit NB = 25.2 corresponds to a total flux integratedacross the NB filter of FNB = 3.28 · 10�18 ergs s�1 cm�2.In common with Labbe et al. (2003) we present 0.007 aper-ture photometry throughout this paper. The correctionrequired to convert photometric measures computed in0.007 apertures to 500 apertures (which we assume to be �total�measures) was determined to be 0.7 magnitudes via analy-sis of bright stars in the NB image.
Fig. 3 displays NIR narrow-band excess, expressed asJs � NB, versus NB magnitude for all sources extractedfrom the total area covered by the optical and NIR datafor the HDFS field. Note that all NB detections have a cor-responding Js detection. Sources displaying Js � NB P 0.3and NB 6 25.2 are flagged as potential z � 9 emittinggalaxies.
Two sources are identified by the above selection crite-ria, HDFS-352 and HDFS-768 – where the identificationnumbers refer to the HDFS photometric catalogue ofLabbe et al. (2003). The photometric spectrum formed by
Fig. 3. Distribution of NB excess Js � NB versus NB magnitude for allobjects in the NIR field area of the HDFS (solid points). The solidhorizontal line indicates Js � NB = 0. The vertical dotted line indicates theselection criterion NB 6 25.2. The horizontal dotted line indicates theselection criterion Js � NBP 0.3. The dashed curve indicates the predictedJs � NB uncertainty (3r) as a function of NB magnitude returned by thecompleteness analysis.
the U300B450V606I814JsHKs plus NB photometry of eachobject is displayed in Fig. 4. In each case the addition ofdeep optical photometry is sufficient to exclude each NBexcess detection as a potential z � 9 source: each NB excessobject is detected in all optical bands and the photometricredshift of each source (Rudnick et al., 2001) –zphot = 1.54 ± 0.06 (HDFS–352) and zphot ¼ 0:76þ0:04
�0:20
(HDFS–768) – is consistent with a NB excess arising fromredshifted Hb4861 and Ha6563 emission, respectively.Although no candidate z � 9 sources are detected withinthe HDFS survey area, the confirmation of two sourceswhose photometric redshifts are consistent with theobserved NB excess arising from narrow line emissionlends support to the assertion that the adopted selectioncriteria identify faint, narrow emission line galaxies.
4. A ZEN paradox: what is the significance of detecting no
Ly a emitters at z = 9?
The Ly a emission line selection function generated bythe NB excess search technique is displayed in Fig. 5 interms of the co-moving volume sampled as a function ofLy a emission luminosity for three values of the rest-framevelocity width of the Ly a-emitting source. For the casewhere the rest-frame velocity width of putative z � 9sources is rv = 50 km s�1, the NB excess survey area sam-ples a co-moving volume of 340 h�3 Mpc3 to a Ly a emis-sion luminosity of LLya P 1043 h�2 ergs s�1.
The uncertain physical state of the IGM at z � 9 compli-cates a detailed comparison of model Ly a-emitting popu-lations to the region of luminosity and volume parameterspace sampled by the ZEN1 study (e.g., see Santos,2004). A more empirical approach is to consider knownLy a-emitting sources and to transpose their properties to
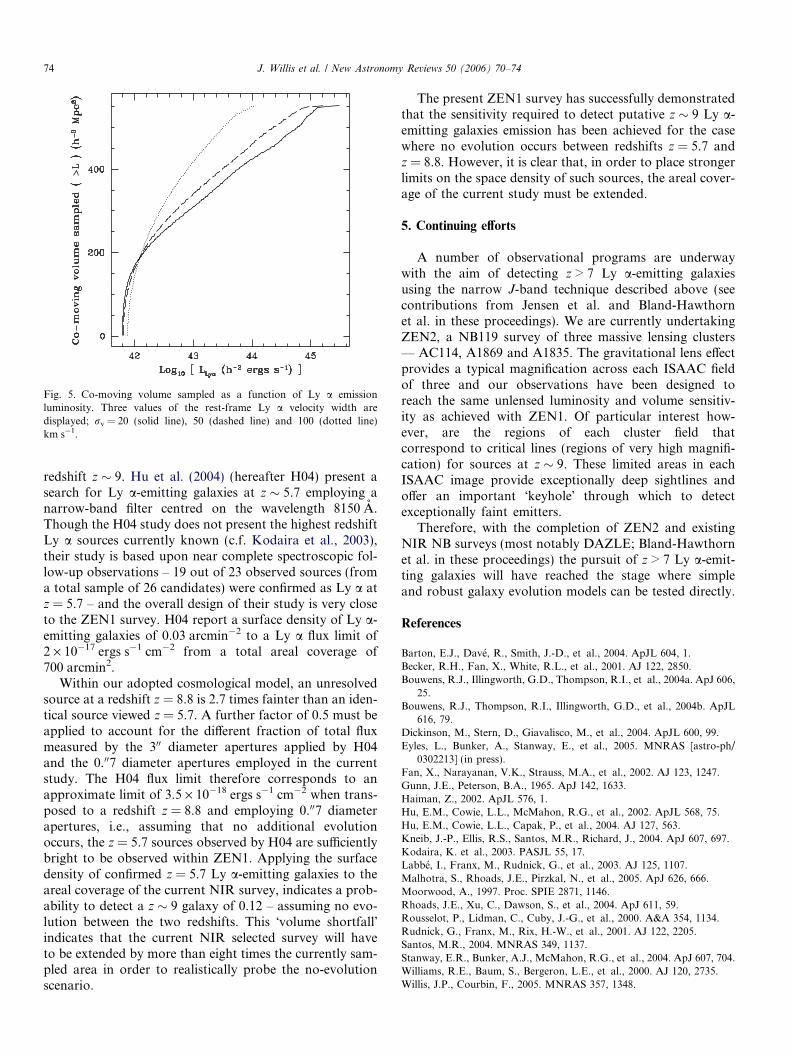
Fig. 5. Co-moving volume sampled as a function of Ly a emissionluminosity. Three values of the rest-frame Ly a velocity width aredisplayed; rv = 20 (solid line), 50 (dashed line) and 100 (dotted line)km s�1.
74 J. Willis et al. / New Astronomy Reviews 50 (2006) 70–74
redshift z � 9. Hu et al. (2004) (hereafter H04) present asearch for Ly a-emitting galaxies at z � 5.7 employing anarrow-band filter centred on the wavelength 8150 A.Though the H04 study does not present the highest redshiftLy a sources currently known (c.f. Kodaira et al., 2003),their study is based upon near complete spectroscopic fol-low-up observations – 19 out of 23 observed sources (froma total sample of 26 candidates) were confirmed as Ly a atz = 5.7 – and the overall design of their study is very closeto the ZEN1 survey. H04 report a surface density of Ly a-emitting galaxies of 0.03 arcmin�2 to a Ly a flux limit of2 · 10�17 ergs s�1 cm�2 from a total areal coverage of700 arcmin2.
Within our adopted cosmological model, an unresolvedsource at a redshift z = 8.8 is 2.7 times fainter than an iden-tical source viewed z = 5.7. A further factor of 0.5 must beapplied to account for the different fraction of total fluxmeasured by the 300 diameter apertures applied by H04and the 0.007 diameter apertures employed in the currentstudy. The H04 flux limit therefore corresponds to anapproximate limit of 3.5 · 10�18 ergs s�1 cm�2 when trans-posed to a redshift z = 8.8 and employing 0.007 diameterapertures, i.e., assuming that no additional evolutionoccurs, the z = 5.7 sources observed by H04 are sufficientlybright to be observed within ZEN1. Applying the surfacedensity of confirmed z = 5.7 Ly a-emitting galaxies to theareal coverage of the current NIR survey, indicates a prob-ability to detect a z � 9 galaxy of 0.12 – assuming no evo-lution between the two redshifts. This �volume shortfall�indicates that the current NIR selected survey will haveto be extended by more than eight times the currently sam-pled area in order to realistically probe the no-evolutionscenario.
The present ZEN1 survey has successfully demonstratedthat the sensitivity required to detect putative z � 9 Ly a-emitting galaxies emission has been achieved for the casewhere no evolution occurs between redshifts z = 5.7 andz = 8.8. However, it is clear that, in order to place strongerlimits on the space density of such sources, the areal cover-age of the current study must be extended.
5. Continuing efforts
A number of observational programs are underwaywith the aim of detecting z > 7 Ly a-emitting galaxiesusing the narrow J-band technique described above (seecontributions from Jensen et al. and Bland-Hawthornet al. in these proceedings). We are currently undertakingZEN2, a NB119 survey of three massive lensing clusters— AC114, A1869 and A1835. The gravitational lens effectprovides a typical magnification across each ISAAC fieldof three and our observations have been designed toreach the same unlensed luminosity and volume sensitiv-ity as achieved with ZEN1. Of particular interest how-ever, are the regions of each cluster field thatcorrespond to critical lines (regions of very high magnifi-cation) for sources at z � 9. These limited areas in eachISAAC image provide exceptionally deep sightlines andoffer an important �keyhole� through which to detectexceptionally faint emitters.
Therefore, with the completion of ZEN2 and existingNIR NB surveys (most notably DAZLE; Bland-Hawthornet al. in these proceedings) the pursuit of z > 7 Ly a-emit-ting galaxies will have reached the stage where simpleand robust galaxy evolution models can be tested directly.
References
Barton, E.J., Dave, R., Smith, J.-D., et al., 2004. ApJL 604, 1.Becker, R.H., Fan, X., White, R.L., et al., 2001. AJ 122, 2850.Bouwens, R.J., Illingworth, G.D., Thompson, R.I., et al., 2004a. ApJ 606,
25.Bouwens, R.J., Thompson, R.I., Illingworth, G.D., et al., 2004b. ApJL
616, 79.Dickinson, M., Stern, D., Giavalisco, M., et al., 2004. ApJL 600, 99.Eyles, L., Bunker, A., Stanway, E., et al., 2005. MNRAS [astro-ph/
0302213] (in press).Fan, X., Narayanan, V.K., Strauss, M.A., et al., 2002. AJ 123, 1247.Gunn, J.E., Peterson, B.A., 1965. ApJ 142, 1633.Haiman, Z., 2002. ApJL 576, 1.Hu, E.M., Cowie, L.L., McMahon, R.G., et al., 2002. ApJL 568, 75.Hu, E.M., Cowie, L.L., Capak, P., et al., 2004. AJ 127, 563.Kneib, J.-P., Ellis, R.S., Santos, M.R., Richard, J., 2004. ApJ 607, 697.Kodaira, K. et al., 2003. PASJL 55, 17.Labbe, I., Franx, M., Rudnick, G., et al., 2003. AJ 125, 1107.Malhotra, S., Rhoads, J.E., Pirzkal, N., et al., 2005. ApJ 626, 666.Moorwood, A., 1997. Proc. SPIE 2871, 1146.Rhoads, J.E., Xu, C., Dawson, S., et al., 2004. ApJ 611, 59.Rousselot, P., Lidman, C., Cuby, J.-G., et al., 2000. A&A 354, 1134.Rudnick, G., Franx, M., Rix, H.-W., et al., 2001. AJ 122, 2205.Santos, M.R., 2004. MNRAS 349, 1137.Stanway, E.R., Bunker, A.J., McMahon, R.G., et al., 2004. ApJ 607, 704.Williams, R.E., Baum, S., Bergeron, L.E., et al., 2000. AJ 120, 2735.Willis, J.P., Courbin, F., 2005. MNRAS 357, 1348.