zebrafish embryonic stromal trunk (zest) cells support
TRANSCRIPT
Zebrafish embryonic stromal trunk (ZEST) cells support hematopoietic stemand progenitor cell (HSPC) proliferation, survival, and differentiation
Clyde Campbella, Tammy Sua, Ryan P. Laua, Arpit Shahb, Payton C. Laurieb, Brenda Avalosb,Julian Aggiob, Elena Harrisb, David Travera, and David L. Stachurab
aDepartment of Cellular and Molecular Medicine, University of California at San Diego School of Medicine, La Jolla, California, USA; bDepartmentof Biological Sciences, California State University, Chico, California, USA
(Received 1 June 2015; revised 11 August 2015; accepted 3 September 2015)
Forward genetic screens in zebrafish have been used to identify genes essential for the gener-ation of primitive blood and the emergence of hematopoietic stem cells (HSCs), but have notelucidated the genes essential for hematopoietic stem and progenitor cell (HSPC) proliferationand differentiation because of the lack of methodologies to functionally assess these processes.We previously described techniques used to test the developmental potential of HSPCs byculturing them on zebrafish kidney stromal (ZKS) cells, derived from the main site of hema-topoiesis in the adult teleost. Here we describe an additional primary stromal cell line we referto as zebrafish embryonic stromal trunk (ZEST) cells, derived from tissue surrounding theembryonic dorsal aorta, the site of HSC emergence in developing fish. ZEST cells encouragedHSPC differentiation toward the myeloid, lymphoid, and erythroid pathways when assessedby morphologic and quantitative reverse transcription polymerase chain reaction analyses.Additionally, ZEST cells significantly expanded the number of cultured HSPCs in vitro, indi-cating that these stromal cells are supportive of both HSPC proliferation and multilineage dif-ferentiation. Examination of ZEST cells indicates that they express numerous cytokines andNotch ligands and possess endothelial characteristics. Further characterization of ZEST cellsshould prove to be invaluable in understanding the complex signaling cascades instigated bythe embryonic hematopoietic niche required to expand and differentiate HSPCs. Elucidatingthese processes and identifying possibilities for the modulation of these molecular pathwaysshould allow the in vitro expansion of HSPCs for a multitude of therapeutic uses. Copyright! 2015 ISEH - International Society for Experimental Hematology. Published by Elsevier Inc.
Hematopoiesis, the production of blood, is an essentialcellular process that occurs constantly over an organism’slife span and is a paradigm for stem cell biology [1]. Thisprocess starts with the hematopoietic stem cell (HSC), atissue-specific stem cell that has the ability to both self-renew and differentiate into more developmentallyrestricted progenitor cells that subsequently mature intothe full repertoire of blood and immune cells. Importantly,this process is tightly regulated; perturbations in the prolif-eration and differentiation of hematopoietic stem andprogenitor cells (HSPCs) can lead to a host of hematopoi-etic disorders, including anemia, thrombocytopenia, leuko-penia, and leukemia.
Zebrafish provide an excellent vertebrate model systemto study hematopoiesis [2–4]. Their external development,high fecundity, and optical transparency have made theminstrumental in the visualization of de novo HSC produc-tion [5,6] and leukocyte behavior [7–10]. Zebrafish possessthe full repertoire of mammalian blood cells including aninnate [11–13] and adaptive immune system [14,15], andthe genetic control of hematopoiesis is well conservedamong fish and mammals. Importantly, zebrafish are usefulin permitting large-scale forward genetic mutagenesis[16–18] and drug screens [19–23]. Their utility as ascreening platform has resulted in identifying genesrequired for primitive hematopoiesis [18,24] and drugsnow in clinical trials to treat hematologic disorders [25].
Because the zebrafish is a relatively new model system,functional means of identifying bona fide HSPCs have beenlacking. Clonal lines of zebrafish have only recently beendeveloped [26–28], making transplantation of HSPCs into
Offprint requests to: David L. Stachura, Department of Biological Sci-ences, California State University, 400 West 1st Street, Chico, CA95929-0515; E-mail: [email protected]; [email protected]
0301-472X/Copyright ! 2015 ISEH - International Society for Experimental Hematology. Published by Elsevier Inc.http://dx.doi.org/10.1016/j.exphem.2015.09.001
Experimental Hematology 2015;43:1047–1061
immune-matched hosts problematic. Although advanceshave been made in HSPC transplantation [29], these exper-iments are still technically difficult. To approach this prob-lem in another way, we developed the first in vitro assays totest HSPC function. Our original approach was to createzebrafish kidney stroma (ZKS) cells [30], a primary cellline derived from the main site of hematopoiesis in theadult zebrafish. The development of this line allowed usto identify cytokines produced by ZKS cells, permittingthe development of clonal methylcellulose assays to testHSPC development [31]. As mammalian cytokines exhibitlittle cross-reactivity with paralogous zebrafish receptors[32], the identification and validation of zebrafish cytokineshave proven invaluable for understanding signaling mole-cules involved in teleost hematopoiesis.
To identify more cytokines responsible for zebrafishHSPC proliferation and differentiation, we isolated tissuenear the embryonic dorsal aorta, the first site of definitivehematopoiesis and HSC formation in the zebrafish,culturing these cells in vitro. We have termed these primarycells zebrafish embryonic stromal trunk (ZEST) cells.Although ZEST cells do not express hematopoietic markers,they do encourage the proliferation and differentiationof HSPCs in culture. We also illustrate that ZEST cellscan easily be used for quantification of multilineage HSPCs.Like their adult hematopoietic stromal counterparts, ZESTcells produce hematopoietic-supportive cytokines; furthercharacterization of their transcriptome should elucidatemolecules important for the generation, expansion, anddifferentiation of vertebrate HSCs and HSPCs.
Methods
Zebrafish stocks and embryosZebrafish were mated, staged, raised, and maintained in accor-dance with University of California, San Diego, and CaliforniaState University, Chico, IACUC guidelines. AB* wild-type (wt)fish and the transgenic tg(–6.0itga2b:eGFP) [33] (referred tothroughout as cd41:GFP) and tg(–3.5ubi:EGFP) [34] (referredto throughout as ubi:GFP) were used.
Generation of ZEST cellsZebrafish embryonal stromal trunk cells were isolated by surgi-cally removing the dorsal aorta and surrounding tissue from thetrunk of 48-hour postfertilization (hpf) AB* wt fish. At 48 hpf,approximately 200 embryos were rinsed three times in sterileembryo medium in 10-cm2 plates. By use of an Olympus SZ51dissecting microscope, the tissue posterior to the yolk tube exten-sion was removed and discarded. Then, the tissue anterior to theyolk tube extension (including the large yolk ball) was removedwith a sterile scalpel and discarded (Fig. 1A, hatched area denotesthe region that was isolated). The remaining trunk of the embryowas finely minced with a surgical scalpel and grown in zebrafishtissue culture medium [30] in a 12.5-cm2 tissue culture flask.The mincing of the tissue destroyed most of the ventral yolktube extension, but any that remained in the culture medium did
not attach to the surface of the flasks. The cells that attached tothe surface of the flask were grown at 32!C in 5% CO2 until cellsachieved $80% confluence. Cells were trypsinized for 5 min andexpanded onto 75-cm2 tissue culture flasks.
Morphologic characterization of ZEST cellsZebrafish embryonic stromal trunk cells were grown on glasscoverslips in culture medium in 24-well tissue culture plates.When cells reached 100% confluence, they were fixed and stainedwith May–Gr€unwald–Giemsa and visualized by microscopy [35].
Reverse transcription polymerase chain reaction analysis ofZEST cellsRNAwas isolated from ZEST cells using a QIAGEN RNeasy kit,and cDNAwas generated using the BioRad iScript cDNA synthe-sis kit. Primers, product sizes, and annealing temperatures used forthe reverse transcription polymerase chain reaction (RT-PCR)characterization of ZEST cells are listed in Table 1.
Isolation and enumeration of whole kidney marrow cellsWhole kidney marrow (WKM) cells were isolated as describedpreviously [35] and enumerated by trypan blue exclusion andcounting with a hemocytometer. WKM cells were added on topof ZEST cells when the stroma was 80% confluent; ZEST cellsdivide slowly and do not need to be mitotically arrested with mito-mycin C or irradiation. To enumerate WKM cells after culture onZEST cells, the stroma was gently rinsed to remove the WKMfrom the cell monolayers. Cells were concentrated by centrifuga-tion at 300g, cytospun onto slides, stained with May–Gr€unwald–Giemsa, and visualized by microscopy.
Quantitative RT-PCR analysis of cultured hematopoietic cellsRNA was isolated from cultured ZEST cells using a QIAGENRNeasy kit, and cDNA was generated using a BioRad iScriptcDNA synthesis kit. Quantitative RT-PCR (qRT-PCR)was per-formed on an Eppendorf Mastercycler with BioRad SsoAdvancedUniversal SYBR Green Supermix. Primers have been previouslydescribed [38,39]. Fold expression was determined by the DDCtmethod, using ef1a as a reference gene and kidney as a referencetissue.
Fluorescence-activated cell sortingWhole kidney marrow from ubi:GFP fish was isolated and resus-pended in phosphate-buffered saline with 0.9% fetal bovineserum. Lymphoid and precursor fractions were sorted andanalyzed on a FACSAriaII (BD Biosciences) by using their uniqueforward and side scatter characteristics [40]. Sytox red (Life Tech-nologies) was used as a cell viability stain.
Proliferation of HSPCs on ZEST cells by flow cytometryLymphoid and precursor fractions from WKM were isolated andstained with the membrane dye PKH-26 (Sigma) and platedonto monolayers of ZEST cells. PKH-26 fluorescence wasanalyzed before the cells were plated and after 5 days in cultureon an LSRII flow cytometer (BD Biosciences). Proliferationcalculations were performed with FloJo software Version 9 (Trees-tar), specifically using the Proliferation Platform, which was usedto determine the percentage of WKM cells that divided, as well asthe culture’s division index. The division index is defined as theaverage number of cell divisions a WKM cell underwent overthe course of the experiment.
1048 C. Campbell et al./ Experimental Hematology 2015;43:1047–1061
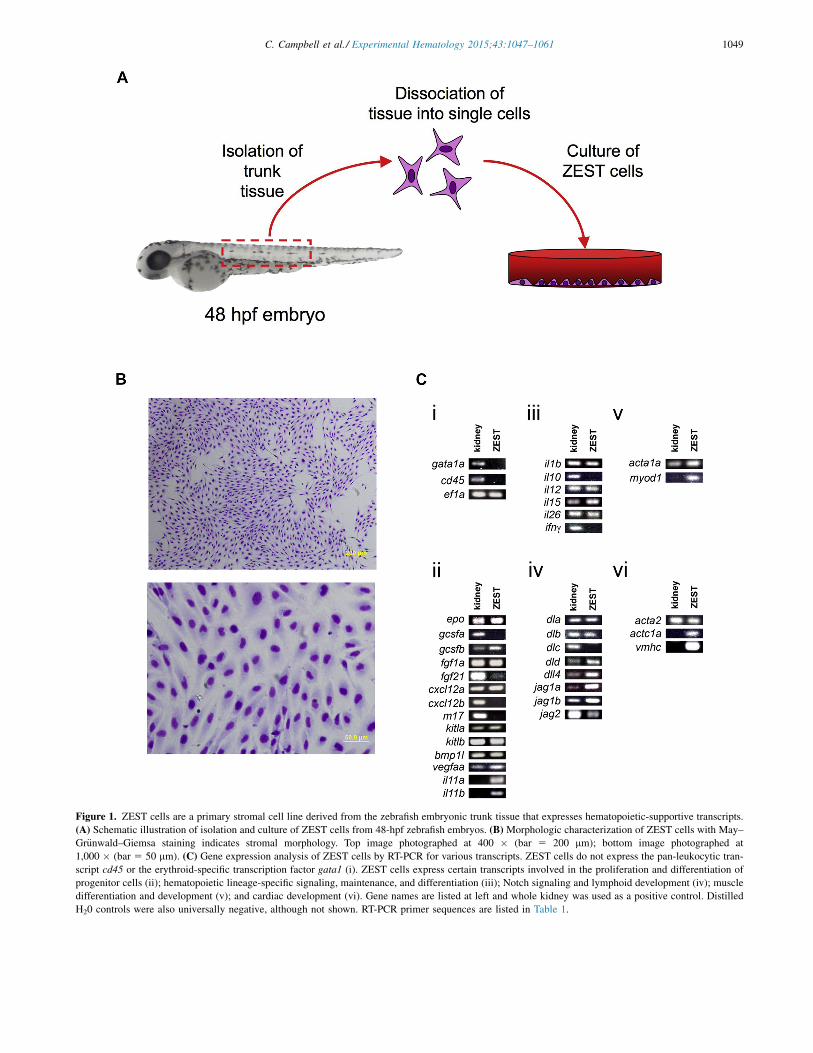
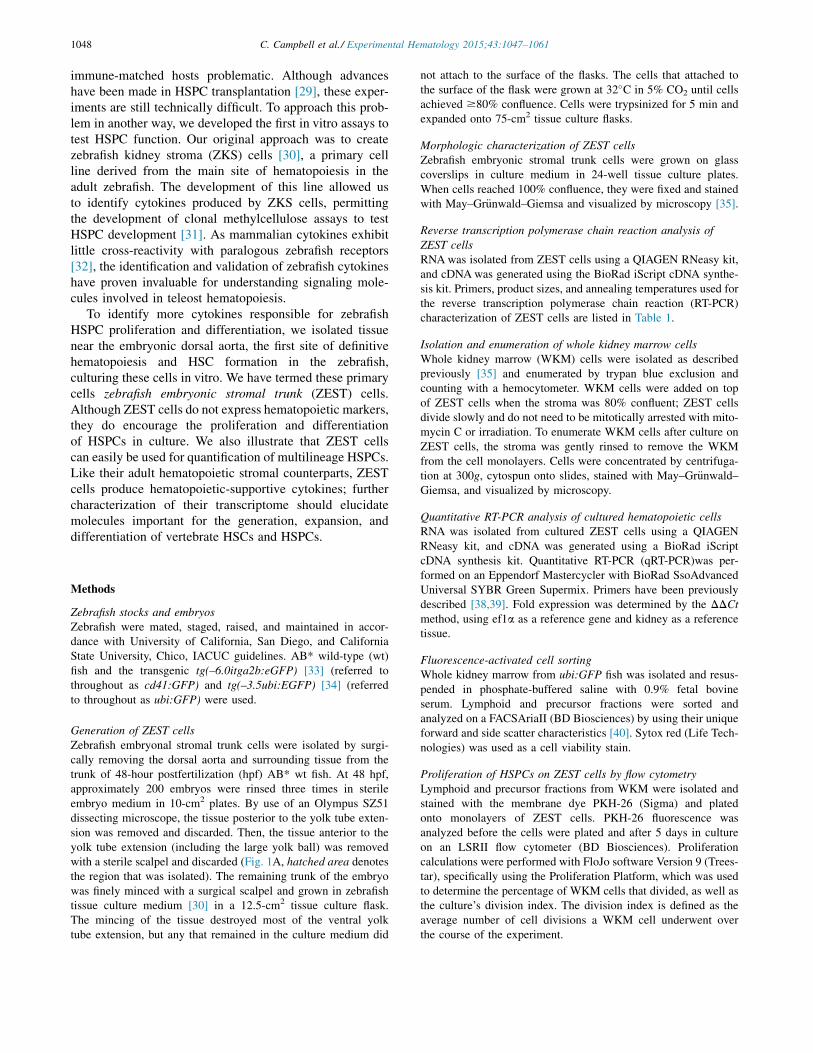
Figure 1. ZEST cells are a primary stromal cell line derived from the zebrafish embryonic trunk tissue that expresses hematopoietic-supportive transcripts.(A) Schematic illustration of isolation and culture of ZEST cells from 48-hpf zebrafish embryos. (B) Morphologic characterization of ZEST cells with May–Gr€unwald–Giemsa staining indicates stromal morphology. Top image photographed at 400 " (bar 5 200 mm); bottom image photographed at1,000 " (bar 5 50 mm). (C) Gene expression analysis of ZEST cells by RT-PCR for various transcripts. ZEST cells do not express the pan-leukocytic tran-script cd45 or the erythroid-specific transcription factor gata1 (i). ZEST cells express certain transcripts involved in the proliferation and differentiation ofprogenitor cells (ii); hematopoietic lineage-specific signaling, maintenance, and differentiation (iii); Notch signaling and lymphoid development (iv); muscledifferentiation and development (v); and cardiac development (vi). Gene names are listed at left and whole kidney was used as a positive control. DistilledH20 controls were also universally negative, although not shown. RT-PCR primer sequences are listed in Table 1.
1049C. Campbell et al./ Experimental Hematology 2015;43:1047–1061

Tab
le1.
Primer
sets
used
forRT-PCRcharacterization
ofZESTcells.Genenames
arelisted
atfarleft,follow
edby
thegene’sdescription
Gene
Definition
Forwardprim
er(5
0 –30)
Reverse
prim
er(5
0 –30)
Ann
ealing
Tem
perature
(!C)
Product
Size
(bp)
acta1a
Dan
iorerioactin,
a1a,skeletal
muscle
GAAAAGAGCTACGAGCTTCC
GTAAGTGGTCTCGTGAATGC
50!
129
acta2
Dan
iorerioactin,
a2,
smoo
thmuscle
TGGATCTGGACTGTGTA
AGG
ACTA
TCTTTCTGCCCCATTC
50!
121
actc1a
Dan
iorerioactin,
a,cardiacmuscle1a
TGCTGTCTTTCCCTCTATTG
GAGTGAGGATACCCCTCTTG
50!
116
bmp1
l[30]
Dan
ioreriobo
nemorph
ogenic
protein1,
like
GGATGGATATTGGAGGAAAG
CTTTGTTCGGTCTGTA
ATCG
50!
230
gcsfa(csf3)
[36]
Dan
ioreriocolony
stim
ulatingfactor
3a,
granulocytecolony
stim
ulatingfactor
AACTACATCTGAACCTCCTG
GACTGCTCTTCTGATGTCTG
55!
165
cxcl12a
Danio
reriochem
okine(C–X
–Cmotif)
12a,
stromal
cell-derived
factor
1aCGCCATTCATGCACCGATTTC
GGTGGGCTGTCAGATTTCCTTGTC
50!
297
cxcl12
bDan
ioreriochem
okine(C–X
–Cmotif)
12b,
stromal
cell-derived
factor
1bCGCCTTCTGGAGCCCAGAGA
AGAGATTCTCCGCTGTCCTCC
50!
291
dla[30]
Dan
ioreriodA
ACGACGATTTGAGTATGACG
GGGATTGGCACTTTA
TATCC
50!
186
dlb[30]
Dan
ioreriodB
TTCCGTGTTTAATGATTTGG
CACTCCACAGAAACTCTTGC
50!
158
dlc[30]
Dan
ioreriodC
TGGTGGACTA
CAATCTGAGC
ACCTCAGTAGCAAACACACG
50!
169
dld
Dan
ioreriodD
AACCCAGACCGTCTGATCAGT
CCGGGTTTGTCGCAAAAGCCA
50!
308
dll4_E
NREF_3
0[30]
Dan
ioreriod-like
4CTCTTTCAGCACACCAATTC
TGAACATCCTGAGACCATTC
50!
189
ef1a
(eef1a
1l1)
[37]
Dan
iorerioeukaryotic
translation
elon
gation
factor
1alpha1,
like
1GAGAAGTTCGAGAAGGAAGC
CGTAGTATTTGCTGGTCTCG
55!
123
epo[30]
Dan
iorerioerythropoietin
ACTTGTA
AGGACGATTGCAG
TATCTGTAATGAGCCGATGG
55!
156
fgf1
[30]
Dan
ioreriofibroblastgrow
thfactor
1ATACTGCGCATAAAAGCAAC
AGTGGTTTTCCTCCATCTTC
50!
154
fgf21[30]
Dan
ioreriofibroblastgrow
thfactor
21CGGTGGTGTATGTA
TGTTCC
GTAGCTGCACTCTGGATGAC
50!
203
gata1a
[37]
Dan
iorerioGATA
bindingprotein1a
TGAATGTGTGAATTGTGGTG
ATTGCGTCTCCATAGTGTTG
55!
650
gcsfb(csf3b
)[36]
Dan
ioreriocolony-stimulatingfactor
3b,
granulocytecolony-stimulatingfactor
bGGAGCTCTGCGCACCCAACA
GGCAGGGCTCCAGCAGCTTC
55!
184
ifnɣ
Dan
ioreriointerferon
,g1-2
TACATAATGCACACCCCATC
TCCTTTGTAGCTTCATCCAC
55!
158
il-1b
Dan
ioreriointerleukin-1,
bTCCACATCTCGTACTCAAGG
CAGCTCGAAGTTAATGATGC
50!
227
il-10[30]
Dan
ioreriointerleukin-10
ATGAATCCAACGATGACTTG
TCTTGCATTTCACCATATCC
50!
222
il-11a
[30]
Dan
ioreriointerleukin-11a
GACAAGCTGAGCAATCAGAC
GGAGCTGAGAAAGAGTAGGC
50!
172
il-11b
[30]
Dan
ioreriointerleukin-11b
TTGAACATTCGCTATCATCC
GAGTAATCGTTCCCCAATTC
50!
166
il-12a
[30]
Dan
ioreriointerleukin-12a
GTGAGTCTGCTGAAGGAGTG
AGTGACATCATTTCCTGTGC
50!
167
il-15[30]
Dan
ioreriointerleukin-15,like
CCAAGTCCACAATTACATGC
TCTTTGTAGAGCTCGCAGAC
55!
166
il-26[30]
Dan
ioreriointerleukin-26
TGAAAAGATGTGGGATGAAC
ACTGATCCACAGCAAAACAC
55!
214
jag1
a[30]
Dan
ioreriojagged
1aTGATTGGTGGATACTTCTGC
AATCCATTGAGTGTGTCCTG
55!
238
jag1
b[30]
Dan
ioreriojagged
1bCTGTGAGCCATCTTCTTCAG
AGCAAAGGAACCAGGTAGTC
55!
213
jag2
[30]
Dan
ioreriojagged
2AATGACTGTGTGAGCAATCC
GTCATTGACCAGATCCACAC
50!
174
kitlga
[30]
Dan
ioreriokitligand
aGGATTCAATGCTTGACTTTG
TGTACTATGTTGCGCTGATG
50!
205
kitlgb
Dan
ioreriokitligand
bGGCAACCAGTCCACCAATAAG
CACTTTTCCCTTCTGTAGTGGC
50!
135
m17
Dan
iorerioil-6
subfam
ilycytokine
M17
CTTGATTGCCGTTCAGTTAG
TGACCGGAGATTGTAGACAC
50!
210
myod1
Dan
ioreriomyogenicdifferentiation1
ATGGCATGATGGATTTTATG
TTTATTATTCCGTGCGTCAG
50!
107
cd45
(ptprc)[37]
Dan
iorerioproteintyrosine
phosphatase,
receptor
type,C
AGTTCCTGAAATGGAAAAGC
GCACAGAAAAGTCCAGTACG
55!
140
vegfaa
Dan
ioreriovascular
endo
thelialgrow
thfactor
Aa
GAAACGTCACTATGGAGGTG
TTCTTTGCTTTGACTTCTGC
50!
121
vmhc
Dan
iorerioventricularmyo
sinheavychain
TTA
TTGACTTTGGCATGGAC
AAAATGAGACTCTGGCTTCC
50!
203
50!
1050 C. Campbell et al./ Experimental Hematology 2015;43:1047–1061
Differentiation analysis of HSPCs on ZESTSingle cd41:GFPþ cells from the lymphoid fraction were platedinto individual wells of 96-well plates on top of ZEST mono-layers. Iron supplement (1:1,000, Sigma) and carp serum(1:1,000) was added to each well to encourage erythroid develop-ment [30]. After 5 days of cd41:GFPþ cell growth and differenti-ation, RNA was collected from the wells and processed forqRT-PCR. Quantitative RT-PCR was performed with primers spe-cific for erythroid, myeloid, and lymphoid differentiation. As acontrol, plates with ZEST cells only were also processed andanalyzed for the same transcripts. Individual cell sorting intoplates was verified by microscopic analysis of fluorescent cells.
Sequence alignment and read countsAll sequenced libraries were processed using the following proce-dures. First, copy-duplicates were removed from sequenced reads.Two sequenced reads are considered to be copy-duplicates,the product of PCR, if they are exact copies of each other. Onlyone copy of exact copy-duplicates was kept. Quality control wascarried out using FastQC tool (http://www.bioinformatics.babraham.ac.uk/projects/fastqc/). Because base sequence content(count of A, C, G, T along the reads’ lengths) in the first 10 bp ofthe reads exhibited an abnormal distribution, the first 10 baseswere trimmed. Another measurement, namely, k-mer content ofFastQC, revealed high k-mer enrichment at the end of reads. Ak-mer is a short k-base-long substring of a read. Various adaptertrimming tools were used to reduce adapter contamination, and,hence, k-mer enrichment; however, none of the tools used signifi-cantly affected the results of k-mer enrichment. Therefore, to reducek-mer enrichment, we used our own method to trim unaligned endsof the reads (potential adapter contamination). First, the sequencedreads were aligned, using the bowtie-2 tool [41], to cDNA se-quences of zebrafish (zv9, Ensembl), using localmode of alignmentand loose parameters that allowed mapping with low alignmentscore, with the following options: –score-min L,–2,0.3, –L 18,–ma 3, –mp 1,1, –np 1, –rdg 50,50, –rfg 50,50, –ignore-quals, –k1. Then our own script processed the results of the alignments andextracted only high-quality aligned consecutive stretches of thereads, requiring the minimum length of this stretch to be at least32 bp. In other words, loosely mapped ends of the sequenced readswere trimmed. Next, trimmed reads were mapped to cDNAsequences using bowtie-2 with default parameters and option–k23 (this option finds at most 23 alignments for each read). Becausethere are at most 22 different transcripts for each gene in zebrafish,this option ensured the finding of alignments to different genes. Onthe basis of the mapping results, only uniquely mapped reads werekept for further analysis. A read was considered unique if it wasmapped to the transcripts of the same gene only; in other words,if a read was mapped to transcripts of two different genes with thesame best alignment score, then the read was considered to beambiguous and was discarded from further analysis. Our own scriptwas used together with the Ensembl GTF filewith the gene informa-tion of zebrafish to count the total number of unique readsmapped toeach gene. These read counts were used to identify differentiallyexpressed genes in each sample compared with the negative control,ZF4 cells.
Normalization and differential expressionTo identify differentially expressed genes in ZEST/ZKS samplescompared with the ZF4 cells, the Microsoft online tool FDR
Calculator based on Fisher’s exact test was used: http://research.microsoft.com/en-us/um/redmond/projects/mscompbio/falsediscoveryrate/default.aspx. The tool calculated the p and q values foreach gene from the read counts. A gene was considered to bedifferentially expressed in a sample ZEST/ZKS compared withZF4 if its p value was #0.05, and its q value was #0.1, and themaximum read count in two samples was at least 10. To identifyoverexpressed genes in a sample ZEST/ZKS compared with ZF4,we used RPKM (reads perkilo base per million mapped reads),calculated as the read count multiplied by 109 and divided bythe gene’s length and total read count per sample. The gene’slength was calculated as the sum of lengths of all its exons. Ifthe RPKM value for a differentially expressed gene in a sampleZEST/ZKS was greater than the RPKM value for the same genein sample ZF4, then the gene was considered overexpressed.
To compare overexpressed genes in ZEST and ZKS samples,only overexpressed genes with a twofold change in a ZEST/ZKS sample compared with ZF4 were considered. The Venn dia-grams were built using overexpressed genes in ZEST/ZKS whoseRPKM value in a ZEST/ZKS sample was at least twice its RPKMvalue in the ZF4 sample.
To build the heat-map clustergram, we considered the top 100overexpressed genes with a twofold change in a ZEST/ZKS sam-ple compared with the ZF4 sample. Of these, the genes with thehighest average RPKM values were used to build the heat-mapclustergram.
Results
ZEST cells are derived from embryonic trunk stromaBecause the site of HSC emergence in zebrafish is endothe-lium located in the floor of the dorsal aorta [5,6], wehypothesized that stromal cells isolated from this embry-onic area would support hematopoiesis. To create ZESTcells, we dissociated the trunk tissue of 48-hpf wt embryosby removing tissue anterior and posterior to the yolk tubeextension (Fig. 1A). The tissue dorsal to the yolk tubeextension was then finely minced with a scalpel and grownin zebrafish tissue culture medium [30] in tissue cultureflasks until cells were confluent. On confluence, cellswere trypsinized and passaged for further culture. Althoughcells were not transformed in any way, they have continuedin culture for more than 90 passages with no signs of senes-cence (data not shown).
Cultured ZEST cells displayed a fibroblasticmorphology when grown on glass coverslips and stainedwith May–Gr€unwald–Giemsa (Fig. 1B). To confirm thatthese ZEST cells were of stromal origin and did not containhematopoietic cell lineages, RT-PCR was performed forboth the pan-leukocytic marker cd45 and the red bloodcell-specific gata1 (Fig. 1Ci). Neither of these transcriptswere present, confirming that ZEST cultures were not he-matopoietic or contaminated with mature hematopoieticcells.
To further characterize these cells at the transcriptionallevel, RT-PCR was performed to analyze the expression
1051C. Campbell et al./ Experimental Hematology 2015;43:1047–1061
of genes known to play essential roles in hematopoieticmaintenance, development, and proliferation. Transcrip-tional analysis revealed that ZEST cells expressed manyhematopoietic progenitor-supportive factors including kitla,kitlb, bmp1l, fgf1a, fgf21, il-11a, and il-11b, as well ascytokines and growth factors involved in lineage-specificsignaling, maintenance, and differentiation, such as epo[42], gcsfa [43], and gcsfb [36] (Fig. 1Cii), and inflamma-tory signaling (Fig. 1Ciii). Additionally, ZEST cellsexpressed Notch ligands involved in niche signaling,lymphocyte development, and maturation (Fig. 1Civ).Finally, ZEST cells expressed transcripts indicative of skel-etal (Fig. 1Cv) and smooth (Fig. 1Cvi) muscle. Together,these data indicate that ZEST cells are stromal and producea multitude of ligands important for the survival and prolif-eration of hematopoietic cells.
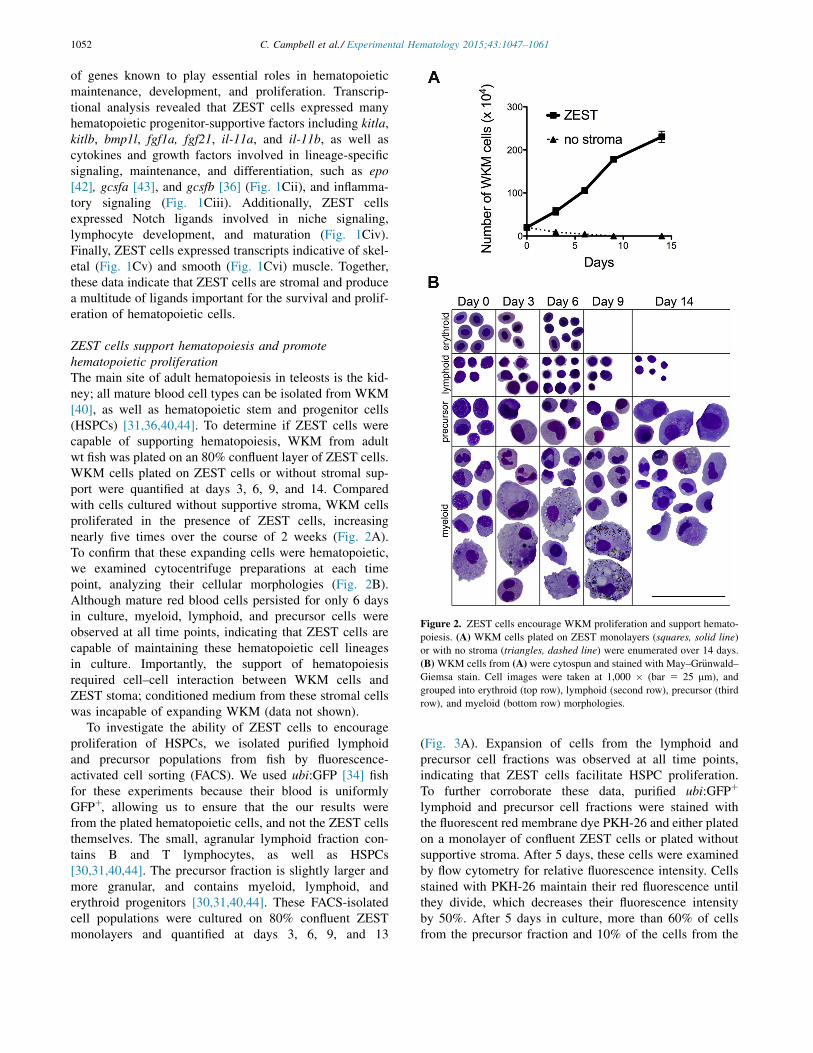
ZEST cells support hematopoiesis and promotehematopoietic proliferationThe main site of adult hematopoiesis in teleosts is the kid-ney; all mature blood cell types can be isolated from WKM[40], as well as hematopoietic stem and progenitor cells(HSPCs) [31,36,40,44]. To determine if ZEST cells werecapable of supporting hematopoiesis, WKM from adultwt fish was plated on an 80% confluent layer of ZEST cells.WKM cells plated on ZEST cells or without stromal sup-port were quantified at days 3, 6, 9, and 14. Comparedwith cells cultured without supportive stroma, WKM cellsproliferated in the presence of ZEST cells, increasingnearly five times over the course of 2 weeks (Fig. 2A).To confirm that these expanding cells were hematopoietic,we examined cytocentrifuge preparations at each timepoint, analyzing their cellular morphologies (Fig. 2B).Although mature red blood cells persisted for only 6 daysin culture, myeloid, lymphoid, and precursor cells wereobserved at all time points, indicating that ZEST cells arecapable of maintaining these hematopoietic cell lineagesin culture. Importantly, the support of hematopoiesisrequired cell–cell interaction between WKM cells andZEST stoma; conditioned medium from these stromal cellswas incapable of expanding WKM (data not shown).
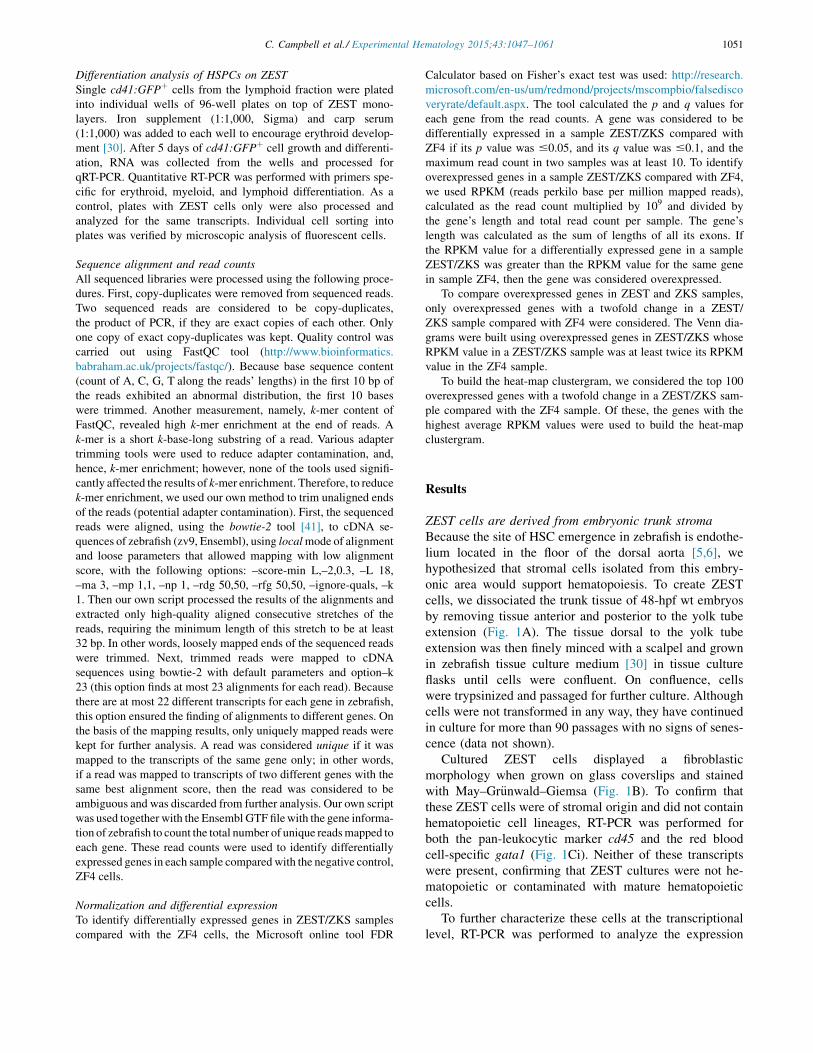
To investigate the ability of ZEST cells to encourageproliferation of HSPCs, we isolated purified lymphoidand precursor populations from fish by fluorescence-activated cell sorting (FACS). We used ubi:GFP [34] fishfor these experiments because their blood is uniformlyGFPþ, allowing us to ensure that the our results werefrom the plated hematopoietic cells, and not the ZEST cellsthemselves. The small, agranular lymphoid fraction con-tains B and T lymphocytes, as well as HSPCs[30,31,40,44]. The precursor fraction is slightly larger andmore granular, and contains myeloid, lymphoid, anderythroid progenitors [30,31,40,44]. These FACS-isolatedcell populations were cultured on 80% confluent ZESTmonolayers and quantified at days 3, 6, 9, and 13
(Fig. 3A). Expansion of cells from the lymphoid andprecursor cell fractions was observed at all time points,indicating that ZEST cells facilitate HSPC proliferation.To further corroborate these data, purified ubi:GFPþ
lymphoid and precursor cell fractions were stained withthe fluorescent red membrane dye PKH-26 and either platedon a monolayer of confluent ZEST cells or plated withoutsupportive stroma. After 5 days, these cells were examinedby flow cytometry for relative fluorescence intensity. Cellsstained with PKH-26 maintain their red fluorescence untilthey divide, which decreases their fluorescence intensityby 50%. After 5 days in culture, more than 60% of cellsfrom the precursor fraction and 10% of the cells from the
Figure 2. ZEST cells encourage WKM proliferation and support hemato-poiesis. (A) WKM cells plated on ZEST monolayers (squares, solid line)or with no stroma (triangles, dashed line) were enumerated over 14 days.(B) WKM cells from (A) were cytospun and stained with May–Gr€unwald–Giemsa stain. Cell images were taken at 1,000 " (bar 5 25 mm), andgrouped into erythroid (top row), lymphoid (second row), precursor (thirdrow), and myeloid (bottom row) morphologies.
1052 C. Campbell et al./ Experimental Hematology 2015;43:1047–1061

lymphoid fraction exhibited at least 1 cell division eventwhen cultured on a ZEST monolayer (Fig. 3B). Addition-ally, the lymphoid and precursor cells plated on ZESTunderwent more cell divisions than their counterparts platedwith no stroma, indicated by the reduction in PKH-26fluorescence (Fig. 3C). Although few cells plated with no
stroma progressed past one (lymphoid fraction) or two (pre-cursor fraction) divisions, cells plated on ZEST underwentmore than five divisions in the lymphoid and precursor frac-tions over 5 days. These data can be quantitated into a ‘‘di-vision index,’’ which is the average number of cell divisionsthat a cell in the original population underwent over the
Figure 3. ZEST cells encourage proliferation of lymphoid and precursor cell fractions. (A) Enumeration of WKM cells generated from isolated lymphoid(squares, solid line) and precursor (triangles, dashed line) cell populations plated on ZEST cells over 14 days. (B) Cells stained with the cell membrane dyePKH-26 from isolated lymphoid (left) and precursor (right) cell fractions grown on ZEST cells (squares, solid line) or with no stromal support (triangles,dashed lines). After 5 days in culture, WKM cells derived from these cultures were analyzed by flow cytometry, and FloJo’s Proliferation Platform was usedto calculate the percentage of cells in the cultures that divided. (C) Cells stained with the cell membrane dye PKH-26 (PE-A, x axis) from isolated lymphoid(left) and precursor (right) cell fractions grown with no stromal support (top) or on ZEST cells (bottom). After 5 days in culture, cells were analyzed by flowcytometry to determine how many rounds of cell division occurred without (top) or with (bottom) ZEST support. Numbers (0–7) above the histograms (bluelines) represent the number of divisions that occurred over 5 days, with 0 corresponding to cells that did not undergo division. The blue histogram lines arecalculated and drawn by the Proliferation Platform module within the FloJo software package. The numbers above each blue peak correspond to the numberof divisions that each population underwent, and the height of the peak corresponds to the numbers of cells that divided. The program also calculates adivision index of each culture, defined as the average number of cell divisions that a WKM cell underwent over 5 days. (Color version available online.)
1053C. Campbell et al./ Experimental Hematology 2015;43:1047–1061

Figure 4. ZEST cells encourage differentiation of lymphoid and precursor cell fractions. (A) Isolated lymphoid (top left plot, black line) and precursor (bot-tom left plot, dashed line) cell fractions were plated on ZEST at day 0, and differentiated over the course of 12 days. Each day, cells were removed andinvestigated on a flow cytometer to determine changes in the cells’ scatter profiles. (B) Isolated lymphoid (squares, solid line) and precursor (triangles,dashed line) cell fractions were plated on ZEST at day 0, and the number of differentiated erythroid (leftmost), lymphoid (second panel), precursor (thirdpanel), and myeloid (rightmost) were enumerated over the course of 12 days. Flow cytometry plots in (A) were coupled with total cell counts at each timepoint to obtain these data. Each point represents the average of two biological replicates, and error bars represent SD. (C) Quantitative RT-PCR results fromcells isolated from differentiated isolated lymphoid (black bar) and precursor (striped bar) cell fractions. At each time point, cells were interrogated for theerythroid-specific marker hbaa (top), myeloid markers csf3r and mpx (second and third rows), B-cell marker pax5 (fourth row), and T-cell marker lck (bottomrow). Bars represent the relative expression of two replicates averaged together, and error bars represent SD. Relative expression was determined by theDDCt method, using ef1a as a reference gene.
1054 C. Campbell et al./ Experimental Hematology 2015;43:1047–1061

course of 5 days. Again, the division index of all cellsplated on ZEST cells is at least two times higher thanwhen no stroma is present. Together, these data indicatethat ZEST cells facilitate HSPC proliferation.
ZEST cells support HSPC differentiationTo determine if ZEST cells also encouraged the differenti-ation of hematopoietic cells, we purified ubi:GFPþ
lymphoid and precursor populations by FACS and co-cultured them for 12 days on ZEST monolayers, addingiron supplement and carp serum to improve erythroiddifferentiation [30] (Fig. 4). In addition to identifyinglymphoid and precursor fractions of zebrafish WKM byflow cytometry, it is also possible to identify maturemyeloid and erythroid cells in this manner [40]. Purifiedlymphoid and precursor populations started to differentiateby day 3 in culture when analyzed by flow cytometry(Fig. 4A, top). The change in granularity of the lymphoidcells into erythroid, precursor, and myeloid fractions indi-cated that HSPCs present in this fraction had differentiated.Likewise, precursor cells changed their scatter characteris-tics to be more erythroid, lymphoid, and myeloid (Fig. 4A,bottom). This differentiation continued over the course of12 days in culture. To quantitate the actual number of cellsthat were generated in these cultures, the percentages ofubi:GFPþ WKM cells in particular cellular fractions(from Fig. 4A) were multiplied by the total number ofWKM cells in the culture. Both lymphoid and precursorpopulations showed expansion of erythroid cells at everytime point throughout the time course (Fig. 4B, leftmostpanel). The precursor population had an increased numberof lymphoid cells on days 3 and 6, eventually levelingout by day 9 and remaining relatively unchanged by day12. On the other hand, the lymphoid population had anincreased number of lymphoid cells at day 3, followed bya gradual decline that continued until day 12 (Fig. 4B,second panel), likely because the HSCs present in this pop-ulation are rare; the majority of cells are postmitoticlymphocytes and do not proliferate over the course of12 days. The plated lymphoid population showed anincrease in precursor cells up to day 6, at which pointthey remained relatively constant for the remainder of thetime course, whereas the plated precursor population ex-hibited a decrease in precursor cells over time, likelybecause these HSPCs were differentiating into mature he-matopoietic lineages (Fig. 4B, third panel). Finally, bothcells from lymphoid and precursor populations exhibitedan expansion of mature myeloid cells over the course ofthe experiment (Fig. 4B, rightmost panel). To confirmthat ZEST stroma encouraged the differentiation of HSPCs,RNA was extracted from these experiments and qRT-PCRwas performed for mature hematopoietic markers. Theerythroid-specific transcript hbaa was detected in both thelymphoid and precursor cultures at every time point duringthe assay, as were the myeloid-specific transcripts mpx and
csf3r and the lymphoid-specific transcripts pax5 and lck(Fig. 4C). Overall, the change in scatter profile, numbers,and gene expression indicate that HSPCs within thelymphoid and precursor fractions differentiated into maturemyeloid, lymphoid, and erythroid cells when plated onZEST cells.
Differentiation of clonal HSPCs on ZEST stromaBecause ZEST cells support multilineage differentiation ofHSPCs, we hypothesized that they had utility to identifyHSPCs in vitro. To develop an assay to test HSPC differen-tiation (Fig. 5A), we isolated cells from the WKM markedwith the cd41:GFP transgene, previously identified as amarker for HSCs with in vivo experiments [45]. As previouswork identified the lymphoid fraction as the scatter fractionin which HSCs were enriched [40], we isolated cd41:GFPþ
lymphoid cells from these fish and used FACS to deposit in-dividual cells into individual wells of a 96-well plate. On this96-well plate was a monolayer of ZEST cells with iron sup-plement and carp serum, and the cd41:GFPþ cells were al-lowed to proliferate and differentiate over the course of5 days. After 5 days, RNA was isolated from individualwells, cDNA was generated, and qRT-PCR was performedfor lineage-specific markers, including the myeloid-specific transcripts cmpl, cd41, csf1r, mpx, and mpeg; theerythroid-specific band3 and hbaa; the B cell-specific igmand pax5; and the T cell-specific lck. To simply the presen-tation of these data, we generated a color-coded schematic,whereby every column represents an individual well thatreceived an individual cd41:GFPþ cell that was interrogatedfor lineage-specific transcripts (Fig. 5). If there was anyexpression of that specific gene, a colored box is shown; ablack box indicates no expression. All samples were normal-ized to ef1a as a housekeeping gene, so all columns have ayellow box in that row. All samples were also normalizedto gene expression in the kidney, which is the far right col-umn, also uniformly yellow. As a control, we performedqRT-PCR for the fold change in these markers when nocd41:GFPþ cells were plated on ZEST cells; only very fewwells indicated any levels of these markers (Fig. 5B). Impor-tantly, no samples had multilineage transcript expression.However, when cd41:GFPþ cells were plated on ZEST cellsand allowed to differentiate for 5 days, there was a strikingincrease in numbers of wells that had multilineage transcriptreadouts. We considered a well (column) that had both mye-loerythroid and lymphoid transcripts to be multilineage;57% of wells had this characteristic (Fig. 5C). Importantly,only one of 49 samples failed to generate a hematopoieticreadout, indicating that cd41:GFPþ cells survive and differ-entiate well on the ZEST monolayer. Overall, these dataindicate that ZEST cells are an excellent in vitro model foranalyzing the differentiation capability of HSPCs. These as-says should allow the identification and testing of putativeHSPCs and the validation of previously identified HSPCs.
1055C. Campbell et al./ Experimental Hematology 2015;43:1047–1061

ZEST and ZKS cells are different stromal cell linesAlthough ZEST and ZKS cells both support HSPC prolifer-ation and multilineage differentiation, they are derived fromdifferent temporal and spatial locations in the zebrafish. Assuch, we hypothesized that they would have different prop-erties. First, we compared the ability of ZEST cells andZKS cells to expand WKM in culture, plating cells and
enumerating them over the course of 14 days. While ZKSexpanded WKM, ZEST monolayers encouraged approxi-mately four times more expansion over the course of theexperiment (Fig. 6A), indicating that they had differentexpansion ability. To more thoroughly investigate thedifferences and similarities between these cell lines, weperformed RNA sequencing (RNASeq) to analyze
Figure 5. ZEST cells encourage multilineage differentiation of individual HSPCs. (A) Schematic of experiment. (B) Visualization of qRT-PCR results fromZEST cells only. Each column is an individual sample (ZEST stroma only) grown for 5 days in culture. Far right column is kidney. Samples were interrogatedfor the genes listed on left side of the figure. Different color boxes shown at the bottom of the figure represent fold expression relative to kidney. Fold expres-sion was determined by the DDCt method, using ef1a as a reference gene and kidney as a reference tissue. (C) Visualization of qRT-PCR results from ZESTcells only. Each column is an individual sample (cd41:GFPlow cells plated on ZEST stroma) grown for 5 days in culture. Far right column is kidney. Sampleswere interrogated for the genes listed on left side of the figure. Different color boxes at the bottom of the figure represent fold expression relative to kidney.Fold expression was determined by the DDCt method, using ef1a as a reference gene and kidney as a reference tissue. If a column contained myeloerythroidmarkers and a lymphoid marker, it was scored as multilineage (demarcated with *).
1056 C. Campbell et al./ Experimental Hematology 2015;43:1047–1061
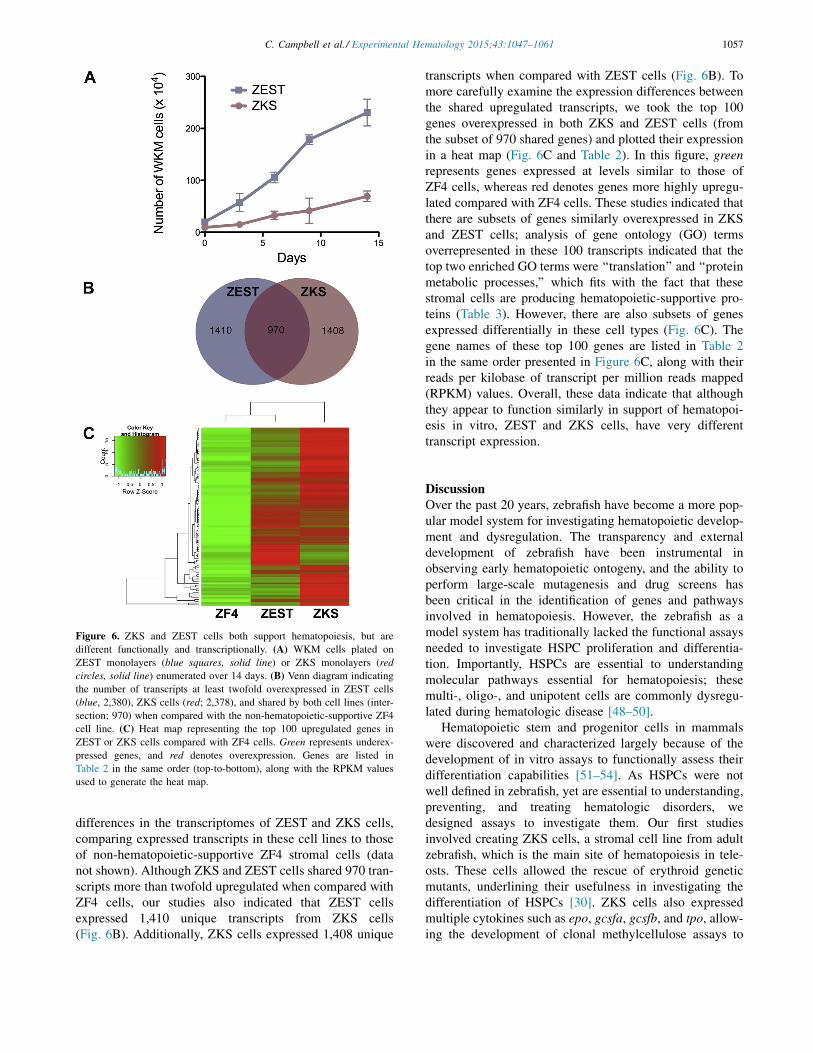
differences in the transcriptomes of ZEST and ZKS cells,comparing expressed transcripts in these cell lines to thoseof non-hematopoietic-supportive ZF4 stromal cells (datanot shown). Although ZKS and ZEST cells shared 970 tran-scripts more than twofold upregulated when compared withZF4 cells, our studies also indicated that ZEST cellsexpressed 1,410 unique transcripts from ZKS cells(Fig. 6B). Additionally, ZKS cells expressed 1,408 unique
transcripts when compared with ZEST cells (Fig. 6B). Tomore carefully examine the expression differences betweenthe shared upregulated transcripts, we took the top 100genes overexpressed in both ZKS and ZEST cells (fromthe subset of 970 shared genes) and plotted their expressionin a heat map (Fig. 6C and Table 2). In this figure, greenrepresents genes expressed at levels similar to those ofZF4 cells, whereas red denotes genes more highly upregu-lated compared with ZF4 cells. These studies indicated thatthere are subsets of genes similarly overexpressed in ZKSand ZEST cells; analysis of gene ontology (GO) termsoverrepresented in these 100 transcripts indicated that thetop two enriched GO terms were ‘‘translation’’ and ‘‘proteinmetabolic processes,’’ which fits with the fact that thesestromal cells are producing hematopoietic-supportive pro-teins (Table 3). However, there are also subsets of genesexpressed differentially in these cell types (Fig. 6C). Thegene names of these top 100 genes are listed in Table 2in the same order presented in Figure 6C, along with theirreads per kilobase of transcript per million reads mapped(RPKM) values. Overall, these data indicate that althoughthey appear to function similarly in support of hematopoi-esis in vitro, ZEST and ZKS cells, have very differenttranscript expression.
DiscussionOver the past 20 years, zebrafish have become a more pop-ular model system for investigating hematopoietic develop-ment and dysregulation. The transparency and externaldevelopment of zebrafish have been instrumental inobserving early hematopoietic ontogeny, and the ability toperform large-scale mutagenesis and drug screens hasbeen critical in the identification of genes and pathwaysinvolved in hematopoiesis. However, the zebrafish as amodel system has traditionally lacked the functional assaysneeded to investigate HSPC proliferation and differentia-tion. Importantly, HSPCs are essential to understandingmolecular pathways essential for hematopoiesis; thesemulti-, oligo-, and unipotent cells are commonly dysregu-lated during hematologic disease [48–50].
Hematopoietic stem and progenitor cells in mammalswere discovered and characterized largely because of thedevelopment of in vitro assays to functionally assess theirdifferentiation capabilities [51–54]. As HSPCs were notwell defined in zebrafish, yet are essential to understanding,preventing, and treating hematologic disorders, wedesigned assays to investigate them. Our first studiesinvolved creating ZKS cells, a stromal cell line from adultzebrafish, which is the main site of hematopoiesis in tele-osts. These cells allowed the rescue of erythroid geneticmutants, underlining their usefulness in investigating thedifferentiation of HSPCs [30]. ZKS cells also expressedmultiple cytokines such as epo, gcsfa, gcsfb, and tpo, allow-ing the development of clonal methylcellulose assays to
Figure 6. ZKS and ZEST cells both support hematopoiesis, but aredifferent functionally and transcriptionally. (A) WKM cells plated onZEST monolayers (blue squares, solid line) or ZKS monolayers (redcircles, solid line) enumerated over 14 days. (B) Venn diagram indicatingthe number of transcripts at least twofold overexpressed in ZEST cells(blue, 2,380), ZKS cells (red; 2,378), and shared by both cell lines (inter-section; 970) when compared with the non-hematopoietic-supportive ZF4cell line. (C) Heat map representing the top 100 upregulated genes inZEST or ZKS cells compared with ZF4 cells. Green represents underex-pressed genes, and red denotes overexpression. Genes are listed inTable 2 in the same order (top-to-bottom), along with the RPKM valuesused to generate the heat map.
1057C. Campbell et al./ Experimental Hematology 2015;43:1047–1061

further refine the isolation and testing of zebrafish HSPCs[31,36,44]. Although methylcellulose assays allowed theclonal investigation of myeloerythroid HSPCs, assaysto assess lymphoid progenitors remain elusive; lympho-supportive cytokines have yet to be identified and
Table 2. Top 100 transcripts overexpressed in hematopoietic-supportiveZKS and ZEST cells compared with non–hematopoietic-supportive ZF4cellsa
Gene RPKM (ZKS) RPKM (ZEST) RPKM (ZF4)
mustn1a 191.7311182 94.20002244 2.377441447myl9a 179.6584981 96.56364658 2.276630133si:busm1-57f23.1 182.0504465 89.25803193 13.64267158blmh 184.0111916 86.10283629 29.39759063cmbl 196.7707245 73.67679014 26.91899859scinla 229.2763242 77.71766924 1.171371221pycard 216.1110211 70.80059954 0.244784777wfdc2 215.3192844 100.2819887 5.805860073atp6v1e1b 211.5850639 104.0432062 50.77535662tnfaip6 197.4394341 109.3081398 52.44479497arl6ip5b 180.1080903 105.0459892 49.94297373ndufb11 247.4927535 68.49972903 30.78048579psma6a 227.9565636 80.43925949 36.57643139rpl13a 262.095085 85.45651864 42.49472207si:dkey-100n23.4 241.0388676 112.7794318 26.3597982rnd3b 230.919067 106.1477521 20.10791448Ada 235.815493 146.7960562 31.49486791rpz5 239.9595079 157.8233757 7.805466586vmhc 277.2773505 124.2928784 3.342640338cahz 355.7589188 56.55174506 1.48171963ost4 293.697141 56.14183101 22.3880387txn 428.0840844 170.734287 74.95409787fhl1a 392.740221 209.8129055 51.64958797si:dkey-12l12.1 431.6353641 159.7228348 29.13243458ckba 410.942751 156.7429014 16.93871335phex 374.7902084 246.0473474 1.422658424CABZ01024686.1 320.0454925 195.9867392 0.150924627rsl24d1 303.7118765 226.5305973 110.1637925ap2m1a 256.7847085 248.5305894 108.62445dlx3b 285.6044597 300.5094173 33.95661813adamtsl7 377.7311012 296.1991765 75.65003739anxa1a 386.1286169 280.2930981 71.0710686cdk1 157.1526365 92.45941086 41.08086644ENSDARG000
00087773(novel gene, nogene name)
151.3186816 86.06460141 36.7259713
lgals3l 151.485882 94.79980323 28.5517658mcl1b 138.0029954 100.3628761 34.55007944sumo3b 142.0062334 85.88205698 40.71745045cx4oi2 157.1675799 83.44086012 13.50501713capgb 140.0313977 95.47507416 14.03742087fibina 162.385075 111.5193532 8.63161174dcn 138.738941 110.0299673 2.200388725fpr1 129.1084434 117.6367545 0.801762529hspb9 208.1065389 130.9142075 4.453978651urah 181.7492844 153.0214309 2.606067373id3 123.0298414 119.957024 32.53271352cd82 b 117.1867309 119.7501676 20.88039052dkk1b 115.2674028 123.3601222 3.914853583cx43 95.76255571 125.268914 20.60977394phlda3 103.4830928 114.8205638 42.38678055pitpnaa 102.4114719 110.3454892 46.22327706tstd1 91.48324211 99.41705808 27.77823182timp2a 110.5132145 134.7435353 45.08674135igflr1 107.6665533 126.7691791 49.45986261ctsh 116.9107597 129.9969604 52.32102958tspan4b 124.4627775 134.439824 38.31343901kctd12.2 70.17791498 131.2071169 10.41369721
(continued)
Table 2. (continued )
Gene RPKM (ZKS) RPKM (ZEST) RPKM (ZF4)
anxa5b 223.4276827 190.0509067 82.02660608ccnd1 204.0826607 198.000819 77.64559053cnn3a 200.6466151 175.5868376 85.12488537lmo4b 171.4754089 158.0390988 54.76838861iscu 177.5601397 135.6039718 62.57678042serpine2 155.1438879 185.8865435 41.16096343cxcl-c1c 205.5342189 222.3706168 33.03549542fabp7a 195.9918097 237.0929702 21.40297666si:ch211-174h4.1 224.7857597 199.3655569 38.63959992ehd2 161.7766861 245.0843826 56.47716098crabp2b 105.0984741 221.8625863 49.8034191si:ch211-222d3.3 95.00787666 229.3358097 21.15952131dusp5 126.478358 236.8883821 9.107537686itga10 89.61611629 201.1502394 2.352461298tcn2l 38.72650992 164.8295692 13.11416496cyp24a1 18.72705544 177.0835255 2.519571099gdf10 b 33.67260166 219.1972506 0.695893287hpdb 81.65105717 369.7602972 1.681026612hbegfa 237.5287195 432.953554 115.5311657timp2b 201.697207 353.6519834 68.67404428thbs4b 211.3951489 552.8064964 31.77418366phlda2 661.6069058 447.6778629 148.3523463prdx1 663.2337466 378.8825097 122.1185737gstp1 585.6433683 324.3995674 107.5635844sncga 506.5409161 491.6240584 33.91588988calm3a 398.2576181 445.6855878 77.36093147ENSDARG000
00092903(novel gene,gene nameprojected to beC18H15orf48)
570.4850827 238.5350614 41.45849625
cd9b 506.2882968 266.2312285 25.2919086snrpe 514.8853227 160.8159508 78.98388808rpl31 786.6591853 197.9255876 69.5006252ifitm5 617.8582984 44.28435681 0.866051404soul5 827.0453265 703.7188802 13.01478191rps16 1058.353433 295.6625046 126.4458616rpl10a 935.7242298 364.8865983 139.5790661si:dkey-22i16.3 966.7386902 8.207114594 1.997906106ENSDARG0000
0071626(novel gene;no gene name)
858.6043295 26.27619774 1.428567107
rps9 1642.964348 524.3909043 228.2500494cox6b1 1642.244168 266.1138185 132.3260874si:ch211-12e1.3 1538.960816 697.6199432 27.15657434rpl22 1350.323073 497.4139112 219.2842156clu 1178.602248 1219.222027 348.8825399stc2a 1171.390702 1231.42446 164.7996506rpl32 3503.451624 1012.274554 501.3860264rpl6 3084.841751 1276.133337 501.4586706
aGene names listed based on Zv9 assembly, as well as reads per kilobase oftranscript per million reads mapped (RPKM) of ZKS, ZEST, and ZF4samples.
1058 C. Campbell et al./ Experimental Hematology 2015;43:1047–1061

recombinantly generated, and T-cell development requirescell-to-cell contact [55]. The benefit of ZKS and ZEST cellsis that they do support lymphoid cell proliferation anddifferentiation, likely by their expression of lympho-supportive cytokines and Notch ligands. Further examina-tion of the transcriptomes of these 2 cell lines is likely toyield important advances in this area.
Importantly, stromal cells are useful for understandingnot only normal hematopoiesis, but also the effect of thehematopoietic niche on hematologic disease development[56]. Other groups created zebrafish hematopoietic-supportive mesenchymal stem cell lines from sdf1:DsRedtransgenic animals [57], allowing investigation of the he-matopoietic niche, positing the zebrafish as a useful modelsystem to study niche/HSPC interactions. Importantly,ZEST cells are easily transfected, and with the advent ofCRISPR/Cas9 technology, it should be possible to quicklyand effectively modulate putatively important stromalfactors involved in hematopoiesis in this in vitro system.
Zebrafish embryonic stromal trunk cells, like their ZKScounterparts, appear to resist senescence. ZEST cells havebeen grown for more than 100 passages, never underwenta massive die off followed by a clonal recovery during theirestablishment, and show no growth slowing or functionaldeviation. We have created 10 different clonal lines ofZEST cells, and all have the same functional properties;they all support the expansion and differentiation of he-matopoietic cells (data not shown). Also, similar to ZKScells, ZEST cells support the proliferation and differentia-tion of all blood cells; lymphoid cells and myeloid celltypes were expanded and observed. Although ZEST cellsdo not support the survival of postmitotic red blood cellsfor more than 6 days in culture, they do encourage differen-tiation from erythroid precursors when iron supplement andcarp serum are added to isolated HSPCs. While ZEST cellssupport adult HSPCs, future experiments are required toanalyze embryonic HSPCs. However, as ZKS cells supportembryonic HSPCs [58], we believe ZEST cells also will.Because of their embryonic origin, they may be moresupportive.
The gold standard for identifying HSCs is the transplan-tation of putative HSCs into irradiated recipients and mea-surement of long-term hematopoietic reconstitution. Inmice, studies indicate that only 0.01% of bone marrow(the mammalian location of HSCs, equivalent to fishWKM) is composed of long- and short-term HSCs [59].In zebrafish, these studies have been problematic; fewclonal fish strains exist, so immune-matching donors andrecipients is challenging. Because of these issues, it hasbeen difficult to quantitate zebrafish HSCs. Descriptive re-ports quantitating side-population (SP) HSCs indicated that0.056 6 0.008% of the WKM is composed of SP HSCs[60], but this characterization was largely descriptive; therewas no functional evidence that these cells were bona fideHSCs. Further refinement of this SP assay indicated thatT
able
3.GO
term
senriched
intop10
0transcriptsoverexpressedin
hematopoietic-suppo
rtiveZKSandZESTcellscomparedwithno
n-hematop
oietic-suppo
rtiveZF4cellsa
Term
Description
Cou
nt%
pValue
Gene
List
total
Pop hits
Pop
total
Foldenrichment
Bon
ferron
iBenjamini
FDR
GO:00064
12Translation
910.46511628
1.76E-04
rps16,
rpl22,
rpl10a,rsl24d1,
rpl32,
rps9,rpl6,rpl13a,
rpl31
53260
8,389
5.479027576
0.0639
6177
0.06396177
0.2432
4761
GO:00162
65Death
44.651162791
0.0106
8724
2phlda3,ckba,clu,
pycard
5374
8,389
8.555838858
0.9822
1296
0.866631938
13.796
5880
8GO:00082
19Celldeath
44.651162791
0.0106
8724
2phlda3,ckba,clu,
pycard
5374
8,389
8.555838858
0.9822
1296
0.866631938
13.796
5880
8GO:00074
23Sensory
organdevelopm
ent
55.813953488
0.0405
9318
2ccnd1,
dkk1b,
scinla,
atp6v1e1b,
dlx3b
53210
8,389
3.768643306
0.9999
9982
20.994372052
43.593
0556
GO:00195
38Protein
metabolic
process
1719.76744186
0.0523
3021
3dusp5,ctsh,rps16,rpl6,rpl13a,
pycard,serpine2,psma6a,
sumo3b,
rpl22,
blmh,
rpl10a,
rsl24d1,
rpl32,
rps9,phex,
rpl31
531719
8,389
1.565335265
0.9999
9999
80.993519671
52.414
9975
1
GO:00016
54Eye
developm
ent
44.651162791
0.0605
0601
3ccnd1,
scinla,atp6v1e1b,
dlx3b
53145
8,389
4.366428107
10.990730627
57.784
0774
3GO:00125
01Program
med
celldeath
33.488372093
0.0714
3547
4phlda3,ckba,pycard
5371
8,389
6.688014882
10.990266803
64.086
3613
2GO:00069
15Apoptosis
33.488372093
0.0714
3547
4phlda3,ckba,pycard
5371
8,389
6.688014882
10.990266803
64.086
3613
2GO:00427
70DNA
damageresponse,signal
transduction
22.325581395
0.0777
0536
8ccnd1,
phlda3
5313
8,389
24.35123367
10.986877438
67.295
7535
4
GO:00098
88Tissuedevelopm
ent
55.813953488
0.0965
3402
2dkk1b,
cx43,dcn,
vmhc,dlx3b
53282
8,389
2.806436505
10.991422401
75.405
7781
7
a GO
term
sanddescriptionof
transcriptsin
Table
2analyzed
byDatabaseforAnn
otation,
Visualization
andIntegrated
Discovery
(DAVID
)v6
.7[46,47].Genenames
listed
basedon
Zv9
assembly.
1059C. Campbell et al./ Experimental Hematology 2015;43:1047–1061

20% of these SP cells in cd41:GFP transgenic animals ex-pressed cd41 at low levels [45]. Transplanting thesecd41:GFPlow SP cells rescued irradiated hosts, indicatingthat about 0.018% of the WKM is composed of HSCs[45]. However, these studies did not isolate cd41:GFPlow
cells from the lymphoid scatter fraction, the fraction whereHSCs reside [40]. Additionally, these studies did notimmune-match donors and recipients, likely reducing theamount of successful engraftment and long-termreconstitution.
We took a different approach to quantitating zebrafishprogenitors, developing a clonal in vitro assay to assess ifthey had the capability of multilineage differentiation. Byplating cd41:GFPlow cells from the lymphoid scatter frac-tion on ZEST cells and analyzing a multilineage transcrip-tional readout 5 days later, we were able to enumerateHSPCs present in the zebrafish kidney. Our FACS isolationindicated that cd41:GFPlow cells in the lymphoid fractionroutinely constituted 0.3% of the total WKM. We detectedboth lymphoid and myeloerythroid differentiation from57% of these cells, or 0.171% of the WKM. This percent-age is higher than the estimated numbers of cd41:GFPlow
HSCs present in this population [45], indicating that thispopulation is heterogeneous [45] and that our assay detectsother multipotent progenitors in this population. Furtherrefinement of the assay, including sorting SPþ cd41:GFPlow
lymphoid cells, may resolve this issue. Although we cannotassess if these cd41:GFPlow lymphoid cells are bona fideHSCs with this assay, they represent a progenitor poolthat expressed multiple mature hematopoietic lineage tran-scripts after culture on ZEST cells.
AcknowledgmentsThis research was supported by National Institutes of HealthGrants K01-DK087814-01A1 (DLS) and R01 DK074482 (DT).
Author contributionsDLS and DT designed the research. CC, TS, RPL, AS, PCL, BA,JA, EH, and DLS performed research. DLS and DT wrote thearticle.
Conflict of interest disclosureAll authors declare no competing financial interests.
References1. Orkin SH, Zon LI. Hematopoiesis: an evolving paradigm for stem
cell biology. Cell. 2008;132:631–644.2. Carroll KJ, North TE. Oceans of opportunity: exploring vertebrate
hematopoiesis in zebrafish. Exp Hematol. 2014;42:684–696.3. Carradice D, Lieschke GJ. Zebrafish in hematology: sushi or science?
Blood. 2008;111:3331–3342.
4. Boatman S, Barrett F, Satishchandran S, Jing L, Shestopalov I, ZonLI. Assaying hematopoiesis using zebrafish. Blood Cells Mol Dis.2013;51:271–276.
5. Bertrand JY, Chi NC, Santoso B, Teng S, Stainier DY, Traver D.Haematopoietic stem cells derive directly from aortic endotheliumduring development. Nature. 2010;464:108–111.
6. Kissa K, Herbomel P. Blood stem cells emerge from aortic endothe-lium by a novel type of cell transition. Nature. 2010;464:112–115.
7. Mathias JR, Dodd ME, Walters KB, Yoo SK, Ranheim EA, Hutten-locher A. Characterization of zebrafish larval inflammatory macro-phages. Dev Comp Immunol. 2009;33:1212–1217.
8. Renshaw SA, Loynes CA, Trushell DM, Elworthy S, Ingham PW,Whyte MK. A transgenic zebrafish model of neutrophilic inflamma-tion. Blood. 2006;108:3976–3978.
9. Ellett F, Pase L, Hayman JW, Andrianopoulos A, Lieschke GJ.mpeg1 promoter transgenes direct macrophage-lineage expressionin zebrafish. Blood. 2011;117:e49–56.
10. Hall C, Flores MV, Storm T, Crosier K, Crosier P. The zebrafish lyso-zyme C promoter drives myeloid-specific expression in transgenicfish. BMC Dev Biol. 2007;7:42.
11. Herbomel P, Thisse B, Thisse C. Ontogeny and behaviour of earlymacrophages in the zebrafish embryo. Development. 1999;126:3735–3745.
12. Lieschke GJ, Oates AC, Crowhurst MO, Ward AC, Layton JE.Morphologic and functional characterization of granulocytes andmacrophages in embryonic and adult zebrafish. Blood. 2001;98:3087–3096.
13. Bennett CM, Kanki JP, Rhodes J, et al. Myelopoiesis in the zebrafish,Danio rerio. Blood. 2001;98:643–651.
14. Lugo-Villarino G, Balla KM, Stachura DL, Banuelos K, WerneckMB, Traver D. Identification of dendritic antigen-presenting cellsin the zebrafish. Proc Natl Acad Sci USA. 2010;107:15850–15855.
15. Willett CE, Zapata AG, Hopkins N, Steiner LA. Expression of zebra-fish rag genes during early development identifies the thymus. DevBiol. 1997;182:331–341.
16. Driever W, Solnica-Krezel L, Schier AF, et al. A genetic screen formutations affecting embryogenesis in zebrafish. Development.1996;123:37–46.
17. Weinstein BM, Schier AF, Abdelilah S, et al. Hematopoietic muta-tions in the zebrafish. Development. 1996;123:303–309.
18. Ransom DG, Haffter P, Odenthal J, et al. Characterization of zebra-fish mutants with defects in embryonic hematopoiesis. Development.1996;123:311–319.
19. Ridges S, Heaton WL, Joshi D, et al. Zebrafish screen identifies novelcompound with selective toxicity against leukemia. Blood. 2012;119:5621–5631.
20. Yeh JR, Munson KM, Elagib KE, Goldfarb AN, Sweetser DA, Peter-son RT. Discovering chemical modifiers of oncogene-regulatedhematopoietic differentiation. Nat Chem Biol. 2009;5:236–243.
21. Clements WK, Traver D. Fish pharming: zebrafish antileukemiascreening. Blood. 2012;119:5614–5615.
22. Bowman TV, Zon LI. Swimming into the future of drug discovery:in vivo chemical screens in zebrafish. ACS Chem Biol. 2010;5:159–161.
23. Peterson RT, Shaw SY, Peterson TA, et al. Chemical suppression of agenetic mutation in a zebrafish model of aortic coarctation. NatBiotechnol. 2004;22:595–599.
24. Brownlie A, Hersey C, Oates AC, et al. Characterization of embry-onic globin genes of the zebrafish. Dev Biol. 2003;255:48–61.
25. North TE, Goessling W, Walkley CR, et al. Prostaglandin E2regulates vertebrate haematopoietic stem cell homeostasis. Nature.2007;447:1007–1011.
26. Mizgirev I, Revskoy S. Generation of clonal zebrafish lines andtransplantable hepatic tumors. Nature protocols. 2010;5:383–394.
27. Mizgirev IV, Revskoy S. A new zebrafish model for experimentalleukemia therapy. Cancer Biol Ther. 2010;9:895–902.
1060 C. Campbell et al./ Experimental Hematology 2015;43:1047–1061
28. Smith AC, Raimondi AR, Salthouse CD, et al. High-throughput celltransplantation establishes that tumor-initiating cells are abundant inzebrafish T-cell acute lymphoblastic leukemia. Blood. 2010;115:3296–3303.
29. de Jong JL, Burns CE, Chen AT, et al. Characterization of immune-matched hematopoietic transplantation in zebrafish. Blood. 2011;117:4234–4242.
30. Stachura DL, Reyes JR, Bartunek P, Paw BH, Zon LI, Traver D. Ze-brafish kidney stromal cell lines support multilineage hematopoiesis.Blood. 2009;114:279–289.
31. Stachura DL, Svoboda O, Lau RP, et al. Clonal analysis of hemato-poietic progenitor cells in the zebrafish. Blood. 2011;118:1274–1282.
32. Liongue C, Ward AC. Evolution of Class I cytokine receptors. BMCEvol Biol. 2007;7:120.
33. Lin HF, Traver D, Zhu H, et al. Analysis of thrombocyte develop-ment in CD41-GFP transgenic zebrafish. Blood. 2005;106:3803–3810.
34. Mosimann C, Kaufman CK, Li P, Pugach EK, Tamplin OJ, Zon LI.Ubiquitous transgene expression and Cre-based recombination drivenby the ubiquitin promoter in zebrafish. Development. 2011;138:169–177.
35. Stachura DL, Traver D. Cellular dissection of zebrafish hematopoie-sis. Methods in cell biology. 2011;101:75–110.
36. Stachura DL, Svoboda O, Campbell CA, et al. The zebrafish granu-locyte colony-stimulating factors (Gcsfs): 2 paralogous cytokines andtheir roles in hematopoietic development and maintenance. Blood.2013;122:3918–3928.
37. Bertrand MJ, Kenchappa RS, Andrieu D, et al. NRAGE, a p75NTRadaptor protein, is required for developmental apoptosis in vivo. CellDeath Differ. 2008;15:1921–1929.
38. Bertrand JY, Kim AD, Teng S, Traver D. CD41þ cmybþ precursorscolonize the zebrafish pronephros by a novel migration route toinitiate adult hematopoiesis. Development. 2008;135:1853–1862.
39. Wittamer V, Bertrand JY, Gutschow PW, Traver D. Characterizationof the mononuclear phagocyte system in zebrafish. Blood. 2011;117:7126–7135.
40. Traver D, Paw BH, Poss KD, Penberthy WT, Lin S, Zon LI. Trans-plantation and in vivo imaging of multilineage engraftment in zebra-fish bloodless mutants. Nat Immunol. 2003;4:1238–1246.
41. Langmead B, Salzberg SL. Fast gapped-read alignment with Bowtie2. Nat Methods. 2012;9:357–359.
42. Paffett-Lugassy N, Hsia N, Fraenkel PG, et al. Functional conserva-tion of erythropoietin signaling in zebrafish. Blood. 2007;110:2718–2726.
43. Liongue C, Hall CJ, O’Connell BA, Crosier P, Ward AC. Zebrafishgranulocyte colony-stimulating factor receptor signaling promotesmyelopoiesis and myeloid cell migration. Blood. 2009;113:2535–2546.
44. Svoboda O, Stachura DL, Machonova O, et al. Dissection of verte-brate hematopoiesis using zebrafish thrombopoietin. Blood. 2014;124:220–228.
45. Ma D, Zhang J, Lin HF, Italiano J, Handin RI. The identification andcharacterization of zebrafish hematopoietic stem cells. Blood. 2011;118:289–297.
46. Huang da W, Sherman BT, Zheng X, et al. Extracting biologicalmeaning from large gene lists with DAVID. Curr Protoc Bioinformat-ics. 2009; Chapter 13:Unit 13.11.
47. Huang da W, Sherman BT, Lempicki RA. Systematic and integrativeanalysis of large gene lists using DAVID bioinformatics resources.Nat Protoc. 2009;4:44–57.
48. Xu L, Gu ZH, Li Y, et al. Genomic landscape of CD34þ hemato-poietic cells in myelodysplastic syndrome and gene mutation pro-files as prognostic markers. Proc Natl Acad Sci USA. 2014;111:8589–8594.
49. Brown BD. A shot in the bone corrects a genetic disease. Mol Ther.2015;23:614–615.
50. Xie M, Lu C, Wang J, et al. Age-related mutations associated withclonal hematopoietic expansion and malignancies. Nat Med. 2014;20:1472–1478.
51. Kondo M, Weissman IL, Akashi K. Identification of clonogenic com-mon lymphoid progenitors in mouse bone marrow. Cell. 1997;91:661–672.
52. Akashi K, Traver D, Miyamoto T, Weissman IL. A clonogenic com-mon myeloid progenitor that gives rise to all myeloid lineages. Na-ture. 2000;404:193–197.
53. Nakorn TN, Miyamoto T, Weissman IL. Characterization of mouseclonogenic megakaryocyte progenitors. Proc Natl Acad Sci USA.2003;100:205–210.
54. Mori Y, Iwasaki H, Kohno K, et al. Identification of the human eosin-ophil lineage-committed progenitor: revision of phenotypic definitionof the human common myeloid progenitor. J Exp Med. 2009;206:183–193.
55. Schmitt TM, Zuniga-Pflucker JC. Induction of T cell developmentfrom hematopoietic progenitor cells by delta-like-1 in vitro. Immu-nity. 2002;17:749–756.
56. Bulycheva E, Rauner M, Medyouf H, et al. Myelodysplasia is in theniche: novel concepts and emerging therapies. Leukemia. 2015;29:259–268.
57. Lund TC, Patrinostro X, Kramer AC, et al. sdf1 Expression reveals asource of perivascular-derived mesenchymal stem cells in zebrafish.Stem Cells. 2014;32:2767–2779.
58. Bertrand JY, Kim AD, Violette EP, Stachura DL, Cisson JL, TraverD. Definitive hematopoiesis initiates through a committed erythro-myeloid progenitor in the zebrafish embryo. Development. 2007;134:4147–4156.
59. Domen JWA, Weissman I. Bone Marrow (Hematopoietic) Stem Cells.Vol. 2011. Bethesda, MD: National Institutes of Health, US Depart-ment of Health and Human Services: Stem Cell Information; 2011.
60. Kobayashi I, Saito K, Moritomo T, Araki K, Takizawa F, Naka-nishi T. Characterization and localization of side population (SP)cells in zebrafish kidney hematopoietic tissue. Blood. 2008;111:1131–1137.
1061C. Campbell et al./ Experimental Hematology 2015;43:1047–1061