zambia: poverty reduction strategy paper progress - sarpn
TRANSCRIPT
73
Objec
tive
Polic
y Act
ion
Stat
us as
at E
nd Ju
ne 20
04
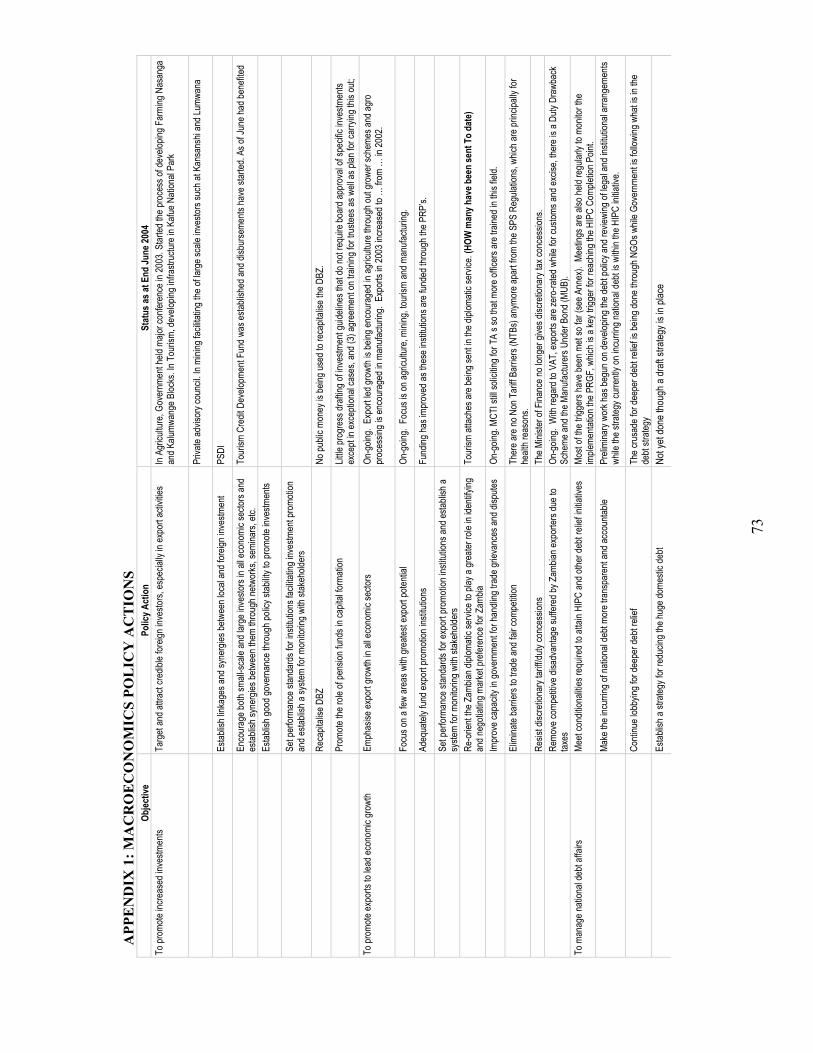
To pr
omote
incre
ased
inve
stmen
ts Ta
rget
and a
ttrac
t cre
dible
foreig
n inv
estor
s, es
pecia
lly in
expo
rt ac
tivitie
s In
Agric
ultur
e, Go
vern
ment
held
major
confe
renc
e in 2
003.
Star
ted th
e pro
cess
of de
velop
ing F
armi
ng N
asan
ga
and K
alumw
ange
Bloc
ks. In
Tou
rism,
deve
loping
infra
struc
ture i
n Kafu
e Nati
onal
Park
Priva
te ad
visor
y cou
ncil.
In mi
ning f
acilit
ating
the o
f larg
e sca
le inv
estor
s suc
h at K
ansa
nshi
and L
umwa
na
Es
tablis
h link
ages
and s
yner
gies b
etwee
n loc
al an
d for
eign i
nves
tmen
t PS
DI
En
cour
age b
oth sm
all-sc
ale an
d lar
ge in
vesto
rs in
all ec
onom
ic se
ctors
and
estab
lish s
yner
gies b
etwee
n the
m thr
ough
netw
orks
, sem
inars,
etc.
Tour
ism C
redit
Dev
elopm
ent F
und w
as es
tablis
hed a
nd di
sbur
seme
nts ha
ve st
arted
. As o
f Jun
e had
bene
fited
Es
tablis
h goo
d gov
erna
nce t
hrou
gh po
licy s
tabilit
y to p
romo
te inv
estm
ents
Se
t per
forma
nce s
tanda
rds f
or in
stitut
ions f
acilit
ating
inve
stmen
t pro
motio
n an
d esta
blish
a sy
stem
for m
onito
ring w
ith st
akeh
older
s
Re
capit
alise
DBZ
No
publi
c mon
ey is
being
used
to re
capit
alise
the D
BZ.
Pr
omote
the r
ole of
pens
ion fu
nds i
n cap
ital fo
rmati
on
Little
prog
ress
draft
ing of
inve
stmen
t guid
eline
s tha
t do n
ot re
quire
boar
d app
rova
l of s
pecif
ic inv
estm
ents
exce
pt in
exce
ption
al ca
ses,
and (
3) ag
reem
ent o
n tra
ining
for t
ruste
es as
well
as pl
an fo
r car
rying
this
out;
To pr
omote
expo
rts to
lead
econ
omic
grow
th Em
phas
ise ex
port
grow
th in
all ec
onom
ic se
ctors
On-g
oing.
Exp
ort le
d gro
wth i
s bein
g enc
oura
ged i
n agr
icultu
re th
roug
h out
grow
er sc
heme
s and
agro
pr
oces
sing i
s enc
oura
ged i
n man
ufactu
ring.
Exp
orts
in 20
03 in
creas
ed to
… fr
om …
in 20
02.
Fo
cus o
n a fe
w ar
eas w
ith gr
eates
t exp
ort p
otenti
al On
-goin
g. F
ocus
is on
agric
ultur
e, mi
ning,
touris
m an
d man
ufactu
ring.
Ad
equa
tely f
und e
xpor
t pro
motio
n ins
titutio
ns
Fund
ing ha
s imp
rove
d as t
hese
insti
tution
s are
fund
ed th
roug
h the
PRP
’s.
Se
t per
forma
nce s
tanda
rds f
or ex
port
prom
otion
insti
tution
s and
estab
lish a
sy
stem
for m
onito
ring w
ith st
akeh
older
s
Re
-orie
nt the
Zam
bian d
iplom
atic s
ervic
e to p
lay a
grea
ter ro
le in
identi
fying
an
d neg
otiati
ng m
arke
t pre
feren
ce fo
r Zam
bia
Tour
ism at
tache
s are
being
sent
in the
diplo
matic
servi
ce. (
HOW
man
y hav
e bee
n se
nt T
o da
te)
Im
prov
e cap
acity
in go
vern
ment
for ha
ndlin
g tra
de gr
ievan
ces a
nd di
spute
s On
-goin
g. MC
TI st
ill so
licitin
g for
TA
s so t
hat m
ore o
fficer
s are
train
ed in
this
field.
El
imina
te ba
rrier
s to t
rade
and f
air co
mpeti
tion
Ther
e are
no N
on T
ariff
Barri
ers (
NTBs
) any
more
apar
t from
the S
PS R
egula
tions
, whic
h are
princ
ipally
for
healt
h rea
sons
.
Resis
t disc
retio
nary
tariff/
duty
conc
essio
ns
The M
iniste
r of F
inanc
e no l
onge
r give
s disc
retio
nary
tax co
nces
sions
.
Remo
ve co
mpeti
tive d
isadv
antag
e suff
ered
by Z
ambia
n exp
orter
s due
to
taxes
On
-goin
g. W
ith re
gard
to V
AT, e
xpor
ts ar
e zer
o-ra
ted w
hile f
or cu
stoms
and e
xcise
, ther
e is a
Duty
Dra
wbac
k Sc
heme
and t
he M
anufa
cture
rs Un
der B
ond (
MUB)
. To
man
age n
ation
al de
bt aff
airs
Meet
cond
itiona
lities
requ
ired t
o atta
in HI
PC an
d othe
r deb
t reli
ef ini
tiativ
es
Most
of the
trigg
ers h
ave b
een m
et so
far (
see A
nnex
). M
eetin
gs ar
e also
held
regu
larly
to mo
nitor
the
imple
menta
tion t
he P
RGF,
whic
h is a
key t
rigge
r for
reac
hing t
he H
IPC
Comp
letion
Poin
t.
Make
the i
ncur
ring o
f nati
onal
debt
more
tran
spar
ent a
nd ac
coun
table
Preli
mina
ry wo
rk ha
s beg
un on
deve
loping
the d
ebt p
olicy
and r
eview
ing of
lega
l and
insti
tution
al ar
rang
emen
ts wh
ile th
e stra
tegy c
urre
ntly o
n inc
urrin
g nati
onal
debt
is wi
thin t
he H
IPC
initia
tive.
Co
ntinu
e lob
bying
for d
eepe
r deb
t reli
ef Th
e cru
sade
for d
eepe
r deb
t reli
ef is
being
done
thro
ugh N
GOs w
hile G
over
nmen
t is fo
llowi
ng w
hat is
in th
e de
bt str
ategy
Estab
lish a
stra
tegy f
or re
ducin
g the
huge
dome
stic d
ebt
Not y
et do
ne th
ough
a dr
aft st
rateg
y is i
n pla
ce
APP
EN
DIX
1: M
AC
RO
EC
ON
OM
ICS
POL
ICY
AC
TIO
NS

74
Re
duce
gove
rnme
nt ar
rear
s to s
uppli
ers a
nd pe
nsion
fund
s Fu
nds h
ave b
een a
lloca
ted un
der t
he m
acro
econ
omic
frame
work.
Abo
ut K7
6 billi
on ha
s bee
n allo
cated
for
clea
ranc
e of d
omes
tic ar
rear
s in 2
004.
By e
nd-Ju
ne 20
04, a
ctual
paym
ents
amou
nted t
o only
K30
bil
lion.
Total
arre
ars s
tand a
t K48
0 billi
on as
at en
d mar
ch 20
04
To re
habi
litat
e inf
rast
ruct
ure a
nd ca
rry o
ut ke
y in
stitu
tiona
l ref
orm
s Re
habil
itate
core
infra
struc
ture l
ike ro
ads,
railw
ays a
nd en
ergy
A
lot of
prog
ress
has b
een m
ade t
o imp
rove
the c
ountr
y’s ro
ads,
major
bridg
es K
atima
Muli
lo an
d Ch
irund
u) w
ere c
ommi
ssion
ed in
2004
and a
irpor
ts (L
iving
stone
, Lus
aka a
nd M
fuwe)
. And
feed
er ro
ads
and n
ation
al pa
rk ro
ads
See t
he C
hapte
r on I
nfras
tructu
re fo
r deta
ils
En
cour
age e
cono
mic g
rowt
h to g
ener
ate re
sour
ces c
apab
le of
reha
bilita
ting
infra
struc
ture i
n futu
re
Mi
nimize
deve
lopme
nt of
new
infra
struc
ture u
nless
it is
imme
diatel
y tied
to a
major
prod
uctiv
e ven
ture
Ins
titute
institu
tiona
l refor
m lea
ding t
o low
er pr
ices f
or en
ergy
and
telec
ommu
nicati
ons
A pr
oces
s to r
eview
regu
lator
y and
lega
l fram
ewor
k for
netw
ork u
tilitie
s with
the o
verri
ding p
olicy
of
minim
izing
the n
eed f
or di
rect
regu
lator
y dete
rmina
tions
is an
indis
pens
able
prec
ondit
ion fo
r effe
ctive
pr
ivate
partic
ipatio
n and
susta
ined (
large
-scale
) inve
stmen
t in a
coun
try w
ith a
long h
istor
y of
admi
nistra
tive c
ontro
ls an
d with
out fa
cilita
ting c
ompe
tition
. Key
elem
ents
of the
prog
ram
could
inclu
de:
Infor
matio
n Com
munic
ation
Tec
hnolo
gy P
olicy
is be
ing de
velop
ed w
hilst
the T
eleco
mmun
icatio
n Act
is be
ing re
viewe
d.
S
tudy o
n the
Priv
ate se
ctor p
artic
ipatio
n on t
he in
terna
tiona
l Gate
way w
as co
mmiss
ioned
.
U
nbun
dling
of Z
ambia
Tele
comm
unica
tions
Cor
pora
tion (
Zamt
el).
Comm
ercia
lisati
on of
ZES
CO
Me
rge g
over
nmen
t dep
artm
ents
to re
duce
oper
ation
al co
sts
Only
a few
have
been
mer
ged M
inistr
y of E
nviro
nmen
t and
the M
inistr
y of T
ouris
m to
form
the M
inistr
y of
Envir
onme
nt, N
atura
l Res
ource
s and
Tou
rism
Re-o
rient
fisca
l exp
endit
ure t
o sup
port
grow
th an
d po
verty
redu
ction
The
proc
ess
of re
ducin
g op
erati
onal
costs
in G
over
nmen
t has
bee
n go
ing o
n sin
ce 1
997
throu
gh th
e Pu
blic
Secto
r Refo
rm P
rogr
amme
(PSR
P).
So fa
r, re
struc
turing
of m
ost c
entra
l gov
ernm
ent m
inistr
ies
has
been
com
pleted
exc
ept f
or M
inistr
y of
Comm
unity
Dev
elopm
ent a
nd S
ocial
Ser
vices
, Mini
stry
of inf
orma
tion
and
Broa
dcas
ting
Servi
ces,
Minis
try o
f Com
munic
ation
s an
d Tr
ansp
ort,
Minis
try o
f Hom
e Af
fairs
and t
he ni
ne pr
ovinc
es.
Im
pleme
nt an
Integ
rated
Fina
ncial
Man
agem
ent a
nd In
forma
tion S
ystem
(IF
MIS)
Th
e con
tract
for th
e sup
ply an
d ins
tallat
ion of
the h
ardw
are a
nd so
ftwar
e nee
ded t
o imp
lemen
t IFMI
S wa
s su
ppos
ed to
be aw
arde
d in J
une 2
004.
The
proc
ess o
f rev
iewing
the e
valua
tion h
as ho
weve
r bee
n dela
yed.
In
this r
egar
d, a r
eview
of ev
aluati
on fo
r awa
rd of
contr
act fo
r pro
cure
ment
of ha
rdwa
re an
d soft
ware
was
co
mplet
ed on
8th J
uly 20
04. A
no ob
jectio
n to w
ard c
ontra
ct to
a pre
ferre
d bidd
er w
as se
nt to
PSCA
P for
on
ward
tran
smiss
ion to
Wor
ld Ba
nk on
July
9, 20
04 fo
r No O
bjecti
on
Im
prov
e pub
lic se
rvice
pay a
nd dr
op no
n-pe
rform
ance
relat
ed al
lowan
ces
Prog
ress
has b
een m
ade t
o som
e exte
nt to
deco
mpre
ss ba
sic sa
laries
espe
cially
for p
rofes
siona
l and
tech
nical
staff t
hrou
gh th
e Med
ium T
erm
Pay R
eform
s. A
stra
tegy t
o imp
rove
publi
c ser
vice p
ay w
as ad
opted
by C
abine
t in
Augu
st 20
02 th
roug
h wha
t is kn
own a
s the
“Med
ium T
erm
Pay R
eform
". T
his ha
s fac
ilitate
d the
de
comp
ress
ion of
basic
salar
ies in
2003
with
emph
asis
given
to pr
ofess
ional
and t
echn
ical p
ositio
ns, e
limina
tion
of so
me al
lowan
ces a
nd ra
tiona
lizati
on of
othe
rs an
d clea
ning u
p the
payro
ll to i
denti
fy ov
ersta
ffing a
nd
erro
neou
s pay
.
Exten
d Acti
vity B
ased
Bud
getin
g (AB
B) to
mor
e mini
stries
AB
B ha
s bee
n exte
nded
to al
l the l
ine m
inistr
ies an
d the
2004
Bud
get w
as pr
epar
ed in
the A
BB fo
rmat.
Ho
weve
r, fun
ding i
s not
yet d
one b
y acti
vity a
s the
deve
lopme
nt of
the fu
nding
mod
ule ha
d not
yet b
een
comp
leted
. This
is ex
pecte
d to b
e com
pleted
in th
e sec
ond h
alf of
2004
and i
t is ex
pecte
d tha
t in 20
05
fundin
g will
be by
activ
ity.
Re
lease
capit
al fun
ds tim
ely to
enab
le ea
rlier e
xecu
tion o
f pro
jects
Fund
ing pr
ofiles
are n
ow su
bmitte
d by M
inistr
ies, P
rovin
ces a
nd S
pend
ing A
genc
ies (M
PSAs
) eve
ry qu
arter
to
the T
reas
ury

75
Fu
nd pr
ovinc
es an
d loc
al go
vern
ment
direc
tly to
exec
ute th
eir pr
ogra
mmes
an
d be m
ade a
ccou
ntable
to th
eir co
mmun
ities a
s par
t of d
ecen
tralis
ation
Pr
ovinc
es ar
e fun
ded d
irectl
y whil
e Loc
al Go
vern
ment
(Cou
ncils
) are
not fu
nded
dire
ctly b
ut thr
ough
Mini
stry o
f Lo
cal G
over
nmen
t and
Hou
sing.
The
Dec
entra
lisati
on P
olicy
has n
ot ye
t bee
n imp
lemen
ted th
erefo
re fu
nding
co
uncil
s dire
ctly h
as no
t bee
n ope
ratio
nalis
ed.
Gu
aran
tee so
cial s
pend
ing an
d cap
ital e
xpen
ditur
e aga
inst e
xpen
ditur
e co
mpre
ssion
Mi
nistrie
s of H
ealth
and E
duca
tion a
re fu
nded
100%
(All t
heir m
onthl
y fun
ding r
eque
sts in
are b
eing m
et). F
or
capit
al ex
pend
iture
s, ev
ery m
onth,
depo
sits a
re m
ade i
n Acc
ount
49 fo
r Pov
erty
Redu
cing P
rogr
amme
s (PR
P’s)
, whic
h are
mos
tly ca
pital
expe
nditu
res.
Expu
nge D
istric
t Adm
inistr
ators
from
budg
et St
ill be
ing fu
nded
from
the n
ation
al bu
dget.
The
gove
rnme
nt ha
s dec
ided t
o reta
in the
Dist
rict A
dmini
strato
rs an
d has
sinc
e ren
amed
them
as D
istric
t Com
miss
ioner
s.
Re-o
rient
fisca
l reve
nue t
o sup
port
econ
omic
grow
th an
d pov
erty
redu
ction
Im
prov
e tax
comp
lianc
e so t
hat th
e tax
/GDP
ratio
reac
hes 2
0 per
cent
Tax a
dmini
strati
on ha
s imp
rove
d with
the T
ax/G
DP ra
tio at
abou
t 18 %
in 20
03 an
d exp
ected
to re
ach 1
8.7 %
in
2004
Redu
ce di
scre
tion i
n the
redu
ction
of ta
x rate
s and
on ta
xes
Ther
e is n
o disc
retio
n in t
he re
ducti
on of
tax r
ates a
s this
is do
ne th
roug
h the
enac
tmen
t of B
ills by
Par
liame
nt.
For t
he m
ining
comp
anies
that
were
gran
ted co
nces
sions
in th
eir D
evelo
pmen
t Agr
eeme
nts, m
ost o
f them
are
comi
ng to
an en
d in 2
005 a
nd G
over
nmen
t is ne
gotia
ting w
ith th
ese c
ompa
nies t
o ens
ure t
hat th
e at th
e co
nces
sions
that
will b
e pro
vided
are s
ustai
nable
, gen
eral
and n
on-d
iscre
tiona
ry.
At
tack l
eaka
ges i
n cus
toms d
uty co
llecti
ons
Gove
rnme
nt thr
ough
the Z
ambia
Rev
enue
Auth
ority
has i
ntrod
uced
a Fle
xible
Anti S
mugg
ling T
eam
(FAS
T) to
fol
low up
susp
ected
smug
gling
. Gov
ernm
ent h
as al
so fa
cilita
ted th
e acq
uisitio
n of m
otor v
ehicl
es an
d sp
eedb
oats
for Z
RA to
effec
tively
patro
l are
as su
spec
ted to
be ro
utes f
or sm
uggle
d goo
ds.
Tr
ansfo
rm co
llecti
on an
d utili
satio
n sys
tem go
vern
ing le
vies
Gove
rnme
nt ha
s emb
arke
d on m
oder
nizing
non-
tax re
venu
e coll
ectio
n to m
ake t
hem
effec
tive,
effici
ent a
nd
acco
untab
le. In
this
rega
rd, th
e Roa
d Tra
ffic C
ommi
ssion
has b
een c
ompu
terize
d so a
s to i
mpro
ve re
venu
e co
llecti
on an
d mini
mize
pilfe
rage
s. To
attai
n stab
le ma
croec
onom
ic en
viron
ment
throu
gh
prud
ent fi
scal
and m
oneta
ry po
licy
Ensu
re th
at de
bt re
lief a
nd pl
edge
d don
or su
ppor
t will
be ac
cess
ed he
nce
redu
cing t
he ne
ed to
borro
w fro
m Ba
nk of
Zam
bia
This
is on
cour
se. Z
ambia
was
plac
ed ba
ck on
the P
RGF
on 14
th Ju
ne 20
04 th
erefo
re ne
w pr
ogra
mme a
id inf
lows f
rom
dono
rs an
d bala
nce o
f pay
ments
are n
ow ex
pecte
d to r
esum
e (in
seco
nd ha
lf of 2
004,
US $2
0 mi
llion e
xpec
ted fr
om th
e Wor
ld Ba
nk, U
S $ f
orm
the E
urop
ean U
nion a
nd fo
rm th
e Afric
an D
evelo
pmen
t Ban
k.
This
will a
lso fa
cilita
te Za
mbia
reac
hing t
he H
IPC
Comp
letion
point
.
Plug
state
enter
prise
s los
ses a
nd pr
eser
ve B
ank o
f Zam
bia’s
finan
cial in
tegrity
The
loss
mak
ing st
ate en
terpr
ises h
ave p
repa
red t
heir s
urviv
al pla
ns w
hich G
over
nmen
t are
revie
wing
. Go
vern
ment
has a
lso ap
prov
ed a
Finan
cial S
ector
Dev
elopm
ent P
lan ai
med a
t add
ress
ing th
e fina
ncial
we
akne
ss of
state
owne
d Non
Ban
k F
Es
tablis
h mon
etary
contr
ol by
GRZ
refra
ining
from
borro
wing
from
BoZ
In
the 20
04 B
udge
t the f
iscal
defic
it has
been
limite
d to 2
.0 pe
rcent
of GD
P so
as to
cons
train
gove
rnme
nt bo
rrowi
ng to
2.2 %
of G
DP
Ma
ke op
en m
arke
t ope
ratio
ns m
ore t
rans
pare
nt, ef
ficien
t and
bette
r un
derst
ood b
y com
merci
al ba
nks a
nd ot
her s
takeh
older
s
En
cour
age t
he us
e of o
ther m
oney
mar
ket in
strum
ents
Gran
t BoZ
grea
ter le
gal a
nd op
erati
onal
auton
omy
This
is be
ing ad
dres
sed u
nder
the F
inanc
ial S
ector
Dev
elopm
ent P
lan (F
SDP)
whic
h was
sent
to Ca
binet
for
cons
idera
tion a
nd ap
prov
al in
June
2004

76
Objec
tive:
To
pro
mot
e a
self-
sust
aini
ng e
xpor
t-led
agr
icul
tura
l sec
tor w
hich
ens
ures
incr
ease
d ho
useh
old
inco
me
and
food
secu
rity
IN
TERM
EDIA
TE IN
DICA
TORS
Prog
ram
mes
or
Field
of i
nter
vent
ion
Pl
anne
d GR
Z
Inpu
ts
(K’ M
illion
)
Actu
al GR
Z In
puts
(K
’ Milli
on)
Plan
ned
Dono
r In
puts
Actu
al Do
nor
Inpu
ts
Plan
ned
Out
puts
Actu
al O
utpu
ts
Out g
rowe
r Sch
emes
9,
500,
6,80
0,
No
. of o
ut g
rowe
rs
targ
eted
for s
uppo
rt 5 o
ut g
rowe
r sch
emes
Cotto
n
2,00
0
1,50
0
300,0
00 fa
rmer
s
18,04
3 far
mers,
21,16
9 Ha,
expe
cted
yield
value
of K
23 b
To
bacc
o
2,00
0
800
800 f
arme
rs
98
3 far
mers,
89
1 hec
tares
, exp
ected
yield
value
of
K6.2
billio
n Co
ffee
2,
000
1,
500
50
0 far
mers
163 f
arme
rs
126 h
ectar
es, e
xpec
ted yi
eld va
lue of
K6
.9 bil
lion
Vege
tables
& P
aprik
a
2,00
0
2,00
0,
5000
farm
ers
2,
351 f
arme
rs
1,07
0 Ha,
expe
cted y
ield v
alue o
f K2.3
bil
lion,
Prom
otio
n of
Com
mer
cial
Agric
ultu
re
Dairy
1,500
1,00
0
120 f
arme
rs to
bene
fit
200 d
airy c
alf he
ifers
to be
pu
rchas
ed
Reha
bilit
atio
n of
agric
ultu
ral
Train
ing
inst
itutio
ns
2,87
0,
855
,
Zamb
ia Ins
titute
of An
imal
Healt
h 50
0,
500,
Reh
abilit
ation
wor
ks st
ill go
ing on
Ka
tete C
o-op
erati
ve C
olleg
e 30
0
Co-o
pera
tive C
olleg
e 3
70,
355,
R
ehab
ilitati
on w
orks
still
going
on
Land
and
infra
stru
ctur
e de
velo
pmen
t e.g
. fee
der r
oads
, war
e hou
ses
etc
Popo
ta To
bacc
o Tra
ining
Insti
tute
500
Kas
aka F
isher
ies
500
Zamb
ia Ce
ntre f
or H
ortic
ultur
e Tra
ining
70
0
Irriga
tion d
evelo
pmen
t and
Dam
cons
tructi
on
6
,000
2
,000
10
Irrig
ation
proje
cts
6
proje
cts im
pleme
nted
4
dams
cons
tructe
d,
1 da
m 90
% co
mplet
e 4
irriga
tion s
chem
es
40%
-50%
wor
ks co
mplet
ed
1Bor
ehole
,rese
vior&
pump
La
nd d
evelo
pmen
t pro
gram
me
15,00
0
2,65
0
Kalum
wang
e far
m blo
ck
5
,000
70
0
1hea
lth ce
ntre,1
00km
road
52
5 far
m plo
ts
1Hea
lth ce
ntre,2
0km
road
s
App
endi
x 2:
Agr
icul
ture
200
3

77
Nasa
nga f
arm
block
5,00
0 9
50
5 br
idges
,300k
m ro
ad
1214
farm
s 1
bridg
e, 16
km ro
ad
828 f
arms
plots
Lu
ena s
ugar
proje
ct
5,00
0 1
,000
advo
cacy
, 200
km ro
ads,
1601
farm
plots
50
km ro
ad
Rura
l Dev
elopm
ent
23
proje
cts st
arted
10
irriga
tion s
chem
es an
d dam
s R
ural
Inves
tmen
t Fun
d 1
,981.8
6
93.32
10 bo
reho
les, 3
farm
bloc
ks be
ing
deve
loped
S
oils a
nd cr
op re
sear
ch
500
5
5
Anim
al dr
ough
t pow
er
2
,000
500
30
rice f
armi
ng gr
oups
,150
hous
ehold
s, po
wer t
illers,
30
0 don
keys
,300 o
xen
60 do
nkey
s, 25
powe
r tille
rs 80
oxen
Pro
vision
of an
ti retr
ovira
l dru
gs
500
2
00
Ailin
g mem
bers
of sta
ff
Not
yet u
tilise
d due
to la
ck of
im
pleme
ntatio
n guid
eline
s
Tech
nolo
gy d
evelo
pmen
t and
pr
ovisi
on o
f agr
icultu
ral
exte
nsio
n
serv
ices f
or fo
od se
curit
y.
Comm
unity
radio
s 5
00
Inp
ut su
ppor
t pro
gram
me
10,00
0 3
1,914
.6
150,0
00 fa
rmer
s ben
efitte
d 74
8 mt c
erea
ls se
ed,10
38.2
mt
legu
me se
eds,
15,47
0mt
fertili
zer a
nd lim
e dist
ribute
d
Targ
eted
supp
ort s
yste
m fo
r fo
od se
curit
y
Seed
Mult
iplica
tion
1,06
0 4
64,
11
distric
ts re
ceive
d fun
ds

78
Objec
tive
To p
rom
ote a
self-
sust
ainin
g ex
port-
led ag
ricul
tura
l sec
tor w
hich
ensu
res i
ncre
ased
hou
seho
ld in
com
e and
food
secu
rity
IN
TERM
EDIA
TE IN
DICA
TORS
Prog
ram
mes
or
Field
of i
nter
vent
ion
Plan
ned
GRZ
In
puts
(K
’ Milli
on)
Actu
al GR
Z
Inpu
ts
(K’ M
illion
)
Plan
ned
Dono
r In
puts
Actu
al Do
nor
Inpu
ts
Plan
ned
Out
puts
Ac
tual
Outp
uts∗
Out g
rowe
r Sch
emes
Nu
mbe
r of o
ut-g
rowe
rs
targ
eted
for s
uppo
rt
Cotto
n 30
0 30
0
20
00 fa
rmer
s/150
0 Ha
To
bacc
o 30
0 30
0
10
00 fa
rmer
s/ 13
00 H
a
Coffe
e 35
0 35
0
100 f
arme
rs/20
0 H
Vege
tables
/Pap
rika
85
0 85
0
17
00 fa
rmer
s/ 10
00 H
a
Dairy
50
0 5
.4
Litre
s of d
airy p
rodu
cts
prod
uced
Prom
otio
n of
com
mer
cial
Agric
ultu
re
Cash
ew N
ut
100
100
3000
farm
ers/1
500 H
a
Irrig
atio
n de
velo
pmen
t pr
ogra
mm
e
Dam
cons
tructi
on/R
ehab
ilitati
on
Irriga
tion d
evelo
pmen
t
Land
dev
elopm
ent
prog
ram
me
Land
and
infra
stru
ctur
e dev
elopm
ent
e.g. f
eede
r roa
ds, w
are h
ouse
s etc
Kalum
wang
e far
m blo
ck
500
De
marca
tion/e
nviro
nmen
tal
Luen
a Far
m Bl
ock
500
im
pact
asse
ssme
nt
Nasa
nga f
arm
bloc
13,00
0
60km
trun
k roa
d, 20
0 km
farm
road
s, ele
ctrific
ation
, da
ms, b
ridge
s
Rura
l Inve
stmen
t Fun
d 1,
500
Ri
ce D
ehau
llers,
irriga
tion
sche
mes,
bore
holes
and
stora
ge sh
eds
Reha
bilit
atio
n of
agric
ultu
ral
Train
ing
inst
itutio
ns
Zamb
ia Ins
titute
of An
imal
Healt
h 4
00
Co
llege
Infra
struc
ture a
nd
Equip
ment
Co-o
pera
tive C
olleg
e 10
0
Poult
ry un
it
Kasa
ka F
isher
ies T
raini
ng In
stitut
e
200
Co
nstru
ction
of po
nds
Infra
struc
ture r
ehab
ilitati
on
App
endi
x 3:
Agr
icul
ture
200
4

79
Zamb
ia Ce
ntre f
or H
ortic
ultur
e Tr
aining
2
79
Tw
o 40 H
.P. W
ater p
umps
Tw
o 40 H
.P. E
lectric
al Mo
tors
Two s
witch
pane
ls Fo
ur 6m
*6" a
lumini
um su
ction
pip
es
Far
m In
stitu
tes a
nd T
rain
ing
ce
ntre
s reh
abilit
atio
n
100
M
ainten
ance
of bu
ilding
s at
Mans
a, Ke
mbe &
Na
muka
shen
de F
TI's
Agric
ultur
e Res
earch
1,
500
6.2
Ha,
20.75
Ha s
eed,
crop
prote
ction
, dem
onstr
ation
s
Farm
Adv
isory
serv
ices
700
Par
ticipa
tory E
xtens
ion ap
proa
ch
500
Exten
sion m
anua
ls
Con
serva
tion f
armi
ng
100
Fa
rmer
s and
staff
Foo
d pro
cess
ing an
d utili
zatio
n 1
00.9
Ex
tensio
n staf
f, far
mers,
wom
en
Prov
ision
of an
ti-retr
ovira
l dru
gs
557
Rese
arch
adop
tion a
nd pr
omoti
on
of
small
scale
equip
ment
100
Re
sear
ch an
d tria
ls
Tech
nolo
gy d
evelo
pmen
t and
pr
ovisi
on o
f agr
icultu
ral e
xten
sion
se
rvice
s for
food
secu
rity.
Farm
ers r
egist
ratio
ns
50
far
mers
regis
ter
Comm
unity
Rad
ios
600
Free
play
radio
s
Anim
al Di
seas
e Con
trol
1
,000
Ma
nufac
ture a
nd P
rocu
reme
nt of
vacc
ines
Lives
tock R
estoc
king M
onito
ring
50
0
Mo
nitor
ing vi
sits
Fish
eries
Ext
ensio
n 1,
000
F
isher
ies C
o-ma
nage
ment
5
00
Aw
aren
ess c
ampa
igns,
Train
ing in
kape
nta ne
t co
nstru
ction
Aqua
cultu
re D
evelo
pmen
t
500
Site
selec
tion -
4 pe
r pro
vince
, 90
0 far
mers
at 36
sites
to be
tra
ined ,
720 p
onds
at 36
sites
to
be c
onstr
ucted
72
fish f
arms
- pon
d stoc
king
Co
-ope
rativ
e edu
catio
n and
train
ing
421.3
Targ
eted
supp
ort s
yste
m fo
r In
put s
uppo
rt pr
ogra
mm
e

80
Fertil
iser s
uppo
rt pr
ogra
mme
+ 70
,000
36,7
44
3200
0mt fe
rtilize
r, 16
00mt
se
ed
1500
0mt o
f fertil
iser,
1600
mt of
se
ed
Seed
Mult
iplica
tion
128
,5
Cr
op M
arke
ting
Foo
d Res
erve
Age
ncy
47,20
0 20
,509.6
8
62
,000 m
etric
tons o
f maiz
e pu
rchas
es
13,50
0 metr
ic ton
s of m
aize
purch
ases
food
secu
rity
Dairy
Out-
grow
er sc
heme
5
00
Lit
res o
f dair
y pro
ducts
pr
oduc
ed

81
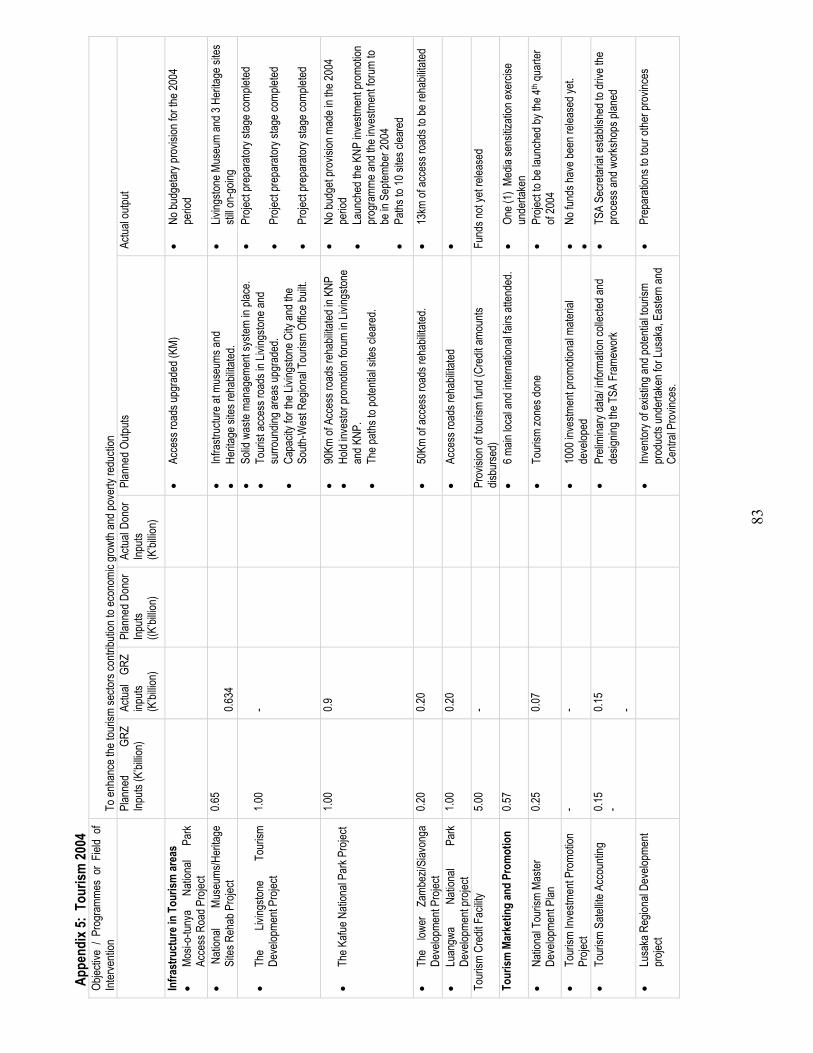
Ob
jectiv
e /
Prog
ramm
es
or
Field
of Int
erve
ntion
To
enha
nce t
he to
urism
secto
rs co
ntribu
tion t
o eco
nomi
c gro
wth a
nd po
verty
redu
ction
Plan
ned
GRZ
Inputs
(K
’billio
n)
Actua
l GR
Z inp
uts
(K’bi
llion)
Plan
ned D
onor
Inp
uts (K
’billio
n)
Actua
l Don
or
Inputs
(K’bi
llion)
Pl
anne
d Outp
uts
Actua
l outp
ut
Infra
stru
ctur
e in
Tour
ism ar
eas
• Mo
si-o-
tunya
Na
tiona
l Pa
rk Ac
cess
Ro
ad P
rojec
t 0.8
0.6
5
•
Acce
ss ro
ads u
pgra
ded (
KM)
• 15
Km
acce
ss ro
ads
reha
bilita
ted
• Na
tiona
l Mu
seum
s/Her
itage
Si
tes
Reha
b Pro
ject
1.05
0.30
• Inf
rastr
uctur
e at m
useu
ms an
d he
ritage
sites
reha
bilita
ted.
• Liv
ingsto
ne M
useu
m an
d 3
Herita
ge si
tes st
ill un
derg
oing
reha
bilita
tion
• Th
e Liv
ingsto
ne T
ouris
m De
velop
ment
Proje
ct
0.5
0.5
• So
lid w
aste
mana
geme
nt sy
stem
in pla
ce
• To
urist
acce
ss ro
ads i
n Liv
ingsto
ne an
d sur
roun
ding a
reas
up
grad
ed.
• Ca
pacit
y for
the L
iving
stone
City
an
d the
Sou
th-W
est R
egion
al To
urism
Offic
e buil
t.
• Pr
oject
prep
arato
ry sta
ge
comp
leted
•
Proje
ct pr
epar
atory
stage
co
mplet
ed
• Pr
oject
prep
arato
ry sta
ge
comp
leted
• Th
e Ka
fue N
ation
al Pa
rk De
velop
ment
Proje
ct 2.0
3
0.60
• 90
Km of
Acc
ess r
oads
re
habil
itated
in K
afue N
ation
al Pa
rk
• 58
Km
of ac
cess
road
s bein
g re
habil
itated
in K
afue N
ation
al Pa
rk •
The
lower
Za
mbez
i/Siav
onga
De
velop
ment
Proje
ct 2.3
0.60
•
50 K
m of
acce
ss ro
ads
reha
bilita
ted.
• 13
Km of
acce
ss ro
ads t
o be
re-a
dver
tised
• Lu
angw
a Na
tiona
l Pa
rk De
velop
ment
proje
ct 2.6
2
1.50
• Ac
cess
road
s reh
abilit
ated
• Za
mbia
Wild
life A
uthor
ity ha
s be
en co
ntrac
ted to
reha
bilita
te 40
Km of
acce
ss ro
ads.
Prom
otio
n of
Inve
stm
ent i
n th
e Tou
rism
se
ctor
• To
urism
Cre
dit F
acilit
y
5.0
5.0
• Pr
ovisi
on of
tour
ism fu
nd (C
redit
am
ounts
disb
urse
d)
• Fo
rty th
ree m
icro,
small
and
mediu
m En
terpr
ises
Tour
ism M
arke
ting
and
Prom
otio
n 1.7
3 0.
35
6 main
loca
l and
inter
natio
nal fa
irs
atten
ded.
• 3 i
ntern
ation
al tra
de fa
irs
atten
ded.
• Pr
oject
not y
et lau
nche
d. •
Natio
nal T
ouris
m Ma
ster D
evelo
pmen
t Pl
an
1.05
0.10
To
urism
zone
s don
e •
1000
prom
otion
al ma
terial
s ha
ve be
en do
ne (b
roch
ures
an
d CDs
for K
NP)
• To
urism
Inve
stmen
t Pro
motio
n Pro
ject
2.6
0.
30
1000
inve
stmen
t pro
motio
nal
mater
ial de
velop
ed
• Re
ports
on P
relim
inary
data/
inf
orma
tion f
rom
other
co
untrie
s coll
ected
on th
e TS
A.
• To
urism
Sate
llite A
ccou
nting
- 0.
56
0.35
Pr
elimi
nary
data/
infor
matio
n co
llecte
d
App
endi
x 4:
Tou
rism
200
3

82
• Lu
saka
Reg
ional
Deve
lopme
nt pr
oject
0.20
0.
20
Inven
tory o
f exis
ting a
nd po
tentia
l tou
rism
prod
ucts
unde
rtake
n for
Lu
saka
, Eas
tern a
nd C
entra
l Pr
ovinc
es
Repo
rt on
the I
nven
tory o
f exis
ting
and p
otenti
al tou
rism
prod
ucts
unde
rtake
n for
Lusa
ka, E
aster
n and
Ce
ntral
Prov
inces
. •
Comm
unity
Par
ticipa
tion i
n Wild
life
cons
erva
tion
• Co
mmun
ity
Alter
nativ
e So
urce
of
incom
e
0.42
-
• No
. of g
ame m
anag
emen
t (GM
As)
• No
t fund
ed
•
• Pr
ivate
Secto
r Ca
pacit
y Bu
ilding
&
Huma
n res
ource
deve
lopme
nt 2.
00
-
•
175 p
eople
train
ed pe
r pro
vince
•
Not fu
nded
83
Appe
ndix
5: T
ouris
m 20
04
Objec
tive
/ Pro
gram
mes
or F
ield
of Int
erve
ntion
To
enha
nce t
he to
urism
secto
rs co
ntribu
tion t
o eco
nomi
c gro
wth a
nd po
verty
redu
ction
Plan
ned
GRZ
Inputs
(K’bi
llion)
Ac
tual
GRZ
inputs
(K
’billio
n)
Plan
ned
Dono
r Inp
uts
((K’bi
llion)
Actua
l Don
or
Inputs
(K
’billio
n)
Plan
ned O
utputs
Ac
tual o
utput
Infra
stru
ctur
e in
Tour
ism ar
eas
• Mo
si-o-
tunya
Na
tiona
l Pa
rk Ac
cess
Roa
d Pro
ject
• Ac
cess
road
s upg
rade
d (KM
) •
No bu
dgeta
ry pr
ovisi
on fo
r the
2004
pe
riod
• N
ation
al Mu
seum
s/Her
itage
Si
tes R
ehab
Pro
ject
0.65
0.6
34
• Inf
rastr
uctur
e at m
useu
ms an
d •
Herita
ge si
tes re
habil
itated
. •
Living
stone
Mus
eum
and 3
Her
itage
sites
sti
ll on-
going
•
The
Living
stone
To
urism
De
velop
ment
Proje
ct
1.00
-
• So
lid w
aste
mana
geme
nt sy
stem
in pla
ce.
• To
urist
acce
ss ro
ads i
n Livi
ngsto
ne an
d su
rroun
ding a
reas
upgr
aded
. •
Capa
city f
or th
e Livi
ngsto
ne C
ity an
d the
So
uth-W
est R
egion
al To
urism
Offic
e buil
t.
• Pr
oject
prep
arato
ry sta
ge co
mplet
ed
• Pr
oject
prep
arato
ry sta
ge co
mplet
ed
• Pr
oject
prep
arato
ry sta
ge co
mplet
ed
• Th
e Kafu
e Nati
onal
Park
Proje
ct
1.00
0.9
• 90
Km of
Acc
ess r
oads
reha
bilita
ted in
KNP
•
Hold
inves
tor pr
omoti
on fo
rum
in Liv
ingsto
ne
and K
NP.
• Th
e path
s to p
otenti
al sit
es cl
eare
d.
• No
budg
et pr
ovisi
on m
ade i
n the
2004
pe
riod
• La
unch
ed th
e KNP
inve
stmen
t pro
motio
n pr
ogra
mme a
nd th
e inv
estm
ent fo
rum
to be
in S
eptem
ber 2
004
• Pa
ths to
10 si
tes cl
eare
d
• Th
e low
er
Zamb
ezi/S
iavon
ga
Deve
lopme
nt Pr
oject
0.20
0.20
• 50
Km of
acce
ss ro
ads r
ehab
ilitate
d. •
13km
of ac
cess
road
s to b
e reh
abilit
ated
• Lu
angw
a Na
tiona
l Pa
rk De
velop
ment
proje
ct 1.0
0 0.2
0
•
Acce
ss ro
ads r
ehab
ilitate
d •
Tour
ism C
redit
Fac
ility
5.00
-
Pr
ovisi
on of
tour
ism fu
nd (C
redit
amou
nts
disbu
rsed)
Fu
nds n
ot ye
t rele
ased
Tour
ism M
arke
ting
and
Prom
otio
n 0.5
7
•
6 main
loca
l and
inter
natio
nal fa
irs at
tende
d. •
One (
1) M
edia
sens
itizati
on ex
ercis
e un
derta
ken
• Na
tiona
l Tou
rism
Maste
r De
velop
ment
Plan
0.2
5 0.0
7
•
Tour
ism zo
nes d
one
• Pr
oject
to be
laun
ched
by th
e 4th q
uarte
r of
2004
•
Tour
ism In
vestm
ent P
romo
tion
Proje
ct -
-
•
1000
inve
stmen
t pro
motio
nal m
ateria
l de
velop
ed
• No
fund
s hav
e bee
n rele
ased
yet.
•
• To
urism
Sate
llite A
ccou
nting
0.1
5 -
0.15
-
• Pr
elimi
nary
data/
infor
matio
n coll
ected
and
desig
ning t
he T
SA F
rame
work
• TS
A Se
cretar
iat es
tablis
hed t
o driv
e the
pr
oces
s and
wor
ksho
ps pl
aned
• Lu
saka
Reg
ional
Deve
lopme
nt pr
oject
• Inv
entor
y of e
xistin
g and
poten
tial to
urism
pr
oduc
ts un
derta
ken f
or Lu
saka
, Eas
tern a
nd
Centr
al Pr
ovinc
es.
• Pr
epar
ation
s to t
our o
ther p
rovin
ces
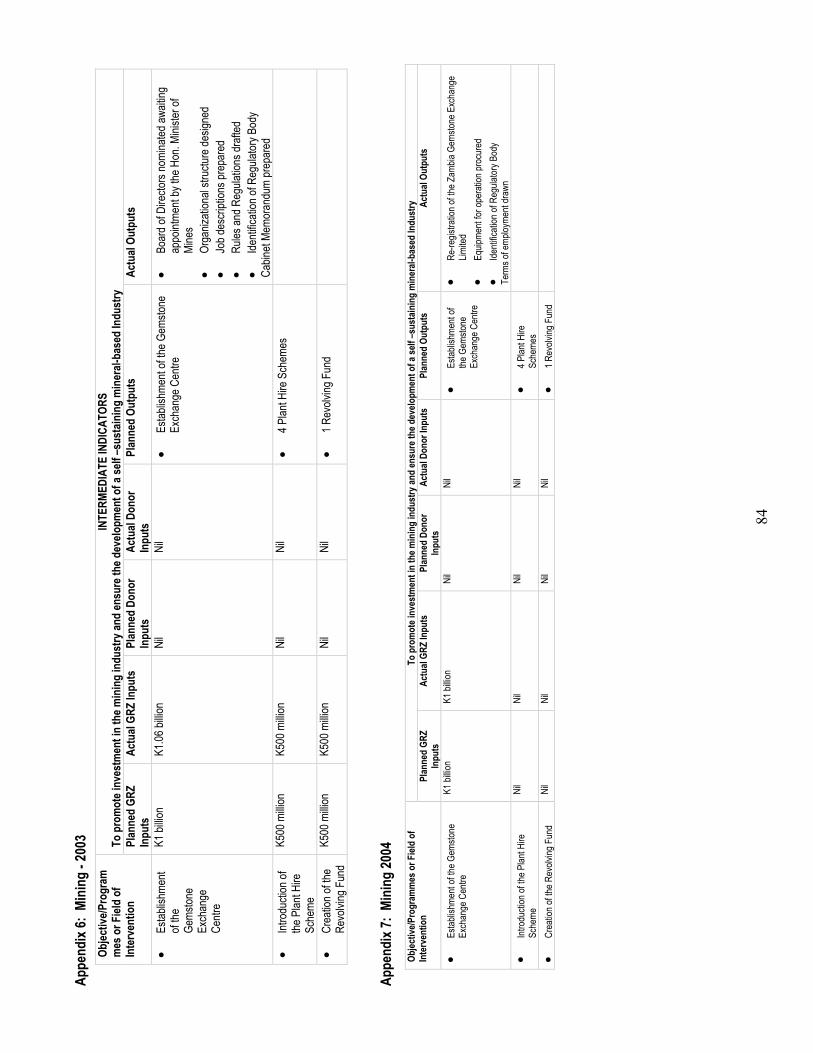
84
Appe
ndix
6: M
inin
g - 2
003
Appe
ndix
7: M
inin
g 20
04
INTE
RMED
IATE
INDI
CATO
RS
To p
rom
ote i
nves
tmen
t in
the m
inin
g in
dust
ry an
d en
sure
the d
evelo
pmen
t of a
self
–sus
tain
ing
min
eral-
base
d In
dust
ry
Objec
tive/P
rogr
amm
es o
r Fiel
d of
In
terv
entio
n Pl
anne
d GR
Z In
puts
Ac
tual
GRZ
Inpu
ts
Plan
ned
Dono
r In
puts
Ac
tual
Dono
r In
puts
Pl
anne
d Ou
tput
s Ac
tual
Outp
uts
• Es
tablis
hmen
t of
the
Gems
tone
Exch
ange
Ce
ntre
K1 bi
llion
K1.06
billio
n Ni
l Ni
l •
Estab
lishm
ent o
f the G
emsto
ne
Exch
ange
Cen
tre
• Bo
ard o
f Dire
ctors
nomi
nated
await
ing
appo
intme
nt by
the H
on. M
iniste
r of
Mine
s •
Orga
nizati
onal
struc
ture d
esign
ed
• Jo
b des
cripti
ons p
repa
red
• Ru
les an
d Reg
ulatio
ns dr
afted
•
Identi
ficati
on of
Reg
ulator
y Bod
y Ca
binet
Memo
rand
um pr
epar
ed
• Int
rodu
ction
of
the P
lant H
ire
Sche
me
K500
milli
on
K500
milli
on
Nil
Nil
• 4 P
lant H
ire S
chem
es
• Cr
eatio
n of th
e Re
volvi
ng F
und
K500
milli
on
K500
milli
on
Nil
Nil
• 1 R
evolv
ing F
und
To p
rom
ote i
nves
tmen
t in
the m
inin
g in
dust
ry an
d en
sure
the d
evelo
pmen
t of a
self
–sus
tain
ing
min
eral-
base
d In
dust
ry
Objec
tive/P
rogr
amm
es o
r Fiel
d of
In
terv
entio
n Pl
anne
d GR
Z In
puts
Ac
tual
GRZ
Inpu
ts
Plan
ned
Dono
r In
puts
Ac
tual
Dono
r Inp
uts
Plan
ned
Outp
uts
Actu
al Ou
tput
s
• Es
tablis
hmen
t of th
e Gem
stone
Ex
chan
ge C
entre
K1
billio
n K1
billio
n Ni
l Ni
l •
Estab
lishm
ent o
f the
Gem
stone
Ex
chan
ge C
entre
• Re
-regis
tratio
n of th
e Zam
bia G
emsto
ne E
xcha
nge
Limite
d •
Equip
ment
for op
erati
on pr
ocur
ed
• Ide
ntific
ation
of R
egula
tory B
ody
Term
s of e
mploy
ment
draw
n •
Intro
ducti
on of
the P
lant H
ire
Sche
me
Nil
Nil
Nil
Nil
• 4 P
lant H
ire
Sche
mes
• Cr
eatio
n of th
e Rev
olving
Fun
d Ni
l Ni
l Ni
l Ni
l •
1 Rev
olving
Fun
d
85
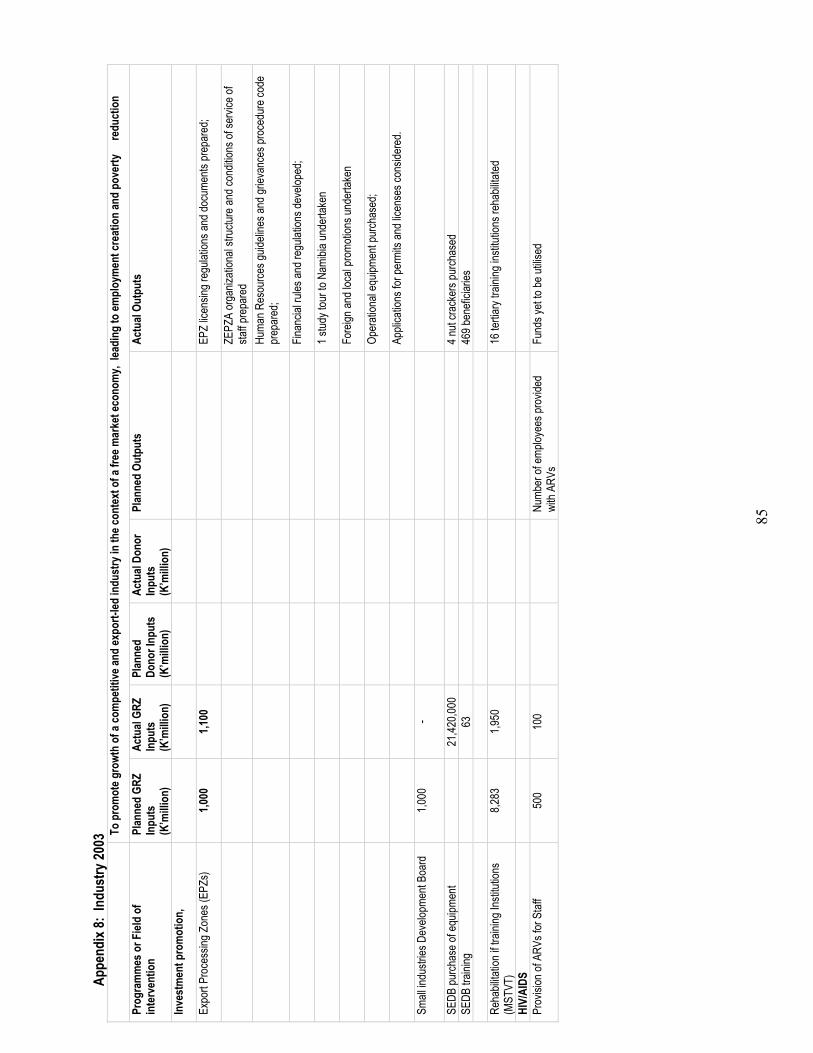
Appe
ndix
8: In
dust
ry 20
03
To
pro
mot
e gro
wth
of a
com
petit
ive an
d ex
port-
led in
dust
ry in
the c
onte
xt o
f a fr
ee m
arke
t eco
nom
y, le
adin
g to
empl
oym
ent c
reat
ion
and
pove
rty
redu
ctio
n
Prog
ram
mes
or F
ield
of
inte
rven
tion
Plan
ned
GRZ
Inpu
ts
(K’m
illion
)
Actu
al GR
Z In
puts
(K
’milli
on)
Plan
ned
Dono
r Inp
uts
(K’m
illion
)
Actu
al Do
nor
Inpu
ts
(K’m
illion
)
Plan
ned
Outp
uts
Actu
al Ou
tput
s
Inve
stm
ent p
rom
otio
n,
Expo
rt Pr
oces
sing Z
ones
(EPZ
s)
1,000
1,1
00
EP
Z lic
ensin
g reg
ulatio
ns an
d doc
umen
ts pr
epar
ed;
ZEPZ
A or
ganiz
ation
al str
uctur
e and
cond
itions
of se
rvice
of
staff p
repa
red
Huma
n Res
ource
s guid
eline
s and
griev
ance
s pro
cedu
re co
de
prep
ared
;
Finan
cial ru
les an
d reg
ulatio
ns de
velop
ed;
1 stud
y tou
r to N
amibi
a und
ertak
en
Fore
ign an
d loc
al pr
omoti
ons u
nder
taken
Oper
ation
al eq
uipme
nt pu
rchas
ed;
Appli
catio
ns fo
r per
mits
and l
icens
es co
nside
red.
Small
indu
stries
Dev
elopm
ent B
oard
1,0
00
-
SEDB
purch
ase o
f equ
ipmen
t
21,42
0,000
4 nut
crack
ers p
urch
ased
SE
DB tr
aining
63
46
9 ben
eficia
ries
Re
habil
itatio
n if tr
aining
Insti
tution
s (M
STVT
) 8,2
83
1,950
16 te
rtiary
traini
ng in
stitut
ions r
ehab
ilitate
d
HIV/
AIDS
Pr
ovisi
on of
ARV
s for
Staf
f 50
0 10
0
Nu
mber
of em
ploye
es pr
ovide
d wi
th AR
Vs
Fund
s yet
to be
utilis
ed

86
Appe
ndix
9: In
dust
ry 20
04
To p
rom
ote g
rowt
h of
a co
mpe
titive
and
expo
rt-led
indu
stry
in th
e con
text
of a
free
mar
ket e
cono
my,
leadi
ng to
empl
oym
ent c
reat
ion
and
pove
rty re
duct
ion
Prog
ram
mes
or F
ield
of in
terv
entio
n Pl
anne
d GR
Z In
puts
(K
’milli
on)
Actu
al GR
Z In
puts
(K
’milli
on)
Plan
ned
Dono
r Inp
uts
(K’m
illion
)
Actu
al Do
nor
Inpu
ts
(K’m
illion
)
Plan
ned
Outp
uts
Actu
al
Expo
rt an
d In
vest
men
t Pro
mot
ion
Dome
stic
and f
oreig
n inv
estm
ent P
romo
tion
1,426
28
Ta
x Har
mon
isatio
n (L
evel
the p
layin
g fie
ld)
Priva
te-Pu
blic P
artne
rship
Institu
tiona
l cap
acity
bu
ilding
20
0 24
,
Loca
l emp
ower
ment
of Sm
all sc
ale in
dustr
ies
100
39
Small
scale
Indu
stries
Ass
ociat
ion of
Zam
bia
100
38
No. o
f Exh
ibitio
ns at
2 Ag
ric. s
hows
Ex
hibite
d at 2
Agr
ic. sh
ows
no
. sem
inar o
n pro
ject m
gt.
1 sem
inar o
n pro
ject m
gt.
Priva
tisat
ion
Prom
otio
n
Na
tion w
ide su
rvey o
f MSE
s 70
0 48
5
1 N
ation
wide
surve
y
Zamb
ia Pr
ivatis
ation
agen
cy
850
180
Small
scale
Ent
erpr
ise P
rom
otio
n
Nu
mber
of M
SME
traini
ng ce
ntres
Prom
otion
of Lo
cal p
rodu
cts
440
403
Imple
menta
tion o
f trad
e rem
edies
25
5 23
3
11 tr
aining
wor
ksho
ps un
derta
ken
SEDB
skills
train
ing ac
tivitie
s
379 b
enefi
ciarie
s sup
porte
d Mi
ne m
onito
ring p
rocu
reme
nt pr
oject
235
215
Sens
itisati
on of
AGO
A Ca
nadia
n Init
iative
, GSP
s 19
5 17
8
Ch
ange
in th
e volu
me of
expo
rts to
USA
, Can
ada
etc
No
of ne
w Za
mbian
firms
to en
ter jo
int ve
nture
s with
US
A
Zamb
ia W
eights
and m
easu
res A
genc
y 35
0 32
0
9 P
rovin
cial w
orks
hops

87
Appe
ndix
10:
Ener
gy 20
04
Field
s of i
nter
vent
ion/
Pro
gram
mes
Ob
jectiv
e: T
o en
sure
opt
imum
supp
ly an
d ut
ilisat
ion
of en
ergy
GR
Z Pl
anne
d In
puts
(K
’milli
on)
GRZ
Actu
al In
puts
(K
’milli
on)
Plan
ned
Dono
r In
puts
(K
’milli
on)
Actu
al Do
nor
Inpu
ts
(K’m
illion
)
Plan
ned
Outp
uts
Actu
al Ou
tput
s
Elec
tricit
y acc
ess f
or ru
ral
and
urba
n ar
eas
11.03
0.4
9 8.1
43
-
1.
Rura
l Elec
trifica
tion M
aster
Plan
0.2
5 0.0
24
0 0
A na
tiona
l Imple
menta
tion M
aster
plan
for
rura
l elec
trifica
tion
An a
ction
plan
has b
een d
rawn
up fo
r dev
elopin
g the
Ru
ral E
lectrif
icatio
n Mas
ter P
lan.
2. Na
nsan
ga fa
rm B
lock E
lectrif
icatio
n 0.4
8 0.4
6 0
0 Co
nstru
cted a
nd en
ergiz
ed ov
erhe
ad hy
dro
electr
icity
lines
in N
ansa
nga f
arm
block
A
n Inte
r Mini
steria
l Com
mitte
e, to
over
see t
he
imple
menta
tion o
f the p
rojec
t, has
been
cons
tituted
an
d has
been
mee
ting
3. Ru
ral E
lectrif
icatio
n 9.0
0
38 id
entifi
ed ru
ral a
reas
from
all p
rovin
ces
electr
ified
4.Pow
er R
ehab
ilitati
on P
roj. G
wemb
e -
- 8.1
4 0
5. So
lar E
nerg
y Ser
vices
Pro
ject
1.52
0 0
0
Pr
omot
ion
of th
e use
of a
ltern
ative
ener
gy
reso
urce
s and
redu
ctio
n in
dep
ende
ncy o
n fu
elwoo
d 9.3
9 0.7
9 -
-
1. Bi
o Gas
0.1
2 0.0
1 0
0 Su
rveye
d are
as w
ith bi
ogas
dige
sters.
4 ins
talled
biog
as pl
ants.
E
valua
tion e
xerci
se is
being
done
.
2. En
ergy
Exp
lorati
on
0.19
0.17
0 0
A co
mpile
d rep
ort o
n petr
oleum
ex
plora
tions
. A da
ta ba
se w
ith in
forma
tion
on hy
droc
arbo
n pote
ntials
in th
e Cou
ntry
Explo
ratio
n Stra
tegy p
aper
being
wor
ked o
n
3. Ge
l Fue
l 0.1
4 0.1
2 0
0 N
o. of
HH us
ing G
el Fu
el fro
m a p
ilot
proje
ct.
An ac
tion p
lan ha
s bee
n dra
wn up
invo
lving
the
purch
ase a
nd di
stribu
tion o
f app
roxim
ately
2,000
sto
ves a
nd th
e gel
fuel.
4. Liq
uidfie
d Petr
oleum
Gas
(LPG
) 0.3
1 0.3
0 0
0 Im
pleme
ntatio
n of 2
prom
otion
al pil
ot pr
ojects
A
n acti
on pl
an fo
r the
diss
emina
tion o
f the L
PG
Stov
es ha
s bee
n dra
wn up
for d
istrib
ution
of ab
out
1,000
stov
es to
iden
tified
hous
ehold
s 5.
Impr
oved
Coo
kstov
es
0.17
0.17
0 0
Incre
ased
acce
ss to
infor
matio
n on
impr
oved
cook
stov
e tec
hnolo
gy.
Incre
ased
use o
f the i
mpro
ved c
ook s
tove
The a
ction
plan
on pr
omoti
ng th
e use
of im
prov
ed
cook
stov
es ha
s bee
n dra
wn up
for d
istrib
uting
2,50
0 im
prov
ed co
ok st
oves
in 6
(six)
area
s in L
usak
a pr
ovinc
e and
3 (th
ree)
on th
e Cop
per b
elt by
end o
f ye
ar.
6. Gl
obal
Villa
ge E
nerg
y Par
tnersh
ip (G
VEP)
0.01
0.01
0 0
Imple
menta
tion o
f a nu
mber
of c
o-or
dinati
on ac
tivitie
s of G
VEP
throu
gh
partn
ersh
ip
A G
VEP
Wor
king G
roup
has b
een s
et up
for
coor
dinati
ng en
ergy
proje
cts/ac
tivitie
s in Z
ambia
. The
Gr
oup,
comp
rises
mem
bersh
ip fro
m GR
Z, P
rivate
Se
ctor,
NGOs
, indiv
iduals
, etc.
El
ectri
city e
xpor
ts
- -
68.34
-
Prog
ram
mes
:

88
1. Za
mbia-
Tanz
ania-
Keny
a Pow
er
Inter
conn
ector
To
tal Lo
ad of
200 M
W of
hydr
o Pow
er
throu
gh a
330 k
V tra
nsmi
ssion
line
cove
ring 6
00KM
on Z
ambia
n Side
and 1
00
KM on
Tan
zania
n side
.
Phas
e 1
feasib
ility s
tudy r
epor
t has
bee
n su
bmitte
d by
the
cons
ultan
ts.
Th
e co
nsult
ants
have
also
sub
mitte
d dr
aft s
olicit
ation
do
cume
nts w
hich
have
bee
n re
viewe
d by
the
three
co
untrie
s (Za
mbia,
Tan
zania
and K
enya
). Th
e no-
objec
tion f
rom
the W
orld
Bank
is be
ing
await
ed fo
r the
fund
ing to
cove
r the
Env
ironm
ental
an
d Soc
ial Im
pact
Asse
ssme
nt (E
SIA)
for t
he
Tanz
anian
Inter
nal R
einfor
ceme
nt an
d for
use t
o en
gage
cons
ultan
ts for
contr
act n
egoti
ation
s. Th
e stu
dy is
estim
ated t
o cos
t US$
300,0
00.
2. Za
mbia/
Nami
bia T
rans
miss
ion
68.34
Supp
ly an
d ef
ficien
t use
of p
etro
leum
-
- -
-
Se
ctor
Tot
al 11
.96
1.27
76.48
-

89
Appe
ndix
11 a:
Infra
stru
ctur
e
Objec
tive:
Con
struc
tion o
f roa
d wor
ks an
d pub
lic bu
ilding
s to e
nhan
ce re
venu
e coll
ectio
n and
fast
clear
ing of
truc
ks.
Prog
ram
me
Plan
ned
GRZ
Inpu
ts
K’ m
illion
Actu
al GR
Z In
put K
`milli
on
Plan
ned
Dono
r In
puts
Actu
al Do
nor
Inpu
ts
20
03
2004
20
03
2004
Plan
ned
Outp
uts
Actu
al Ou
tput
s
Road
wor
ks/ci
vil w
orks
at
Chiru
ndu B
ridge
10,01
8
13,40
5 -
- -
Ro
ads,
parki
ng ba
ys, c
ycle
paths
, othe
r civ
il wor
ks
95%
of th
e wor
ks ha
ve be
en do
ne
Polic
e stat
ion
0
3,6
32
Polic
e Stat
ion
Wor
ks co
mplet
ed w
ith on
ly fue
l tank
s yet
to be
ins
talled
Co
nstru
ction
of F
reigh
t Te
rmina
l
12,02
5
0
Fr
ight te
rmina
l buil
ding
Tend
ering
finali
sed.
Wor
ks to
take
46 w
eeks
.
Cons
tructi
on of
Pa
ssen
ger C
ontro
l Bu
ilding
4,5
27
0
Pass
enge
r con
trol b
uildin
g Te
nder
ing fin
alise
d. W
orks
to ta
ke 52
wee
ks.
Cons
tructi
on of
Hou
ses
3,3
09
5,0
91
50 S
taff h
ouse
s 50
hous
es co
mplet
ed.
Cons
ultan
cy
1,0
00
1,8
19
Cons
ultan
cy
Sewe
rage
Disp
osal
Syste
m
4,300
0
Se
wer d
ispos
al sy
stem
Await
ing G
RZ F
inanc
ing
Wate
r Tre
atmen
t Plan
t
780
92
2
W
ater T
reatm
ent P
lant
98%
of w
orks
done
Ad
minis
trativ
e cos
ts
250
Bilat
eral/
site m
eetin
g
New
Gove
rnme
nt Co
mplex
2,0
82
80
0 67
8 33
0
Comm
unica
tion t
ruck
ing an
d duc
ts,
Finish
es to
the b
uildin
g, pr
ovisi
on of
lifts,
ele
ctrici
ty an
d tele
phon
es
The
lifts
and
telep
hone
s we
re in
stalle
d. (2
004)
Te
nder
pr
oced
ures
ha
d sta
rted
for
the
instal
lation
of el
ectric
ity.
Katim
amuli
lo Inf
rastr
uctur
e 20
0
7,2
C
onstr
uctio
n of th
e bor
der p
ost s
uppo
rt inf
rastr
uctur
e P
rojec
t is a
t Ten
der s
tage
Tota
l
36,75
9
25,44
9
Ap
pend
ix 11
b: I
nfra
stru
ctur
e 200
3 – Ju
ne 20
04
Ob
jectiv
e: R
enov
ation
s of p
ublic
build
ings t
o enh
ance
good
wor
king e
nviro
nmen
t. Pr
ogra
mm
e Pl
anne
d GR
Z In
puts
K’
milli
on
Actu
al GR
Z In
put
K`m
illion
Pl
anne
d Do
nor
Inpu
ts
Actu
al Do
nor
Inpu
ts
20
03
2004
20
03
2004
Plan
ned
Outp
uts
Actu
al Ou
tput
s
Kitw
e Voc
ation
al Tr
aining
Cen
tre
Reno
vatio
ns
50
0
75
Re
nova
tions
to be
Com
pleted
in 16
we
eks
10%
of W
orks
done
Luan
shya
In-se
rvice
Tru
st Re
nova
tions
271
54
Reno
vatio
ns to
be C
omple
ted in
8 we
eks
50%
of W
orks
done
Zamb
ia Ins
titute
of Bu
sines
s & In
dustr
ial
Trus
t ren
ovati
ons
32
1
188
Co
mplet
e wor
ks in
16 w
eeks
95
% W
orks
comp
leted
Powe
r sub
statio
n
1,000
0
Powe
r sub
statio
n Aw
aiting
fund
ing
Gene
rator
1,000
0
Gene
rator
Aw
aiting
fund
ing
Audit
or G
ener
al’s O
ffice r
ehab
ilitati
on
1,2
31
1,0
88
Co
mplet
e reh
abilit
ation
wor
ks
Wor
ks co
mplet
ed
Maxw
ell H
ouse
Ren
ovati
on
35
0
233
Co
mplet
e wor
ks in
16 w
eeks
W
orks
comp
leted

90
Natio
nal In
stitut
e for
Scie
ntific
& In
dustr
ial
Rese
arch
Ren
ovati
ons
31
0
299
Co
mplet
e wor
ks in
8 we
eks
Wor
ks co
mplet
ed
Comm
unica
tions
Auth
ority
Offic
e Bloc
k
189
16
3
Comp
lete w
orks
in 9
week
s W
orks
comp
leted
Ev
elyn H
one P
aram
edica
l Coll
ege
Reno
vatio
ns
14
9
149
Co
mplet
e wor
ks in
8 we
eks
Wor
ks co
mplet
ed
Subt
otal
5,3
21
2,2
49
Ap
pend
ix 11
c: In
frast
ruct
ure 2
003 –
June
2004
OBJE
CTIV
E: F
easib
ility s
tudy a
nd pr
elimi
nary
engin
eerin
g des
igns f
or up
grad
ing/co
nstru
ction
of th
e roa
ds an
d brid
ges
Prog
ram
me
Plan
ned
GRZ
Inpu
ts
K’ m
illion
Ac
tual
GRZ
Inpu
t K`
milli
on
Plan
ned
Dono
r In
puts
Ac
tual
Dono
r In
puts
2003
20
04
2003
20
04
Plan
ned
Outp
uts
Actu
al Ou
tput
s K’
milli
on
Samf
ya-L
ubwe
-Luw
ingu R
oad F
easib
ility S
tudy
80
0
Inc
eptio
n re
port
Await
ing G
RZ
Finan
cing
Chiaw
a Brid
ge F
easib
ility S
tudy
80
0
Inc
eptio
n re
port
Await
ing
GRZ
Finan
cing
Zamb
ezi B
ridge
Fea
sibilit
y Stud
y
400
Incep
tion
repo
rt Aw
aiting
GR
Z Fin
ancin
g Ch
itimuk
ulu F
easib
ility S
tudy
60
0
Inc
eptio
n re
port
Await
ing
GRZ
Finan
cing
Itezh
i-tezh
i Roa
d Fea
sibilit
y Stud
y
391
37
0
Inc
eptio
n re
port
Luan
gwa
Brid
ge
– Mw
ami
bord
er
deta
iled
desig
n
2,579
2,500
Inc
eptio
n re
port
Upgr
ading
of P
edicl
e Roa
d Fea
sibilit
y Stud
y
1,000
Inc
eptio
n re
port
Aw
aiting
GR
Z Fin
ancin
g Ch
embe
Brid
ge F
easib
ility S
tudy
57
5
264
Incep
tion
Repo
rt
Incep
tion R
epor
t re
ceive
d Su
btot
al
9,149
264
Appe
ndix
11 d
: In
frast
ruct
ure 2
003 –
June
2004
-Per
iodi
c Main
tena
nce P
rogr
amm
es.
OB
JECT
IVE:
Reh
abilit
ation
, pav
ing an
d rec
onstr
uctio
n of th
e roa
d. Pr
ogra
mm
e Pl
anne
d GR
Z In
puts
K’m
illion
Ac
tual
GRZ
Inpu
ts
K’m
illion
Pl
anne
d Do
nor
Inpu
ts K
’milli
on
Actu
al Do
nor I
nput
s K’
milli
on
20
03
2004
20
03
2004
20
03
2004
20
03
2004
Plan
ned
Outp
uts
Actu
al Ou
tput
s
Make
ni-Ka
fue R
oad
14
4456
0000
3999
9840
0
1444
5585
600
67
9873
9200
50
km ro
ad
maint
ained
44
km pa
ved (
asph
alt);
25km
shou
lder
15km
reco
nstru
ction
; Lu
saka
-Mak
eni
Road
Re
habil
itatio
n
1624
9968
00
400
16
2499
6320
0
2640
8832
00
4.1km
road
ma
intain
ed
Drain
age w
orks
, layin
g of s
ervic
e duc
ts in
prog
ress
. Lu
saka
-Kab
we R
oad
38
6998
5600
0
3869
9841
600
10
7127
2640
0 57
km ro
ad
maint
ained
20
km of
edge
repa
ir is c
omple
te,
10km
over
lay co
mplet
ed.
Subt
otal
69
3954
4404
800
69
3953
9240
4
2015
2350
8043

91
Appe
ndix
11 e:
Infra
stru
ctur
e 200
3 – Ju
ne 20
04 C
onst
ruct
ion
and
Reha
bilit
atio
n Pr
ogra
mm
es
OB
JECT
IVE:
Re
habil
itatio
n and
cons
tructi
on of
road
s and
bridg
es w
ith dr
ains a
nd m
itre dr
ains c
leare
d of s
ilt an
d veg
etatio
n con
trol a
nd cu
lvert
maint
enan
ce.
Prog
ram
me
Plan
ned
GRZ
Inpu
ts
K’ m
illion
Ac
tual
GRZ
Inpu
ts K
' milli
on
Plan
ned
Dono
r Inp
uts K
' m
illion
Ac
tual
Dono
r Inp
uts
K'm
illion
2003
20
04
2003
20
04
2003
20
04
2003
20
04
Plan
ned
Outp
uts
Actu
al Ou
tput
s
Living
stone
-Ses
heke
Ro
ad
32
,902
0
135,8
42
0 20
2km
reha
bilita
ted
202k
m of
reha
bilita
tion w
orks
done
Lusa
ka-M
ongu
Rd
Ph
ase I
2,294
0
22,94
3
2,294
Ph
ase I
167k
m re
habil
itated
60
Km of
reha
bilita
tion c
omple
ted
Katim
amuli
lo Br
idge
9,1
38
25
0
47,38
0
0 88
0m B
ridge
co
nstru
cted
880 m
etres
long
x 10
.0 me
tre w
idth
comp
leted
Mong
u-Ka
labo R
oad
9,1
20
0
92
,832
13,24
6
74km
road
co
nstru
cted
25km
Clea
red;
25km
Exc
avate
d 1k
m cu
t, 69
km e
arthw
orks
, 48K
m Lo
wer
selec
ted su
b gra
de
Ching
ola-K
asum
bales
a Ro
ad
12
,720
20
0
360
0
45 km
Roa
d Re
habil
itated
Te
nder
docu
ments
comp
leted
and
works
comm
ission
ed
Subt
otal
66
,174
45
0 29
9,358
16
3,515
15
,539
OBJE
CTIV
E: M
ainten
ance
of th
e roa
d, mi
tre dr
ains c
leare
d of s
ilt an
d veg
etatio
n con
trol a
nd cu
lvert
maint
enan
ce.
Prog
ramm
e Pl
anne
d GRZ
/Don
or
Inputs
K’ m
illion
Ac
tual G
RZ In
puts
K' m
illion
Pl
anne
d Don
or
Inputs
K' m
illion
Ac
tual D
onor
Inp
uts K
'milli
on
20
03
2004
20
03
2004
20
03
2004
20
03
2004
Plan
ned
Outpu
ts Ac
tual O
utputs
Nyim
ba –
Peta
uke
– Si
nda
-Ka
tete R
oad
19
,612
10
,895
173k
m re
paire
d 90
km ve
getat
ion co
ntrol;
80 km
of E
dge r
epair
s; 80
km of
potho
le pa
tching
. 29 k
m se
aling
Ch
ingola
-Solw
ezi R
oad
27
,239
14
,500
132 k
m co
mplet
ed by
en
d 200
4
26km
resh
aped
, Sho
ulder
reco
nstru
ction
66.7k
m
Potho
le pa
tching
132k
m do
ne; L
evell
ing co
urse
26
km
Subto
tal
48
,855
27
,399
App
endi
x 11
f: I
nfra
stru
ctur
e 20
03 –
Jun
e 20
04.

92
Ap
pend
ix 11
g:
Infra
stru
ctur
e 200
3 – Ju
ne 20
04 F
eede
r Roa
ds R
ehab
ilitat
ion
CENT
RAL
PROV
INCE
OB
JECT
IVE:
He
avy g
radin
g with
drain
s and
mitre
drain
s clea
red o
f silt
and v
egeta
tion c
ontro
l and
culve
rt m
ainten
ance
Pr
ogra
mm
e Pl
anne
d GR
Z/Do
nor
Inpu
ts K
’ milli
on
Actu
al GR
Z In
puts
K' m
illion
Pl
anne
d Do
nor
Inpu
ts K
' milli
on
Actu
al Do
nor
Inpu
ts
K'm
illion
Plan
ned
Outp
uts
Actu
al Ou
tput
s
20
03
2004
20
03
2004
20
03
2004
Ka
nona
-Kun
dalili
a Roa
d
150
59
13
k m g
rade
d 12
.9km
of gr
ading
and m
itre dr
ains
comp
leted
Mu
mbwa
-Blue
Lago
on R
oad
25
0
285
80 k
m gr
aded
12
km of
the r
oad g
rade
d with
ve
getat
ion co
ntrol
and w
orks
are
ongo
ing.
Kapo
po-G
reat
North
Roa
d
250
75
0
30
k m
grad
ed
30km
grad
ed w
ith dr
ains a
nd m
itre
drain
s clea
red.
Muso
fu Ro
ad
25
0
25
30km
grad
ed
30km
has b
een r
e-gr
avell
ed
Kano
na-L
usiw
asi R
oad
10
0
246
82km
grad
ed
41km
of m
ainten
ance
of dr
ains h
as
been
comp
leted
and w
orks
are
ongo
ing.
Mumb
wa-It
ezhit
ezhi
Road
549
63
10
1 km
grad
ed
50km
of ro
ad gr
aded
with
mitre
dr
ains a
nd ve
getat
ion cl
eare
d Mu
mbwa
-Kain
du R
oad
50
0
743
75km
grad
ed
62km
gra
ded w
ith dr
ains a
nd m
itre
drain
s clea
red
Mans
hya/S
eren
je Fa
rm B
lock
1,0
00
0
Fa
rm ro
ads o
pene
d up.
Await
ing fin
ancin
g Mu
lekate
mbo-
Mwen
ewisi
-Mpa
ngala
Ro
ad
50
0
0
Gr
ading
of th
e roa
d Aw
aiting
finan
cing
Mumb
wa-K
asem
pa R
oad
50
0
0
Gr
ading
of 18
1 km
of the
road
Aw
aiting
finan
cing
Subt
otal
6,0
53
41
75
CO
PPER
BELT
PRO
VINC
E
Ka
lulus
hi-Lu
fwan
yama
Roa
d
100
36
0
0
0 Gr
ading
of 35
km of
the r
oad
Lu
ansh
ya-M
pong
we–L
uans
obe R
oad
0
30
0
0
0 Re
cons
tructi
on of
107 k
m of
the
road
1.
Luan
shya
-Mpo
ngwe
co
mplet
ed bu
t last
stretc
h Wor
ks
susp
ende
d Ol
d Con
go R
oad
90
0
96
0
0
Grad
ing 11
0 km
of the
road
Aw
aiting
finan
cing
Kalul
ushi-
Sabin
a Roa
d
250
0
0
0
Grad
ing of
13.8
km of
the r
oad
Await
ing fin
ancin
g Mp
ongw
e–Ma
chiya
Roa
d
900
12
2
0
0 Gr
ading
of th
e roa
d W
orks
are o
n goin
g Su
btot
al
2150
878
0
0
. EAS
TERN
PRO
VINC
E
C
hipata
-Lun
dazi
Road
9,306
4,633
Ma
inten
ance
of 1
00 km
of th
e ro
ad
100 k
m ve
getat
ion co
ntrol;
80 km
Ed
ge re
pairs
; poth
ole pa
tching
; Sl
urry
seali
ng co
mplet
ed
0
2,824
Ma
inten
ance
of 7
9 km
the ro
ad
79 km
vege
tation
contr
ol, E
dge
repa
irs &
potho
le pa
tching
; Lu
ndaz
i-Chit
ungu
lu Rd
300
0
Grad
ing of
the r
oad
Await
ing fin
ancin
g Ms
oro-
Katet
e D 12
4 Roa
d
624
0
Grad
ing of
50 km
of th
e roa
d Aw
aiting
finan
cing

93
Katet
e-Ch
adidz
a Roa
d
500
0
Grad
ing of
the r
oad
Await
ing fin
ancin
g
Chad
idza-
Kazim
ule R
d
500
0
Gr
ading
of 26
km of
the r
oad
Await
ing fin
ancin
g Ms
oro-
Katet
e Roa
d (L
upan
de B
ridge
)
600
13
1
Co
nstru
ction
of 5
5.2 km
Brid
ge
wor
ks on
going
Chilo
ngoz
i-Sind
a Roa
d
500
0
Gr
ading
of th
e roa
d Aw
aiting
finan
cing
Chipa
ta-Ch
adidz
a Rd
40
0
0
Grad
ing of
97.4
km of
the r
oad
Await
ing fin
ancin
g Lu
ndaz
i-Mala
wi B
orde
r
200
0
Gr
ading
of 1
5.4 km
of th
e roa
d Aw
aiting
finan
cing
Mvuy
e Brid
ge-P
etauk
e
250
50
Co
nstru
ction
of 1
bridg
e W
orks
on go
ing
Nyim
ba-M
tirizi
Road
300
0
Gr
ading
of 3
0 km
of the
road
Aw
aiting
finan
cing
Nyim
ba-U
totwe
Roa
d
300
9
Grad
ing of
25 k
m of
the ro
ad
Wor
ks on
going
Lu
ndaz
i-Cha
ma R
oad
50
0
0
Gr
ading
of 1
51 km
the r
oad
Await
ing fin
ancin
g Ka
sene
ngwa
–Chiw
oko
0
10
0
Gr
ading
of th
e roa
d W
orks
on go
ing on
force
acco
unt
Subt
otal
27
,567
14
,962
LUAP
ULA
PROV
INCE
Mw
ense
-Mwe
nda R
oad
20
0
0
Grad
ing of
62.3
km of
the r
oad
Await
ing fin
ancin
g Nc
helen
ge-K
awam
bwa R
oad
50
0
146
Grad
ing of
60 k
m of
the ro
ad
Wor
ks on
going
Sa
mfya
-Kas
aba R
oad
50
0
52
Grad
ing of
75.8
km of
the r
oad
Wor
ks on
going
Mu
wang
uni B
ridge
400
50
Co
nstru
ction
of 1
Brid
ge
Await
ing fin
ancin
g Mp
orok
oso-
Bulay
a-Ka
puta-
Munu
nga
Road
1,000
133
Grad
ing of
198
km of
the r
oad
Wor
ks on
going
Kapu
ta-Mu
nung
a Roa
d
500
47
Gr
ading
of 10
4 km
of the
road
W
orks
susp
ende
d Ns
umbu
-Bula
ya R
oad
15
0
0
Grad
ing of
the r
oad
Await
ing
finan
cing
Kash
ikish
i-Lun
chind
a
0
200
Grad
ing of
132 k
m of
the r
oad
Wor
ks su
spen
ded
Kawa
mbwa
-Mus
hota
55
0
12
Grad
ing of
33.8
km of
the r
oad
Ma
nsa-
Milen
ge R
oad
30
0
0
Gr
ading
of 30
km of
the r
oad
Await
ing fin
ancin
g Su
btot
al
14,16
7
7,904
LU
SAKA
PRO
VINC
E
Ka
seng
a Brid
ge
60
0
70
Cons
tructi
on of
1 Br
idge
Wor
ks on
going
Ch
irund
u-Ch
iawa R
oad
50
0
167
Grad
ing of
73 k
m of
the ro
ad
Wor
ks on
going
Sh
ikabe
ta-Ch
ing’om
be R
oad
30
0
0
Grad
ing of
35.4
km of
the r
oad
Await
ing fin
ancin
g Mw
amolo
-Via
Luko
shi-L
eopa
rds
Hill
Road
500
0
Grad
ing of
10 k
m of
the ro
ad
Await
ing fin
ancin
g
Chak
weng
a Ro
ad
50
0
0
Gr
ading
of 6
7.6 km
of th
e roa
d Aw
aiting
finan
cing
Mun
gwi-O
ld M
umbw
a-Ka
supe
Rd
1,
100
0
Grad
ing of
the r
oad
Await
ing fin
ancin
g Su
btot
al
1704
323
NORT
HERN
PRO
VINC
E
Mb
ala-T
anza
nia B
orde
r Roa
d
400
17
6,
Grad
ing 20
.6 km
and d
raina
ge
works
Chiun
dapo
nde-
Muwe
le Ro
ad
40
0
21
Grad
ing 7
0 km
and d
raina
ge
works
Kasa
ma-L
uwing
u Roa
d
12,00
0
10,98
0
Gr
ading
150k
m &
drain
age w
orks
60
km e
arth
works
, 30k
m pa
veme
nt,
45km
surfa
ce dr
essin
g Na
kond
e-Ma
lawi B
orde
r Roa
d
1,200
100
Grad
ing 49
km an
d dra
inage
wor
ks
Wor
ks on
going
Ka
puta-
Kasa
ma R
oad
50
0
0
Grad
ing 72
.3 km
& dr
ainag
e wor
ks
Await
ing fin
ancin
g Ns
umbu
-Bula
ya R
oad
15
0
124
Grad
ing 43
.1 km
& dr
ainag
e wor
ks
Wor
ks on
going
Mb
esum
a Brid
ge
1,0
00
0
Co
nstru
ction
of 1
Brid
ge
Await
ing fin
ancin
g
Tot
al
0
0
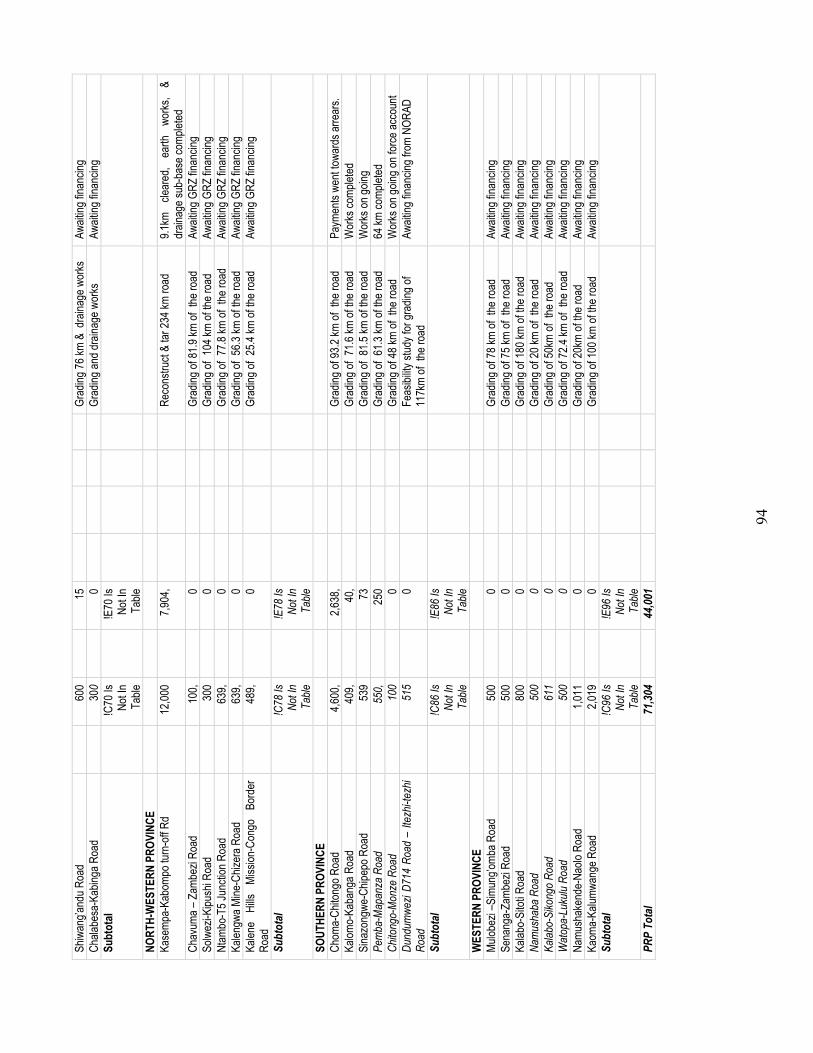
94
Shiw
ang’a
ndu R
oad
60
0
15
Grad
ing 76
km &
dra
inage
wor
ks
Await
ing fin
ancin
g Ch
alabe
sa-K
abing
a Roa
d
300
0
Grad
ing an
d dra
inage
wor
ks
Await
ing fin
ancin
g Su
btot
al
!C70
Is
Not In
Ta
ble
!E
70 Is
No
t In
Table
NORT
H-W
ESTE
RN P
ROVI
NCE
Kase
mpa-
Kabo
mpo t
urn-
off R
d
12,00
0
7,904
,
Re
cons
truct
& tar
234 k
m ro
ad
9.1km
cle
ared
, ea
rth
works
, &
drain
age s
ub-b
ase c
omple
ted
Chav
uma –
Zam
bezi
Road
100,
0
Grad
ing of
81.9
km of
the r
oad
Await
ing G
RZ fin
ancin
g So
lwez
i-Kipu
shi R
oad
30
0
0
Gr
ading
of 1
04 km
of th
e roa
d Aw
aiting
GRZ
finan
cing
Ntam
bo-T
5 Jun
ction
Roa
d
639,
0
Grad
ing of
77.8
km of
the r
oad
Await
ing G
RZ fin
ancin
g Ka
lengw
a Mine
-Chiz
era R
oad
63
9,
0
Gr
ading
of 5
6.3 km
of th
e roa
d Aw
aiting
GRZ
finan
cing
Kalen
e Hi
lls
Miss
ion-C
ongo
Bo
rder
Ro
ad
48
9,
0
Gr
ading
of 2
5.4 km
of th
e roa
d Aw
aiting
GRZ
finan
cing
Subt
otal
!C
78 Is
No
t In
Table
!E
78 Is
No
t In
Table
SOUT
HERN
PRO
VINC
E
Ch
oma-
Chito
ngo R
oad
4,6
00,
2,6
38,
Grad
ing of
93.2
km of
the r
oad
Paym
ents
went
towar
ds ar
rear
s. Ka
lomo-
Kaba
nga R
oad
40
9,
40,
Grad
ing of
71.6
km of
the r
oad
Wor
ks co
mplet
ed
Sina
zong
we-C
hipep
o Roa
d
539
73
Gr
ading
of 8
1.5 km
of th
e roa
d W
orks
on go
ing
Pem
ba-M
apan
za R
oad
55
0,
25
0
Gr
ading
of 6
1.3 km
of th
e roa
d 64
km co
mplet
ed
Chito
ngo-
Mon
ze R
oad
10
0
0
Gr
ading
of 48
km of
the r
oad
Wor
ks on
going
on fo
rce ac
coun
t Du
ndum
wezi
D714
Roa
d –
Itezh
i-tezh
i Ro
ad
51
5
0
Fe
asibi
lity st
udy f
or gr
ading
of
117k
m of
the r
oad
Await
ing fin
ancin
g fro
m NO
RAD
Subt
otal
!C
86 Is
No
t In
Table
!E
86 Is
No
t In
Table
WES
TERN
PRO
VINC
E
Mu
lobez
i –Si
mung
’omba
Roa
d
500
0
Grad
ing of
78 km
of th
e roa
d Aw
aiting
finan
cing
Sena
nga-
Zamb
ezi R
oad
50
0
0
Gr
ading
of 75
km of
the r
oad
Await
ing fin
ancin
g Ka
labo-
Sitot
i Roa
d
800
0
Grad
ing of
180 k
m of
the ro
ad
Await
ing fin
ancin
g Na
mus
haba
Roa
d
500
0
Grad
ing of
20 km
of th
e roa
d Aw
aiting
finan
cing
Kalab
o-Si
kong
o Ro
ad
61
1
0
Gr
ading
of 50
km of
the r
oad
Await
ing fin
ancin
g W
atop
a-Lu
kulu
Road
500
0
Grad
ing of
72.4
km of
the r
oad
Await
ing fin
ancin
g Na
mush
aken
de-N
aolo
Road
1,011
0
Gr
ading
of 20
km of
the r
oad
Await
ing fin
ancin
g Ka
oma-
Kalum
wang
e Roa
d
2,019
0
Gr
ading
of 10
0 km
of the
road
Aw
aiting
finan
cing
Subt
otal
!C
96 Is
No
t In
Table
!E
96 Is
No
t In
Table
PRP
Tota
l
71,30
4
44,00
1

95
Ap
pend
ix 11
h:
Infra
stru
ctur
e 200
3 – Ju
ne 20
04: C
omm
unica
tions
and
Tran
spor
t 200
3-Ju
ne 20
04
Prog
ram
me
Plan
ned
GRZ
inpu
t k’ m
illion
An
nual
GRZ
Inpu
t K’
milli
on
Plan
ned
dono
r Ac
tual
dono
r Pl
anne
d ou
tput
Actu
al Ou
tput
Cons
tructi
on of
Chip
ata-M
chinj
i 1,4
78
1,478
0
0 Fe
asibi
lity st
udy c
omple
ted by
4 Qt
r 200
4 Ra
ilway
line c
onstr
ucted
by 20
06
Feas
ibility
Stud
y ong
oing
Wate
rway
s Man
agem
ent
550,
550
0 0
Cana
ls cle
ared
in 4
prov
inces
Ann
ually
Ni
l De
velop
ment
of Inf
orma
tion a
nd
Comm
unica
tion T
echn
ology
Poli
cy
287
0 US
$ 270
,000 (
IDA)
0
ICT
Polic
y dev
elope
d Dr
aft D
ocum
ent P
rodu
ced
Reha
bilita
tion o
f Airp
orts
3,777
0 0
Airp
orts
reha
bilita
ted
Chipa
ta Ai
rpor
t reh
ab co
mplet
ed
South
down
Airp
ort c
ivil w
orks
unde
r pro
cure
ment
Traff
ic Inf
orma
tion S
ystem
24
3, 0
0 0
ZAMT
IS e
stabli
shme
nt co
mplet
ed
ZAMT
IS es
tablis
hmen
t still
on-g
oing
Road
Safe
ty Ac
tion P
lan
646
0 US
$ 275
,000 (
IDA)
US
$
To
tal
6,188

96
Appe
ndix
12a:
2003
Bas
ic an
d Un
ivers
ity E
duca
tion
Jan-
Dec 2
003
GRZ
INPU
TS
DONO
R IN
PUTS
OUTP
UTS
Prog
ram
mes
Pl
anne
d Ac
tual
Plan
ned
Actua
l Pl
anne
d Ac
tual
Cons
tructi
on
Of
Rura
l Se
c Sc
hools
9,000
,000,0
00
0
Co
nstru
ction
of
rura
l Se
cond
ary s
choo
ls
Teac
her
Rura
l Ha
rdsh
ip all
owan
ce
2,000
,000,0
00
Fiv
e sele
cted r
ural
prov
inces
: W
ester
n, N/
Wes
tern,
Luap
ula, E
aster
n and
No
rther
n
.
Teac
her
Rura
l Ho
using
10
,000,0
00,00
0
Scho
ol Re
quisi
tes
10,00
0,000
,000
3,000
,000,0
00
Supp
ly tex
t boo
ks to
all
scho
ols
3,433
,244 b
ks
15,00
0scie
kits
5,000
sciec
harts
HI
V/
AIDS
pr
ovisi
on o
f ARV
s to
staff
1,500
,000,0
00
500,0
00,00
0
Inf
ected
mem
bers
of sta
ff 10
1 ARV
cour
ses
Scho
ol fee
ding
& de
-wor
ming
2,0
00,00
0,000
0
Feed
ing an
d de-
worm
ing in
Pi
lot sc
hools
Al
l pilo
t sch
ools
reac
hed
and
prog
. Exte
nded
usin
g do
nor f
undin
g Co
nstru
ction
of
Chins
ali C
olleg
e 1,5
00,00
0,000
50
0,000
,000
Comp
letion
of C
olleg
e Co
nstru
ction
wor
k pro
gres
sing
UNZA
re
habil
itatio
n 4,0
00,00
0,000
50
0,000
,000
Conc
rete
roof
rese
aling
, re
vamp
ing of
in-h
ouse
wate
r su
pply,
repla
ceme
nt of
defec
tive s
anita
ry fitt
ings,
Paint
ing an
d car
pentr
y re
pairs
Wate
r re
ticula
tion
syste
m an
d ho
stels
partia
lly
reha
bilita
ted
CBU
reha
bilita
tion
3,000
,000,0
00
500,0
00,00
0
Re
habil
itatio
n of w
ater
retic
ulatio
n sys
tem an
d ho
stels.
Wate
r sys
tem a
nd st
uden
t hos
tels r
ehab
ilitate
d
Tota
l 43
,000,0
00,00
0 5,1
80,00
0,000

97
Appe
ndix
12b:
2004
Bas
ic an
d Un
ivers
ity E
duca
tion
Ja
n–Ju
ne 20
04
GRZ
Inputs
Do
nor I
nputs
Ou
tputs
Prog
ramm
es
Plan
ned
Actua
l Pl
anne
d Ac
tual
Plan
ned
Actua
l
Rura
l Har
dship
All.
2,000
,000,0
00
324,5
69,00
0 0
0 Fiv
e sele
cted
rura
l pro
vince
s: W
ester
n, N/
Wes
tern,
Luap
ula,
Easte
rn an
d Nor
thern
Paid
all to
teac
hers
in fiv
e se
lected
prov
inces
,
CBU
Reha
bilita
tion
2,250
,000,0
00
2,250
,000,0
00
0 0
Comp
lete r
ehab
ilitati
on of
CBU
UNZA
Re
habil
itatio
n 4,8
82,00
0,000
4,8
82,00
0,000
544,0
00,00
0 Co
ncre
te ro
of re
seali
ng,
reva
mping
of in
-hou
se w
ater
supp
ly, re
place
ment
of de
fectiv
e sa
nitar
y fitti
ngs,
Paint
ing an
d ca
rpen
try re
pairs
Comm
unity
Sch
ool.
Supp
ort
3,000
,000,0
00
2,486
,000,0
00
0 0
All C
ommu
nity S
choo
ls re
gister
ed
with
the M
oE
Bursa
ry Pr
ovisi
on
3,000
,000,0
00
2,486
,854,1
55
All id
entifi
ed O
VCs
713 O
VCs
bene
fited
HIV/
AIDS
aw
aren
ess a
t Wor
k Pl
ace
1,500
,000,0
00
243,4
27,07
8
Mo
E sta
ff, Te
ache
rs an
d Lea
rner
s At
tende
d wor
ksho
ps an
d tra
ined
in HI
V/AI
DS m
atter
s.
Total
16
,6320
00,00
0 10
,971,7
12,91
1

98
Appe
ndix
12 c:
Edu
catio
n 20
03 T
ertia
ry E
duca
tion
Prog
ram
mes
or
Field
of i
nter
vent
ion
Pl
anne
d GR
Z
Inpu
ts
(K’ M
illion
)
Actu
al GR
Z In
puts
(K
’ Milli
on)
Plan
ned
Dono
r In
puts
Actu
al Do
nor
Inpu
ts
Plan
ned
I Out
puts
Actu
al Ou
tput
s
Nkum
bi Int
erna
tiona
l Coll
ege
reha
bilita
tion
100,0
00,00
0 10
0,000
,000
Reha
bilita
tion o
f five
hoste
ls Fiv
e hos
tels
reha
bilita
ted
Luan
shya
Tra
des T
raini
ng
institu
te 20
0,000
,000
200,0
00,00
0
Re
nova
te 3 s
tuden
t hos
tels
W
ork i
n pro
gres
s.
Luka
shya
Tra
des T
raini
ng
institu
te 15
0,000
,000
150,0
00,00
0
Re
habil
itate
3 stud
ent h
ostel
s 3 s
tuden
t hos
tels r
enov
ated
Kabw
e Tra
des T
raini
ng In
stitut
e 10
0,000
,000
100,0
00,00
0
Re
habil
itate
hoste
ls
Lusa
ka B
usine
ss an
d Tec
hnica
l co
llege
10
0,000
,000
100,0
00,00
0
Re
nova
te stu
dent
Kitch
en
Draw
ings
read
y an
d wo
rk ten
dere
d
Living
stone
Tra
des T
raini
ng
Institu
te 10
0,000
,000
100,0
00,00
0
Re
nova
te stu
dent
hoste
ls
Kaom
a Tra
des T
raini
ng In
stitut
e 20
0,000
,000
200,0
00,00
0
1,000
conc
rete
block
s mo
ulded
2 B
oreh
oles s
unk
Mwini
lunga
Tra
des T
raini
ng
Institu
te*
200,0
00,00
0 20
0,000
,000
Reha
bilita
te St
uden
t hos
tels
Ukwi
mi T
rade
s Tra
ining
insti
tute
200,0
00,00
0 20
0,000
,000
30
,000b
locks
mo
ulded
Ch
oma T
rade
s Tra
ining
Ins
titute
100,0
00,00
0 10
0,000
,000
On
e hos
tel re
habil
itated
Ol
d kitc
hen e
quipm
ent r
eplac
ed
Solw
ezi T
rade
s Tra
ining
Ins
titute
100,0
00,00
0 10
0,000
,000
Co
nstru
ction
of
class
room
bloc
ks
Chipa
ta Tr
ades
Tra
ining
Ins
titute
100,0
00,00
0 10
0,000
,000
Cons
tructi
on of
clas
sroom
s an
d offic
es
North
ern T
echn
ical C
olleg
e 10
0,000
,000
100,0
00,00
0
Re
nova
tion o
f 4 ho
stels
On
e hos
tel
comp
leted
, 3 p
artia
lly co
mplet
e
Kasiy
a Sec
retar
iat
Reha
bilita
tion
100,0
00,00
0 10
0,000
,000
Reha
bilita
te 3
stude
nt ho
stels
All 3
hoste
ls re
habil
itated
Ki
twe
Voca
tiona
l Tr
aining
Ins
titute
100,0
00,00
0 10
0,000
,000
Reno
vate
1 male
hoste
l an
d buil
d 2 ki
tchen
s
1 male
hoste
l, 2
kitch
ens c
onstr
ucted
Zamb
ia Ai
r Se
rvice
Tr
aining
Ce
ntre
Reha
bilita
tion
100,0
00,00
0 10
0,000
,000
Reha
bilita
te sto
re r
oom
and
instal
l new
cook
er
Instal
led in
dustr
ial
Cook
er an
d cold
Ro
om
Tota
l 6,0
60,00
0,000
1,9
50,00
0,000
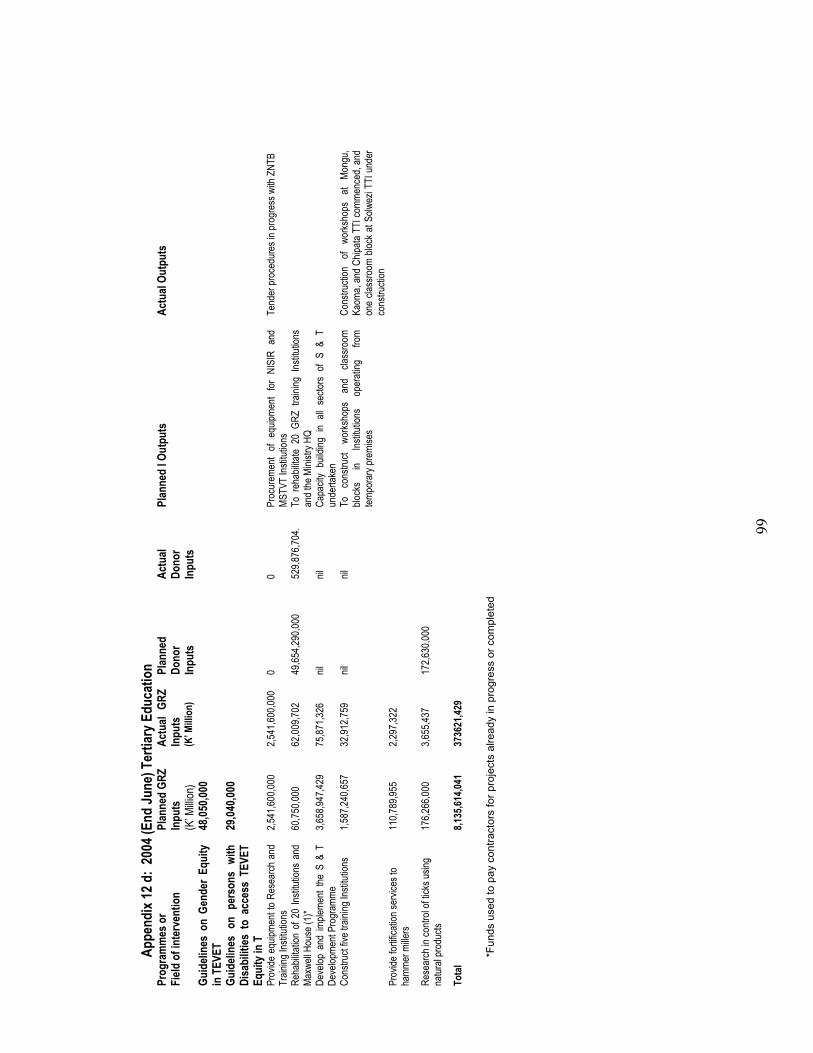
99
Appe
ndix
12 d
: 20
04 (E
nd Ju
ne) T
ertia
ry E
duca
tion
Prog
ram
mes
or
Field
of i
nter
vent
ion
Pl
anne
d GR
Z
Inpu
ts
(K’ M
illion
)
Actu
al GR
Z In
puts
(K
’ Milli
on)
Plan
ned
Dono
r In
puts
Actu
al Do
nor
Inpu
ts
Plan
ned
I Out
puts
Actu
al Ou
tput
s
Guid
eline
s on
Gen
der
Equi
ty
in T
EVET
48
,050,0
00
Guid
eline
s on
per
sons
with
Di
sabi
lities
to
acce
ss T
EVET
Eq
uity
in T
29,04
0,000
Prov
ide e
quipm
ent t
o Re
sear
ch a
nd
Train
ing In
stitut
ions
2,541
,600,0
00
2,541
,600,0
00
0 0
Proc
urem
ent
of eq
uipme
nt for
NIS
IR a
nd
MSTV
T Ins
titutio
ns
Tend
er pr
oced
ures
in pr
ogre
ss w
ith Z
NTB
Reha
bilita
tion
of 20
Insti
tution
s an
d Ma
xwell
Hou
se (1
)* 60
,750,0
00
62,00
9,702
49
,654,2
90,00
0 52
9,876
,704.
To r
ehab
ilitate
20
GRZ
traini
ng I
nstitu
tions
an
d the
Mini
stry H
Q
Deve
lop a
nd im
pleme
nt the
S &
T
Deve
lopme
nt Pr
ogra
mme
3,658
,947,4
29
75,87
1,326
nil
nil
Ca
pacit
y bu
ilding
in
all s
ector
s of
S &
T un
derta
ken
Cons
truct
five t
raini
ng In
stitut
ions
1,587
,240,6
57
32,91
2,759
nil
nil
To
co
nstru
ct wo
rksho
ps
and
class
room
blo
cks
in Ins
titutio
ns
oper
ating
fro
m tem
pora
ry pr
emise
s
Cons
tructi
on
of wo
rksho
ps
at Mo
ngu,
Kaom
a, an
d Ch
ipata
TTI c
omme
nced
, and
on
e cla
ssro
om b
lock a
t Solw
ezi T
TI u
nder
co
nstru
ction
Pr
ovide
fortif
icatio
n ser
vices
to
hamm
er m
illers
110,7
89,95
5 2,2
97,32
2
Rese
arch
in co
ntrol
of tic
ks us
ing
natur
al pr
oduc
ts
176,2
66,00
0 3,6
55,43
7 17
2,630
,000
Tota
l 8,1
35,61
4,041
37
3621
,429
*Fun
ds u
sed
to p
ay c
ontra
ctor
s fo
r pro
ject
s al
read
y in
pro
gres
s or
com
plet
ed

100
Appendix 12 e: Education
2004 PRP BUDGET AND RELEASES TO PROVINCES AS AT 20 AUGUST 2004 FOR EDUCATION INSTITUTION BUDGET RELEASES
LUSAKA PROVINCE 3,077,000,000
-
COPPERBELT PROVINCE 2,223,000,000
819,666,667
CENTRAL PROVINCE 2,557,000,000
945,000,000
NORTHERN PROVINCE 2,557,000,000
437,972,845
WESTERN PROVINCE 2,557,000,000
1,178,395,651 EASTERN PROVINCE 2,698,057,401 23,000,343 LUAPULA PROVINCE 2,557,000,000 27,238,554
NORTH WESTERN PROVINCE 3,257,000,000
520,314,433 SOUTHERN PROVINCE 2,537,000,000 38,731,166
TOTAL 24,020,057,401
3,990,319,659

10
1
A
ppen
dix 1
2 f: E
duca
tion
- PR
P B
udge
ts a
nd R
elea
ses.
BU
DGET
RE
LEAS
ES
Rel/B
udge
t BU
DGET
RE
LEAS
ES
Rel/B
udge
t Ye
ar
2004
20
04
%an
tage
20
03
2003
%
anta
ge
MOE
16
,632,0
00,00
0 10
,971,7
13,00
0 66
43
0000
0000
0 5,4
80,00
0,000
13
MS
TVT
8
,212,7
04,04
1
3,73
6,121
,428
46
6,
060,0
00,00
0
1,95
0,000
,000
24
MOE
: Pro
vince
s
3
,964,9
02,90
9 13
1
2,000
,000,0
00
1,600
,000,0
00
13
Tota
l
24,84
4,704
,041
18,67
2,737
,337
42
61,0
60,00
0,000
9,0
30,00
0,000
17
GRA
NTS
(NON
- PR
PS) B
UDGE
T AN
D DI
SBUR
SEME
NTS
TO P
ROVI
NCES
BU
DGET
Di
sbur
sem
ents
Re
l/Bud
get
BUDG
ET
Disb
urse
men
ts
Rel/B
udge
t YE
AR
2003
20
03
%an
tage
20
04
2004
%
anta
ge
Min.
Educ
.HQ
75
6,758
,203,2
79
328,3
85,11
0,431
43
.4 Lu
saka
1,9
57,10
7,000
11
6568
4348
60
3,07
7,000
,000
0.0
Co
pper
belt
1147
2880
00
7070
8778
6 62
2,22
3,000
,000
819,6
66,66
7 36
.9 Ce
ntral
7540
8400
0 46
4751
296
62
2,
557,0
00,00
0
94
5,000
,000
37.0
North
ern
989,4
60,00
0 60
9816
435
62
2,
557,0
00,00
0
43
7,972
,845
17.1
Wes
tern
1267
1345
06
8228
3533
2 65
2,55
7,000
,000
1,
178,3
95,65
1 46
.1 Ea
stern
18
8590
1792
12
2464
2387
65
2,69
8,057
,401
23,0
00,34
3 0.9
Lu
apula
53
0443
905
3289
0803
7 62
2,55
7,000
,000
27,2
38,55
4 1.1
N/
Wes
tern
2430
5232
3 15
7,830
,156
65
3,
257,0
00,00
0
52
0,314
,433
16.0
South
ern
1432
1290
96
9966
4404
4 70
2,53
7,000
,000
38,7
31,16
6 1.5
HE
AD 21
3,
012,3
31,98
1
2,57
4,650
,730
85.5
Tota
l 10
,206,6
00,62
2 64
7819
9821
63
78
3,790
,592,6
61
334,9
50,08
0,820
42
.7
GR
ANTS
AND
PER
SONA
L EM
OLUM
ENTS
TO
PROV
INCE
S (D
ISTR
ICT
AGGR
EGAT
ES)
AUGU
ST 20
04
Inst
itutio
n
Prov
incia
l Ed
ucat
ion
Offic
e
Basic
Sch
ool
Edu
catio
n Hi
gh S
choo
l E
duca
tion
Teac
her
Educ
atio
n
Budg
et
Relea
se
Budg
et
Relea
se
Budg
et
Relea
se
Budg
et
Relea
se
Min.
Educ
.HQ
Lusa
ka
3,505
,406,3
71
1,980
,388,7
97
36,14
9,459
,120
26,18
8,636
,882
10,88
7,944
,403
8,059
,882,2
24
1,02
5,859
,599
406,9
12,32
0 Co
pper
belt
4,873
,740,3
96
2,229
,265,9
50
68,70
6,132
,804
28,82
7,637
,407
27,23
8,135
,090
20,27
9,153
,947
6,07
2,568
,400
3,
012,4
09,57
5

10
2
Centr
al 3,5
36,90
6,101
1,9
78,37
4,021
40
,462,9
01,91
3 26
,541,1
76,74
7 6,8
16,89
6,120
4,9
40,94
7,713
4
,140,4
47,05
8
2,50
7,012
,546
North
ern
4,368
,857,0
19
2,223
,536,0
31
75,01
9,216
,596
44,08
5,219
,203
9,550
,766,0
53
3,838
,141,7
47
1,4
49,48
4,166
91
7,038
,253
Wes
tern
2,932
,658,6
39
1,660
,407,1
66
36,87
0,597
,341
12,89
4,883
4,
620,0
46,36
7 3,2
83,81
2,053
1
,829,5
97,58
5
1,10
9,356
,216
Easte
rn
3,670
,366,5
80
1,861
,818,5
55
42,57
5,418
,900
18,83
7,347
,612
9,099
.814,3
02
3,601
,551,1
46
1,6
77,51
7,523
727,1
23,81
1 Lu
apula
2,9
47,10
9,215
1,6
05,82
6,681
40
,725,9
57,88
3 23
,179,2
03,22
7 5,1
86,11
8,924
2,0
61,52
4,430
1
,569,7
90,42
0
9
51,72
0,189
N/
Wes
tern
2,648
,958,1
52
1,268
,512,4
55
30,97
8,026
,707
16,27
3,523
,893
2,187
,906,6
06
882,6
68,99
0 1
,682,7
83,06
3
1,03
4,024
,201
South
ern
4,360
,057,6
62
2,258
,776,0
59
54,97
0,459
,892
19,83
8,105
,045
10,99
4,395
,908
4,371
,190,3
88
3,9
16,66
2,314
2,380
,947,9
29
Total
32
,844,0
60,13
5 17
,066,9
05,71
5 42
6,458
,171,1
56
203,7
83,74
4,899
77
,482,2
09,47
1 51
,318,8
72,63
8 2
3,364
,710,1
28
13
,046,5
45,04
0 Re
lease
/ Bud
get P
erce
ntage
52
48
66
56
Relea
se R
ankin
g 3
4
1
2
Abov
e / B
elow
Nat. A
vera
ge %
-3
.5%
-7
.50%
10.5%
0.5%
Nat io
nal A
vera
ge :
55.5%
GRAN
TS A
ND P
ERSO
NAL
EMOL
UMEN
TS T
O MI
NIST
RY H
Qs, A
UGUS
T 20
04
Bu
dget
Re
lease
s Re
l/bge
t %
Minis
try of
Edu
catio
n He
ad 21
3,012
,331,9
81
2,5
74,65
0,730
85
Mi
nistry
of
Educ
ation
HQ
75
6,758
,203,2
79
423,8
91,60
4,716
56
Mi
nistry
of S
cienc
e and
Tec
hnolo
gy (T
raini
ng)

103
Appendix 12 g: Education - 2003 Grants to Districts for Basic Education
PROVINCE BUDGET RELEASES BUDGET/REL% Lusaka 1,957,107,000 1,165,684,348 60 Copperbelt 1,147,288,000 707,087,786 62 Central 754,084,000 464,751,296 62 Northern 989,460,000 609,816,435 62 Western 1,267,134,506 822,835,332 65 Eastern 1,885,901,792 1,224,642,387 65 Luapula 530,443,905 328,908,037 62 N/Western 243,052,323 157,830,156 65 Southern 1,432,129,096 996,644,044 70
Grand Total 10,206,600,622 6,478,199,821 63

104
Appendix 12 h: Education GRANTS (NON - PRPS) BUDGET AND DISBURSEMENTS TO PROVINCES -
BUDGET Disbursements Rel/Budget BUDGET Disbursements Rel/Budget YEAR 2003 2003 %antage 2004 2004 %antage
Min. Educ.HQ 756,758,203,279 328,385,110,431 43.4
Lusaka 1,957,107,000 1165684348 60 3,077,000,000 0.0 Copperbelt 1147288000 707087786 62 2,223,000,000 819,666,667 36.9
Central 754084000 464751296 62 2,557,000,000 945,000,000 37.0 Northern 989,460,000 609816435 62 2,557,000,000 437,972,845 17.1 Western 1267134506 822835332 65 2,557,000,000 1,178,395,651 46.1 Eastern 1885901792 1224642387 65 2,698,057,401 23,000,343 0.9 Luapula 530443905 328908037 62 2,557,000,000 27,238,554 1.1
N/Western 243052323 157,830,156 65 3,257,000,000 520,314,433 16.0 Southern 1432129096 996644044 70 2,537,000,000 38,731,166 1.5 HEAD 21 3,012,331,981 2,574,650,730 85.5
Total 10,206,600,622 6478199821 63 783,790,592,661 334,950,080,820 42.7

10
5
Appe
ndix
12 i:
Edu
catio
n S1
04: C
ompl
etio
n Ra
te b
y Gen
der,
Basic
Sch
ools
(Gra
de 7)
Repo
rting
Lev
el:
Dist
rict
Selec
tion
Ye
ar: 2
003;
Pr
ovin
ce: A
ll Pro
vince
s;
Dist
rict:
All D
istric
ts
15-
Sep-
04
Ma
le
Male
Ma
le
Male
Fe
male
Fe
male
Fe
male
Fe
male
To
tal
Tota
l To
tal
Tota
l Ma
le
Fem
ale
Tota
l
Stud
ents
Dr
opou
ts
Repe
ate
Pop'n
St
uden
ts
Drop
outs
Re
peat
e Po
p'n
Stud
ents
Dr
opou
ts
Repe
ate
Pop'n
CR
CR
CR
CHAD
IZA
62
7 28
73
91
6 47
7 34
63
97
9 1,1
04
62
136
1,895
57
.42%
38
.82%
47
.81%
CHAM
A
1,085
26
17
7 78
8 49
5 39
60
80
4 1,5
80
65
237
1,592
11
1.93
49.25
%
80.28
%
CHAV
UMA
23
3 5
15
291
171
6 16
27
9 40
4 11
31
57
0 73
.20%
53
.41%
63
.51%
CHIB
OMBO
3,662
16
8 77
8 3,1
92
3,090
18
0 57
6 2,8
98
6,752
34
8 1,3
54
6,090
85
.09%
80
.54%
82
.92%
CHIE
NGE
47
0 32
73
85
1 24
2 42
18
79
0 71
2 74
91
1,6
41
42.89
%
23.04
%
33.33
%
CHILI
LABO
MBW
E
1,013
30
86
84
8 96
9 41
80
83
5 1,9
82
71
166
1,683
10
5.78
101.5
6 10
3.68
CHILU
BI
51
3 32
44
73
6 22
0 28
11
72
8 73
3 60
55
1,4
64
59.38
%
24.86
%
42.21
%
CHIN
GOLA
2,291
61
20
2 2,1
89
2,404
74
18
0 2,3
96
4,695
13
5 38
2 4,5
85
92.65
%
89.73
%
91.12
%
CHIN
SALI
2,0
57
71
395
1,550
1,1
55
82
199
1,506
3,2
12
153
594
3,056
10
2.65
58.03
%
80.66
%
CHIP
ATA
3,1
07
128
379
4,142
2,5
35
191
262
4,179
5,6
42
319
641
8,321
62
.77%
49
.82%
56
.27%
Sour
ce: Z
ambia
Ann
ual S
choo
l Cen
sus
ED*A
SSIS
T/Za
mbi
a An
erro
neou
s rep
ort m
ight b
e due
to in
comp
lete d
ata.
1

10
6
S104
: Com
plet
ion
Rate
by G
ende
r, Ba
sic S
choo
ls (G
rade
7)
Repo
rting
Lev
el:
Dist
rict
Selec
tion
Ye
ar: 2
003;
Pr
ovin
ce: A
ll Pro
vince
s;
Dist
rict:
All D
istric
ts
15-
Sep-
04
Ma
le
Male
Ma
le
Male
Fe
male
Fe
male
Fe
male
Fe
male
To
tal
Tota
l To
tal
Tota
l Ma
le
Fem
ale
Tota
l
Stud
ents
Dro
pout
s Re
peat
e Po
p'n S
tude
nts
Drop
outs
Re
peat
e Po
p'n S
tude
nts
Drop
outs
Re
peat
e Po
p'n
CR
CR
CR
CHOM
A
3,445
14
0 73
5 2,9
14
3,088
15
3 58
3 2,8
55
6,533
29
3 1,3
18
5,769
88
.19%
82
.38%
85
.32%
CH
ONGW
E
1,881
67
22
5 1,8
78
1,608
82
18
2 1,8
14
3,489
14
9 40
7 3,6
92
84.61
%
74.09
%
79.44
%
GWEM
BE
42
2 30
85
48
3 29
7 26
42
45
6 71
9 56
12
7 93
9 63
.56%
50
.22%
57
.08%
IS
OKA
1,8
40
57
426
1,210
1,1
25
54
233
1,119
2,9
65
111
659
2,329
11
2.15
74.89
%
94.25
%
ITEZ
HI T
EZHI
411
12
121
581
334
28
83
554
745
40
204
1,135
47
.85%
40
.25%
44
.14%
KA
BOMP
O
840
31
130
838
524
39
55
793
1,364
70
18
5 1,6
31
81.03
%
54.22
%
68.00
%
KABW
E
1,907
36
21
4 2,3
20
1,985
40
18
5 2,4
86
3,892
76
39
9 4,8
06
71.42
%
70.80
%
71.10
%
KAFU
E
2,396
38
24
2 1,8
83
2,129
62
22
3 1,9
32
4,525
10
0 46
5 3,8
15
112.3
7 95
.45%
10
3.80
KALA
BO
1,0
43
29
149
1,363
83
9 67
84
1,3
55
1,882
96
23
3 2,7
18
63.46
%
50.77
%
57.14
%
KALO
MO
2,5
71
97
624
2,277
2,1
37
121
491
2,376
4,7
08
218
1,115
4,6
53
81.25
%
64.18
%
72.53
%
Sour
ce: Z
ambia
Ann
ual S
choo
l Cen
sus
ED*A
SSIS
T/Za
mbi
a an
erro
neou
s rep
ort m
ight b
e due
to in
comp
lete d
ata.
2
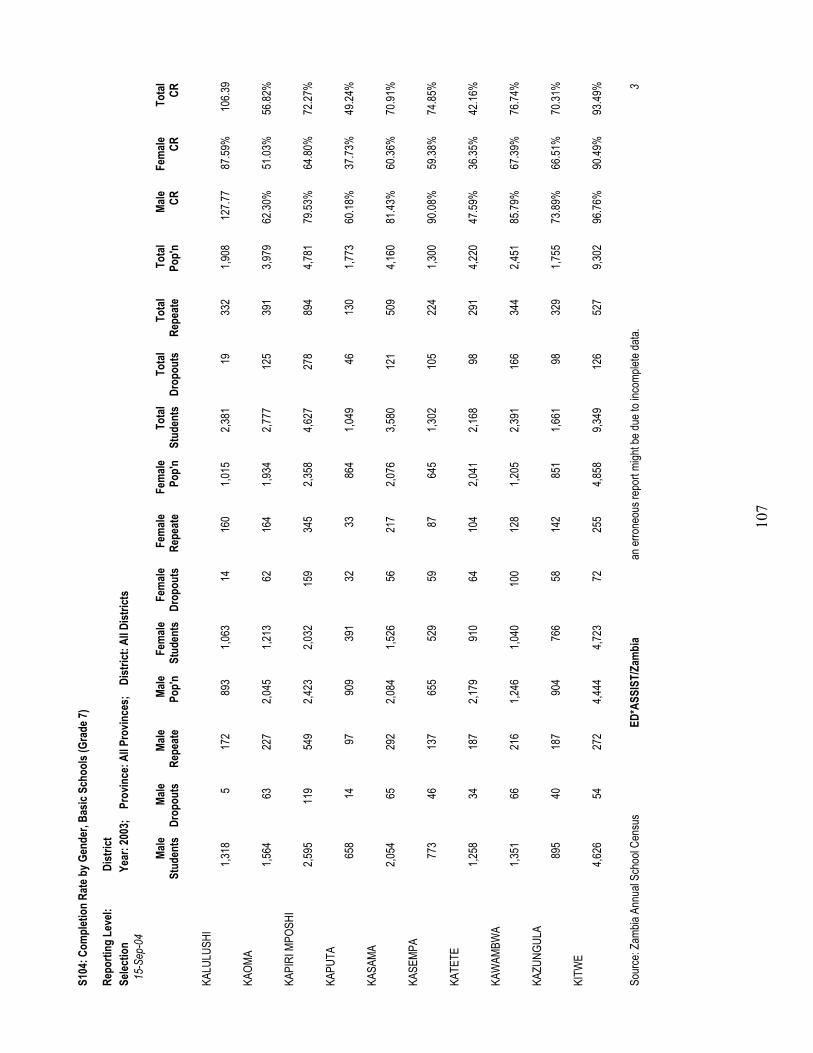
10
7
S104
: Com
plet
ion
Rate
by G
ende
r, Ba
sic S
choo
ls (G
rade
7)
Repo
rting
Lev
el:
Dist
rict
Selec
tion
Ye
ar: 2
003;
Pr
ovin
ce: A
ll Pro
vince
s;
Dist
rict:
All D
istric
ts
15-
Sep-
04
Ma
le
Male
Ma
le
Male
Fe
male
Fe
male
Fe
male
Fe
male
To
tal
Tota
l To
tal
Tota
l Ma
le
Fem
ale
Tota
l
Stud
ents
Dr
opou
ts
Repe
ate
Pop'n
St
uden
ts
Drop
outs
Re
peat
e Po
p'n
Stud
ents
Dr
opou
ts
Repe
ate
Pop'n
CR
CR
CR
KALU
LUSH
I
1,318
5
172
893
1,063
14
16
0 1,0
15
2,381
19
33
2 1,9
08
127.7
7 87
.59%
10
6.39
KAOM
A
1,564
63
22
7 2,0
45
1,213
62
16
4 1,9
34
2,777
12
5 39
1 3,9
79
62.30
%
51.03
%
56.82
%
KAPI
RI M
POSH
I
2,595
11
9 54
9 2,4
23
2,032
15
9 34
5 2,3
58
4,627
27
8 89
4 4,7
81
79.53
%
64.80
%
72.27
%
KAPU
TA
65
8 14
97
90
9 39
1 32
33
86
4 1,0
49
46
130
1,773
60
.18%
37
.73%
49
.24%
KASA
MA
2,0
54
65
292
2,084
1,5
26
56
217
2,076
3,5
80
121
509
4,160
81
.43%
60
.36%
70
.91%
KASE
MPA
77
3 46
13
7 65
5 52
9 59
87
64
5 1,3
02
105
224
1,300
90
.08%
59
.38%
74
.85%
KATE
TE
1,2
58
34
187
2,179
91
0 64
10
4 2,0
41
2,168
98
29
1 4,2
20
47.59
%
36.35
%
42.16
%
KAW
AMBW
A
1,351
66
21
6 1,2
46
1,040
10
0 12
8 1,2
05
2,391
16
6 34
4 2,4
51
85.79
%
67.39
%
76.74
%
KAZU
NGUL
A
895
40
187
904
766
58
142
851
1,661
98
32
9 1,7
55
73.89
%
66.51
%
70.31
%
KITW
E
4,626
54
27
2 4,4
44
4,723
72
25
5 4,8
58
9,349
12
6 52
7 9,3
02
96.76
%
90.49
%
93.49
%
Sour
ce: Z
ambia
Ann
ual S
choo
l Cen
sus
ED*A
SSIS
T/Za
mbi
a an
erro
neou
s rep
ort m
ight b
e due
to in
comp
lete d
ata.
3

10
8
S104
: Com
plet
ion
Rate
by G
ende
r, Ba
sic S
choo
ls (G
rade
7)
Repo
rting
Lev
el:
Dist
rict
Selec
tion
Ye
ar: 2
003;
Pr
ovin
ce: A
ll Pro
vince
s;
Dist
rict:
All D
istric
ts
15-
Sep-
04
Ma
le
Male
Ma
le
Male
Fe
male
Fe
male
Fe
male
Fe
male
To
tal
Tota
l To
tal
Tota
l Ma
le
Fem
ale
Tota
l
Stud
ents
Dr
opou
ts
Repe
ate
Pop'n
St
uden
ts
Drop
outs
Re
peat
e Po
p'n
Stud
ents
Dr
opou
ts
Repe
ate
Pop'n
CR
CR
CR
LIVIN
GSTO
NE
1,4
11
28
147
1,284
1,5
27
17
131
1,380
2,9
38
45
278
2,664
96
.26%
99
.93%
98
.16%
LUAN
GWA
21
5 5
38
258
206
19
36
242
421
24
74
500
66.67
%
62.40
%
64.60
%
LUAN
SHYA
2,062
39
26
3 1,8
17
1,970
38
23
1 2,0
07
4,032
77
49
4 3,8
24
96.86
%
84.75
%
90.51
%
LUFW
ANYA
MA
71
9 27
53
72
2 59
6 60
41
69
7 1,3
15
87
94
1,419
88
.50%
71
.02%
79
.92%
LUKU
LU
75
6 32
14
9 80
2 46
5 46
66
75
4 1,2
21
78
215
1,556
71
.70%
46
.82%
59
.64%
LUND
AZI
2,4
58
124
408
2,689
1,4
62
134
159
2,608
3,9
20
258
567
5,297
71
.63%
44
.82%
58
.43%
LUSA
KA
11
,142
321
679
11,68
2 11
,259
390
631
13,24
1 22
,401
711
1,310
24
,923
86.82
%
77.32
%
81.77
%
LUW
INGU
1,103
69
18
6 87
5 53
4 80
70
92
4 1,6
37
149
256
1,799
96
.91%
41
.56%
68
.48%
MAMB
WE
54
2 12
71
54
2 37
8 14
21
50
0 92
0 26
92
1,0
42
84.69
%
68.60
%
76.97
%
MANS
A
1,883
62
26
9 2,1
18
1,363
93
18
4 2,1
86
3,246
15
5 45
3 4,3
04
73.28
%
49.68
%
61.29
%
Sour
ce: Z
ambia
Ann
ual S
choo
l Cen
sus
ED*A
SSIS
T/Za
mbi
a an
erro
neou
s rep
ort m
ight b
e due
to in
comp
lete d
ata.
4
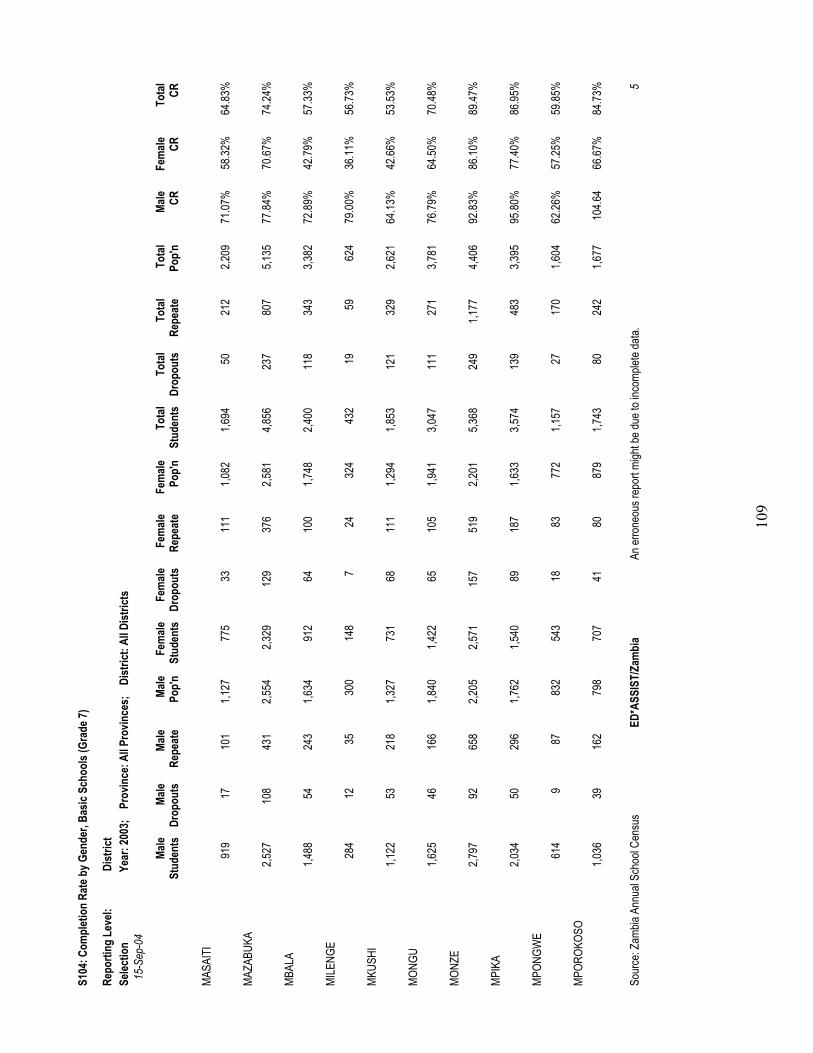
10
9
S104
: Com
plet
ion
Rate
by G
ende
r, Ba
sic S
choo
ls (G
rade
7)
Repo
rting
Lev
el:
Dist
rict
Selec
tion
Ye
ar: 2
003;
Pr
ovin
ce: A
ll Pro
vince
s;
Dist
rict:
All D
istric
ts
15-
Sep-
04
Ma
le
Male
Ma
le
Male
Fe
male
Fe
male
Fe
male
Fe
male
To
tal
Tota
l To
tal
Tota
l Ma
le
Fem
ale
Tota
l
Stud
ents
Dr
opou
ts
Repe
ate
Pop'n
St
uden
ts
Drop
outs
Re
peat
e Po
p'n
Stud
ents
Dr
opou
ts
Repe
ate
Pop'n
CR
CR
CR
MASA
ITI
91
9 17
10
1 1,1
27
775
33
111
1,082
1,6
94
50
212
2,209
71
.07%
58
.32%
64
.83%
MAZA
BUKA
2,527
10
8 43
1 2,5
54
2,329
12
9 37
6 2,5
81
4,856
23
7 80
7 5,1
35
77.84
%
70.67
%
74.24
%
MBAL
A
1,488
54
24
3 1,6
34
912
64
100
1,748
2,4
00
118
343
3,382
72
.89%
42
.79%
57
.33%
MILE
NGE
28
4 12
35
30
0 14
8 7
24
324
432
19
59
624
79.00
%
36.11
%
56.73
%
MKUS
HI
1,1
22
53
218
1,327
73
1 68
11
1 1,2
94
1,853
12
1 32
9 2,6
21
64.13
%
42.66
%
53.53
%
MONG
U
1,625
46
16
6 1,8
40
1,422
65
10
5 1,9
41
3,047
11
1 27
1 3,7
81
76.79
%
64.50
%
70.48
%
MONZ
E
2,797
92
65
8 2,2
05
2,571
15
7 51
9 2,2
01
5,368
24
9 1,1
77
4,406
92
.83%
86
.10%
89
.47%
MPIK
A
2,034
50
29
6 1,7
62
1,540
89
18
7 1,6
33
3,574
13
9 48
3 3,3
95
95.80
%
77.40
%
86.95
%
MPON
GWE
61
4 9
87
832
543
18
83
772
1,157
27
17
0 1,6
04
62.26
%
57.25
%
59.85
%
MPOR
OKOS
O
1,036
39
16
2 79
8 70
7 41
80
87
9 1,7
43
80
242
1,677
10
4.64
66.67
%
84.73
%
Sour
ce: Z
ambia
Ann
ual S
choo
l Cen
sus
ED*A
SSIS
T/Za
mbi
a An
erro
neou
s rep
ort m
ight b
e due
to in
comp
lete d
ata.
5

11
0
S104
: Com
plet
ion
Rate
by G
ende
r, Ba
sic S
choo
ls (G
rade
7)
Repo
rting
Lev
el:
Dist
rict
Selec
tion
Ye
ar: 2
003;
Pr
ovin
ce: A
ll Pro
vince
s;
Dist
rict:
All D
istric
ts
15-
Sep-
04
Ma
le
Male
Ma
le
Male
Fe
male
Fe
male
Fe
male
Fe
male
To
tal
Tota
l To
tal
Tota
l Ma
le
Fem
ale
Tota
l
Stud
ents
Dr
opou
ts
Repe
ate
Pop'n
St
uden
ts
Drop
outs
Re
peat
e Po
p'n
Stud
ents
Dr
opou
ts
Repe
ate
Pop'n
CR
CR
CR
MPUL
UNGU
547
30
97
753
306
36
37
690
853
66
134
1,443
55
.78%
33
.77%
45
.25%
MUFU
LIRA
1,8
00
13
72
1,877
1,8
33
25
58
2,045
3,6
33
38
130
3,922
91
.37%
85
.57%
88
.35%
MUFU
MBW
E
417
21
52
570
357
41
34
540
774
62
86
1,110
60
.35%
52
.22%
56
.40%
MUMB
WA
2,8
90
101
558
2,245
2,5
61
136
371
2,157
5,4
51
237
929
4,402
99
.38%
95
.22%
97
.34%
MUNG
WI
1,2
64
45
237
1,277
67
3 45
97
1,3
06
1,937
90
33
4 2,5
83
76.90
%
40.66
%
58.58
%
MWEN
SE
1,2
01
39
211
1,219
83
0 74
13
1 1,1
88
2,031
11
3 34
2 2,4
07
78.01
%
52.61
%
65.48
%
MWIN
ILUNG
A
1,170
57
18
7 1,4
38
671
67
61
1,328
1,8
41
124
248
2,766
64
.39%
40
.89%
53
.11%
NAKO
NDE
1,2
20
27
263
870
846
27
134
871
2,066
54
39
7 1,7
41
106.9
0 78
.65%
92
.76%
NAMW
ALA
96
8 71
28
3 1,1
68
879
80
225
1,141
1,8
47
151
508
2,309
52
.57%
50
.31%
51
.45%
NCHE
LENG
E
962
39
93
1,155
69
0 72
71
1,0
74
1,652
11
1 16
4 2,2
29
71.86
%
50.93
%
61.78
%
Sour
ce: Z
ambia
Ann
ual S
choo
l Cen
sus
ED*A
SSIS
T/Za
mbi
a An
erro
neou
s rep
ort m
ight b
e due
to in
comp
lete d
ata.
6

11
1
S104
: Com
plet
ion
Rate
by G
ende
r, Ba
sic S
choo
ls (G
rade
7)
Repo
rting
Lev
el:
Dist
rict
Selec
tion
Ye
ar: 2
003;
Pr
ovin
ce: A
ll Pro
vince
s;
Dist
rict:
All D
istric
ts
15-
Sep-
04
Ma
le
Male
Ma
le
Male
Fe
male
Fe
male
Fe
male
Fe
male
To
tal
Tota
l To
tal
Tota
l Ma
le
Fem
ale
Tota
l
Stud
ents
Dr
opou
ts
Repe
ate
Pop'n
St
uden
ts
Drop
outs
Re
peat
e Po
p'n
Stud
ents
Dr
opou
ts
Repe
ate
Pop'n
CR
CR
CR
NDOL
A UR
BAN
4,7
37
95
508
4,196
4,8
25
153
446
4,676
9,5
62
248
954
8,872
98
.52%
90
.38%
94
.23%
NYIM
BA
61
6 20
67
91
8 39
9 40
43
82
5 1,0
15
60
110
1,743
57
.63%
38
.30%
48
.48%
PETA
UKE
1,8
50
113
252
2,771
1,3
69
141
172
2,661
3,2
19
254
424
5,432
53
.59%
39
.68%
46
.78%
SAMF
YA
1,5
76
37
175
1,796
1,0
22
94
106
1,693
2,5
98
131
281
3,489
75
.95%
48
.55%
62
.65%
SENA
NGA
85
4 46
13
1 1,2
09
722
70
78
1,248
1,5
76
116
209
2,457
56
.00%
45
.99%
50
.92%
SERE
NJE
1,7
11
49
429
1,674
1,0
98
56
208
1,585
2,8
09
105
637
3,259
73
.66%
52
.62%
63
.42%
SESH
EKE
82
3 24
11
5 90
4 71
6 37
76
92
6 1,5
39
61
191
1,830
75
.66%
65
.12%
70
.33%
SHAN
GOMB
O
429
12
76
853
322
18
47
853
751
30
123
1,706
39
.98%
30
.13%
35
.05%
SIAV
ONGA
709
24
147
733
474
30
71
746
1,183
54
21
8 1,4
79
73.40
%
50.00
%
61.60
%
SINA
ZONG
WE
90
1 39
16
8 1,0
38
727
69
118
1,032
1,6
28
108
286
2,070
66
.86%
52
.33%
59
.61%
Sour
ce: Z
ambia
Ann
ual S
choo
l Cen
sus
ED*A
SSIS
T/Za
mbi
a An
erro
neou
s rep
ort m
ight b
e due
to in
comp
lete d
ata.
7

11
2
S104
: Com
plet
ion
Rate
by G
ende
r, Ba
sic S
choo
ls (G
rade
7)
Repo
rting
Lev
el:
Dist
rict
Selec
tion
Ye
ar: 2
003;
Pr
ovin
ce: A
ll Pro
vince
s;
Dist
rict:
All D
istric
ts
15-
Sep-
04
Ma
le
Male
Ma
le
Male
Fe
male
Fe
male
Fe
male
Fe
male
To
tal
Tota
l To
tal
Tota
l Ma
le
Fem
ale
Tota
l
Stud
ents
Dr
opou
ts
Repe
ate
Pop'n
St
uden
ts
Drop
outs
Re
peat
e Po
p'n
Stud
ents
Dr
opou
ts
Repe
ate
Pop'n
CR
CR
CR
SOLW
EZI
2,2
72
102
314
2,415
1,6
61
142
217
2,277
3,9
33
244
531
4,692
76
.85%
57
.18%
67
.31%
ZAMB
EZI
59
8 12
73
64
3 50
7 36
48
63
9 1,1
05
48
121
1,282
79
.78%
66
.20%
73
.01%
Tot
als
11
5,15
3,839
16
,677
117,9
2 94
,943
5,116
11
,376
119,4
7 21
0,10
8,955
28
,053
237,3
9 80
.26%
65
.66%
72
.91%
So
urce
: Zam
bia A
nnua
l Sch
ool C
ensu
s ED
*ASS
IST/
Zam
bia
an er
rone
ous r
epor
t migh
t be d
ue to
inco
mplet
e data
.

11
3
Appe
ndix
10
S102
: Net
Enr
olm
ent R
atio
(NER
) by G
ende
r, Gr
ades
1-9
Repo
rting
Lev
el:
Dist
rict
Selec
tion
Ye
ar: 2
003;
Pr
ovin
ce: A
ll Pro
vince
s;
Dist
rict:
All D
istric
ts
15-S
ep-0
4
Ma
le
Male
Fe
male
Fe
male
To
tal
Total
Ma
le
Fema
le
Total
Stud
ents
Pop'n
St
uden
ts Po
p'n
Stud
ents
Pop'n
NE
R NE
R NE
R
CHAD
IZA
5,409
11
,414
6,077
10
,914
11,48
6 22
,328
47.39
%
55.68
%
51.44
%
CHAM
A 8,1
40
9,238
6,3
58
8,965
14
,498
18,20
3 88
.11%
70
.92%
79
.65%
CHAV
UMA
3,434
3,7
53
3,043
3,5
57
6,477
7,3
10
91.50
%
85.55
%
88.60
%
CHIB
OMBO
25
,374
33,06
9 24
,878
31,91
8 50
,252
64,98
7 76
.73%
77
.94%
77
.33%
CHIE
NGE
6,386
10
,164
5,123
9,9
62
11,50
9 20
,126
62.83
%
51.43
%
57.18
%
CHILI
LABO
MBW
E 8,3
56
9,133
8,4
77
9,376
16
,833
18,50
9 91
.49%
90
.41%
90
.94%
CHILU
BI
5,304
8,5
35
4,196
8,1
50
9,500
16
,685
62.14
%
51.48
%
56.94
%
CHIN
GOLA
17
,193
22,38
3 17
,691
23,28
1 34
,884
45,66
4 76
.81%
75
.99%
76
.39%
CHIN
SALI
14,60
7 17
,485
12,67
4 16
,803
27,28
1 34
,288
83.54
%
75.43
%
79.56
%
CHIP
ATA
27,60
2 46
,687
27,13
0 45
,800
54,73
2 92
,487
59.12
%
59.24
%
59.18
%
CHOM
A 25
,132
28,59
3 25
,196
28,88
3 50
,328
57,47
6 87
.90%
87
.23%
87
.56%
CHON
GWE
14,89
7 19
,005
14,64
0 18
,744
29,53
7 37
,749
78.38
%
78.10
%
78.25
%
GWEM
BE
3,933
4,7
79
3,706
4,6
60
7,639
9,4
39
82.30
%
79.53
%
80.93
%
ISOK
A 12
,698
13,20
4 10
,923
12,75
5 23
,621
25,95
9 96
.17%
85
.64%
90
.99%
ITEZ
HI T
EZHI
3,5
97
5,624
3,5
04
5,509
7,1
01
11,13
3 63
.96%
63
.61%
63
.78%
Sour
ce: Z
ambia
Ann
ual S
choo
l Cen
sus
ED*A
SSIS
T/Za
mbia
an er
rone
ous r
epor
t migh
t be d
ue to
inco
mplet
e data
. 1

11
4
S102
: Net
Enro
lmen
t Rati
o (NE
R) by
Gen
der,
Grad
es 1-
9
Repo
rting L
evel:
Di
strict
Se
lectio
n Ye
ar: 2
003;
Pro
vince
: All P
rovin
ces;
Dist
rict: A
ll Dist
ricts
15-S
ep-0
4
Ma
le
Male
Fe
male
Fe
male
To
tal
Total
Ma
le
Fema
le
Total
Stud
ents
Pop'n
St
uden
ts Po
p'n
Stud
ents
Pop'n
NE
R NE
R NE
R
KABO
MPO
7,267
8,5
88
6,789
8,6
88
14,05
6 17
,276
84.62
%
78.14
%
81.36
%
KABW
E 15
,222
23,29
6 15
,919
24,37
5 31
,141
47,67
1 65
.34%
65
.31%
65
.32%
KAFU
E 17
,545
19,39
3 17
,747
19,84
4 35
,292
39,23
7 90
.47%
89
.43%
89
.95%
KALA
BO
11,04
5 14
,619
10,14
8 15
,130
21,19
3 29
,749
75.55
%
67.07
%
71.24
%
KALO
MO
19,75
5 23
,148
19,57
6 23
,672
39,33
1 46
,820
85.34
%
82.70
%
84.00
%
KALU
LUSH
I 9,5
23
10,16
4 9,1
96
10,43
5 18
,719
20,59
9 93
.69%
88
.13%
90
.87%
KAOM
A 15
,159
21,14
1 14
,340
21,12
5 29
,499
42,26
6 71
.70%
67
.88%
69
.79%
KAPI
RI M
POSH
I 19
,923
26,16
4 18
,963
25,39
0 38
,886
51,55
4 76
.15%
74
.69%
75
.43%
KAPU
TA
7,175
10
,759
6,059
10
,479
13,23
4 21
,238
66.69
%
57.82
%
62.31
%
KASA
MA
17,54
0 22
,917
15,92
9 22
,818
33,46
9 45
,735
76.54
%
69.81
%
73.18
%
KASE
MPA
6,220
6,8
17
5,925
6,9
21
12,14
5 13
,738
91.24
%
85.61
%
88.40
%
KATE
TE
12,58
8 25
,178
13,32
2 23
,737
25,91
0 48
,915
50.00
%
56.12
%
52.97
%
KAW
AMBW
A 12
,492
13,60
9 11
,672
13,55
9 24
,164
27,16
8 91
.79%
86
.08%
88
.94%
KAZU
NGUL
A 7,0
94
9,232
6,8
21
8,813
13
,915
18,04
5 76
.84%
77
.40%
77
.11%
KITW
E 35
,671
47,31
0 35
,881
49,41
7 71
,552
96,72
7 75
.40%
72
.61%
73
.97%
Sour
ce: Z
ambia
Ann
ual S
choo
l Cen
sus
ED*A
SSIS
T/Za
mbia
an er
rone
ous r
epor
t migh
t be d
ue to
inco
mplet
e data
. 2

11
5
S102
: Net
Enro
lmen
t Rati
o (NE
R) by
Gen
der,
Grad
es 1-
9
Repo
rting L
evel:
Di
strict
Se
lectio
n Ye
ar: 2
003;
Pro
vince
: All P
rovin
ces;
Dist
rict: A
ll Dist
ricts
15-S
ep-0
4
Ma
le
Male
Fe
male
Fe
male
To
tal
Total
Ma
le
Fema
le
Total
Stud
ents
Pop'n
St
uden
ts Po
p'n
Stud
ents
Pop'n
NE
R NE
R NE
R
LIVIN
GSTO
NE
10,55
7 12
,565
11,18
5 13
,666
21,74
2 26
,231
84.02
%
81.85
%
82.89
%
LUAN
GWA
2,244
2,5
65
2,160
2,5
27
4,404
5,0
92
87.49
%
85.48
%
86.49
%
LUAN
SHYA
15
,456
19,88
3 15
,466
20,37
4 30
,922
40,25
7 77
.73%
75
.91%
76
.81%
LUFW
ANYA
MA
8,812
7,9
86
8,306
7,8
22
17,11
8 15
,808
110.3
4%
106.1
9%
108.2
9%
LUKU
LU
7,285
8,6
83
6,905
8,6
68
14,19
0 17
,351
83.90
%
79.66
%
81.78
%
LUND
AZI
18,76
9 29
,618
16,49
2 28
,314
35,26
1 57
,932
63.37
%
58.25
%
60.87
%
LUSA
KA
77,65
9 12
4,206
80
,839
133,6
90
158,4
98
257,8
96
62.52
%
60.47
%
61.46
%
LUW
INGU
9,7
13
10,74
0 8,0
21
10,29
5 17
,734
21,03
5 90
.44%
77
.91%
84
.31%
MAMB
WE
4,903
6,0
07
4,429
5,8
22
9,332
11
,829
81.62
%
76.07
%
78.89
%
MANS
A 17
,718
23,88
7 16
,385
23,46
4 34
,103
47,35
1 74
.17%
69
.83%
72
.02%
MASA
ITI
9,357
12
,484
8,628
12
,084
17,98
5 24
,568
74.95
%
71.40
%
73.20
%
MAZA
BUKA
18
,541
26,70
4 18
,561
26,96
5 37
,102
53,66
9 69
.43%
68
.83%
69
.13%
MBAL
A 14
,172
20,44
1 11
,998
19,89
3 26
,170
40,33
4 69
.33%
60
.31%
64
.88%
MILE
NGE
2,849
3,8
21
2,557
3,7
14
5,406
7,5
35
74.56
%
68.85
%
71.75
%
MKUS
HI
9,833
13
,788
9,222
13
,985
19,05
5 27
,773
71.32
%
65.94
%
68.61
%
Sour
ce: Z
ambia
Ann
ual S
choo
l Cen
sus
ED*A
SSIS
T/Za
mbia
An er
rone
ous r
epor
t migh
t be d
ue to
inco
mplet
e data
. 3

11
6
S102
: Net
Enro
lmen
t Rati
o (NE
R) by
Gen
der,
Grad
es 1-
9
Repo
rting L
evel:
Di
strict
Se
lectio
n Ye
ar: 2
003;
Pro
vince
: All P
rovin
ces;
Dist
rict: A
ll Dist
ricts
15-S
ep-0
4
Ma
le
Male
Fe
male
Fe
male
To
tal
Total
Ma
le
Fema
le
Total
Stud
ents
Pop'n
St
uden
ts Po
p'n
Stud
ents
Pop'n
NE
R NE
R NE
R
MONG
U 15
,793
20,43
7 15
,145
20,36
0 30
,938
40,79
7 77
.28%
74
.39%
75
.83%
MONZ
E 18
,907
22,69
6 18
,434
22,55
0 37
,341
45,24
6 83
.31%
81
.75%
82
.53%
MPIK
A 16
,251
19,85
9 15
,196
19,06
9 31
,447
38,92
8 81
.83%
79
.69%
80
.78%
MPON
GWE
5,341
8,2
49
5,175
8,0
97
10,51
6 16
,346
64.75
%
63.91
%
64.33
%
MPOR
OKOS
O 8,7
30
9,991
8,2
21
9,865
16
,951
19,85
6 87
.38%
83
.34%
85
.37%
MPUL
UNGU
6,1
11
8,765
4,9
91
8,575
11
,102
17,34
0 69
.72%
58
.20%
64
.03%
MUFU
LIRA
15,69
4 19
,676
15,97
4 20
,199
31,66
8 39
,875
79.76
%
79.08
%
79.42
%
MUFU
MBW
E 4,6
12
5,811
4,3
01
5,736
8,9
13
11,54
7 79
.37%
74
.98%
77
.19%
MUMB
WA
20,49
8 21
,952
20,45
8 21
,504
40,95
6 43
,456
93.38
%
95.14
%
94.25
%
MUNG
WI
10,97
0 14
,985
9,079
14
,645
20,04
9 29
,630
73.21
%
61.99
%
67.66
%
MWEN
SE
10,98
6 13
,960
9,874
13
,304
20,86
0 27
,264
78.70
%
74.22
%
76.51
%
MWIN
ILUNG
A 11
,015
15,41
3 9,0
37
14,66
3 20
,052
30,07
6 71
.47%
61
.63%
66
.67%
NAKO
NDE
8,275
9,8
43
7,511
9,7
38
15,78
6 19
,581
84.07
%
77.13
%
80.62
%
NAMW
ALA
7,628
11
,293
7,779
11
,216
15,40
7 22
,509
67.55
%
69.36
%
68.45
%
NCHE
LENG
E 10
,123
13,52
1 9,0
61
13,20
0 19
,184
26,72
1 74
.87%
68
.64%
71
.79%
Sour
ce: Z
ambia
Ann
ual S
choo
l Cen
sus
ED*A
SSIS
T/Za
mbia
An er
rone
ous r
epor
t migh
t be d
ue to
inco
mplet
e data
. 4
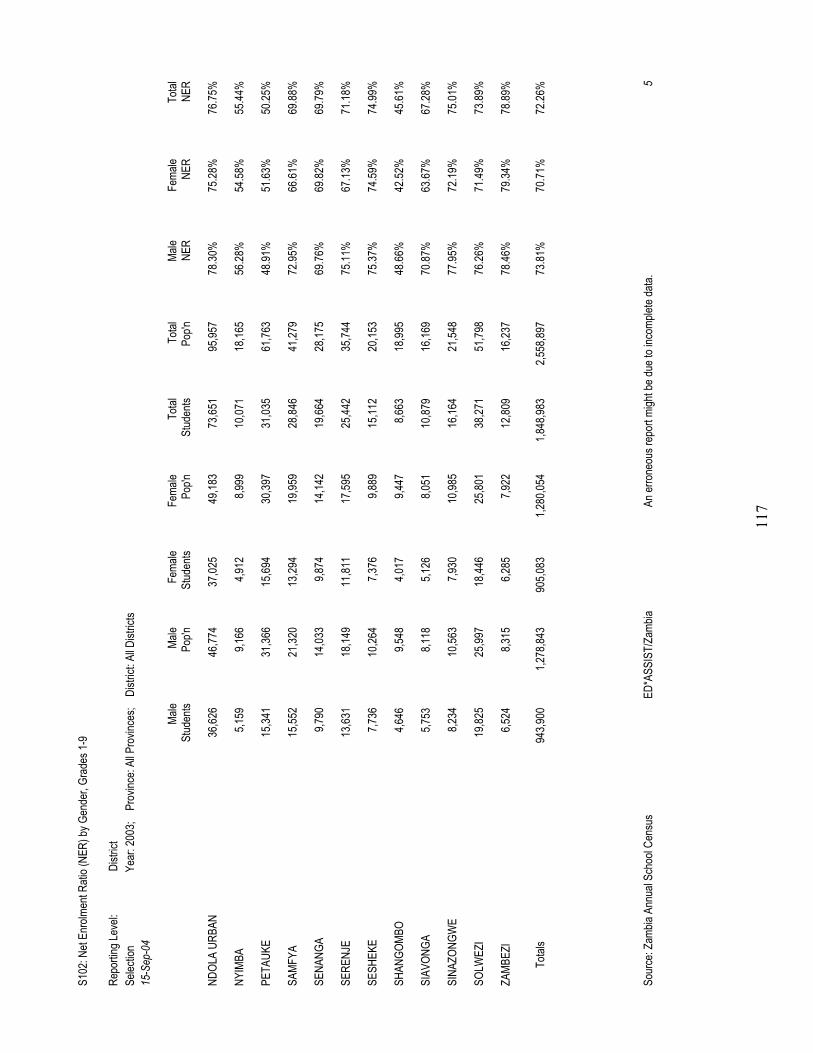
11
7
S102
: Net
Enro
lmen
t Rati
o (NE
R) by
Gen
der,
Grad
es 1-
9
Repo
rting L
evel:
Di
strict
Se
lectio
n Ye
ar: 2
003;
Pro
vince
: All P
rovin
ces;
Dist
rict: A
ll Dist
ricts
15-S
ep-0
4
Ma
le
Male
Fe
male
Fe
male
To
tal
Total
Ma
le
Fema
le
Total
Stud
ents
Pop'n
St
uden
ts Po
p'n
Stud
ents
Pop'n
NE
R NE
R NE
R
NDOL
A UR
BAN
36,62
6 46
,774
37,02
5 49
,183
73,65
1 95
,957
78.30
%
75.28
%
76.75
%
NYIM
BA
5,159
9,1
66
4,912
8,9
99
10,07
1 18
,165
56.28
%
54.58
%
55.44
%
PETA
UKE
15,34
1 31
,366
15,69
4 30
,397
31,03
5 61
,763
48.91
%
51.63
%
50.25
%
SAMF
YA
15,55
2 21
,320
13,29
4 19
,959
28,84
6 41
,279
72.95
%
66.61
%
69.88
%
SENA
NGA
9,790
14
,033
9,874
14
,142
19,66
4 28
,175
69.76
%
69.82
%
69.79
%
SERE
NJE
13,63
1 18
,149
11,81
1 17
,595
25,44
2 35
,744
75.11
%
67.13
%
71.18
%
SESH
EKE
7,736
10
,264
7,376
9,8
89
15,11
2 20
,153
75.37
%
74.59
%
74.99
%
SHAN
GOMB
O 4,6
46
9,548
4,0
17
9,447
8,6
63
18,99
5 48
.66%
42
.52%
45
.61%
SIAV
ONGA
5,7
53
8,118
5,1
26
8,051
10
,879
16,16
9 70
.87%
63
.67%
67
.28%
SINA
ZONG
WE
8,234
10
,563
7,930
10
,985
16,16
4 21
,548
77.95
%
72.19
%
75.01
%
SOLW
EZI
19,82
5 25
,997
18,44
6 25
,801
38,27
1 51
,798
76.26
%
71.49
%
73.89
%
ZAMB
EZI
6,524
8,3
15
6,285
7,9
22
12,80
9 16
,237
78.46
%
79.34
%
78.89
%
To
tals
943,9
00
1,278
,843
905,0
83
1,280
,054
1,848
,983
2,558
,897
73.81
%
70.71
%
72.26
%
Sour
ce: Z
ambia
Ann
ual S
choo
l Cen
sus
ED*A
SSIS
T/Za
mbia
An er
rone
ous r
epor
t migh
t be d
ue to
inco
mplet
e data
. 5

11
8
Appe
ndix
13:
Healt
h-20
03
Objec
tive
/ Pr
ogra
mmes
or
Fie
ld of
Inter
venti
on
To im
prov
e the
healt
h stat
us of
all p
eople
in Z
ambia
, esp
ecial
ly the
poor
.
Budg
eted
input
(GRZ
) ‘’K
milli
on ’’
Actu
al Inp
ut (G
RZ)
’K m
illion
’’
Budg
eted
input
(Don
or)
‘’K m
illion
’’
Actua
l Inp
ut Do
nor
’K m
illion
’’
Inten
ded o
utput
Actua
l outp
ut
Repr
oduc
tive h
ealth
1,1
77
98
100 p
erce
nt co
vera
ge
72 pe
rcent
atten
ding a
ntena
tal cl
inic
Child
Hea
lth /C
hild S
urviv
al 4,7
09
392
EPI tr
aining
for p
rovin
cial p
rovid
ers.
Al
l pro
vincia
l ser
vice p
rovid
ers t
raine
d Ro
ll bac
k mala
ria
3,767
40
81
Scali
ng up
of co
artem
in 28
distr
icts
28 di
strict
s sca
led up
Pr
ocur
emen
t of A
RV’S
5,8
86
6,376
Pr
ocur
emen
t of A
RVS
for 30
00 pa
tients
Te
nder
ing be
ing do
ne
Esse
ntial
drug
kits
2825
22
35
Proc
urem
ent o
f first
line d
rugs
Pr
ocur
emen
t goin
g on.
Equip
ment
and
reh
abilit
ation
of
traini
ng
scho
ols
3250
32
50
All tr
aining
scho
ols re
habil
itated
On
going
Ap
pend
ix 14
Hea
lth -2
004
Objec
tive /
Pro
gram
mes o
r Fiel
d of
Inter
venti
on
To im
prov
e the
healt
h stat
us of
all p
eople
in Z
ambia
, esp
ecial
ly the
poor
.
Budg
eted
input
(GRZ
) ‘’K
milli
on ’’
Actu
al Inp
ut (G
RZ)
’K m
illion
’’
Budg
eted
input
Dono
r ‘’K
milli
on ’
Actua
l Inp
ut Do
nor
’K
millio
n’’
Inten
ded o
utput
Actua
l outp
ut O
utcom
e
Reha
bilita
tion o
f Hea
lth fa
cilitie
s. 10
0,500
4,6
00
Reha
bilita
tion o
f all p
rovin
cial H
ospit
als.
5 thir
d lev
el an
d all p
rovin
cial h
ospit
als re
habil
itated
.
Child
Hea
lth / C
hild s
urviv
al 4,0
00
2,400
Al
l chil
dren
immu
nized
in th
e 8 pr
ovinc
es
All c
hildr
en im
muniz
ed.
Meas
les ca
ses r
educ
ed
to 0.3
case
s fro
m 2.5
Ro
ll bac
k mala
ria
5,500
0..
5
Re
intro
duce
indo
or re
sidua
l spr
aying
in al
l Di
strict
s IR
S int
rodu
ced i
n 5 di
strict
s and
ITN’
s pilo
t pro
ject
cond
ucted
in N
/W ea
stern
prov
ince
Malar
ia inc
idenc
e re
duce
d fro
m 94
.7 to
91
per
1000
Es
senti
al dr
ug ki
ts 12
000
1,725
Pu
rchas
e of fi
rst lin
e dru
gs fo
r all
publi
c he
alth i
nstitu
tions
Fir
st lin
e dru
gs pu
rchas
ed fo
r all i
nstitu
tions
Di
seas
e bur
den
redu
ced
HIV/
AIDS
– pr
ovisi
on of
ARV
s staf
f 25
,800
13,44
0
Pu
rchas
e of A
RV’s
for 10
,000 p
atien
ts Pu
rchas
ed A
RV’s
for 6,
600 p
atien
ts an
d dist
ribute
d to
7 pro
vincia
l Hos
pitals
and 3
rd le
vel h
ospit
als
Healt
h Wor
kers
hous
ing de
velop
ment
10,00
0 10
00
Reha
bilita
tion o
f staf
f hou
ses a
nd
cons
tructi
on of
4 sta
ff hou
ses
37 st
aff ho
uses
reha
bilita
ted
Equit
y of a
cces
s to h
ealth
facil
ities
5,000
90
0
Co
nstru
ction
of he
alth p
osts
Co
nstru
ction
of 4
healt
h pos
ts un
derw
ay in
Isok
a, So
lwez
i, Nch
eleng
e and
Mum
bwa d
istric
ts inc
luding
3 sta
ff hou
ses p
er ea
ch he
alth p
ost.
Repr
oduc
tive h
ealth
1,1
77
98
100 p
erce
nt co
vera
ge
72 pe
rcent
atten
ding a
tenata
l clin
ic
Child
Hea
lth / C
hild s
urviv
al 4,7
09
392
EPI tr
aining
for p
rovin
cial p
rovid
ers.
Al
l pro
vncia
l ser
vice p
rovid
ers t
raine
d
Roll b
ack m
alaria
3,7
67
4081
Sc
aling
up of
coar
tem in
28 di
strict
s 28
distr
icts s
caled
up
Pr
ocur
emen
t of A
RV’S
5,8
86
6,376
Pr
ocur
emen
t of A
RVS
for 30
00 pa
tients
Te
nder
ing be
ing do
ne
Es
senti
al dr
ug ki
ts 28
25
2235
Pr
ocur
emen
t of fi
rst lin
e dru
gs
Proc
urem
ent g
oing o
n.
Equip
ment
and r
ehab
ilitati
on of
tra
ining
scho
ols
3250
32
50

119
Appe
ndix
15:
Wat
er an
d Sa
nita
tion
- 200
3 Ob
jectiv
e To
ensu
re th
at Za
mbia’
s wate
r res
ource
s are
effec
tively
deve
loped
and m
anag
ed to
contr
ibute
to po
verty
redu
ction
thro
ugh i
ncre
ased
acce
ss to
safe
water
and s
anita
tion,
incre
ased
food
prod
uctio
n, an
d foo
d sec
urity
for lo
w inc
ome r
ural
and u
rban
Zam
bians
.
IN
TERM
EDIA
TE IN
DICA
TORS
Pr
ogra
mm
e or f
ield
of in
terv
entio
n GR
Z Bu
dget
ed
GRZ
Amt S
pent
Do
nor B
udge
ted
Dono
r Am
t Spe
nt
Plan
ned
Outp
ut
Actu
al Ou
tput
I.
WAT
ER R
ESOU
RCES
MAN
AGEM
ENT
Wate
r Res
ource
s Acti
on P
rogr
amme
18
2,060
,646
176,0
00,00
0 5,2
28,59
0,000
3,7
45,26
9,400
Dr
aft W
ater R
esou
rces
Mana
geme
nt Bi
ll in p
lace
Preli
mina
ry W
orks
on th
e Bi
ll hav
e bee
n don
e.
sub
tota
l 18
2,060
,646
176,0
00,00
0 5,2
28,59
0,000
3,7
45,26
9,400
II.
DAM
CON
STRU
CTIO
N AN
D RE
HABI
LITA
TTIO
N PR
OGRA
MME
18
0000
0000
Irriga
tion S
chem
es
1,576
,500,0
00
1,900
,000,0
00
- -
100 %
comp
letion
81
% co
mplet
ion ra
te ac
hieve
d
Surfa
ce W
ater I
nform
ation
Dev
elopm
ent
363,0
00,00
0 28
7,000
,000
- -
Reha
bilita
tion /
Con
struc
tion o
f ear
th da
ms
1,700
,000,0
00
1,800
,000,0
00
- -
50 ea
rth da
ms re
habil
itatio
ns
62 ea
rth da
ms
reha
bilita
ted
Sub
tota
l 3,6
39,50
0,000
3,9
87,00
0,000
-
-
III.
GRO
UND
WAT
ER E
XPLO
RATI
ON A
ND M
APPI
NG
Grou
ndwa
ter M
onito
ring W
ells
80,00
0,000
80
,000,0
00
- -
8 Obs
erva
tion w
ells c
onstr
ucted
8 O
bser
vatio
n well
s co
nstru
cted
stren
gthen
ing th
e hyd
rolog
ical N
etwor
k 35
0,000
,000
350,0
00,00
0 -
- Re
hab o
f 30 h
ydro
stati
ons
Reha
b of 3
0 hyd
ro
statio
ns
Subt
otal
430,0
00,00
0 43
0,000
,000
- -
IV. C
APAC
ITY
BUIL
DING
Wate
r Sec
tor R
eform
, EM
– GTZ
4,1
71,00
0,000
4,1
71,00
0,000
Ne
w ins
titutio
ns an
d law
s, Ki
osks
in
2 CU
Comm
ercia
lisati
on, P
OIS
5,520
,000,0
00
5,520
,000,0
00
Perfo
rman
ce in
dicato
rs im
prov
ed
Prac
tices
and l
esso
ns fr
om pe
ri-ur
ban w
ater p
oints
in Lu
saka
& C
/belt
- -
9,200
,000
11,50
0,000
-
The S
econ
d in-
coun
try tr
aining
cour
se in
comm
unity
Emp
ower
ment
for
WSS
Man
agem
ent
- -
352,3
60,00
0,000
27
3,700
,000,0
00
Estab
lishm
ent a
nd ca
pacit
y buil
ding o
f Per
i urb
an S
ectio
n with
in CU
-
- 39
9,900
,000
208,7
65,00
0 11
kios
ks co
nstru
cted
11 ki
osks
cons
tructe
d
Subt
otal
- -
362,4
60,10
0,000
28
3,611
,265,0
00
V. C
OMPL
EMEN
TARY
D-W
ASHE
SUP
PORT
Em
powe
ring o
f com
munit
ies re
sultin
g in p
romo
tion
and i
mpro
ved
sanit
ation
-
- 47
7,750
,000
473,8
95,50
0 13
9 Wate
r poin
ts,19
45 la
trines
44
Wate
r poin
ts, 70
0 lat
rines
Su
btot
al -
- 36
2,937
,850,0
00
284,0
85,16
0,500
VI
. RUR
AL W
ATER
SUPP
LY A
ND S
ANIT
ATIO
N
Ru
ral W
ater S
upply
Dev
elopm
ent P
rojec
t – E
aster
n
50
,869,0
00,00
0 50
,869,0
00,00
0 82
0 Wate
r Poin
ts 19
9 Wate
r Poin
ts

12
0
Rura
l wate
r bor
ehole
s and
well
s 1,6
00,00
0,000
1,5
06,47
4,806
-
- 14
7 Wate
r poin
ts
147 W
ater p
oints
cons
tructe
d Th
e pro
ject fo
r Gro
undw
ater D
evelo
pmen
t and
San
itatio
n Imp
rove
ment
in Dr
ough
t pro
ne R
ural
Area
s Pha
se 3
320,0
00,00
0 50
0,000
,000
17,94
0,000
,000
17,94
0,000
,000
300 B
oreh
oles w
ith ha
nd pu
mps
216 B
oreh
oles w
ith ha
nd
pump
s con
struc
ted
SDA
Gwem
be D
evelo
pmen
t Pro
ject
560,0
00,00
0 44
5,364
,420
40 B
oreh
oles d
rilled
30
Bor
ehole
s Gw
embe
-Ton
ga P
rojec
t 70
0,000
,000
335,3
73,95
5 -
- 30
Bor
ehole
s drill
ed
25 B
oreh
oles
Subt
otal
2,620
,000,0
00
2,341
,848,7
61
69,36
9,000
,000
69,25
4,364
,420
TOTA
L 6,8
71,56
0,646
6,9
34,84
8,761
43
7,535
,440,0
00
357,0
84,79
4,320
No
te: D
onor
Com
pone
nts ha
ve be
en co
nver
ted in
to Kw
acha
1 Eu
ro=K
4300
, $1=
K460
0, 1p
ound
=65
00

12
1
Appe
ndix
16:
Wat
er an
d Sa
nita
tion
- 200
4 Ob
jectiv
e To
ensu
re th
at Za
mbia’
s wate
r res
ource
s are
effec
tively
deve
loped
and m
anag
ed to
contr
ibute
to po
verty
redu
ction
thro
ugh i
ncre
ased
acce
ss to
safe
water
and s
anita
tion,
incre
ased
food
pr
oduc
tion,
and f
ood s
ecur
ity fo
r low
incom
e rur
al an
d urb
an Z
ambia
ns.
IN
TERM
EDIA
TE IN
DICA
TORS
Proj
ect N
ame
GRZ
Plan
ned
inpu
t (K)
GR
Z re
lease
’s Do
nor P
lanne
d In
put
(K)
Dono
r Rele
ased
Pl
anne
d Ou
tput
(200
4)
Actu
al ou
tput
s(20
04)
I. W
ATER
RES
OURC
ES M
ANAG
EMEN
T
W
ater R
esou
rces A
ction
Pro
gram
18
2,060
,646
182,0
60,64
6 5,2
28,59
0,000
-
Draft
ing of
Wate
r Res
ource
s Act
in pr
ogre
ss
Integ
rate
Wate
r res
ource
s mgt
proje
ct (D
ANID
A)
- -
639,5
48,00
0 -
4 Dam
s, 43
wate
r poin
ts, 52
3 latr
ines &
1 dip
tank
Envir
onme
ntal
Prote
ction
and
Natu
ral
Reso
urce
s Ma
nage
ment
Proje
ct 43
,700,0
00
- 82
,800,0
00
- a.
Prote
ction
of th
e Lus
aka A
quife
r b.
Base
line
water
quali
ty for
wate
r bod
ies in
Lusa
ka
c. Lu
saka
surfa
ce w
ater q
uality
docu
ment
writte
n
Sub
tota
l 22
5,760
,646
182,0
60,64
6 5,9
50,93
8,000
-
II.
DAM
CONS
TRUC
TION
AN
D RE
HABI
LITA
TION
Re
habil
itatio
n /co
nstru
ction
of E
arth
Dams
1,5
60,26
7,582
1,5
09,21
6,778
-
- 50
dams
reha
bilita
ted &
1 ne
w da
m co
nstru
cted
work
has j
ust s
tarted
TO
TAL
1,560
,267,5
82
1,509
,216,7
78
- -
III. G
ROUN
D MO
NITO
RING
AND
EXP
LORA
TION
Grou
ndwa
ter M
onito
ring a
nd E
xplor
ation
10
1,133
,443
52,63
9,141
-
6 m
onito
ring w
ells d
rilled
and e
quipp
ed. D
ata
colle
cted
6 mon
itorin
g well
s drill
ed
Gro
und w
ater m
appin
g Stud
ies
57,98
3,217
-
Grou
nd w
ater u
tility
maps
Stre
ngthe
ning o
f Hyd
rolog
ical n
etwor
k 30
3,510
,506
100,0
00,00
0 -
30
hydr
ometr
ic sta
tions
reha
bilita
ted 30
re-
estab
lishe
d.
17 H
ydro
logica
l stat
ions
reha
bilita
ted
TOTA
L 46
2,627
,166
152,6
39,14
1 -
-
IV
. CAP
ACIT
Y BU
ILDIN
G
The
Third
In
- Co
untry
Tr
aining
Co
urse
in
Comm
unity
Emp
ower
ment
for W
ater
Supp
ly &
Sanit
ation
Mgt
-
276,0
00,00
0
Deve
lop S
kills
of W
ater S
upply
& S
anita
tion M
gt thr
ough
Com
munit
y Emp
ower
ment
De
volut
ion T
rust
Fund
-
1,2
90,00
0,000
TOTA
L -
- 1,5
66,00
0,000
-
V.
COMP
LEME
NTAR
Y D-
WAS
HE
SUPP
ORT
PROG
RAMM
E
WAS
HE
-
825,5
00,00
0
165 W
ater P
oints
and
42
50 La
trines
cons
tructe
d
TOTA
L -
- 82
5,500
,000
-
VI
. R
URAL
WAT
ER S
UPLY
DEV
ELOP
MENT
PR
OGRA
MMES
Rura
l wate
r bor
ehole
s and
well
s 48
8,850
,288
488,8
50,28
8 -
45
Bor
ehole
s site
d, co
nstru
cted &
equip
ped w
ith
hand
pump
s
45 B
oreh
oles s
ited,
cons
tructe
d & eq
uippe
d with
ha
nd pu
mps
Rura
l Wate
r Dev
elopm
ent fo
r Dro
ught
Pron
e Are
as
169,4
01,42
0 16
9,401
,420
-
Proje
ct ad
minis
tered
, Sup
ervis
ed an
d mon
itore
d sit
e pre
para
tions

12
2
Rura
l Wate
r (No
rther
n Pro
vince
) 76
,500,0
00
33
,580,0
00,00
0
175 b
oreh
oles w
ith ha
nd pu
mp co
mplet
e
Rura
l W
ater
( D
roug
ht Em
erge
ncy
Reco
very
Proje
ct)
703,2
31,44
3
-
160 B
oreh
oles s
ited,
cons
tructe
d and
equip
ped w
ith
hand
pump
s & 56
2 bor
ehole
s reh
abilit
ated
Rura
l Wate
r Dev
elopm
ent -
Easte
rn P
rovin
ce
178,5
00,00
0 10
5,510
,032
50,60
0,000
300 W
ater p
oints
220
Rura
l Wate
r Dev
elopm
ent -
North
ern P
rovin
ce
76,50
0,000
76
,500,0
00
-
178 b
ore h
oles
site p
repa
ratio
ns
Follo
w-up
Stud
y &
Reha
bilita
tion
of all
Jap
anes
e re
lated
bore
holes
-
4,1
40,00
0,000
Curre
nt sta
tus of
all J
apan
ese r
elated
bore
holes
are
studie
d
SDA
grou
nd w
ater d
evelo
pmen
t -
18
6,000
,000
186,0
00,00
0 50
Bor
ehole
12
bore
holes
TOTA
L 1,6
92,98
3,151
84
0,261
,740
37,95
6,600
,000
186,0
00,00
0
VI
I.
PE
RI-U
RBAN
W
ATER
SU
PPLY
AN
D SA
NITA
TION
Pr
ivate
Secto
r Pa
rticipa
tion
in W
SS
Servi
ce
Deliv
ery f
or U
rban
Poo
r in Z
ambia
-
46
,000,0
00
-
Ex
plorin
g Pr
ivatel
y Ma
nage
d Pu
blic
Sanit
ary
Facil
ities i
n Per
-Urb
an A
reas
for im
prov
ed H
ealth
-
- 11
5,000
,000
- To
ilets
built
in ce
rtain
peri u
rban
area
s
Wate
r Ki
osks
- L
ow C
ost
Tech
nolog
ies f
or t
he
Urba
n Poo
r
- 23
0,000
,000
- 10
kios
ks bu
ilt (1
400 p
erso
ns)
Wate
r Sec
tor R
eform
-
- 3,0
10,00
0,000
-
New
institu
tions
and l
aws
.
- -
3,010
,000,0
00
- Ki
osk i
n 2 C
U co
nstru
cted
Co
mmer
cialis
ation
-
- 3,4
40,00
0,000
-
Perfo
rman
ce in
dicato
rs im
prov
emen
ts
POIS
-
- 1,2
90,00
0,000
-
Perfo
rman
ce in
dicato
rs im
prov
emen
ts
Wate
r Su
pply
in Ea
stern
, So
uther
n an
d No
rth-
weste
rn P
rovin
ces
- -
610,6
00,00
0,000
-
Living
En
viron
menta
l Im
prov
emen
t Pr
oject
for
Unpla
nned
Urb
an S
ettlem
ent in
Lusa
ka*
- -
17,94
0,000
,000
- Cl
ean &
stab
le wa
ter su
pply
syste
m co
mplet
ed
Comm
unity
Cen
tres c
omple
ted
Peri U
rban
Wate
r Sup
ply &
San
itatio
n -
- 1,0
32,43
0,000
-
46 ki
osks
& re
hab o
f netw
ork ,
Es
tablis
hmen
t & ca
pacit
y buil
ding o
f Per
i urb
an
secti
on w
ithin
CU
Ba
selin
e Stud
y on W
SS in
Per
i urb
an ar
eas o
f Za
mbia
- -
2,150
,000,0
00
- Da
ta in
all pe
ri urb
an ar
eas i
s coll
ected
TOTA
L -
- 64
2,863
,430,0
00
-
Gr
and
tota
l 3,9
41,63
8,545
2,6
84,17
8,305
68
9,162
,468,0
00
186,0
00,00
0

12
3
Appe
ndix
17:
Soc
ial S
afet
y Net
s- 20
03
Food
Sec
urity
Pac
k Ob
jectiv
e: To
prom
ote a
self-s
ustai
ning e
xpor
t-led a
gricu
lture
secto
r whic
h ens
ures
incre
ased
hous
ehold
inco
me an
d foo
d sec
urity
Ag
ricul
ture
Pr
ogra
mm
es
Inte
rmed
iate i
ndica
tors
Plan
ned G
RZ In
puts
K’ m
illion
Ac
tual G
RZ In
puts
K’ m
illion
Pl
anne
d Outp
uts
Actua
l Outp
uts
Food
Sec
urity
Pac
k Pr
ogra
mm
e 90
,000
44,40
0 20
0,000
hou
seho
lds
150,0
00 h
ouse
hold
s sup
porte
d
Targ
eted F
ood S
ecur
ity
Pack
– W
etlan
d Pr
ogra
mme (
June
2003
– Au
gust
2003
)
4,000
1,4
00
75 M
t see
d maiz
e 1 M
t Sor
ghum
seed
0 M
t Rice
30
Mt B
eans
10
Mt G
roun
dnuts
20
Mt A
gr. L
ime
140 M
t Com
poun
d D
140 M
t Ure
a
20,00
0 hou
seho
lds su
ppor
ted
75 M
t see
d maiz
e 1 M
t Sor
ghum
seed
0 M
t Rice
30
Mt B
eans
10
Mt G
roun
dnuts
20
Mt A
gr. L
ime
140 M
t Com
poun
d D
140 M
t Ure
a Ta
rgete
d Foo
d Sec
urity
Pa
ck –
Rainf
ed
(Sep
tembe
r 200
3 – Ju
ne
2004
)
86,00
0 43
,000
585 M
t Maiz
e see
d 10
Mt S
orgh
um se
ed
75 M
t Rice
4 M
t Mille
t 20
0 Mt B
eans
10
00 M
t Gro
undn
uts
150 M
t Cow
peas
15
0 Mt S
oya b
eans
31
,200,0
00 C
assa
va cu
ttings
20
0,000
x50k
g vol.
S/po
tato v
ines
3,500
Mt A
gric.
Lime
7,5
00 M
t Com
poun
d D
7,500
Mt U
rea
8,500
fishin
g nets
15
,000 s
mall l
ivesto
ck
130,0
00 ho
useh
olds s
uppo
rted
585 M
t Maiz
e see
d 8 M
t Sor
ghum
seed
75
Mt R
ice
4.49 M
t Mille
t 72
2 Mt B
eans
14
5 Mt G
roun
dnuts
36
Mt C
owpe
as
120 M
t Soy
a bea
ns
3,500
Mt A
gric.
Lime
5,5
80 M
t Com
poun
d D
5,580
Mt U
rea
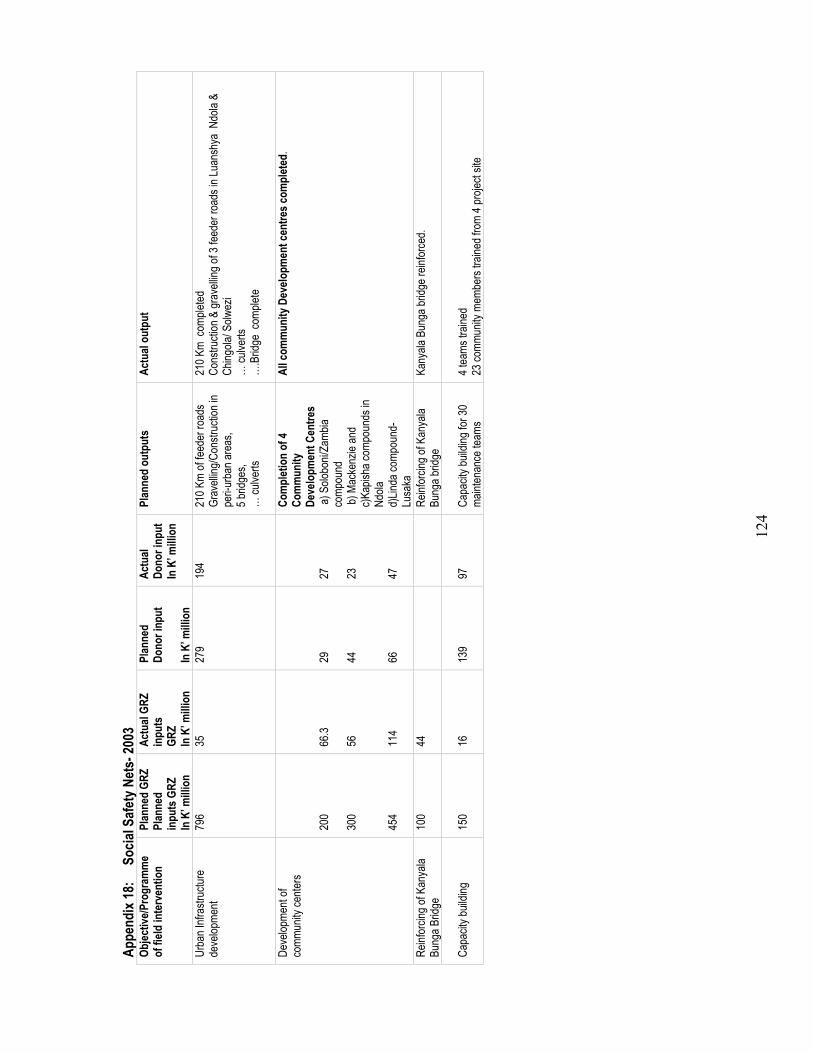
12
4
Appe
ndix
18:
Soc
ial S
afet
y Net
s- 20
03
Objec
tive/P
rogr
amm
e of
field
inte
rven
tion
Plan
ned
GRZ
Plan
ned
inpu
ts G
RZ
In K
’ milli
on
Actu
al GR
Z
inpu
ts
GRZ
In K
’ milli
on
Plan
ned
Dono
r inp
ut
In K
’ milli
on
Actu
al Do
nor i
nput
In
K’ m
illion
Plan
ned
outp
uts
Actu
al ou
tput
Urba
n Infr
astru
cture
de
velop
ment
796
35
279
194
210 K
m of
feede
r roa
ds
Grav
elling
/Con
struc
tion i
n pe
ri-ur
ban a
reas
, 5 b
ridge
s,
… cu
lverts
210 K
m co
mplet
ed
Cons
tructi
on &
grav
elling
of 3
feede
r roa
ds in
Luan
shya
Ndo
la &
Ching
ola/ S
olwez
i …
culve
rts
….B
ridge
com
plete
De
velop
ment
of co
mmun
ity ce
nters
200
300
454
66.3
56
11
4
29
44
66
27
23
47
Com
plet
ion
of 4
Com
mun
ity
Deve
lopm
ent C
entre
s a)
Solo
boni/
Zamb
ia co
mpou
nd
b) M
acke
nzie
and
c)Kap
isha c
ompo
unds
in
Ndola
d)
Linda
comp
ound
- Lu
saka
All c
omm
unity
Dev
elopm
ent c
entre
s com
plet
ed.
Reinf
orcin
g of K
anya
la Bu
nga B
ridge
10
0 44
Re
infor
cing o
f Kan
yala
Bung
a brid
ge
Kany
ala B
unga
bridg
e rein
force
d.
Capa
city b
uildin
g 15
0 16
13
9 97
Ca
pacit
y buil
ding f
or 30
ma
inten
ance
team
s
4 tea
ms tr
ained
23
comm
unity
mem
bers
traine
d fro
m 4 p
rojec
t site

12
5
Appe
ndix
19:
Soc
ial S
afet
y Net
s- 20
03
IN
TERM
EDIA
TE IN
DICA
TORS
Plan
ned
GRZ
inpu
ts
Actu
al GR
Z in
puts
Pl
anne
d Do
nor
inpu
ts
Actu
al Do
nor
inpu
ts
Plan
ned
Outp
uts
Actu
al Ou
tput
s
To fa
cilita
te ac
cess
to he
alth s
ervic
es.
0.5 bi
llion
kwac
ha.
453 m
illion
kw
acha
nil
Ni
l Us
er fe
es pa
id an
d dru
gs
purch
ased
for 2
5000
clien
ts Us
er fe
es pa
id an
d dru
gs
purch
ased
for 6
333 c
lients
. To
facil
itate
acce
ss to
Edu
catio
n ser
vices
. 1 b
illion
Kwa
cha
906 m
illion
kw
acha
nil
Ni
l S
choo
l fees
and r
equis
ites
purch
ased
and f
ees p
aid fo
r 216
0 pu
pils
Scho
ol fee
s and
requ
isites
pu
rchas
ed an
d fee
s paid
for
4220
pupil
s. To
facil
itate
acce
ss to
socia
l sup
port.
( foo
d, sh
elter
, clo
thing
). 4 b
illion
kwac
ha.
3. bil
lion
kwac
ha.
nil
Nil
Food
ratio
ns an
d clot
hes
purch
ased
for 6
0 450
clien
ts.
Foo
d rati
ons,
clothe
s, bla
nkets
pu
rchas
ed an
d rep
atriat
ion
done
for 4
6180
clien
ts.
Total
5 b
illion
kwac
ha.
5 billi
on.
nil
Nil
87 61
0 56
733 c
lients
of in
terv
entio
ns
1.Obje
ctive
: To a
ssist
the m
ost v
ulner
able
in so
ciety
to ful
fil the
ir bas
ic ne
eds,
partic
ularly
healt
h, ed
ucati
on, fo
od an
d she
lter a
nd pr
omote
co
mmun
ity ca
pacit
y, to
deve
lop lo
cal a
nd ex
terna
lly su
ppor
ted in
itiativ
es to
over
come
the p
roble
ms of
extre
me po
verty
and v
ulner
abilit
y

12
6
Appe
ndix
20:
Soc
ial S
afet
y Net
s- 20
03
Prog
ramm
es o
r Fie
ld of
Inter
venti
on
Objec
tive:
To m
itigate
and i
mpro
ve th
e soc
io-ec
onom
ic an
d cult
ural
status
of al
l vuln
erab
le gr
oups
of pe
ople
in Za
mbia
and t
here
by co
ntribu
te to
natio
nal d
evelo
pmen
t.
Bu
dget
ed
inpu
t (G
RZ)
‘’K
milli
on ’’
Budg
eted
In
put (
Dono
r) Kw
acha
Act
ual
Inpu
t (G
RZ)
’K
milli
on’’
Actu
al In
put
Dono
r ’K
milli
on’’
Inte
nded
out
put
Actu
al ou
tput
Psyc
hoso
cial
Coun
sellin
g an
d Sma
ll Bu
sines
s Aw
aren
ess
34
5 milli
on
151,0
00
122.m
illion
11
9 for
mer Z
RL em
ploye
es to
coun
selle
d 84
4 for
mer R
AMCO
Z em
ploye
es co
unse
lled.
Only
4 for
mer Z
RL em
ploye
es co
unse
lled.
556 f
orme
r RAM
COZ
emplo
yees
coun
selle
d.
Agric
ultur
e ba
sed t
raini
ng
46
0 milli
on
84
.8 mi
llion
Prov
ide a
gricu
lture
bas
ed tr
aining
skil
ls to
27 fo
rmer
ZR
L em
ploye
es f
rom
Chom
a, Ma
zabu
ka,
Kalom
o, Mo
nze a
nd Li
vings
tone.
27 fo
rmer
ZRL
emplo
yees
actua
lly tr
ained
.
Land
re
settle
ment
21
4 milli
on
13
7 milli
on
10 la
nd re
settle
ment
semi
nars
for 1,
500 b
enefi
ciarie
s 10
bore
holes
to dr
illed
Feas
ibility
stud
y on
40
Km o
f Fe
eder
roa
ds i
n Ka
tikulu
la an
d Chit
ambo
Fe
asibi
lity s
tudy
on t
he c
onstr
uctio
n of
Scho
ol an
d he
alth
centr
e an
d re
habil
itatio
n of
teach
ers’
hous
es in
re
settle
ment
area
s.
10 se
mina
rs he
ld 10
Bor
ehole
s drill
ed
study
comp
leted
and c
ivil w
orks
yet to
star
t. St
udy c
omple
ted an
d civi
l wor
ks ar
e yet
to sta
rt.
Sour
ce: M
inistr
y of L
abou
r and
Soc
ial S
ecur
ity
Note
: Gov
ernm
ent c
ontrib
ution
was
in te
rms o
f adm
inistr
ative
supp
ort to
the p
rojec
t total
ling Z
MK 15
1,000
,000 d
uring
the p
eriod
unde
r rev
iew.

12
7
Appe
ndix
21:
Gove
rnan
ce -
2003
Sect
or G
oal:
To p
rom
ote G
ood
Gove
rnan
ce in
the m
anag
emen
t of P
rivat
e and
Pub
lic A
ffairs
as a
mec
hani
sm o
f pov
erty
redu
ctio
n
INTE
RMED
IATE
INDI
CATO
RS
Prog
ram
me /
Field
of I
nter
vent
ion
Plan
ned
GRZ
Inpu
ts
Act
ual G
RZ
Inpu
ts
Plan
ned
Dono
r inp
uts
Act
ual d
onor
in
put
Plan
ned
Outp
uts
Actu
al o
utpu
ts
Cons
titutio
nal re
view
9,000
4,8
00
17,00
0 -
No
./% of
wom
en in
decis
ion m
aking
go
vern
ment
posit
ions (
Minis
ters,
PSs,
MPs),
Revie
w the
cons
titutio
n by
2006
,Dec
ision
mak
ing pr
oces
ses
dece
ntrali
zed b
y 200
4
CRC
has c
omple
ted an
d su
bmitte
d rep
ort to
go
vern
ment,
17%
wom
en in
selec
ted de
cision
ma
king p
ositio
ns
Natio
nal in
daba
1,000
sta
keho
lder in
volve
ment
on m
ajor
natio
nal is
sues
In
daba
repo
rt pr
oduc
ed an
d end
orse
d by
cabin
et
Elec
tral re
form
3,000
-
-
Ex
ecuti
ve po
wers
in the
Con
stitut
ion
revie
wed
Elec
toral
legisl
ation
revie
wed r
epor
t su
bmitte
d to g
over
nmen
t De
centr
alisa
tion
of An
ti co
rupti
on
comm
ission
1,300
-
-
439 c
ompla
ints l
odge
d by J
une 2
003
Appe
ndix
22:
Gove
rnan
ce -
2004
Sec
tor G
oal:
To p
rom
ote G
ood
Gove
rnan
ce in
the m
anag
emen
t of P
rivat
e and
Pub
lic A
ffairs
as a
mec
hnism
of p
over
ty re
duct
ion
Objec
tive/P
rogr
amm
e/Fiel
d of
Inte
rven
tion
INTE
RMED
IATE
INDI
CATO
RS
P
lanne
d GR
Z In
puts
A
ctua
l GRZ
In
puts
P
lanne
d Do
nor i
nput
s A
ctua
l do
nor i
nput
Pl
anne
d Ou
tput
s Ac
tual
out
puts
Socio
-Pol
itica
l Gov
erna
nce
Cons
titut
iona
l and
Judi
cial r
efor
ms
Cons
titutio
nal re
view
9,
000
4,200
1
7,000
-
.. of w
omen
in de
cision
mak
ing
gove
rnme
nt po
sition
s (Mi
nister
s, PS
s, MP
s),Re
view
the co
nstitu
tion b
y 20
06,D
ecisi
on m
aking
proc
esse
s de
centr
alize
d by 2
004
CRC
has c
omple
ted an
d su
bmitte
d rep
ort to
go
vern
ment,
17%
wom
en in
selec
ted de
cision
ma
king p
ositio
ns
Parlia
menta
ry Re
forms
Live d
ebate
cove
rage
on F
M ra
dio fr
om 20
-50
kilom
etre r
adius
.
Imple
menta
tion o
f the D
ecen
traliz
ation
Poli
cy
Five (
5) ye
ar im
pleme
ntatio
n Acti
on P
lan
deve
loped
, Rep
ortin
g pro
cedu
res c
larifie
d for
the
Dec
entra
lisati
on S
ecre
tariat
Ec
onom
ic Go
vern
ance
Pu
blic E
xpen
ditur
e Man
agem
ent R
eform
s

12
8
Mediu
m Te
rm
Expe
nditu
re
Fram
ewor
k Tr
aining
4,6
19
4,664
-
MT
EF im
pleme
ntatio
n in 2
004,M
TEF
200
Cons
ultati
ve G
roup
s tra
ined,2
00 B
udge
t Co
mmitte
es tr
ained
in al
l MPS
As,
Imple
menta
tion o
f Acti
vity B
ased
Bud
getin
g
1,459
Acti
vity B
ased
Bud
getin
g / IF
MIS
imple
mente
d / ad
opted
in al
l go
vern
ment
spen
ding a
genc
ies
FMS
Retoo
led 35
0 acc
ounta
nts tr
ained
on
CCS
Imple
menta
tion o
f IFMI
S 82
0 16
9 3,0
94
844
% of
Fun
ding t
o Dep
artm
ents
acco
rding
to Y
ellow
Boo
k esti
mates
Impr
oved
Fina
ncial
Man
agem
ent S
ystem
, 99%
of
fundin
g bein
g don
e acc
ordin
g to y
ellow
bo
ok.5
sites
elec
ted fo
r pilo
ting,
Tend
er
Nego
tiatio
ns go
ing on
De
moc
ratic
Gov
erna
nce
Imple
menta
tion o
f PSR
P
%
of qu
alifie
d per
sons
in ci
vil se
rvice
Tran
spar
ency
and
Acco
unta
bilit
y
Na
tiona
l Bas
eline
surve
y
20
-
97
Base
line R
epor
t Ba
selin
e Rep
ort C
omple
ted
Law
Enfo
rcem
ent a
nd H
uman
Rig
hts
Polic
e and
Pris
ons S
ervic
e 7,6
92
5,692
-
-
Po
lice C
amps
reha
bilita
ted, C
amp r
oads
gr
aded
, Poli
ce C
ells r
ehab
ilitate
d
Inter
natio
nal C
onve
ntion
on
the E
limina
tion
of Ra
cial D
iscrim
inatio
n
800
Re
port
done
Huma
n righ
ts Co
mmiss
ion ca
pacit
y Buil
ding
25
2 -
-
Ta
sk F
orce
on A
nti C
orru
ption
400
Judi
cial R
efor
ms
Cons
tructi
on an
d Reh
abilit
ation
of co
urts
1,436
64
8 76
0, 80
0 Ba
cklog
of ca
ses a
waitin
g disc
harg
e (n
umbe
r, ye
ar en
d)
66 Lo
cal c
ourts
and 6
Sub
ordin
ate co
urts
reha
bilita
ted in
all th
e pro
vince
s. Pr
ocur
emen
t of O
ffice f
urnit
ure a
nd
Equip
ment
1,901
To
tal nu
mber
of co
urtro
oms w
ith ju
dges
an
d per
sonn
el as
signe
d.
Judg
es an
d Mag
istra
tes fu
rnitu
re pr
ocur
ed an
d dis
tribute
d. Fa
xes,
ers a
nd S
cann
ers a
lso
proc
ured
. Ph
ase I
cons
tructi
on of
Mag
istra
te Co
urt
Comp
lex
2,1
76
12
cour
troom
s com
plex w
ith ad
minis
trativ
e ce
lls bu
ilt.
Refin
emen
t of th
e Stra
tegic
Plan
40
6,250
32
St
rateg
ic Pl
an de
velop
ed an
d Pr
ogra
mmes
imple
mente
d St
rateg
ic Pl
an im
pleme
nted
Capa
city B
uildin
g 87
8 67
4 6
511
24
Pro
fessio
nals,
40 La
y Mag
istra
tes,44
Ju
dges
and 2
0 Mag
istra
tes tr
ained
Sm
all C
laims
Cou
rt 60
19
2052
case
s hav
e bee
n file
d 105
9 alre
ady b
een
dispo
sed o
f. Im
pleme
ntatio
n of J
uven
ile Ju
stice
Sys
tem
216
216
Child
Justi
ce F
orum
s esta
blish
ed in
9 Pr
ovinc
ial H
eadq
uarte
rs Ch
ild
Justi
ce
Foru
ms
launc
hed
in Nd
ola,
Kitw
e, Liv
ingsto
ne an
d Lus
aka
Alter
nativ
e Disp
ute R
esolu
tion M
echa
nisms
-
54
49 ca
ses h
ave b
een r
eferre
d for
med
iation
13
58 ha
ve be
en su
cces
sfully
settle
d

12
9
Comp
uteris
ation
12
3,442
.00
53,44
2
Netw
orkin
g Com
plete,
read
y for
co
mmiss
ioning
Co
urt C
ircuit
ing
15
,393,4
31
22
1,000
5 t
win c
ams,
7 Stat
ion W
agon
s 5 t
win c
ams p
urch
ased
20
03 B
UDGE
T
Cons
titutio
nal re
view
9,000
4,8
00
17,00
0,
-
No./%
of w
omen
in de
cision
mak
ing
gove
rnme
nt po
sition
s (Mi
nister
s, PS
s, MP
s),Re
view
the co
nstitu
tion b
y 20
06,D
ecisi
on m
aking
proc
esse
s de
centr
alize
d by 2
004
CRC
has c
omple
ted an
d su
bmitte
d rep
ort to
go
vern
ment,
17%
wom
en in
selec
ted de
cision
ma
king p
ositio
ns
Natio
nal in
daba
1,000
sta
keho
lder in
volve
ment
on m
ajor
natio
nal is
sues
In
daba
repo
rt pr
oduc
ed an
d end
orse
d by
cabin
et
Elec
toral
refor
m
3,0
00
-
-
Exec
utive
powe
rs in
the C
onsti
tution
re
viewe
d El
ector
al leg
islati
on re
viewe
d rep
ort
subm
itted t
o gov
ernm
ent
Dece
ntrali
satio
n of
Anti
corru
ption
co
mmiss
ion
1,3
00
-
-
43
9 com
plaint
s lod
ged b
y Jun
e 200
3

13
0
APPE
NDIX
23 a:
REG
IONA
L DE
VELO
PMEN
T-Ce
ntra
l Pro
vince
Ob
jectiv
e/ pr
ogra
mm
es o
r Fiel
d of
In
terv
entio
n Pl
anne
d GR
Z In
puts
Ac
tual
GRZ
Inpu
ts
Plan
ned
Outp
uts
Actu
al Ou
tput
s Na
tiona
l Fee
der R
oads
Pro
gram
me(P
RP)
2,000
1,2
00
Reha
bilita
tion o
f nati
onal
feede
r roa
ds
Re
settl
emen
t Pro
gram
mes
Re
settle
ment
Sche
mes
500
500
990 f
arm
plots
to be
dema
rcated
and a
lloca
ted
� 837
Far
m plo
ts
772
Far
m plo
ts
110 B
oreh
oles t
o be d
rilled
and e
quipp
ed
� 05 b
oreh
oles d
rilled
and e
quipp
ed
43
5 Km.
of in
terna
l acc
ess r
oads
to be
stum
ped a
nd fo
rmed
� 3
0 km
of ac
cess
road
form
ed 38
Km
of ac
cess
road
stum
ped
6 C
linics
to be
prov
ided
1 Clin
ic pr
ovide
d
6 Agr
icultu
ral S
torag
e she
ds to
be pr
ovide
d � N
il
6 S
choo
ls to
be pr
ovide
d 3 S
choo
ls pr
ovide
d
To ac
quire
land
for A
gricu
ltura
l Res
ettlem
ent p
urpo
ses
� Lan
d suit
abilit
y sur
vey a
t Kan
yesh
a sch
eme d
one·
Socio
-eco
nomi
c sur
vey o
f Kan
yesh
a don
e·
Ma
pping
of so
cio-e
cono
mic f
eatur
es
10
00 S
ettler
Title
Dee
d Offe
r lette
rs to
be s
ecur
ed
He
alth
Reha
bilita
tion o
f Dist
rict H
ospit
als,
600
500
Reha
bilita
tion o
f Dist
rict H
ospit
als, C
entra
l Pro
vince
On
-goin
g Re
hab.
Of K
abwe
Gen
Hos
pitals
45
0 20
0 Re
habil
itatio
n of K
abwe
Gen
eral
Hosp
ital
On-g
oing
Rura
l Dev
elopm
ent
Anim
al Dr
augh
t Pow
er
200
1,000
12
000 s
mall-s
cale
farme
rs in
60 ag
ricult
ural
camp
s in a
ll the
6 dis
tricts
in the
prov
ince a
re ta
rgete
d.
�Star
t-up
Wor
ksho
p for
40
Minis
try o
f Ag
ricult
ure
and
Co-
oper
ative
s Sen
ior st
aff.
�Staf
f Tra
ining
for 5
4 Fiel
d staf
f (Ve
terina
ry As
sistan
ts an
d Ca
mp E
xtens
ion O
fficer
s) in
Cons
erva
tion T
illage
Tec
hnolo
gies
and D
onke
y/Ox T
raini
ng.
�Far
mer
grou
p ide
ntific
ation
and
awa
rene
ss m
eetin
gs fo
r the
ide
ntifie
d gro
ups
� Pro
cure
ment
of 30
0 Ri
pper
s tha
t hav
e sin
ce b
een
distrib
uted
to the
six d
istric
ts eq
ually
.
� P
repa
ratio
n of T
ende
r Doc
umen
ts an
d Floa
tation
for p
urch
ase
of 24
0 don
keys
and 1
20 ha
rnes
ses.
�Orie
nted 4
0 sen
ior M
ACO
staff t
o pro
ject im
pleme
ntatio
n.
�Tra
ined
54 f
ield
staff
(Vas
/CEO
s) in
Cons
erva
tion
Tillag
e Te
chno
logies
and D
onke
y/Ox-t
raini
ng.
� Far
mer G
roup
s hav
e bee
n ide
ntifie
d.
� Con
ducte
d awa
rene
ss m
eetin
g.
� Pro
cure
d 300
rippe
rs.
� The
bid d
ocum
ent h
as be
en pr
epar
ed an
d ten
der f
loated
. Irr
igatio
n Dev
elopm
ent
1,500
20
0, 80
hous
ehold
s who
will
incre
ase h
ectar
age u
nder
vege
table
prod
uctio
n and
high
value
crop
s. Pr
ocur
emen
t of G
RZ 11
8 and
Tru
ck sp
are p
arts
and f
uel.
Sub
tota
l 3,8
33
1,700

13
1
APPE
NDIX
23 b
: 200
3 PRP
INDI
CATO
R MO
NITO
RING
REP
ORT-
East
ern
Prov
ince
Ob
jectiv
e/ pr
ogra
mm
es o
r Fiel
d of
In
terv
entio
n Pl
anne
d GR
Z In
puts
Ac
tual
GRZ
Inpu
ts
Plan
ned
Outp
uts
Actu
al Ou
tput
s
Educ
atio
n
Pr
ovisi
on of
Sch
ool D
esks
1,3
33
300
Prov
ision
of 76
0 Sch
ool D
esks
37
8 pro
cure
d He
alth
Reha
bilita
tion o
f Chip
ata G
ener
al Ho
spita
l 45
0 30
0 Re
habil
itatio
n of C
hipata
Gen
eral
Hosp
ital
`
600
250
` `
Rura
l Dev
elopm
ent
Reha
bilita
tion o
f Loc
al co
urts
400
Re
habil
itatio
n of L
ocal
cour
ts On
-goin
g De
velop
ment
of inf
rastr
uctur
e in n
ew di
strict
s 30
0 30
0
Yo
uth
Deve
lopm
ent
Cons
tructi
on of
Chil
dren
Reh
abilit
ation
Cen
tre
450
100
Cons
tructi
on of
Chil
dren
Reh
abilit
ation
Cen
tre
On-g
oing
Rura
l Dev
elopm
ent
Natio
nal F
eede
r Roa
ds P
rogr
amme
(PRP
) 2,0
00
1,100
Re
habil
itatio
n of N
ation
al Fe
eder
Roa
ds
On-g
oing
Rura
l Dev
elopm
ent
Irriga
tion a
nd W
ater H
arve
sting
1,5
00
600
reha
bilita
te 11
dams
11
dams
reha
bilita
ted
Rese
ttlem
ent P
rogr
amm
es
Rese
ttleme
nt Sc
heme
s(PRP
) 50
0 20
0 De
marca
tion o
f Plot
s Ye
t to be
repo
rted
Sub
tota
l 9,4
33
3,150

13
2
APPE
NDIX
23 c:
2003
PRP
INDI
CATO
R MO
NITO
RING
REP
ORT-
Luap
ula P
rovin
ce
Objec
tive/
prog
ram
mes
or F
ield
of In
terv
entio
n
Plan
ned
GRZ
Inpu
ts
Actu
al GR
Z In
puts
Pl
anne
d Ou
tput
s Ac
tual
Outp
uts
Educ
atio
n
Prov
ision
of S
choo
l Des
ks
1,333
15
0 Pr
ovisi
on of
320 d
esks
, 50 t
ables
and 5
0 ch
airs
320 d
esks
, 50 t
ables
and 5
0 cha
irs pr
ocur
ed B
lown u
p roo
fs re
place
d in t
wo
scho
ols
1 * 3
class
room
bloc
ks, 3
staff
hous
es an
d VIP
toile
t
1 *
3 cla
ssro
om bl
ocks
, 3 st
aff ho
uses
and V
IP to
ilet
Rura
l Dev
elopm
ent
Natio
nal F
eede
r Roa
ds P
rogr
amme
(PRP
) 2,0
00
1,150
Grad
ing of
50 km
Cha
nnel
clear
ing 60
km Li
nes o
f culv
erts
instal
led 35
km
Reha
bilita
tion o
f loca
l cou
rts
500
200
Reha
bilita
tion o
f 7 lo
cal c
ourts
5 l
ocal
cour
ts re
habil
itated
Re
settl
emen
t Pro
gram
mes
00
1 Res
ettlem
ent S
chem
es(P
RP)
500
250
Dema
rcatio
n of 6
00 pl
ots
179 p
lots d
emar
cated
, 5.8
km ro
ad
Healt
h
Co
mplet
ion of
Man
sa G
ener
al Ho
spita
l (1)
2,500
1,0
00
Comp
letion
of O
PD (1
) OP
D (1
) Com
plete
Reha
bilita
tion o
f Dist
rict H
ospit
als, L
uapu
la Pr
ovinc
e 60
0 20
0 Re
habil
itatio
n of a
ll Dist
rict H
ospit
als
3 dist
rict h
ospit
als re
habil
itated
Ru
ral D
evelo
pmen
t
Be
e Kee
ping
600
50
, 000
kg of
hone
y pro
duce
d 21
, 000
kg of
hone
y pro
duce
d Fe
asibi
lity S
tudy A
gricu
ltura
l Lim
e 10
0
2 fea
sibilit
y Stud
ies in
Agr
icultu
ral L
ime
2 fea
sibilit
y stud
ies do
ne
Reha
bilita
tion o
f dam
1 d
am re
habil
itated
Da
m re
habil
itated
(1)
Drilli
ng of
bore
hole
Drilli
ng of
10 bo
reho
les
1 dam
reha
bilita
ted
Reha
bilita
tion o
f bor
ehole
s
Re
habil
itatio
n of 4
bore
holes
4 b
oreh
oles r
ehab
ilitate
d Da
m su
rvey
One s
urve
y On
e sur
vey
Deve
lopme
nt of
infra
struc
ture i
n new
distr
icts
300
150
Cons
tructi
on of
2 DC
s hou
ses
2 DC
s hou
ses c
onstr
ucted
8,433
3,1
00

13
3
APPE
NDIX
23 d
: 200
3 PRP
INDI
CATO
R MO
NITO
RING
REP
ORT
-Lus
aka P
rovin
ce
Objec
tive/
prog
ram
mes
or F
ield
of In
terv
entio
n Pl
anne
d GR
Z In
puts
Ac
tual
GRZ
Inpu
ts
Plan
ned
Outp
uts
Actu
al Ou
tput
s Re
settl
emen
t Pro
gram
mes
Re
settle
ment
Sche
mes(P
RP)
300
300
Dema
rcatio
n of 6
00 pl
ots
75%
comp
lete
Healt
h
Re
habil
itatio
n of d
istric
t hos
pitals
1,2
00
1,600
Ye
t to be
iden
tified
No
t yet
Rura
l Dev
elopm
ent
Deve
lopme
nt of
infra
strac
ture
600
1,200
Pu
rchas
e 1 o
ffice b
lock a
nd re
habil
itatio
n of
DCs o
fficial
resid
ence
1 O
ffice b
lock p
urch
ased
and r
ehab
ilitati
on of
DCs
off
icial
resid
ence
on-g
oing
Reha
bilita
tion o
f loca
l cou
rts
1,000
80
0 Co
nstru
ction
of 2
local
cour
ts At
prov
incial
tend
ering
comm
ittee s
tage
Educ
atio
n
Pr
ovisi
on of
Sch
ool D
esks
2,6
66
800
700 t
wo-se
ater d
esks
for lo
wer p
rimar
y 37
0 two
-seate
r des
ks fo
r lowe
r prim
ary
70
0 two
-seate
r des
ks fo
r High
Sch
ools
344 t
wo-se
ater d
esks
for H
igh S
choo
ls Ru
ral D
evelo
pmen
t
Na
tiona
l Fee
der R
oads
Pro
gram
(PRP
) 2,0
00
700
Reha
bilita
tion 3
feed
er ro
ads
At te
nder
ing st
age
Sub
tota
l 4,6
66,
1,500
,

13
4
APPE
NDIX
23 e:
2003
PRP
INDI
CATO
R MO
NITO
RING
REP
ORT
-Nor
th-W
este
rn P
rovin
ce
Objec
tive/
prog
ram
mes
or F
ield
of In
terv
entio
n Pl
anne
d GR
Z In
puts
Ac
tual
GRZ
Inpu
ts
Plan
ned
Outp
uts
Actu
al Ou
tput
s De
velop
ment
of inf
rastr
uctur
e in n
ew di
strict
s 30
0 _
Cons
tructi
on of
4 ho
uses
Co
nstru
ction
of th
e 4 ho
uses
on-g
oing
Reha
bilita
tion o
f loca
l cou
rts
500
_ Re
habil
itatio
n of 7
loca
l cou
rts
On-g
oing
Infra
struc
ture D
evelo
pmen
t Lum
wana
and K
ansa
nshi
Mine
s 2,0
00
1,000
4 h
ouse
s con
struc
tion
4 Hou
ses c
onstr
ucted
Ed
ucat
ion
Prov
ision
of S
choo
l Des
ks
1,333
20
0 Pr
ovisi
on of
Sch
ool D
esks
To
be de
termi
ned
Healt
h
Co
mplet
ion of
Solw
ezi G
ener
al Ho
spita
l (1)
2,500
1,3
00
Comp
letion
of S
olwez
i Gen
eral
Hosp
ital (1
) So
lwez
i Gen
eral
Hosp
ital C
omple
ted (1
) Re
habil
itatio
n of D
istric
t Hos
pitals
,Nor
th-W
ester
n 60
0 40
0 Re
habil
itatio
n of 6
Dist
rict H
ospit
als
6 Dist
rict H
ospit
als re
habil
itated
Land
Dem
arca
tion
910
210
Estab
lishm
ent o
f 7 re
settle
ment
sche
mes i
n 7
distric
ts 7 r
esett
lemen
t sch
emes
estab
lishe
d in 7
distr
icts
Natio
nal F
eede
r Roa
ds P
rogr
amme
(PRP
) 2,0
00
1,450
Re
habil
itatio
n of 7
natio
nal fe
eder
road
s pr
ogra
mme
On-g
oing
Indu
stria
l Dev
elopm
ent
Bee k
eepin
g(PR
P)
300
200
3 Bee
keep
ing di
strict
proje
cts
On-g
oing
Rese
ttlem
ent P
rogr
amm
es
Rese
ttleme
nt Sc
heme
s(PRP
) 50
0 10
0 De
marca
te 50
0 Ha,
drill
3 bor
ehole
s, re
habil
itate
3 bor
ehole
s 43
4 Ha d
emar
cated
, 3 bo
reho
les dr
illed,
3 bor
ehole
s re
habil
itated
8,143
3,8
60
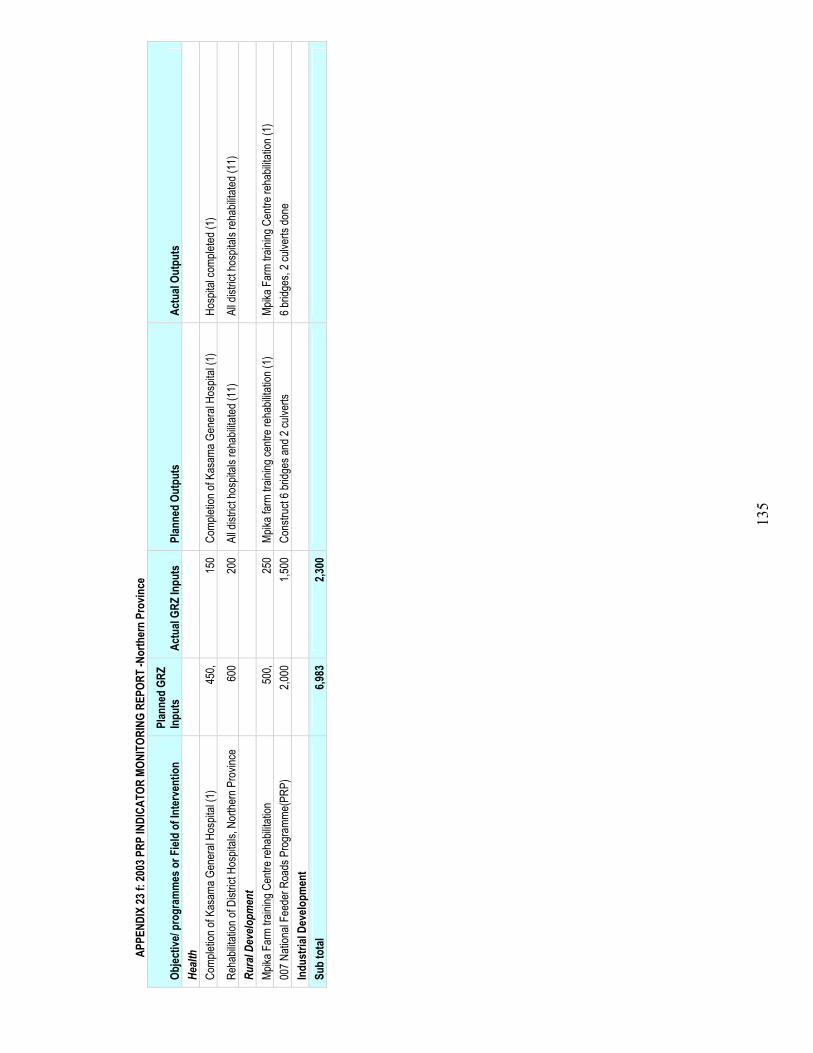
13
5
APPE
NDIX
23 f:
2003
PRP
INDI
CATO
R MO
NITO
RING
REP
ORT
-Nor
ther
n Pr
ovin
ce
Objec
tive/
prog
ram
mes
or F
ield
of In
terv
entio
n Pl
anne
d GR
Z In
puts
Ac
tual
GRZ
Inpu
ts
Plan
ned
Outp
uts
Actu
al Ou
tput
s He
alth
Comp
letion
of K
asam
a Gen
eral
Hosp
ital (1
) 45
0, 15
0 Co
mplet
ion of
Kas
ama G
ener
al Ho
spita
l (1)
Hosp
ital c
omple
ted (1
)
Reha
bilita
tion o
f Dist
rict H
ospit
als, N
orthe
rn P
rovin
ce
600
200
All d
istric
t hos
pitals
reha
bilita
ted (1
1)
All d
istric
t hos
pitals
reha
bilita
ted (1
1)
Rura
l Dev
elopm
ent
Mpika
Far
m tra
ining
Cen
tre re
habil
itatio
n 50
0, 25
0 Mp
ika fa
rm tr
aining
centr
e reh
abilit
ation
(1)
Mpika
Far
m tra
ining
Cen
tre re
habil
itatio
n (1)
00
7 Nati
onal
Feed
er R
oads
Pro
gram
me(P
RP)
2,000
1,5
00
Cons
truct
6 brid
ges a
nd 2
culve
rts
6 brid
ges,
2 culv
erts
done
In
dust
rial D
evelo
pmen
t
Su
b to
tal
6,983
2,3
00

13
6
APPE
NDIX
23 g
: 200
3 PRP
INDI
CATO
R MO
NITO
RING
REP
ORT-
Sout
hern
Pro
vince
Objec
tive/
prog
ram
mes
or F
ield
of In
terv
entio
n
Plan
ned
GRZ
Inpu
ts
Actu
al GR
Z In
puts
Pl
anne
d Ou
tput
s Ac
tual
Outp
uts
Educ
atio
n
Pr
ocur
emen
t of B
asic
and H
igh S
choo
l des
ks
1,333
30
0 12
6 des
ks pe
r 19 c
onsti
tuenc
ies
2400
desk
s pro
cure
d and
distr
ibuted
He
alth
Reha
bilita
tion o
f Livi
ngsto
ne G
ener
al Ho
spita
l 45
0 25
0 1 M
ale M
edica
l war
d com
pleted
, wor
k on 3
staff
hoste
ls in
prog
ress
, se
curity
fenc
e ten
dere
d 1 M
ale M
edica
l war
d com
pleted
, wor
k on 3
staff
ho
stels
in pr
ogre
ss, s
ecur
ity fe
nce t
ende
red
Reha
bilita
tion o
f Hos
pitals
-Sou
thern
Pro
vince
60
0 20
0
Mo
nze
Cons
tructi
on of
Inten
sive C
are u
nit (1
) Int
ensiv
e Car
e Unit
cons
tructe
d (1)
Liv
ingsto
ne
Purch
ase o
f eme
rgen
ce ge
nera
tor (1
) 1 g
ener
ator p
urch
ased
Ch
oma
Reha
b. Of
Map
anza
Hea
lth ce
ntre (
1)
Reha
b. Of
Map
anza
Hea
lth ce
ntre
Kazu
ngula
Co
nstru
ction
of 1
healt
h pos
t and
1 sta
ff hou
se
Cons
tructi
on of
1 he
alth p
ost a
nd 1
staff
hous
e Si
avon
ga
Cons
tructi
on of
healt
h pos
t (1)
Co
nstru
ction
of he
alth p
ost
Kalom
o
Co
nstru
ction
of 1
healt
h pos
t and
1 sta
ff hou
se
Cons
tructi
on of
1 he
alth p
ost a
nd 1
staff h
ouse
Si
nazo
ngwe
Co
nstru
ction
of 1
staff h
ouse
Co
nstru
ction
of 1
staff h
ouse
Si
avon
ga
Reha
bilita
tion o
f Hea
lth po
st (1
) He
alth p
ost r
ehab
ilitate
d Ru
ral D
evelo
pmen
t
Re
habil
itatio
n of L
ocal
Cour
ts 50
0
Reha
bilita
tion o
f 7 Lo
cal C
ourts
On
-goin
g
Sink
ing of
Bor
ehole
s 24
5 24
5 Si
nking
of 24
2 bor
ehole
s 9 b
oreh
oles s
unk
Resto
cking
of C
attle
2,000
1,0
00
Proc
urem
ent o
f 211
2 hea
ds of
cattle
for 1
1 dist
ricts-
192/d
istric
t by
Dece
mber
200
4
Irriga
tion D
evelo
pmen
t 2,0
00
1,000
Es
tablis
h sma
ll-sca
le irr
igatio
n sch
emes
in fo
ur di
strict
s On
e sch
eme e
stabli
shed
in M
an’gw
ato K
alomo
distr
ict
Re
habil
itatio
n of te
n dam
s Th
ree d
ams r
ehab
ilitate
d ;
Co
nstru
ction
of tw
o dam
s Ye
t to be
cons
tructe
d Ru
ral D
evelo
pmen
t
Na
tiona
l Fee
der R
oads
Pro
gram
me(P
RP)
2,000
1,5
00
Grad
ing of
497k
m of
feede
r roa
ds
497 k
m do
ne
Ve
getat
ion co
ntrol
on 46
7 km
of fee
der r
oads
46
7 km
done
Re
settl
emen
t Pro
gram
mes
Rese
ttleme
nt Sc
heme
s 50
0 50
0 De
marca
tion o
f 619
farm
s 24
5 plot
s dem
arca
ted
Dr
ill 10
bore
holes
in 7
sche
mes
8 bor
ehole
s drill
ed
Sub
tota
l 10
,428,
4,995
,

13
7
APPE
NDIX
23 i:
2003
PRP
INDI
CATO
R MO
NITO
RING
REP
ORT-
Wes
tern
Pro
vince
Objec
tive/
prog
ram
mes
or F
ield
of In
terv
entio
n Pl
anne
d GR
Z In
puts
Ac
tual
GRZ
Inpu
ts
Plan
ned
Outp
uts
Actu
al Ou
tput
s Ed
ucat
ion
Prov
ision
of S
choo
l Des
ks
1,333
20
0 14
00 m
etal d
esks
and 2
800 w
oode
n des
ks
proc
ured
14
00 m
etal d
esks
and 2
800 w
oode
n des
ks pr
ocur
ed
Healt
h
Reha
bilita
tion o
f dist
rict h
ospit
als
2,500
1,0
00
Reha
bilita
te se
wara
ge sy
stems
in al
l 5
hosp
itals
1 hos
pital
reha
bilita
ted
Deve
lopme
nt of
infr
600
400
1 Offic
e bloc
k pur
chas
ed an
d DCs
re
siden
ce re
habil
itated
1 O
ffice b
lock p
urch
ased
and D
Cs re
siden
ce
reha
bilita
ted
Rura
l Dev
elopm
ent
Reha
bilita
tion o
f loca
l cou
rts
500
0 Re
habil
itate
5 loc
al co
urts
5 loc
al co
urts
reha
bilita
ted
001 N
ation
al Fe
eder
Roa
ds P
rogr
am(P
RP)
300
0 Im
prov
e roa
d infr
astru
cture
in 7
distric
ts 37
km of
road
s reg
rave
lled
Indu
stria
l Dev
elopm
ent
001 B
ee ke
eping
(PRP
) 2,0
00
1,300
50
tonn
es of
liquid
hone
y No
t yet
done
Re
settl
emen
t Pro
gram
mes
001 R
esett
lemen
t Sch
emes
(PRP
) 30
0 0
Dema
rcatio
n of 6
00 pl
ots
250 p
lots d
emar
cated
00
1 Re
settle
ment(
PRP)
50
0 20
0 Dr
illing
of 26
bore
holes
16
bore
holes
drille
d
Alloc
ate 96
9 far
ms
478 f
arms
alloc
ated
Sub
tota
l 8,0
33
3,100
GR
AND
TOTA
L 64
,888,3
33,33
3 26
,305,0
00,00
0
1992
19
96
2000
/200
1 *2
002/
2003
Pe
rcen
t of
Hou
seho
lds w
ith
acce
ss to
safe
wat
er
48.3
46
.8
51.3
52
.0
Sour
ce: Z
ambi
a D
emog
raph
ic a
nd H
ealth
Sur
vey
Rep
ort,
2000
/200
1 *
The
Livi
ng C
ondi
tions
Mon
itorin
g Su
rvey
Rep
ort 2
002/
2003
, CSO
App
endi
x 24
b T
able
8: P
ropo
rtio
n of
hou
seho
lds a
cces
sing
cle
an w
ater
, 199
2 –
2002
/200
3


Republic of Zambia
Addendum to the Second PRSP Implementation Progress Report
2004
MINISTRY OF FINANCE AND NATIONAL PLANNING
PLANNING AND ECONOMIC MANAGEMENT DEPARTMENT
P.O. BOX 50062 LUSAKA
FEBRUARY 2005

2
OVERVIEW ................................................................................................................................................................... 3 WITH REGARD TO THE SOCIAL SECTORS OF HEALTH, EDUCATION, WATER AND SANITATION, TOTAL RELEASES, IN NOMINAL TERMS, IN 2004 INCREASED TO K1, 371.6 BILLION AND WERE ABOVE TARGET BY K69.1 BILLION. AS A SHARE OF THE TOTAL NATIONAL BUDGET, RELEASES TO THE SOCIAL SECTORS IN 2004 ROSE TO 25.9 PERCENT COMPARED TO 24.3 PERCENT IN 2003. IN TERMS OF SECTORAL BREAKDOWN, RELEASES TO THE EDUCATION SECTOR, WHICH CONSTITUTE THE BULK OF SOCIAL SECTOR SPENDING, INCREASED TO K841.9 BILLION OR 15.9 PERCENT OF THE TOTAL NATIONAL BUDGET FROM K686 BILLION OR 14.3 PERCENT OF TOTAL NATIONAL BUDGET IN 2003. RELEASES TOWARDS THE HEALTH SECTOR IN 2004 AMOUNTED TO K426.6 BILLION COMPARED TO K419 BILLION IN 2003. ............................................................................................................................................................................ 4
CHAPTER 1.................................................................................................................................................................... 5 MACROECONOMIC PERFORMANCE AND STRUCTURAL REFORMS......................................................... 5 TABLE 1.1: STATUS OF THE KEY PRSP MACROECONOMIC INDICTORS AS OF DECEMBER 2004 .... 5 ECONOMIC SECTORS.............................................................................................................................................. 11
3.1 AGRICULTURE.............................................................................................................................................. 11 3.2 TOURISM ...................................................................................................................................................... 12 3.3 MINING ........................................................................................................................................................ 12 IN 2004, A TOTAL OF K2.0 BILLION WAS RELEASED FOR THE IMPLEMENTATION OF THE GEMSTONE EXCHANGE, CREATION OF A REVOLVING FUND AND INTRODUCTION OF THE PLANT HIRE SCHEME AS OUTLINED BELOW................ 12
3.4 MANUFACTURING ..................................................................................................................................... 13 3.6 INFLASTRUCTURE .................................................................................................................................. 13
TABLE 15 TOTAL RELEASES IN NOMINAL TERMS TO THE SOCIAL SECTORS INCREASED TO K1, 371.6 BILLION AND WERE ABOVE TARGET FOR THE YEAR 2004 BY K69.1 BILLION. AS A SHARE OF THE TOTAL NATIONAL BUDGET, RELEASES TO THE SOCIAL SECTORS IN 2004 ROSE TO 25.9 PERCENT COMPARED TO 24.3 PERCENT IN 2003. IN TERMS OF SECTORAL BREAKDOWN, RELEASES TO THE EDUCATION SECTOR, WHICH CONSTITUTE THE BULK OF SOCIAL SECTOR SPENDING, INCREASED TO K841.9 BILLION OR 15.9 PERCENT OF THE TOTAL NATIONAL BUDGET FROM K686 BILLION OR 14.3 PERCENT OF TOTAL NATIONAL BUDGET IN 2003. RELEASES TOWARDS THE HEALTH SECTOR IN 2004 AMOUNTED TO K426.6 BILLION COMPARED TO K419 BILLION IN 2003. HOWEVER, AS A SHARE OF THE NATIONAL BUDGET, RELEASES TO THE HEALTH SECTOR FELL TO 8.1 PERCENT FROM 8.7 PERCENT IN 2003. (SEE TABLE BELOW) ............................... 16
TABLE 4.1..................................................................................................................................................................... 16 REGIONAL IMPLEMENTATION PROGRESS ..................................................................................................... 20
5.1 CENTRAL PROVINCE..................................................................................................................................... 20 5.2 COPPERBELT PROVINCE ............................................................................................................................... 20 5.3 EASTERN PROVINCE ..................................................................................................................................... 21 5.4 LUAPULA PROVINCE .................................................................................................................................... 21 5.7 NORTHERN PROVINCE.................................................................................................................................. 22 5.8 SOUTHERN PROVINCE .................................................................................................................................. 22 5.9 WESTERN PROVINCE .................................................................................................................................... 24 CHAPTER 6 .............................................................................................................................................................. 25 6.1 INSTITUTIONAL FRAMEWORK FOR PRSP IMPLEMENTATION, MONITORING AND EVALUATION ......................................................................................................................................................... 25

3
EXECUTIVE SUMMARY
Overview The addendum to the Second Poverty Reduction Strategy Paper (PRSP) Implementation Progress Report reviews status of the PRPs for the period July to December 2004. This additional review was necessitated by the need to comprehensively report on the PRSP implementation for the twelve months ended December 2004. The report notes improvement in funding to priority Poverty Reducing Programmes (PRP’s) from K212 billion in 2003 to K532.6 billion in 2004. Major improvements in public finance management were achieved in 2004, mainly due to the introduction of the Medium Term Expenditure Framework (MTEF) and Activity Based Budgeting (ABB). Disbursements to the key social sectors remarkably improved during the year compared to 2003. Efforts were made to strengthen stakeholder involvement in reviewing the implementation of Poverty Reduction Programmes (PRPs) in the last two quarters of 2004. In this regard, Sector Advisory Groups (SAGs), as part of the monitoring framework, played an important role in the review process. Monthly meetings in respective sectors and two national conferences were held during the year, one in each half. These conferences brought together stakeholders from all over the country to review progress in the implementation of the Poverty Reduction Programmes and to agree on future areas of intervention. The general SAG in the last quarter brought out issues such as the redefinition of PRPs and mechanisms of decongesting and the decentralization of PRPs funding, In this regard, the PRP are in three categories as follows: Programmes directly contributing towards poverty reduction (PRP1); Programmes indirectly contributing towards poverty reduction, (PRP2); and those remotely contributing towards poverty reduction as PRP3. Zambia’s economic performance in 2004 continued to register positive growth. Real GDP growth was 5.0 percent in 2004 compared to 5.1 percent in 2003 exceeding the PRSP target of 4
percent. The growth was attributed to improved output in the key sectors of agriculture, mining, manufacturing, construction and tourism. The domestic budget deficit was contained at less than 2 percent of GDP in 2004 from 5 percent in 2003. This led to a fall in the level of interest rates. Inflation rate was largely stable in 2004, marginally deteriorating from 17.2 percent in December 2003 to 17.5 percent in December 2004. The exchange rate remained generally stable. The improvements in fiscal performance paved way for reaching an agreement on a new Poverty Reduction and Growth Facility (PRGF) with the IMF in June 2004. The agreement between the IMF and Government restored credibility with the Cooperating Partners, thus allowing for increased external inflows. A sectoral analysis indicated that in the agriculture sector, a total of K162.3 billion was released against an allocation of K142.3 billion in 2004. The bulk of the allocation was for the Fertilizer Support Programme, crop marketing and Nasanga Farm Block. The Mining sector was funded a total of K2.0 billion in 2004 for the implementation of the gemstone exchange, creation of a revolving fund and introduction of the plant hire scheme. With regard to the Tourism sector, a total of K 15.3 billion was disbursed for key programmes such as rehabilitation of infrastructure in tourism areas, promotion of investment and tourism marketing. With respect to the Manufacturing sector, a total of K4.8 billion was released and utilised for the privatisation programme, small-scale enterprise development, export and investment promotion and the harmonisation of taxes to ‘level the playing field’ in the sector. In the Energy sector, one of the key programmes implemented was the rural electrification programmes. A total of K11.9 billion was released for PRPs. A total of K 105 billion was released for Road programmes such as the building of bridges and pontoons, rehabilitation of roads and institutional reforms.
4
With regard to the social sectors of Health, Education, Water and Sanitation, total releases, in nominal terms, in 2004 increased to K1, 371.6 billion and were above target by K69.1 billion. As a share of the total national budget, releases to the social sectors in 2004 rose to 25.9 percent compared to 24.3 percent in 2003. In terms of sectoral breakdown, releases to the Education sector, which constitute the bulk of social sector spending, increased to K841.9 billion or 15.9 percent of the total national budget from K686 billion or 14.3 percent of total national budget in 2003. Releases towards the health sector in 2004 amounted to K426.6 billion compared to K419 billion in 2003. Regional disbursements in 2004 amounted to K8.5 billion against an allocation of K10.4 billion. These funds were disbursed directly to Provincial Administration and not through the sector ministries. The funds were utilised mainly
on infrastructure development, land resettlement and industrial development. In terms of infrastructure development, this involved construction and rehabilitation of health posts, local courts, feeder roads, high schools, airports and aerodromes.
The key findings among others were that the quality of reports from sectors and provinces improved in terms of input, output and outcome during the review period. However, data collection, storage and analysis for planning purposes was still lacking in most sectors apart from the Health and Education sectors. Arising from this realisation, a needs assessment study was undertaken to identify training needs for SAGs and other stakeholders involved in the PRSP monitoring. Government also proposed to reduce the number of times SAG conferences are held to two in order to reduce costs and also allow SAGs time to prepare their reports.

5
CHAPTER 1
MACROECONOMIC PERFORMANCE AND STRUCTURAL REFORMS
1.1 Macroeconomic Performance and PRSP Indicators The overall macroeconomic goal in the PRSP is to attain a high and sustainable growth in Gross Domestic Product (GDP), low inflation rate and a sustainable external sector position. Zambia’s economic performance in the review period improved markedly. Real GDP growth
increased from 3.3 percent in 2002 to 5.1 percent and 5.0 percent in 2003 and 2004, respectively, exceeding the PRSP target of 4 percent. The growth was attributed to improved output in the key sectors of agriculture, mining, manufacturing, construction and tourism in 2004.
Table 1.1: Status of the Key PRSP Macroeconomic Indictors as of December 2004
Indicator Base year
Base Year status
Target Year Status as at end 2003
Status as at end Dec 2004
Remarks
Real GDP Growth
2001
4.9%
4.0%
2004
5.1 %
5.0
Achieved
Real Annual Per Capita GDP growth rate
2001 2.2 % 1.1 % 2004 2.6 % 2.5%* Achieved
Overall Fiscal Deficit
2% 2004 6.6% 1.7%* Not Achieved
Annual Rate of Inflation 2001 18.7 % 5 % 2004 17.2 % 17.5% Not Achieved Annual growth in exports 2001 7.5 % 7.5 % 2004 15 % 51 % Achieved Domestic Arrears reduced to zero (K, billion)
2001 O 2006 K 578.6 K577.4 Not likely to be achieved
HIPC Completion Point Reached 2003 Not Reached
To be assessed in 1st qtr 2005
Activity Based Budgeting adopted across government (no of ministries)
2001 7 All 2004 Done Done Achieved
Funding to all departments reflects yellow book
2001 Over 80 %
2004 88% Achieved
Overall Expenditure patterns reflect the priorities in the PRSP
Over 80 %
2004 50
99.9%
Achieved
Incidence of Poverty (Headcount %)
1998 73 % 65 %* 2004 67 67 Based on LCMS III
Rural Incidence of Poverty (Headcount %)
1998 83 % 75 % 2004 N/A 72.0 Based on LCMS III
Urban Incidence of Poverty (Headcount %)
1998 56 % 50 % 2004 N/A 28.0 Based on LCMS III
Poverty Gap (incidence and depth) 1998 0.55 0.4 2004 N/A 0.57 Based on LCMS III Gross Domestic Investment % of GDP
1998 14.9% 20 % 2004 27.1% 28.3% Achieved
Inflows of FDI 2001 US $72 m US$88m 2004 $170 m $270 Achieved (though mostly concentrated in mining)
Source: Ministry of Finance and National Planning • Poverty level should be understood in the context of new methodology employed by CSO therefore the 1998 LCMS figure is not Comparable with the 2002 LCMS figure. • * preliminary figures
The implementation of poverty reduction interventions, such as the input pack and out-grower schemes in agriculture as well as improvements to infrastructure like trunk roads and airports and increased private sector participation contributed to investment and
growth. In the mining sector, growth was largely attributed to the re-capitalisation of large mining companies and new investments which was complemented by increased export earnings arising from high global metal prices. As a result, overall investment as a percentage of GDP rose

6
to 28.3 percent from 27.1 percent in 2003, surpassing the PRSP target of 20 percent. During the period under review, the average annual inflation in 2004 fell to 18.0 percent from 21.5 percent in 2003. However, end year inflation marginally rose to 17.5 percent from 17.2 percent in 2003 and was 2.5 percentage points above the end year and PRSP target of 15 percent. This outturn mainly reflected a rise in the prices of non-cereal food products such as meat, which were adversely affected by the outbreak of livestock diseases in many parts of the country. In addition, frequent upward adjustments in fuel prices during the year also affected the overall inflation outturn. The firm fiscal stance undertaken in 2004 contributed to the favourable outturn in inflation in addition to stable cereal prices following a good harvest during the 2003/2004 agricultural season. Government managed to limit the budget deficit to 1.9 percent of GDP and domestic borrowing was within target of 2 percent of GDP. Consequently, the overall fiscal deficit fell to … percent from 6.3 percent in 2003. In the external sector, export receipts shot up by 51 percent to US $1,588 million from US $1,052 million in 2003, which was over and above the PRSP target of 7.5 percent. The increase in export receipts was attributed to expansion in domestic mineral production as well as the high world metal prices and strong growth in non-metal exports. Similarly, imports increased by 32 percent to US $1, 845 million in 2004. However, export growth out striped import growth thereby improving the trade balance by US $ 12 million to US $697 million from US $699 million in 2003. Never the less, high interest payments on external debt in the services account resulted into the current account deficit (after grants) narrowing marginally to 5 percent of GDP in 2004 from 6 percent in 2003.
1.2 Progress on Implementation of PRSP Policy Actions and Structural Reforms The PRSP identified many structural/policy actions required to facilitate growth and poverty reduction. The implementation of the structural/policy actions was generally on track in
2004. The focus of these policy action were to improve public expenditure management, addressing the problems of the state owned non-bank financial institutions and removing bottle necks to private sector development. In 2004, Government approved the Public Expenditure Management and Financial Accountability (PEMFA) Action Plan, which contains a broad and detailed programme of reforms to improve public expenditure management. In this regard, Government developed an Interim Establishment Register, cleaned up the payroll and implemented a new Payroll Management Establishment Control (PMEC) system. The focus of the system is to improve payroll management, provide better data and control mechanisms, accuracy of the payroll and tighter budget control and aligning the size of the civil service with resource availability. In addition, Public Service Commission Regulations were revised, new Terms and Conditions of Service developed and engagement of new staff suspended. In the financial sector, Government approved the Financial Sector Development Plan (FSDP) in 2004. The vision of the plan is to develop a stable, sound and market based financial system that will support efficient mobilization and allocation of resources necessary for economic diversification, sustainable growth and poverty reduction. A team to spearhead the implementation of the plan was appointed. Government also began restructuring the two state owned non-bank financial institutions.
Government working with the Private Sector and other stakeholders prepared and launched a comprehensive Private Sector Development Initiative (PSDI) Action Plan aimed at improving the environment for private sector growth in June 2004. By the end of 2004, amendments to the investment and export processing zone acts were submitted to the Cabinet committee on legislation and a decision was being awaited. Furthermore, a document to be used as a basis for sourcing donor support to the PSD was finalised.
1.4 Macroeconomic framework and the Medium Term Outlook

7
The macroeconomic framework in the PRSP/TNDP was revised. The revision in the macroeconomic framework was largely on account of outturns in 2003 and 2004. The revised macroeconomic targets for 2005-2007 are to: achieve GDP growth rates of 5.0 percent in 2005, 2006 and 2007; bring down end-year inflation to 15 percent in 2005, 10 percent in 2006 and 5.0 percent in 2007; reduce domestic borrowing to 1.6 percent of GDP in 2005, 1.3 percent in 2006 and 0.7 percent in 2007; improve the country’s external sector’s viability by increasing the official Gross International Reserves (GIR) to 1.5 months of import cover in 2005, 1.7 months in 2006 and 1.9 months in 2007 and remain current with foreign debt service payments. The growth targets are premised on favourable performance in the key sectors of agriculture, mining, manufacturing and tourism. In agriculture, Government’s focus will be to improve productivity of the sector through well-targeted interventions such as the Fertilizer Support Programme (FSP). In the mining and quarrying sector, higher growth in 2005 is anticipated largely due to increased production of
copper and cobalt, mainly due to the coming on stream of Kansanshi and Lumwana in North-western province. In the tourism sector, impetus for continued growth is expected to come from the benefits of the economic diversification programmes being undertaken by Government. Manufacturing, growth is premised on the higher domestic demand from the mining, tourism and agriculture sectors. In order to further aid manufacturing growth, initiatives in the area of private sector development will continue to be the major focus.
Fiscal policy in the medium term will be key to preserving macroeconomic stability. Domestic revenue is expected to average 18.3 percent of GDP, personnel emoluments will be maintained at 7.9 percent of GDP over the period 2005-2007 while domestic financing is expected to decline to 0.7 percent of GDP by 2007. In the external sector, the strategy is to restore a sustainable external debt position by reaching the Completion Point under the HIPC initiative and reducing the current account deficit to a sustainable level.
Table 1.2: Key Macroeconomic Targets: 2003-2007
2003 2004 2005 2006 2007 Actual Prelim Proj. Proj. Proj. Real GDP Growth Rate 5.1 5.0 5.0 5.0 5.0 Inflation Rate (end period) 17.2 17.5 15.0 10.0 5.0 Nominal GDP (K' billions) 20,481 25,814 31,212 35,812 39,865 Current Account Deficit Incl. grants (% of GDP) (7.5) (5.7) (3.1) (3.3) (3.6) Domestic Borrowing as % of GDP (cash basis) 5.1 0.8 1.6 1.2 0.6 GIR months of Import Cover 1.3 1.2 1.3 1.5 1.7

8
CHAPTER 2Budget Execution and Management 2.1 Overview Preliminary data indicate that domestic revenue was below target by 2.1 percent, total expenditures were above the ceiling by 0.4 percent and funding to priority Poverty reduction programmes improved in 2004. In addition, inflows on programme grants were above the estimate of K143.1 billion amounting to K234.7 billion. 2.2 Revenue collection Government collected a total of K4, 678.3 billion in domestic revenues against a budget estimate of K4, 782.7 billion. This was marginally below the target by 2 percent. Of this amount, tax revenue stood at K4, 551.5 billion and was above the target of K4, 536.9 billion by K14.7 billion. The Government also collected K86.1 billion as non-tax revenue, which was 35 percent lower than projected. In addition to domestic revenues, foreign in flows amounted to K234.7 billion against the target of K163.0 billion. This favourable disbursement from Cooperating Partners was in response to the firm fiscal stance undertaken by Government in line with PEMFAR. 2.3 Expenditures Total expenditures were above the ceiling by 0.4 percent and that funding to priority Poverty reduction programmes also improved in 2004. Out of the total domestic expenditure, a total of 2023.7 billion was spent on wages and salaries and was above the target of K2, 018 .4 billion by K5.3 billion. Funding to PRPs was K532.6 billion. Other expenditures
included recurrent departmental charges (K844.5 billion), transfers and pensions (K422.6 billion) 2.4 Wages and Salaries Expenditure on wages and salaries as at end December 2004 stood at K2,023.7 billion. This was K5.3 billion or 0.3 percent above the annual ceiling of K2,018.4 billion and represented 7.9 percent of GDP. The increase was mainly attributed to the higher than expected payments on employer’s contribution to workers social security schemes. In addition, there was a higher than programmed payment on wages and salaries to Ministries of Health and Education. 2.5 Recurrent Departmental Charges Recurrent Departmental Charges (RDC’s) stood at K844.5 billion. This was K158.9 billion or 23.2 percent above target. The over expenditure was mainly due to higher than programmed expenditure arising from settlement of court cases and clearance of both housing and non housing domestic arrears. The general increase in Government operations, including payments to commercial utilities, operational expenses of the defence wings and Presidential Affairs also contributed to this outturn. 2.6 Transfers and Pensions A total sum of K422.6 billion was released for transfers and pensions, which was above the end year ceiling by 0.8 percent. Out of the amount released, K27.1 billion

9
went to the Public Service Pension Fund to reduce on the outstanding debt. 2.7 Debt service With regard to debt service, Government spent K1, 373.7 billion on external and domestic interest payment compared to a projection of K1, 469.2 billion. External debt payments at K637.2 billion were above projection on account of payments carried over from 2003. Domestic debt interest payments at K734.0 billion were lower than the target of K927.5 billion by 21 percent due to lower interest rates. 2.8 Capital Expenditure A total of K570.5 billion was released towards capital programmes and this was below the target of K601.4 billion by only 5.1 percent. Of the amount released, K112.3 billion went to the Road Fund as fuel levy collections. The higher collections were on account of higher fuel prices. It remains Government’s commitment to release all the fuel levy collections in full. The release of K112.3 billion in 2004 was 49.8 percent above the budget estimate of K75 billion. All of the funds released to the former National Roads Board were for road rehabilitation. In addition, a total of K8.2 billion was released as counterpart funds towards donor financed infrastructure projects. 2.9 Poverty Reduction Programmes
(PRPs)
Of the total budget of K532.6 billion for poverty reducing programmes, 100 percent
was released compared to only 24 percent achieved in 2002 and 50 percent in 2003. Of the amount released for poverty reducing programmes, K96.7 billion was for the fertiliser support programme to provide subsidised inputs to farmers. K47.2 billion went to the procurement of maize from small-scale farmers to provide them with incomes. A further K29 billion was funded towards the Food Security Pack programme for vulnerable but viable farmers. All these programmes empowered the rural population by creating wealth and distancing them from poverty. In addition, other important programmes that received funds included the following: the preparation of agricultural land for farm blocks; promotion of out-grower schemes; control of livestock diseases; livestock re-stocking; basic education; Roll Back Malaria; child survival and health; procurement of kits for essential drugs and supply of clean and safe water. 2.10 Financing of Deficit The outturn in revenues of K4,678.6 billion and expenditure of K5,298 billion resulted in overall budget deficit of K547 billion or 1.9 percent of GDP. This deficit was financed through Borrowing, however, was within the end year target of 2 percent of GDP and was lower than the 2003 level by K550.7 billion. The deficit was financed from the banking and the non-banking sectors.

10
Table 2.1: Central Government Operations, 2004 2004 Budget Outturn Variance (K' Million) (K' Million) (K' Million) REVENUE AND GRANTS 6,209,395 5,996,884 (212,511) REVENUE 4,782,735 4,678,639 (104,096)
Tax Revenue 4,536,881 4,551,872 14,991 Income Tax 2,047,881 2,037,888 (9,993)
Company Income Tax 382,600 331,930 (50,670) Personal Income Tax 1,657,698 1,701,471 43,773
PAYE 1,428,700 1,482,604 53,904 O/w Medical Levy 3,500 5,719 2,219
Withholding Tax 228,998 213,147 (15,851) Mineral Royalty 4,083 4,487 404
Domestic Goods and Services 1,241,600 1,060,549 (181,051) Excise duties 627,900 607,164 (20,736)
O/w fuel levy 75,000 121,533 46,533 Domestic VAT 613,700 453,385 (160,315)
Trade Taxes 1,247,400 1,453,436 206,036 Import VAT 755,400 909,011 153,611 Import Tariffs 492,000 544,425 52,425
Non-Tax Revenue 133,000 86,119 (46,881) Miscellaneous Revenue 36,000 26,198 (9,802) Exceptional Revenue 76,854 14,449 (62,405)
GRANTS 1,426,660 1,318,245 (108,415) Program 143,100 234,659 91,559 Project* 1,283,560 1,083,586 199,974
TOTAL EXPENDITURES (excl. Project Financing) 5,276,390 5,298,508 22,118 CURRENT EXPENDITURES 4,674,990 4,728,025 53,035 Wages and Salaries 2,018,400 2,023,746 5,346
Housing allowance 86,400 86,400 Public Service Retrenchment 33,000 20,058 (12,942) Recurrent Departmental Charges (RDCs) 685,600 844,515 158,915
Arrears clearance 76,700 84,265 7,565 Housing allowance 26,700 30,364 3,664 Non-housing allowance 50,000 53,901 3,901
Elections & constitutional review 26,000 19,228 (6,772) Award and Compensations (Court decision) 20,000 35,089 15,089 Presidential Affairs 18,000 22,968 4,968 Other RDCs 544,900 682,965 138,065
Transfers and Pensions 419,400 422,589 3,189 Settlement statutory arrears (pensions) 30,000 27,086 (2,914) Other 389,400 395,502 6,102
Domestic Interest 927,460 734,312 (193,148) External Debt Interest 216,300 273,671 57,371 Other current expenditures 395,830 415,973 20,143
Financial restructuring 119,630 109,368 (10,262) ZRA 118,000 118,000 Maize Reserve in Rotating Fund (HIPC- PRP) 47,200 47,200 Input Pack (Food Security) + Fertiliser Price Support 99,000 125,700 26,700 Constitutional posts 12,000 15,705 3,705
Contingency 12,000 13,219 1,219 - CAPITAL EXPENDITURES (excl. Project Financing) 601,400 570,483 (30,917)
Of which: HIPC-PRPs 366,300 343,724 (22,576) Counterpart PRPs 40,000 7,972 (32,028) GRZ Road Projects 80,000 20,040 (59,960) Fuel levy 75,000 112,337 37,337 Ordinary Capital 61,100 76,719 15,619 REF 9,000 9,013 13 Land Development Fund 6,000 - (6,000) Counterpart (Ordinary) 4,000 8,651 4,651
FOREIGN FINANCED* 2,684,600 1,094,769 (1,589,831) Of which HIPC PRPs 1,494,431 1,799 (1,492,632)
Source: Ministry of Finance and National Planning
Note: Project grants and loans are based on estimated inflows from donors but do not pass through Government accounts
11
CHAPTER 3
SECTOR IMPLEMENTATION Economic Sectors 3.1 Agriculture In the agriculture sector, a total of K142.3 billion was allocated for poverty reduction programmes in 2004. The bulk of the allocation was for the Fertilizer Support Programme (49.2 percent), crop marketing (33.2 percent) and Nasanga Farm Block had 9.1 percent. The remaining 8.5 percent was for other investment programmes. During the first half of 2004, K79.6 billion or 56 percent of the total PRP budget allocation was released of which maize marketing programme and the Input Support programme together received 96 percent of the amount. In the second half a further K82.7 billion was released bringing the total annual release to K162.3 billion or 114 percent of the total PRP allocation to the agricultural sector.
3.1.1 Targeted Support System for Food Security
By end December, 2004 a total sum of K96.7 billion was released against an allocation of K70 billion. The funds were utilised for the purchase of 60,000 mt and 3,000 mt of fertiliser and seed, of fertiliser and 2,400 mt of seed in the previous season. A total of 150,000 households received inputs in 2004 compared to 120,000 households in the previous season.
3.1.2 Purchase and storage of the national food reserves
A total of K47.2 billion (100 percent) was released and utilised for the purchase of 61,320 mt of maize from 38 districts. In Luapula province, cassava was
purchased while in Mongu and Kasama, rice was purchased.
3.1.3 Out-grower Schemes The PRSP 2002-2004 targeted to support 126,000 small-scale farmers in a period of three years through out-grower schemes. In 2004, a total of K1.9 billion was allocated and 100 percent of the amount was released by the end of the year. The funds were used for input disbursements and extension services on a total hectarage of 5,500 benefiting 7,800 farmers by the end of the year.
3.1.4 Irrigation Development Programme
With regard to the Irrigation Development Programme, a total of K615 million was allocated out of which K510 million was released by the end of the year.
3.1.5 Land Development Programme Out of the nine farm blocks identified for development, government’s focused on the development of Nansanga farm block, Kalumwange farm block and Luena Sugar Plantation in 2004. The total allocation for these farm blocks in 2004 was K14 billion for infrastructure development, electrification and environmental impact surveys. By the end of 2004, K14 billion or 100 percent of the farm block allocation was released towards the commercialisation of the agriculture land in the above mentioned farm block. However, due to the outbreak of foot and mouth disease in some parts of the country, K3.8 billion was re allocated to the disease control programme. 3.1.6 Seed Multiplication A total of K1.5 billion was allocated to the seed multiplication research programme. The full amount was released and utilised in 11 districts
12
for purchase of chemicals, fertilizer and seed production research in various research stations. 3.1.7 Animal Disease Control
The Animal Disease Control Programme was allocated K1 billion to preserve the current population of livestock which was released. In addition, K3.8 billion was varied from farm block releases and allocated to this programmes to control the foot and mouth disease. 3.1.8 Aquaculture and Fisheries
Development
In 2004, an amount of K1.7 billion was allocated for aquaculture and fisheries development. Government undertook the following activities: the opening of 36 sites in all the nine provinces; the construction of 720 fish ponds; and the training of 1,300 farmers in fish seed production. The budget allocation was released in full by end December 2004.
3.2 Tourism A total of K 15.3 billion was allocated which was released 100 percent for major programmes like infrastructure development in tourism Areas, promotion of investment in the tourism Sector and the tourism marketing and promotion. Other activities undertaken included the following:
• Project preparatory work in Livingstone for the solid waste management system;
• Tourist access roads; • Capacity building for the Livingstone
City; • Building of the South-West Regional
Tourism office; • officially launch the tourism investors’
forum for attracting tourism investors to Livingston and the Kafue National Park;
• Inventory of existing and potential tourism products;
• The collection of Preliminary data/information from other countries on the Tourism Satellite Accounting (TSA); and
• The preparation of the National Tourism Master Development Plan.
3.3 Mining
In 2004, a total of K2.0 billion was released for the implementation of the gemstone exchange, creation of a revolving fund and introduction of the plant hire scheme as outlined below.
3.3.1 Establishment of the Gemstone Exchange
The Zambia Gemstone Exchange Limited was registered and a Board of Directors recommended by stakeholders. A Cabinet Memorandum was prepared on the same was prepared. In addition, the rules and regulations of the Gem Exchange were drawn up in consultation with the Lusaka Stock Exchange (LuSE) and the Securities and Exchange Commission (SEC). 3.3.2 Creation of a Revolving Fund A total of K500 million was budgeted and released for the consultancy on the creation of the revolving fund. 3.3.3 Introduction of a Plant Hire Scheme
The complete set of mining equipment would require K2.5 billion. For the planned four schemes to operate effectively, Government would require a total of K50 billion. Therefore, the possibility of varying the funds to the Revolving Fund was being considered to increase the capital base. The amount of K500 million released for the introduction of the Plant Hire Scheme was inadequate for a complete set of mining equipment for hire. T 3.3.4 Other Developments
The mining sector continued to show higher levels of activity resulting from increased private sector investment. The number of licences issued continued to indicate increased interest in the mining sector. The following licences were issued during the year under review:
Twenty seven for small-scale mining,
Twenty seven for prospecting permits, and

13
Fifty eight Gemstone Licences. The construction of a new power line to service Kansanshi and Lumwana mines in the North-Western Province progressed according to schedule during the year. By December 2004, the construction of the new power line was completed and the substation buildings were commissioned.
3.4 Manufacturing During 2004, Government allocated a total of K4.8 billion for PRPs in the sector. These funds were released and utilised for the following: privatisation, small-scale enterprise, export and investment promotion and the harmonisation of taxes to ‘level the playing field’ in the sector. 3.4.1 Investment promotion
During the year, Government exhibited at two Agricultural and commercial shows and undertook two investment promotion trips to South Africa and Germany. 3.4.2 Trade and Export Promotion During the year under review the major activities undertaken included training and sensitisation workshops, acquisition of equipment, provision of marketing support services, monitoring and networking and a consultancy on dimensions of stone evaluation. In addition Government purchased four nut crackers for women groups in Western province. 3.5 ENERGY
Status of Programme Implementation During the year under review, the bulk of the projects implemented under Poverty Reduction Programme were rural electrification projects. A total allocation of K11.96 billion for PRPs in the 2004 budget was released for the following major programmes:
3.5.1 Rural Electrification Programme In 2004 the rural electrification programme was undertaken in farm block development areas as well as other rural areas. 3.5.2 Rural Electrification Master Plan By the end of the year, the Rural Electrification Master Plan was completed to be implemented by the Rural Electrification Authority.
3.5.3 Nansanga Farm Block Electrification
project The electrification of Nansanga farm block commenced from part of the K9 billion funding.
3.6 INFLASTRUCTURE 3.6.1 Road Sub-sector
In 2004, Government allocated K 105 billion to the road sub-sector. Feasibility studies was allocated K 6 billion, poverty reduction programmes K76.3 billion, Bridges and pontoons K 7.7 billion and rehabilitation of roads K 9.4 billion. Periodic maintenance was allocated K 5.7 billion and institutional transformation into the Roads Development Agency K 1.5 billion. As at end December 2004, a total of K 4.9 billion was released towards feasibility studies, poverty reduction programmes K86.5 billion, rehabilitation and periodic maintenance of roads K 22.2 billion and institutional transformation into the Roads Development Agency received K1.8 billion. Further, a total sum of K115.8 billion was disbursed for periodic maintenance under National Roads Board. The roads covered included the Chingola – Solwezi and Petauke – Katete. The major Government funded projects included the Mutanda-Kasempa road and the Kasama-Luwingu road while Cooperating Partners funded rehabilitation works on the Livingstone-Sesheke and the Lusaka-Mongu road phase 1 among others (see table 3.1).

14
Table 3.1: Major Road Projects undertaken in 2004. Project Distance
(Km) Work description Status Financing
Livingstone-Sesheke road
202 Rehabilitation Project completed KFW
Lusaka-Mongu road phase 1
167 Rehabilitation On-going. 60 Km rehabilitated DANNIDA
Mongu-Kalabo road 74 Rehabilitation Project ongoing Kuwait/BADEA/OPEC
Makeni-Kafue road 50 Maintenance On-going. 44 Km paving, 30 Km crack sealing, 15 Km reconstruction
done by third quarter of 2004.
IDA
Lusaka-Kabwe road 57 Maintenance On-going. 20 Km edge repair and 10 Km overlay repair done by third
quarter 2004
IDA
Chingola-Kasumbalesa road
45 Construction Tender documents completed IDA
Chipata-Lundazi road 179 Maintenance On-going. 100 Km’s of vegetation control, 80 Km’s of edge repairs and
pothole patching done
GRZ
Nyimba-Petauke-Sinda-Katate road
173 Maintenance On-going. 90 km’s vegetation control, 80 km’s edge repairs and pothole
patching and 29 kilometers of sealing was done.
Road Fund
Chingola-Solwezi road.
132 Emergency repair On-going. 66.7 kilometer shoulder reconstruction, 26 side reshaping and
132 kilometers of pothole patching was undertaken.
Road Fund
Kasama-Luwingu 150 Rehabilitation 60 km’s earth works, 30 km’s pavement, 45 km’s surface dressing
GRZ
Mutanda-Kasempa 147 Rehabilitation Substantially complete GRZ Source: Ministry of Works and Supply Government continued with the implementation of the 2002 transport policy through the establishment of the Road Development Agency (RDA), Road Transport and Safety Agency (RTSA) and National Road Fund Agency (NRFA). Boards of Directors for the RDA, NRFA and RTSA were appointed. In order to expand, rehabilitate and maintain paved, unpaved and feeder roads, Government in
collaboration with Cooperating Partners, continued to implement the Road Sector Investment Programme (ROADSIP). The first phase of ROADSIP officially came to an end in 2003 and recorded some achievements as outlined in table 4.5. The second phase of ROADSIP which was renamed the Road Rehabilitation and Maintenance Programme (RRMP) was expected to start after June 2004.

15
Table 3.2: Status of Implementation for ROADSIP Phase I
Source: National Roads Board 2004 3.6.2 National Road Safety Action Plan
Government continued to implement the National Road Safety Action Plan (NRSAP). In order to reduce the number of accidents, the minimum age requirement for Passenger Service Vehicle (PSV) drivers was increased from 18 to 21 years and a re-training programme was introduced. A total of 10 motorcycles were bought for road patrols and mounting of speed traps was stepped up. Breathalysers were also bought to help in conducting on the spot alcohol tests for drivers.
3.6.3 BUILDINGS Government disbursed K 28 billion to undertake building programmes in 2004. Construction of support infrastructure at Chirundu was still under way by December 2004. In addition, building
works continued at the New Government Complex. 3.6.4 New Chirundu Bridge Infrastructure In 2004, a total sum of K20.5 billion was released for infrastructure at the new Chirundu Bridge from a budget provision of K35.9 billion. These included six access roads to the bridge, the platform and the water and sanitation systems. Other projects were security wall fence and guard houses, 50 houses, Police station, passenger control building, freight terminal and street lights. 3.6.5 New Government Complex In 2004 K1.1 billion was released out of an allocation of 2.8 billion for telephone installations, power sub station and generator at the building complex.
Name Of Project Financier Status 1 Lusaka Road Phase II JICA/GRZ
Counterpart Completed in 2004
2 Livingstone-Sesheke Road KfW-Germany/GRZ Counterpart
Completed in 2004
3 Katimamulilo Bridge KfW-Germany/GRZ Counterpart
Complete in 2004
4 Kabwe-Kapirimposhi Road EU/GRZ Counterpart
Completed in 2004
5 Mporokoso-Bulaya GRZ 80% complete 6 Periodic maintenance of
roads World Bank/GRZ Counterpart
75 % complete
7 Community roads/capacity building
World Bank 75 % complete
8 Mongu-Kalabo Road Badea /Kuwait/OPEC Fund/GRZ Counterpart
60% complete
9 Capacity Building & Institutional development
NORAD 60% complete
10 Lusaka-Mongu Road Danida/GRZ Counterpart
15% complete

16
CHAPTER 4
4.0 SOCIAL SECTORS
Total releases in nominal terms to the social sectors increased to K1, 371.6 billion and were above target for the year 2004 by K69.1 billion. As a share of the total national budget, releases to the social sectors in 2004 rose to 25.9 percent compared to 24.3 percent in 2003. In terms of sectoral breakdown, releases to the education sector, which constitute the bulk of social sector spending, increased to K841.9
billion or 15.9 percent of the total national budget from K686 billion or 14.3 percent of total national budget in 2003. Releases towards the health sector in 2004 amounted to K426.6 billion compared to K419 billion in 2003. However, as a share of the national budget, releases to the health sector fell to 8.1 percent from 8.7 percent in 2003. (see table below)
Table 4.1
Allocations and Releases to the Social sectors `as % of Total National Budget
2003 2004
Sector Budget Releases Budget Releases Education 13.2 14.3 15.5 15.9 Health 9.9 8.7 6.9 8.1 Water and Sanitation 0.6 0.3 0.7 0.4 Other* 0.4 0.9 1.6 1.5 Total 24.1 24.3 24.7 25.9 As % of GDP
2003 2004
Sector Budget Releases Budget Releases Education 2.6 3.4 3.2 3.3 Health 1.9 2.1 1.4 1.7 Water and Sanitation 0.1 0.1 0.1 0.1 Other* 0.1 0.2 0.3 0.3 Total 4.7 5.7 5.1 5.3 Total National Budget 3,974.9 4,789.1 5,276.4 5,298.5
GDP 20,305.2 20,305.2 25,578.0 25,704.0 Source: Ministry of Finance and National Planning Other* comprises social safety net and disaster relief management sectors
4.1 Education Funding to the education sector improved in 2004 rising to K795 billion from K686 billion while as a percentage of the total domestic budget it increased to 24.5 percent in 2004 from 19.2 percent in 2003 (See Appendix I). With regard to enrolment in 2004, the figures indicate that more pupils had access to basic education during the period. A total of 2,522,378
were enrolled during the period indicating an increase of 9.3 percent. Out of this number 1,302,167 were boys and 1,220,211 were girls. This increase was partly due to the Free Basic Education Policy which was introduced in 2002. The policy abolished all user fees at basic education level and made school uniforms not compulsory and other programmes introduced by the ministry such as the programme for the

17
Advancement of Girls Education (PAGE), Bursary schemes and introduction of community schools. Further, the pregnancy re-admission policy enhanced the enrolment rates. In 2003, the number of re-admissions were 926, against 3,509 recorded pregnancies in the previous year. Having identified the gaps in the policy, the Re- entry Policy guidelines have been reviewed for wider dissemination during the period under review. 4.1.1 Gross enrolment ratio In 2004, the Gross Enrolment Ratio (GER) at basic school rose by 5.4 percentage points to 93.1 percent from 87.7 percent in 2003. The increase in the GER was as a result of increased pupil enrolment. At Provincial level, there were disparities in terms of GER, which ranged from 73.44 in Eastern province to 106.2 in Northern Province. The gross enrolment ratio at high school level increased to 16.5 in 2004 from 13.9 in 2003, showing an increase of 2.6. Gross enrolment ratio for males increased by 3.6 percentage points compared to 1.6 for females between the two years. The increase in GER was due to increased pupil enrolment. Enrolment at university level increased by 15 percent in 2004 to11,561, 561 from 10,092 in 2003. At the University of Zambia (UNZA), students enrolment increased to 8,471 compared to 7,558 in 2003 and while at the Copperbelt University (CBU), enrolment increased to 3,090 students from 2,534 in the previous year. The increase in student enrolment was attributed to the rise in self-sponsored students and Government policy to increase access to university education. 4.1.2 Pupil Teacher ratio The number of basic school teachers increased by 5.2 percent to 40,915 from 38,891 in 2003.This increase was due to the replacement of some retired and deceased teachers. However, the number of teachers fell below the required levels, as more teachers could not be recruited due to budgetary constraints. Despite the non-recruitment of teachers due to budget constraints
in 2004, Government replaced some retired and deceased teachers; this resulted in the marginal increase in the number of teachers. In order to retain teachers especially in rural areas, Government continued to pay rural hardship and housing allowances to deserving teachers serving in the rural areas. Furthermore, the Netherlands Government offered US $10 Million to Government to settle the retirement and repatriation allowances. As a result of this payment, more teachers are expected to be recruited in 2005. This move was to pave way for recruitment of new teachers as the retired teachers were to be removed from the payroll. 4.1.3 Bursary Provision Government continued to support Orphans and Vulnerable Children (OVCs) PRP budget amounted to K3 billion. A total of 4,476 children in 41 districts received K500,038 for grades 8 - 12 and K67,000 for grades 1 – 7, each to cover school fees, examination fees (at grade 9 and 12), books, uniforms transport in some cases etc. A total of K3 billion was release and has been disbursed. A further K765 million and K327 million was disbursed to support another 15,300 orphans and vulnerable children from the pool support and CAMFED respectively. 4.1.4 HIV / AIDS Awareness at Work place A total of K1.5 billion was budgeted for and released to the Education sector for the HIV / AIDS awareness at work place and was disbursed to the Provincial education Offices for the various activities under the programme.
4.2 HEALTH During the review period, there were notable improvements in the health sector. This was reflected in improvements in key basic health care delivery indicators such as health centre outpatient per capital attendance and by the general decrease in the incidence of the major diseases such as malaria, non-pneumonia respiratory infections and diarrhoea. The drug situation generally improved with 0.79 kits per 1,000 patients opened in 2004 compared to 0.73

18
kits opened per 1,000 patients in 2003. Further, the percentage coverage of fully immunized children under one year improved from 74 percent in 2003 to 77 percent in 2004. Despite these improvements health care delivery continued to be constrained by lack of sufficient human, material and financial resources. In 2004, Government financing to the health sector in nominal terms increased to K426 billion from K419 billion in 2003. Funding in 2004 was above the budget allocation. However, as a percent of the total national budget, funding to the health sector declined to 8.1 percent in 2004 from 8.7 percent in 2003. Similarly, as a percentage of the discretionary budget, funding to the health sector dropped to 11.5 percent from 12 percent in 2003. The following key Programmes were implemented in 2004:-
i) Roll back malaria ii) Child Survival / Child Health iii) Essential drugs Kits iv) HIV / AIDS v) Equity of access to healthy care vi) Sexual and Reproductive health vii) Rehabilitation of health facilities viii) Rehabilitation of training
Institutions; and (i) Rural Housing for medical staff.
4.2.1 Malaria In 2004, the scaling up of the action plan for malaria was implemented through the provision of Co-artem to all the 72 districts and the training of frontline health workers in the use of Co-artem in all provinces. In addition, about 1,500,000 Insecticide Treated Nets were distributed throughout the country. Further, in the 2004/2005 transmission season the indoor residual spraying project has been scaled to cover eight districts from the initial five districts (Kitwe, Ndola, Kabwe, Lusaka and Livingstone) including Mufulira, Kalulushi and Kazungula district covering 324,137 people out a total population of 2,783,569.The scaling up programme has steadily increased the number of people living with HIV/AIDS on the ART Programme from 4,000 recorded in 2003 to 15,500 in 2004.
4.2.2 HIV / AIDS The scaling up programme has steadily increased the number of people living with HIV/AIDS on Anti-Retroviral Therapy (ART) programme from 4,000 recorded in 2003 to 15,500 in 2004. The programme has been supported with funds received from the PRP component of K6.4 billion, which represent 108 percent of the budgeted K5.9 billion. Other funds came from the Global Fund and cooperating partners and other initiatives such as PEPFAR. The programme continued to build capacity in human resource to handle and administer ARVs in the new established sites for the provision of ART. In this regard a total of 269 medical personnel, such as doctors, medical licentiates, clinical officers and nurses, were trained in management of opportunistic infections and administration of ART. This led to an increase in the provision of ART to 15,000 patients by October 2004 from 4,000 persons in 2003. In addition levels of awareness of ART also improved with about 500 women receiving counselling each month countrywide. Similarly the number of centres providing ART in 2004 rose from 53 in 2003 to 84 in 2004.
4.2.3 Child Survival / Child Health In 2004, a total of K4.7 billion was released towards the purchase of vaccines for the routine EPI programmes such as promotion of AFP surveillance, conducting nutrition surveillance, sensitisation on exclusive breast feeding, making follow ups on under weight children on a weekly basis and carry out immunization exercise. The funds were also used to strengthen EPI training in Health institutions. Immunisation coverage in 2004 stood at 79 percent.
4.2.4 Essential drugs Kits A total of K21.9 billion was spent on the purchase of essential drugs. In addition K2.8 billion was also received from PRP funds which were used to purchase first line drugs for all public health institutions. The situation of stocks of drugs in Health Centres was satisfactory throughout the year.
19
4.2.5 Sexual and Reproductive Health In 2004, a total of K1.2 billion was released towards the programme for updating the reproductive health policy, adolescent health and prevention of mother to child transmission of HIV / AIDS. Under the Safe motherhood programme, equipment and drug supplies for essential obstetric for all districts were procured. Seven ambulances were bought one for each district, radio equipment for all provinces and the training of staff was carried out in four provinces (Copperbelt, Southern, Northern and North Western) while a Tradition Birth Attendants (TBA) curriculum was developed and clean delivery kits were introduced in all districts for home deliveries. In the Prevention of Mother to Child Transmission (PMTCT), 84 sites in 12 districts countrywide were providing ARVs to mothers. Further, it was estimated that 500 women each moth were being counselled and tested. 4.3 SOCIAL SAFETY NETS The main Social Safety Nets programmes supported by Government in 2004 continued to be Food Security Pack Programme, National Trust for the Disabled, Programmes Urban Self Help the Food Programme Management Unit and the Public Welfare Assistant scheme.
4.3.1 Food Security Pack Programme
A total of 150,000 households were supported under the FSP in 2003/2004 farming season at a cost of K91 billion compared to K82 billion spent in 2002/2003 farming season with 125,195 beneficiaries. In the last four seasons beneficiaries increased maize production from an average of less than five by fifty Kg bags per lima to an average of eighteen by fifty Kg per lima. In 2002/2003 season a total of 132,000 Mt were produced by beneficiaries worth K82 billion and in 2003/2004 season 197 Mt was produced worth K124 billion.
By 2004 more than 30,000 beneficiaries successfully graduated over the past three years and were self sustaining. The programme recorded a 50 percent recovery rates and during the 2004/2005 season a minimum of 10,000 additional beneficiaries received inputs bought through recoveries. 4.3.2 Programmes Urban Self Help
With regards to the Programme Urban Self Help (PUSH) K40 million was disbursed by Government to the programme which catered for 28 communities and reached out to 110,000 direct beneficiaries. Further the implementation of the various programmes resulted into the construction and rehabilitation of infrastructure in 14 districts, construction four Community Development Centres in Kafue, Kapiri Mposhi, Kitwe and Chingola. Through PUSH, the Chifulube Road in Luanshya was graveled connecting 30 food production holdings and storage sheds and markets in Luanshya town. Further, 1.5km of the Mutenda road leading to fishponds off the Chingola- Solwezi was graveled to support local peasants. Two bridges were completed under the programme and these are the in Luanshya and Ndola.
4.3.3 National Trust for the Disabled
During the year under review, the Government continued to provide micro-credit to disabled persons through the National Trust for the Disabled (NTD). In 2004, the National Trust for the Disabled (NTD) worked with new groups in Lusaka, Kafue and Nakonde. A total of K15.5 million was disbursed to twenty beneficiaries, out of which eleven were males and nine were females
4.3.4 Public Welfare Assistance Schemes (PWAS)
For PAWS, Government disbursed a total of K2.9 billion which enabled 105,043 beneficiaries to be reached. Out of the total beneficiaries, 41.3 percent were males while 58.7 percent were females. In 2004, the PWAS had been accessed by 134,092 clients as compared to 105,043 in 2003.

20
Chapter 5
REGIONAL IMPLEMENTATION PROGRESS In 2004, Government disbursed K8.5 billion PRPs out of an allocation of K10.4 billion. The funds reported under this chapter covers funds received through the Provincial Administration and not through the sector ministries. The chapter, therefore, is by no means exhaustive of all PRP implementation in the Provinces. The chapter, therefore, analyses the releases, expenditures and outputs per region. Government mainly focussed on infrastructure development, land resettlement and industrial development. The regional infrastructure development involved the construction and rehabilitation of health posts, local courts, feeder roads, high schools, airports and aerodromes.
5.1 Central Province In 2004, Government released K7.4 billion for PRPs to Central province. These funds were used, among others, for drilling boreholes, land resettlement, provision of school desks, procurement of school requisites, rehabilitation of health facilities and roads. A total of K4 billion was used to procure school desks, K2.2 billion for the continued rehabilitation of feeder roads and K609 million was earmarked for mushroom propagation. A further K4.81 million was used to rehabilitate access roads in the resettlement areas and the sinking and equipping boreholes. Out of the targeted 990 plots, 837 farm plots were allocated to settlers in the schemes. Other amenities provided in the scheme included the construction of one clinic. In order to increase agricultural production and income among small-holder farmers,
Government disbursed a total of K1 billion. In addition, Government released a further K200 million for irrigation development. In 2004, Government implemented the Industrial Development programme in the Province. Activities undertaken included the bee-keeping project whose aim was to empower people economically. The expected output of this project was the procurement of raw honey and protective clothing, procurement of honey and bees wax processing machine, rehabilitation of storerooms, mobilization and sensitisation of bee keeping groups and the training of 420 people in bee keeping in seven districts.
5.2 Copperbelt Province In the Copperbelt Province, Government disbursed a total K7 billion out of a budget allocation of K8 billion. The funds were used to develop water and road infrastructure, income generating activities such as Piggeries, bee keeping, rural development, infrastructure development and resettlement programmes. Furthermore, a total of K950 million was released for feeder roads but monitoring of these activities were yet take to be undertaken at the time of this report. In the resettlement programmes, activities undertaken included the drilling of 15 boreholes, rehabilitation of 28 old boreholes, rehabilitation of 3 dams and the designing and surveying of 2 additional dams. Other PRP activities implemented in the Province included the rehabilitation of school infrastructure and procurement of furniture, infrastructure development, rehabilitation of feeder roads and bee keeping. In addition, the

21
Land resettlement programme received K500 million for the rehabilitation of feeder roads.
5.3 Eastern Province
The total authorised PRP budget for Eastern province in 2004 was K9.9 billion out of which K6.7 billion was released. The main interventions included the rehabilitation and construction of infrastructure and the sinking of boreholes and demarcations of plots in the resettlement schemes. Government earmarked and released K4.7 billion for education programmes. The funds were used for the promotion and preservation of culture and procurement of school requisites including 3, 500 desks. In the Eastern Province, Government undertook a livestock vaccination programme. A total of 40, 000 dogs, 6,530 calves and 6, 313 chicken were vaccinated. In the feeder road programme, a total of K3.8 billion was released in 2004 part of which was used for feasibility studies. A total of 100 km of road was earmarked for rehabilitation. Government disbursed K150 million for the electrification of Chimtengo forest. The electrification of Chimtengo forest was completed in 2004 and resulted in the commissioning of saw-mill. Funds released for the resettlement programmes in the Province were used for the demarcation of plots in the resettlement and the improvement the water and sanitation infrastructure. A total of 6 boreholes were drilled and 60 plots demarcated.
5.4 Luapula Province In 2004, Government disbursed to Luapula Province a total of K6.9 billion. Interventions during the period under review included provision of management and regulation of
the fish industry, grading of roads, procurement of school desks, rehabilitation of health infrastructure, rehabilitation of feeder roads, bee keeping and rehabilitation of Government infrastructure. Government also focused on Biodiversity and watershed conservation activities in all districts. The output was the protection to the headwaters of the Luapula river tributaries, ultimately leading to a continuous and even flow of clean water in the streams. Two dams were also constructed in the Province in 2004. The resettlement Schemes established by Government in the Province made tremendous progress in 2004. This was as a result of early releases of funds. In the National Feeder Roads programme, 60km of road were graded and 8 km were re-gravelled. However, implementation was suspended due to heavy rains. 5.5 North-Western Province In 2004, Government disbursed to the North Western Province a total of K7.2 billion which was the total allocation for the year. The focus in the Province during the year was on infrastructure development, water and Sanitation, Bee keeping, provision of school requisites and resettlement programmes. 5.6 Lusaka Province
In 2004, Government continued to undertake activities in the tree planting programme in the forestry sub-sector. These activities were aimed at mitigating deforestation effects by establishing five nurseries in all districts. By December 2004, nursery capacities were built in readiness for the tree-planting season. Other activities envisaged to be undertaken in the Province were the holding of an orientation workshop, area identification and site selection in all districts for bee keeping projects.

22
Government rehabilitated four dams in Chongwe and strengthened nine hydrological stations. The outputs were the employment of labour to start clearing vegetation, procurement of cement and stones, payment of gauge readers, and the rehabilitation of all 9-gauge stations in the Province, the Out-growers Schemes in fish farming, the construction of 34 ponds and stocking them with fingerlings. In the Health programme, planned outputs included the construction of three and rehabilitation of 12 health posts. In terms of Monitoring and evaluation, two monitoring trips were undertaken and 22 PRP projects evaluated. In the infrastructure programme, a site on which to construct an office block was identified and building plans forwarded to the Ministry of Works and Supply for approval. Other activities of rehabilitating the University Teaching Hospital and construction of local courts were still at tender stage at the time of this report. In the provisions of school requisites, Government commenced the distribution of 4, 484 school desks. Other activities included the rehabilitation of 256 km of road, the commencement of the tree planting exercise, construction of 18 culverts and 6 splashes.
5.7 Northern Province In 2004, Government disbursed a total K2.8 billion. These funds were utilised for infrastructure development, provision of school requisites, development of resettlement schemes and bee keeping. In the education programme, a total of 1, 193 desks were distributed while health care was improved through rehabilitation of health facilities. Canals in Northern Province were dredged in order to improve transport. In the resettlement programme, plots were demarcated and one school and a house completed during the period under review. In
order to empower people economically, Government embarked on bee keeping activities aimed at income generating activities. In the Water and Sanitation programme, a total of 49 boreholes were drilled, 7 gauge stations opened and one dam rehabilitated. In 2004, the province received K44 million for pothole patching. The status of roads in the province remained more or less the same as in 2003. Part of the funds released was spent on the Lukashya trades College for the rehabilitation of hostels, recreation hall and kitchen.
5.8 Southern Province
In 2004, the Southern Province received a total K8.4 billion for PRPs. The funds were utilised for the procurements of desks and rehabilitation of school infrastructure. The break down of the usage of these funds was as follows:
• Irrigation development – K500,000,000
• Cattle restocking- K2,000,000,000 • Animal disease control-
K500,000,000 • Feeder road rehabilitation-
K1,612,184,200 • Water development- K487,815,800 • Construction and rehabilitation of
Health facilities- K1,013,000,000 • Provision of requisites for High and
Basic Schools- K1,342,320,128 • Development of Resettlement
Schemes- K926,953,000 In the agriculture programme, Government rehabilitated three dams and surveyed sites for four more dams. Government also established small-scale irrigation schemes. This resulted in seven hectares of land being irrigated at Mang’wato supporting 28 households. At the time of this report, further

23
work was being undertaken ate Bbulolo irrigation scheme. In the cattle restocking programme, Government released a total of K2 billion to carry out cattle restocking programme in the Province. The funds were utilised to procure a total of 2,215 cattle. These measures increased crop production and the general welfare of the beneficiaries. In the animal disease control programme, a total of 172,900 vaccines were procured, which were used to vaccinate a total of 126,834 cattle in Namwala, Itezhitezhi, Mazabuka, Choma, Monze, Kalomo and Kazungula districts. Government undertook the following activities in the resettlement programme:
• Interviewed and allocated plots to 245 applicants at Masasabi;
• Electrified 1 staff House and office at Masasabi;
• Completed 1x2 classroom block at Masasabi;
• Completed renovation of a house into a school at Kabuyu;
• Graded 3 km road at Siamambo; • Drilled 6 boreholes at Masasabi
resettlement scheme; • Identified and acquired 2 blocks of
land in Mazabuka and Kalomo; • Sited 3 boreholes at Masasabi (2 ) and
Ngabo (1); and • Surveyed 128 plots at Harmony
scheme in Choma All these activities resulted in resettling of 245 small scale farmers and this in turn increased food production. In addition, six sources of clean and safe drinking water were provided in the resettlement schemes. In the infrastructure programme, the following Road rehabilitation and maintenance projects were carried out:
• Graded 30kms of Nyawa road and repaired a washed away culvert in Kalomo;
• Graded 11kms of Choma-Masuku road;
• Graded 65 kms of the targeted 110 kms of the Itezhitezhi-Junction of Lusaka Mongu road;
• Graded 17 kms of Sinazongwe-Sinazeze road;
• Graded 5 kms of Chief Mwemba road and 2.5 kms of Chief Sinazongwe road;
• Construction of 5 culverts completed on Sinazongwe- Chipepo Road;
• Gwembe Chipepo Road heavy grading and spot gravelling done;
• Emergency repair of Livingstone –Zimba, Choma- Namwala, Old Lusaka Road, Simatobolo Road, culverts repair of Maamba and Kabanga Roads;
• Culvert construction and embankment restoration done on Mapatizya – Kabanga road;
• Routine maintenance of Zimba -Victoria Falls Road, Mazabuka-T1/T2 junction road and Livingstone/Kazungula road was completed;
• Pot holes patching on Livingstone-Zimba road; and
• Construction of a causeway and embankment in Kazungula on Ngwezi – Kauwe road.
In the Water and Sanitation programme, the boreholes drilled in 2004 included 9 in Itezhitezhi and 4 in Namwala. The other 36 boreholes were sited in other districts of the Province.
In the Health programme, Government carried out the following programmes;
• Completed rehabilitation of the male medical ward at Livingstone General Hospital;
• Completed rehabilitation of one staff hostel;

24
• Construction of security fence at Livingstone General Hospital has reached an advanced stage. Almost 60 percent done;
• Purchase of maternity wing equipment for Itezhitezhi;
• Commencement of the construction of pharmacy extension in Mazabuka; and
• Extension of health center and completion of staff house at Rusangu in Monze.
Under Education programme, Government, procurement and distributed 2,400 desks and this improved the learning environment for 4,800 pupils in the 19 constituencies of the Province.
5.9 Western Province
In 2004, Western province a total of K5.4 billion was released for PRPs. The funds were utilised on rural infrastructure development, land resettlement and the provision of amenities in the resettlement areas. Government continued with the programme of infrastructure development. One office block was purchased while other Government buildings were rehabilitated. Government procured metal desks and wooden desks for distribution to schools. In the infrastructure development programme, Government rehabilitated roads In 2004, the Province undertook various programmes and projects to fulfil the values of Poverty Reduction Strategy Paper. The Province continued to pursue programmes and projects aimed at poverty reduction in the areas of agriculture, animal health, education, Health water and social safety net through infrastructure development. The projects involved provision of education and health infrastructure, development of resettlement
schemes as well as provision of water and sanitation facilities. The project that was undertaken is as follow: The province purchased 20 Boran Bulls for distribution to small Scale farmers to improve their herd. The department of Veterinary and Tsetse Control was still processing tender documents at the time of this report as most of the drugs could only be obtained abroad. The department of land resettlement demarcated a total of 105 plots and a total of 10 boreholes were sunk. This resulted into 2,500 persons accessising clean drinking water. In Education, the procurement of school requisites, desks, rehabilitation of Kaoma and Sioma secondary schools were at tender stage. In the Health programme, Government completed the construction of a ward block, theatre block, a security fence and improved water and sanitation at Mongu hospital. A total of K312 million was utilised on Installation of the power generator, construction of water tank and water reticulation system and construction of 1,200 meters of security fence. The two projects improved health delivery at the hospital as the hospital no longer ran out of water and electricity. Civil works started as the Ministry of Works was still processing the bills of quantity and pursuing Tender authority. Tender documents were signed and the contractor moved on site while for the district hospital rehabilitation works were complete. Other programmes undertaken included rural water supply, civil aviation where the department cleared 20 6 hectors of vegetation control and Marine and Inland waters

25
CHAPTER 6
6.1 INSTITUTIONAL FRAMEWORK FOR PRSP IMPLEMENTATION, MONITORING AND EVALUATION
During the period under review, the consultative process for monitoring and evaluation was further enhanced through the active participation of the Sector Advisory Groups (SAGs), Inter-Ministerial Technical Committee, Provincial Development Coordinating Committees (PDCCs) and Districts Development Coordinating Committees (DDCCs). These consultative structures continued to carry out their mandates at national, provincial and district levels respectively, according to their terms of reference that included among others, developing planning activities that provided input into the 2005 national budget and monitoring and reporting on the implementation of the poverty reduction programme for the third and fourth quarters.
At national level, the coordinating role of PEMD was carried out through the SAG meetings and conferences that were held during the review period. Several SAG meetings were held at sector level at which reports were produced for the SAG conference that was held in October 2004. The conference was a success in that its objectives to review performance of the PRPs and other capital programmes in the last two quarters of the year, make submissions to the Green Paper and recommendations for programmes to be considered in the 2005 budget were met. The resulting reports were consolidated into a single report that was presented to Cabinet. The report was used by the policy making body to assess the relevance of the policies and programmes adopted and to allow corrective action to be taken within the lifetime of the strategy. The report was also used by the MoFNP as part of inputs into the PRSP progress report that was presented to government, cooperating partners and other stakeholders. In order to ensure that there is accurate reporting on progress in the implementation of the PRPs, the SAGs used the monitoring system provided by the MOFNP. The reporting mechanism uses the indicator system adopted for PRSP by assessing progress based on inputs, outputs as
well as assessing the achievements of the objectives of the set targets using the outcomes and impact indicators. With regard to monitoring at provincial and district levels, the inter-ministerial technical committee in collaboration with the planning sub-committees of the DDCCs and the Monitoring and Evaluation secretariat of the PDCCs undertook monitoring and evaluation of projects and programmes under implementation during the first half of 2004. These committees facilitated the collection of information on input and output indicators in various sectors. The reports fed into PDCC and DDCC meetings as well as the October 2004 SAG conference. They were also used by Cabinet for decision making. Not withstanding the achievements made in terms of reporting by the SAGs, PDCCs and DDCCs, these monitoring structures demonstrated a number of weaknesses during the monitoring of the PRPs. The most notable weaknesses included among others; the weakness and inadequacy of the data collected, weakness in the analysis of the data collected and the inadequacy in understanding the indicator system. Other weaknesses were identified as lack of interest by some chairpersons of the SAGs to chair meetings, meetings not held regularly and in some instances, the SAG reports being submitted late to MOFNP. As a corrective measure, MOFNP proposed to the last SAG conference a training programme for building capacity among SAG members as a way of enhancing the quality of the PRSP implementation progress reporting. Furthermore, an assessment of the capacity building programme being conducted at provincial and district levels by ZAMSIF and PMTC through the local government structure should be carried out in order to harmonise it with the proposed training programme. To this end, PEMD in conjunction with GTZ prepared a training programme for the SAG members. The Training

26
Needs Assessment was conducted in November and is due to be tabled in the first quarter of 2005 to stakeholders after which the training exercise will commence. From the draft report of the Training Needs Assessment, a number of issues to be followed up were identified as follows:
• PRS monitoring needs to be seen in the context of all programmes implemented by Government and other stakeholders that are poverty reducing, regardless of their tag in the national budget. At present, the PRS, and by extension PRS monitoring, is associated solely with the release of funds under the identified PRPs in the national budget.
• There is need to improve the level of discussions at the SAGs to include debate on outcome and impact data. This information can come from a variety of sources, ranging from the CSO to participatory exercises carried out by civil society members of the SAG. The benefit of each of these sources of information needs to be identified and understood by the reporting officers.
• There is a need to strengthen the management information systems of a number of ministries and in a number of sectors. The current weak, and in some cases non-existent, systems has major ramifications for a system of monitoring that is based on regular information.
• Issues of data analysis and data use particularly need to be addressed. Data that is usually presented in institutional reports (monthly, quarterly and annual) is not analysed. This requires attention if they are to be utilised for future policy decisions and comparative analysis.
• The role of the Central Statistical Office (CSO) in the SAGs needs to be reconsidered. It is apparent that CSO are generating information that members of the SAGs are not aware of. If the SAGs
are to meet their TORs they need to have access to this information. In this regard the suggestion of the Director CSO, that a representative from the CSO should be included on each Sector Advisory Group needs to be acted on. Further, on-going plans to develop capacity within the National Statistical System need to be viewed as a concomitant activity to any training and capacity development undertaken under the broader heading of PRS monitoring.
• There should be two national SAG meetings per year but the quarterly meetings should continue in the sectors to provide advice to the sector in the implementation of its activities. These meetings should not limit themselves to the discussion of inputs and outputs under the identified PRPs, but utilise the existing TORs to discuss broader issues of relevance to the sectors, as already suggested by a number of sectors. At provincial and district level this is the same as saying that the PDCC and DDCC sub-committees need to meet more regularly to feed information into the larger committee.
• Address the legal basis for the SAGs, PDCC and DDCC if they are to fulfil their functions and roles. This is particularly relevant with the launch of the decentralisation policy.
• Pro-poor budgets – what they are and where they fit in the “new” way of thinking (away from PRPs.
• Budgeting, particularly on issues of the MTEF and ABB
• The use of Zambia Info as a means of data storage and management.

27
CHAPTER 7
LESSONS LEARNT, WAY FORWARD AND RECOMMENDATIONS
7.1 Government recognised that the definition of PRPs used in the budget up to December 2004 was too narrow and yet “PRPs’ are a much broader term. In this regard, the definition of PRPs was broadened and is now being defined as those programmes or interventions that directly contribute towards poverty reduction (PRP1) as well as those programmes indirectly contributing towards poverty reduction (PRP2) and remotely contributing towards poverty reduction (PRP3) see Appendix …).
7.2 The quality of reports from sectors
and provinces improved in terms of input, output and outcome during the review period. However, data collection, storage and analysis for planning purposes is still lacking in
most sectors apart from the health and education sectors. Arising from this realisation, a needs assessment study was undertaken to identify training needs for the SAGs and other stakeholders involved in the PRSP monitoring.
7.3 It was also noted that the frequency of
holding SAG conferences should be reduced from four times to two times a year. This is because holding these conferences was time-consuming and costly. In addition, the space of time between the conferences did not allow for SAGs to provide up-to-date information for particular quarter. However, the monthly meetings of individual SAGs will continue to be held and quarterly reports will be submitted to MoFNP.

28
Appendix I
Education: 2004 Releases
Period GRZ Inputs (ZMK) Donor Inputs Outputs Jan – Dec Planned Actual Planned Actual Planned Actual Rural Hardship Allowance
2,000,000,000 2,000,000,000 0 0 Disburse to the 5 rural provinces
K64.9 million disbursed to the 5 rural provinces
Rural Housing
6,500,000,000 6,500,000,000 0 0 Construction of Teachers houses in Rural areas
Tender for construction of portal frame s for rural schools has been approved -Contracts are being signed
CBU Rehabilitation
2,250,000,000 2,250,000,000 2,839,329,000 2,839,329,000 Rehabilitation of CBU
Rehabilitation works ongoing
UNZA Rehabilitation
4,882,000,000 4,882,000,000 1,216,905,000 1,216,905,000 Rehabilitation of UNZA
Rehabilitation works ongoing
Community School Support
3,000,000,000 3,000,000,000 0 0 To disbursed to Community schools
Disbursed to all community registered community schools
Bursary provision
3,000,000,000 3,000,000,000 1,092,369,060 1,092,369,060 To be disbursed to OVCs & vulnerable children
Disbursed to 4,476 OVCs in 41 districts
HIV / AIDS Awareness at Workplace
1,500,000,000 1,500,000,000 To be disbursed to the provinces
Disbursed to all PEOs for HIV/AIDS at workplace activities
29
APPENDIX II: RECLASSIFICATION OF POVERTY REDUCING ITEMS IN THE 2004 and 2005 BUDGET and 2005-2007 MTEF In line with the HIPC initiative, Government set aside resources for the implementation of ear-marked poverty reducing items in the budget. Subsequently, Government created a specific code in the budget to identify these programmes and projects under code 4. The definitions of these programmes were restricted to capital related items covering economic, cross cutting issues and social sectors, but were limited by the amount of resources labelled PRPs in the fiscal framework. This clearly did not portray the total picture of Zambia’s efforts in poverty reduction, as many programmes in the budget were poverty reducing though not directly linked to the HIPC initiative. It was against this background that Government decided to broaden the definition of poverty reducing elements to include all programmes relating to poverty reduction including some Personal Emoluments (PEs) for staff directly involved in the implementation of PRP programmes. It was in this light that proposals for the reclassification of PRPs were made for use in the preparation of the 2005 budget and 2005-2007 MTEF. These proposals have since been implemented in the 2005 budget. 1.1 GENERIC DEFINITIONS The generic definitions give a general picture of what can be classified as poverty reducing in the budget. This section suggests detailed classification of poverty-reduction relevant budget items and expenditure. This definition tries to be as holistic and accurate as possible when looking at different budget and expenditure items. While distinguishing between directly poverty-reduction relevant items and those that are only indirectly contributing to it, it goes a step further to recognize certain administrative cost as relevant to poverty-reduction. 1.2 CATEGORISATION
The redefinition and the guidelines of poverty reducing programmes were done during the last quarter of 2004. This information was given to the sector ministries to assist them in the budgeting process for 2005. The categorization is as follows:
1. Category 1: Directly poverty-reduction relevant costs
These are programmes, which are pro-poor and increase accessibility of the poor and venerable to services such as health, education and water and sanitation.
• Capital expenditure for projects such as schools, health centres/posts and hospitals, local courts, police posts/camps, feeder roads, water supply and sanitation systems, irrigation schemes, cattle dips, establishment of credit/micro-credit schemes, etc;
• Grants to quasi-government bodies operating services directly benefiting the poor;
• Recurrent costs for goods, services and other requisites/equipment for facilities directly serving the (poor) population, including maintenance;
• PEs for government staff directly serving the (poor) population, such as teachers, doctors, nurses, rural health workers, agricultural extension officers (including veterinary officers), community workers, local court justices, rural police officers, including allowances for hardship postings and field work;
• Vehicles and transport costs for PRR outreach activities;
• Cost for PRR campaigns, PRR radio programmes;
• Bursaries for vulnerable children;

30
• Social safety net grants to poor people;
• Purchase and distribution of drugs, vaccines, ARVs;
• Markets and storage facilities; and • Electrification and energy supply to
poor households.
2. Category 2: Indirectly poverty-reduction relevant cost
These are items, which facilitate and ensure compliance to good governance, transparency and accountability in the implementation of PRPs such as those listed below:
• Planning cost for PRP programmes, including workshop cost;
• Monitoring cost for PRP programmes, including fuel, allowances;
• Databases; • Research costs; • Training costs; • Costs for higher education, including
PEs of staff, buildings, furniture and equipment; and
• Voter registration.
3. Category 3: Administration cost for PRP programmes
These are items not directly affecting the poor but are facilitating the implementation of PRPs such as the ones given below. These should be labelled PRPs.
• PEs for administrative personnel, predominantly working for PRR programmes or heads;
• Housing and other costs for administrative personnel predominantly working for PRR programmes or heads;
• Office buildings: construction, maintenance and operation;
• Office equipment and running cost, Stationary;
• Vehicles, Transport cost and fuel for administrative personnel at district, provincial and central level;
4. Category 0: Non poverty-reduction
budget items and costs
These are items neither directly put money into the Poor’s pockets nor increase access of the poor to social services. These should not be labelled as PRPs, for example the purchase of movable assets for administrative purposes.

1
Republic of Zambia
Second PRSP Implementation Progress Report 2004: Supplement on Policies and Objectives for 2005
MINISTRY OF FINANCE AND NATIONAL PLANNING
PLANNING AND ECONOMIC MANAGEMENT DEPARTMENT
P.O. BOX 50062 LUSAKA
FEBRUARY 2005

2
Second PRSP Implementation Progress Report 2004: Supplement on Policies and Objectives for 2005 In 2002, the Government of Zambia prepared its Poverty Reduction Strategy Paper (PRSP) covering the period 2002-2004. The PRSP formally expired in 2004. However, as we indicated in the second Annual Progress Report on the implementation of the PRSP (APR), “it was agreed between Government and stakeholders that there would not be a second generation of the PRSP. The Government formulated a Transitional National Development Plan (TNDP), which incorporated the PRSP, to run from 2002 to 2005”. The TNDP was a result of a large and intense participatory process similar to the one undertaken for the preparation of the PRSP. In addition to the areas discussed in the PRSP, the TNDP addresses other areas such the judiciary, law and order, and defense and security. Therefore, the poverty reduction strategy and programs for implementation in 2005 are drawn from the TNDP. These policies broadly follow the guidelines indicated in the PRSP and the strategies, policies, and objectives presented in the 2002 PRSP remain relevant for guiding policies in 2005. For 2005, As highlighted in the Minister of Finance and National Planning’s speech accompanying the submission to parliament of the 2005 budget, the goal of the Government is to continue with viable economic policies that will promote broad-based growth and consolidate national unity and economic and political stability. In the macroeconomic area, the main targets are summarized in the Addendum to the APR (Chapter 1). The Addendum
also presents the medium term framework for 2005-2007, the result of a discussion with all stakeholders. Economic growth in 2005 will principally be driven by the sectors of agriculture, tourism, and mining. However, Government’s efforts also aim at achieving strong expansion in other sectors as condition for high and sustainable growth, as a necessary means to sharply reduce poverty levels and reach the United Nations Millennium Development Goals (MDGs). In this context, the Government will work closely with the private sector to improve business and investment climate in Zambia on the basis of the Private Sector Development Plan (PSDP). In particular, the government intends to scale-up the implementation of the reform measures relating to the improvement in the regulatory and licensing framework. The 2005 budget submitted to Parliament aims to limit domestic financing needs to 1.6 percent of GDP. Aggregate revenues are expected to be 18.5 percent of GDP, or 0.2 percent of GDP higher than in the earlier framework. The combination of these higher revenues and the Government’s decision to cancel a census costing 0.1 percent of GDP, which had been included in initial spending plans for the constitutional review, will offset increases in other spending, including a small increase in the wage bill, which allows us to hire additional and much needed teachers. In the 2005 budget, the Government has broadened the definition of poverty-

3
reducing spending to more closely correspond to the priorities set out in Zambia’s PRSP. Under the new definition, poverty reduction spending now includes a significant share of recurrent spending, including the wages of teachers in basic schools and health workers. On this definition 22.3 percent of domestically financed outlays, including external debt amortization, or the equivalent of 4.9 percent of GDP, are for poverty reduction. The monetary policy for 2005 has been tightened to reverse the unanticipated increase in reserve and broad money at the end of 2004. For the year as a whole, the growth in reserve money will be limited to 10.5 percent, with the aim of containing the growth in broad money to 14.8 percent.
As indicated in the Addendum to the APR, sector policies and interventions in 2005 broadly follow the guidelines indicated in the PRSP. Specifically: • On public expenditure
management, priority in 2005 is to be given to key steps needed to support the implementation of the Public Expenditure Management and Financial Accountability (PEMFA) program. Thus the government will finalize a framework for monitoring and evaluating the PEMFA program incorporating the benchmarks of public expenditure management that are used under the HIPC assessment and action plans to track poverty-reducing spending. On debt management, the Government will prepare a public debt management reform plan with World Bank assistance;
• On the financial sector, implementation of the Financial Sector Development Plan will continue. Priority is given to the execution of the plans for the resolution of three financially weak state-owned nonbank financial institutions;
• On agriculture, the Government
will continue to focus on food security, crop diversification, the opening up of new agricultural production areas, fight against livestock diseases and livestock restocking, and expansion of cash crops for exports by small and large scale farmers;
• On mining, the Government will
continue to provide an enabling environment to enhance private investment in the sector;
• On energy, the focus of the
Government remains on increasing access to electricity services, enhancing the security of supply of petroleum products and promotion of alternative energy, facilitating the provision of energy to areas of high economic potential, and accelerating the rural electrification program;
• On tourism, the Government in
2005 will concentrate reform efforts on simplifying and rationalizing the licensing framework, enacting the Tourism and Hospitality Bill, and with a World Bank loan on improving infrastructure in the area of Livingstone;
• On manufacturing, the Government
proposes to implement a principle to
4
provide more relief on equipment than on raw material;
• On education, the government will
continue to implement the education policy agreed with all stakeholders. In support of this policy, the 2005 budget allocated additional resources for hiring teachers to accelerate progress towards the pupil/teacher ratios envisaged under the PRSP and needed to reach the MDGs;
• On health, priority in 2005 is given
to the restructuring of the primary health programme, in particular by dealing with health problems at community level. As for the education sector, also in the health sector the 2005 budget allocated
additional recourses to increase the number of health workers and provide incentive for their retention.
• Finally, on decentralization, the
Government will continue the process of reviewing and establishing appropriate institutional structures and arrangements to facilitate decentralization of funds, coordination, monitoring and implementation of development projects conceived by local communities. In addition, the programme for 2005 is to consolidate and strengthen the local capacity to plan by amalgamating all local sector committees to form the nucleus of district planning and development committees.