zambia country strategy paper 2017-2021 combined … · 2019-06-29 · african development bank...
TRANSCRIPT
AFRICAN DEVELOPMENT BANK GROUP
ZAMBIA
COUNTRY STRATEGY PAPER 2017-2021 COMBINED WITH THE 2017 COUNTRY
PORTFOLIO PERFORMANCE REVIEW
Prepared by: RDGS/COZM DEPARTMENTS
August 2017
FISCAL YEAR
01 January to 31 December
CURRENCY EQUIVALENTS
(August 2017)
National Currency: Zambia Kwacha (ZMW)
UA 1.00 = USD 1.40775
UA 1.00 = ZMW 12.5252
USD 1.00 = ZMW 8.8973
Sovereign Credit Rating (B- Fitch / B- S&P / B3- Moody’s)
ACRONYMS AND ABBREVIATIONS
ADF African Development Fund
ADB African Development Bank
AGTF Africa Growing Together Fund
BDEV Independent Development Evaluation
DBSA Development Bank of South Africa
CODE Committee on Operations and Development Effectiveness
COMESA Common Market for Eastern and Southern Africa
COZM Country Office Zambia
CP Cooperating Partner
CPPR Country Portfolio Performance Review
CSP Country Strategy Paper
DHS Demographic and Health Survey
EAC East African Community
FDI Foreign Direct Investment
GAFSP Global Agriculture and Food Security Program
GCI Global Competitiveness Index
GDP Gross Domestic Product
GEF Global Environment Facility
GNI Gross National Income
GRZ Government of the Republic of Zambia
HDI Human Development Index
HIV/AIDS Human Immunodeficiency Virus / Acquired Immuno-Deficiency Syndrome
IDC Industrial Development Corporation
IFI International Financing Institution
IFMIS Integrated Financial Management Information System
IMF International Monetary Fund
IOP Indicative Operational Plan
IPP Independent Power Producer
MDB Multilateral Development Bank
MDG Millennium Development Goals
MIC Middle Income Country
MTEF Medium Term Expenditure Framework
NDP National Development Plan
NTF Nigeria Trust Fund

OSBP One-Stop-Border-Post
PAF Performance Assessment Framework
PBO Policy Based Operation
PFM Public Financial Management
PIU Project Implementation Unit
PRBS Poverty Reduction Budget Support
PSD Private Sector Development
RDGS Southern Africa Regional Development and Business Delivery Office
RRC Regional Resource Centre
R-SNDP Revised Sixth National Development Plan 2013-2016
SACMEQ Southern and Eastern Africa Consortium for Monitoring Education Quality
SADC Southern Africa Development Community
SCF Strategic Climate Fund
SI Statutory Instrument
SNDP Sixth National Development Plan 2011-2015
UA Unit of Account
USD United States Dollars
ZESCO Zambia Electricity Supply Company
ZMW Zambian Kwacha
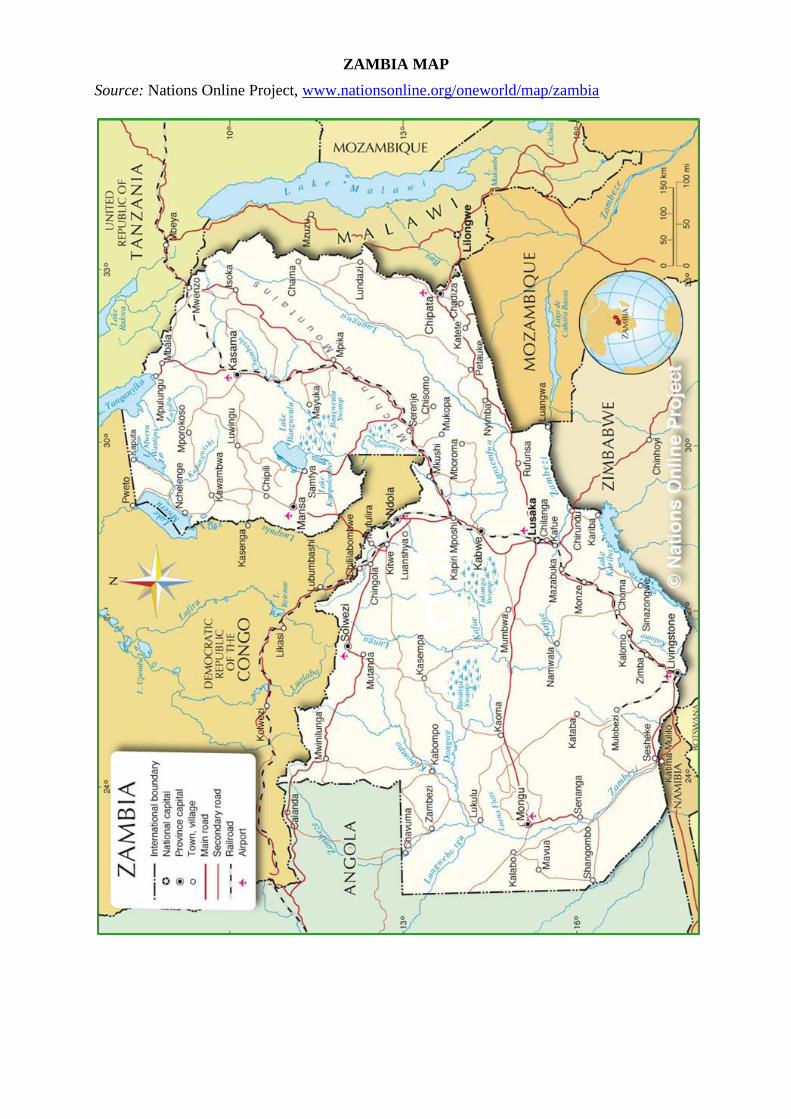
ZAMBIA MAP
Source: Nations Online Project, www.nationsonline.org/oneworld/map/zambia
TABLE OF CONTENTS
EXECUTIVE SUMMARY ...................................................................................................... i
1. INTRODUCTION ......................................................................................................... 1
2. COUNTRY CONTEXT ................................................................................................ 1
2.1. Political Trends ....................................................................................................... 1 2.2. Economic Trends .................................................................................................... 2 2.3. Social and Poverty Trends ...................................................................................... 4
3. STRATEGIC OPTIONS ............................................................................................... 5
3.1. Country Strategic Framework ................................................................................ 5 3.2. Aid Coordination, Alignment and Harmonization ................................................. 7 3.3. Challenges and Opportunities ................................................................................ 7 3.4. Country Portfolio Performance Review ................................................................. 9 3.5. Conclusions from the Country Strategy Evaluation ............................................. 10
3.6. Lessons Learned ................................................................................................... 11
4. BANK GROUP STRATEGY FOR THE COUNTRY ............................................. 12
4.1. Rationale and Strategic Selectivity ....................................................................... 12 4.2. Development and Strategic Objectives and Outcomes ........................................ 13 4.3. Indicative Bank Assistance Programme ............................................................... 18 4.4. Non-Lending Programme of Activities ................................................................ 18
4.5. Financing of the Strategy ..................................................................................... 19 4.6. Monitoring and Evaluation of Bank Group Operations ....................................... 19
4.7. Country Dialogue Issues ...................................................................................... 20 4.8. Potential Risks and Mitigation Measures ............................................................. 20
5. CONCLUSION AND RECOMMENDATION ......................................................... 21

LIST OF ANNEXES
ANNEX A: INDICATIVE RESULTS FRAMEWORK
ANNEX B: BANK PORTFOLIO STATUS AS OF 01 AUGUST 2017
ANNEX C-a: PORTFOLIO PERFORMANCE IMPROVEMENT PLAN 2016 – STATUS
OF IMPLEMENTATION
ANNEX C-b: 2017 COUNTRY PORTFOLIO IMPROVEMENT PLAN
ANNEX D: INDICATIVE LENDING PROGRAM 2017-2019
ANNEX E: INDICATIVE NON-LENDING PROGRAM
ANNEX F: LESSONS LEARNED
ANNEX G: SELECTED ECONOMIC AND FINANCIAL INDICATORS
ANNEX H: PROGRESS TOWARDS ACHIEVING MILLENNIUM DEVELOPMENT
GOALS
ANNEX I: COMPARATIVE SOCIO ECONOMIC INDICATORS
ANNEX J: RISK AND DEBT ANALYSIS
ANNEX K: SUMMARY OF FIDUCIARY RISK ASSESSMENT REPORT 2016
ANNEX L: DIVISION OF LABOR
ANNEX M: ANALYTICAL REPORTS CONSULTED
LIST OF TABLES
Table 1: Selected Portfolio Performance Indicators ................................................................ 10
Table 2: Country Strategy Alignment with National Development Plan, 10-Year Strategy, and
High 5s ....................................................................................................................... 15
Table 3: Key debt indicators for selected years
Table 4: Public Expenditure and Financial Analysis trends between 2005 and 2016 Table 5: 2016 Public Financial Management Scores (based on PEFA framework)
LIST OF FIGURES
Figure 1: Competitiveness Indicators for Selected Countries .................................................... 2 Figure 2: Selected macroeconomic trends ................................................................................. 3 Figure 3: Key Strategic Growth Areas ....................................................................................... 5 Figure 4: Portfolio Allocation and Disbursement ...................................................................... 9 Figure 5: Country Strategy Results Framework and Pillars ..................................................... 14
Figure 6: Composition of External Debt (2016, pct.) Figure 7: Redemption Profile as at end-2016 (K billions)
LIST OF TEXT BOXES
Box 1: Recent Development in Energy Reforms ....................................................................... 6 Box 2: Employment and Education ........................................................................................... 8 Box 3: Alignment and Selectivity Criteria ............................................................................... 12
Box 4: Main Conclusions from the Bank Dialogue Mission ................................................... 13 Box 5: Indicative financing the Country Strategy .................................................................... 19
i
EXECUTIVE SUMMARY
1. The new Country Strategy was prepared between 2015 and 2017 when the Zambian
economy faced some of its worst macroeconomic and fiscal challenges since the 1980’s.
The 10-year period before 2011-12 was characterized by high growth averaging 7.4% per
annum and large foreign direct investments into a mineral-driven copper economy. The overall
fiscal performance reached a new low with a deficit of 10% of GDP in 2016. The Country
Strategy preparation process started in 2015, but faced substantial slippages due to delays in the
adoption of a new annotated format for the Bank’s Country Strategy Papers and a parallel
process of finalising the evaluation of Country Strategies for Zambia between 2002 and 2015.
The 2017-2021 Country Strategy framework and strategic pillars were finally endorsed by
CODE on November 14th, 2016, in a meeting that also discussed the achievements and lessons
from the previous CSP 2011-2015 and the Country Portfolio Performance Review. CODE
members recommended during the meeting that within the pillars there was a need for greater
selectivity, expansion of the macroeconomic and debt analysis, diversification of economic and
energy sectors, and strong focus on sustainability.
2. Despite being a middle income country, poverty continues to exceed 54% with rural
poverty around 77%. Social indicators are improving, but continue to mimic those in low
income countries. A key challenge has been the absence of inclusive growth and formal job
creation which stands at only 11% of the active labour force. Addressing the creation of
productive employment opportunities for the rising population is key to increasing
inclusiveness. Tackling structural impediments are therefore critical to unlock the private
sector. The past mineral-driven and public-sector led growth model therefore needs to be
transformed to stimulate broad based private sector led growth. Zambia’s National
Development Plan 2017-2021 recognizes the need for a new model for economic development
that aims to create a resilient diversified economy for sustained advanced growth and socio-
economic development. This approach entails Government to facilitate a business friendly
environment through structural reforms and regulatory adjustments while seeking to support
private-sector investments in high impact infrastructure.
3. The National Development Plan also recognizes that tackling infrastructure
bottlenecks will promote development and support growth in the private sector and lower
business costs. Only 25% of households have access to electricity of which rural access is even
lower at a meagre 3%. Reforming the power sector and facilitating investments to increase
generation, transmission and distribution capacity will help expand rural electrification and
support the growing demand from industry and urban households. The limited and poor linkages
between rural production areas and urban markets hampers private sector growth. Strengthening
these linkages will create more business and market opportunities. Access to safe water stands at
65% while access to improved sanitation is only 44%. Improving these indicators is a priority for
Government to contribute to a healthy and productive population.
4. Apart from attracting the private sector, the Government will be focused on
consolidating the budget during the next five years. Zambia Plus, the Government’s medium
term Economic Recovery Program from 2016, aims to restore budget credibility by reducing the
deficit to sustainable levels. Zambia Plus also aims to ensure greater economic stability, growth and
job creation through policy consistency to raise market confidence for sustained private sector
investment. This year, 2017, already looks to be a turning point with higher copper prices,
expanding mining production, improved agriculture harvest, stable exchange rates, low
inflation, and decelerating debt accumulation. Finally, Zambia Plus sets out some bold and
important reforms that among other things aims to reduce costly subsidies while shielding the
most vulnerable.
5. The Country Strategy 2017-21 proposes the Bank Group interventions for the next five
years based on discussions with key stakeholders in the country, and taking into account the
ii
lessons and recommendations emanating from previous Country Strategies. The Strategy also
considers the reclassification to Blend in 2014, which made considerable non-concessional (ADB)
resources available in excess of USD 1 billion. The Strategy therefore seeks a broader mandate than
previous Strategies in order to allow operational flexibility and adjustments to changes in
Government priorities.
6. The Country Strategy 2017-2021 has a stronger emphasis on private sector
development to support the industrialization and jobs creation agenda. The overall
development objective aims to: reduce poverty and lessen vulnerability through a dynamic and
sustainable private sector that creates jobs. This objective is achieved by pursuing two strategic
goals that: i) raise productivity and strengthen trade competitiveness, to expand non-traditional
exports and reduce vulnerability to copper; and ii) create a business friendly environment to
support diversification and industrialisation while improving nutrition. To achieve these
objectives two pillars are proposed. Pillar 1, Support to Infrastructure Development, will
include support to water and sanitation, energy and transport. This pillar is aligned to the Banks
Ten-Year Strategy priority area of infrastructure development, and scaling up High 5s of Light-
up and Power Africa. Pillar 2, Support to Private Sector Development, will underscore key
private sector areas, enterprise development and agriculture. This pillar is aligned to the Ten-
Year Strategy priority area of agriculture and food security, and scaling up High 5s of Feed
Africa and Industrialise Africa.
7. The Country Strategy will screen cross-cutting themes in the project design.
Evaluation recommendations suggested that a stronger attempt is made on promoting inclusive
and green growth while improving the mainstreaming of gender. The Strategy will concentrate
on cross-cutting areas that can be categorized in the following four themes: Gender; Climate;
Skills and Technology; and Economic and Governance Reforms. When preparing projects each
of these areas will be screened, reviewed and considered in the design and formulation of projects.
Certain cross-cutting areas will be more relevant for some operations than for others.
8. A project pipeline was developed in discussions with Government amounting to USD
1.2 billion taking into account the available funding. Apart from lending the Bank will also
increase its focus on non-lending operations. The Bank will place greater emphasis on policy
dialogue which will be underpinned by cutting-edge knowledge work. Technical assistance will
support preparation of projects, project and reform implementation, and strengthen institutional
capacity in line with the Government priorities. The Bank will provide capacity development
and policy advisory assistance in collaboration with other development partners.
9. The Bank portfolio in Zambia comprises 23 ongoing and approved operations of
which 2 are multinational. The net portfolio value is UA 729 million (USD 1.0 billion). The
three largest sectors in the portfolio include transport, water and sanitation, and agriculture.
More than 62% of funding is now from ADB resources. The average disbursement ratio is 15%
with an average project age of 2.6 years. The most recent Country Portfolio Performance
Review assessed the overall portfolio performance as satisfactory with a positive improvement
trend. More projects are increasingly task managed directly from the Country Office and the
Regional Resource Centre, benefitting overall portfolio performance.
10. The Boards of Directors are hereby requested to consider and approve Zambia’s
Country Strategy 2017– 2021.
1
1. INTRODUCTION
11. This paper proposes the Bank Group’s intervention strategy in Zambia for 2017 to 2021. The
Strategy is based on discussions with the Government, Cooperating Partners, the Private Sector,
civil society, and the lessons and recommendations emanating from the Independent Development
Evaluation 2002-2015 and the Zambia Country Strategy 2011-15 Completion Report. The Strategy
also takes into account the comments from CODE on the need for greater selectivity, expansion
of the macroeconomic analysis and debt sustainability, energy diversification, and sustainability
of interventions. The Strategy takes into account Zambia’s MIC status and the transition to Blend
in 2014, making considerable non-concessional resources available. The Strategy therefore seeks
a broader mandate in order to allow operational flexibility subject to the Government’s priorities.
12. Based on the conclusions and the recommendations of the Evaluation, the Country Strategy
2017-2021 proposes a stronger emphasis on private sector development. The development objective
aims to build a conducive investment environment for sustainable development to create jobs, reduce
poverty and malnutrition, and lessen vulnerability. The Evaluation also established the need to
continue to address infrastructure bottlenecks (Pillar 1: Support to Infrastructure Development) in
addition the dialogue mission confirmed Governments reorientation towards the private sector to
create jobs (Pillar 2: Support to Private Sector Development). These pillars aim to: i) raise
productivity and strengthen trade competitiveness, to expand non-traditional exports and reduce
vulnerability to copper, and ii) create a business friendly environment to support diversification and
industrialization while improving nutrition. The Strategy is aligned with the Government’s long term
Vision 2030 and the Seventh National Development Plan 2017-2021, and has taken Bank policies,
priorities and strategies into account. The High 5s are mainly addressed through Light-up and Power,
Feeding and Industrialising Africa.
13. Following the introduction, the paper is structured as follows: Chapter 2 presents the country
context from the political, economic, and social standpoints. Chapter 3 presents the strategic
options, including aid coordination and the Bank’s positioning in the country. Chapter 4 presents
the Bank’s intervention strategy for Zambia from 2017 to 2021. Chapter 5 concludes this paper
and presents the recommendation submitted to the Board.
2. COUNTRY CONTEXT
2.1. Political Trends
14. Zambia has remained peaceful and politically stable since independence, while public
institutions continue to mature. Multiparty elections were introduced in 1991, with the Movement
for Multiparty Democracy emerging as the governing party. Presidential, parliamentary and local
government elections have been held every five years. The MMD retained power for 20 years under
three presidents. At the national elections in 2011, the Patriotic Front under Michael Sata’s
leadership, defeated the MMD. His presidency was cut short due to illness after which PF front-
runner Edgar Lungu, was elected in 2015. General elections were held in August 2016 under a new
constitution. Edgar Lungu, retained his presidency, being the first president elected under a 50
percent plus one vote system and with a Vice President as running mate. The elections and the
aftermath have been characterised by waning political space for the opposition parties. This has been
most evident with the arrest of the opposition leader in April 2017 and the subsequent treason charge
for blocking the presidential motorcade.
15. Zambia is slowly improving good governance while strengthening its actions to tackle
corruption. The 2016 Mo Ibrahim Index (good governance), indicates a marginal improvement
from 58.0 in 2011 to 58.8 in 2015. Of the four areas monitored, two have shown improvements: rule
of law, and human development, while participation and human rights, and sustainable economic
opportunity has deteriorated. The Government has managed to improve accountability from 39.3 in
2011 to 42.5 in 2015. Despite these positive trends, the 2015 Transparency International Corruption
Index still places Zambia in the middle group (ranked 76) with a low score of 38/100.

2
16. Zambia faces limited fragility and transitional challenges. There are some factors that
could develop adversely over time if not addressed. It has been observed there is some degree of
political intolerance and exclusion of the media in political processes, relatively high urban youth
unemployment, and high dependence on the mining sector for reserves. Failing to address these
factors could affect overall economic performance, and lead to social and political instability.
2.2. Economic Trends
17. Between 2000 and 2010, the economy achieved impressive growth averaging 7.4% per
annum driving Zambia above the threshold for Middle Income Countries. Growth was driven
by investments in the mining sector spilling into construction, transport, communications, wholesale
and retail. High growth was facilitated by favourable copper prices underpinned by demand from
China, and increasing trade in the region. The global financial crisis during 2008/9 initially had
limited effects on the Zambian economy. The main transmission of instability was through falling
copper prices after 2011 that led to a slower growth trajectory (see Annex G and I for indicators).
18. The reduction in copper prices, and abnormal rainy seasons in 2014/5 and 2015/6
affected growth in mining and agriculture. The poor rains especially in the south of the country
reduced electricity generation from major hydro power plants. Combined with excess exchange
rate volatility and inflationary pressure in 2015 and 2016, wholesale and retail trade, financial
services, and transportation services were also affected. Real growth declined to 3.2% in 2016
putting real per capita growth at just 0.2%.
19. Although agriculture remains a small sector, it employs more than 2.9 million out of
5.9 million in employment. Agriculture is only the sixth largest (7.1% of GDP) sector. Wholesale
and retail trade employs 690,000 and is by far the largest sector, 22.6% of GDP. Mining, 10.5%;
construction, 10.2%; and manufacturing, 8.3% of GDP. Mining employs 82,000, construction
employs 183,000 while manufacturing 234,000. Education is fifth accounting for 7.6% of GDP
while employing more than 132,000 teachers creating substantial formal employment. There are
630,000 formally employed of which more than 1/3 are in central and local government.
20. Zambia remains a preferred investment destination in the region by many investors that
see the country as peaceful and with limited internal conflicts. Despite the slowing economy,
Zambia continues to attract foreign investors. In 2015, FDI amounted to USD 1.3 billion a reduction
from USD 2.1 billion in 2014. In previous years, mining received more than two thirds of investments,
but in 2015 manufacturing surpassed mining, receiving USD 604 million, compared to mining’s USD
325 million. Over the past decade, Government has taken several initiatives to improve the country’s
investment climate. Zambia was listed among the top-10 reformers in 2010, and ranked 98 out of 190
economies in the 2017 Doing Business ranking. Zambia has made good progress in the areas of ease
of starting a business, getting credit, paying taxes and dealing with construction permits. Six issues
stand out as far from best practice: i) trading across borders (rank 161), ii) getting electricity (rank
153), iii) resolving insolvency (rank 83), iv) enforcing contracts (rank 135), v) registering property
(rank 145) and vi) protecting minority investors (ranking 87). According to the 2016 GCI Zambia is
in the bottom fifth, ranked 118 out of 138 economies.
21. Rising expenditures and insufficient
revenues have led to deterioration of the
fiscal deficit. When PF took office, the
election promise was to increase public
investments in transport and energy while
putting more money in people’s pockets. This
led to a 45% wage adjustment for public
employees in 2013 pushing the wage bill to
over 61% of domestic tax revenues in 2014.
This entailed faster growth in expenditures
while revenues couldn’t keep up. The fiscal
deficit deteriorated reaching 10% of GDP in 2016 (commitment basis). During 2015 and 2016
Figure 1: Competitiveness Indicators for Selected Countries

3
arrears grew to 8.8% of GDP as public service providers and contractors where not being paid. The
Government acknowledges the need for fiscal consolidation, but has been slow to adjust. With the
2016 elections behind us there is increased optimism that Government will now be able to tighten
fiscal policy and pursue fiscal consolidation.
22. Borrowing to finance public infrastructure investments and fill gaps in the national
budget have increased public debt levels in recent years. Total debt stocks are estimated to
increase to about 56% of GDP in 2016 from 26% in 2012, with external debt accounting for 70%
of total debt. Zambia has accessed a total of USD 3 billion on international financial markets since
2012 in addition to concessional and non-concessional borrowing. The cost of Eurobond finance
has risen from 5.3% in 2012 to over 9% in 2015 adding to higher debt service payments. The sharp
depreciation of the Kwacha in 2015 increased external debt levels in kwacha terms, but also
increased debt servicing to an estimated 17% of domestic revenues in 2016. The risk of external
debt distress was therefore adjusted to moderate given the deterioration in debt dynamics (IMF,
Figure 2: Selected macroeconomic trends

4
2015). Under the baseline and alternative scenarios, all external debt sustainability indicators
remain below their applicable thresholds, but the debt-service-to-revenue ratio breaches the
threshold under various external shocks. Breaches coincide with Eurobond repayments during
2024 to 2028 period. Zambia’s overall public sector debt dynamics are sustainable under the
baseline. However, the large primary balance deficit underscores the need for improving the fiscal
position. Annex J provides additional analysis on the debt dynamics for the next five years.
23. Zambia is committed to an open, liberal trade regime and has put efforts into deepening
regional integration through regional and multilateral arrangements. This has been important
in promoting exports and to some extent economic diversification. Exports to the eight neighbouring
countries and South Africa increased from USD 1.3 billion in 2010 to USD 1.6 billion in 2015, while
imports increased from USD 3.3 billion to USD 3.9 billion. Trade with Congo DR peaked in 2013,
but still maintains a high level with USD 1.5 billion while South African trade amounts to USD 3.1
billion. Zambia hosts the headquarters of COMESA and remains active in SADC. Zambia has
affirmed its forward commitment to inter-regional trade by participating in the COMESA-EAC-
SADC-tripartite trade market. Zambia has also adopted a policy to establish one stop border posts
and trade centres at all its major borders as a way of expediting intra-regional and international trade.
24. This year, 2017, looks to be a turning point with increasing copper prices, expansion of
mining production, expectations of an improved agriculture harvest, stable exchange rate and
inflation and decelerating debt accumulation. The improved rains have ended load shedding from
8-10 hours per day in 2015/16 while new and rehabilitated mines will be ramping up production by
8-16% in the medium term. In 2016 the Government launched its Economic Recovery Program that
will focus on greater domestic resource mobilisation, improving fiscal governance, restoring budget
credibility and raising the confidence of the private sector. These reforms are needed to stimulate
growth in the economy. In the medium term, the economy is expected to exceed 4% growth, inflation
remaining within 6-9% range, and currency depreciation mirroring low inflation.
2.3. Social and Poverty Trends
25. Poverty remains endemic and widespread with gains in social and human development
lagging behind. Zambia’s high economic growth rate has not translated into equitable wealth
distribution. Poverty levels are high, with more than 54% of the population living below the
poverty line in 2015. Poverty remains predominantly geographically defined, with poverty highest
in rural areas at about 77% compared to 23% in urban areas. Poverty prevalence is higher in the
rural and remote areas, but the concentration of poverty is often located in urban areas. Urban
poverty incidence could rise in the future as urban population continues to grow while employment
opportunities are not created fast enough to follow suit. Evidence from Zambia indicates that the
level of education is important in reducing the risk of becoming poor. The 2015 HDI ranks Zambia
139. The score was 0.586 up from 0.555 in 2010 moving Zambia into medium developed countries
and above the average for Sub-Saharan Africa (0.502). Annex H provides data on MDG progress.
26. Gender equality is improving, but remains low in the region. The Gender Inequality
Index interprets loss in human development due to inequality between female and male
achievements in three dimensions: reproductive health, empowerment and economic activity.
Zambia has a low Gender Inequality Index of 0.587, ranking it 132 out of 154 countries. Female
participation in the labour market is 73% compared to 86% for men. In parliament, women only
occupy 18% of seats. This is well below the SADC target of 50% representation. In 2015, the first
female Vice President was appointed, and female participation in cabinet increased to 29%.
27. Primary school net enrolment has remained consistently above 95% for both girls and
boys, but quality of education lags behind. The 2014 national figures indicate that the combined
net enrolment is 100% for boys and girls. Primary school completion rates have increased reaching
over 99% in 2014. At the secondary school level school infrastructure and qualified teachers
remains in short supply. Net attendance rates are low, 38% for boys and 36% for girls. Pass rates
are low at only 60%, while dropout rates in lower secondary school reach as high as 39% in 2009
according to UNESCO. The quality of education is low according to studies from SACMEQ.

5
Particularly math and reading skills are poor compared to the region. Other areas contributing to
low quality are the high student-teacher ratio, limited access to teaching materials and resources,
and insufficient number of classrooms.
28. Maternal and child health outcomes are improving, while better access to treatment is
addressing the spread of HIV and AIDS. The 2014 DHS indicates that maternal mortality has
fallen to 398 deaths per 100,000 from 591 deaths per 100,000 in 2007. Improvements in other
areas include use of family planning services, reduction in child and infant mortality, and increase
in exclusive breastfeeding. Chronic malnutrition still remains a concern with prevalence above
40% in 2015, the second highest in Southern Africa. The Government target is to reduce stunting
to 30%. HIV and AIDS prevalence rates are decreasing in Zambia. The rate of HIV transmission
from mother to child has been halved to 12% in 2014 from 24% in 2009. This is attributed to
universal coverage of ARV treatment. Young women are still most at risk of being infected.
29. Two-thirds of the population do not have access to electricity. Less than 4% of households
in rural areas have access while 68% of urban households have access. The absence of energy
reforms and cost-reflective electricity tariffs has discouraged investments and led to insufficient supply
of generation capacity. This is evident with electricity generation that has been affected by two
droughts and the overuse of water at the critical Kariba Hydro Power Station. Growing demand for
electricity currently outstrips available supply.
30. Access to potable water is still below the required amounts for a sanitary and disease-free
environment, while sanitation and drainage systems in many areas are still underdeveloped. The
average consumption of water for drinking and other domestic use is not more than 20 liters per day
per rural household, i.e. approximately 5 liters per person per day (UNCTAD, 2006). Poor water
supply and sanitation services in peri-urban areas cause annual outbreaks of waterborne diseases
during the rainy season. This not only places a heavy economic burden on already impoverished
communities, but also on public health services. According to WHO/UNICEF more than 56% of the
population is still without access to improved sanitation facilities. Poorly constructed drainage systems
are inefficient during the rainy season leading to waterlogs on the roads or in market places.
3. STRATEGIC OPTIONS
3.1. Country Strategic Framework
31. Vision 2030 projects Zambia to become a prosperous
middle income nation through infrastructure and human
resource development to stimulate creation of wealth and
jobs. The development aim is set forth in Vision 2030,
providing a framework for Zambia’s aspirations. The Seventh
National Development Plan provides the overall strategic
direction and investment priorities for 2017-2021.
32. The NDP uses an integrated approach and sets out the
principles of accountability, efficient resource allocation and
effective utilization of resources. The overarching goal is
creating a resilient diversified economy for sustained
advanced growth and socio-economic development. The plan
rests on five pillars: i) economic diversification and job
creation; ii) reducing inequalities; iii) tackling poverty and
vulnerabilities; iv) enhancing human development; and v)
strengthening governance for diversification. The plan
recognizes key strategic growth areas, Figure 3. Agriculture is the major employer in the country,
while reliable infrastructure is vital to economic development promoting inclusive growth. By
raising labour productivity and lowering production costs, infrastructure will enhance economic
activity and contribute to creating jobs. While investing in infrastructure is a pre-requisite for
Figure 3: Key Strategic Growth Areas

6
achieving growth, Government also sees investments in health, education, water and sanitation as
critical for inclusive and sustainable growth in the long term.
33. Sufficient electricity generation will be important
for future development. The Government recognizes that
the energy sector is critical for powering businesses,
mining, manufacturing and the economy as a whole (2008
National Energy Policy and the 2017 Electricity Reform
Road Map). Energy reforms are high on the Governments
agenda and are needed to attract private sector through
Independent Power Producers and institutional investors
which will help to achieve the country’s generation targets
while creating a competitive environment for improving
efficiency, Box 1. Investments will be needed, to ensure
future generation surplus while expanding access. With
abundant water and other renewable energy resources
available, the Government aims to turn Zambia into an electricity exporter.
34. To reduce transport costs, good quality and expanded transport is key to linking the
country’s provinces and districts. The Government prioritises the development of the main
transport corridors as stated in the National Transport Policy and the Road Sector Framework 2012-
2022. Link 8000 plans to construct and rehabilitate 8000 km of trunk and main roads. The Pave
Zambia 2000 aims to pave urban roads in 17 districts across the country, and L400 aims to
rehabilitate the road network in Lusaka. Implementation has been mixed as a result of the fiscal
pressures. A national infrastructure master plan has been developed in 2017. A shift from rail to road
presents advantages in the cost to government through reduced maintenance costs. Shifting cargo to
rail would result in reduced traffic loads mitigating premature road failures and help provide good
road transport. Viable business models will need to be explored while private sector investment
would be required to supplement the government’s limited resources into rail transport systems.
35. The Government aims to establish an agriculture sector that is commercially oriented,
competitive, productive, diversified, and driven by principles of equity and sustainability. The development of agriculture, livestock, fisheries and forestry are considered national
development priorities. The Agriculture Policy sees these priorities as key drivers in creating jobs,
enhancing inclusive growth, addressing climate change, and diversifying the economy. In the area
of agricultural diversification, the Government intends to promote cash crops such as cotton,
cashew nuts, soya beans, cassava, horticulture and rice. Government is also actively supporting
farmers to exploit investment opportunities in dairy, beef, small ruminants, poultry and
aquaculture value chains. Government is further supporting aquaculture parks to improve the
availability of fingerlings, while encouraging the private sector to participate in the establishment
of fish feed plants, freezing facilities, and offering fiscal incentives to the aquaculture sub-sector.
36. The development of a dynamic private sector is key to creating the hundred thousand jobs
needed to keep up with annual entry into the labour market. Economic diversification will lead to
lower copper dependency and vulnerability to external shocks. The Private Sector Development and
Competitiveness Strategy and the 2013 Industrialisation and Jobs Creation Strategy are critical
Government documents outlining the diversification strategy. Diversification will require, among
others, improving technology and innovation, improving skills, raising productivity, ensuring low cost
inputs, and establishing marketing and distribution channels. Expanding and growing micro, small and
medium sized enterprises through business development services and affordable access to finance and
promoting partnerships between local and international firms will also be important. The 2015 Youth
Policy promotes skilled, enlightened, and economically empowered youth to impact national
development. In 2014, the IDC was created to take ownership of 34 State Owned Enterprises to
commercialize and attract foreign partners/investors. Multi-facility economic zones are being
developed. These zones provide investor incentives to attract local and foreign investors.
Government took bold steps in November 2016
by increasing fuel prices by more than 40% to
ensure cost-reflectivity on fuel imports. As of May
2017, non-mining electricity tariffs were raised by
an initial 50% contributing to improvement in
ZESCO cash flows (and a reduction of indirect
subsidies). An additional 25% increase is planned
for September 2017 as well as negotiations with
mining houses is nearing a conclusion that will
raise their tariffs to an average of 9.3 US-
cents/kWh. These measures will help to reduce
pressure on the fiscal deficit in the medium term.
Box 1: Recent Development in Energy Reforms

7
3.2. Aid Coordination, Alignment and Harmonization
37. The Joint Assistance Strategy 2011-15 and the Division of Labour are the main aid
coordination instruments. The Strategy sets out the Cooperating Partners support to the NDPs,
provides the medium term framework to realize the aid principles, and aligns development to the
Aid Policy and Strategy. For coordination purposes the Division of Labour is regularly updated
and included in Annex L. As the Joint Assistance Strategy remains relevant and valid there are no
immediate plans to have this revised.
38. The high level aid architecture is well structured and institutionalized through the CP
Group led by a Troika. The Troika holds monthly meetings with the Secretary to the Treasury,
the Permanent Secretary of Planning and their teams. In addition, Joint Sector Working Groups
hold regular meetings that provide a platform for policy dialogue. Issues that cannot be resolved
at working group level can be elevated to the CP group. The Bank is active in the CP group and
led the Troika in 2012. The Bank participates in relevant working groups and has previously
chaired the following working groups: transport (since 2014), agriculture (2013), water and
sanitation (2012 and 2015) and monitoring and statistics (2014 and 2015).
39. Country dialogue is carried out at various levels of Government. The CP Group leads the
high-level dialogue with Government. The Bank, through the Resident Representative, the Country
Programme Officer and the Country Economist, engage with Government, particularly the Ministry
of Finance, Ministry of Planning, and the Bank of Zambia, at relevant entry points. Sector staff are in
regular contact with their counterparts and participate in the activities of various sector working groups.
40. Development aid from traditional bilateral donors is declining. Over the past 15 years
development aid has fallen from 23 to 4% of GNI. In 2015, total bilateral aid fell to USD 572
million while multilateral aid amounted to USD 311 million. About 4/5 of aid ends in health and
social sectors. The waning development assistance is being filled by increased foreign direct
investment and by accessing international credit markets. Emerging development partners from
China and South Africa (i.e. DBSA) are increasing support.
3.3. Challenges and Opportunities
41. The main challenges stem from the infrastructure gaps that remain in transport, energy, and
water and sanitation. These sectors are key enablers for private sector and human development.
Keeping up with the growing demand for electricity is crucial to avoid load shedding. Other
challenges stem from limited diversification and the high dependence on copper. Growing demand
in domestic and regional markets offer opportunities in agriculture and manufacturing, but limited
policy consistency and coordination have led to private sector uncertainty, reducing potential
investment and growth. The private sector regulatory framework is therefore a crucial component
that must be accommodative to attract investors and support local businesses, benefiting employment
generation and consumers. Skilled and qualified labor are key to promote innovation, increase
productivity, and improve efficiency in production and business.
Challenges and Weaknesses
42. Infrastructure deficits increase business costs and lower the quality of services. The high
cost of transport and demanding non-tariff trade barriers reduces the potential of regional trade. The
limited maintenance and poor quality of roads has increased the cost of transport to as much as 40%
of the value of goods. It is estimated that 87% of trunk roads are in good condition compared to less
than 10% of feeder roads. One stop border posts support the flow of goods, but non-tariff trade
barriers still increases trade costs. Competitive and efficient transport corridors are critical to
growing the economy. Limited investment in electricity infrastructure affected power supply in 2015
and 2016 impacting business. An inefficiently performing utility, energy tariffs set below the cost of
supply, and scarce reforms has led to underinvestment in the sector. Sustainable service delivery and
reliability of water supply and sanitation is affected by deteriorating infrastructure. Pressure on
access to water and sanitation will continue to grow due to urbanization and unplanned expansion
of peri-urban areas. Maintaining existing infrastructure and enhancing management, project
appraisal, and planning are critical skills for developing future quality infrastructure.
8
43. High dependency on copper for export earnings increases vulnerability to commodity
shocks. The country remains highly dependent on copper earnings for 60-70% of its foreign currency
reserves. When copper prices slump this increases the risk of macro-economic instability. Although
non-traditional exports have grown in the past few years there is need to diversify and expand the
production base of the economy while increasing the basket of goods that can be exported.
44. Policy uncertainty and predictability lowers appetite for investment and private sector
expansion. Red tape, bureaucratic procedures, limited information of licensing requirements in
certain industries, low government capacity and service mindedness, low entrepreneurship capacity
and access to information on market conditions, and high interest rates constrains private sector
development. Cumbersome licensing and inspection procedures adds to company costs while
smaller businesses often can’t attain compliance with regulations due to the lack of capacity and
knowledge of the regulations. Policies and regulations are often prepared without private sector
consultation leading to suboptimal outcomes. Although private sector reforms are on-going
implementation is often constrained by insufficient resources, weak capacity and inadequate inter-
ministerial coordination. A predictable business environment with access to market information will
increase investment and boost private sector activity creating (formal) jobs.
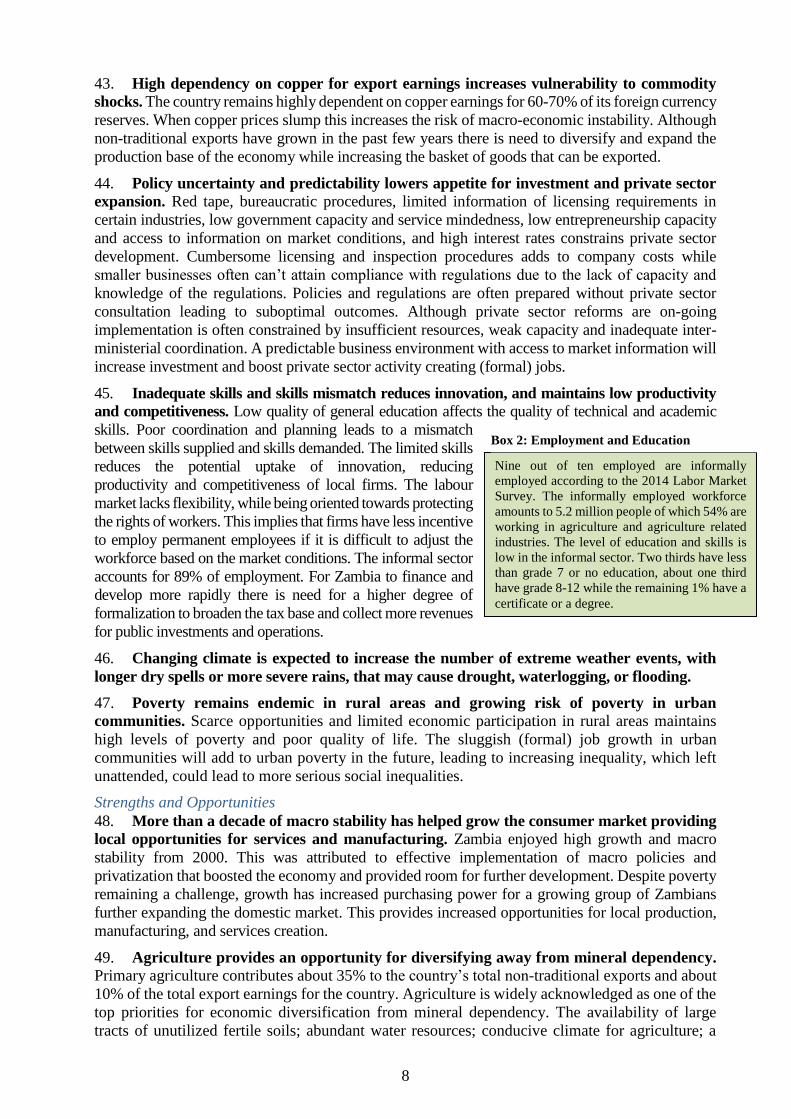
45. Inadequate skills and skills mismatch reduces innovation, and maintains low productivity
and competitiveness. Low quality of general education affects the quality of technical and academic
skills. Poor coordination and planning leads to a mismatch
between skills supplied and skills demanded. The limited skills
reduces the potential uptake of innovation, reducing
productivity and competitiveness of local firms. The labour
market lacks flexibility, while being oriented towards protecting
the rights of workers. This implies that firms have less incentive
to employ permanent employees if it is difficult to adjust the
workforce based on the market conditions. The informal sector
accounts for 89% of employment. For Zambia to finance and
develop more rapidly there is need for a higher degree of
formalization to broaden the tax base and collect more revenues
for public investments and operations.
46. Changing climate is expected to increase the number of extreme weather events, with
longer dry spells or more severe rains, that may cause drought, waterlogging, or flooding.
47. Poverty remains endemic in rural areas and growing risk of poverty in urban
communities. Scarce opportunities and limited economic participation in rural areas maintains
high levels of poverty and poor quality of life. The sluggish (formal) job growth in urban
communities will add to urban poverty in the future, leading to increasing inequality, which left
unattended, could lead to more serious social inequalities.
Strengths and Opportunities
48. More than a decade of macro stability has helped grow the consumer market providing
local opportunities for services and manufacturing. Zambia enjoyed high growth and macro
stability from 2000. This was attributed to effective implementation of macro policies and
privatization that boosted the economy and provided room for further development. Despite poverty
remaining a challenge, growth has increased purchasing power for a growing group of Zambians
further expanding the domestic market. This provides increased opportunities for local production,
manufacturing, and services creation.
49. Agriculture provides an opportunity for diversifying away from mineral dependency.
Primary agriculture contributes about 35% to the country’s total non-traditional exports and about
10% of the total export earnings for the country. Agriculture is widely acknowledged as one of the
top priorities for economic diversification from mineral dependency. The availability of large
tracts of unutilized fertile soils; abundant water resources; conducive climate for agriculture; a
Nine out of ten employed are informally
employed according to the 2014 Labor Market
Survey. The informally employed workforce
amounts to 5.2 million people of which 54% are
working in agriculture and agriculture related
industries. The level of education and skills is
low in the informal sector. Two thirds have less
than grade 7 or no education, about one third
have grade 8-12 while the remaining 1% have a
certificate or a degree.
Box 2: Employment and Education
9
large pool of underemployed; and potential markets for agricultural produce within the Southern
Africa region offers the best opportunities for increasing production and value addition.
50. Robust financial sector offers opportunities for further development. The financial sector
has shown strong growth in recent years and has been able to consolidate its capital base and
strengthen its loan portfolio, despite 2016 proving a difficult year for the sector with high interest
rates and growing non-performing loans. The sector is still considered small serving mainly larger
urban markets. There are opportunities to grow and extend the coverage to the large underserved
rural and peri-urban populations that don’t have access to formal and informal financial services.
51. Strategic geographic position offers a gateway to neighbouring countries. Zambia lies in
the heartland of Southern Africa bordering eight countries. Half of the 18 transport corridors in the
sub-region traverse through the country. This provides opportunities to become a regional
manufacturing and trade hub. Particularly DR Congo offers opportunities for trading agricultural
products while the Lake Tanganyika corridor provides direct access to the Great Lakes Region.
52. Zambia could be a regional electricity exporter. Untapped hydropower and renewable
energy potential amounting to more than 4,000 MW could be developed and added to the export
portfolio. This would help diversify the economy and increase foreign currency receipts.
3.4. Country Portfolio Performance Review
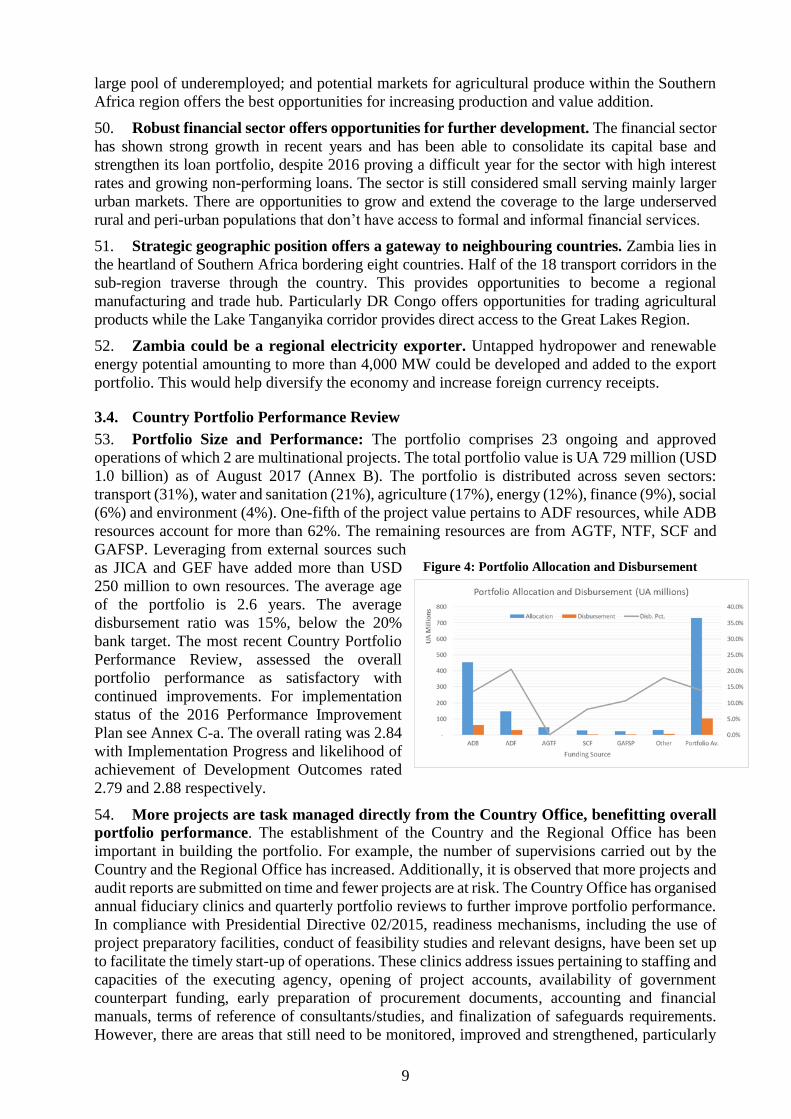
53. Portfolio Size and Performance: The portfolio comprises 23 ongoing and approved
operations of which 2 are multinational projects. The total portfolio value is UA 729 million (USD
1.0 billion) as of August 2017 (Annex B). The portfolio is distributed across seven sectors:
transport (31%), water and sanitation (21%), agriculture (17%), energy (12%), finance (9%), social
(6%) and environment (4%). One-fifth of the project value pertains to ADF resources, while ADB
resources account for more than 62%. The remaining resources are from AGTF, NTF, SCF and
GAFSP. Leveraging from external sources such
as JICA and GEF have added more than USD
250 million to own resources. The average age
of the portfolio is 2.6 years. The average
disbursement ratio was 15%, below the 20%
bank target. The most recent Country Portfolio
Performance Review, assessed the overall
portfolio performance as satisfactory with
continued improvements. For implementation
status of the 2016 Performance Improvement
Plan see Annex C-a. The overall rating was 2.84
with Implementation Progress and likelihood of
achievement of Development Outcomes rated
2.79 and 2.88 respectively.
54. More projects are task managed directly from the Country Office, benefitting overall
portfolio performance. The establishment of the Country and the Regional Office has been
important in building the portfolio. For example, the number of supervisions carried out by the
Country and the Regional Office has increased. Additionally, it is observed that more projects and
audit reports are submitted on time and fewer projects are at risk. The Country Office has organised
annual fiduciary clinics and quarterly portfolio reviews to further improve portfolio performance.
In compliance with Presidential Directive 02/2015, readiness mechanisms, including the use of
project preparatory facilities, conduct of feasibility studies and relevant designs, have been set up
to facilitate the timely start-up of operations. These clinics address issues pertaining to staffing and
capacities of the executing agency, opening of project accounts, availability of government
counterpart funding, early preparation of procurement documents, accounting and financial
manuals, terms of reference of consultants/studies, and finalization of safeguards requirements.
However, there are areas that still need to be monitored, improved and strengthened, particularly
Figure 4: Portfolio Allocation and Disbursement
10
reducing start-up delays by addressing quality-at-entry issues. The 2017 Portfolio Improvement
Plan is included in Annex C-b.
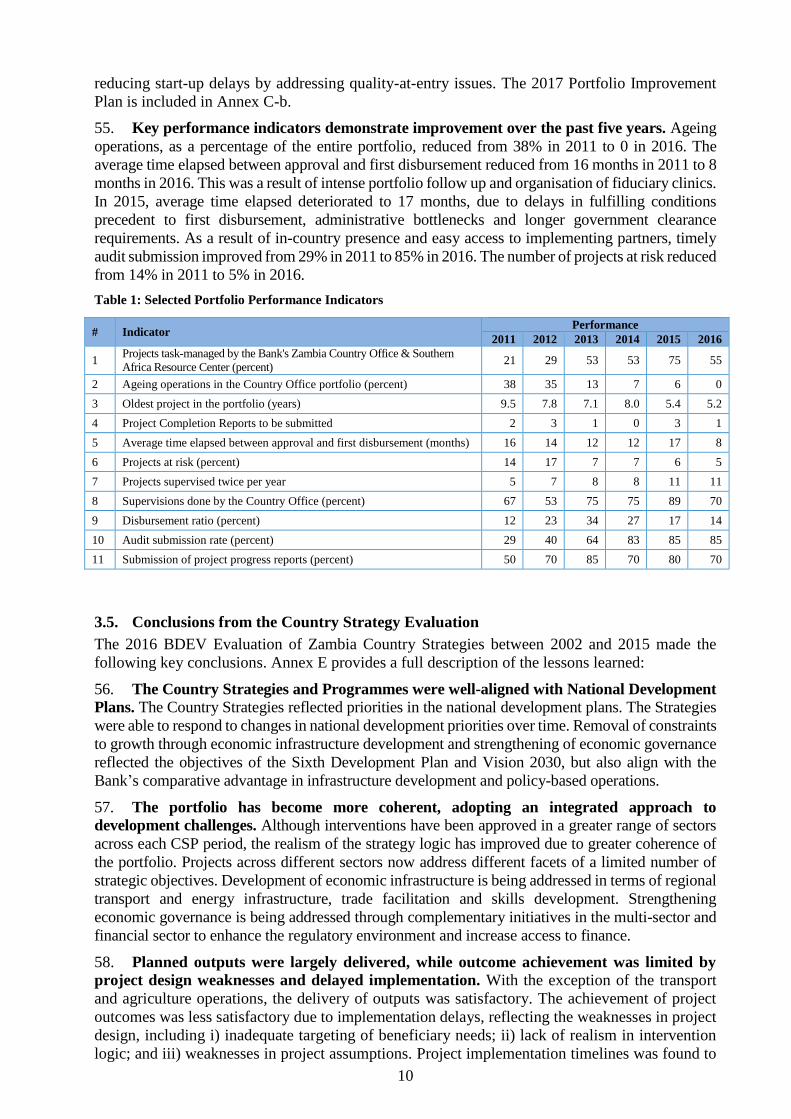
55. Key performance indicators demonstrate improvement over the past five years. Ageing
operations, as a percentage of the entire portfolio, reduced from 38% in 2011 to 0 in 2016. The
average time elapsed between approval and first disbursement reduced from 16 months in 2011 to 8
months in 2016. This was a result of intense portfolio follow up and organisation of fiduciary clinics.
In 2015, average time elapsed deteriorated to 17 months, due to delays in fulfilling conditions
precedent to first disbursement, administrative bottlenecks and longer government clearance
requirements. As a result of in-country presence and easy access to implementing partners, timely
audit submission improved from 29% in 2011 to 85% in 2016. The number of projects at risk reduced
from 14% in 2011 to 5% in 2016.
Table 1: Selected Portfolio Performance Indicators
3.5. Conclusions from the Country Strategy Evaluation
The 2016 BDEV Evaluation of Zambia Country Strategies between 2002 and 2015 made the
following key conclusions. Annex E provides a full description of the lessons learned:
56. The Country Strategies and Programmes were well-aligned with National Development
Plans. The Country Strategies reflected priorities in the national development plans. The Strategies
were able to respond to changes in national development priorities over time. Removal of constraints
to growth through economic infrastructure development and strengthening of economic governance
reflected the objectives of the Sixth Development Plan and Vision 2030, but also align with the
Bank’s comparative advantage in infrastructure development and policy-based operations.
57. The portfolio has become more coherent, adopting an integrated approach to
development challenges. Although interventions have been approved in a greater range of sectors
across each CSP period, the realism of the strategy logic has improved due to greater coherence of
the portfolio. Projects across different sectors now address different facets of a limited number of
strategic objectives. Development of economic infrastructure is being addressed in terms of regional
transport and energy infrastructure, trade facilitation and skills development. Strengthening
economic governance is being addressed through complementary initiatives in the multi-sector and
financial sector to enhance the regulatory environment and increase access to finance.
58. Planned outputs were largely delivered, while outcome achievement was limited by
project design weaknesses and delayed implementation. With the exception of the transport
and agriculture operations, the delivery of outputs was satisfactory. The achievement of project
outcomes was less satisfactory due to implementation delays, reflecting the weaknesses in project
design, including i) inadequate targeting of beneficiary needs; ii) lack of realism in intervention
logic; and iii) weaknesses in project assumptions. Project implementation timelines was found to
# Indicator Performance
2011 2012 2013 2014 2015 2016
1 Projects task-managed by the Bank's Zambia Country Office & Southern
Africa Resource Center (percent) 21 29 53 53 75 55
2 Ageing operations in the Country Office portfolio (percent) 38 35 13 7 6 0
3 Oldest project in the portfolio (years) 9.5 7.8 7.1 8.0 5.4 5.2
4 Project Completion Reports to be submitted 2 3 1 0 3 1
5 Average time elapsed between approval and first disbursement (months) 16 14 12 12 17 8
6 Projects at risk (percent) 14 17 7 7 6 5
7 Projects supervised twice per year 5 7 8 8 11 11
8 Supervisions done by the Country Office (percent) 67 53 75 75 89 70
9 Disbursement ratio (percent) 12 23 34 27 17 14
10 Audit submission rate (percent) 29 40 64 83 85 85
11 Submission of project progress reports (percent) 50 70 85 70 80 70
11
be unsatisfactory across all sectors. Progress was made in addressing delays to loan effectiveness
and first disbursement, while challenges arising from multiparty co-financing arrangements was
affected by the need to harmonise terms, conditions and procurement arrangements.
59. The Bank contributed to increasing access to basic services and improving the business
environment while opportunities for upscaling private investment were not leveraged. At the
country level, the Bank contributed to improving access to basic services, including water, sanitation,
power and health. In contrast, efforts to strengthen public financial management were less successful.
Notably, these gains were not only the result of direct investments in each sector. Increased access
to services and business development also resulted from large private sector investments. However,
opportunities to complement and upscale these private investments were not pursued.
60. Political and governance risks are increasingly important factors in the sustainability
of projects. These risks include regulatory changes implemented without consultation,
irregularities in procurement, and lack of political will to address inadequate tariff regimes. For
example, the sustainability of lines of credit projects were limited by the introduction of interest
rate caps and increased capital reserve requirements. Investments in utilities face challenges due
to the absence of cost-reflective tariffs.
61. Activities attempted to promote inclusive and green growth, while opportunities to
mainstream gender were not fully leveraged. Projects attempted to promote sustainable
investment as well as reduce disparities between urban and rural areas. However, opportunities were
not always leveraged to generate business development and employment opportunities for women.
Lines of credit and agriculture projects demonstrated that such initiatives should be supported by
targeted project interventions. More could also be done to promote direct employment opportunities
for women within infrastructure and industrial projects.
3.6. Lessons Learned
The lessons learned from previous CSPs have been taken into account in this Strategy and will be
carefully considered in all future operations.
Quality-at-Entry and Start-up Delays
62. Requiring preconditions to be met at pre-appraisal instead of creating conditions
precedent will reduce start-up delays: Attaining conditions precedent posed difficulties for some
projects, resulting in significant delays. This was often due to requirements about certain
regulations and/or studies to be carried out. The Bank now aims to address difficult preconditions
at an early stage as part of the pre-appraisal process, before Board approval, thereby reducing
delays. Most public sector operations also have simplified conditions precedent to first
disbursement, but meeting conditions precedent to effectiveness are still delayed from the side of
Government. The actions are in line with the Presidential Directive 02/2015.
63. Early sensitisation and conditional approval by authorities could help reduce start-up
delays: Critical delay factors relate to government policy requiring approval by cabinet, parliament
and attorney general before a loan agreement can be signed. To reduce delays, the Country Office
will start early sensitisation of approving authorities concerning project objectives, components,
cost/loan size and financing terms. Early sensitisation will entail obtaining approval from all relevant
authorities of the negotiated and initialled loan agreement prior to submitting a project to the Board.
64. Encourage task managers to use existing facilities to initiate pre-feasibility studies,
early procurement preparation, to help reduce start-up delays: The Bank has at its disposal
various trust funds and project preparation facilities that should be used more systematically to
initiate pre-feasibility, feasibility, design, and procurement preparation. This will contribute to
quicker start-up of operations and reduce delays related to procurement, disbursement, etc.
Implementation capacity and monitoring
65. Continue to support project implementation, monitoring and evaluation capacity
through training: As part of the measures to improve project implementation capacity, the Bank

12
should on a continuous basis organise project implementation training workshops in the areas of
procurement processing, familiarisation of standard bidding documents, setting up monitoring and
evaluation information systems, and contract and disbursement management. The Country Office
will continue to assist project accountants and procurement officers to identify implementation
issues as soon as they arise. Project staff will receive refresher training on the progress reporting
system in order to track outputs and outcome indicators, and assess performance in relation to
annual targets for disbursement and procurement.
Results Framework
66. Clear formulation of strategic objectives to strengthen indicator linkage and
measurability: A clear theory of change and results matrix will improve the linkage between the
Bank’s overall Strategy with that of the National Development Plans. Some objectives in the results
framework were too narrowly defined while indicators were vaguely specified and did not provide
adequate information on what was measured. The design of the Results Based Framework (Annex
A) has been improved through better formulation of strategic objectives and outcomes.
Bank Presence
67. The Bank’s physical presence in Zambia has made it possible to strengthen
relationships and enhance policy dialogue: The in-country presence has provided visibility,
direct and quick access to the government, cooperating partners, and the private sector. It has also
strengthened the relationship with Government and improved policy dialogue. Furthermore, it has
enabled building local networks and expanding the portfolio while leveraging finance from
development partners. The Bank will continue to strengthen its local presence and build capacity
to provide implementation support and supervision of Bank funded operations.
4. BANK GROUP STRATEGY FOR THE COUNTRY
This section provides the rationale for the selection of pillars based on selectivity criteria agreed with
the government. The section also outlines the Country Strategy’s objectives and outcomes
established for the next five years, and discusses the two selected pillars including the Banks
deliverables. Finally, the section provides an overview of the non-lending activities, the financing of
the Strategy, monitoring and evaluation, policy dialogue and the implementation risks.
4.1. Rationale and Strategic Selectivity
68. The design of the Country Strategy and
the overall results framework was based on a
set of alignment and selectivity criteria, Box 3.
In order to leave a visible footprint and avoid
spreading resources to thinly the focus was on a
few key sectors to ensure high development
impact, while retaining flexibility given Zambia’s
MIC status. The proposed pillars and strategic
objectives are the result of efforts by the
Government and the Bank to pursue a deeper
partnership between 2017 and 2021 and to support
Zambia’s aspirations under its NDP. A Country
Strategy Dialogue Mission took place from 23 to
27 January 2017 to validate the Strategic Approach. The selected pillars and sectors considered
for support, the key government policies, sector challenges and opportunities were discussed
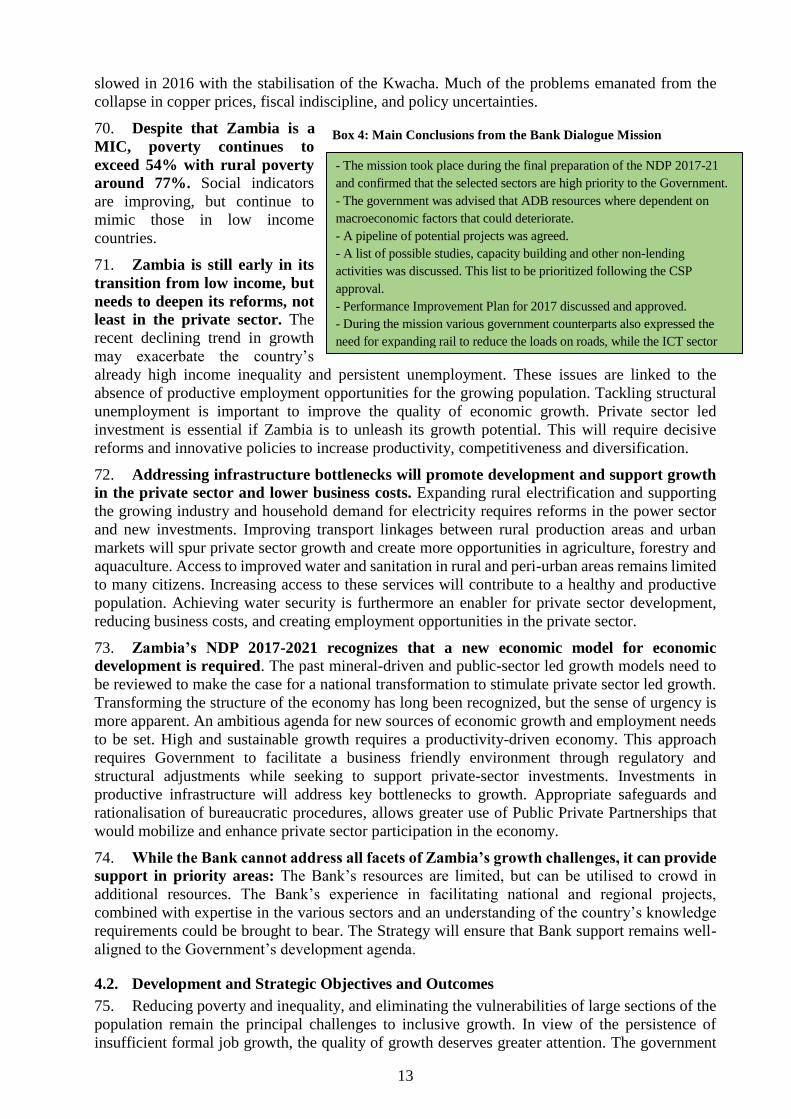
during the mission. The main conclusions are summarised in Box 4, below.
69. Maintaining strong growth has been a challenge in recent years. The Zambian economy
is struggling in the aftermath of a collapse in copper prices and electricity shortages. Investor
confidence has been hit hard as a result. The exchange rate depreciated sharply, inflation soared,
the fiscal deficit widened, and public debt rose rapidly in 2014 and 2015. The increase in debt
The following criteria were applied in designing the
Strategy and selecting priorities:
- Country priority and continuation of current support,
- Utilise the Banks comparative advantage in
infrastructure development, while seeking opportunities
for partnerships,
- Synergies between national projects and those in
neighbouring countries,
- Complies with the division of labour, and
- Complies with the Bank’s strategy and priorities (Ten-
Year Strategy and High-5s)
Box 3: Alignment and Selectivity Criteria
13
slowed in 2016 with the stabilisation of the Kwacha. Much of the problems emanated from the
collapse in copper prices, fiscal indiscipline, and policy uncertainties.
70. Despite that Zambia is a
MIC, poverty continues to
exceed 54% with rural poverty
around 77%. Social indicators
are improving, but continue to
mimic those in low income
countries.
71. Zambia is still early in its
transition from low income, but
needs to deepen its reforms, not
least in the private sector. The
recent declining trend in growth
may exacerbate the country’s
already high income inequality and persistent unemployment. These issues are linked to the
absence of productive employment opportunities for the growing population. Tackling structural
unemployment is important to improve the quality of economic growth. Private sector led
investment is essential if Zambia is to unleash its growth potential. This will require decisive
reforms and innovative policies to increase productivity, competitiveness and diversification.
72. Addressing infrastructure bottlenecks will promote development and support growth
in the private sector and lower business costs. Expanding rural electrification and supporting
the growing industry and household demand for electricity requires reforms in the power sector
and new investments. Improving transport linkages between rural production areas and urban
markets will spur private sector growth and create more opportunities in agriculture, forestry and
aquaculture. Access to improved water and sanitation in rural and peri-urban areas remains limited
to many citizens. Increasing access to these services will contribute to a healthy and productive
population. Achieving water security is furthermore an enabler for private sector development,
reducing business costs, and creating employment opportunities in the private sector.
73. Zambia’s NDP 2017-2021 recognizes that a new economic model for economic
development is required. The past mineral-driven and public-sector led growth models need to
be reviewed to make the case for a national transformation to stimulate private sector led growth.
Transforming the structure of the economy has long been recognized, but the sense of urgency is
more apparent. An ambitious agenda for new sources of economic growth and employment needs
to be set. High and sustainable growth requires a productivity-driven economy. This approach
requires Government to facilitate a business friendly environment through regulatory and
structural adjustments while seeking to support private-sector investments. Investments in
productive infrastructure will address key bottlenecks to growth. Appropriate safeguards and
rationalisation of bureaucratic procedures, allows greater use of Public Private Partnerships that
would mobilize and enhance private sector participation in the economy.
74. While the Bank cannot address all facets of Zambia’s growth challenges, it can provide
support in priority areas: The Bank’s resources are limited, but can be utilised to crowd in
additional resources. The Bank’s experience in facilitating national and regional projects,
combined with expertise in the various sectors and an understanding of the country’s knowledge
requirements could be brought to bear. The Strategy will ensure that Bank support remains well-
aligned to the Government’s development agenda.
4.2. Development and Strategic Objectives and Outcomes
75. Reducing poverty and inequality, and eliminating the vulnerabilities of large sections of the
population remain the principal challenges to inclusive growth. In view of the persistence of
insufficient formal job growth, the quality of growth deserves greater attention. The government
- The mission took place during the final preparation of the NDP 2017-21
and confirmed that the selected sectors are high priority to the Government.
- The government was advised that ADB resources where dependent on
macroeconomic factors that could deteriorate.
- A pipeline of potential projects was agreed.
- A list of possible studies, capacity building and other non-lending
activities was discussed. This list to be prioritized following the CSP
approval.
- Performance Improvement Plan for 2017 discussed and approved.
- During the mission various government counterparts also expressed the
need for expanding rail to reduce the loads on roads, while the ICT sector
proposed a need for carrying out a situation analysis of the telecoms sector.
Box 4: Main Conclusions from the Bank Dialogue Mission
14
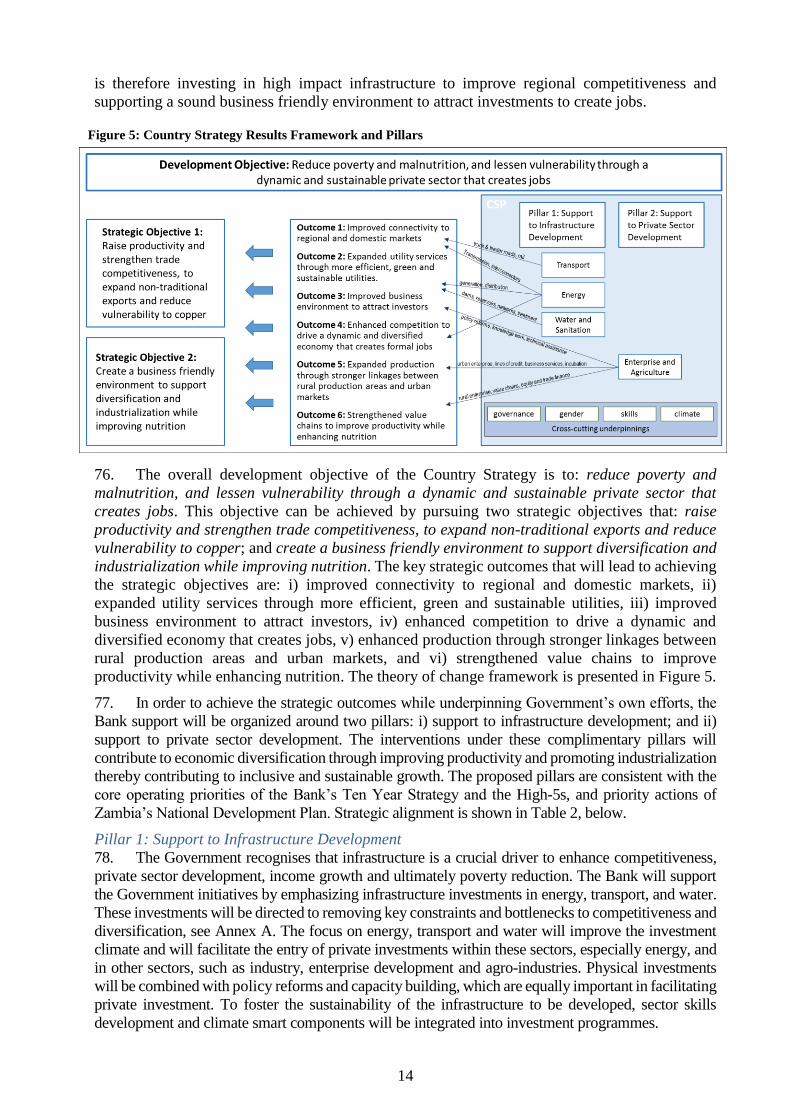
is therefore investing in high impact infrastructure to improve regional competitiveness and
supporting a sound business friendly environment to attract investments to create jobs.
76. The overall development objective of the Country Strategy is to: reduce poverty and
malnutrition, and lessen vulnerability through a dynamic and sustainable private sector that
creates jobs. This objective can be achieved by pursuing two strategic objectives that: raise
productivity and strengthen trade competitiveness, to expand non-traditional exports and reduce
vulnerability to copper; and create a business friendly environment to support diversification and
industrialization while improving nutrition. The key strategic outcomes that will lead to achieving
the strategic objectives are: i) improved connectivity to regional and domestic markets, ii)
expanded utility services through more efficient, green and sustainable utilities, iii) improved
business environment to attract investors, iv) enhanced competition to drive a dynamic and
diversified economy that creates jobs, v) enhanced production through stronger linkages between
rural production areas and urban markets, and vi) strengthened value chains to improve
productivity while enhancing nutrition. The theory of change framework is presented in Figure 5.
77. In order to achieve the strategic outcomes while underpinning Government’s own efforts, the
Bank support will be organized around two pillars: i) support to infrastructure development; and ii)
support to private sector development. The interventions under these complimentary pillars will
contribute to economic diversification through improving productivity and promoting industrialization
thereby contributing to inclusive and sustainable growth. The proposed pillars are consistent with the
core operating priorities of the Bank’s Ten Year Strategy and the High-5s, and priority actions of
Zambia’s National Development Plan. Strategic alignment is shown in Table 2, below.
Pillar 1: Support to Infrastructure Development
78. The Government recognises that infrastructure is a crucial driver to enhance competitiveness,
private sector development, income growth and ultimately poverty reduction. The Bank will support
the Government initiatives by emphasizing infrastructure investments in energy, transport, and water.
These investments will be directed to removing key constraints and bottlenecks to competitiveness and
diversification, see Annex A. The focus on energy, transport and water will improve the investment
climate and will facilitate the entry of private investments within these sectors, especially energy, and
in other sectors, such as industry, enterprise development and agro-industries. Physical investments
will be combined with policy reforms and capacity building, which are equally important in facilitating
private investment. To foster the sustainability of the infrastructure to be developed, sector skills
development and climate smart components will be integrated into investment programmes.
Figure 5: Country Strategy Results Framework and Pillars

15
Energy: The absence of stable, reliable and adequate power supply is the most severe infrastructure
constraint affecting economic development. Private investors and development partners have been
hesitant to invest in the sector for several reasons, including the absence of institutional
arrangements to mobilize private sector, low electricity tariffs that do not reflect costs, a financially
stressed public sector utility, and inadequate human resource capacity.
In pursuance of economic diversification Zambia has large and unexploited hydropower potential.
Given the region’s recent electricity supply deficits, Zambia has the potential to export clean
electricity if harnessed. Responding to the need of expanding electricity supply, the Bank will
support the government’s priority of ensuring availability of sufficient and affordable energy with
a view to enhancing competitiveness and efficiency. Reliable energy supply will promote
industrialisation that in turn will lead to more employment. Increased energy supply will also
create opportunities for energy export through the Southern Africa Power Pool. To support the
government achieve its energy goals, and in line with Light-up and Power Africa and the New
Deal on Energy, the Bank will operationalise this sector through investment operations (including
in IPPs), policy advisory services and sector reforms to: i) improve access to electricity in urban
and rural areas (off-grid and mini-grids will also be considered); ii) increase energy efficiency; iii)
support clean power development; iv) facilitate regional cooperation and integration; v) strengthen
utilities, sector governance and financial restructuring; and vi) promote private sector participation.
The Bank will work on both supply and demand sides. The Bank will promote Public Private
Partnerships for renewable energy generation and distribution to supplement scarce public resources.
Transport: The Government recognises the role transport infrastructure plays as a catalyst to
economic development. Government priorities are driven by improving connectivity, with emphasis
being placed on rural (national) connectivity to complement the gains in regional connectivity.
Transport faces various challenges which have driven the effort of transforming the transport
network to a land-linked country that is now being complemented with promoting rural connectivity.
There is also need for a more balanced shift between road and railway for the transportation of bulk
cargo and container traffic. Critical points in addressing the imbalance would be to make rail more
competitive through the provision of an efficient and attractive service. This would entail
rehabilitating rail infrastructure to promote increased operating speeds (and capacity) and addressing
rolling stock constraints. The Bank shall exercise selectivity in the support to the sector, emphasizing
key road corridors, but also retaining flexibility to partner in critical sub-sectors to maximize the
Table 2: Country Strategy Alignment with National Development Plan, 10-Year Strategy, and High 5s
National Vision and National Development Plan TYS High-5s Country Strategy
Promote employment and job creation through targeted and
strategic investments in selected sectors:
Economic diversification (industry widening, crop,
livestock and forestry diversification)
SME promotion
Private sector reforms
Financial sector development
Skills upgrading
Private Sector
Development
Industrialize
Africa
Pillar 2: Support to Private Sector
Development – create a business
friendly environment to support
diversification
Agriculture
Enterprise Development
Promote rural development through agri-development, rural
enterprises and rural infrastructure
Decentralisation
Financial sector development
Agriculture and
Food security
Feed Africa
Enhance human development by investing in social sectors
Invest in science, technology and innovation
Skills and
Technology
Quality of Life
Accelerate infrastructure development
Transport (Roads, Rail, Ports, Airports, OSBP)
Energy
Water and Sanitation
Infrastructure
Development
and Regional
Integration
Integrate Africa,
Light up and
Power Africa,
Quality of Life
Pillar 1: Support to Infrastructure
Development – raise productivity
and strengthen trade competitiveness
Transport
Water and Sanitation
Energy

16
dividends of enhancing productivity, competitiveness, diversification, and promoting economic
growth and development. The Bank support will promote regional integration efforts while linking
rural production areas with urban markets. The Bank will operationalise this sector through i)
rehabilitating and expanding infrastructure networks, ii) strengthening institutions and institutional
capacity in the transport sector, and iii) facilitating trade and transport development. In line with the
government’s draft transport policy, the Bank will also support an enabling environment to promote
increased modal share for rail. The Bank will therefore explore support to the railways and the
promotion of urban transport interventions.
Water and sanitation: Government acknowledges the importance of ensuring adequate water
supply and improved sanitation services. Achieving water security will enable the development of
business and industry, and contribute to generating employment opportunities. Access to clean water
and improved sanitation will also contribute to ensuring a healthy population while reducing
malnutrition. The sector is characterised by significant inequality in access to water and sanitation
services between rural and urban households. Urban households have better access to potable water
and sanitation services. Ineffective operation and maintenance systems affecting aged and
dilapidated infrastructure, high non-revenue water, and tariffs that do not cover the cost of utility
operation, hamper the operations and expansion of utilities. Other important aspects include
insufficient water (national and transboundary) resources management to ensure enough water for
human consumption, irrigation and agricultural development, industry and eco-system health. The
Bank’s support will therefore aim to utilize the huge potential in water resources, increase sustainable
access to safe water supply and improved sanitation, reduce pollution, and improve public health.
Specifically, the Bank will invest to: i) rehabilitate, expand and construct new water supply and
sanitation systems, ii) strengthen water resources management, iii) construct climate resilient small
and medium multipurpose surface water storage dams and reservoirs to mitigate effects of drought,
iv) address impacts of climate change by increasing the resilience of communities coupled with
adaptive capacity building, v) improve water usage for irrigation to boost agricultural productivity
and generate rural employment opportunities, and vi) support sector agencies and public utility
companies to ensure sustainable service provision. The Bank programs will be gender responsive
and will promote equitable access to and management of safe and adequate water for domestic
supply, sanitation, food security and environmental sustainability. The Banks investments in the
sector will take into account the government priorities and the High-5 priority of improving the
Quality of Lives of Zambians.
Pillar II: Private Sector Development
79. Economic rebalancing would benefit from greater private sector participation in the economy.
In addition to providing adequate basic infrastructure, the Government acknowledges the need to
create a sound regulatory environment that is open for business, and to partner with the private sector
to develop the requisite skills to meet their demands. This calls for policies and strategies geared
towards strengthening Zambia’s competitiveness and ensuring favourable conditions are in place for
private sector development to augment its position as an investment destination. The development
of agriculture (crops, livestock, fisheries and forestry), which is the source of livelihood for over
60% of the population, is considered a national development priority. The agriculture sector is seen
as a key driver in fighting poverty, creating jobs, enhancing inclusive growth, addressing issues of
climate change and malnutrition, as well as a vehicle for diversifying the copper-dependent
economy. In line with the provisions of the Feed and Industrialize Africa priorities, the Bank, will
continue to support agriculture while strengthening support to private sector development.
Enterprise Development: The Bank’s private sector operations will be integral to the Country
Strategy and important in promoting private sector engagement in the development process. The
private sector plays a key role in the economy, and can finance Zambia’s significant development
needs, including infrastructure and social services. To ensure that the private sector plays a leading
role in achieving economic growth targets, jobs creation and efficient allocation of resources, the
Country Strategy will attempt to address policy reforms to remove impediments to private
investment such as reducing bureaucracy, streamlining licensing procedures, enhancing service

17
orientation, increasing access to market information, and easing access to work permits for
investors. The support will include improvements in the business enabling environment, trade
competitiveness, and capacity building to promote bankable Public-Private Partnerships. Given
the untapped potential for Public Private Partnerships in several sectors the Bank will support the
introduction of the required facilitating policy, legal, and institutional regimes, improving the
toolkits on public private partnerships while also improving technical capacity. By promoting a
stronger commercial orientation, the Bank will enhance the ability of local private enterprises to
take advantage of regional market opportunities. The Bank will also accelerate efforts to finance
infrastructure with private sector participation, mobilize commercial co-financing, and facilitate
credit enhancement. The Banks private sector operations will support financial sector development
and broad economic growth. One area will be support to micro, small and medium sized enterprise
development through the provision of credit lines and other relevant Bank instruments to the
financial sector. The Bank will also strengthen capacity development in the financial sector
through targeted technical assistance. Finally, the Bank will support Zambia to develop an efficient
transit transport system in co-operation with its neighbors to facilitate more competitiveness and
trade.
Agriculture: The Bank support to agriculture will be private sector oriented, with the public sector
providing public goods and the enabling environment. Key interventions will aim at addressing
issues along selected value chains to enhance productivity and production, while supporting the
establishment of rural agricultural enterprises to drive growth, create jobs for women and youth,
improve the rural economy, and increase the share of agricultural contribution to the national
economy. The Bank will formulate investment operations to support specific value chains while
addressing the challenges of infrastructure development, capacity building, provision of matching
grants, de-risking facilities, access to credit and markets, and improving policy and regulatory
environment for small and medium scale farmers. The Bank will encourage and support established
agribusiness actors to provide marketing linkages and mentorship to smallholder farmers through
out-grower contracts wherever possible, as a means of stimulating entrepreneurship amongst the
smallholder and younger farmers. In the area of climate change mitigation and adaptation, the Bank,
with partners, will continue to support the development and resource mobilization for the National
REDD Strategy Investment Plan, the Forestry Investment Program, and digitalization of soil and
crop suitability maps for increased productivity.
The main deliverables and sector specific constraints are incorporated in the Results Based
Framework in Annex A, including the sector outcomes, outputs and group interventions.
Cross-cutting themes
80. The preparation of projects will require screening and review of cross-cutting themes in
project design. The Country Strategy will focus on cross-cutting areas that can be categorized in the
following four themes: Gender; Climate; Skills and Technology; and Economic and Governance
Reforms. When preparing projects each of these areas will be screened, reviewed and taken into
account in the design. Some areas will be more relevant for some operations than others. For example
when constructing a road it is important to consider potential climate effects (heavy rains and
flooding) on the sustainability of the road. When considering the location of a dam it is also important
to consider climate, the potential effects of multiyear droughts and other environmental effects. The
Government has taken several actions to embed climate change in national policies and
development plans. In 2016 the National Policy on Climate Change was adopted. Zambia is also
signatory to the Paris Agreement on Climate Change that was ratified in 2016. Skills and
technology transfer will be especially important in projects supporting private sector development.
Building capacity in planning, project appraisal, financial management and procurement (fiduciary
clinics), and social and safeguards clinics will also be considered. Sector specific governance
reforms and improvement in public financial management will be integrated considerations in policy
based operations, but will also be reviewed in project operations.
81. Economic and Governance issues are key areas that will continue to be supported. The
Bank will continue to work with the Government and CPs to enhance fiduciary management and
18
country procurement reforms to address identified risks in PFM and procurement (Annex K).
Furthermore the Bank will provide capacity building to the Zambia Public Procurement Authority as
indicated in Annex E. The Bank’s intervention to support PFM and procurement reforms will be in the
form of a specific governance operation or dedicated component within a larger project depending on
the issues to be addressed. The aim of supporting PFM and procurement will be to reduce fiduciary
risks and accelerate the gradual use of country systems.
82. Gender will receive specific attention in future project design. Mainstreaming gender is an
essential aspect of quality-at-entry. Project-specific gender action plans will support women’s
participation and access to benefits in Bank-funded projects. The Bank will target gender equity at
all stages of support by: i) institutionalizing the use of gender action plans; ii) collecting, analysing,
and reporting more systematically on gender-disaggregated data in sectors of engagement; and iii)
raising gender awareness and building capacity in key executing and implementing agencies for
gender mainstreaming. Integration of gender benchmarking and other gender diagnostics will also
be considered in the non-lending activities. A gender profile and national fragility assessment should
be carefully considered during the first half of the Strategy implementation period.
4.3. Indicative Bank Assistance Programme
83. The 2017-2021 Country Strategy will comprise new operations and several operations that
are carried over from the 2011-15 Strategy, see Annex B. The pipeline of new operations are
presented in the Indicative Operations Program 2017-2019 in Annex D.
4.4. Non-Lending Programme of Activities
84. The Bank will provide capacity development and policy advisory technical assistance in
collaboration with other development partners. Technical assistance will help the government
prepare projects, support project implementation, implement reforms, and strengthen institutional
capacity in line with the Government priorities and the Country Strategy. The Bank will place
greater emphasis on deeper engagement on policy development which will be underpinned by
cutting-edge knowledge work aimed at improving government efficiency and effectiveness. This
will involve stepped-up efforts to deliver high quality policy advice through targeted analytical
and advisory work. A knowledge and advisory programme provided in Annex E will be prioritised
in consultation with the Government soon after approval of the Country Strategy.
85. Knowledge and capacity support: Bank financing will be modest compared to public
spending and private investment requirements. The Bank will therefore seek to enhance the
knowledge value of its lending support by incorporating analytical, advisory, and capacity
development support. Greater emphasis will be given to linking knowledge and finance by
generating and communicating lessons and solutions from the Bank’s operations, and to sharing
global and regional good practices. The Bank will draw on its staff and advisory resources to
respond rapidly to requests for policy advice.
86. Technical support: The Bank will finance country-specific technical assistance that will
support policy reforms and operational activities. Technical assistance will include:
Evidence-based analytical work to inform policy for economic transformation, including
investment promotion and employment generation;
Support efforts to develop an enabling environment to facilitate companies to enter into
regional and international value chains to take advantage of market access opportunities;
Support to operationalize Public Private Partnership Policy including institutional and
technical support, and assessment of the Public Private Partnership environment to help
identify key constraints to private sector participation; and,
Capacity building and training to improve the capacity of project implementation units, and
to strengthen the country’s statistical capacity.

19
4.5. Financing of the Strategy
87. The operational country limits are sufficient to
cover the current pipeline with adequate headroom to
increase activities. The lending capacity is regularly
adjusted based on the macro-framework, country risk, and
country borrowing. The country limits may change in
response to: country rating upgrades/downgrades;
lower/higher country correlations; exposure to
management operations and private sector operations
(diversification); and growth/decline in the Bank’s risk
capital. Zambia continues to benefit from the ADF with an
overall indicative allocation for ADF-14 spanning 2017 to
2019 of USD 26 million. The reduced ADF resources is a
combination of weakening performance based allocations
and the reclassification of Zambia to Blend Status in 2014.
The reclassification has changed the financing mix and
increased ADB resources which have more than covered the shortfall in ADF, see Box 5. The Bank
will also pursue PPPs with the view of drawing in private sector capital.
88. The Bank will draw on a mix of lending and non-lending financial instruments. To effectively
support policy and sector reforms while improving predictability, PBOs will be considered using
multi-year frameworks. These operations will require close cooperation and coordination with the
IMF, the World Bank and other cooperating partners. The annual allocation will also be used to
leverage official and commercial co-financing. The Bank will use its full range of financial instruments
to meet the country’s critical needs without exerting a significant impact on the country’s debt ceiling.
The use of credit enhancement products including guarantees and guarantee syndication, and of loan
syndication products, which can mobilize private sector capital, will be explored when considering
commercial co-financing options. The Bank will also explore the possibility of issuing Kwacha
denominated bonds to support deepening of the financial market. This would help to address the needs
of institutional investors who are not only looking for more Kwacha assets but also longer dated
securities. Finally, where relevant, such as larger infrastructure investments, the Bank will seek joint
financing with MDBs and IFIs as well as bilateral partners.
4.6. Monitoring and Evaluation of Bank Group Operations
89. The results framework in Annex A, was established in consultation with the Government to
ensure alignment with the Seventh National Development Plan 2017-21 and the National
Performance Framework 2017-2030. The results framework takes into account Zambia’s
development aspirations, the operational priorities, key constraints, and expected outputs at midterm
and at Strategy end. The United Nations is providing support to the preparation of the Sustainable
Development Goals and the ensuing indicators. This work will be finalised later in 2017. The
Monitoring and Statistics Working Group, provides support in relation to the development of the
National Development Plan, Living Conditions Surveys, various statistical surveys, and technical
assistance. The Bank supports the Statistics Office in the areas of statistical business registers and
national accounts improvement that will provide baseline data for private sector development.
Support is also provided in the area of industrialization and industrial intelligence. The completion
report is planned for 2021. Based on the outcomes of the 2019 Midterm Review and changes to
government priorities, new sectors such as ICT, will be considered.
90. Strategy implementation is monitored first and foremost by the Country Office with support
from the Regional Office. The relevant Government ministries and agencies will deal with the day-
to-day project monitoring. The capacity to deal with financial management, procurement and
human resource issues requires continuous support. The Bank will therefore ensure that regular
training is an integrated part of each project to provide the necessary skills to the relevant project
staff to help address implementation delays. The Bank will ensure application of Presidential
ADF (limited availability ≈ USD 26 million)
ADB (more than USD 1 billion)
– Public
– Private
Co-Financing (> USD 300 million)
– Africa Growing Together Fund
– Bilaterals (e.g. JICA, SIDA)
– Multilaterals (e.g. EIB, WB, IFC)
– Other co-financing
Trust Funds (≈ USD 5 million)
– MIC TA funds and Project Preparation Facility
– Other funds (KOAFEC, SEFA, AfTRA, etc)
Box 5: Indicative financing for the Country Strategy

20
Directive 02/2015 through advance procurement action, prior appointment of key project
management staff, recourse to the Project Preparation Facility and other available funds.
4.7. Country Dialogue Issues
91. In the course of implementing the Country Strategy, country dialogue will take into account
macroeconomic trends and sector related issues in the context of the National Development Plan
and the Bank’s operational plan. Dialogue will cover: i) macroeconomic, fiscal, and debt
sustainability issues, ii) strategic policy reforms like energy and private sector, and operational
reforms related to governance and accountability, iii) portfolio implementation with the aim to
improve performance and increase disbursements, iv) financial and performance challenges
related to private sector operations, v) performance of country pipeline development to ensure
solid and relevant interventions, vi) non-lending activities and knowledge work to support policy
reform and operations, and vii) other development partners and civil society support to build
synergies, networks, and explore opportunities for co-financing and risk sharing.
4.8. Potential Risks and Mitigation Measures
92. The inherent risks that may affect Strategy implementation relate to the following factors:
Macroeconomic risks: Zambia faces both external and internal risks. On the external side,
persistent slow growth in the global economy and the vulnerability to low copper prices will
adversely affect Zambian exports and revenue generation. Agriculture is primarily rain fed
dependent (80%) and is therefore prone to droughts and water logging. Electricity supply is largely
hydropower dependent with major hydro-power dams situated in the south of the country that is
more prone to drought than the north. Domestic risks relate to insufficient resource mobilisation
and increased spending affecting budget credibility. Exchange rate volatility emanating from
weaker budget credibility risks increasing uncertainty and affecting investor sentiment. Kwacha
depreciation would further increase debt servicing while further reducing the fiscal space for
discretionary spending. The Government has demonstrated resolve by adjusting fuel prices to cost
reflectivity, increased non-mining electricity tariffs by an initial 50% and has indicated reforms in
agriculture. Support from IMF and development partners will help mitigate the risk through policy
dialogue, advice and financial support. Climate risks will be mitigated through climate smart
project designs and consideration for locations, such as diversifying hydro to the north and
promoting small dams and reservoirs to retain water through longer dry spells.
Fiduciary risk: Accountability mechanisms remain weak, but are slowly improving as indicated in
the fiduciary risk assessment and other financial management diagnostics. Operations under the
Country Strategy will incorporate fiduciary safeguards. Support to the anti-corruption action plan,
public financial management reforms, and capacity building projects will help mitigate risks. The
continuous roll-out of the integrated financial management information system to remaining sites,
particularly at the decentralised levels will enhance expenditure controls.
Institutional risk to deliver services: Limited funding may lead to poor service delivery affecting
living standards, especially for the vulnerable in society. Protecting social services expenditure
will ensure continued provision of social transfers, health, education and water and sanitation.
Government has maintained spending levels and is planning to further increase allocations to
social protection as indicated in the 2017 National Budget.
Implementation capacity risk: Capacity constraints could cause delays in reform implementation.
Cooperating Partners and the Bank have committed to providing capacity building in many areas
where weaknesses have been identified. Institution wide capacity building and training will be an
integrated part of the Banks operations in Zambia.
Transition and fragility risks: The risk of violence and social breakdown is considered low in
Zambia as the country has a relatively high capacity for social and political institutions to manage
challenges within a legitimate framework. However, transition risks are associated with: i) poor
service delivery, especially in rural areas; ii) political intolerance and exclusion of the media and

21
civil society in political processes and during elections; iii) high dependence on mining; and iv)
relatively high urban youth unemployment. These risks must be addressed over the longer term to
reduce the risk of social and political instability. The Bank support aims to diversify the economy
and create both rural and urban jobs.
5. CONCLUSION AND RECOMMENDATION
93. The Boards of Directors are invited to consider and approve the Bank’s 2017-2021 Country
Strategy for Zambia.

I
ANNEX A: INDICATIVE RESULTS FRAMEWORK
1 GRZ Strat.
Obj.
2 Constraints to Achieving the Desired Outcomes
3 Final Outcomes (2021)
4 Final Outputs (2021)
5 Midterm Outcome (2019)
6 Mid Term Output (2019)
7 Bank Group Interventions during 2017-
2021 CSP (ongoing and proposed)
PILLAR I: SUPPORT TO INFRASTRUCTURE DEVELOPMENT: STRATEGIC OBJECTIVE 1: Raise productivity and strengthen trade competitiveness, to expand non-traditional exports and reduce vulnerability to copper
Improved access to water and sanitation Improved water resources develop-ment and manage-ment
Water and Sanitation: Improved health, quality of life and reduced poverty of the population of Zambia through the provision of adequate, safe, and sustainable water and sanitation services with due regard to environmental protection: Constraints:
Tariffs not yet fully reflective
Ineffective operation and maintenance systems
Financing constraints in the water sector
Extremely low levels of access to adequate sanitation
Climate change is likely to lead to more frequent unpredictable and extreme weather episodes.
Inadequate capacity in key management
Inadequate Information Management systems for planning,
Inefficient water resources management
Expanded utility services through more efficient, green and sustainable utilities
Increased overall access to safe water to 75% (68%, 2015)
50% reduction in incidence of water-borne diseases (Malaria Fatality Rate 23%, 2014)
Increased sanitation coverage to 52% (44%, 2015)
Operation and maintenance recovery > 110%
Reduced Non-Revenue Water (NRW) to 35%
Increased revenue collection efficiency to 100%
1230 water points constructed in rural areas
150,000 people trained WASHE (+50% women)
Sewer system rehabilitated/ extended by 300 km in target areas and construct 500 sanitation facilities public institutions
Gender audit conducted and strategy to build capacity in place
1,900 km of Water networks rehabilitated, augmented and extended
350 utility staff trained (>50% of female staff)
Increase in overall access to water supply (68%, 2015)
Reduction in incidence of water-borne diseases
Sanitation coverage increased to 46% (44%, 2015)
Operation and maintenance recovery > 90%
Reduced Non-Revenue Water to 45% from 53% in 2016
Revenue collection efficiency at 90% vs. 60% in 2016
200 water points constructed in rural areas
2,870 VWASHE committees formed and 28,740 people trained
Sewer system extended by 72 km in target areas and construct 100 sanitation facilities public institutions
Gender audit planned and conducted
50 km of water networks constructed,
200 utility staff trained (> 50% of female staff)
Approved/On-going
Lusaka Sanitation Program
Transforming rural livelihoods in Western Zambia
Integrated Small Towns Water Supply and Sanitation program
Development of guidelines for multipurpose small dams
Proposed
Lusaka City Water Supply Improvement Project
Zambia Water Resources Infrastructure Development Project
Phase Two Small Towns Water Supply and Sanitation program
Improved access to electricity supply
Power – Generation, Transmission and Distribution: To exploit the hydropower and alternative power potential of the country for meeting domestic demand and exporting power to neighbouring countries efficiently and sustainably. Constraints:
poor governance and institutional structure
absence of institutional arrangements to mobilize the private sector
low consumer tariffs that do not reflect costs has led to insufficient investment in generation, transmission and distribution
high technical and commercial losses, coupled with inadequate attention to operation and maintenance
financially stressed public sector utility
inadequate human resource capacity and knowledge in the energy sector
Need for diversification of power supply (as country is 87% hydro dependent)
Expanded utility services through more efficient, green and sustainable utilities
Increased competition with more than 1600 MW of new genera-tion completed (2400 MW, 2016)
improved operational efficiency of the State Owned Utility, ZESCO (KPIs from ERB)
Improved connectivity to regional and domestic markets
Increased consumer access to on-grid and off-grid electricity users (25%, 2016)
Electricity exports increasing (787 GWh, 2016)
At least two solar and two hydro projects initiated
ZESCO transformation completed
Zambia-Tanzania interconnector initiated, and ZiZaBoNa inter-connector completed
Zambia-Mozambique intercon-nector and Zambia-DRC Inter-connector prepared
Increased competition with at least 4 new IPPs under imple-mentation (2 solar IPPs in 2017)
improved operational efficiency of the State Owned Utility, ZESCO (KPIs from ERB)
Increased consumer access to on-grid and off-grid electricity users (25% in 2016)
Increased interconnection transmission capacity (MW)
Investment Plan for Generation and Transmission
Long term power systems development & investment plan
Comprehensive transparent tariff structure established
Regional integration transmission interconnector ZiZaBoNa initiated
Approved/On-going
Project Finance Itezhi Tezhi
Kariba Dam Rehabilitation
Cost of Service Study (Power) Proposed
Energy Sector Budget Support
2 Interconnector/Transmission Projects
1 Distribution Project(s)
>4 IPP Generation Projects
Technical Assistance and Diagnostic Studies
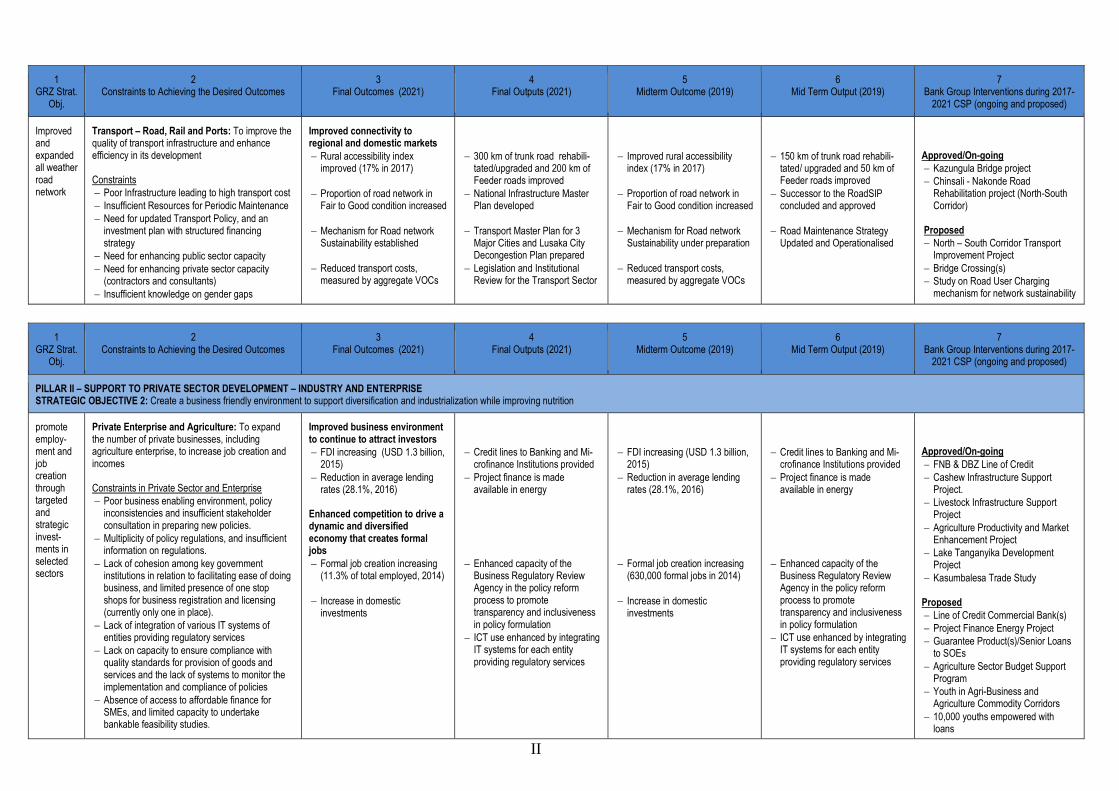
II
1 GRZ Strat.
Obj.
2 Constraints to Achieving the Desired Outcomes
3 Final Outcomes (2021)
4 Final Outputs (2021)
5 Midterm Outcome (2019)
6 Mid Term Output (2019)
7 Bank Group Interventions during 2017-
2021 CSP (ongoing and proposed)
Improved and expanded all weather road network
Transport – Road, Rail and Ports: To improve the quality of transport infrastructure and enhance efficiency in its development Constraints
Poor Infrastructure leading to high transport cost
Insufficient Resources for Periodic Maintenance
Need for updated Transport Policy, and an investment plan with structured financing strategy
Need for enhancing public sector capacity
Need for enhancing private sector capacity (contractors and consultants)
Insufficient knowledge on gender gaps
Improved connectivity to regional and domestic markets
Rural accessibility index improved (17% in 2017)
Proportion of road network in Fair to Good condition increased
Mechanism for Road network Sustainability established
Reduced transport costs, measured by aggregate VOCs
300 km of trunk road rehabili-tated/upgraded and 200 km of Feeder roads improved
National Infrastructure Master Plan developed
Transport Master Plan for 3 Major Cities and Lusaka City Decongestion Plan prepared
Legislation and Institutional Review for the Transport Sector
Improved rural accessibility index (17% in 2017)
Proportion of road network in Fair to Good condition increased
Mechanism for Road network Sustainability under preparation
Reduced transport costs, measured by aggregate VOCs
150 km of trunk road rehabili-tated/ upgraded and 50 km of Feeder roads improved
Successor to the RoadSIP concluded and approved
Road Maintenance Strategy Updated and Operationalised
Approved/On-going
Kazungula Bridge project
Chinsali - Nakonde Road Rehabilitation project (North-South Corridor)
Proposed
North – South Corridor Transport Improvement Project
Bridge Crossing(s)
Study on Road User Charging mechanism for network sustainability
1 GRZ Strat.
Obj.
2 Constraints to Achieving the Desired Outcomes
3 Final Outcomes (2021)
4 Final Outputs (2021)
5 Midterm Outcome (2019)
6 Mid Term Output (2019)
7 Bank Group Interventions during 2017-
2021 CSP (ongoing and proposed)
PILLAR II – SUPPORT TO PRIVATE SECTOR DEVELOPMENT – INDUSTRY AND ENTERPRISE STRATEGIC OBJECTIVE 2: Create a business friendly environment to support diversification and industrialization while improving nutrition
promote employ-ment and job creation through targeted and strategic invest-ments in selected sectors
Private Enterprise and Agriculture: To expand the number of private businesses, including agriculture enterprise, to increase job creation and incomes Constraints in Private Sector and Enterprise
Poor business enabling environment, policy inconsistencies and insufficient stakeholder consultation in preparing new policies.
Multiplicity of policy regulations, and insufficient information on regulations.
Lack of cohesion among key government institutions in relation to facilitating ease of doing business, and limited presence of one stop shops for business registration and licensing (currently only one in place).
Lack of integration of various IT systems of entities providing regulatory services
Lack on capacity to ensure compliance with quality standards for provision of goods and services and the lack of systems to monitor the implementation and compliance of policies
Absence of access to affordable finance for SMEs, and limited capacity to undertake bankable feasibility studies.
Improved business environment to continue to attract investors
FDI increasing (USD 1.3 billion, 2015)
Reduction in average lending rates (28.1%, 2016)
Enhanced competition to drive a dynamic and diversified economy that creates formal jobs
Formal job creation increasing (11.3% of total employed, 2014)
Increase in domestic investments
Credit lines to Banking and Mi-crofinance Institutions provided
Project finance is made available in energy
Enhanced capacity of the Business Regulatory Review Agency in the policy reform process to promote transparency and inclusiveness in policy formulation
ICT use enhanced by integrating IT systems for each entity providing regulatory services
FDI increasing (USD 1.3 billion, 2015)
Reduction in average lending rates (28.1%, 2016)
Formal job creation increasing (630,000 formal jobs in 2014)
Increase in domestic investments
Credit lines to Banking and Mi-crofinance Institutions provided
Project finance is made available in energy
Enhanced capacity of the Business Regulatory Review Agency in the policy reform process to promote transparency and inclusiveness in policy formulation
ICT use enhanced by integrating IT systems for each entity providing regulatory services
Approved/On-going
FNB & DBZ Line of Credit
Cashew Infrastructure Support Project.
Livestock Infrastructure Support Project
Agriculture Productivity and Market Enhancement Project
Lake Tanganyika Development Project
Kasumbalesa Trade Study Proposed
Line of Credit Commercial Bank(s)
Project Finance Energy Project
Guarantee Product(s)/Senior Loans to SOEs
Agriculture Sector Budget Support Program
Youth in Agri-Business and Agriculture Commodity Corridors
10,000 youths empowered with loans
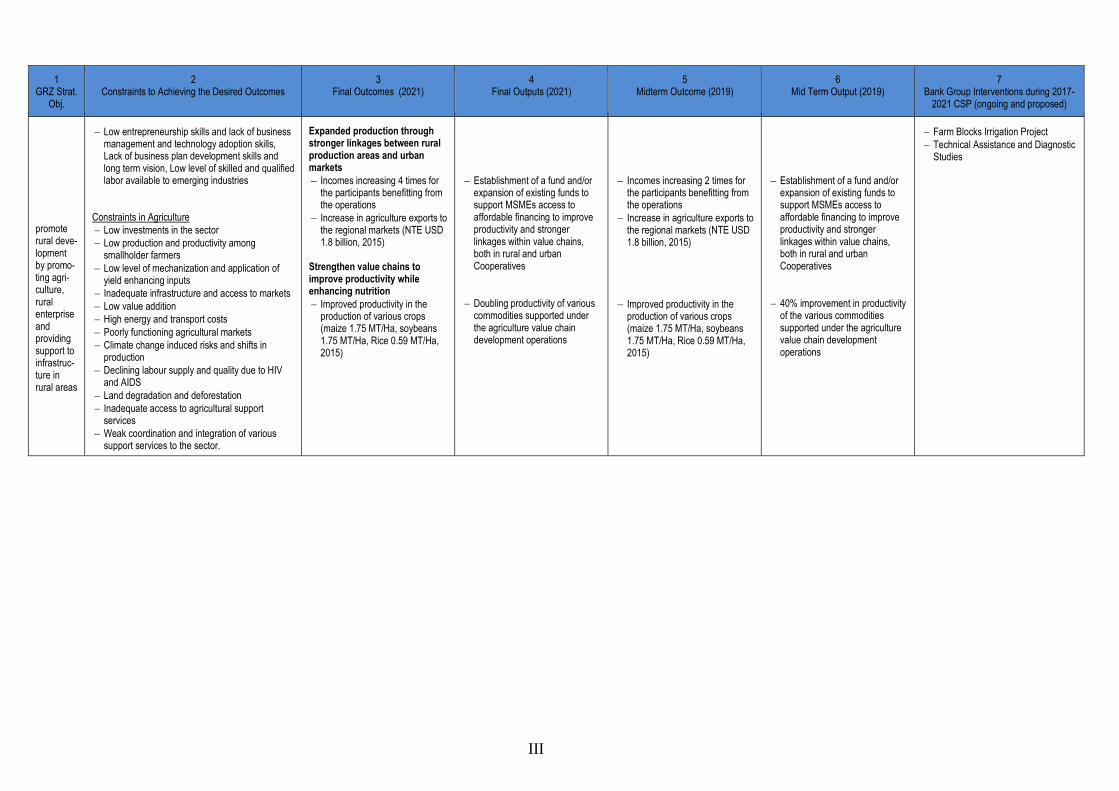
III
1 GRZ Strat.
Obj.
2 Constraints to Achieving the Desired Outcomes
3 Final Outcomes (2021)
4 Final Outputs (2021)
5 Midterm Outcome (2019)
6 Mid Term Output (2019)
7 Bank Group Interventions during 2017-
2021 CSP (ongoing and proposed)
promote rural deve-lopment by promo-ting agri-culture, rural enterprise and providing support to infrastruc-ture in rural areas
Low entrepreneurship skills and lack of business management and technology adoption skills, Lack of business plan development skills and long term vision, Low level of skilled and qualified labor available to emerging industries
Constraints in Agriculture
Low investments in the sector
Low production and productivity among smallholder farmers
Low level of mechanization and application of yield enhancing inputs
Inadequate infrastructure and access to markets
Low value addition
High energy and transport costs
Poorly functioning agricultural markets
Climate change induced risks and shifts in production
Declining labour supply and quality due to HIV and AIDS
Land degradation and deforestation
Inadequate access to agricultural support services
Weak coordination and integration of various support services to the sector.
Expanded production through stronger linkages between rural production areas and urban markets
Incomes increasing 4 times for the participants benefitting from the operations
Increase in agriculture exports to the regional markets (NTE USD 1.8 billion, 2015)
Strengthen value chains to improve productivity while enhancing nutrition
Improved productivity in the production of various crops (maize 1.75 MT/Ha, soybeans 1.75 MT/Ha, Rice 0.59 MT/Ha, 2015)
Establishment of a fund and/or expansion of existing funds to support MSMEs access to affordable financing to improve productivity and stronger linkages within value chains, both in rural and urban Cooperatives
Doubling productivity of various commodities supported under the agriculture value chain development operations
Incomes increasing 2 times for the participants benefitting from the operations
Increase in agriculture exports to the regional markets (NTE USD 1.8 billion, 2015)
Improved productivity in the production of various crops (maize 1.75 MT/Ha, soybeans 1.75 MT/Ha, Rice 0.59 MT/Ha, 2015)
Establishment of a fund and/or expansion of existing funds to support MSMEs access to affordable financing to improve productivity and stronger linkages within value chains, both in rural and urban Cooperatives
40% improvement in productivity of the various commodities supported under the agriculture value chain development operations
Farm Blocks Irrigation Project
Technical Assistance and Diagnostic Studies
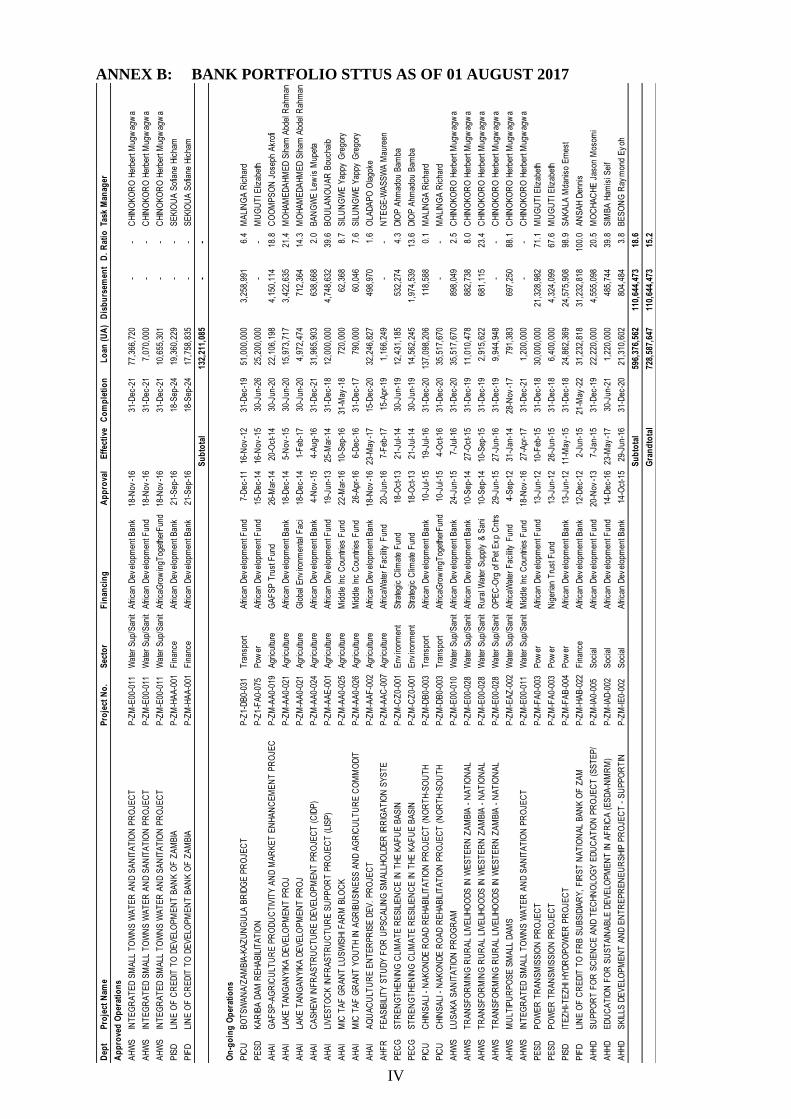
IV
ANNEX B: BANK PORTFOLIO STTUS AS OF 01 AUGUST 2017
Dep
tP
roje
ct N
ame
Pro
ject
No
. S
ecto
rF
inan
cin
gA
pp
rova
lE
ffec
tive
Co
mp
leti
on
Lo
an (
UA
)D
isb
urs
emen
tD
. R
atio
Task
Man
ager
Ap
pro
ved
Op
erat
ion
s
AH
WS
INT
EG
RA
TE
D S
MA
LL T
OW
NS
WA
TE
R A
ND
SA
NIT
AT
ION
PR
OJE
CT
P-Z
M-E
00-0
11W
ater
Sup
/San
itA
frica
n D
evel
opm
ent B
ank
18-N
ov-1
631
-Dec
-21
77,3
66,7
20
-
-
C
HIN
OK
OR
O H
erbe
rt M
ugw
agw
a
AH
WS
INT
EG
RA
TE
D S
MA
LL T
OW
NS
WA
TE
R A
ND
SA
NIT
AT
ION
PR
OJE
CT
P-Z
M-E
00-0
11W
ater
Sup
/San
itA
frica
n D
evel
opm
ent F
und
18-N
ov-1
631
-Dec
-21
7,07
0,00
0
-
-
CH
INO
KO
RO
Her
bert
Mug
wag
wa
AH
WS
INT
EG
RA
TE
D S
MA
LL T
OW
NS
WA
TE
R A
ND
SA
NIT
AT
ION
PR
OJE
CT
P-Z
M-E
00-0
11W
ater
Sup
/San
itA
frica
Gro
win
gTog
ethe
rFun
d18
-Nov
-16
31-D
ec-2
110
,655
,301
-
-
CH
INO
KO
RO
Her
bert
Mug
wag
wa
PIS
DLI
NE
OF
CR
ED
IT T
O D
EV
ELO
PM
EN
T B
AN
K O
F Z
AM
BIA
P-Z
M-H
AA
-001
Fin
ance
Afri
can
Dev
elop
men
t Ban
k21
-Sep
-16
18-S
ep-2
419
,360
,229
-
-
SE
KIO
UA
Sof
iane
Hic
ham
PIF
DLI
NE
OF
CR
ED
IT T
O D
EV
ELO
PM
EN
T B
AN
K O
F Z
AM
BIA
P-Z
M-H
AA
-001
Fin
ance
Afri
can
Dev
elop
men
t Ban
k21
-Sep
-16
18-S
ep-2
417
,758
,835
-
-
SE
KIO
UA
Sof
iane
Hic
ham
Su
bto
tal
132,
211,
085
-
-
On
-go
ing
Op
erat
ion
s
PIC
UB
OT
SW
AN
A/Z
AM
BIA
-KA
ZU
NG
ULA
BR
IDG
E P
RO
JEC
TP
-Z1-
DB
0-03
1T
rans
port
Afri
can
Dev
elop
men
t Fun
d7-
Dec
-11
16-N
ov-1
231
-Dec
-19
51,0
00,0
00
3,
258,
991
6.4
MA
LIN
GA
Ric
hard
PE
SD
KA
RIB
A D
AM
RE
HA
BIL
ITA
TIO
NP
-Z1-
FA
0-07
5P
ower
Afri
can
Dev
elop
men
t Fun
d15
-Dec
-14
16-N
ov-1
530
-Jun
-26
25,2
00,0
00
-
-
M
UG
UT
I Eliz
abet
h
AH
AI
GA
FS
P-A
GR
ICU
LTU
RE
PR
OD
UC
TIV
ITY
AN
D M
AR
KE
T E
NH
AN
CE
ME
NT
PR
OJE
CP
-ZM
-AA
0-01
9A
gric
ultu
reG
AF
SP
Tru
st F
und
26-M
ar-1
420
-Oct
-14
30-J
un-2
022
,106
,198
4,15
0,11
4
18
.8
CO
OM
PS
ON
Jos
eph
Akr
ofi
AH
AI
LAK
E T
AN
GA
NY
IKA
DE
VE
LOP
ME
NT
PR
OJ
P-Z
M-A
A0-
021
Agr
icul
ture
Afri
can
Dev
elop
men
t Ban
k18
-Dec
-14
5-N
ov-1
530
-Jun
-20
15,9
73,7
17
3,
422,
635
21.4
M
OH
AM
ED
AH
ME
D S
iham
Abd
el R
ahm
an
AH
AI
LAK
E T
AN
GA
NY
IKA
DE
VE
LOP
ME
NT
PR
OJ
P-Z
M-A
A0-
021
Agr
icul
ture
Glo
bal E
nviro
nmen
tal F
aci
18-D
ec-1
41-
Feb
-17
30-J
un-2
04,
972,
474
71
2,36
4
14.3
M
OH
AM
ED
AH
ME
D S
iham
Abd
el R
ahm
an
AH
AI
CA
SH
EW
INF
RA
ST
RU
CT
UR
E D
EV
ELO
PM
EN
T P
RO
JEC
T (
CID
P)
P-Z
M-A
A0-
024
Agr
icul
ture
Afri
can
Dev
elop
men
t Ban
k4-
Nov
-15
4-A
ug-1
631
-Dec
-21
31,9
65,9
03
63
8,66
8
2.0
BA
NG
WE
Lew
is M
upet
a
AH
AI
LIV
ES
TO
CK
INF
RA
ST
RU
CT
UR
E S
UP
PO
RT
PR
OJE
CT
(LI
SP
)P
-ZM
-AA
E-0
01A
gric
ultu
reA
frica
n D
evel
opm
ent F
und
19-J
un-1
325
-Mar
-14
31-D
ec-1
812
,000
,000
4,74
8,63
2
39
.6
BO
ULA
NO
UA
R B
ouch
aib
AH
AI
MIC
TA
F G
RA
NT
LU
SW
ISH
I FA
RM
BLO
CK
P-Z
M-A
A0-
025
Agr
icul
ture
Mid
dle
Inc
Cou
ntrie
s F
und
22-M
ar-1
610
-Sep
-16
31-M
ay-1
872
0,00
0
62
,368
8.7
SIL
UN
GW
E Y
appy
Gre
gory
AH
AI
MIC
TA
F G
RA
NT
YO
UT
H IN
AG
RIB
US
INE
SS
AN
D A
GR
ICU
LTU
RE
CO
MM
OD
ITP
-ZM
-AA
0-02
6A
gric
ultu
reM
iddl
e In
c C
ount
ries
Fun
d26
-Apr
-16
6-D
ec-1
631
-Dec
-17
790,
000
60,0
46
7.
6
S
ILU
NG
WE
Yap
py G
rego
ry
AH
AI
AQ
UA
CU
LTU
RE
EN
TE
RP
RIS
E D
EV
. P
RO
JEC
TP
-ZM
-AA
F-0
02A
gric
ultu
reA
frica
n D
evel
opm
ent B
ank
18-N
ov-1
623
-May
-17
15-D
ec-2
032
,246
,827
498,
970
1.
6
O
LAD
AP
O O
lago
ke
AH
FR
FE
AS
IBIL
ITY
ST
UD
Y F
OR
UP
SC
ALI
NG
SM
ALL
HO
LDE
R IR
RIG
AT
ION
SY
ST
EP
-ZM
-AA
C-0
07A
gric
ultu
reA
frica
Wat
er F
acili
ty F
und
20-J
un-1
67-
Feb
-17
15-A
pr-1
91,
166,
249
-
-
N
TE
GE
-WA
SS
WA
Mau
reen
PE
CG
ST
RE
NG
TH
EN
ING
CLI
MA
TE
RE
SIL
IEN
CE
IN T
HE
KA
FU
E B
AS
INP
-ZM
-CZ
0-00
1E
nviro
nmen
tS
trate
gic
Clim
ate
Fun
d18
-Oct
-13
21-J
ul-1
430
-Jun
-19
12,4
31,1
85
53
2,27
4
4.3
DIO
P A
hmad
ou B
amba
PE
CG
ST
RE
NG
TH
EN
ING
CLI
MA
TE
RE
SIL
IEN
CE
IN T
HE
KA
FU
E B
AS
INP
-ZM
-CZ
0-00
1E
nviro
nmen
tS
trate
gic
Clim
ate
Fun
d18
-Oct
-13
21-J
ul-1
430
-Jun
-19
14,5
62,2
45
1,
974,
539
13.6
D
IOP
Ahm
adou
Bam
ba
PIC
UC
HIN
SA
LI -
NA
KO
ND
E R
OA
D R
EH
AB
ILIT
AT
ION
PR
OJE
CT
(N
OR
TH
-SO
UT
HP
-ZM
-DB
0-00
3T
rans
port
Afri
can
Dev
elop
men
t Ban
k10
-Jul
-15
19-J
ul-1
631
-Dec
-20
137,
098,
206
11
8,58
8
0.1
MA
LIN
GA
Ric
hard
PIC
UC
HIN
SA
LI -
NA
KO
ND
E R
OA
D R
EH
AB
ILIT
AT
ION
PR
OJE
CT
(N
OR
TH
-SO
UT
HP
-ZM
-DB
0-00
3T
rans
port
Afri
caG
row
ingT
oget
herF
und
10-J
ul-1
54-
Oct
-16
31-D
ec-2
035
,517
,670
-
-
MA
LIN
GA
Ric
hard
AH
WS
LUS
AK
A S
AN
ITA
TIO
N P
RO
GR
AM
P-Z
M-E
00-0
10W
ater
Sup
/San
itA
frica
n D
evel
opm
ent B
ank
24-J
un-1
57-
Jul-1
631
-Dec
-20
35,5
17,6
70
89
8,04
9
2.5
CH
INO
KO
RO
Her
bert
Mug
wag
wa
AH
WS
TR
AN
SF
OR
MIN
G R
UR
AL
LIV
ELI
HO
OD
S IN
WE
ST
ER
N Z
AM
BIA
- N
AT
ION
AL
P-Z
M-E
00-0
28W
ater
Sup
/San
itA
frica
n D
evel
opm
ent B
ank
10-S
ep-1
427
-Oct
-15
31-D
ec-1
911
,010
,478
882,
738
8.
0
C
HIN
OK
OR
O H
erbe
rt M
ugw
agw
a
AH
WS
TR
AN
SF
OR
MIN
G R
UR
AL
LIV
ELI
HO
OD
S IN
WE
ST
ER
N Z
AM
BIA
- N
AT
ION
AL
P-Z
M-E
00-0
28W
ater
Sup
/San
itR
ural
Wat
er S
uppl
y &
San
i10
-Sep
-14
10-S
ep-1
531
-Dec
-19
2,91
5,62
2
681,
115
23
.4
CH
INO
KO
RO
Her
bert
Mug
wag
wa
AH
WS
TR
AN
SF
OR
MIN
G R
UR
AL
LIV
ELI
HO
OD
S IN
WE
ST
ER
N Z
AM
BIA
- N
AT
ION
AL
P-Z
M-E
00-0
28W
ater
Sup
/San
itO
PE
C-O
rg o
f Pet
Ex
p C
ntrs
29-J
un-1
527
-Jun
-16
31-D
ec-1
99,
944,
948
-
-
C
HIN
OK
OR
O H
erbe
rt M
ugw
agw
a
AH
WS
MU
LTIP
UR
PO
SE
SM
ALL
DA
MS
P-Z
M-E
AZ
-002
Wat
er S
up/S
anit
Afri
caW
ater
Fac
ility
Fun
d4-
Sep
-12
31-J
an-1
428
-Nov
-17
791,
383
697,
250
88
.1
CH
INO
KO
RO
Her
bert
Mug
wag
wa
AH
WS
INT
EG
RA
TE
D S
MA
LL T
OW
NS
WA
TE
R A
ND
SA
NIT
AT
ION
PR
OJE
CT
P-Z
M-E
00-0
11W
ater
Sup
/San
itM
iddl
e In
c C
ount
ries
Fun
d18
-Nov
-16
27-A
pr-1
731
-Dec
-21
1,20
0,00
0
-
-
CH
INO
KO
RO
Her
bert
Mug
wag
wa
PE
SD
PO
WE
R T
RA
NS
MIS
SIO
N P
RO
JEC
TP
-ZM
-FA
0-00
3P
ower
Afri
can
Dev
elop
men
t Fun
d13
-Jun
-12
10-F
eb-1
531
-Dec
-18
30,0
00,0
00
21
,328
,982
71
.1
MU
GU
TI E
lizab
eth
PE
SD
PO
WE
R T
RA
NS
MIS
SIO
N P
RO
JEC
TP
-ZM
-FA
0-00
3P
ower
Nig
eria
n T
rust
Fun
d13
-Jun
-12
26-J
un-1
531
-Dec
-18
6,40
0,00
0
4,32
4,09
9
67
.6
MU
GU
TI E
lizab
eth
PIS
DIT
EZ
HI-T
EZ
HI H
YD
RO
PO
WE
R P
RO
JEC
TP
-ZM
-FA
B-0
04P
ower
Afri
can
Dev
elop
men
t Ban
k13
-Jun
-12
11-M
ay-1
531
-Dec
-18
24,8
62,3
69
24
,575
,908
98
.9
SA
KA
LA M
dani
so E
rnes
t
PIF
DLI
NE
OF
CR
ED
IT T
O F
RB
SU
BS
IDIA
RY
, F
IRS
T N
AT
ION
AL
BA
NK
OF
ZA
MP
-ZM
-HA
B-0
22F
inan
ceA
frica
n D
evel
opm
ent B
ank
12-D
ec-1
22-
Jun-
1521
-May
-22
31,2
32,8
18
31
,232
,818
10
0.0
AN
SA
H D
enni
s
AH
HD
SU
PP
OR
T F
OR
SC
IEN
CE
AN
D T
EC
HN
OLO
GY
ED
UC
AT
ION
PR
OJE
CT
(S
ST
EP
/P
-ZM
-IA0-
005
Soc
ial
Afri
can
Dev
elop
men
t Fun
d20
-Nov
-13
7-Ja
n-15
31-D
ec-1
922
,220
,000
4,55
5,09
8
20
.5
MO
CH
AC
HE
Jas
on M
osom
i
AH
HD
ED
UC
AT
ION
FO
R S
US
TA
INA
BLE
DE
VE
LOP
ME
NT
IN A
FR
ICA
(E
SD
A-N
MR
M)
P-Z
M-IA
D-0
02S
ocia
lA
frica
n D
evel
opm
ent F
und
14-D
ec-1
623
-May
-17
30-J
un-2
11,
220,
000
48
5,74
4
39.8
S
IMB
A H
amis
i Sei
f
AH
HD
SK
ILLS
DE
VE
LOP
ME
NT
AN
D E
NT
RE
PR
EN
EU
RS
HIP
PR
OJE
CT
- S
UP
PO
RT
INP
-ZM
-IE0-
002
Soc
ial
Afri
can
Dev
elop
men
t Ban
k14
-Oct
-15
29-J
un-1
631
-Dec
-20
21,3
10,6
02
80
4,48
4
3.8
BE
SO
NG
Ray
mon
d E
yoh
Su
bto
tal
596,
376,
562
11
0,64
4,47
3
18
.6
Gra
nd
tota
l72
8,58
7,64
7
110,
644,
473
15.2

V
ANNEX C-a: PORTFOLIO PERFORMANCE IMPROVEMENT PLAN 2016 – STATUS OF IMPLEMENTATION
Issue Description Recommended Action Responsibility Timeline Implementation Status
Pro
ject
sta
rt-u
p d
ela
ys
Loan signature delays
Delays in issuing legal
opinion
Delays in submitting
documents related to
conditions precedent to
effectiveness and first
disbursement
Delays in the appointment
of core project staff as
part of effectiveness
conditions
High level dialogue between Ministry of Finance,
cooperating partners and Ministry of Justice on clearance
of agreements and contracts
African
Development
Bank, Ministry of
Finance, other
cooperating
partners, Ministry
of Justice
Immediate, by
end of December
2016
Two high-level meetings held. A proposal for
streamlining clearance of documents,
especially procurement dossiers and contracts,
has been submitted for Government’s
consideration.
Sign loan agreements within 90 days,
Develop processing schedules for newly approved
operations
Follow up with executing agencies on conditions precedent
for first disbursements
Executing agencies to be proactive in submitting conditions
precedent to first disbursement
Ministry of
Finance –
multilateral desk,
executing
agencies
Continuous The Bank has agreed with the Ministry of
Finance to designate one set of signatories for
all loans and grants, unless otherwise advised
by the Ministry of Finance. This has minimised
delays in processing disbursement requests for
newly approved operations. Average time from
approval to first disbursement reduced from 17
months to 5.93 months.
Explore possible streamlining of review process and
possible capacity building to multilateral desk of Ministry
of Finance and Ministry of Justice
Ministry of
Finance and
Ministry of
Justice
Continuous In process. The Multilateral desk was moved to
the newly created Ministry of National
Planning. The Bank held two meetings with the
Ministry of National Planning on this subject,
expected to be concluded before end of 2017.
Bank to create project start-up checklist for new projects African
Development
Bank, Ministry of
Finance
End of April
2016
This has been done and discussed in detail
during quarterly portfolio review meetings.
Fin
an
cia
l m
an
ag
emen
t
Poor follow-up on the
recommendations made
in audit reports to ensure
fiduciary safeguard of
Bank resources
Delays in funds flow
from special account to
operating account
The Bank and Ministry of Finance to organise an audit-
planning meeting with the auditor general’s office and
project coordinators and accountants
Undertake pre and post audit meetings between the
Bank, auditors and project implementation units would
aid in identifying challenges and agreeing what is
expected and on the way forward
African
Development
Bank, Ministry of
Finance, office of
the attorney
general,
executing
agencies
End of December
2016
Audit planning meeting held. Follow up
meetings between projects and the office of the
Auditor General has been arranged and
confirmed.
Project coordinators to submit update on implementation of
audit recommendations in quarterly progress reports
Project
coordinators
January to June
2016
Follow up on audit recommendations
incorporated in quarterly progress reporting.
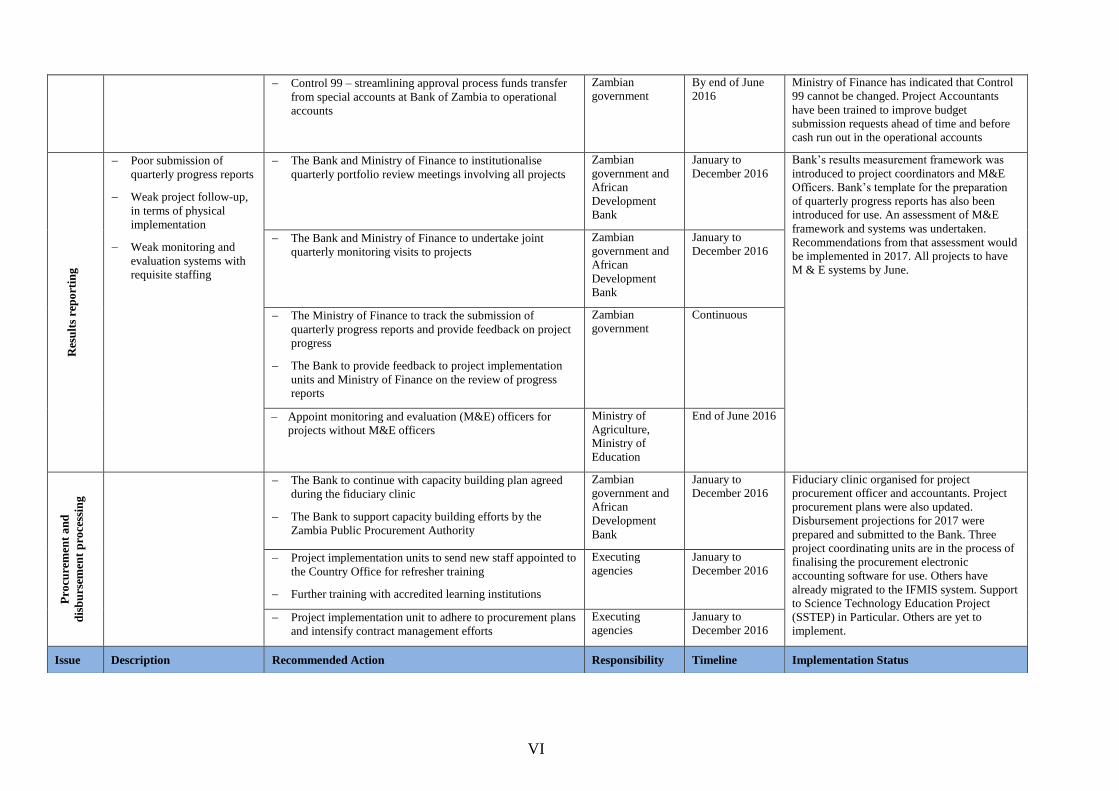
VI
Control 99 – streamlining approval process funds transfer
from special accounts at Bank of Zambia to operational
accounts
Zambian
government
By end of June
2016
Ministry of Finance has indicated that Control
99 cannot be changed. Project Accountants
have been trained to improve budget
submission requests ahead of time and before
cash run out in the operational accounts
Res
ult
s re
po
rtin
g
Poor submission of
quarterly progress reports
Weak project follow-up,
in terms of physical
implementation
Weak monitoring and
evaluation systems with
requisite staffing
The Bank and Ministry of Finance to institutionalise
quarterly portfolio review meetings involving all projects
Zambian
government and
African
Development
Bank
January to
December 2016
Bank’s results measurement framework was
introduced to project coordinators and M&E
Officers. Bank’s template for the preparation
of quarterly progress reports has also been
introduced for use. An assessment of M&E
framework and systems was undertaken.
Recommendations from that assessment would
be implemented in 2017. All projects to have
M & E systems by June.
The Bank and Ministry of Finance to undertake joint
quarterly monitoring visits to projects
Zambian
government and
African
Development
Bank
January to
December 2016
The Ministry of Finance to track the submission of
quarterly progress reports and provide feedback on project
progress
The Bank to provide feedback to project implementation
units and Ministry of Finance on the review of progress
reports
Zambian
government
Continuous
Appoint monitoring and evaluation (M&E) officers for
projects without M&E officers
Ministry of
Agriculture,
Ministry of
Education
End of June 2016
Pro
cure
men
t a
nd
dis
bu
rsem
ent
pro
cess
ing
The Bank to continue with capacity building plan agreed
during the fiduciary clinic
The Bank to support capacity building efforts by the
Zambia Public Procurement Authority
Zambian
government and
African
Development
Bank
January to
December 2016
Fiduciary clinic organised for project
procurement officer and accountants. Project
procurement plans were also updated.
Disbursement projections for 2017 were
prepared and submitted to the Bank. Three
project coordinating units are in the process of
finalising the procurement electronic
accounting software for use. Others have
already migrated to the IFMIS system. Support
to Science Technology Education Project
(SSTEP) in Particular. Others are yet to
implement.
Project implementation units to send new staff appointed to
the Country Office for refresher training
Further training with accredited learning institutions
Executing
agencies
January to
December 2016
Project implementation unit to adhere to procurement plans
and intensify contract management efforts
Executing
agencies
January to
December 2016
Issue Description Recommended Action Responsibility Timeline Implementation Status

VII
ANNEX C-b: 2017 COUNTRY PORTFOLIO IMPROVEMENT PLAN
Issue Description Recommended actions Responsible Monitoring indicators Time frame
Pro
ject
im
ple
men
tati
on
Del
ay
s
Feasibility studies and detailed designs are
not in place at commencement of project
Slow physical implementation of the
project as a result of delays in contract
clearance by the Ministry of Justice
Increased use of MIC funds and project
preparation facilities for feasibility studies
and detailed designs before project
implementation commencement
Creation of a desk at Ministry of Justice for
clearance of AfDB project contracts
Establish thresholds and clear only high-
valued contracts at the Ministry of Justice
Recruitment of more lawyers at Ministry of
Justice
Ministry of Finance
Ministry of Justice
Ministry of Justice/Ministry
of Finance
Improved project
implementation
Improved procurement
processing and contract
clearance
Jan – Dec 2017
Jan – Dec 2017
Fin
an
cia
l M
an
ag
emen
t
Delays in funds flow from special account
to operating account from BOZ
Poor follow-up on the recommendations
made in audit reports to ensure fiduciary
safeguard of Bank resources
Delayed submission of Financial
Statements
Delays in appointment of designated
signatories
Improve Cash flow planning and
management at PIU level
Follow up implementation of audit report
recommendations and provide updates in
quarterly progress reports
Enhance adherence to audit
recommendations
Audits to start 1st February to enable
Preparation of the FS
To have same list of designated signatories
to sign on all Projects
Project Coordinator
Project Coordinator
Project Team
Project Team
Ministry of Finance
Improved Disbursement
schedule and cash
management
Reduced recurring audit
queries
Submission of audit report to
AfDB 6 months after the end
of year.
Reduced start-up delays
Jan – Dec 2017
Immediate
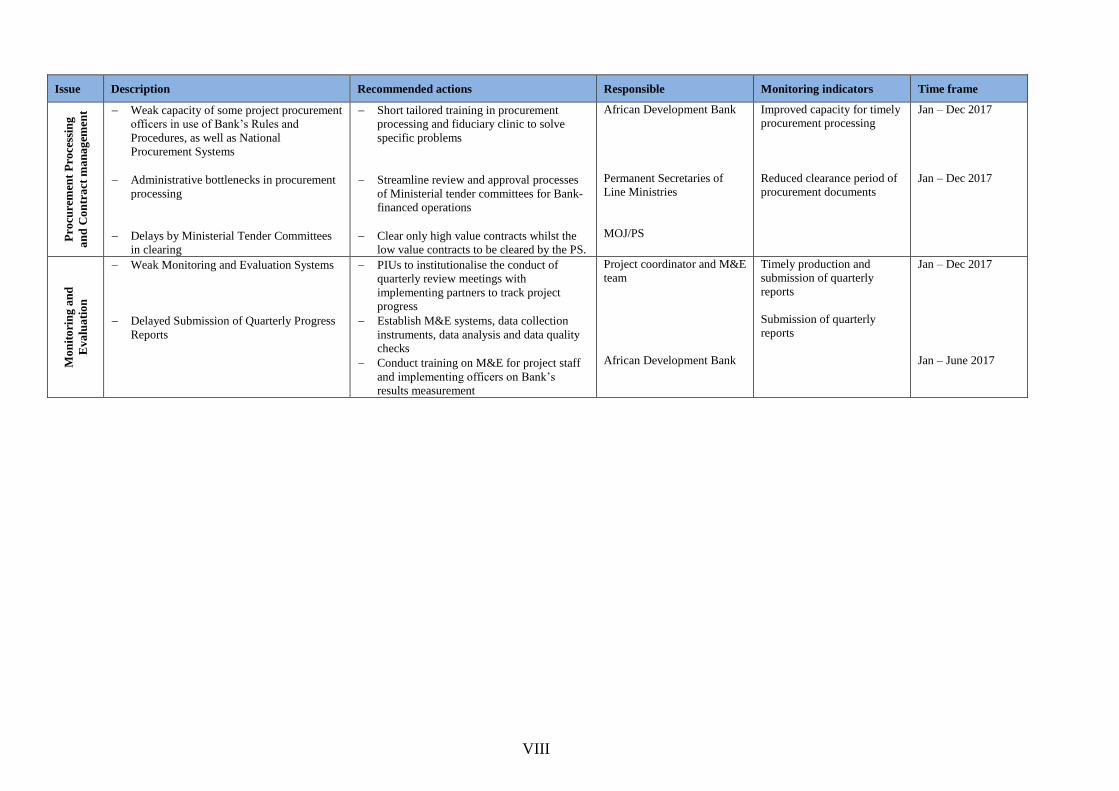
VIII
Issue Description Recommended actions Responsible Monitoring indicators Time frame
Pro
cure
men
t P
roce
ssin
g
an
d C
on
tra
ct m
an
ag
emen
t Weak capacity of some project procurement
officers in use of Bank’s Rules and
Procedures, as well as National
Procurement Systems
Administrative bottlenecks in procurement
processing
Delays by Ministerial Tender Committees
in clearing
Short tailored training in procurement
processing and fiduciary clinic to solve
specific problems
Streamline review and approval processes
of Ministerial tender committees for Bank-
financed operations
Clear only high value contracts whilst the
low value contracts to be cleared by the PS.
African Development Bank
Permanent Secretaries of
Line Ministries
MOJ/PS
Improved capacity for timely
procurement processing
Reduced clearance period of
procurement documents
Jan – Dec 2017
Jan – Dec 2017
Mo
nit
ori
ng a
nd
Ev
alu
ati
on
Weak Monitoring and Evaluation Systems
Delayed Submission of Quarterly Progress
Reports
PIUs to institutionalise the conduct of
quarterly review meetings with
implementing partners to track project
progress
Establish M&E systems, data collection
instruments, data analysis and data quality
checks
Conduct training on M&E for project staff
and implementing officers on Bank’s
results measurement
Project coordinator and M&E
team
African Development Bank
Timely production and
submission of quarterly
reports
Submission of quarterly
reports
Jan – Dec 2017
Jan – June 2017

IX
ANNEX D: INDICATIVE LENDING PROGRAM 2017-2019
Pillar 1 – Support to Infrastructure Development (Millions UA)
High 5 Priority Project Name ADB ADF
2017
Integrate Africa North South Corridor Improvement Project
(Serenje-Mpika) 71.4
Light up & Power Africa Energy Sector Budget Support (phase 1) 72.2 0.5
Total 143.6 0.5
2018
Improve the Quality of Life Lusaka Bulk Water Supply Project 50.0 1.5
Improve the Quality of Life Zambia Water Resources Infrastructure
Development Program 28.6 1.0
Light up & Power Africa Tanzania – Zambia Interconnection Project 20.0 6.0
Light up & Power Africa Energy Sector Budget Support (programmatic,
phase 2) 108.4 1.0
Total 207.0 9.5
2019
Improve the Quality of Life Lusaka Decongestion Project 35.7
Light up & Power Africa Zizabona Power Interconnection Project 17.9 5.0
Intregrate Africa Feira Bridge (Zambezi River) 42.9
Light up & Power Africa Batoka Gorge Electric Power Generation* 117.9
Total 214.4 5.0
Grand Total 565.0 15.0
* As the CSP uses an integrated approach there will be projects that have elements/activities that will
support both pillars particularly when it comes to private sector orientation, private sector development
or underpinning reforms in the private sector.

X
Pillar 2 – Support to Private Sector Development1 (Millions UA)
High 5 Priority Project Name ADB ADF
2017
Industrialise Africa Sovereign Guarantee/Senior Loan to Zambia
National Building Society 35.7
Total 35.7
2018
Light up & Power Africa Zambia Renewable Energy Financing Program 50.0
Industrialize Africa Line of Credit: Zambia National Commercial Bank 28.6
Feed Africa Zambia Youth In Agri-Business And Agriculture
Commodity Corridors* 51.4 1.5
Feed Africa Agriculture Sector Budget Support* 28.6 1.0
Total 158.6 2.5
2019
Light up & Power Africa Western Hydro Power - Project Finance 35.7
Light up & Power Africa HBS SOLAR - Project Finance 35.7
Feed Africa Farm Blocks Irrigation Project (Luswishi Farm Block
Development) * 21.4
Improve the Quality of Life Rural Youth And Women Entrepreneurship* 21.4 1.0
Total 114.2 1.0
Grand Total 308.5 3.5
1 The IOP is a public sector tool, it offers some certainty on the pipeline. However, private sector operations (PSO)
(unlike Public Sector Operations) are opportunistic in nature and therefore the indicative operations may not
always materialize and new operations may be added. The indicative operations listed may be dropped or new
ones added throughout the implementation period of the CSP.
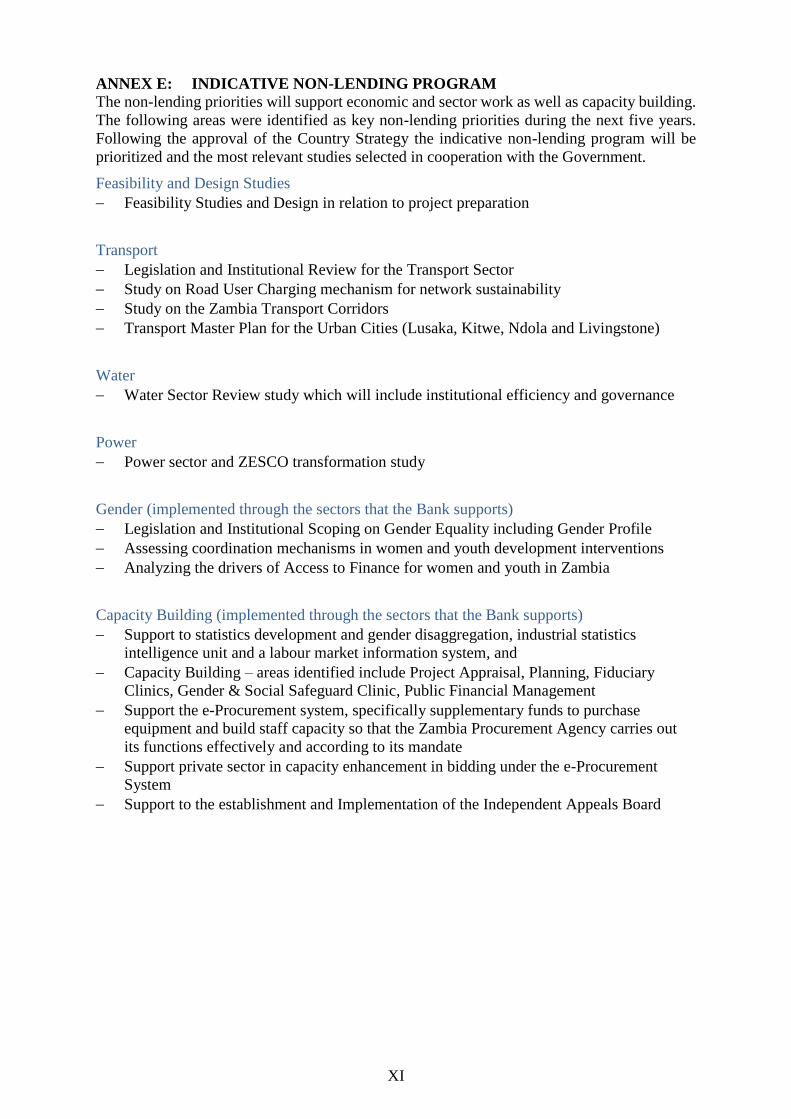
XI
ANNEX E: INDICATIVE NON-LENDING PROGRAM
The non-lending priorities will support economic and sector work as well as capacity building.
The following areas were identified as key non-lending priorities during the next five years.
Following the approval of the Country Strategy the indicative non-lending program will be
prioritized and the most relevant studies selected in cooperation with the Government.
Feasibility and Design Studies
Feasibility Studies and Design in relation to project preparation
Transport
Legislation and Institutional Review for the Transport Sector
Study on Road User Charging mechanism for network sustainability
Study on the Zambia Transport Corridors
Transport Master Plan for the Urban Cities (Lusaka, Kitwe, Ndola and Livingstone)
Water
Water Sector Review study which will include institutional efficiency and governance
Power
Power sector and ZESCO transformation study
Gender (implemented through the sectors that the Bank supports)
Legislation and Institutional Scoping on Gender Equality including Gender Profile
Assessing coordination mechanisms in women and youth development interventions
Analyzing the drivers of Access to Finance for women and youth in Zambia
Capacity Building (implemented through the sectors that the Bank supports)
Support to statistics development and gender disaggregation, industrial statistics
intelligence unit and a labour market information system, and
Capacity Building – areas identified include Project Appraisal, Planning, Fiduciary
Clinics, Gender & Social Safeguard Clinic, Public Financial Management
Support the e-Procurement system, specifically supplementary funds to purchase
equipment and build staff capacity so that the Zambia Procurement Agency carries out
its functions effectively and according to its mandate
Support private sector in capacity enhancement in bidding under the e-Procurement
System
Support to the establishment and Implementation of the Independent Appeals Board
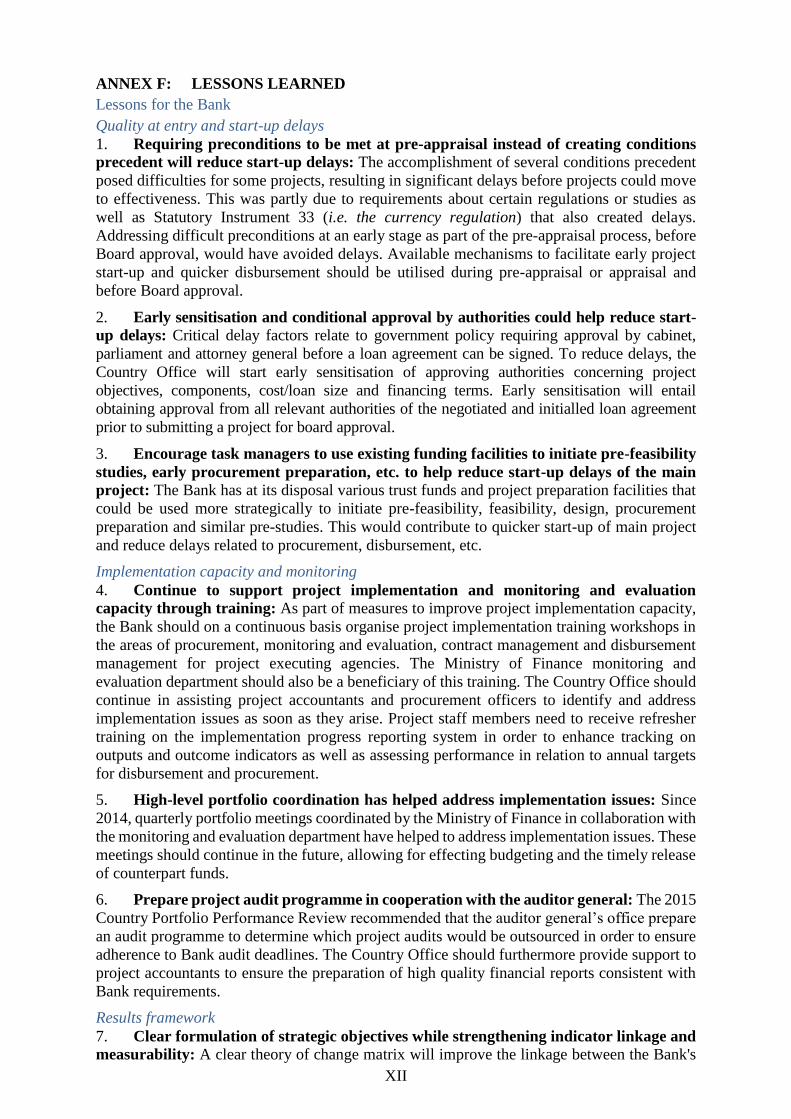
XII
ANNEX F: LESSONS LEARNED
Lessons for the Bank
Quality at entry and start-up delays
1. Requiring preconditions to be met at pre-appraisal instead of creating conditions
precedent will reduce start-up delays: The accomplishment of several conditions precedent
posed difficulties for some projects, resulting in significant delays before projects could move
to effectiveness. This was partly due to requirements about certain regulations or studies as
well as Statutory Instrument 33 (i.e. the currency regulation) that also created delays.
Addressing difficult preconditions at an early stage as part of the pre-appraisal process, before
Board approval, would have avoided delays. Available mechanisms to facilitate early project
start-up and quicker disbursement should be utilised during pre-appraisal or appraisal and
before Board approval.
2. Early sensitisation and conditional approval by authorities could help reduce start-
up delays: Critical delay factors relate to government policy requiring approval by cabinet,
parliament and attorney general before a loan agreement can be signed. To reduce delays, the
Country Office will start early sensitisation of approving authorities concerning project
objectives, components, cost/loan size and financing terms. Early sensitisation will entail
obtaining approval from all relevant authorities of the negotiated and initialled loan agreement
prior to submitting a project for board approval.
3. Encourage task managers to use existing funding facilities to initiate pre-feasibility
studies, early procurement preparation, etc. to help reduce start-up delays of the main
project: The Bank has at its disposal various trust funds and project preparation facilities that
could be used more strategically to initiate pre-feasibility, feasibility, design, procurement
preparation and similar pre-studies. This would contribute to quicker start-up of main project
and reduce delays related to procurement, disbursement, etc.
Implementation capacity and monitoring
4. Continue to support project implementation and monitoring and evaluation
capacity through training: As part of measures to improve project implementation capacity,
the Bank should on a continuous basis organise project implementation training workshops in
the areas of procurement, monitoring and evaluation, contract management and disbursement
management for project executing agencies. The Ministry of Finance monitoring and
evaluation department should also be a beneficiary of this training. The Country Office should
continue in assisting project accountants and procurement officers to identify and address
implementation issues as soon as they arise. Project staff members need to receive refresher
training on the implementation progress reporting system in order to enhance tracking on
outputs and outcome indicators as well as assessing performance in relation to annual targets
for disbursement and procurement.
5. High-level portfolio coordination has helped address implementation issues: Since
2014, quarterly portfolio meetings coordinated by the Ministry of Finance in collaboration with
the monitoring and evaluation department have helped to address implementation issues. These
meetings should continue in the future, allowing for effecting budgeting and the timely release
of counterpart funds.
6. Prepare project audit programme in cooperation with the auditor general: The 2015
Country Portfolio Performance Review recommended that the auditor general’s office prepare
an audit programme to determine which project audits would be outsourced in order to ensure
adherence to Bank audit deadlines. The Country Office should furthermore provide support to
project accountants to ensure the preparation of high quality financial reports consistent with
Bank requirements.
Results framework
7. Clear formulation of strategic objectives while strengthening indicator linkage and
measurability: A clear theory of change matrix will improve the linkage between the Bank's

XIII
overall strategy with that of the government's National Development Plans. Some objectives
were too specific and their formulation rather complicated. Some of the indicators were vaguely
specified and did not provide adequate information on what was measured. The design of the
strategic framework can be improved through better formulation of strategic objectives.
8. Reduce the number of outcome and output indicators and bring in line with
SMART principles. The CSP results framework established 30 outcome and 37 output
indicators, which is a large amount to monitor. One or perhaps two outcome indicators would
be sufficient, while two to three output indicators would be enough. It is important to select
indicators where baselines and targets can be measured and established. The design and
formulation of outcome and output indicators should be brought in line with OECD principles
of SMART indicators, i.e. specific, measurable, achievable, relevant and time bound, and in
accordance with Bank Policy.
Economic and sector work
9. Simplifying clearance and approval procedure for knowledge work: One of the
challenges in preparing economic and sector work at Country Office level is the often-lengthy
process of document clearance and approval within the hierarchy of the Bank. A simplified
process could accelerate the completion, clearance and publication of reports, especially when
it comes to country specific reports at Country Office level. Furthermore, providing a platform
for internal cooperation between economists in the region and with EDRE as well as providing
earmarked resources for diagnostic work could promote more knowledge work.
Private sector
10. Financing needed to support the missing middle in the private sector: Zambia
remains an attractive beneficiary of investments. However, many private sector firms that are
interested in obtaining finance are not able to meet the high financing thresholds that the Bank
requires. Potential projects cannot meet the threshold criteria, which amount to USD 10 million
for corporate loans or USD 30 million for project finance support, as their financing needs
often fall below this threshold. At the same time, accessing long-term funding through the local
banking system is prohibitively expensive with nominal interest rates ranging between 24 and
30%.
11. Lines of credit do not provide more funding to small and medium sized enterprises: The lines of credit are provided to banks to expand their opportunities for on-lending. However,
the lines of credit have not increased lending to small and medium sized enterprises, as
challenges associated with short tenors, high lending rates and high collateral requirements
persist. The Zambia National Commercial Bank's experience points to more success with the
use of credit guarantees that reduce risk. Lines of credit are only relevant when there is a
genuine liquidity need.
12. Public Private Partnerships can be a vehicle to support the private sector: Although
only pursued to a limited extent, PPPs can provide an approach for engaging and strengthening
support to the private sector. The approach being pursued in the cashew value chain project
provides a vehicle for using sovereign lending to support public infrastructure such as
collection points, storage and warehousing, while the private sector – through producers,
traders and processors – can expand its business and access the market. Given the importance
of creating jobs, this approach should be considered more widely.
Lessons for the Government
Policy dialogue and policy predictability
13. Strengthening dialogue on policies that affect Bank operations: The private sector
has highlighted inadequate dialogue between the authorities, the private sector and other
stakeholders on various occasions. These issues were also raised in the mid-term, and specific
reference was made to policies that were implemented and later retracted when it became
apparent that they were not working effectively. Some of these policies, including the foreign
currency regulation (SI-33), have also affected Bank operations. Lack of cost-reflective
XIV
electricity tariffs affects project profitability. Implementation of interest rate caps affects
banking profitability, and the introduction and revocation of new mineral royalty tariffs create
uncertainty. Strengthening dialogue with the relevant authorities before policies are approved
can limit the adverse effects on Bank operations.
14. Policy predictability affects investor sentiment: The impact of reduced policy
predictability affects investor sentiment and leads to lost or lower investment, as investors look
to other more stable countries. The authorities are now in the process of implementing
mandatory regulatory impact assessments to carefully analyse the impacts of new laws and
regulations before enforcing them.
Debt strategy
15. Formulation of a debt strategy and strengthening active debt management: National
public debt is still considered moderate. However, the acceleration in debt to GDP ratio in 2015
is a sign for careful monitoring of debt dynamics as well as the formulation of a debt strategy
and active debt management. Loan financed public investments need to be prioritised, carefully
appraised, return a high yield, and the must be based on attractive lending terms.
Project implementation delays
16. Develop a simple project tracking tool to reduce start-up delays: It has been
suggested that a project tracking tool be developed to monitor the various steps in loan
processing, loan signature, issuance of legal opinion and prior engagement with cabinet on
projects. Such a tracking tool would help track the various steps and ensure follow-up with the
relevant authorities as soon as delays are observed. The Ministry of Finance would require
technical support to revamp the monitoring, tracking and oversight responsibilities.
17. Quicker follow-up to reduce project implementation delays: In order to limit project
delays, it was agreed that there was a need to strengthen the monitoring on the appointment of
core project staff and the submission of documents for project effectiveness and first
disbursement. Executing agencies are to institutionalise the quarterly portfolio review meetings
to monitor progress made on each project and follow up on effectiveness conditions. These
meetings will be followed by a field monitoring visit to assess project effectiveness and
delivery of various interventions to beneficiary communities.

XV
ANNEX G: SELECTED ECONOMIC AND FINANCIAL INDICATORS
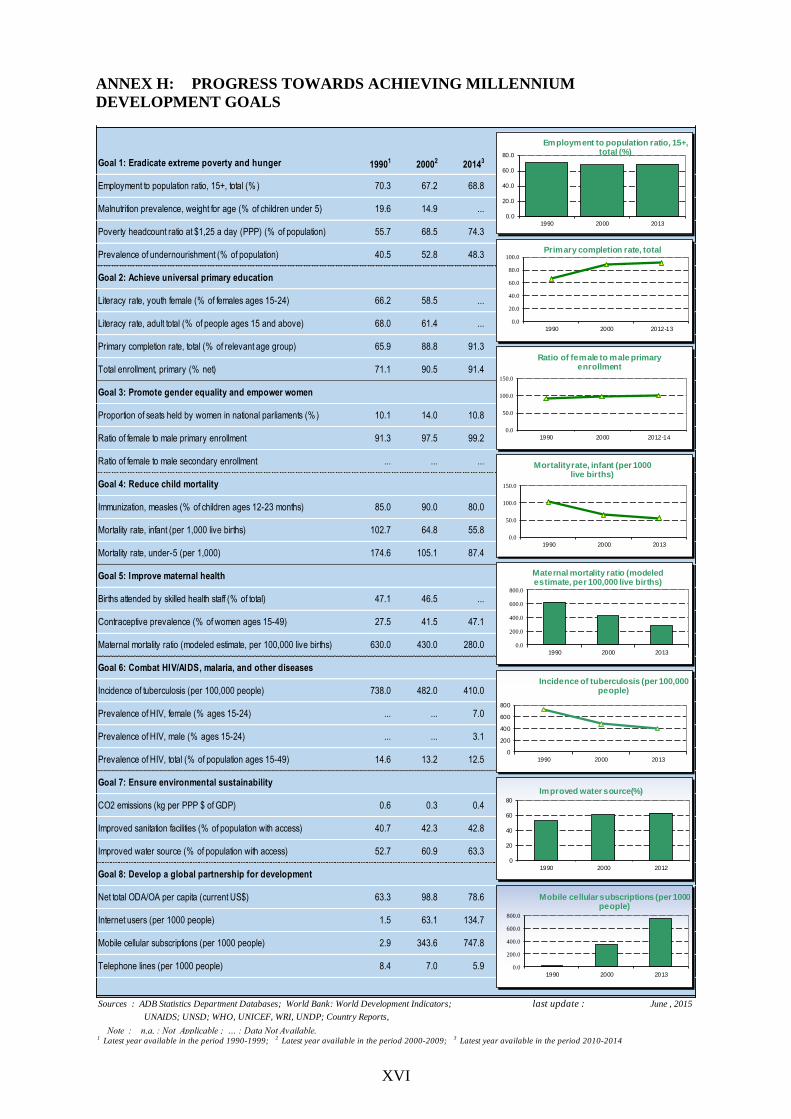
XVI
ANNEX H: PROGRESS TOWARDS ACHIEVING MILLENNIUM
DEVELOPMENT GOALS
Goal 1: Eradicate extreme poverty and hunger 19901 20002 20143
Employment to population ratio, 15+, total (% ) 70.3 67.2 68.8
Malnutrition prevalence, weight for age (% of children under 5) 19.6 14.9 ...
Poverty headcount ratio at $1,25 a day (PPP) (% of population) 55.7 68.5 74.3
Prevalence of undernourishment (% of population) 40.5 52.8 48.3
Goal 2: Achieve universal primary education
Literacy rate, youth female (% of females ages 15-24) 66.2 58.5 ...
Literacy rate, adult total (% of people ages 15 and above) 68.0 61.4 ...
Primary completion rate, total (% of relevant age group) 65.9 88.8 91.3
Total enrollment, primary (% net) 71.1 90.5 91.4
Goal 3: Promote gender equality and empower women
Proportion of seats held by women in national parliaments (% ) 10.1 14.0 10.8
Ratio of female to male primary enrollment 91.3 97.5 99.2
Ratio of female to male secondary enrollment ... ... ...
Goal 4: Reduce child mortality
Immunization, measles (% of children ages 12-23 months) 85.0 90.0 80.0
Mortality rate, infant (per 1,000 live births) 102.7 64.8 55.8
Mortality rate, under-5 (per 1,000) 174.6 105.1 87.4
Goal 5: Improve maternal health
Births attended by skilled health staff (% of total) 47.1 46.5 ...
Contraceptive prevalence (% of women ages 15-49) 27.5 41.5 47.1
Maternal mortality ratio (modeled estimate, per 100,000 live births) 630.0 430.0 280.0
Goal 6: Combat HIV/AIDS, malaria, and other diseases
Incidence of tuberculosis (per 100,000 people) 738.0 482.0 410.0
Prevalence of HIV, female (% ages 15-24) ... ... 7.0
Prevalence of HIV, male (% ages 15-24) ... ... 3.1
Prevalence of HIV, total (% of population ages 15-49) 14.6 13.2 12.5
Goal 7: Ensure environmental sustainability
CO2 emissions (kg per PPP $ of GDP) 0.6 0.3 0.4
Improved sanitation facilities (% of population with access) 40.7 42.3 42.8
Improved water source (% of population with access) 52.7 60.9 63.3
Goal 8: Develop a global partnership for development
Net total ODA/OA per capita (current US$) 63.3 98.8 78.6
Internet users (per 1000 people) 1.5 63.1 134.7
Mobile cellular subscriptions (per 1000 people) 2.9 343.6 747.8
Telephone lines (per 1000 people) 8.4 7.0 5.9
Sources : ADB Statistics Department Databases; World Bank: World Development Indicators; last update :
UNAIDS; UNSD; WHO, UNICEF, WRI, UNDP; Country Reports,
Note : n,a, : Not Applicable ; … : Data Not Available,1 Latest year available in the period 1990-1999; 2 Latest year available in the period 2000-2009; 3 Latest year available in the period 2010-2014
June , 2015
0
200
400
600
800
1990 2000 2013
Incidence of tuberculosis (per 100,000 people)
0.0
20.0
40.0
60.0
80.0
1990 2000 2013
Employment to population ratio, 15+, total (%)
0.0
20.0
40.0
60.0
80.0
100.0
1990 2000 2012-13
Primary completion rate, total
0.0
50.0
100.0
150.0
1990 2000 2012-14
Ratio of female to male primary enrollment
0.0
50.0
100.0
150.0
1990 2000 2013
Mortality rate, infant (per 1000 live births)
0.0
200.0
400.0
600.0
800.0
1990 2000 2013
Maternal mortality ratio (modeled estimate, per 100,000 live births)
0.0
200.0
400.0
600.0
800.0
1990 2000 2013
Mobile cellular subscriptions (per 1000 people)
0
20
40
60
80
1990 2000 2012
Improved water source(%)

XVII
ANNEX I: COMPARATIVE SOCIO ECONOMIC INDICATORS

XVIII
ANNEX J: RISK AND DEBT ANALYSIS
Zambia obtained debt relief in 2006 and was
able to maintain a sustainable external debt
growth until 2012. From 2012 when Zambia
accessed the first Eurobond of USD 750
million, external debt growth increased. The
need to finance public infrastructure and fill
expenditure gaps in the national budget
increased external and domestic lending.
Combined with significant depreciation of
the Kwacha in 2015, debt ratios, deteriorated.
Debt servicing to revenue is estimated at 24% in 2016, while to exports remains below 5% of
exports.
Zambia has accessed a total of USD 3 billion on the
international financial markets since 2012 in addition
to concessional and non-concessional borrowing.
Eurobonds account for the majority of external debt
composition in 2016, Figure 6. The cost of Eurobond
finance rose from 5.3% in 2012 to over 9% in 2015
adding to higher debt service payments. In 2016,
Zambia did not access the Eurobond market with the
high cost of funding at about 10%. Financing of public
spending was instead done through a drawdown on
external reserves, issuance of domestic bonds and
allowing build-ups of domestic arrears. The increase in
arrears is estimated at 5% of GDP for 2016. The 2016
redemption profile indicates that in the next 5 years the
primary redemptions are domestic debt. As of 2022,
Figure 7, when the 2012 Eurobond expires external
redemptions start to dominate. External redemptions in 2022 and 2024 stand out, while the
2015 Eurobond was sequenced in three expiring bonds in 2025-2027.
The Government clearly states that “we can only spend what we have”. Plans for 2017 are to
launch a medium term debt strategy and closely monitor exchange rate risk, interest rates and
refinancing options. Domestic government securities will remain an important instrument for
budget financing. The policy is to move towards longer dated bonds which will help re-profile
the debt and the principal
repayments. The Government
has also stated that there is
need to slow down capital
infrastructure investments
while sourcing more funding
through public private
partnerships and joint
ventures.
According to the
Government’s draft Medium
Term Debt Strategy 2017-2021
the total external debt
amounted to USD 6.5 billion in
2016, while domestic debt
Table 3: Key debt indicators for selected years
Indicators 2011 2016 2021
Domestic debt (% of GDP) 12.1 11.6 13.8
External debt (% of GDP) 6.6 32.5 43.6
Arrears, stock (% of GDP) 8.8
External (%) of total debt 35.3 72.3 74.7
Debt Servicing (% of GDP) 2.8 2.5
Source: Draft Medium Term Debt Strategy 2017-2019, and
Draft 2017 Debt Sustainability Analysis, Ministry of Finance.
Figure 6: Composition of External Debt
(2016, pct.)
Figure 7: Redemption Profile as at end-2016 (K billions)

XIX
amounted to USD 2.5 billion2. In addition the stock of arrears according to Government
estimates amounts to 8.8% of GDP. Based on the Governments Debt Strategy the plan is to
increase the maturity to reduce the refinancing risk by shifting towards longer dated papers.
Close to 59% of domestic securities in 2016 are 24 month or longer compared to 33% in 2013.
At the same time the plan is to maintain the current exchange rate risk with only one foreign
currency bond issuance in 2017 and no additional issuances up to an including 2021. New
external debt to be contracted will be concessionary or semi-concessionary financing from
international financial institutions. This will slow the growth in external debt accumulation in
the medium term.
Furthermore, according to the Governments draft 2017 Debt Sustainability Analysis3 Zambia
is at high risk of a deterioration in its external debt dynamics. This is a shift from the previous
classification of moderate risk in the 2014 Debt Sustainability Analysis. Under the baseline and
alternative scenarios, all external debt sustainability indicators remain below their applicable
thresholds, but the debt service-to-revenue ratio breaches the threshold under various external
shocks. Breaches coincide with Eurobond repayments during 2022 to 2027 period. Zambia’s
overall public sector debt dynamics are sustainable under the baseline. However, the large
primary balance deficits underscores the need for improving the fiscal position.
The Government is fully aware of the need to improve its fiscal performance and reduce its
deficit in order to move onto a sustainable debt trajectory. Regaining budget credibility and
market confidence will be critical factors as the date for the first Eurobond repayment in 2022
gets closer. Addressing the fiscal deficit and proving that Zambia can reduce the fiscal deficit
will be the Governments core priorities in the next 5 years. The Government has clearly
indicated that it will …embark on fiscal consolidation, which will ensure the rationalization of
expenditures and enhancement of revenue mobilization. …in order to guarantee Zambia’s debt
carrying capacity, Government commits to apply loan proceeds to projects with high rate of
return so as to achieve higher GDP growth.
2 According to Bank of Zambia data the total outstanding domestic bonds and treasuries as of end 2016,
amounted to K 31.9 billion, about USD 3.2 billion. 3 The IMF is expected to provide an updated DSA during the third quarter of 2017 as part of the Article IV
report. This update is likely only to be available after September 13, 2017.

XX
ANNEX K: SUMMARY OF FIDUCIARY RISK ASSESSMENT REPORT 2016
Introduction
The Bank updated the Zambia Country Fiduciary Risk Assessment with the objective to assess
the level of fiduciary risk associated with the country’s Public Financial Management (PFM)
Systems in order to determine the level of recommended use of the system in the context of the
proposed Country Strategy. The analysis was done through the review of the core elements of
the PFM system namely; budget, treasury, accounting and reporting, internal controls, external
audit, corruption and procurement. The overall fiduciary risk is still assessed as substantial,
with a positive trajectory of change primarily based on progress so far made from the
implementation of agreed reform activities within the PFM reform strategy, as also alluded to
in the latest 2016 PEFA Report.
Overall Public Financial Management Systems Performance and Level of Recommended Use
Noticeable achievements include; i) drafting of the Planning and Budgeting bill through an
extensive consultative process, ii) piloting of output-based budgeting in two ministries, iii)
revision of the PFM Act to align it with the requirements of the new constitution, iv) improved
IFMIS functionality and increased rollout to 44 Ministries, Provinces and other Spending
Agencies, out of the first phase target of 50, v) piloting/rollout of Treasury Single Account in
seven sites to improve predictability in disbursements and effective management of bank
balances, vi) equipping Internal Audit with a robust set of methodological tools (manuals,
Computer Assisted Audit Tools and trained staff), and vii) progress made in reforming the Office
of the Auditor General to enhance its independence and effectiveness.
While commending the Government for progress achieved so far under the ongoing reforms,
there is pressing need to expedite action in implementing the remaining reform activities under
the ongoing Public Financial Management Reform Program to further strengthen the PFM
environment. The review identified the following areas of weaknesses concerning fiduciary risk:
i) the need to enhance clarity in leadership and accountability arrangements for addressing or
facilitating IFMIS implementation progress; ii) weak coordination between IFMIS business unit
and IFMIS technical unit; iii) absence of a long term strategy for IFMIS; iv) address periods of
uncertainty in rolling out the Treasury Single Account due to unresolved simple technical issues;
v) uncertainty on the implementation of the proposed Risk Management Framework by Internal
Audit across Government; vi) delays in mainstreaming IFMIS team structure fully into
government structure and vii) weak commitment controls and functionality gaps in IFMIS
(including weak integration capability with other systems including tax and customs revenue
systems, payroll, e-procurement and the debt management system-CS-DRMS). The ongoing
Reform Program, coordinated by the World Bank with support from cooperating partners, will
help to correct deficiencies in the short to medium term.
Given the level of fiduciary risk and the positive trajectory of change as confirmed by the 2016
Public Expenditure and Financial Analysis (table 4 and 5 below), there is scope for the Bank
to make use of country procedures and systems to the maximum extent possible (including
budget, treasury, accounting and reporting, internal control and external audit systems) with
appropriate mitigation measures incorporated into the design of both Policy-Based Operations
(PBOs) and Public Investment Projects (PIPs). The Bank’s fiduciary capacity building support
Table 4: Public Expenditure and Financial Analysis trends between 2005 and 2016
Core Pillars of PFM Performance 2005 Ratings 2008 Ratings 2012 Ratings 2016 Ratings
A/B C/D A/B C/D A/B C/D A/B C/D
Credibility of the budget 1 3 3 1 0 4 2 2
Comprehensiveness and transparency 2 4 4 2 2 4 5 1
Policy-based budgeting 1 1 1 1 2 0 1 1
Predictability and control in budget execution 1 8 2 7 2 7 2 7
Accounting, recording and reporting 0 4 2 2 2 2 2 2
External scrutiny and audit 1 2 1 2 1 2 2 1
Total 6 22 13 15 9 19 14 14
Source: Report on the Evaluation of the Public Financial Management System of Zambia (forthcoming)

XXI
will explore the possibility of contributing towards the implementation of GRZ’s ongoing PFM
Reform Strategy currently being supported by PFM CPs in Zambia.
Procurement Review
The procurement law and code has been reviewed in 2016 using the Bank’s customized 21
critical sub-indicators of the MAPS for the use of Borrower Procurement System and the
deviations in the regulatory framework are not significant to impact on the Bank’s fiduciary
compliance standards.
The key identified risks relate to the complaint review mechanism, eligibility and mandatory
joint ventures. The Lack of an Independent Complaint Mechanism would affect the operation,
especially in the application of National Procurement Procedures to International Competitive
Bidding. Although a Review Panel is provided in the Act, the Panel is appointed by the Director
General of the Zambia Public Procurement Authority and from within the members of staff.
Therefore the Act does not provide for an Independent Procurement Review Panel, but gives
the Authority mandate to deal with complaints and appeals from bidders. The exclusion of
International Participation in National competitive bidding opportunities would also equally
affect operations because under the Borrower System participation in open national bidding is
limited to citizens and local bidders only.
The provision of mandatory Joint Ventures with local firms under International Competitive
Bidding affects fair participation. The imposition of this condition is considered restrictive to
international open bidding practices.
As for the National Standard Bidding document for goods, works, and services, including
General Conditions of Contracts for public sector contracts have been reviewed and the risk of
their use is rated moderate due to the following reasons:
the National Standard Tender documents have provided for standard and mandatory set of
clauses reflective of the legal framework in the country,
the Bidding Documents establish the minimum content of the tender documents which is
relevant and sufficient for tenderers to be able to respond to the employer’s requirements,
the documents requires the use of neutral specifications and recognizes standards which
are equivalent when neutral specifications are not available,
the Bidding documents include sample contracts covering the General Conditions of
contract,
the Bidding Documents are accessible and available for use by all public procuring entities,
the dispute resolution mechanisms for bidders and enforcement procedures are outlined in
the regulations, and
the Public Procurement regulations have standardized the minimum content of the bidding
documents and the procedural requirements in using such documents.
The Legal framework, organization, policy, and procedures providing for internal and external
control and audit of public procurement which enforces the proper application of laws,
regulations and procedures, have been assessed. The risk for its use is rated low, due to the
following reasons:
The internal controls in the Country are reliable and reasonably effective. The office of the
Auditor General is mandated to Audit Public expenditure annually and the findings are
presented to the Public Accounts Committee of Parliament. This is covered in the Financial
Management Act. Internal Audits are also carried out as transactions are done within the
government operations.
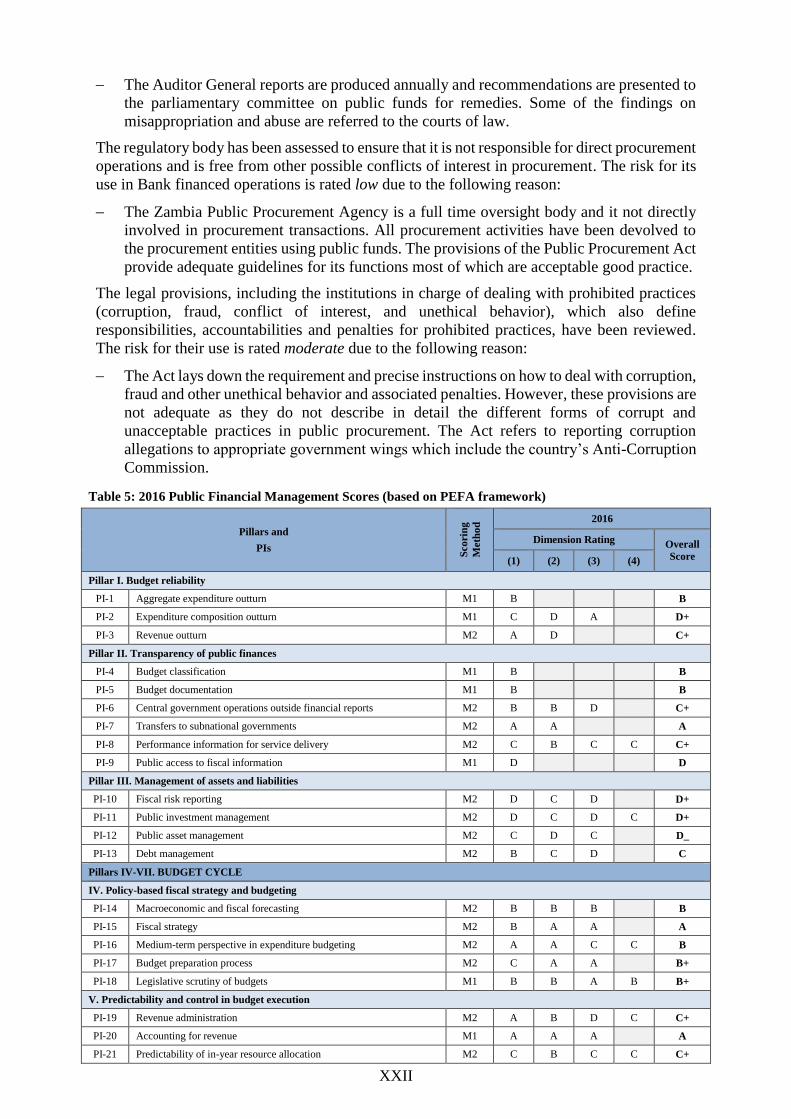
XXII
The Auditor General reports are produced annually and recommendations are presented to
the parliamentary committee on public funds for remedies. Some of the findings on
misappropriation and abuse are referred to the courts of law.
The regulatory body has been assessed to ensure that it is not responsible for direct procurement
operations and is free from other possible conflicts of interest in procurement. The risk for its
use in Bank financed operations is rated low due to the following reason:
The Zambia Public Procurement Agency is a full time oversight body and it not directly
involved in procurement transactions. All procurement activities have been devolved to
the procurement entities using public funds. The provisions of the Public Procurement Act
provide adequate guidelines for its functions most of which are acceptable good practice.
The legal provisions, including the institutions in charge of dealing with prohibited practices
(corruption, fraud, conflict of interest, and unethical behavior), which also define
responsibilities, accountabilities and penalties for prohibited practices, have been reviewed.
The risk for their use is rated moderate due to the following reason:
The Act lays down the requirement and precise instructions on how to deal with corruption,
fraud and other unethical behavior and associated penalties. However, these provisions are
not adequate as they do not describe in detail the different forms of corrupt and
unacceptable practices in public procurement. The Act refers to reporting corruption
allegations to appropriate government wings which include the country’s Anti-Corruption
Commission.
Table 5: 2016 Public Financial Management Scores (based on PEFA framework)
Pillars and
PIs
Sco
rin
g
Meth
od
2016
Dimension Rating Overall
Score (1) (2) (3) (4)
Pillar I. Budget reliability
PI-1 Aggregate expenditure outturn M1 B B
PI-2 Expenditure composition outturn M1 C D A D+
PI-3 Revenue outturn M2 A D C+
Pillar II. Transparency of public finances
PI-4 Budget classification M1 B B
PI-5 Budget documentation M1 B B
PI-6 Central government operations outside financial reports M2 B B D C+
PI-7 Transfers to subnational governments M2 A A A
PI-8 Performance information for service delivery M2 C B C C C+
PI-9 Public access to fiscal information M1 D D
Pillar III. Management of assets and liabilities
PI-10 Fiscal risk reporting M2 D C D D+
PI-11 Public investment management M2 D C D C D+
PI-12 Public asset management M2 C D C D_
PI-13 Debt management M2 B C D C
Pillars IV-VII. BUDGET CYCLE
IV. Policy-based fiscal strategy and budgeting
PI-14 Macroeconomic and fiscal forecasting M2 B B B B
PI-15 Fiscal strategy M2 B A A A
PI-16 Medium-term perspective in expenditure budgeting M2 A A C C B
PI-17 Budget preparation process M2 C A A B+
PI-18 Legislative scrutiny of budgets M1 B B A B B+
V. Predictability and control in budget execution
PI-19 Revenue administration M2 A B D C C+
PI-20 Accounting for revenue M1 A A A A
PI-21 Predictability of in-year resource allocation M2 C B C C C+

XXIII
Table 5: 2016 Public Financial Management Scores (based on PEFA framework)
Pillars and
PIs
Sco
rin
g
Meth
od
2016
Dimension Rating Overall
Score (1) (2) (3) (4)
PI-22 Expenditure arrears M1 D B D+
PI-23 Payroll controls M1 A B A C C+
PI-24 Procurement management M2 C B C B C+
PI-25 Internal controls on non-salary expenditure M2 A C C B
PI-26 Internal audit M1 C B C C C+
VI. Accounting and reporting
PI-27 Financial data integrity M2 C C C B C+
PI-28 In-year budget reports M1 C D C D+
PI-29 Annual financial reports M1 A B B B+
VII. External scrutiny and audit
PI-30 External audit M1 A B B B B+
PI-31 Legislative scrutiny of audit reports M2 C A B A B+
Source: Report on the Evaluation of the Public Financial Management System of Zambia (forthcoming)
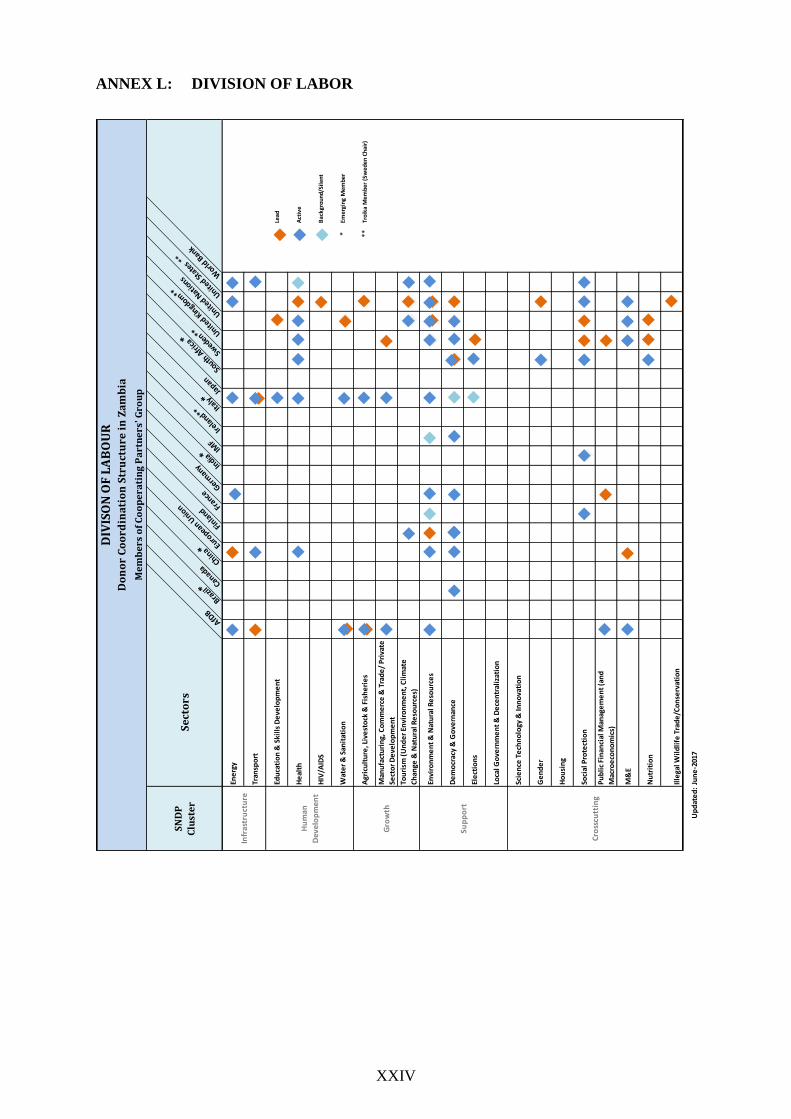
XXIV
ANNEX L: DIVISION OF LABOR
Me
mb
ers
of
Co
op
era
tin
g P
art
ne
rs' G
rou
p
DIV
ISO
N O
F L
AB
OU
RD
on
or
Co
ord
ina
tio
n S
tru
ctu
re i
n Z
am
bia
SN
DP
Clu
ste
rS
ect
ors
AfDB
Brazil
* CanadaChin
a* European U
nion
Finla
nd France
Germany In
dia* IM
F
Irela
nd** Italy
* Japan
South A
frica
*
Sweden** Unite
d Kin
gdom**
United N
ations
United St
ates *
*
World
Bank
Ene
rgy
Tran
spo
rt
Edu
cati
on
& S
kill
s D
eve
lop
me
nt
Lead
He
alth
Act
ive
HIV
/AID
SB
ackg
roun
d/Si
lent
Wat
er
& S
anit
atio
n*
Emer
ging
Mem
ber
Agr
icu
ltu
re, L
ive
sto
ck &
Fis
he
rie
s**
Troi
ka M
embe
r (S
wed
en C
hair
)
Man
ufa
ctu
rin
g, C
om
me
rce
& T
rad
e/
Pri
vate
Sect
or
De
velo
pm
en
t
Tou
rism
(U
nd
er
Envi
ron
me
nt,
Cli
mat
e
Ch
ange
& N
atu
ral R
eso
urc
es)
Envi
ron
me
nt
& N
atu
ral R
eso
urc
es
De
mo
crac
y &
Go
vern
ance
Ele
ctio
ns
Loca
l Go
vern
me
nt
& D
ece
ntr
aliz
atio
n
Scie
nce
Te
chn
olo
gy &
Inn
ova
tio
n
Ge
nd
er
Ho
usi
ng
Soci
al P
rote
ctio
n
Pu
bli
c Fi
nan
cial
Man
age
me
nt
(an
d
Mac
roe
con
om
ics)
M&
E
Nu
trit
ion
Ille
gal W
ild
life
Tra
de
/Co
nse
rvat
ion
Up
dat
ed
:Ju
ne
-201
7
Sup
po
rt
Infr
astr
uct
ure
Hu
man
Dev
elo
pm
ent
Gro
wth
Cro
sscu
ttin
g

XXV
ANNEX M: ANALYTICAL REPORTS CONSULTED
African Development Bank (2010), Zambia CSP 2011-2015.
African Development Bank (2013), Zambia CSP 2011-2015 and CPPR midterm review.
African Development Bank (2013), 10-year Strategy.
African Development Bank (2013), Zambia skills development study - Constraints and
prospects.
African Development Bank (2015), Zambia Manufacturing Study.
African Development Bank (2015), Zambia Private Sector Profile.
African Development Bank (2016), Zambia Issues Paper.
Bwalya, P.K. et al. (2011), An analysis of constraints to inclusive growth in Zambia.
Millennium Challenge Account, Lusaka, Zambia.
Central Statistics Office (2010), Living Conditions and Monitoring Survey. Central Statistics
Office, Lusaka, Zambia.
Central Statistics Office (2012), Zambia Labor Force Survey Report, Central Statistics
Office, Ministry of Labor and Social Security, Lusaka, Zambia.
Central Statistical Office, Ministry of Health, and ICF International, (2014), Zambia
Demographic and Health Survey 2013-14. Rockville, Maryland, USA: Central
Statistical Office, Ministry of Health, and ICF International.
Finscope (2015), Finscope Zambia 2015.
GRZ-CPG, (2014), Zambia’s Way Forward: Job Creation to Promote Inclusive Growth,
High Level Stakeholder Dialogue.
Ianchovichina, E. & Lundstrom, S. (2008), What are the Constraints to Inclusive Growth in
Zambia? World Bank.
IMF (2015), Zambia Article IV Report.
International Council on Mining and Metals (2014), Enhancing Mining’s Contribution to the
Zambian Economy and Society. Chamber of Mines, Zambia.
Kalula, E. et al. (2013), Zambia labor law reform Issues paper. International Labor
Organization, Zambia.
Mason, N.M., Jayne, T.S., & Mofya-Mukuka, R. (2013), Zambia’s Input Subsidy Programs,
Agricultural Economics 44, 613-628.
Meeuws, R. (2004), Zambia – Trade and Transport Facilitation Audit. World Bank.
Ministry of Commerce, Trade and Industry (2013), Strategy paper on Industrialization and
Job Creation. Lusaka, Zambia.
Ministry of National Development Planning (forthcoming), draft Seventh National
Development Plan 2017-2021.
Ministry of National Development Planning (forthcoming), draft Zambia’s Vision 2030
National Performance Framework: Strategic Objectives, Long-Term Outcomes, Key
Performance Indicators, Pathways To Change, And National Measurement Indicators
2017 -2030.
Ministry of Finance (forthcoming), draft Medium Term Debt Management Strategy 2017 –
2019.
Ministry of Finance (forthcoming), draft Zambia Debt Sustainability Analysis, May 2017.
Ministry of Finance (forthcoming), draft Zambia Economic Recovery Program.
XXVI
Ministry of Finance (2015), Medium Term Expenditure Framework 2016-2018. Lusaka,
Zambia.
Ministry of Finance (2013), Revised-Sixth National Development Plan 2013-2016 (Vol. 1) –
People Centered Economic Growth and Development. Lusaka, Zambia.
Ministry of Finance (2013), Revised-Sixth National Development Plan 2013-2016 (Vol. 2) –
People Centered Economic Growth and Development. Lusaka, Zambia.
Ministry of Finance (2006), Vision 2030 – A prosperous Middle-Income Nation by 2030.
Lusaka, Zambia.
Report on the Evaluation of the Public Financial Management System of Zambia
(forthcoming).
SADC (2012), Regional Infrastructure Development Master Plan - Transport Sector Plan.
World Bank (2011), Zambia More Jobs and Prosperity in Zambia: What would it take? Jobs
and Prosperity: Building Zambia’s Competitiveness Program. Report No. 62376-ZM.
World Bank (2014), Doing Business 2015: Going Beyond Efficiency, Zambia Profile.
Washington, DC: World Bank Group. DOI: 10.1596/978-1-4648-0351-2.
Zambia Business Survey (2010), The profile and productivity of Zambian businesses.