zambia 2008 district profile for senanga · zambia 2008 district profile for senanga goal 1-9 10-12...
TRANSCRIPT

Zambia 2008 District Profile for Senanga
Goal
1-9 10-12
Female Pupils 12,548 599 NIR 74%
Male Pupils 13,694 827 NER 96%
Survival to G9 27%
Teachers 647 108
Pupil-Teacher Ratio 43
Schools 115 4 Teacher Attrition Rate 19%
Classrooms 548 50 % Teachers Qualified 90%
Textbooks 64,165 3,076 Pupil-Book Ratio 1.8
ANALYSIS
Grades Actual
Value
Basic School At a glance
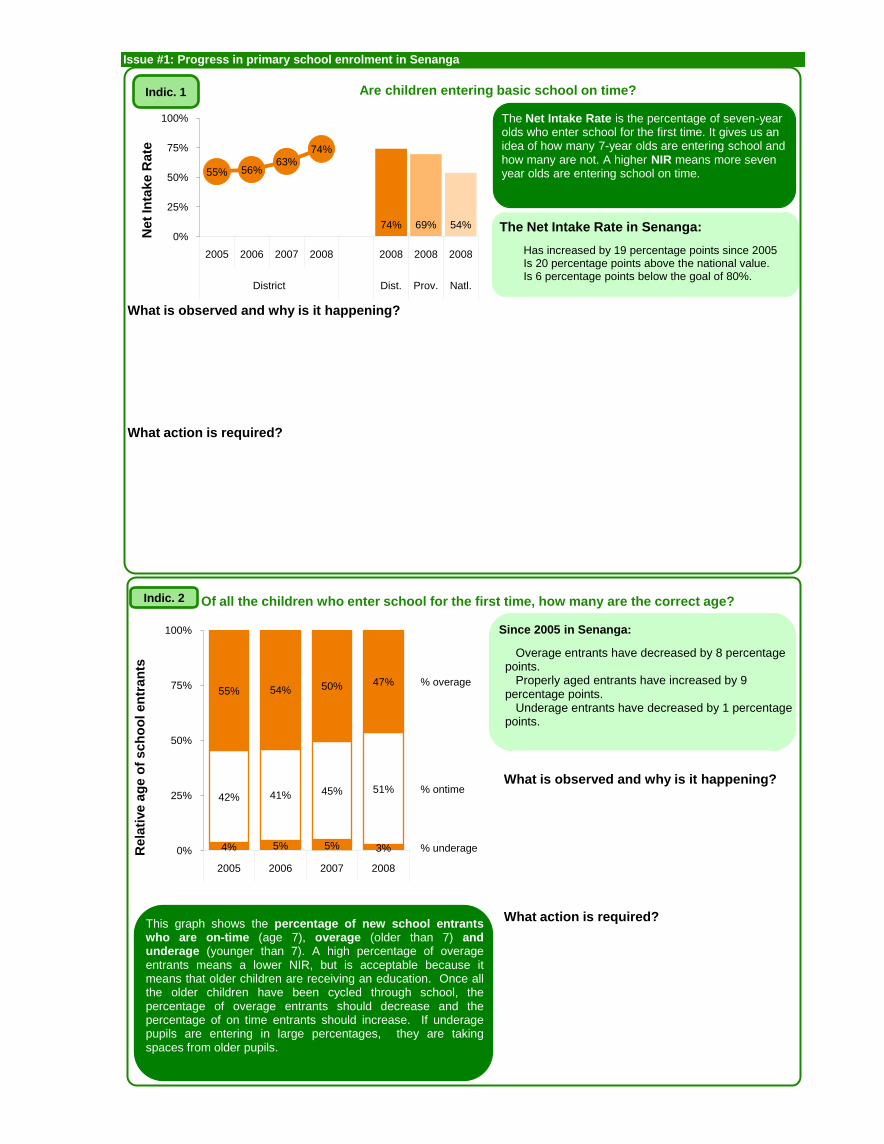
Issue #1: Progress in primary school enrolment in Senanga
Since 2005 in Senanga:
The Net Intake Rate is the percentage of seven-year olds who enter school for the first time. It gives us an idea of how many 7-year olds are entering school and how many are not. A higher NIR means more seven year olds are entering school on time.
What is observed and why is it happening?
What action is required?
Are children entering basic school on time?
Net
Inta
ke R
ate
The Net Intake Rate in Senanga:
Has increased by 19 percentage points since 2005Is 20 percentage points above the national value.Is 6 percentage points below the goal of 80%.
74% 69% 54%
55% 56%63%
74%
0%
25%
50%
75%
100%
2005 2006 2007 2008 2008 2008 2008
District Dist. Prov. Natl.
Indic. 1
This graph shows the percentage of new school entrantswho are on-time (age 7), overage (older than 7) andunderage (younger than 7). A high percentage of overageentrants means a lower NIR, but is acceptable because itmeans that older children are receiving an education. Once allthe older children have been cycled through school, thepercentage of overage entrants should decrease and thepercentage of on time entrants should increase. If underagepupils are entering in large percentages, they are takingspaces from older pupils.
Of all the children who enter school for the first time, how many are the correct age?Indic. 2
What is observed and why is it happening?
What action is required?
4% 5% 5% 3%
42% 41% 45% 51%
55% 54% 50% 47%
% underage
% ontime
% overage
0%
25%
50%
75%
100%
2005 2006 2007 2008
Overage entrants have decreased by 8 percentage points.
Properly aged entrants have increased by 9 percentage points.
Underage entrants have decreased by 1 percentage points.
Rela
tive a
ge
of
sc
ho
ol en
tra
nts

What is observed and why is it happening?
What action is required?
Are all basic school age children enrolled in basic school?
Ba
sic
NE
R
The Net Enrollment Rate in Senanga:
Has increased by 10 percentage points since 2005Is 6 percentage points below the national average.Is 16 percentage points above the goal of 80%.
96% 102% 103%
86% 88% 91%96%
0%
25%
50%
75%
100%
125%
2005 2006 2007 2008 2008 2008 2008
District Dist. Prov. Natl.
The Basic Net Enrollment Rate is the percentage ofbasic-aged (ages 7-15) children who are enrolled in basicschool (grades 1-9). A higher Basic NER means morechildren are attending school at the correct age.
Indic. 3
2,223
1,868
1,864
1,680
1,521
1,341
1,295
759
780
2,106
1,910
1,924
1,729
1,494
1,230
1,182
681
655
1
2
3
4
5
6
7
8
9
Gra
de
Are girls and boys enrolled in equal numbers?Indic. 4
The Gender Parity Index in Senanga:
Is within 0.03 of the national goal of 1 for grades 1-9.
Is highest in grades 1-4, with 1 girls per boy.Is lowest in grades 8-9, with 0.87 girls per boy.
The Gender Parity Index is the ratio of female tomale pupils. A GPI larger than one mean there aremore females than males in school. A GPI smallerthan one means there are less females per male inschool. A GPI of 1 is desirable because it meansthere is an equal number of males and females inschool.
What is observed and why is it happening?
What action is required?
Ge
nd
er
Pari
ty In
dex
Grade 1-9GPI: 0.97
Grade 8-9GPI: 0.87
Grade 5-7GPI: 0.94
Grade 1-4GPI: 1

ISSUE #2: Efficiency in Senanga
The Grade 1-9 Multi Grade Survival Rate isthe percentage of pupils enrolled in grade 1during the current school year who areexpected to reach grade 9, no matter how manyyears It is estimated using data from a singleyear. A higher survival rate means more pupilsare expected to reach grade 9 and less dropout.
What is observed and why is it happening?
What action is required?
How many first-grade pupils will reach grade 9?
Gra
de
1-9
Mu
lti G
rad
e S
urv
iva
l R
ate
The top reasons that students in grades 5-9 left schoolas reported by school head-masters. Headmasters maynot always know the exact reason.
What is observed and why is it happening?
What action is required?
Why do children in grades 5-9 drop out before completing basic school?
The Grade 1-9 Multi Grade Survival Rate in Senanga:
Has increased by 7 percentage points since 2005
Is 8 percentage points below the national average.
Is 53 percentage points below the goal of 80%.
27% 33% 34%
20%26% 25% 27%
0%
25%
50%
75%
100%
2005 2006 2007 2008 2008 2008 2008
Indic. 5
Indic. 6
3%
4%
13%
33%
43%
5%
10%
14%
18%
52%
0% 10% 20% 30% 40% 50% 60%
Death
Marriage
Orphaned
Other
Economic
Orphaned
Other
Marriage
Economic
Pregnancy
Male
Fem
ale

100%
99%
84%
91%
77%
58%
80%
49%
34%
Urban
100%
86%
83%
74%
62%
48%
43%
25%
26%
Rural
100% 50% 0 50% 100%
Grade 1
Grade 2
Grade 3
Grade 4
Grade 5
Grade 6
Grade 7
Grade 8
Grade 9
Are some Grade 1 students less likely than others to reach higher grades of Basic School?
These pyramids compare the multi-grade survival rates for a grade 1 pupil from different education situations.When one group has a lower survival rate to a particular grade, pupils from that group are less likely to reachthat grade.
What is observed and why is it happening?
What action is required?
In Senanga, students are less likely to stay in school through grade 9 if they are female or if they attend a rural or community school.
26% of rural school entrants will reach grade 9 as compared with 34% of urban entrants.
25% of female school entrants will reach grade 9 as compared with 28% of male entrants.
0% of community school entrants will reach grade 9 as compared with 33% of government school entrants.
Indic.7
100%
84%
80%
73%
62%
50%
47%
27%
28%
Male
100%
91%
87%
78%
63%
48%
44%
26%
25%
Female
100% 50% 0 50% 100%
Grade 1
Grade 2
Grade 3
Grade 4
Grade 5
Grade 6
Grade 7
Grade 8
Grade 9
100%
88%
88%
79%
70%
59%
58%
34%
33%
Govt.
100%
88%
70%
62%
36%
9%
3%
Comm.
100% 50% 0 50% 100%
Grade 1
Grade 2
Grade 3
Grade 4
Grade 5
Grade 6
Grade 7
Grade 8
Grade 9

ISSUE #3: Are children learning?
What is observed and why is it happening?
What action is required?
How do children perform on the Grade 7 exam?
The Grade 7 Exam is designed to measure individual students' learning levelsat the end of grade 7. Exams are a common measure of learning, thoughcritics argue that students with a high knowledge level could perform poorly ifthey are not good at taking tests.
Exam scores are tabulated according to wher the test is taken rather thanwhere a pupil attends school. For example, if a community school pupil travelsto a government school to take the exam, then their score is recorded as agovernment school score. Because of this, the Urb./Rur and Comm./Govt.scores i n the graph may not reflect learning levels properly.
Not all grade 7 pupils sit for the exam, which means that exam scores may notbe representative of the learning level of all grade 7 pupils. If high achievingpupils take the exam and low achieving pupils avoid it, then the average scoresrepresent the learning level of high achievers more than that of low achievers.
The average Grade 7 exam score in Senanga :
Is 21 points higher than the national average.
Is 22 points higher in rural schools than in urban schools.
Is 15 points longer in community schools than in government schools.
Indic. 8
609 599 589 611 589 624 6080
100
200
300
400
500
600
700
2008 2008 2008 Rural Urban Comm. Govt.
Dist. Prov. Natl. District, 2008 District, 2008
Avera
ge
G7
Exa
m S
co
re

Issue #4: How are school resources distributed in Senanga ?
What is observed and why is it happening?
What action is required?
Are there enough basic school teachers for all pupils?
Pu
pil-T
ea
ch
er
Rati
o
How are basic school teachersdistributed by school type?
What is observed and why is it happening?
What action is required?
The Basic Pupil-Teacher Ratio is theaverage number of basic pupils to eachbasic teacher. A higher PTR means thateach teacher is responsible for more pupils.
The Pupil-Teacher Ratio in Senanga:
Has decreased by 7 pupils since 2005.Is 7 pupils lower than the national
average.Is 23 pupils higher than the national goal
Basic Pupil-Teacher Ratio by School Type:
PTR in rural schools is 24 pupils higher than PTR in urban schools.
PTR in community schools is 18 pupils higher than PTR in government schools.
43 48 50
5043 45 43
0
20
40
60
80
2005 2006 2007 2008 2008 2008 2008
District Dist. Prov. Natl.
46 22 59 410
20
40
60
80
Rural Urban Comm. Govt.
District, 2008 District, 2008
Indic. 9
Indic. 10
Pu
pil-T
ea
ch
er
Rati
o

<= 39 40-59 60-119 >= 120 Total
31 43 35 6 115
PTR
# Schools
128
138
140
182
187
310
49
51
51
51
53
53
54
54
55
56
57
58
59
60
61
61
62
63
63
63
64
64
66
67
67
67
69
70
70
72
73
73
73
76
81
85
88
91
91
91
99
99
105
106
107
110
114
116
0 50 100 150 200 250 300 350
Katongo Community School
Simbuyu Community
Lumbe Middle Basic
Notale Community
Lilela Basic
Nang'Wanyi M Basic
Liangati Basic
Maombe Basic
Lipaa Iri Centre
Shekela M. Basic
Suu Middle Basic
Sabelo M. Basic
Silowana Basic
Ukolo M. Basic
Kalamba M. Basic
Lusuma Community School
Lukama Community
Liyoyelo M. Basic
Malombe Middle Basic
Liliachi Basic
Mande M. Basic
Kafula M. Basic
Nambwae Basic
Mapungu Basic
Mabumbu M. Basic
Namukokoba M Basic
Lutunda Community School
Ng'Ala Middle Basic
Likuma Iri Centre
Mutwa Basic
Mwananyanda Community
Lyande Community
Samwinga M. Basic
Nasilimwe M. Basic
Suunda Community
Sikana M Basic
Libumbwandinde Community
Kaanda Community
Lilunga Community
Mwanamwalye Basic
Sitangamanyanga M. Basic
Namiloli Community
Siloloti Community
Lwehumba M Basic School
Mwandi M. Basic
Namuu Community
Sipungu M. Basic
Mbondwe Middle Basic
Suumi Community
Looma Community
Lulambo Community
Namukokoba Community
Muu Community
Kashitu M Basic School
Schools with the highest Grade 1-9 PTR's
In which basic schools are pupil-teacher ratios the largest?
What is observed and why is it happening?
What action is required?
Indic. 11
This page lists the 50 basic schools with the highest G1-G9 pupil-teacher ratios. The schools with the highest ratios arelisted first and have the greatest need for assistance. In a school with a PTR of 60 or less, learning is possible. In a schoolwith a PTR of more than 60, learning is difficult. In a school with a PTR of 120 or more, learning is nearly impossible.Schools with high PTR's may be in need of additional classrooms and other resources as well as teachers.

Tea
ch
er
Att
riti
on
Rate
How many basic school teachers leave their posts every year? The TeacherAttrition Rate isthe percentage ofteachers reportedto have left theirposition in the pastyear. Teachersmay have left foranother teachingpost, or leftteachingaltogether.
A lower TeacherAttrition Ratemeans that lessteachers have lefttheir positionseach year.
What is observed and why is it happening?
What action is required?
Are basic school teachers qualified to teach?
The Teacher Qualification Rateis the percentage of teachers who are known to have a teaching degree, diploma, or certificate. If a teacher's qualification is unknown, they are counted as unqua-lified.
A higher Teacher Qualification Rate means more teachers are qualified to teach.
What is observed and why is it happening?
What action is required?
17% 5% 30% 13% 17% 13%0%
20%
40%
Rural Urban Comm. Govt. Female Male
District, 2008 District, 2008 District, 2008
19% 13% 14%7% 9% 10%
19%
0%
20%
40%
2005 2006 2007 2008 2008 2008 2008
District Dist. Prov. Natl.
89% 96% 12% 98% 93% 88%0%
25%
50%
75%
100%
Rural Urban Comm. Govt. Female Male
District, 2008 District, 2008 District, 2008
90% 90% 87%
91% 91% 92%90%
75%
100%
2005 2006 2007 2008 2008 2008 2008
District Dist. Prov. Natl.
The Teacher Attrition Rate in Senanga:
Has increased by 12 percentage points since 2005.
Is similar to the national average.
Is 14 percentage points above the goal of 5%.
Is 12 percentage points higher for rural teachers.
Is 17 percentage points higher for community school teachers.
Is 4 percentage points higher for female teachers.
The Teacher Qualification Rate in Senanga:
Has remained constant since 2005.
Is similar to the national average.
Is 10 percentage points avove the goal of 80%.
Is 7 percenage points lower for rural teachers.
Is 87 percentage points lower for community school teachers.
Is 5 percentage points higher female teachers.
Indic. 12
Indic. 13

Are there enough math books for basic school pupils?
Pu
pil-B
oo
k R
ati
o
The Basic Pupil-Book Ratio is the number ofprimary pupils for each book. A higher Basic PBRmeans more pupils share each book. This graphuses the PBR for Math books as an indication ofthe PBR across all subjects. Other subjects areequally important and BPR's for these subjects areavailable in Ed*Assist.
What is observed and why is it happening?
What action is required?
The pupil book ratio in Senanga:
Is 0.8 pupils lower than the national average.Is 0.8 pupils higher than the goal of 1.Is 5.1 pupils lower in rural schools.is 2 pupils higher in community schools.
Indic. 15
1.8 1.9 2.6 1.7 6.9 3.4 1.7N/A 1.7 1.8 1.8
0
1
2
3
4
5
6
7
8
2005 2006 2007 2008 2008 2008 2008 Rural Urban Comm. Govt.
District Dist. Prov. Natl. District, 2008 District, 2008
4.0 5.1 6.0 6.10
2
4
6
8
Gr. 1-4 Gr. 5-7 Gr. 8-9 Gr. 10-12
Ho
urs
per
sh
ift
4.8 4.7 4.6 4.8 5.0 4.4 4.80
2
4
6
8
2008 2008 2008 Rural Urban Comm. Govt.
Ho
urs
pe
r s
hif
t
Are basic school pupils' shifts long enough?
Shift duration is the average number of hours out of a school day that a pupil attends school. Higher values mean pupils spend more time learning. 4-6 hours per day is recommended by the Ministry of Education. Shift duration is lower when schools use multiple shifting.
What is observed and why is it happening?
What action is required?
Indic. 14 The average shift duration in Senanga:
Is 0.15 hours longer than the national average.
Is 0.78 hours longer than the goal of 4 hours.
Is 0.27 hours shorter in rural schools than in urban schools.
Is 0.41 hours shorter in community schools than in government schools.
Is 0.03 hours shorter than the goal of 4 hours in grades 1-4.

Are there enough classrooms for basic school pupils?
Pu
pil C
las
sro
om
Rati
o
The Basic Pupil Classroom Ratio is theaverage number of basic pupils for eachclassroom. A higher Pupil Classroom Ratiomeans a larger number of pupils in eachclassroom. In schools that practice multipleshifting, the pupil-classroom ratio is not thesame as the pupil class ratio.
What is observed and why is it happening?
What action is required?
Are basic school classrooms in permanent condition?
% C
las
sro
om
s P
erm
an
en
t
The Percentage of Classrooms in PermanentCondition is the percentage of classrooms thatare reported to be permanent rather thantemporary or incomplete.
What is observed and why is it happening?
What action is required?
Indic. 16
Indic. 17
The number of pupils sharing each classroom in Senanga:
Is 7 pupils below the national average.Is 18 pupils above the goal of 20.2 pupils worse in rural schools than in
urban schools.similar by school type.
The Percentage of classrooms in permanent condition in Senanga:
Is 24 percentage points below the national average
Is 54 percentage points below the goal of 100%
34 percenage points lower for rural schools.46 percentage points lower for community
38 39 46 39 37 33 33
43 4136 38
0
20
40
60
2005 2006 2007 2008 2008 2008 2008 Rural Urban Comm. Govt.
District Dist. Prov. Natl. District, 2008 District, 2008
46% 52% 70% 44% 78% 7% 53%
61%52% 48% 46%
0%
25%
50%
75%
100%
2005 2006 2007 2008 2008 2008 2008 Rural Urban Comm. Govt.
District Dist. Prov. Natl. District, 2008 District, 2008

Issue #5: Overview of secondary schools in Senanga
33% 35% 38%
N/A 51%
38%33%
0%
25%
50%
75%
2005 2006 2007 2008 2008 2008 2008
District Dist. Prov. Natl.
21% 20% 26%
22% 22% 21% 21%
0%
25%
50%
2005 2006 2007 2008 2008 2008 2008
District Dist. Prov. Natl.
Bas
ic t
o S
ec
on
dary
T
ran
sit
ion
Ra
teS
ec
on
dary
En
rollm
en
t R
ate
Indic. 18
Indic. 19
Are students reaching secondary school?
Are all secondary aged children enrolled in secondary school?
The Basic toSecondaryTransition Rate is thepercentage of studentsin the last grade ofbasic school (grade 9)who reach the firstgrade of secondary(grade 10). A higherrate means morepupils are beingpromoted tosecondary.
What is observed and why is it happening?
What action is required?
The Secondary Net Enrollment Rate is the percentage of secondary-aged children who are enrolled in secondary school. A higher Secondary NERmeans more children are attending school at the correct age.
What is observed and why is it happening?
What action is required?

Sec
on
dary
PT
RS
ec
on
da
ry P
CR
Sec
on
dary
PB
R
Indic. 20
Indic. 21
Indic. 22
Are there enough secondary school teachers?
Are there enough secondary school classrooms?
Are there enough secondary school math books?
The Secondary Pupil Teacher Ratio is the average number of secondary pupils for each secondary teacher. A higher Secondary PTR means that each teacher is responsible for more pupils.
The Secondary Pupil-Book Ratio is the number of primary pupils for each book. A higher Secondary BPR means more pupils share each book. This graph gives the BPR for Math books, but ratios for the other subjects are equally important.
The Secondary Pupil Classroom Ratio is the average number of secondary pupils for each classroom. A higher Pupil Classroom Ratio means a larger number of pupils in each classroom.
What is observed and why is it happening?
What action is required?
What is observed and why is it happening?
What action is required?
What is observed and why is it happening?
What action is required?
2.0 1.9 2.5N/A 4.4
76.0
2.002468101214161820222426283032343638404244464850525456586062646668707274767880
2005 2006 2007 2008 2008 2008 2008
District Dist. Prov. Natl.
13 18 190
18 14 13
0
20
40
60
2005 2006 2007 2008 2008 2008 2008
District Dist. Prov. Natl.
37 41 390
45 4237
0
20
40
60
2005 2006 2007 2008 2008 2008 2008
District Dist. Prov. Natl.