zambeef plc fy 2016 financial results presentation(zambia)
TRANSCRIPT

2016 Results

THIS DOCUMENT (“DOCUMENT”) IS STRICTLY CONFIDENTIAL AND IS BEING PROVIDED TO YOU SOLELY FOR YOUR GENERAL BACKROUND INFORMATION. THE DISTRIBUTION OF THIS DOCUMENT MAY BE RESTRICTED BY LAW. ACCORDINGLY, THIS DOCUMENT MAY NOT BE DISTRIBUTED IN ANY JURISDICTION EXCEPT IN ACCORDANCE WITH THE LEGAL REQUIREMENTS APPLICABLE TO SUCH JURISDICTION. IN PARTICULAR, YOU MAY NOT DISTRIBUTE, FORWARD, REPRODUCE, TRANSMIT OR OTHERWISE MAKE AVAILABLE THIS DOCUMENT OR DISCLOSE ANY INFORMATION CONTAINED IN IT OR CONVEYED DURING ANY ACCOMPANYING ORAL PRESENTATION (THE “INFORMATION”) , IN WHOLE OR IN PART, DIRECTLY OR INDIRECTLY, IN THE UNITED STATES, AUSTRALIA, CANADA OR JAPAN, OR IN ANY OTHER JURISDICTION WHERE TO DO SO WOULD BE UNLAWFUL. FAILURE TO COMPLY WITH THESE RESTRICTIONS MAY CONSTITUTE A VIOLATION OF APPLICABLE SECURITIES LAWS. PERSONS INTO WHOSE POSSESSION THIS DOCUMENT COMES ARE REQUIRED BY THE COMPANY TO INFORM THEMSELVES ABOUT AND TO OBSERVE ANY SUCH RESTRICTIONS. NEITHER ZAMBEEF PRODUCTS PLC (“THE COMPANY”) NOR ITS DIRECTORS, OFFICERS, EMPLOYEES, RESPECTIVE AFFILIATES, SUBSIDIARIES, AGENTS OR ADVISERS ACCEPT ANY LIABILITY TO ANY PERSON IN RELATION TO THE DISTRIBUTION OR POSSESSION OF THIS DOCUMENT IN OR FROM ANY JURISDICTION.
The Document and the Information have been prepared by or on behalf of, and are the sole responsibility of, the Company. The Information is being provided to you during an oral presentation (the “Presentation”) and is not a complete record of that discussion. The Information does not purport to be full or complete and does not constitute investment advice. No representation or warranty, express or implied, is given by or on behalf of the Company, its affiliates, agents or advisers or any other person as to, and no reliance may be placed for any purposes whatsoever on, the adequacy, accuracy, completeness, fairness or reasonableness of the Information. None of the Information has been independently verified by the Company, its affiliates, agents or advisers or any other person, and no liability or responsibility whatsoever is accepted by any of them for any loss howsoever arising, directly or indirectly, from any use of the Information or otherwise arising in connection therewith. The Company, its affiliates, agents and advisers do not undertake and are not under any duty to update this Document or to correct any inaccuracies in the Information which may become apparent, or to provide you with any additional information.
The sole purpose of this Document and the Presentation is to provide background information to assist you in obtaining a general understanding of the business of the Company. Neither this Document nor the Presentation constitute an offer to sell, or a solicitation of an offer to buy or subscribe for, securities of the Company in any jurisdiction. Neither this Document nor the Presentation are intended to provide the basis of any investment decision, financing or any other evaluation and are not to be considered as a recommendation by the Company, its affiliates, agents or advisers that any recipient of this Document purchase or subscribe for any securities in the Company. Each recipient of this Document contemplating any investment in the Company is required to make and will be deemed to have made its own independent investigation and appraisal of the business, results of operations, financial condition, liquidity, performance and prospects of the Company and the merits and risks of an investment in the securities of the Company. The delivery of this Document at any time does not imply that the information in it is correct as of any time after its date, or that there has been no change in the business, results of operations, financial condition, liquidity, performance and prospects of the Company since that date and no obligations is accepted to update any such information after the date of the Document. No person affiliated with the Company, their directors, officers, employees, respective affiliates, agents or advisers has been authorised to give any information or to make any representation not contained in this Document and, if given or made, such information or representation must not be relied upon.
The securities of the Company have not been, and will not be, registered under the US Securities Act of 1933, as amended (the "Securities Act") and may not be offered, sold, transferred or delivered, directly or indirectly, within the United States except pursuant to an exemption from, or in a transaction not subject to, the registration requirements of the Securities Act.
This Document and the Presentation have not been approved by an authorised person pursuant to Section 21 of the Financial Services and Markets ACT 2000and accordingly, in the United Kingdom, this Document and the Presentation are directed solely at persons having professional experience in matters relating to investments and who are investment professionals as specified in Article 19(5) of the Financial Services and Markets Act 2000 (Financial Promotion) Order 2005 (the "Financial Promotions Order"), to persons who are high net worth companies, unincorporated associations or high value trusts as specified in Article 49(2) of the Financial Promotion Order or to any other persons to whom it may lawfully be communicated (all such persons together being referred to as "relevant persons"). This Document and the Presentation must not be acted on and relied upon by any other person. Any investment or investment activity to which this communication relates to is available to relevant persons and will be engaged in only with relevant persons. In addition to the foregoing restrictions, this Document and the Presentation are made and directed only at persons falling within the meaning of "qualified investors" as defined in section 86 of the Financial Services and Markets Act 2000 (as amended).
This Document may contain forward-looking statements, including, but not limited to, statements as to the Company’s business, results of operations, financial condition, liquidity, performance and prospects and trends and developments in the markets in which the Company operates. Forward-looking statements include all statements other than statements of historical fact and in some cases may be identified by terms such as “targets”, “believes”, “expects”, “anticipates”, “estimates”, “aims”, “intends”, “will”, “may”, “would”, “could” or, in each case, their negative or comparable terms. By their nature, forward-looking statements involve risk and uncertainty because they relate to future events and circumstances that may or may not occur. A number of factors, which may be beyond the control of the Company, its affiliates, agents and advisers, could cause actual results and developments to differ materially from those expressed or implied by the forward-looking statements. Forward-looking statements in this Document reflect the Company’s view with respect to future events as at the date hereof and are subject to known and unknown risks, uncertainties and assumptions relating to the Company’s operations, results of operations, financial condition, growth, strategy, liquidity and the markets in which the Company operates. No assurances can be given that the forward-looking statements in this Document will be realised. Forward-looking statements are not guarantees of future performance. The Company, its affiliates, agents and advisers undertake no obligation and do not intend to update any forward-looking statements in this presentation to reflect events or circumstances after the date of this presentation.
Disclaimer
2

CONTENTS
1. Highlights
2. Strategy
a) Identifying Our Core Strengths
b) Retail Driving Growth
c) Growing Regional Demand
d) Managing the Balance Sheet
3. 2016 Financials a) Abridged Income Statement
b) Abridged Balance Sheet
c) Abridged Cash Flow Statement
d) Segmental Summary
e) Retailing Results
f) Cold Chain Food Production
g) Stock feed Results
h) Cropping
i) Non-financial Highlights
4. Sustainability
5. Outlook
6. Dividend Policy
7. Summary
3

HIGHLIGHTS (ZMW) EBITDA
2016: ZMW 317m
2015: ZMW 150m 112%
Profit after tax
2016: ZMW 157m
2015: ZMW (55)m ZMW212m
Cost/Income Ratio
2016: 25.7%
2015: 28.2% 9%
Current ratio
2016: 1.6
2015: 1.0 60%
Gearing
2016: 25.7%
2015: 60.3% 57%
Debt-to-EBITDA
2016: 1.7
2015: 4.2 60%
4

STRATEGY
5

IDENTIFYING OUR CORE STRENGTHS Four best-in-class strategic pillars
• Business built on four best-in-class market leading operations creating a strong integrated group
• Retail and Distribution
• Cold Chain Food Production
• Arable Farming
• Stockfeed
• Deliver high quality, good value fresh food to the mass market in Zambia and West Africa
• Zambeef enjoys the advantage of an integrated model
• Retail operation driving growth
6
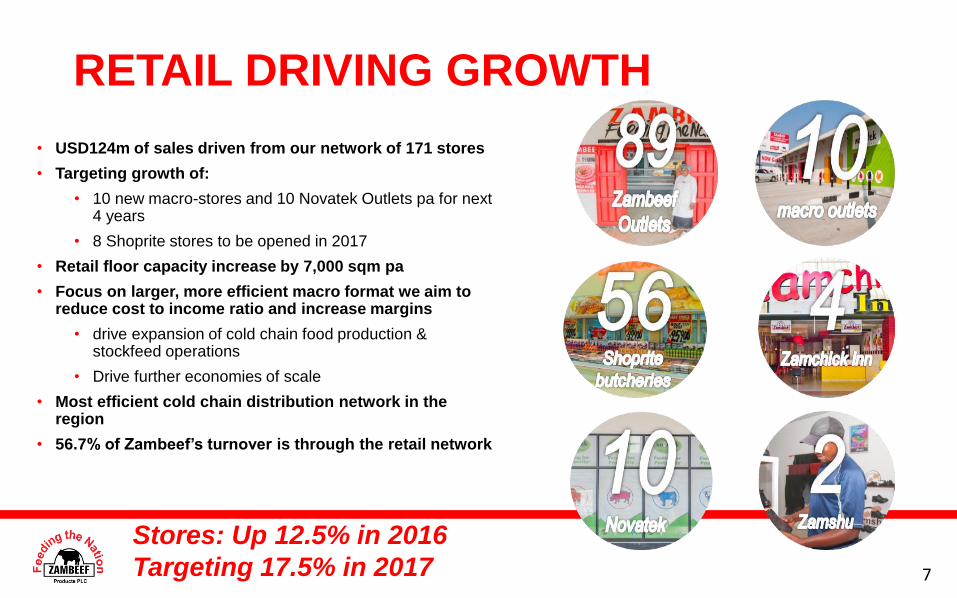
• USD124m of sales driven from our network of 171 stores
• Targeting growth of:
• 10 new macro-stores and 10 Novatek Outlets pa for next 4 years
• 8 Shoprite stores to be opened in 2017
• Retail floor capacity increase by 7,000 sqm pa
• Focus on larger, more efficient macro format we aim to reduce cost to income ratio and increase margins
• drive expansion of cold chain food production & stockfeed operations
• Drive further economies of scale
• Most efficient cold chain distribution network in the region
• 56.7% of Zambeef’s turnover is through the retail network
RETAIL DRIVING GROWTH
Stores: Up 12.5% in 2016
Targeting 17.5% in 2017 7

RETAIL DRIVING GROWTH
2017 (projected) (projected)
2016 2015
Zambia Zambeef Outlets 83 83 86
Zambeef Macros 20 10 7
Zamchick Inns 4 4 6
Novatek 20 10 5
Zamshu Outlets 4 2 0
131 109 104
Shoprite Butcheries 34 31 26
165 140 130
Nigeria Shoprite Butcheries
24
20
14
Master Meats Outlets 6 6 6
30 26 20
Ghana Shoprite butcheries 6 5 4
TOTAL 201 171 152
8

GROWING REGIONAL DEMAND
• Zambian Population growth one of the highest in the world, estimated at around 2.94% per annum*
• Zambian rate of urbanisation one of the highest in the region, estimated at around 3.96% per annum*
• Zambeef increasing market share with around 7,000m2 of additional retail floor space planned to be rolled out each year for next 4 years;
• Zambeef expanding formal and informal sales into the region with increased exports into SADC/COMESA with a population of over 400million people as apposed to 16m in Zambia;
• Formal exports totalled USD8.6m with informal exports believed to be similar.
* CIA World Factbook
9

MANAGING THE BALANCE SHEET
• Focus on cash conversion
• Growth of business to be driven by its retail operations;
• Targeted Capex in Cold Chain Food Production divisions to sustain growth with higher return hurdles and clear managerial responsibility of delivering anticipated RoCE;
• Return to dividend paying in 2017;
• Return Zambeef over a three year period to a dividend policy of 30% of profit after tax;
• Prudent access to loan facilities to support investment while maintaining strict liquidity ratios and continuing to improve gearing and debt servicing ratios.
10

11 2016 FINANCIALS
11

ABRIDGED INCOME STATEMENT
30 September 2016 30 September 2015
ZMW'000 ZMW'000 % Change
Revenue 2 376 148 1 554 872 52.82%
Cost Of Sales (1 500 202) (888 159) -68.91%
Gross Profit 875 946 666 713 31.38%
Other Income 1 694 708 139.27%
Administrative Expenses (690 047) (505 343) -36.55%
Administrative Expenses (excluding
depreciation) (612 263) (438 293) -39.69%
Depreciation (77 784) (67 050) -16.01%
Operating Profit 187 593 162 078 15.74%
Finance Costs (111 346) (55 295) -101.37%
Foreign Exchange (Gains/Losses) 58 345 (142 358) 140.98%
Unrealised 28 626 (46 873) 161.07%
Realised 29 719 (95 485) 131.12%
Profit/(loss) Before Taxation 134 592 (35 575) 478.33%
Income Tax (10 798) (4 661) 131.67%
Profit/(Loss) from discontinued operations 33 592 (14 377)
Profit/(Loss) After Taxation 157 386 (54 613) 388.18%
Adjusted Profit/(Loss) After Taxation 95 168 6 637 837.92%
EBITDA 316 555 149 501 111.74%
12

ABRIDGED BALANCE SHEET
30 September 2016 30 September 2015
ZMW'000 ZMW'000
Non-Current Assets 2 099 036 1 989 503
Current Assets 922 024 791 124
Total Assets 3 021 060 2 780 627
Capital and Reserves 2 128 323 1 475 292
Non-Current Liabilities 307 700 516 292
Current Liabilities 585 037 789 043
Total Equity and Liabilities 3 021 060 2 780 627
Ratios
Current Ratio 1.58 1.00
Total Debt/Equity Ratio 25.66% 60.34%
13

ABRIDGED CASH FLOW 30 September 2016 30 September 2015
ZMW'000 ZMW'000
Profit/(Loss) Before Taxation 134 592 (35 575)
EBITDA 316 555 149 501
Movement in Working Capital (185 407) 114 124
Cash inflow/(outflow) from Operating Activities 131 148 263 625
Cash inflow/(outflow) from/(on) investment activities 266 416 (21 714)
Cash inflow/(outflow) before financing activities 397 564 241 911
Cash inflow/(outflow) from financing (178 389) (268 542)
Cash at the beginning of the year (190 648) (147 868)
Effects of exchange rate changes 36 280 (16 149)
Cash at the end of the year 64 806 (190 648)
14

SEGMENTAL SUMMARY % OF GROUP GROSS PROFIT
Retailing - Zambia, 15.2% Retailing - West
Africa, 5.6%
Cold Chain Food Products, 30.4%
Stock Feed, 16.4%
Crop - Row Crops, 28.8%
Others, 3.6%
2016
15

18
1 6
99
26
6 0
80
14
3 9
16
25
1 8
60
32
39
1
12
7 4
23
19
5 4
87
73
82
1
25
3 3
26
64
55
5
-
50 000
100 000
150 000
200 000
250 000
300 000
2016
2015
GROSS PROFIT (ZMW’000)
Cold Chain Food Products Stock Feed Others Retailing
95.0% 49.8% 0.6%
Row Crops
36.1% 42.6%
Divisional 2016 & 2015 Gross Profit Summary (ZMW’000)
16

RETAILING RESULTS
2015: ZMW (21.7)m 568%
• Retail network has significantly grown
• Expanded from 154 to 171 stores
• Volumes grew by around 11%
• Gross profit margins increasing from 13.1% to
13.5%
• One of the fastest growing retailers in the region
17

COLD CHAIN FOOD PRODUCTION
2015: ZMW (21.7)m 568%
• One of the largest meat processors in the
region
• Focused on value addition, branding and
retailing
• Significant volume increases:
• Beef, pork, chicken and fish + 8%
• Dairy products + 19%
• Eggs + 2.2%
• Margins increased with Gross Profit
percentage increasing from 22.9% to 23.5%
18

STOCKFEED (NOVATEK) RESULTS
2015: ZMW (21.7)m 568%
• The market leader in Stockfeed in Zambia with volumes
increasing 15.3% to 150,280t (2015: 130,280t)
• Operating at full capacity in second half of the year
• New stockfeed plant to come on line in February 2017
• increasing capacity from 14,000t to 25,000t per month
• Growth to be driven by retailing expansion selling day
old chicks with stockfeed
• Margins increased from 18.1% to 20.6%
19

CROPPING
2015: ZMW (21.7)m 568%
• One of the largest row cropping operations in
Africa
• 7,971 hectares under irrigation and planted twice
a year with a further 8,623 hectares of rain fed
cropping making a total of 24,564 hectares
planted per annum
• 113,617t of grain harvested during the year up
from 107,985 in 2015 as well as 27,334t of silage
produced
• Most of farming income in US Dollars and
financial results negatively impacted by
appreciating of ZMW during the year while
opposite effect in 2015
• World class farming assets
20
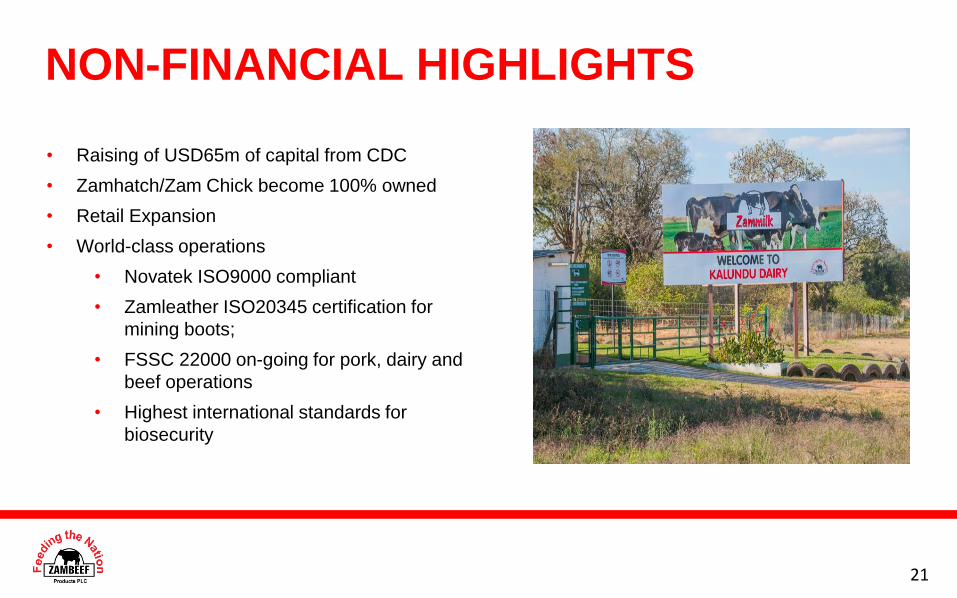
NON-FINANCIAL HIGHLIGHTS
2015: ZMW (21.7)m 568%
• Raising of USD65m of capital from CDC
• Zamhatch/Zam Chick become 100% owned
• Retail Expansion
• World-class operations
• Novatek ISO9000 compliant
• Zamleather ISO20345 certification for
mining boots;
• FSSC 22000 on-going for pork, dairy and
beef operations
• Highest international standards for
biosecurity
21
SUSTAINABILITY
THROUGH
INCLUSIVE
GROWTH
22

SUSTAINABILITY
568%
Zambeef Products takes a ‘triple bottom line’ approach to its sustainability and is committed to ensuring a positive social, economic and environmental impact. Zambeef continues to invest in; • Education • Social amenities: water, electricity
etc. • Poverty eradication • Sports • Traditional ceremonies
+ Economic Impact + Environmental Impact
+ Social Impact
23

ECONOMIC CONTRIBUTION
• US$8.6 million of exports income generated for the nation
• More than US$150 million investment in the last six years
• One of the largest employers in Zambia with over 6,000 staff employed with total emoluments of ZMW307m (USD28.3m)
• ZMW144m (US$13.3 million) of tax, duty and pension payments made to the Zambian government in FY 2016;
• Efficient link of small scale farmers to the market:
24

25 OUTLOOK
25

OUTLOOK
• Driving sustainable revenue growth through:
• Expansion of retail network
• Increasing capacity throughout operations
• Increasing exports into SADC/COMESA region
• De risking the business through:
• Reduced gearing and dollar debt
• E&S/Food safety strategy
• Sustainability and economic impact
• Investing to enhance margins and improve economies of scale
• Improve cash conversion through:
• Strong working capital control
• Tight control on capex and managerial responsibility for
delivering anticipated RoCE
• Disposal of non core assets
26

DIVIDEND POLICY
Payment of a sustainable progressive
dividend
• There continues to be exciting growth
opportunities and the Company will invest
to capture this growth
• At the same time the Board’s intention is to
manage the business in a way that allows
the payment of a sustainable progressive
dividend
• Dividend payments to resume in 2017
• The intention is to return the business to
paying 30% of PAT over a three year
period provided key liquidity and debt
servicing ratios are met
27

SUMMARY 28

SUMMARY
• This year Zambeef has delivered strong growth and record profits in a very volatile and challenging macro environment
• Our business models is robust with volumes having increasing by around 11% and margins being maintained. We believed steady growth will continue
• There are still operational gains and efficiencies to be captured and the team is focused to deliver these
• The capital injection received from CDC has materially de-risked the balance sheet. The residual debt structure is better matched to our underlying ZMW and $ cashflows. Nevertheless we will continue to focus on further debt reduction and mitigating operational risk
29

THANK YOU 30

APPENDICES 31

12
26
9
4 5
09
8 9
67
5 8
20
2 1
50
5 1
28
1 2
98
1 2
04
13
28
9
23
25
6
1 8
90
85
1
25
0
13
64
0
4 4
08
11
79
9
3 5
08
2 9
24
6 5
32
1 4
56
1 4
69
10
45
6
35
88
2
1 6
90
1 7
48
5 7
05
-
5 000
10 000
15 000
20 000
25 000
30 000
35 000
40 000
2016
2015
APPENDIX: DETAILED DIVISIONAL 2016 & 2015 GROSS PROFIT (USD’000)
Cold Chain Food Products 2016: 24 567 2015: 27 688
Leather
11.8% 95.6%
Retailing 2016: 16 778 2015: 18 048
Other 2016: 2 991 2014: 9 143
27.1% 24.0% 65.9% 26.5% 21.5% 10.8% 18.1% 10.1% 35.2% 51.3% 32
Eggs Stock Feed
Row Crops Mill Beef Chicken Pork Milk Fish Edible Oils
Retail West Africa
2.3%
Retail Zambia

13
2 8
72
48
82
7
97
13
0
63
02
8
23
28
5
55
53
8
14
06
2
13
03
7
14
3 9
16
25
1 8
60
20
46
4
9 2
16
2 7
11
96
29
9
31
12
4
83
30
2
24
76
7
20
64
6
46
11
9
10
28
0
10
37
4
73
82
1
25
3 3
26
11
93
4
12
34
4
40
27
7
-
50 000
100 000
150 000
200 000
250 000
300 000
2016
2015
DIVISIONAL 2016 & 2015 GROSS PROFIT (ZMW’000)
Cold Chain Food Products 2016: 266 080 2015: 195 487
Milk Chicken Pork Fish Beef Eggs Stock Feed
Edible Oils
Mill Leather
93.3% 25.7% 36.8% 12.8% 154.5% 16.6%
Retailing 2016: 181 699 2015: 127 423
Other 2016: 32 391 2014: 64 555
Retail Zambia
Retail West Africa
20.4% 0.6% 25.3% 38.0% 56.9% 33
Crop-Row Crops
71.5% 95.0%

Segmental Revenue and Gross Profit (USD’000)
Segment
2016 Revenue
USD ’000 2015 Revenue
USD ’000
% change
2016 Gross Profit
USD ’000 2015 Gross Profit
USD ’000
% change
Retailing - Zambia 104 481 119 443 -12.5% 12 269 13 640 -10.1%
Master Meats Nigeria 16 881 15 448 9.3% 3 640 3 759 -3.2%
Master Meats Ghana 3 113 2 958 5.2% 869 650 33.6%
Retail - West Africa 19 994 18 407 8.6% 4 508 4 408 2.3%
Total Retailing 124 475 137 849 -9.7% 16 778 18 049 -7.0%
Beef 39 400 50 519 -22.0% 8 967 11 802 -24.0%
Chicken 26 321 23 829 10.5% 5 820 3 508 65.9%
Pork 19 717 22 654 -13.0% 2 150 2 924 -26.5%
Milk 11 591 14 291 -18.9% 5 128 6 532 -21.5%
Fish 4 448 5 150 -13.6% 1 298 1 456 -10.8%
Eggs 3 294 4 094 -19.5% 1 204 1 469 -18.1%
Cold Chain Food Products 104 771 120 537 -13.1% 24 567 27 691 -11.3%
Stock Feed 64 410 57 771 11.5% 13 289 10 456 27.1%
Crop-Row Crops 38 171 56 250 -32.1% 23 256 35 882 -35.2%
Mill 8 231 7 981 3.1% 1 890 1 690 11.8%
Leather 3 051 4 563 -33.1% 851 1 749 -51.3%
Edible Oils 8 476 30 995 -72.7% 250 5 705 -95.6%
Others 19 758 43 538 -54.6% 2 991 9 143 -67.3%
Total 351 585 415 946 -15.5% 80 881 101 221 -20.1%
Less: Intra/Inter Group Sales -132 181 (159 811) -17.3% 0.0% Less: Discontinued operations (35 898) -100.0% (6 785) -100.0%
Group Total 219 404 220 237 -0.4% 80 881 94 436 -14.4%
34
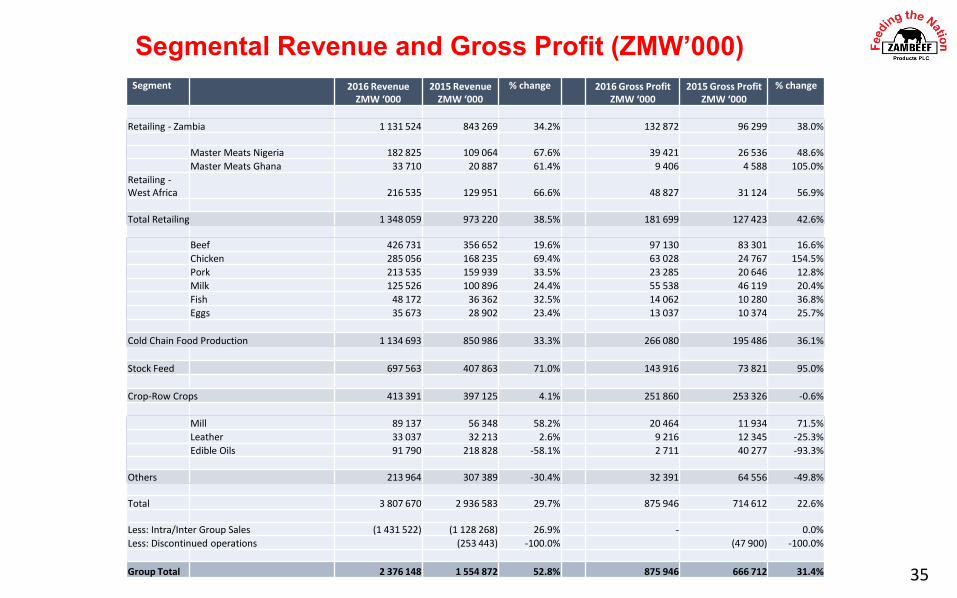
Segmental Revenue and Gross Profit (ZMW’000)
Segment
2016 Revenue
ZMW ‘000 2015 Revenue
ZMW ‘000
% change
2016 Gross Profit
ZMW ‘000 2015 Gross Profit
ZMW ‘000
% change
Retailing - Zambia 1 131 524 843 269 34.2% 132 872 96 299 38.0%
Master Meats Nigeria 182 825 109 064 67.6% 39 421 26 536 48.6%
Master Meats Ghana 33 710 20 887 61.4% 9 406 4 588 105.0%
Retailing - West Africa 216 535 129 951 66.6% 48 827 31 124 56.9%
Total Retailing 1 348 059 973 220 38.5% 181 699 127 423 42.6%
Beef 426 731 356 652 19.6% 97 130 83 301 16.6%
Chicken 285 056 168 235 69.4% 63 028 24 767 154.5%
Pork 213 535 159 939 33.5% 23 285 20 646 12.8%
Milk 125 526 100 896 24.4% 55 538 46 119 20.4%
Fish 48 172 36 362 32.5% 14 062 10 280 36.8%
Eggs 35 673 28 902 23.4% 13 037 10 374 25.7%
Cold Chain Food Production 1 134 693 850 986 33.3% 266 080 195 486 36.1%
Stock Feed 697 563 407 863 71.0% 143 916 73 821 95.0%
Crop-Row Crops 413 391 397 125 4.1% 251 860 253 326 -0.6%
Mill 89 137 56 348 58.2% 20 464 11 934 71.5%
Leather 33 037 32 213 2.6% 9 216 12 345 -25.3%
Edible Oils 91 790 218 828 -58.1% 2 711 40 277 -93.3%
Others 213 964 307 389 -30.4% 32 391 64 556 -49.8%
Total 3 807 670 2 936 583 29.7% 875 946 714 612 22.6%
Less: Intra/Inter Group Sales (1 431 522) (1 128 268) 26.9% - 0.0%
Less: Discontinued operations (253 443) -100.0% (47 900) -100.0%
Group Total 2 376 148 1 554 872 52.8% 875 946 666 712 31.4% 35
36