zainal abidin, n., mustafa, m., & dangerfield, b. c. (2014...
TRANSCRIPT

Zainal Abidin, N., Mustafa, M., & Dangerfield, B. C. (2014). CombatingObesity through Healthy Eating Behaviour: A Call for System DynamicsOptimisation. PLoS ONE, 9(12), [e114135]. DOI:10.1371/journal.pone.0114135
Publisher's PDF, also known as Version of record
License (if available):CC BY
Link to published version (if available):10.1371/journal.pone.0114135
Link to publication record in Explore Bristol ResearchPDF-document
This is the final published version of the article (version of record). It first appeared online via Public Library ofScience at http://journals.plos.org/plosone/article?id=10.1371/journal.pone.0114135. Please refer to anyapplicable terms of use of the publisher.
University of Bristol - Explore Bristol ResearchGeneral rights
This document is made available in accordance with publisher policies. Please cite only the publishedversion using the reference above. Full terms of use are available:http://www.bristol.ac.uk/pure/about/ebr-terms

RESEARCH ARTICLE
Combating Obesity through HealthyEating Behavior: A Call for SystemDynamics OptimizationNorhaslinda Zainal Abidin1*, Mustafa Mamat2¤, Brian Dangerfield3,Jafri Haji Zulkepli1, Md. Azizul Baten1, Antoni Wibowo1
1. School of Quantitative Sciences, College of Arts and Sciences, Universiti Utara Malaysia, Sintok, Kedah,Malaysia, 2. Department of Mathematics, Faculty of Science and Technology, Universiti MalaysiaTerengganu, Kuala Terengganu, Terengganu, Malaysia, 3. Department of Management, School ofEconomics, Finance and Management, University of Bristol, Bristol, United Kingdom
¤ Current address: Faculty of Informatics and Computing, Universiti Sultan Zainal Abidin, Kuala Terengganu,Terengganu, Malaysia
Abstract
Poor eating behavior has been identified as one of the core contributory factors of
the childhood obesity epidemic. The consequences of obesity on numerous
aspects of life are thoroughly explored in the existing literature. For instance,
evidence shows that obesity is linked to incidences of diseases such as heart
disease, type-2 diabetes, and some cancers, as well as psychosocial problems. To
respond to the increasing trends in the UK, in 2008 the government set a target to
reverse the prevalence of obesity (POB) back to 2000 levels by 2020. This paper
will outline the application of system dynamics (SD) optimization to simulate the
effect of changes in the eating behavior of British children (aged 2 to 15 years) on
weight and obesity. This study also will identify how long it will take to achieve the
government’s target. This paper proposed a simulation model called Intervention
Childhood Obesity Dynamics (ICOD) by focusing the interrelations between various
strands of knowledge in one complex human weight regulation system. The model
offers distinct insights into the dynamics by capturing the complex
interdependencies from the causal loop and feedback structure, with the intention
to better understand how eating behaviors influence children’s weight, body mass
index (BMI), and POB measurement. This study proposed a set of equations that
are revised from the original (baseline) equations. The new functions are
constructed using a RAMP function of linear decrement in portion size and number
of meal variables from 2013 until 2020 in order to achieve the 2020 desired target.
Findings from the optimization analysis revealed that the 2020 target won’t be
OPEN ACCESS
Citation: Zainal Abidin N, Mamat M, Dangerfield B,Zulkepli JH, Baten MA, et al. (2014) CombatingObesity through Healthy Eating Behavior: A Call forSystem Dynamics Optimization. PLoS ONE 9(12):e114135. doi:10.1371/journal.pone.0114135
Editor: Antonio Gonzalez-Bulnes, INIA, Spain
Received: May 21, 2014
Accepted: November 3, 2014
Published: December 15, 2014
Copyright: � 2014 Zainal Abidin et al. This is anopen-access article distributed under the terms ofthe Creative Commons Attribution License, whichpermits unrestricted use, distribution, and repro-duction in any medium, provided the original authorand source are credited.
Data Availability: The authors confirm that all dataunderlying the findings are fully available withoutrestriction. All relevant data are within the paper.
Funding: The authors wish to thank UniversitiMalaysia Terengganu (UMT) for the financialsupport in conducting the research, provided underthe Fundamental Research Grant Scheme (FRGS)with grant number: 59256. The funders had no rolein study design, data collection and analysis,decision to publish, or preparation of the manu-script.
Competing Interests: The authors have declaredthat no competing interests exist.
PLOS ONE | DOI:10.1371/journal.pone.0114135 December 15, 2014 1 / 17

achieved until 2026 at the earliest, six years late. Thus, the model suggested that a
longer period may be needed to significantly reduce obesity in this population.
Introduction
Obesity is a term referring to the condition of excess fat [1]. It has been classified
as a chronic disease and has become a worldwide noticeable problem, affecting
both rich and poor countries. Research indicates that obesity is linked to the
incidences of various diseases such as heart disease, type-2 diabetes, some cancers,
and numerous psychosocial problems [2]. It is well accepted that obesity in the
population is caused by an imbalance, a gap between calories consumed and
expended [3]. Over the last two decades, changing in diet propensity with the
growing consumption of food away from home contributes to obesity [4]. Food
prepared away from home, particularly fast-food, contains higher saturated fat
and energy density, and has more added sugar and larger portion sizes ([5], [6]).
Public health literature suggests that greater frequency of outside food
consumption is associated with weight gain and increased body mass index (BMI)
and obesity ([5], [7]). For children, foods containing higher fat, sugar, and
cholesterol reduce the IQ in later childhood [8]. In contrast, healthy food options
are associated with improved intelligence [9].
Obesity is now no longer rare in children and the prevalence is increasing at an
alarming rate. Since obesity is a carryover process and has long-term negative
impacts on various life aspects [2], obesity prevention should ideally start in
childhood [1]. Statistical data in the UK shows that the prevalence of overweight
and obese children in British has increased since 1995 [10]. To respond to the
increasing trends in the UK, in 2008 the government set a target to reverse the
prevalence of obesity (POB) back to 2000 levels by 2020 [11]. Although some
progresses have been initiated to tackle childhood obesity in the UK, the level of
obesity still remains high, especially in lower socioeconomic groups [11]. Thus,
the cause of the failure must be determined in order to achieve a successful
solution. From a quantitative perspective, one of the failures in solving any
complex system is inadequate tools to design, analyze, and implement actions and
policies [12].
Reviews of the published literature have revealed that a variety of techniques
have been employed in the quest for effective obesity amelioration. Most are direct
experimental studies such as behavioral change interventions, which are assessed
using randomized controlled trials. Their objective is to determine if the change
has had an impact on weight reduction but they have not provided sufficient
evidences of lasting effects, suggesting that more time is required for the changes
to create an effect at the population level ([13], [14]). Alternatively, statistical
models have been created but they mostly look at the prediction of trends and
normally need an abundance of historical data. Feedback processes are evident in
Combating Obesity by System Dynamics Optimization
PLOS ONE | DOI:10.1371/journal.pone.0114135 December 15, 2014 2 / 17
the system when viewed holistically but these are not clearly defined in the
statistical or analytical models.
One possible way to overcome the shortcomings of the above methods is the
use of the system dynamics (SD) model. A model based on the SD methodology is
different from other obesity models because it can re-create the obesity process at
the population level with all relevant variables considered endogenously and with
the feedback processes, where evidences are properly represented [15]. Moreover,
non-numerical (soft) variables can be included in the model. SD concentrates on
trends in behavior and de-emphasizes a fit to particular data points. One of the
important usages of SD is to evaluate policies for system improvement [16]. SD
serves as a medium to test various policy improvements under a wide range of
performances. Optimization is one of the testing tools and a very limited number
of studies was found to analyze the behavior of a system under changing policies
using optimization ([17], [18]). Thus, the use of optimization in policy evaluation
is still considered novel in the SD area. For example, although SD optimization
has been used to solve numerous policy solutions (see [19], [20], [21]), none of
the SD studies, to the best of the researchers’ knowledge, have paid attention to
the behavior solution related to obesity.
Aim of the Analysis
This study considers the UK government’s target to remove obesity as a public
health concern by 2020. As part of the overall research objectives, this study
attempts to demonstrate the contribution offered by SD modeling in an
important area of public health. The model is applied as an experimentation tool
to attain useful insights into the effects of eating behavioral change on the
measurement changes. The outcomes of changes are examined within the
following trends: average weight (AW), average body mass index (ABMI), and the
POB. This study considers how eating behavior modifications in the British child
population might lead to the successful POB target by 2020. This study aims to
answer the following research questions: first, whether the target set in 2000 will
be accomplished by 2020, and second, if not, how long will it take to achieve this
measurement target?
Structure of the Paper
The rest of the paper is organized as follows: The next section presents a broad
sample of studies from the SD literature related to various obesity issues. In the
methodology section, the conceptual framework on which the model is based on
is defined. Next, SD model of obesity behavior is formulated by highlighting the
causal relationship and feedback dynamics. Then, these dynamic relationshiops
are integrated into a running model that is being validated. The final section
summarises the conclusion and offers recommendations for future works.
Combating Obesity by System Dynamics Optimization
PLOS ONE | DOI:10.1371/journal.pone.0114135 December 15, 2014 3 / 17

Analytical Framework of the Study
Overview of System Dynamics Optimization
Optimization is defined as achieving the best solution from the set of available
alternatives with regard to some criteria [22]. From the SD point of view,
optimization is used to improve the model results via model performance (policy
optimization) or to fit the model to available time-series data (calibration
optimization) [23]. The choice between the two types of optimization depends on
the model purpose. Normally, SD researchers and practitioners depend on their
intuitions, experiences, and trial and error approach for policy design and
improvement where the policies are tested and modified and the process is
repeated until satisfactory results are found. These approaches provide a good
direction for policy improvement but are time consuming, especially for
beginners and for those who work with insufficient computer facilities ([24],
[20]). The situation is now changing and more efforts have been extended with
the development of the policy design methods. There are two types of policy
design methods, an application of control theory method and simulation by
optimization. The latter has emerged recently as a result of the advanced
development of computer software.
System Dynamics Studies in Tackling Obesity
Several obesity studies that use the SD approach have been published, including
the work of Abdel-Hamid [25], who used the SD approach to model body
metabolism and energy regulation. Abdel-Hamid assessed the factors of dietary
intake and exercise and how these components interact to determine adult body
weight. In 2004, Homer and colleagues [26] modeled the impact of the caloric
imbalance on the changes in body weight and BMI of the adult population in the
USA. In Homer et al. [27], the aim was to model BMI trends of various age
categories in the population. However, according to the researchers’ knowledge,
none of these studies used optimization to find a solution to obesity. To fill this
gap, the hybrid of two approaches of calibration and policy optimization is
adopted for the current study. The desired AW target is entered as a future time-
series and the model is optimized to this series. The objective is to alter the trend
so that by 2020, the POB is back to what it was in 2000. Finally, in contrast with
the above SD models, which focus either on the individual or the entire US
population, the focus here is on the British child population aged 2–15 years,
segregated by gender and three age bands.
System Dynamics Methodology
Overview of System Dynamics
SD was introduced in the late 1950s and Professor Jay Forrester is the trailblazer of
the methodology [28]. It is a computer-aided approach to studying the behavior
Combating Obesity by System Dynamics Optimization
PLOS ONE | DOI:10.1371/journal.pone.0114135 December 15, 2014 4 / 17

of a complex system over time. SD modeling initially involved mapping, then
evolved with the model’s development, which uses a software package, for
instance, Vensim, Stella, iThink, or Powersim. In terms of usage, it is an
appropriate method to tackle strategic level issues related to policy decisions.
Specifically, SD employs a model to test policies and to overcome policy
resistance. SD is different from other modeling approaches as it deals with the
complex problem which contains the feedback loops, non-linear and time delaysthat affect the behavior of the entire system [16]. Due to its capability, the
applications of SD in various health studies are well reported in literatures such as
obesity [29], [30] and Chlamydia screening [31].
Data Sources
This study focused on the British child population, aged between 2 and 15 years,
as an overall approach to prevent obesity at the population level. The data used in
this study were obtained from the Health Survey for England (HSE) [10] as well as
other published sources.
Model Description
Fig. 1 demonstrates the framework to depict the structural assumptions of obesity
process. The diagram allows the integration of four different sectors of food
intake, energy expenditure (EE), physical measurement, and BMI impact into a
single diagram. All these sectors have a specific function when considering that the
ultimate purpose of the model is to evaluate the effects of changes in eating
behavior on weight and obesity.
Fig. 2 is an extension of the sub-sector diagram, designed to describe the
obesity process from feedback explanations. The diagram was designed using the
causal and loop (CL) tool, which consists of variables connected by positive (+) or
negative (–) links. A positive link between variables A and B means an increase in
A will result in an increase in B. Meanwhile, a negative link means that if the A
variable increase, the B variable will decrease in opposite direction [16]. In regards
to food consumption, the greater portion size and number of meals taken result in
a larger consumption of total fat, whereas the opposite condition applies for lower
consumption. Average fat portion size either from home, school, or outside meals
is driven by a parameter called fractional rate. Changes in fractional rate result in
changes in the average fat portion size, and this influencing process is explained
from the three reinforcing loops of RL1, RL2 and RL3.
The overall obesity mechanism from energy balance (EB) and its weight and
basal metabolism rate (BMR) progress were described and marked with the BL
symbol [29]. EB is the difference between energy intake (EI) and energy
expenditure (EE). Thus, changes in any of these energies affect changes in EB. A
daily positive EB is stored in muscle or fat. An increase in weight itself causes
higher EE, specifically energy from BMR. An increase in BMR energy causes
increased EE in total, which in turn tends to bring EB back to zero. This BL causes
Combating Obesity by System Dynamics Optimization
PLOS ONE | DOI:10.1371/journal.pone.0114135 December 15, 2014 5 / 17

weight to reach a new EB value in the long run. Equivalence between EI and EE
ensures no weight change. The entire process can take years to show up as changes
in the AW of the population [26]. The model is calibrated in years and so changes
in daily EB and weight variability are smoothed out to result in a less sharp AW
change in a year. However, because eating and performing physical activity (PA) is
a daily process, the model additionally computes EI and EE in daily units to aid
understanding and to reflect common health nomenclature. Weight and BMI are
measured using the formula ofweightheight2
[32]. The more weight an individual has,
the higher the BMI value, and the opposite condition for weight loss.
Model Development
This paper developed a simulation model called Intervention Childhood Obesity
Dynamics (ICOD) by focusing the interrelations between various strands of
knowledge in one complex human weight regulation system. The ICOD obesity
model was successfully developed using the Vensim software for formulating,
analyzing, and experimenting purposes [33]. In this study, the model was
simulated from 1970 to 2030, and the output divided into Phase 1 (1970–2012)
and Phase 2 (2013–2030). Phase 1 represents the past and present situations that
Fig. 1. The interaction of eating and physical activity behavior on weight and obesity; Here, EI5energy intake, BMI5body mass index.
doi:10.1371/journal.pone.0114135.g001
Combating Obesity by System Dynamics Optimization
PLOS ONE | DOI:10.1371/journal.pone.0114135 December 15, 2014 6 / 17

lead to obesity, whilst Phase 2 refers to the capability of the ICOD model to
reverse the future of AW, ABMI, and POB trends. The data were collected from
publishing sources [10] and a literature review [25], [26], in order to simulate the
model. The time step for the simulation is 0.0625.
System Dynamics Optimization Process
Overall, there are five steps in the optimization process [34]. As the first step, the
important concepts need to be determined before the optimization process begins.
These concepts are payoff function and weight. The payoff function is a formula
which expresses the objective function. Next, the weight value must be assigned to
the payoff function and the value should always be 1.0 for a calibration
optimization [23]. In calibration optimization, Vensim takes the difference
between the model variable and the data value, multiplies it by weight, squares it
and adds it to the error sum, which is minimized. Then the parameters are
considered. The optimization process continues by searching for the best solution
that best fits the simulated AW to the time series data entered as desired AW. The
optimization process occurs by maximizing the payoff function. The value of the
payoff function is normally negative and after optimization the value should be
less negative. The best payoff value after optimization would be zero [23].
Fig. 2. Causal loop diagram of the interaction of eating and physical activity behavior on weight and obesity.
doi:10.1371/journal.pone.0114135.g002
Combating Obesity by System Dynamics Optimization
PLOS ONE | DOI:10.1371/journal.pone.0114135 December 15, 2014 7 / 17

The Adoption of System Dynamics Optimization
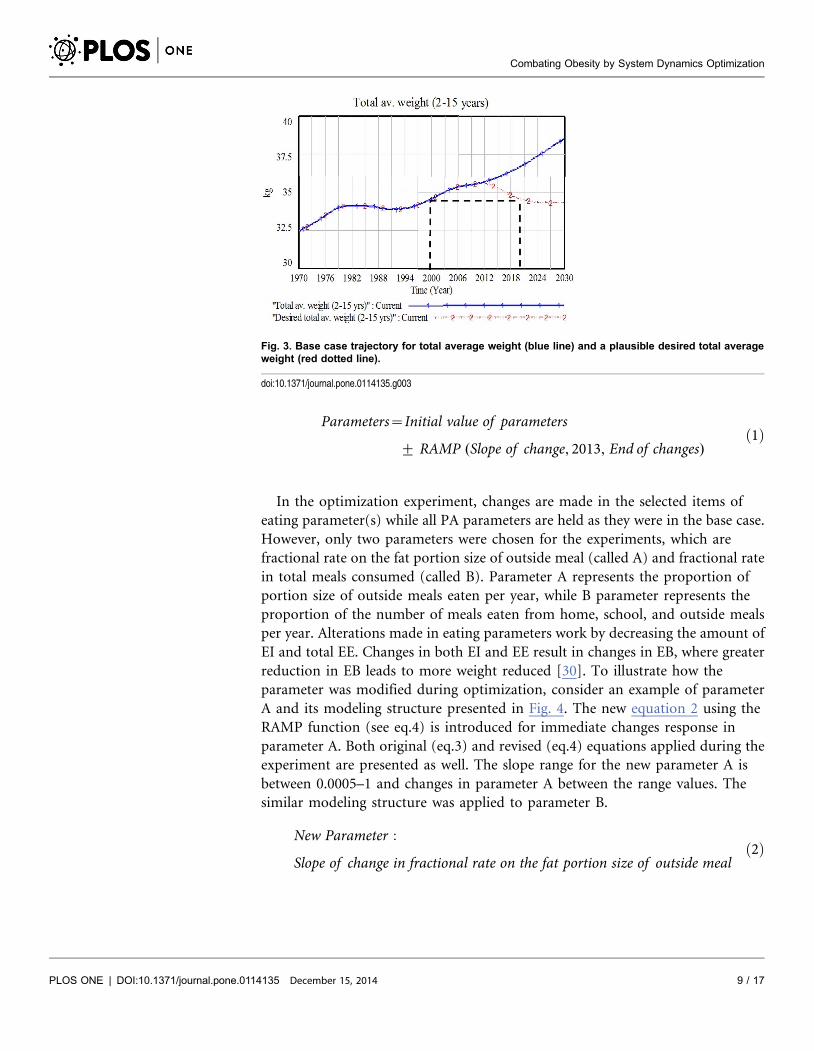
Table 1 presents a plausible AW target needed by 2020 and Fig. 3 illustrates a
graph for weight changes from the baseline, starting in 2013, that would be
compatible with UK government policy. We decided on weight because for the
nation to reverse the rising tide of population obesity, everyone needs to be able to
reach a healthy weight. With that, the achievement in POB only will be achieved
[11]. The upper (blue) line in Fig. 3 shows the simulated trend (base case) for
total AW whereas the lower (red) line is a desired weight trajectory which passes
through the target needed by 2020 (<34.6 kg). Total AW is the weight measured
from the total of six model categories of three age groups and genders. The trend
is presented from a total population (2–15 years) as a broader strategy to tackle
population obesity. In order to achieve the desired weight target of 34.55 kg in
2020, the changes must be made in single or combination of parameters. In our
study, we choose the year 2013 as our initial year for the policy changes to be
rolled out.
Due to the inclusion of a future data series by this analysis, the overall process is
effectively a hybrid of policy and calibration optimizations. Using optimization,
the model searches and chooses the best parameter value to fit with a given future
weight series data, ranging from 2013 to 2030. In response to eating behavior
changes, public policy changes cannot produce a sudden step response, so we have
optimized the rate of change parameters which are assumed to change in a gradual
linear fashion over a period of years. Obviously the trajectory could be different
with a slower initial decrease and then a sharper fall to the target value in 2020.
This is managed in the model using the RAMP function, one of the functions
available in Vensim software. A RAMP function is a flow that is increasing or
decreasing linearly and not constant over time. Prior to this experiment, the
portion size and number of meals variables were reduced linearly from 2013 until
2020 using RAMP function. We have not yet explored other possible trajectories.
To achieve the necessary reduction in AW by 2020, the optimization process
was performed at rates of change in eating variables. It is reflected in the structure
of equation 1 below. This generalized can be applied to eating parameters,
although the sign needs to reflect whether a reduction or an increase is desirable as
shown by the ¡ sign in equation 1. Changes in behavior are assumed to
commence in 2013. Due to a delay between the behavior changes and their effect,
obviously no results have been observed in the beginning of the intervention
period, especially in 2013. The impact will only be seen after at least a year.
Table 1. Changes in average weight values from the past (1970–2010) and into the future (2020–2030).
Average weight (kg) 1970 1980 1990 2000 2010 2020 2030
Total average weight (Baseline) 32.40 34.06 33.91 34.55 35.55 36.69 38.56
Desired total average weight 34.55 34.31
doi:10.1371/journal.pone.0114135.t001
Combating Obesity by System Dynamics Optimization
PLOS ONE | DOI:10.1371/journal.pone.0114135 December 15, 2014 8 / 17
Parameters~Initial value of parameters
+ RAMP (Slope of change, 2013, End of changes)ð1Þ
In the optimization experiment, changes are made in the selected items of
eating parameter(s) while all PA parameters are held as they were in the base case.
However, only two parameters were chosen for the experiments, which are
fractional rate on the fat portion size of outside meal (called A) and fractional rate
in total meals consumed (called B). Parameter A represents the proportion of
portion size of outside meals eaten per year, while B parameter represents the
proportion of the number of meals eaten from home, school, and outside meals
per year. Alterations made in eating parameters work by decreasing the amount of
EI and total EE. Changes in both EI and EE result in changes in EB, where greater
reduction in EB leads to more weight reduced [30]. To illustrate how the
parameter was modified during optimization, consider an example of parameter
A and its modeling structure presented in Fig. 4. The new equation 2 using the
RAMP function (see eq.4) is introduced for immediate changes response in
parameter A. Both original (eq.3) and revised (eq.4) equations applied during the
experiment are presented as well. The slope range for the new parameter A is
between 0.0005–1 and changes in parameter A between the range values. The
similar modeling structure was applied to parameter B.
New Parameter :
Slope of change in fractional rate on the fat portion size of outside mealð2Þ
Fig. 3. Base case trajectory for total average weight (blue line) and a plausible desired total averageweight (red dotted line).
doi:10.1371/journal.pone.0114135.g003
Combating Obesity by System Dynamics Optimization
PLOS ONE | DOI:10.1371/journal.pone.0114135 December 15, 2014 9 / 17

Original Equation :
Changes in fat portion size from outside meal
~Av: of fat portion size from outside meal
|fractional rate on the fat portion size of outside meal
ð3Þ
Revised Equation :
Fractional rate on the fat portion size of outside meal~Initial value of fractionalrateon the fat portion size of outside meal{RAMP (Slope of changein fractional rate on the fat portion size of outside meal, 2013,Endof growth rate changes)
During optimization, the original parameter becomes a variable as the search
routine works to achieve the best objective function result. Through this change,
the closest result (green line) to the red line for AW as presented in Fig. 5 is
achieved. Using optimization, the model provides a suggestion on the best
reduction value in the parameters to fit with future weight target data. The
solution suggested from optimization depends on the number of parameters and
time duration factors. Optimization experiments possibly can be experimented on
more than two parameters at a time and the searching process will be more
difficult and time-consuming if involved with a number of parameters [23]. Using
SD optimization, suggestion for the solution might not offer the exact point-by-
point trend to fit into a given data series, but the closest solution to the desired
target trends of simulation periods.
Fig. 4. Structure for modeling the average of fat portion size from outside.
doi:10.1371/journal.pone.0114135.g004
(4)
Combating Obesity by System Dynamics Optimization
PLOS ONE | DOI:10.1371/journal.pone.0114135 December 15, 2014 10 / 17

Model Validation
To validate the model, the test is done to both structure and behavior of the
model as suggested by the Forrester and Senge [35] and Sterman [16]. The ICOD
model has successfully passed on behavior reproduction since the real data fit with
the simulated trends for both AW and ABMI, as shown in Fig. 6. The other test is
mass balance, also known as the checksum test, which does not involve any
simulation [30]. This test works to balance the input and output values in the
model by identifying whether people (resources) are added to or leak from the
model during the course of a simulation. For the balance to be satisfied in this
condition, the formula of total population of obese and non-obese must be equal
with the whole population. The value for checksum must be equal to zero at all
times. Fig. 7 proved that the model has passed the checksum test with the
checksum trends fluctuating around zero, allowing for computational accuracy. If
the input and output do not balance, then the graph will exhibit a non-zero
behavior pattern.
Results and Discussions
The simulated result from the base case (Current) for total AW is presented in the
blue line trend in Fig. 5. Including the optimized values caused a reduction in the
average of fat portion size from outside, and the average of annual number of
meals. For instance, result from simulation analysis depicts a decrease in meal
consumptions in year 2030. Prior to the baseline simulation, meal consumptions
are recorded at approximately 35 grams per meals and 1600 meals per year.
However, these consumptions have been reduced to 7 grams per meal and almost
250 meals per year after the optimization experiment (see [30]). Although the
results from eating optimization (Strategy 1) look unrealistic and are involved
with quite drastic changes to achieve the desired weight target, it is important to
highlight that the tight timeframe for the target to be achieved is likely to be a
major contributing factor. It supports the view that a much longer time frame will
be necessary to achieve a reduction in AW at the population level because the time
Table 2. Comparisons of the average weight (AW), average BMI (ABMI), and prevalence of obesity (POB) changes resulting from the optimizationexperiment.
AW (kg) ABMI (kg/m2) POB (%)
Baseline Optimization Baseline Optimization Baseline Optimization
BASELINE &OPTIMIZATIONEXPERIMENT
2020 2030 2020 2030 2020 2030
BASELINE (CURRENT)
36.69 38.56 19.7 20.61 24.04 28.75
OPTIMIZATIONEXPERIMENT (STRATEGY1)
35.60 33.76 19.11 18.02 21.06 12.21
doi:10.1371/journal.pone.0114135.t002
Combating Obesity by System Dynamics Optimization
PLOS ONE | DOI:10.1371/journal.pone.0114135 December 15, 2014 11 / 17
taken to gain weight is known to be shorter than the time taken to reduce it. Apart
from that, only two parameters were tested in the model. The results are
compressed within these two parameters for the best result achieved.
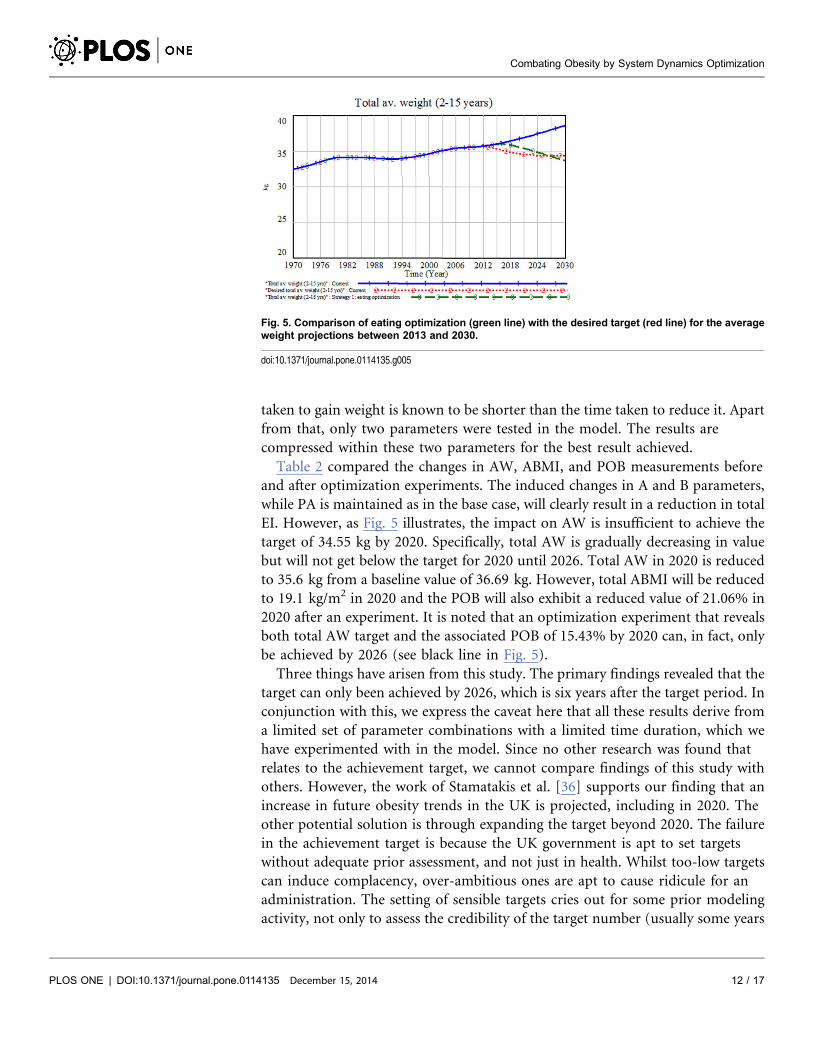
Table 2 compared the changes in AW, ABMI, and POB measurements before
and after optimization experiments. The induced changes in A and B parameters,
while PA is maintained as in the base case, will clearly result in a reduction in total
EI. However, as Fig. 5 illustrates, the impact on AW is insufficient to achieve the
target of 34.55 kg by 2020. Specifically, total AW is gradually decreasing in value
but will not get below the target for 2020 until 2026. Total AW in 2020 is reduced
to 35.6 kg from a baseline value of 36.69 kg. However, total ABMI will be reduced
to 19.1 kg/m2 in 2020 and the POB will also exhibit a reduced value of 21.06% in
2020 after an experiment. It is noted that an optimization experiment that reveals
both total AW target and the associated POB of 15.43% by 2020 can, in fact, only
be achieved by 2026 (see black line in Fig. 5).
Three things have arisen from this study. The primary findings revealed that the
target can only been achieved by 2026, which is six years after the target period. In
conjunction with this, we express the caveat here that all these results derive from
a limited set of parameter combinations with a limited time duration, which we
have experimented with in the model. Since no other research was found that
relates to the achievement target, we cannot compare findings of this study with
others. However, the work of Stamatakis et al. [36] supports our finding that an
increase in future obesity trends in the UK is projected, including in 2020. The
other potential solution is through expanding the target beyond 2020. The failure
in the achievement target is because the UK government is apt to set targets
without adequate prior assessment, and not just in health. Whilst too-low targets
can induce complacency, over-ambitious ones are apt to cause ridicule for an
administration. The setting of sensible targets cries out for some prior modeling
activity, not only to assess the credibility of the target number (usually some years
Fig. 5. Comparison of eating optimization (green line) with the desired target (red line) for the averageweight projections between 2013 and 2030.
doi:10.1371/journal.pone.0114135.g005
Combating Obesity by System Dynamics Optimization
PLOS ONE | DOI:10.1371/journal.pone.0114135 December 15, 2014 12 / 17

ahead), but also the desired trajectory to be followed in attaining it. The finding
also has implications for governments and other bodies who choose to set future
health (and indeed other) targets. It is desirable to carry out some modeling in
advance to ascertain if the chosen target might just be feasible. Often it seems that
the targets are decided on a whim and the consequence of this might be acute
embarrassment for the government.
Secondly, this study focuses on the challenges the government faces in order to
achieve the desired target. The failure to achieve the target might be due to the
ineffectiveness in the policy intervention related to obesity problem. It is not
supposed to focus on individual level issues only, such as controlling food
consumptions. A more practical approach should encompasses the environmental
influence, such as providing the environment that promotes healthier food
consumption behavior [37]. Thus, this finding brings an important message to the
government and policy makers that the planning strategies for obesity
interventions might be better targeted at creating an environment which makes it
easier to access healthier food rather than convincing individuals to make
healthier choices.
Lastly, this research highlighted that the current UK food policy needs to be
reviewed with respect to its effects on children. This is especially the case for
school and outside food sources. Most of the teenage population nowadays
consumes more outside food than meals at home. The frequent consumption of
outside food and sugar-laden drinks has a significant impact on weight gain and
obesity [7].
Conclusions
The ICOD obesity model was successfully developed with the intent to better
understand how past eating behavior influences a child’s weight gain and
Fig. 6. Fitting trends between real data and simulated trends of weight and BMI.
doi:10.1371/journal.pone.0114135.g006
Combating Obesity by System Dynamics Optimization
PLOS ONE | DOI:10.1371/journal.pone.0114135 December 15, 2014 13 / 17

increased obesity. The model is designed to address the issue and build a shared
understanding of obesity dynamics in a way that is solidly grounded in the best
available science and useful to non-specialists, from policy makers to the public.
Using SD calibration and policy optimizations, this study offers insight into how
the best of AW, ABMI, and POB reversion values can be achieved in the future
direction by controlling portion size and number of meals eaten. Findings from
the optimization experiment revealed that the government’s desired target in both
AW and POB is unlikely to be achieved by 2020 and the target can be only
achieved by 2026. Therefore, the model suggested a longer period may be needed
to significantly reduce childhood obesity in this population. This paper concludes
that the SD optimization is a meaningful approach to guide the food stakeholder
to understand and to experiment on the dynamic situation of obesity from an
eating behavior perspective.
Limitations and Future Works
The ICOD model enables decision makers, practitioners, researchers and the
public to learn and quickly access information about the effect of nutrition on the
dynamics of obesity. However, as with any model, the ICOD model is not
Fig. 7. Balanced output for the obese and non-obese population.
doi:10.1371/journal.pone.0114135.g007
Combating Obesity by System Dynamics Optimization
PLOS ONE | DOI:10.1371/journal.pone.0114135 December 15, 2014 14 / 17
appropriate for all purposes. To address the issue, this study has some limitations
that need to be highlighted. In conducting this research, limitations in data
acquisition have been experienced. There is a lack of historical national survey
data, especially on EI and PA, which limits the scope for model validation.
Because of that, the development of the obesity model is derived from the best
information available from the literature and also from expert knowledge. For the
purpose of simplification, we assumed the model exhibits similar behavior in all
age groups and gender categories in terms of eating, PA, and metabolic aspects. In
reality, there might be differences in the regulation of EI and EE among the
different age groups and genders, not only from quantitative aspects but also a
qualitative difference. Another limitation is that RAMP trajectory trends were
only experimented with a limited number of variables tested in the optimization
experiment.
From this limitation, future research can be done by extending the model. One
of the interesting areas for extending the model would be that the heterogeneity
issues might be addressed and tested for future research direction. Secondly, if the
target to overcome obesity by changing eating behavior is not achievable by the
year 2020, we need to consider a few alternative approaches to this issue. One
plausible solution to this problem is to focus on multiple aspects of behavioral
changes. For instance, the combination of PA and eating behavioral changes
might offer the better solution for BMI or weight reduction ([38], [39], [40]).
Therefore, our study is striving to explore the dynamic effect of changes in both
behavior to the weight and BMI reversing trends. Lastly, we also plan to conduct
experiments with an unlimited number of parameters for future research
direction from optimization work.
Author Contributions
Conceived and designed the experiments: NZA BD. Performed the experiments:
NZA. Analyzed the data: NZA. Contributed reagents/materials/analysis tools:
NZA BD. Contributed to the writing of the manuscript: NZA MM BD JHZ MAB
AW. Drafting the article: NZA MM BD JHZ MAB AW. Final approval of the
paper: NZA MM BD JHZ MAB AW.
References
1. Dehghan M, Akhtar-Danes N, Merchant AT (2005) Childhood obesity, prevalence and prevention.Nutrition Journal 4: 1–8.
2. Kumanyika S, Jeffery RW, Morabia A, Ritenbaugh C, Antipatis VJ (2002) Obesity prevention: Thecase for action. International Journal of Obesity 26: 425–436.
3. WHO (2013) Obesity and overweight. Available: http://www.who.int/mediacentre/factsheets/fs311/en/index.html. Accessed: 2013 Aug 12.
4. Rennie L, Johnson L, Jebb SA (2005) Behavioural determinants of obesity. Best Practice & ResearchClinical Endocrinology & Metabolism 19: 343–358.
5. Bowman SA, Vinyard BT (2004) Fast food consumption of U.S. adults: impact on energy and nutrientintakes and overweight status. Journal of the American College of Nutrition 23: 163–168.
Combating Obesity by System Dynamics Optimization
PLOS ONE | DOI:10.1371/journal.pone.0114135 December 15, 2014 15 / 17

6. Young LR, Nestle M (2007) Portion sizes and obesity: responses of fast-food companies. Journal ofPublic Health Policy 28: 238–248.
7. Taveras EM, Berkey CS, Rifas-Shiman SL, Ludwig DS, Rocket HRH, et al. (2005) Association ofconsumption of fried food away from home with body mass index and diet quality in older children andadolescents. Pediatrics 116: e518–e524.
8. Northstone K, Joinson C, Emmett P, Ness A, Paus T (2012) Are dietary patterns in childhoodassociated with IQ at 8 years of age? A population-based cohort study. Journal of Epidemiology andCommunity Health 66: 624.
9. Theodore RF, Thompson JMD, Waldie KE, Wall C, Becroft DMO, et al. (2009) Dietary patterns andintelligence in early and middle childhood. Intelligence 37: 506–513.
10. NHS (2011a) Health Survey for England-2009: Trend Tables. Available: http://www.ic.nhs.uk/statistics-and-data-collections/health-and-lifestyles-related-surveys/health-survey-for-england/health-survey-for-england-2009-trend-tables. Accessed: 2011 Oct 15.
11. Department of Health (2008) Healthy weight, healthy lives: a cross-government strategy for England.Available: http://webarchive.nationalarchives.gov.uk/20100407220245/http://www.dh.gov.uk/en/Publicationsandstatistics/Publications/PublicationsPolicyAndGuidance/DH_082378. Accessed: 2013Jun 20.
12. Lebcir M (2006) Health care management: the contribution of systems thinking. Available: http://uhra.herts.ac.uk/bitstream/handle/2299/683/S65.pdf?sequence51. Accessed: 2013 Oct 25.
13. Caballero B, Clay T, Davis SM, Ethelbah B, Rock BH, et al. (2003) Pathways: a school-based,randomized controlled trial for the prevention of obesity in American Indian schoolchildren. AmericanJournal of Clinical Nutrition 78: 1030–1038.
14. Neumark-Sztainer D, Story M, Hannan PJ, Rex J (2003) New moves: a school-based obesityprevention program for adolescent girls. Preventive Medicine 37: 41–51.
15. Forrester JW (1961) Industrial dynamics. MIT Press: Cambridge, MA (Now available from PegasusCommunications, Waltham, M A).
16. Sterman JD (2000) Business dynamics: Systems thinking and modelling for a complex world. Boston MA: Irwin McGraw-Hill.
17. Coyle RG (1985) The use of optimization methods for policy design in a system dynamics model.System Dynamics Review 1: 81–91.
18. Duggan J (2008) Equation-based policy optimization for agent-oriented system dynamics models.System Dynamics Review 24: 97–118.
19. Wolstenholme EF, Al-Alusi A-S (1987) System dynamics and heuristics optimization in defenceanalysis. System Dynamics Review 3: 102–115.
20. Keloharju R, Wolstenholme EF (1989) A case study in system dynamics optimization. Journal of theOperational Research Society 40: 221–230.
21. Dangerfield B, Roberts C (1996) An overview of strategy and tactics in system dynamics optimisation.Journal of the Operational Research Society 47: 405–423.
22. INFORMS Computing Society (2013) The nature of mathematical programming. Available: http://glossary.computing.society.informs.org/index.php?page5nature.html. Accessed: 2013 Jun 20.
23. Dangerfield BC (2009) System dynamics models, optimisation of. In: Meyers RA. Encyclopedia ofComplexity & System Science: Springer, New York, USA.
24. Mohapatra PKJ, Sharma SK (1985) Synthetic design of policy decisions in system dynamics models: Amodal control theoretical approach. System Dynamics Review 1: 63–80.
25. Abdel-Hamid TK (2003) Exercise and diet in obesity treatment: an integrative system dynamicsperspective. Medicine & Science in Sports & Exercise 35: 400–413.
26. Homer J, Jones A, Seville D, Sustainability Institute (2004) Diabetes system model referenceguidance. Available: http://www.sustainabilityinstitute.org/pubs/diabetessystemreference.pdf. Accessed:2013 Jul 15.
Combating Obesity by System Dynamics Optimization
PLOS ONE | DOI:10.1371/journal.pone.0114135 December 15, 2014 16 / 17

27. Homer J, Milstein B, Dietz W, Buchner D, Majestic E (2006) Obesity population dynamics: exploringhistorical growth and plausible futures in the US. In: The Online Proceedings of 24th International SystemDynamics Conference, July 2006, Nijmegen, The Netherlands, July 2006.
28. Forrester JW (2007) System dynamics-a personal view of the first fifty years. System Dynamics Review23: 345–358.
29. Dangerfield BC, Abidin NZ (2011a) The role of behaviour change in eating and physical activity in thebattle against childhood obesity. In: The Online Proceedings of the 29th International System DynamicsConference, Washington DC, July 24–28, 2011.
30. Norhaslinda Zainal Abidin (2012) A dynamic model for evaluating the effects of changes in eating andphysical activity on childhood obesity. PhD thesis, University of Salford.
31. Townshend JRP, Turner HS (2000) Analysing the effectiveness of chlamydia screening. Journal of theOperational Research Society 51: 812–824.
32. NHS (2011b) Statistics on obesity, physical activity and diet: England, 2011. Available: http://www.ic.nhs.uk/statistics-and-data-collections/health-and-lifestyles/obesity/statistics-on-obesity-physical-activity-and-diet-england-2011. Accessed: 2011 Oct 15.
33. VENSIM (2010) Ventana Systems, Inc.60 Jacob Gates Road Harvard, MA01451, USA.
34. Bazin E (2011) An analysis of the performance of push, pull and hybrid production system inmanufacturing supply chains. PhD Thesis, University of Salford.
35. Forrester JW, Senge PM (1980) Tests for building confidence in system dynamics model. In: LegastoAA, Forrester JW, Lyneis JM (eds, System Dynamics, Vol.14, Series, TIMS Studies in the ManagementSciences)209–228, New York: North-Holland.
36. Stamatakis E, Zaninotto P, Falaschetti E, Mindell J, Head J (2010) Time trends in childhood andadolescent obesity in England from 1995 to 2007 and projections of prevalence to 2015. Journal ofEpidemiology and Community Health 64: 167–174.
37. Swinburn BA, Sacks G, Hall KD, McPherson K, Finegood DT, et al. (2011) The global obesitypandemic: shaped by global drivers and local environments. Lancet 378: 804–814.
38. Campbell K, Waters E, O’Meara S, Summerbell C (2001) Interventions for preventing obesity inchildhood: a systematic review. Obesity Reviews 2: 149–157.
39. Summerbell CD, Waters E, Edmunds LD, Kelly S, Brown T, et al. (2005) Interventions for preventingobesity in children (Review). Cochrane Database Systemic Review, 3(CD001871): 1–80 Available: http://onlinelibrary.wiley.com/o/cochrane/clsysrev/articles/CD001871/frame.html. Accessed: 2013 Aug 2.
40. Lemmens VEPP, Oenema A, Klepp KI, Henriksen HB, Brug J (2008) A systematic review of theevidence regarding efficacy of obesity prevention interventions among adults. Obesity Reviews 9: 446–455.
Combating Obesity by System Dynamics Optimization
PLOS ONE | DOI:10.1371/journal.pone.0114135 December 15, 2014 17 / 17