za 2017 - wwfawsassets.wwf.org.za/downloads/wwf_food_loss_and_waste_web.pdf · food loss and waste:...
TRANSCRIPT

1Food loss and waste: Facts and futures
Food Loss and Waste: Facts and FuturesTaking steps towards a more sustainable food future
FOOD
2017
repOrTza
This report was made possible with the support of

WWF, 2017. Food Loss and Waste: Facts and Futures. WWF South AfricaAvailable at www.wwf.org.za/food-loss-and-waste-facts-and-futures
Editor: Tatjana von BormannContributors: Leani de Vries, Nicola Jenkins, Nan Tian, Innocentia Modau, Pavitray Pillay, Bridget Carle, Philippa NottenReviewer: Dr Suzan Oelofse Text editor: Marlene Rose
Design: Design for development, www.d4d.co.zaFront cover photo: Paballo Thekiso
©Text 2017 WWF-SA All rights reserved
wwf.org.za
WWF is one of the world’s largest and most experienced independent conservation organisations, with over 6 million supporters and a global network in over 100 countries.
WWF’s mission is to stop the degradation of the planet’s natural environment and to build a future in which humans live in harmony with nature, by conserving the world’s biological diversity, ensuring that the use of renewable natural resources is sustainable, and promoting the reduction of pollution and wasteful consumption.

COnTenTs eXeCUTIVe sUMMarY: a picture of food waste in south africa 4
COnTeXT 7
Scope of the problem 7
Global context 7South African context 8
Understanding the link between food waste and greenhouse gas emissions 11
pUbLIC anD prIVaTe seCTOr 15
Public sector 15
Policies, legislation and regulations 15National, provincial and municipal response 17
Private sector 18Formal vs informal market challenges 18Understanding the food industry position 20
aCTIOns FOr a MOre FOOD-seCUre FUTUre 26 Actions for a ‘Waste not Want not’ future 26
‘Waste not Want not’ actions for the government 26‘Waste not Want not’ actions for the food industry 27‘Waste not Want not’ actions for companies 27‘Waste not Want not’ actions for individual consumers 28
reFerenCes 29

The WOrk OF WWFWWF’s Food Practice works to tackle food loss and waste in a number of ways. These include scoping the extent of the challenge, testing possible approaches and solutions, advocating for action across sectors, and particularly promoting collaborative government and business action. Research includes both qualitative studies of attitudes and understanding and more data-driven approaches such as using life-cycle analysis to understand hotspots in food product value chains. Findings from these research projects as well as pilot projects and advocacy work are included in the content of this report.
WWF’s FOOD praCTICe WOrks TO TaCkLe FOOD
LOss anD WasTe
An absurd amount of the food produced in the world today – as much as a third – goes to waste.
South Africa is right on trend with equally high levels of food waste. Estimates suggest that a third of all food in South Africa is never consumed and simply ends up in landfill, adding further pressure to an already over-extended waste-disposal system.
This evidence of excessive waste is in stark contrast to the evidence that millions of South Africans in both urban and rural areas are going hungry.
Water and energy costs, together with the cost of disposing of the waste, means that food wastage comes at a very high price to the South African economy and environment.
The lack of data on the causes, volumes and hotspots in the food value chain remains a challenge that requires collective action and reporting transparency.
Nevertheless, many of the actions required to reduce food waste are already well formulated; the challenge is transferring this knowledge to where it is needed, within government, the business sector and households.
As a Champion of Sustainable Development Goal 12.3, the South African government, represented by the Department of Agriculture, Forestry and Fisheries, has made a global commitment to halve food waste by 2030 and is now obligated to create the political and social environment conducive to adopting the available ideas.
It is widely agreed that effectively reducing food waste and loss could be one of the most fundamental strategies to improve food security and achieve a sustainable food future.
4 Food Loss and Waste: Facts and Futures
keY MessaGes
WhaT FOOD Is WasTeD The MOsT??
? Where In The VaLUe ChaIn DOes WasTe OCCUr?
WhaT a WasTea pICTUre OF FOOD WasTe In sOUTh aFrICa
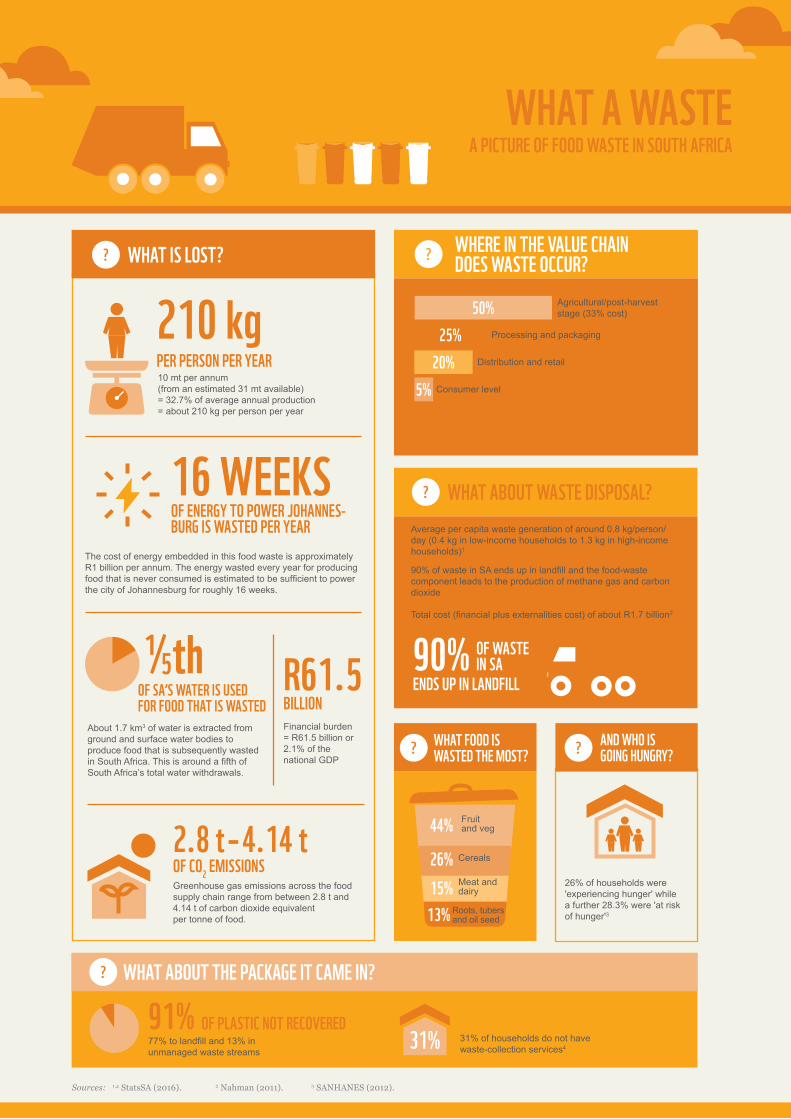
10 mt per annum (from an estimated 31 mt available) = 32.7% of average annual production = about 210 kg per person per year
210 kg per persOn per Year
The cost of energy embedded in this food waste is approximately R1 billion per annum. The energy wasted every year for producing food that is never consumed is estimated to be sufficient to power the city of Johannesburg for roughly 16 weeks.
OF enerGY TO pOWer jOhannes-bUrG Is WasTeD per Year
16 Weeks
About 1.7 km3 of water is extracted from ground and surface water bodies to produce food that is subsequently wasted in South Africa. This is around a fifth ofSouth Africa’s total water withdrawals.
½thOF sa’s WaTer Is UseD FOr FOOD ThaT Is WasTeD
Financial burden = R61.5 billion or 2.1% of the national GDP
r61.5bILLIOn
bUT reDUCInG FOOD WasTe aT The LaTer sTaGes OF The sUppLY ChaIn Can saVe 3 TIMes The enerGY OF CUTTInG WasTe pOsT-harVesT
Agricultural/post-harvest stage (33% cost)50%
Distribution and retail20%Consumer level5%
Greenhouse gas emissions across the food supply chain range from between 2.8 t and 4.14 t of carbon dioxide equivalent per tonne of food.
2.8 t OF CO2 eMIssIOns
Average per capita waste generation of around 0.8 kg/person/day (0.4 kg in low-income households to 1.3 kg in high-income households)1
90% of waste in SA ends up in landfill and the food-waste component leads to the production of methane gas and carbon dioxide
Total cost (financial plus externalities cost) of about R1.7 billion2
90% OF WasTe In sa
enDs Up In LanDFILL
? WhaT abOUT WasTe DIspOsaL?
26% of households were 'experiencing hunger' while a further 28.3% were 'at risk of hunger'3
WhaT Is LOsT??
WhaT abOUT The paCkaGe IT CaMe In??
91% 77% to landfill and 13% in unmanaged waste streams
31% of households do not have waste-collection services4
Processing and packaging25%
? anD WhO Is GOInG hUnGrY?
44% Fruit and veg
13% Roots, tubers and oil seed
15% Meat and dairy
26% Cereals
OF pLasTIC nOT reCOVereD31%
Sources: 1,4 StatsSA (2016). 2 Nahman (2011). 3 SANHANES (2012).
– 4.14 t
5

6 Food Loss and Waste: Facts and Futures
© TATJA
nA
vo
n B
oR
MA
nn
44% of fruit and vegetables is wasted in South Africa and most of it before it reaches the supermarket shelves.

COnTeXT The current level of food waste and loss is unsustainable. Understanding the scope of the problem will guide actions to reduce the wastage of valuable resources and ultimately improve food security.
sCOpe OF The prObLeM All the food produced in the orchards, fields, pastures, greenhouses, feedlots and fisheries of the world is ultimately intended for consumption. Each plum, pilchard or pork rasher will ideally make its way successfully through the various steps of the food supply chain to meet the pressured demand of feeding an increasing global population.
Global context
Every year, the world produces enough calories to feed everyone a mostly vegetarian diet, yet, owing to the complexities, inefficiencies and incongruities in the food system, many people still go hungry. And demand is only growing, so much so that it is estimated that food production may have to increase by as much as 70% to feed 9 billion people in the world by 2050, if current production and consumption behaviour remains unchanged. This would require an increase of 120 million hectares of arable land for crop production in developing countries. It is predicted that arable land in the developed world could decrease by 50 million hectares owing to degradation in the form of erosion, desertification and unsustainable use.1 The decrease in arable land will be exacerbated by climate change-driven water scarcity and warming.
This required production increase is calculated based on a food system that is far from perfect. Staggering evidence of the inefficiency and absurdity of our current food system is found in the fact that a third of the annual global edible food produced, about 1.3 billion tonnes, goes to waste or is lost.2 And this in a world where almost 800 million people are going hungry on a daily basis.
Food waste and loss, and the associated environmental, social and economic implications, have become a topic of increasing global concern. With every morsel of food that is produced and wasted, the embedded nutrition, energy, water, capital and other resources are also wasted. This only further exacerbates the food insecurity experienced across the world.3 The problem is not without complexity and solving the food waste problem is not the ultimate silver bullet to transform the imperfect food system. It is, however, the lowest-hanging – and rotten – fruit on which concerted action can be focused because big inefficiencies suggest big opportunities.4
The first problem is that the terminology is confusing and definitions are not widely agreed upon. There is a subtle difference between ‘food loss’ and ‘food waste’. These processes occur at different stages in the food supply chain, which includes agricultural production, harvesting, post-harvest storage and handling, processing, packaging or distribution, retail and ultimate consumption. In the current literature, food lost at the post-harvest stage is generally referred to as ‘food losses’ and ‘spoilage’, while at the later stages of the food supply chain it is termed ‘food waste’ and generally applies to food lost due to behavioural issues (e.g. consumer behaviour).5
The problem is compounded by a lack of clarity
of what exactly is meant by the terms ‘food loss’ and ‘food
waste’. Typically anything identified as ‘waste’ has little or no value. Food,
particularly edible food, should be called anything but ‘waste’.
1 FAO (2009).2 FAO (2011).3 Notten et al. (2014); Spiker et al. (2017).
4 Lipinski (2013).5 Grolleaud (2002).

8 Food Loss and Waste: Facts and Futures
WhaT CaUses FOOD WasTe?Primarily, there are three interrelated drivers:10
1. large-scale urbanisation that has accelerated food demand and expansion of the agricultural sector
2. dietary transitions to more diversified and resource-intensive foods
3. globalisation and global trade that drive the increase of processed goods, supermarkets and international competition to local markets.
It is also important to consider the packaging in which the food is stored, distributed, displayed and purchased by the consumer. While it is estimated that $11.4 billion of recyclable packaging is wasted every year, it is accepted that the environmental impact is less severe than the impact of wasted food.6 For example, in the USA, household waste costs an estimated $48.3 billion per year.7 WWF South Africa’s research into the beef value chain found that the packaging of two 500 g steaks can be made and disposed of for the same amount of carbon that it takes to produce a mouthful of steak.8
Food packaging plays a critical
role in food safety and in enhancing
the shelf-life of food. But although
packaging can actually reduce
food loss and waste,9 more
time, money and effort should be channelled into
reducing, reusing and recycling
food packaging.
South African context
In South Africa, 10 million tonnes of food go to waste every year.15 This accounts for a third of the 31 mt that are produced annually in South Africa.16 Together, fruits, vegetables and cereals account for 70% of the wastage and loss. In South Africa, this wastage and loss primarily occur early in the food supply chain.17
Interestingly, a study in the city of Rustenburg in North West province found the weight of food waste as a percentage of the total weight of domestic waste collected at different households to be as follows: 27% in low-income areas, 13% in middle-income areas, and 17% in high-income areas.18 Research on food-waste flows in Enkanini informal settlement, Stellenbosch, Western Cape showed that informal settlement households generate between 5.2 and 9.6 kg of food waste per week. Although low-income groups are likely to consume less in general, food waste in this category makes
6 MacKerron (2015).7 Jones (2006). 8 Notten et al. (2014).9 Williams & Wikström (2010).10 Parfitt et al. (2010).11 Notten et al. (2014).12 FAO (2011).
13 FAO (2011). 14 FAO (2011).15 Oelofse & Nahman (2013).16 Nahman & De Lange (2013).17 Notten et al. (2014). 18 Silbernagl quoted in Nahman et al. (2012:2150).
There are, however, significant regional differences in food waste and loss. In the developing world, these processes occur primarily at the initial stages of the food supply chain, whereas in the developed and industrialised world, it occurs at the final stages.11 Measured per capita, much more food is going to waste in the developed world and for different reasons. In Europe and North America, for example, the attitudes and behaviours of food retailers and consumers influence inefficient and unsustainable planning and consumption. In Africa and Asia, on the other hand, food loss and waste occur as a result of financial and managerial constraints and poor infrastructure such as the lack of technology or transport, and also improper farming methods.12 According to the FAO,13 South and Southeast Asia are the smallest contributors to food loss and waste, followed by sub-Saharan Africa. Together, their per capita food loss and waste amount to 460 kg per year, while the combined figures for Europe, North America and Oceania are double that at 900 kg per year.14

9Food loss and waste: Facts and futures
Because there are major knowledge
gaps on global and local food loss and
waste, information is based on best
estimations.
19 Mollatt (2014). 20 Nahman et al. (2012). 21 Oelofse (2015).
22 EPA (n.d.).23 FAO (2011).24 Notten et al. (2014).
up a greater portion of the waste generated by them than by better-off residents.19 This may be due to improper storage facilities such as a lack of refrigeration. The Council for Scientific and Industrial Research (CSIR) has quantified the financial burden of food loss and waste in South Africa at R61.5 billion or 2.1% of the national GDP. Nahman et al.20 found that roughly 0.8% of the national GDP, or R21.2 billion, is wasted by households in the form of food every year.
A ballpark figure for the cost of embedded energy wasted as a consequence of food waste is R1 billion – an approximate estimate of combined diesel and electricity cost. This is a very large amount, despite being an extremely rough figure based on commodity-wide estimates of the embedded energy for food products.
The energy wasted every year in South Africa for producing food that is never consumed is estimated as sufficient to power the City of Johannesburg for roughly 16 weeks. Also notable is the fact that the food products with the highest waste tonnages contribute the least to this overall energy cost. For example, fruit and vegetables account for 44% of the food waste, but for just 15% of the cost of wasted energy.
The wasted embedded water would fill over 600 000 Olympic swimming pools. Given that farming consumes 62% of total freshwater used in SA, this is a huge waste of scarce water resources in the 30th driest country on the planet.
About 90% of waste in SA is disposed of to landfills, where the food-waste component leads to the production of methane gas and carbon dioxide.21 Methane is a potent greenhouse gas that contributes to climate change, having 28–36 times more impact on the environment than carbon dioxide (over 100 years).22
There are major research and knowledge gaps on global and local food loss and waste,23 therefore information is primarily obtained from best estimations and merely provides indications. Research is specifically lacking on the causes and nature of food waste along the various steps in the food supply chain and also, particularly, on accurate quantification.24 In South Africa and other developing countries, especially, there is a dearth of accurate and up-to-date information, such as related emissions research.
The fact remains, however, that this level of food loss and waste is unsustainable. It impacts on the competitiveness of the South African food industry by reducing the growth and employment potential of the sector. It is also a waste of valuable resources which, as the impact of climate change becomes more significant, could reduce the capability of the South African food industry to adapt. Finally, successfully reducing food loss and waste is an opportunity to mitigate the severe localised food insecurity that is being experienced by significant portions of the South African population.

The WaTer We CannOT see25
25 Sources: WWF and Woolworths research, the Green House www.tgh.co.za and UCT Chemical Engineering Department.
Throwing away half your hamburger is equal to a 60-minute shower with a water-efficient shower head
Leaving a mouthful of steak on your plate equates to running your dishwasher 22 times
Spilling a teaspoonful of sugar equates to about one flush of a dual-flush toilet
Wasting just one teaspoon of milk is equivalent to one flush of a dual-flush toilet
Wasting a litre of milk is equivalent to taking six full baths
Pouring half a cup of orange juice away is equal to flushing the toilet 12 times
Letting a clementine rot is equivalent to flushing the toilet three times
Letting an apple or pear rot is equivalent to taking a 3-minute shower (or flushing the toilet four times)
= =
=60 minutes
10 Food Loss and Waste: Facts and Futures
Note: All the comparisons are calculated for South Africa and are based on total water use, which includes both water extracted from dams, etc. for irrigation (blue water) and rain water (green water), with the exception of the fruit and sugar examples, which include irrigation water only.
= 1x 1x
12x
3x 4x
6x
= =
=
=22x

The hidden waste in the fishing sector
Post-harvest fish losses are of major global concern. In most fish value chains an estimated average of 27% of fish is lost or wasted between landing and consumption.26 A lack of verified data is a persistent challenge, with little or no reported data available for fish catches that are discarded at sea.
In the past five decades, the supply of fish for human consumption has grown immensely.27 This growth is linked to population growth, reductions in wastage, improved utilisation and distribution channels, international trade, rising incomes and urbanisation.28
Fish is a versatile commodity. However, it can spoil easily, becoming unfit for consumption and even dangerous to health through microbial growth, chemical change and breakdown by endogenous enzymes.29
According to the FAO,30 over 21 mt of fish were destined for non-food products in 2014, of which 76% was reduced to fishmeal and fish oil. Fishmeal is used in the diets of farmed fish, poultry and pigs, and in pet food.31 In South Africa, this is the fate of the entire anchovy and herring catch and of some juvenile sardine. In 2016, approximately 329 000 tonnes were converted into fishmeal and a further 3 770 tonnes of fishmeal were produced from sardine heads and guts.
Fish by-products, including waste, have always been considered of low value and used as feed for farmed animals or thrown away, often called ‘trash fish’.32 In the last two decades, there has been an increase in the use of fish by-products. In South Africa in 2008, 83.8 mt of fishmeal were produced from by-products.33
The global discards of fish at sea were estimated to be around 7.3 mt in 2005, 80% coming from industrial fleets.34 In contrast, small-scale fishers generate less wastage in the form of discards (about 2 mt a year). However, a substantial amount of fish is lost due to post-harvest mishandling during transport, inadequate storage, unhygienic landing centres, unreliable electricity supply, lack of processing facilities and extended waiting periods before the fish is sold.35
In South Africa, there is no validated data on the volume lost during post-harvesting in the small-scale fishery and recreational sectors. Although reported data does not account for fish caught but discarded at sea, estimated discard rates for South African trawlers range from an overall rate of 4.136 to 31%.
per CapITa COnsUMpTIOn OF FIsh InCreaseD FrOM an
aVeraGe OF 9.9 kg In The 1960s TO 19.7 kg In 2013.
9.9 –19.7 kg
26 FAO (2016); Béné et al. (2015). 27 FOA (2016). 28 Béné et al. (2015); FAO (2016). 29 FAO (2016).30 FAO (2016).31 Jackson & Shepherd (2010).
32 Belton & Thilsted (2014). 33 Jackson & Shepherd (2010). 34 Kelleher (2005). 35 FAO (2016); Béné et al. (2015). 36 Kelleher (2005).
11Context
FIsh VaLUe ChaIn
UnDersTanDInG The LInk beTWeen FOOD WasTe anD GreenhOUse Gas eMIssIOns Although food waste has become a huge concern in both developing and developed countries, a key impact that has received limited attention is the environmental and economic cost of food waste. In terms of environmental costs, the typical measure is in terms of greenhouse gas (GHG) emissions. This is measured in two ways: first, in terms of a relatively minor impact from the decomposition of food waste at landfills,
12 Food Loss and Waste: Facts and Futures
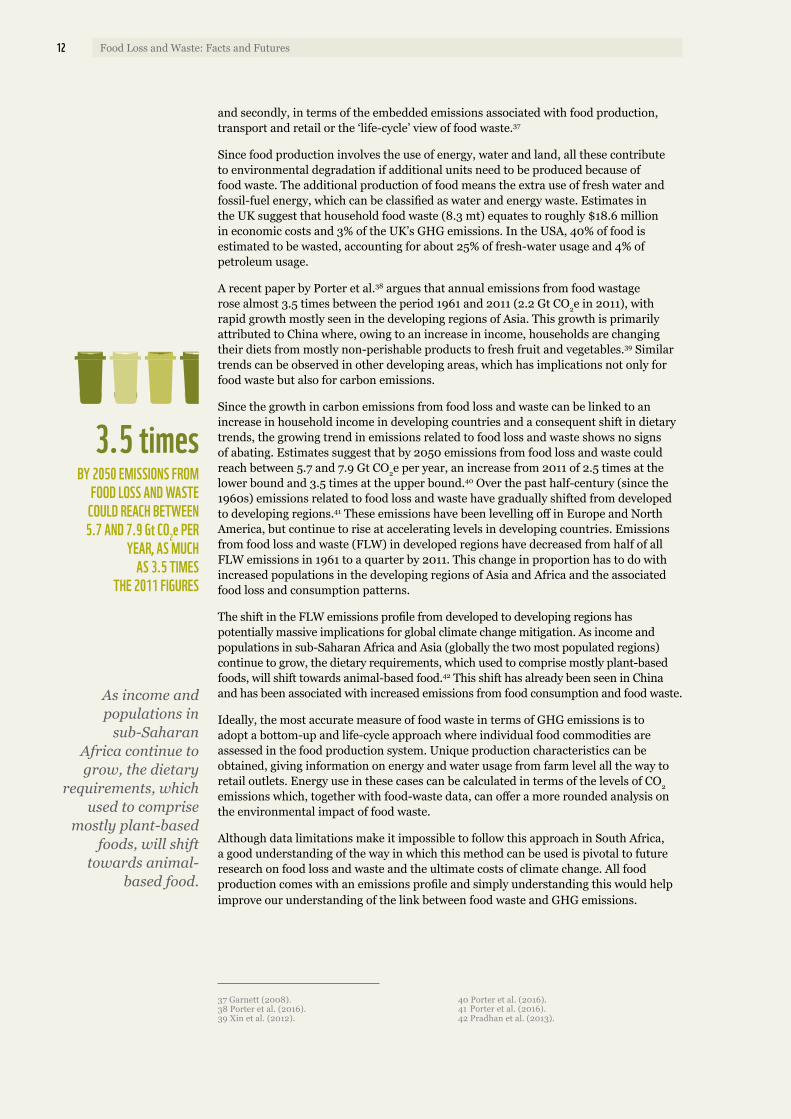
bY 2050 eMIssIOns FrOM FOOD LOss anD WasTe
COULD reaCh beTWeen 5.7 anD 7.9 Gt CO2e per
Year, as MUCh as 3.5 TIMes
The 2011 FIGUres
As income and populations in
sub-Saharan Africa continue to grow, the dietary
requirements, which used to comprise
mostly plant-based foods, will shift
towards animal-based food.
37 Garnett (2008). 38 Porter et al. (2016). 39 Xin et al. (2012).
40 Porter et al. (2016). 42 Pradhan et al. (2013).
3.5 times
and secondly, in terms of the embedded emissions associated with food production, transport and retail or the ‘life-cycle’ view of food waste.37
Since food production involves the use of energy, water and land, all these contribute to environmental degradation if additional units need to be produced because of food waste. The additional production of food means the extra use of fresh water and fossil-fuel energy, which can be classified as water and energy waste. Estimates in the UK suggest that household food waste (8.3 mt) equates to roughly $18.6 million in economic costs and 3% of the UK’s GHG emissions. In the USA, 40% of food is estimated to be wasted, accounting for about 25% of fresh-water usage and 4% of petroleum usage.
A recent paper by Porter et al.38 argues that annual emissions from food wastage rose almost 3.5 times between the period 1961 and 2011 (2.2 Gt CO2e in 2011), with rapid growth mostly seen in the developing regions of Asia. This growth is primarily attributed to China where, owing to an increase in income, households are changing their diets from mostly non-perishable products to fresh fruit and vegetables.39 Similar trends can be observed in other developing areas, which has implications not only for food waste but also for carbon emissions.
Since the growth in carbon emissions from food loss and waste can be linked to an increase in household income in developing countries and a consequent shift in dietary trends, the growing trend in emissions related to food loss and waste shows no signs of abating. Estimates suggest that by 2050 emissions from food loss and waste could reach between 5.7 and 7.9 Gt CO2e per year, an increase from 2011 of 2.5 times at the lower bound and 3.5 times at the upper bound.40 Over the past half-century (since the 1960s) emissions related to food loss and waste have gradually shifted from developed to developing regions.41 These emissions have been levelling off in Europe and North America, but continue to rise at accelerating levels in developing countries. Emissions from food loss and waste (FLW) in developed regions have decreased from half of all FLW emissions in 1961 to a quarter by 2011. This change in proportion has to do with increased populations in the developing regions of Asia and Africa and the associated food loss and consumption patterns.
The shift in the FLW emissions profile from developed to developing regions has potentially massive implications for global climate change mitigation. As income and populations in sub-Saharan Africa and Asia (globally the two most populated regions) continue to grow, the dietary requirements, which used to comprise mostly plant-based foods, will shift towards animal-based food.42 This shift has already been seen in China and has been associated with increased emissions from food consumption and food waste.
Ideally, the most accurate measure of food waste in terms of GHG emissions is to adopt a bottom-up and life-cycle approach where individual food commodities are assessed in the food production system. Unique production characteristics can be obtained, giving information on energy and water usage from farm level all the way to retail outlets. Energy use in these cases can be calculated in terms of the levels of CO2 emissions which, together with food-waste data, can offer a more rounded analysis on the environmental impact of food waste.
Although data limitations make it impossible to follow this approach in South Africa, a good understanding of the way in which this method can be used is pivotal to future research on food loss and waste and the ultimate costs of climate change. All food production comes with an emissions profile and simply understanding this would help improve our understanding of the link between food waste and GHG emissions.
41 Porter et al. (2016).

13Food loss and waste: Facts and futures
The significant economic and environmental losses from food waste are compounded by the fact that 800 million people still suffer from hunger globally, while 1.9 billion adults are overweight or obese. These alarming statistics lead to a third of the world’s population being characterised as malnourished, which contributes to reduced productivity and economic growth and increased morbidity, mortality and disease.
All food waste can also be categorised as wasted nutrients; nutrients that could be consumed by those without access to a healthy diet that meets their daily requirements of essential vitamins and minerals. This is especially true because the food wasted at the highest level (estimated to be as high as 50%) is nutrient-dense fruits and vegetables. Furthermore, although it is difficult to estimate amounts, we know that lean protein sources such as poultry, fish and eggs are also wasted across the value chain, equating to wasted essential fatty acids, vitamins (A, B, D) and minerals (including calcium, iodine, zinc, iron and selenium).
The FAO43 has specifically investigated how this fruit and vegetable loss equates to losses of vitamins A and C across the food supply chain in seven regions spanning Europe, Asia, the Americas, Oceania and Africa. While these methods to evaluate nutrient losses in food waste have significant limitations, the FAO44 concluded that a reduction could ‘avail more nutrients and phytochemicals for human consumption, contributing to alleviation of micronutrient deficiencies and non-communicable diseases in vulnerable populations’.
While food waste and poor nutrition are global issues, they hit close to home in South Africa. Elements of the state of nutrition in South Africa include:
• 43.6% of South African children are deficient in Vitamin A, which leads to a weakened immune system (increasing the prevalence of illness and disease, potentially blindness)
• 10% of South African children suffer from iron deficiency anaemia, a condition that can leave children feeling tired and weak
• Professor David Sanders at the University of the Western Cape’s School of Public Health45 explained that ‘on average the IQs are being lowered because of this chronic under-nutrition, especially in early childhood’
• adults who are eating diets with inadequate nutrients are at higher risk of developing diabetes, heart disease and certain cancers.
As the South African diet continues to shift towards one that is higher in processed foods and lower in fruit and vegetables, malnutrition will increase as well. Reducing food waste in South Africa can improve the health and well-being of the majority of South Africans.
43 FAO (n.d.). 44 FAO (n.d.). 45 Stassen (2015).
Food waste = Wasted nutrientsnUTrITIOn
Context
43.6% of South African children are deficient in Vitamin
A, leading to a weakened immune
system.

14 Food Loss and Waste: Facts and Futures©
Wo
oLW
oR
ThS
Understanding the connection between wasted food and wasted resources requires obtaining information on
energy and water usage from farm level all the way through to retail outlets.

pUbLIC anD prIVaTe seCTOr
A focused approach to the minimisation of food waste and diversion from landfill requires clear action plans and targets at a sector level and collaboration across government departments, business and civil society.
pUbLIC seCTOr Policies, legislation and regulations
There is no legislation in South Africa that regulates food waste per se. Yet the perception of the food industry is that it is highly regulated, often leading to still usable products being condemned.
Food waste is controlled by legislation that covers waste or waste management in general. This legislation is enforced by environmental health practitioners, the Department of Water and Sanitation and the Department of Environmental Affairs.46 Policies, legislation and regulations that would govern the management of food loss and waste include the following:
• The National Environmental Management: Waste Act 59 of 2008 and the National Environmental Management: Waste Amendment Act 26 of 2014. Both these Acts stipulate controls for the management and recording of waste, including the issuing of licences. Most importantly for the purposes of food loss and waste, it requires municipalities to develop integrated waste management plans. The corresponding National Environmental Management Act 107 of 1998, under which the above two Acts reside, specifically outlines some principles relating to waste, noting that waste should be avoided or, where it cannot be avoided altogether, should be minimised, reused or recycled wherever possible. The Act also includes a citizen dimension, noting that ‘any person must take reasonable measures to avoid pollution and/or degradation of the environment’.
• The National Waste Management Strategy (NWMS), which includes a government target to minimise waste to landfill by 25% by 2016. Potential measures to reduce waste are also cited, with Goal 1 being the most relevant to the reduction and diversion of food waste from landfill through promoting the minimisation, reuse, recycling and recovery of waste. The strategy also provides for the designation of waste management officers to co-ordinate waste management activities within and across the different levels of government to ensure implementation.47
• The food regulations under the Foodstuffs, Cosmetics and Disinfectants Act 54 of 1972 and the Health Act 63 of 1977. It is these regulations that are perceived to be contributing to food waste rather than the environmental laws.
Given the environmental, social and economic cost of disposing food, the legal obligations of waste disposal would suggest that the role of the government at all levels is vital for co-ordinating, implementing, incentivising and monitoring the minimisation and diversion of food loss and waste from landfill.
South Africa does not have legislation that governs food waste
exclusively.
46 Allies (2011). 47 DEA (2013); Ramukhwatho et al. (2016).

Government getting it right: Scandinavian gold standard on food waste
The Scandinavian countries of Denmark and Sweden are widely recognised for the proactive approach they’ve taken to reducing food loss and waste. Sweden presents an interesting example of government championing effective cross-sector collaboration to counteract food loss and waste.
• Government: For the period 2013–2015, three national agencies (agriculture, environment and food) were involved in a three-year project to reduce food waste. They focused on:
• identifying knowledge gaps and barriers to reducing food waste
• educating consumers
48 Ayeleru et al. (2016); DEA (2012); Haider (2014); Mollatt (2014); Urban Earth (2013).49 Sango et al. (2016); Urban Earth (2013).
50 DEA (2012, 2013); Sango et al. (2016).51 Robinson & Jenkin (2017). 52 Robinson & Jenkin (2017).
65–90%IT Is esTIMaTeD ThaT
beTWeen 65 anD 90% OF OrGanIC WasTe (InCLUDInG
FOOD WasTe) COLLeCTeD bY MUnICIpaLITIes Is DUMpeD
aT LanDFILLs.49
Case sTUDY 1
16 Food Loss and Waste: Facts and Futures
To identify appropriate solutions it is useful to understand the volumes of food waste that authorities handle. At present no research adequately identifies the volume of food waste entering the South African municipal waste stream. An organic waste fraction is often reported, of which food waste would form a part. Even at this level, figures for organic waste vary between 5 and 50%.48
Despite this discrepancy in the figures, it is apparent that a large proportion of food waste generated by households and the food service sector is disposed of at landfills. As municipalities provide waste management services for households, they are critical role players in making the transition from dumping food waste at landfills to promoting the minimisation and diversion of food waste. As the populations in our cities grow, the organic fraction of household waste is predicted to grow exponentially. Given that cities are also running out of landfill space makes the role of municipalities even more important. Some of the biggest constraints in implementing a transition from using landfills to minimising or diverting food waste are the lack of capacity and awareness about this issue in municipalities; the discrepancy between the waste management services in urban and rural areas; and the fact that food waste is not recognised in ‘general waste’ classifications, which means that there is no obligation to record it.50
There is another dimension to the regulatory environment: surplus food can be redistributed. This is a viable alternative to disposal. Diverting edible food to charity is an active strategy for a number of retailers and food industry players; either directly through local charity relationships or through organisations like Food Forward (previously Foodbank SA) which collect edible surplus food.51 Innovative business models, such as that of Groceries Unlimited, have also responded to the opportunity for resale of still edible food. Groceries Unlimited’s Foodies stores sells cut-price food close to or past its ‘best before’ date often sourced from insurance companies that receive the goods as a result of claims.
WWF research (see page 20) found that companies are often reluctant to donate food, not only because they fear that their reputation would suffer should there be accidental food poisoning but also because they do not want to risk misinterpreting the regulations. The legislative procedures – such as the need for a manufacturer or retailer to obtain a ‘Safety Disposal Certificate’ from the entity accepting or removing donated food from its premises, can deter food donation. These certificates are governed by complex provisions in various Acts and regulations and cannot be provided by receiving companies such as Food Forward or Groceries Unlimited, for instance.52

53 http://slangintematen.se/54 Champions123 (2016).
Based on Case Study 1, the case of Sweden being a gold standard for reducing food loss and waste is quite clear. Not only are numerous government agencies or ministries involved, but there is a clearly formulated action plan and target. There is cross-governmental collaboration and collaboration with business and civil society. With data always being an issue, Sweden has actively worked to create a platform where data is available at all levels, from country level to business and household level. The result is that in terms of per capita food waste, Sweden is far below other developed countries.
As a country we are committed to
reducing food waste by 50% by 2030.
• increasing collaboration among actors in the food chain
• providing examples of effective approaches
• stimulating production of biogas from food waste that cannot be prevented
• making recommendations for future work.
• Policy: A national waste plan (2012–2017) was created by the Swedish Environmental Protection Agency and a new one is forthcoming.
• Civil society: Organisations such as the Swedish Consumer Cooperative provides information, guidance and education material to consumers.53
• Multi-stakeholder grouping: The Swedish Collaboration Group for Reduced Food Waste (SaMMa) brings together diverse sectors to find active ways to address food waste.
• Business: Numerous agencies work to collect and share data throughout the supply chain.
Western Cape Government
In 2016 the Western Cape Government initiated a strategic framework for household food and nutrition security, called ‘Nourish to Flourish’. The strategy has a threefold aim:
• to protect the province’s residents while addressing the underlying problems that shape the food economy
• to ensure that resources are managed
Case sTUDY 2
17Public and private sector
National, provincial and municipal response
Food waste is becoming a more important item on the government’s agenda – the South African government is a signatory to the United Nation’s Sustainable Development Goals, of which target 12.3 sets a target to reduce food waste by 50% by 2030.54
Given this level of commitment, one would expect to find examples of food waste reduction initiatives in South Africa or legislation to that effect. However, very few interventions could be found. The organic or food waste interventions that were identified focused on ‘end-of-pipe’ solutions, such as composting. No examples of food waste reduction at a national, provincial or municipal level could be identified, except for some projects in the Western Cape Government, eThekwini Municipality and the City of Cape Town. This illustrates the chasm between the targets being set and actual activities on the ground.

18 Food Loss and Waste: Facts and Futures
55 Western Cape Government (2016).56 Norton & Rawlinson (2016). 57 Ayeleru et al. (2016).
58 Sources: Dube (2016); Fouche et al. (2012); Haysom (2016); Masojada (2014); Mollatt (2014); Pereira (2014); Petersen (2016); Skinner & Haysom (2016a, 2016b).
prIVaTe seCTOr Formal vs informal market challenges
The South African food retail industry is diverse – it includes large formalised supermarket chains, wholesale markets, spaza shops and informal traders selling their produce on the street or in localised hubs.56 The reasons for food waste occurring in formal and informal markets will vary, particular during the post-harvest, retail and consumer stages of the food supply chain. Some of the main differences will be determined by the ability to refrigerate and store food at optimal temperatures to maintain shelf-life, and the quantity and preparation of fresh produce used during the cooking stage. For example, lower-income households are more likely to prepare food from scratch, whereas middle- to higher-income households purchase more prepared and packaged foods. Ironically, preparing meals from scratch creates more organic food waste.57
• Concentrated, with four large supermarket chains: Pick n Pay, Shoprite, SPAR and Woolworths
• A wide geographical presence in all provinces
• Food commonly sourced directly from growers
• Often a major supplier to the informal market
CharaCTerIsTICs • Food-insecure households more likely to rely on informal sources of food and the informal market in general
• Smaller purchases of fresh produce made more often
• Food commonly sourced from supermarkets, wholesalers and sometimes directly from commercial growers
• Retail chains account for nearly 70% (R320 billion) of total retail market
• Formal and ‘hybrid’ wholesalers make up 5% (R25 billion) of retail market
• Almost 1 700 supermarkets countrywide
• 33 wholesale markets countrywide
• Food sales account for nearly 54% of all retail sales
• The 10 largest packaged-food companies account for almost 52% of total packaged-food sales
• Market size estimates vary from R46 billion to R176 billion
• 66% of street traders sell food
• More than 350 000 street traders sell food
• 2% of households purchase food from the informal food economy almost every day
• On average 70% of households normally source food from informal markets or street vendors
sIze
FOrMaL MarkeT InFOrMaL MarkeT
• to allow people to access fresh and nutritious food.
The programme consists of six pillars, of which the fourth, ‘Food resource management for the future’, aims to work towards the integration of responses to climate change into all aspects of the food system by 2030.
One of the solutions identified to meet this objective is to improve the reduction and management of food waste in the province. The government is currently working with stakeholders to meet this objective.55
While some municipalities are
interested in and do recognise the issue of
organic waste (which includes food waste),
most focus on diverting organic waste to
composting rather than on reducing food waste.
TabLe 2.1: keY DIsTInCTIOns beTWeen The FOrMaL anD InFOrMaL MarkeTs58

19Food loss and waste: Facts and futures
• All major food retailers and manufacturers have active corporate social and environmental responsibility programmes
• Little actual data exists on food loss or waste generated along food-manufacturing or retail supply chains, or within operations
• Larger international food manufacturers operating in South Africa, e.g. Nestlé and Unilever, are committed to reducing food waste
• Very little research, if any, exists on food loss and waste in the informal retail sector
• Research often focuses on access to food, or problems associated with the volume and type of waste generated so as to overcome waste disposal, hygiene and pollution problems
• The mere scale of the informal food sector indicates that food loss and waste could be a problem
• A better understanding of food sold, how and where it is sold and consumed and food waste disposal routes would make it possible to develop targeted solutions to reduce food waste
DaTa anD aCTIVITIes
Participants in the formal market could:
• collaborate with one another to gain access to a large consumer base for anti-food-waste campaigns and initiatives
• collaborate to bring about a large-scale shift in consumer behaviour and reduce food waste
• make changes to their ordering and other procurement practices to significantly reduce food loss in their supply chains
• create greater consumer loyalty
• connect commercial growers directly with school feeding schemes or informal traders (‘bakkie’ trade) to absorb surplus food
Participants in the informal market have the following opportunities:
• to reduce the presence of vermin by reducing food waste in trading environments and homes
• to absorb and sell food that would not meet ‘formal’ market specifications through informal selling
• to allow consumers to purchase food in quantities of their choice
• to share unwanted or surplus yet edible food with neighbours or family members
OppOrTUnITIes
Formal-market participants face the following challenges:
• the financial benefits of investing in food loss and waste minimisation activities in their supply chains
• the actual cost of change, e.g. having to invest in packaging technologies or run a consumer awareness campaign
• a lack of ability and flexibility to change technical product appearance specification practices
• regulatory barriers, e.g. waste licensing and permitting that can restrict food redistribution
• retailer competition, which could have an impact on collaboration in the industry
• the lack of skills and capacity to identify and implement food-waste reduction initiatives
Participants in the informal market face the following challenges:
• ownership of informal stores is transient, with 85% run by foreigners and premises rented by South Africans
• any formalisation of the informal trade through regulatory controls such as health certificates could significantly increase food waste, as the sector currently absorbs large quantities of food not accepted within the formal sector, e.g. spent layer hens, chicken heads and legs, the 5th quarter (giblets, head, tail, tongue, heart, liver, etc.) and damaged, misshapen or discounted produce
• an increase in food prices could lead to an increase in the purchase of low-cost, low-nutrition food or mass-produced take-away food; fresh food may become undervalued, resulting in increased food waste
ChaLLenGes
Public and private sector
FOrMaL MarkeT InFOrMaL MarkeT
TabLe 2.1: keY DIsTInCTIOns beTWeen The FOrMaL anD InFOrMaL MarkeTs (continued)
South Africa has a diverse retail grocery sector, ranging from large full-line supermarkets and wholesalers (the formal trade) to small, informal spaza shops (the informal trade). To identify appropriate solutions to minimise food loss and waste in the sector, it is useful to understand some of the key distinctions between the markets, and the potential challenges and opportunities that exist, in order to implement activities that will reduce waste.

20 Food Loss and Waste: Facts and Futures
Understanding the food industry position
A WWF-SA survey of the packaged-food, retail and hospitality sector’s food waste and loss attitudes and policies provided some interesting insights and the first steps towards evidence-based, fit-for-purposes solutions.
Estimates suggest that most food loss and waste (96%) occur at the pre-consumer level. Although one can speculate about the possible reasons for this food waste (such as transportation, storage infrastructure, poor handling and processing), actual data to measure the possible causes is limited.
In an effort to better understand food waste from the perspective of the retail, hospitality and packaged-food industry, a survey was conducted by WWF-SA in 2017. Most food waste occurs before the food reaches these three sectors, although some of this waste is inadvertently caused by manufacturers and retailers, so the survey was the first step towards finding evidence-based, fit-for-purposes solutions for food loss and waste.
The surveyA total of 53 companies were identified to participate in the survey. The survey was drafted with support from the World Resources Institute (WRI) and a total of 23 questions were asked, of which only four were quantitative. Companies received the survey via email but about half the target respondents, those identified as market leaders, were also asked to participate in telephonic or face-to-face interviews.
Although only 30% of the selected companies agreed to participate, those that did respond are South Africa’s largest food retailers, food brands and brand owners and represent the bulk of the formal food industry. This makes the findings useful to reflect the status, understanding and reporting of food loss and waste in the country.
FindingsThe results from the survey suggest that a positive trend is developing regarding combating food waste. All the companies indicated that they regard food loss and waste as an important issue and that they are measuring or estimating food waste in their company. Also, the majority of the companies (86%) set food waste targets and have active policies intended to decrease food loss and waste at multiple points in their operations.
However, while targets or policies were evident, these were not always supported by detailed company estimates, nor were dedicated members of staff assigned the task of reducing food loss and waste. While 70% of respondents indicated that they collected food waste data, very few were able to provide figures. This may be owing to confidentiality, but in some instances there was no central data-collating point or the granularity of the data was not understood. The fact that policies are not successfully implemented, managed and administered could be contributing to a lack of visibility of food waste volumes and causes across the business, which in turn contributes to high levels of waste.
While the research clearly indicates that companies recognise the need to identify, measure and address the problem of food loss and waste, the strategic importance of implementing activities to prevent food loss and waste was less evident. All the respondents indicated waste levels below 5% and almost all the companies believed that most food was wasted elsewhere in the supply chain, not in their sector. Almost 50% of the respondents believed it happened at consumer level, followed by retail. Yet when asked if consumer education was being provided to help improve the understanding of packaging innovations, cooking and storage tips or date labels in order to reduce waste levels, the answer was consistently negative. The explanation for this lies in the fact that most policies are associated with the need to improve operational efficiencies and manage costs, so food waste is still understood as an issue of economics rather than social and environmental responsibility: if it happens outside of operations and has no impact on return on investment, it is not seen as a necessary area of investment.
This failure to invest in customer education to reduce waste in homes is partially offset by the fact that a third of the companies look for avenues to donate surplus food. Those that do not donate food predominantly cited the lack of clarity on food safety regulations,
The survey responses indicate a lack of
clarity on where in the food value chain
the food loss and waste occurs.

21Food loss and waste: Facts and futures
liability and reputational concern as reasons. It would seem that the publicity risk of one bad food incident far outweighs the benefits of donating food as part of a social responsibility initiative or to decrease food waste.
Consumers were also seen as a cause of waste because they expect premium or ‘perfect’ products and produce. This is supported by other research conducted by WWF, which indicates that part of the food wasted at farm level is owing to the appearance of the food not meeting the high standards of food distributors; thus a percentage of crops never actually leave the farm and is often just ploughed back into the soil.
Constraints and conclusions The research was intended to include a quantitative component, but as respondents were only able to provide percentages rather than volumes or category breakdowns, obtaining comparable, benchmarked data remains a significant challenge. Until this lack of transparency is addressed it will remain difficult to know exactly where the problem lies, why it occurs and how it can be resolved. Even when information was available, it was very difficult to cross-reference to check for accuracy. This problem of transparency was highlighted in the question about the WRI’s Food Loss and Waste Accounting and Reporting Standard (FLW Standard). Respondents were not aware of it and once it was explained only two indicated that they would be willing to report and conform to the standard.
This research was time consuming and challenging because most of the companies were reluctant to participate. During a follow-up workshop there was a similar lack of willingness on the part of companies to discuss the food loss and waste issue.
The fact that companies identify food waste as a problem and try to measure and address it on their own, in ‘silos’, might not be the right solution. It really is the ‘tragedy of the commons’ if most firms believe food waste happens somewhere else, outside their supply chain. Dialogue and a willingness to work with civil society and the government to address fool loss and waste are critical.
A company from the food processing and manufacturing sector
“The business case for reducing food waste is growing stronger every day, we recognise the economic, social and environmental impact of food waste and the growing need to reduce this.”
Status quo: This company presents interesting insights into the responsibility for food waste and where it should fall. Although many food processors and manufacturers understand the importance of food waste, this company reflects the norm where most have yet to set reduction targets or have active organisation-wide policies. One reason for this could be the fact that food loss and waste are quite a recent concern for South Africa and thus many companies do not have the appropriate structure to deal with measuring food waste, setting targets and creating policies.
Main insight: The concept of the ‘tragedy of the commons’ seems to apply to food waste responses where there is insufficient impetus to act for the common good. Although this company was aware of the voluntary FLW Standard they were not willing to join voluntarily. There is limited benefit to be the ‘first mover’ and, moreover, it adds additional administrative costs for the organisation.
Over 63% of respondents
adopt packaging technologies to
reduce food waste, but only 20% inform
consumers of these innovations. Only 27% provide
guidance on how to interpret date labels.
Public and private sector
Case sTUDY 3

A company from the retail sector
“Each department has integrated waste reduction into a number of things across the supply chain – a lot of time is spent there because it’s money.”
Status quo: It seems that, at least from a company perspective, a reasonable amount has been achieved to combat food loss and waste.
According to the company, there seems to be widespread recognition of food waste in the organisation. It is a strategic priority and active policies and targets are in place to reduce food waste. The company donates food not sold to numerous organisations. It actively looks to innovate on packaging to reduce food waste, offer detailed information on interpreting labels and has implemented measures outside its immediate operations to address food waste.
Main insight: It is the only retailer surveyed who stated that most food in South Africa is being wasted not at the consumer level, but rather at the farm level. In the context of the current information on food waste in South Africa it seems that this company has been one of the few to correctly identify food waste as lying outside the consumer sector.
A company from the food processing and distribution sector “Food waste is measured throughout the supply chain, it's an important cost factor especially with margins in the dairy business. A lot of emphasis is placed on this – when we offload a tanker per site, we measure the percentage of waste, and the same will apply for the processing and packaging areas. Food waste is important for us, it is high up on the radar, and we aim for alignment right down to floor level.”
Status quo: The company in question, one of the largest distributors in South Africa, not only sets food waste targets, but also has active policies to manage food waste. Reducing food waste is part of their strategic priorities and the company has an entire team dedicated to reducing food waste (from the chief engineer to production managers).
Additionally, the company donates unsold or undelivered food to charities, works towards innovations in packaging to increase shelf-life and informs consumers of these innovations through marketing.
Main insight: From all the companies surveyed, this one seems to offer the most optimistic outlook on South African companies. It seems to be most aware of the food waste problem, has extensive policies to address this (throughout the organisation) and communicates this to consumers in the form of marketing outreach. This could be seen as the gold standard that other companies could follow. However, although they were aware of the FLW Standard, they were non-committal about possible participation.
Case sTUDY 4
Case sTUDY 5
22 Food Loss and Waste: Facts and Futures

Food products are not legally required to have explanatory text to define date labels. This leaves interpretation up to the consumer. The misunderstanding of these labels is often the cause of further unnecessary waste.
full cream milk
LabeLLInG FOOD In sOUTh aFrICa
Source: Inspired by a similar representation by the Harvard Food Law and Policy Clinic and Natural Resources Defence Council on US food date labels.
best beforesell byuse by
International best practice, from WRAP in the UK, considers that:
• the consumer should see one clear label
- with a single date on perishable products and consistent labelling for the entire product category (e.g. milk)
- that is prominently positioned and easy to read
- that contains stock-control information (e.g. the sell-by date), which should be coded so as to be unintelligible to the consumer.
• there should be no date label on long shelf-life products such as rice and pasta.
date of manufacture
1 litre
Food labels are provided for under the Foodstuffs, Cosmetics and Disinfectants Act 54 of 1972, ‘Regulations Relating to the Labelling and Advertising of Foodstuffs’, R146.
The latest regulations, R429, are to be passed soon.
Indicates ‘the date which signifies the end of the period … during which the product will remain fully marketable and will retain any specific qualities …’.
The food is still safe to eat and will have deteriorated in quality only.
Indicates ‘the last date of offer for sale to the consumer after which there remains a reasonable storage period at home’.
This date is not meant for the consumer, but merely indicates to the retailer when the supplier would like the product to be removed from the shelves.
The following foodstuffs and ingredients are exempt from dates of durability: alcoholic beverages, chewing gum, confectionary products of flavoured and coloured sugars, unpeeled and uncut fruit and vegetables, processed meat, honey, ready-to-eat flour confectionary, sugars, unprocessed and unpacked fish, meat and poultry, and vinegar.
This means that some non-perishable food products have date labels, even though their shelf-lives go long beyond those. This includes pasta and rice.
‘The date which signifies the end of the estimated period … after which the product probably will not have the quality attributes normally expected … food should not be regarded as marketable.’
This date is applied to fresh, perishable and pre-packed food items. It is illegal to sell food past this date.
'The date on which the food becomes the product as described.'

24 Food Loss and Waste: Facts and Futures
Woolworths
Woolworths’ active relationship with its customers, supply farms and their processed food manufacturers positions the company to follow a comprehensive approach to waste reduction through its full supply chain.
In 2015 WWF conducted a scoping study of the Woolworths value chain. The aim of the study was to understand the extent to which food waste is occurring in relevant value chains and within the home of the consumer. This research included a questionnaire which was completed by 1 846 regular Woolworths customers.
By tracking one product – spinach, both baby leaf and Swiss chard – through the supply chain, it was possible to determine where the most significant food loss and waste hotspots occurred. Unsurprisingly, the highest levels of potential food loss and waste occurred on the farm where, in extreme cases, up to 60% of the crop could be lost.
Primary causes for on-farm waste are damaged harvests or over-planning by the grower. In the processing stage, waste is usually caused by quality issues and size variations. This means the product does not meet the required Woolworths procurement specifications. By understanding where and why food loss and waste occur in the supply chain, Woolworths is in a position to work more closely with its suppliers to reduce loss of food products.
Currently waste management efforts include fit-for-purpose packaging, on-pack information, donations of surplus food to more than 1 000 charities every year, and promoting supply chain efficiency and sustainable farming practices. Woolworths is also using social media to show customers how to reduce food waste through using leftovers and storing food effectively. By 2020 Woolworths aims to ensure that 95% of store waste and 100% for head offices and Distribution Centres does not land up in landfill. If it is not fit for human consumption it will be diverted to other uses such a feed, compost or energy.
For the past few years Woolworths
and WWF have worked together
to resolve environmental
challenges in areas of common interest. The focus on waste in this partnership
has been an important source
of learning for both organisations.
Case sTUDY 6
From farm to fork – how much is lost along the way?
WWF in partnership with Woolworths participated in the pilot testing phase of the WRI’s Food Loss and Waste Accounting and Reporting Standard (FLW Standard). The aim was to test a methodology for mapping food loss and waste along the supply chain. Spinach was selected because of its multiple uses and risk of waste throughout the chain. The results showed that the greatest potential waste occurred at the production and processing stages: of the initial 100 g of spinach produced on the farm, only 26 g is eaten.
VaLUe ChaIn sTUDY
in-store7 g
Waste insights from Woolworths customers
38%said that the most food waste in their household was caused
during food preparation
20%buy too much voluntarily
16%are compelled to
buy too much (because pack sizes are too large)
14%serve too large portions, resulting in leftovers on
plates
12%cook too much
on-farm29 g
Lost
38 gPacking and processing
Lost
0 gretail distribution centre
Lost
eaten26 g
Eaten

25Food loss and waste: Facts and futures©
JAM
ES
Mo
RG
An
/WW
F
The government needs to emphasise efforts to minimise waste and
diversion to landfills.

26 Food Loss and Waste: Facts and Futures
aCTIOns FOr a MOre FOOD-seCUre
FUTUre
This is not rocket science, but it does take understanding, investment and commitment – from the government, the food industry, companies and individuals – to do what needs to be done. And many of the necessary actions are already known.
aCTIOns FOr a ‘WasTe nOT WanT nOT’ FUTUre It has to be assumed that nobody likes to waste and that once the causes of food loss and waste are better understood, the required actions – throughout the food supply chain – will duly follow. Although the generation of verified data is a priority, this can be an expensive and lengthy process. But it need not be an obstacle. Important mitigation actions can still be achieved by focusing on what is known, namely:
• most of the food loss and waste in South Africa occurs at the pre-consumer level in the food supply chain
• it must be assumed that this matter is already high on the policymakers’ agenda: at the 2016 World Economic Forum in Davos the Minister of Agriculture, Forestry and Fisheries, Mr Senzeni Zokwana, was announced as a Champion of target 12.3 of the UN’s Sustainable Development Goals.
Furthermore, the South African government recognises that the waste sector can – and does – provide opportunities for value recovery, job creation and economic development. The Department of Science and Technology (DST) has developed the Waste Research, Development and Innovation (RDI) Roadmap for South Africa to provide strategic direction and to co-ordinate investments for the next 10 years. The roadmap draws on deep expertise within the Council for Scientific and Industrial Research (CSIR) and is critical for future activities in the waste research, development and innovation spheres. The detail in the roadmap for food loss and waste is still in progress.
‘Waste not Want not’ actions for the government
• Leadership on food waste target: Collaboratively develop and establish an ambitious target and strategy and a roadmap for its achievement. Promote indicator and measurement tools such as the Global Food Loss Index and FLW Protocol and Standard.
• Policies and incentives: Promote targeted policies, such as food donation regulations, subsidies, grants and tax credits as well as market-based instruments, such as labelling schemes.
• Collaborate: Work across departments to ensure synergies between policies and initiatives and with the private sector and NPOs to introduce a change in behaviours throughout the value chain.
• Facilitate change: Provide a practical contribution by promoting strategic dialogue on food waste and diversion from landfill, including knowledge transfer sessions that identify innovations to reduce food waste.
• Municipal capacity: Improve local capacity to implement policies and campaigns such as educational food waste reduction campaigns.
“12.3
By 2030, halve per capita global food waste at the retail
and consumer levels and reduce food losses along
production and supply chains,
including post-harvest losses.”
12 respOnsIbLe COnsUMpTIOn anD prODUCTIOn

27Food loss and waste: Facts and futures
• Focus where it matters: Emphasise efforts to reduce food loss and waste, and not just diversion from landfills.
• Support and commission research: Invest in research to make the biggest reductions quickly and cost effectively, and to better understand South Africa’s unique situation in informal and formal food value chains, and inform targeted actions.
‘Waste not Want not’ actions for the food industry
• Adopt date label best practice: Misunderstanding date labels contributes to food waste of 700 kt per year in the UK and similar figures are seen in many other countries.59 By working together, stakeholders in the food industry can ensure labelling consistency across products and adapted to literacy levels.
• Collaborate and collate amalgamated data: Develop a fit-for-purpose template aligned with with tools such as the Food and Agriculture Organisation’s (FAO) Food Loss Assessment Methodology and the WRI’s FLW Standard. Also, adopt an agreed series of definitions relevant to food loss and waste that are clearly understood and can be reported against.
59 WRAP (2016).
The FLW sTanDarDIn South Africa, there is no collaborative effort to report on food loss or waste. To quantify the magnitude of the food loss and waste problem, the CSIR has had to draw on high-level studies from other countries, such as those produced by the UN’s Food and Agricultural Organisation (FAO), or ad hoc studies often fulfilling a one-off research need. There is clearly an urgent need for a consolidated and agreed platform and method for capturing, analysing and reporting food loss and waste in our food supply chain.
One of the most recognised approaches for quantifying food removed from the food supply chain is the global accounting and reporting standard developed by the World Resources Institute (WRI) – known as the Food Loss and Waste Accounting and Reporting Standard (FLW Standard). This protocol ensures the consistent collection and reporting of data in order to understand how much food loss and waste is generated and where in the supply chain the problem lies. This could be achieved through implementing a voluntary reporting agreement such as the FLW Standard.
‘Waste not Want not’ actions for companies
• Manage and measure: Adopt globally benchmarked policies for managing and measuring food loss and waste. Ensure that food that must be removed from the shelves but that is still edible is donated to charity.
• Engage the researchers: The South African academic sector is eager to partner with the food industry to better understand and address the food loss and waste challenge. This is a golden opportunity to gather the required scientific data through research.
• Adopt a bottom-up and life-cycle approach: The most accurate measure of food waste in terms of GHG emissions is the life-cycle approach. Developing a good understanding at company level of the way in which this method can be used is pivotal to future research on food loss and waste and the ultimate costs of climate change.
It is critical for the future to gather
sufficient, accurate and quantitative data to obtain a
full picture of food loss and waste so that appropriate
initiatives can be designed and
implemented.
Actions for a more food-scure future
• Develop a roadmap for delivering company policy: Implement systems to eliminate the gap between policy and target setting and operational delivery.
• Optimise packaging: Invest in the latest packaging innovations to increase the shelf-life of food. Innovations include using split packs for smaller portion sizes, resealable packs to keep food fresher for longer, and vacuum packing. The ‘reduce, reuse and recycle’ considerations particularly pertain to plastic packaging.
• Adapt in-store promotions: Focus on providing value for money (e.g. reduced-price offers) rather than encouraging unnecessary purchases (e.g. buy one, get one free).
• Address high appearance quality standards: Consider being more flexible and responsive about the technical and visual specifications for products and produce that are bought from producers.
• Invest in product reworking: The value of ‘out of spec’ products can be maximised by reworking them into other products, i.e. hail-damaged vegetables can be sliced and diced. Lower-value products are then downgraded to feed, fuel or fertilizer.
• Improve customer education: Customers will benefit from a greater understanding of how to avoid food waste. It is critical that this is adapted for varying levels of literacy and socio-economic levels.
‘Waste not Want not’ actions for individual consumers60
• Get curious about your food and where it came from, knowing the incredible journey it takes helps us to value our food more.
• Understand date labels. ‘Sell by’ is information for the grocer, not for you, the customer. Food past its sell-by date is generally still good to eat for a few days. When in doubt, sniff!
• Make wiser decisions when shopping for food by doing better meal planning and checking fridge stock beforehand.
• Avoid multi-pack promotions (e.g. buy one, get one free) and buy only what you will consume.
• Prepare the right quantity of food (not too much) and don’t serve more than can be eaten.
• Freeze leftover or surplus food for later use.
• Store fresh produce where it is easy to see, on eye-level shelves in the fridge or on countertops where it is likely to be seen and eaten.
• Reuse any packaging that can be used for an alternative purpose, and recycle and compost.
If food production is to keep pace with demand, it will require resolving the many absurdities, inadequacies and problematic practices in production and consumption. Identifying and resolving the drivers of food waste and shifting consumption patterns are critical levers in the transition to a just and sustainable food system. Taken together, the actions listed in this report would transform the food system, creating conscious consumers supplied by an effective and sophisticated supply chain where little or no food is wasted.
It would further be critical for
each stakeholder and individual to
understand and acknowledge that the responsibility
lies with all.
60 Notten et al., 2014; Ranganathan et al., 2016; Noleppa & Cartsburg, 2015; Bea Johnson TedTalk, 2016.
28 Food Loss and Waste: Facts and Futures

reFerenCesAllies, B. 2011. Food waste management. Presented at the Eco-health Conference,
Muldersdrift, South Africa. Available at: www.nwu.ac.za/sites/www.nwu.ac.za/files/files/v-eco_health_forum/Documentation/2011%20papers/Bonnita%20Allies-Food%20waste%20management-2nd%20Ecohealth%20Forum-24-25%20November%202011.pdf.
Ayeleru, O., Ntuli, F. & Mbohwa, C. 2016. Municipal Solid Waste Composition Deter-mination in the City of Johannesburg. Presented at the Municipal Solid Waste Composition Determination in the City of Johannesburg. Available at: www.iaeng.org/publication/WCECS2016/WCECS2016_pp625-629.pdf.
Belton, B. & Thilsted, S.H. 2014. Fisheries in transition: Food and nutrition security implications for the global South. Global Food Security, 3: 59–66.
Béné, C., Barange, M., Subasinghe, R., Pinstrup-Andersen, P., Merino, G., Hemre, G.I. & Williams, M. 2015. Feeding 9 billion by 2050 – Putting fish back on the menu. Food Security, 7: 261–274.
Champions123. 2016. Champion 12.3: A Global Challenge. Available at: champions123.org/target-12-3.
DEA. Department of Environmental Affairs. 2012. Municipal Solid Waste Tariff Strategy. Pretoria. Available at: sawic.environment.gov.za/ documents/1352.pdf.
DEA. 2013. Environment Outlook: Chapter 13: Waste management. Pretoria: Department of Environment Affairs, Forestry & Rural Affairs (DEFRA). Available at: www.environment.gov.za/sites/default/files/reports/ environmentoutlook_chapter13.pdf.
Dube, S. 2016. Barriers to Entry in the South African Supermarket Industry. CCRED Quarterly Review. Available at: www.competition.org.za/review/2016/2/19/barriers-to-entry-in-the-south-african-supermarket-industry.
EPA. n.d. Greenhouse Gas Emissions: Understanding global warming potentials. Available at: www.epa.gov/ghgemissions/understanding-global-warming- potentials.
FAO. n.d. Global Variations in Micro-nutrient Losses in the Fruit and Vegetable Supply Chain. Available at: www.fao.org/fileadmin/user_upload/food-loss- reduction/CoP_English/Vit_A___C_Loss_FAO_7-region_Poster_1st_PHL_Congress_201510.pdf.
FAO. 2009. How to Feed the World in 2050. Available at: www.fao.org/fileadmin/templates/wsfs/docs/expert_paper/How_to_Feed_the_World_in_2050.pdf.
FAO. 2011. Global food losses and food waste – Extent, causes and prevention. Rome: FAO. Available at: www.fao.org/docrep/014/mb060e/mb060e00.pdf.
FAO. 2016. The state of world fisheries and aquaculture: Contributing to food security and nutrition for all. Available at: www.fao.org/3/a-i5555e.pdf.
Fouche, D., Wilkinson, J. & Peer, S. 2012. South African retail and consumer products outlook 2012–2016 (South African edition). PricewaterhouseCoopers. Available at: www.pwc.co.za/en/assets/pdf/retail-and-consumer-products-out-look-2012-2016.pdf.
Garnett, T. 2008. Cooking up a storm: Food, greenhouse gas emissions and our changing climate. Surrey: Food Climate Research Network, Center for Environmental Strategy.
Grolleaud, M. 2002. Post-harvest losses: Discovering the full story. Overview of the phenomenon of losses during the post-harvest system. Rome: FAO, Agro Industries and Post-Harvest Management Service.
Haider, M. 2014. Waste Management in Stellenbosch: Entering a new era. Presented at the GreenCape Waste Economy Workshop. Available at: greencape.co.za/assets/Sector-files/waste/Stellenbosch-Waste-Management.pdf.
Haysom, G. 2016. Interview on 24 May with Gareth Haysom, African Centre for Cities, University of Cape Town for the Food Loss and Waste: Facts and Futures publication.
Jackson, A. & Shepherd, J. 2010. Connections between farmed and wild fish: Fishmeal and fish oil as feed ingredients in sustainable aquaculture. Advancing The Aquaculture Agenda: Workshop Proceedings. Paris: OECD. Available at: www.iffo.net/system/files/OECD%20PAPER%20Jackson%20and%20Shepherd.pdf.
Johnson, B. 2016. Two adults, two kids, zero waste. (TEDx Video). Available at: www.youtube.com/watch?v=CSUmo-40pqA.
Jones, T. 2006. Addressing food wastage in the US. Interview: The Science Show, 8 April. Available at: www.abc.net.au/rn/scienceshow/stories/2006/ 1608131.htm.
Kelleher, K. 2005. Discards in the world’s marine fisheries. An update. FAO Fisheries Technical Paper No. 470. Rome: FAO.
Lipinski, B., Hanson, C., Waite, R., Searchinger, T., Lomax, J. & Kitinoja, L. 2013. Reducing Food Loss and Waste. Working Paper, Installment 2 of Creating a Sustainable Food Future. Washington, DC: World Resources Institute. Available at: www.worldresourcesreport.org.
MacKerron, C.B. 2015. Waste and Opportunity 2015: Environmental Progress and Challenges in Food, Beverage, and Consumer Goods Packaging. Available at: www.nrdc.org/sites/default/files/consumer-goods-packaging-report.pdf.
Masojada, M. 2014. The sleeping giant – informal trade in South Africa. Supermarket & Retailer. Available at: www.supermarket.co.za/news-article.asp?ID= 6851&CatTags=1
Mollatt, M. 2014. Ecological Food Sense: Connections between food waste flows and food production in Enkanini Informal Settlement, Stellenbosch (Master’s thesis, Stellenbosch University, Stellenbosch). Available at: www.google.co.za/#q= municipality+food+waste+reduction+south+africa&start=20.
Nahman, A. & De Lange, W. 2013. Costs of food waste along the value chain: Evidence from South Africa. Waste Management, 33(11): 2493–2500. Available at: dx.doi.org/10.1016/j.wasman.2013.07.012.
Nahman, A., De Lange, W., Oelofse, S. & Godfrey, L. 2012. The costs of household food waste in South Africa. Waste Management, 32(11): 2147–2153.
Noleppa, S. & Cartsburg, M. 2015. The Great Waste from Field to Fork: Extent and environmental impacts of food waste in Germany. WWF Deutschland.
Norton, A. & Rawlinson, M. 2016. Grocery retail sector market inquiry: Non- confidential submissions made by Pick n Pay. Johannesburg: Nortons Inc. Available at: www.compcom.co.za/wp-content/uploads/2016/09/Pick-n-Pay-Submission-Non-Confidential-1.pdf.
Notten, P., Bole-Rentel, T. & Rambaran, N. 2014. Understanding the Food Energy Water Nexus: Developing an understanding of the energy implications of wasted food and waste disposal. WWF-SA, South Africa.
Oelofse, S. 2015. Composition and Value of Waste in Landfills in SA. IFAT Environmental Technology Forum Africa, 16 September 2015. Available at: researchspace.csir.co.za/dspace/bitstream/handle/10204/8725/Oelofse1_2015.pdf?sequence=1&isAllowed=y.
Oelofse, S. & Nahman, A. 2012. Estimating the Magnitude of Food Waste Generated in South Africa. Pretoria: CSIR.
Oelofse, S.H. & Nahman, A. 2013. Estimating the magnitude of food waste generated in South Africa. Waste Management & Research, 31(1): 80–86.
Parfitt, J., Barthel, M. & Macnaughton, S. 2010. Food waste within food supply chains: Quantification and potential for change to 2050. Philosophical Transactions of the Royal Society B, 365: 3065–3081.
Pereira, L.M. 2014. The Future of South Africa’s Food System: What is research telling us? Stellenbosch: Southern Africa Food Lab. Available at: bio-economy.org.za/wp-content/uploads/2015/02/Pereira-2014-The-Future-of-South-Africas-Food-System-Executive-Summary.pdf.
Petersen, L. 2016. Interview on 23 May with Lief Petersen of the Sustainable Livelihoods Foundation, for the Food Loss and Waste: Facts and Futures publication.
Porter, S.D., Reay, D.S., Higgins, P. & Bomberg, E. 2016. A half-century of produc-tion-phase greenhouse gas emissions from food loss & waste in the global food supply chain. Science of the Total Environment, 571: 721–729. Available at: www.ncbi.nlm.nih.gov/pubmed/27432722.
Pradhan, P., Reusser, D.E. & Kropp, J.P. 2013. Embodied greenhouse gas emissions in diets. PLoS ONE, 8(5): e62228.
Ramukhwatho, F., Du Plessis, R. & Oelofse, S. 2016. Household food wastage by income level: A case study of five areas in the city of Tshwane Metropolitan Municipality, Gauteng Province, South Africa. Presented at the 23rd WasteCon Conference, Emperors Palace, Johannesburg, South Africa.

30 Food Loss and Waste: Facts and Futures
Ranganathan, J. et al. 2016. Shifting Diets for a Sustainable Food Future. Working Paper, Installment 11 of Creating a Sustainable Food Future. Washington, DC: World Resources Institute. Available at: www.worldresourcesreport.org.
Robinson, B. & Jenkin, N. 2017. Realising the social and economic potential of food waste in the Western Cape Province. Submission to the Department of the Premier, Western Cape Government, to support the implementation of the ‘Nourish to Flourish’ Framework.
Sango, T., Basson, L. & Williams, Q. 2016. Towards integrated municipal waste management: Technical guide for technology identification and screening for integrated waste management planning. Presented at the 23rd WasteCon Conference, Emperors Palace, Johannesburg, South Africa. Available at: www.green-cape.co.za/assets/Waste-Sector-Desk-Content//28.-Sango-T-et-al.pdf.
Skinner, C. & Haysom, G. 2016a. Informal Food Retailers: Undervalued, ignored and abused? African Centre for Cities, University of Cape Town. Available at: www.africancentreforcities.net/wp-content/uploads/2016/10/Haysom-and-Skinner-SSAG-27-Sept-Final.pdf.
Skinner, C. & Haysom, G. 2016b. The Informal Sector’s Role in Food Security – A missing link in policy debates? African Centre for Cities, University of Cape Town. Available at: www.africancentreforcities.net/wp-content/ uploads/2016/10/Seminar-input-24-Aug-Final.pdf.
Spiker, M.L., Hizam H.A.B., Siddiqi, S.M. & Neff, R.A. 2017. Wasted Food, Wasted Nutrients: Nutrient loss from wasted food in the United States and comparison to gaps in dietary intake. Journal of the Academy of Nutrition and Dietetics, 2017, DOI: 10.1016/j.jand.2017.03.015.
Stassen, W. 2015. South Africa: A fat, hungry nation. The South African Health News Service. Available at: www.health-e.org.za/2015/04/07/south-africa-a-fat- hungry-nation.
StatsSA. Statistics South Africa Community Survey. 2016. Available at: www.statssa.gov.za/?page_id=6283.
SANHANES. The South African National Health and Nutrition Examination Survey. 2013. Available at: www.hsrc.ac.za/uploads/pageNews/72/ SANHANES-launch%20edition%20(online%20version).pdf.
Urban Earth. 2013. South African Waste Snapshot. Available at: www.urbanearth.co.za/sites/default/files/urban_earth_sa_waste_snapshot.pdf.
Western Cape Government. 2016. Nourish to Flourish: An overview of the Western Cape Government Strategic Framework for Household Food and Nutrition Security. Department of the Premier, Western Cape Government. Available at: www.westerncape.gov.za/food.
Williams, H. & Wikström, F. 2010. Environmental Impact of Packaging and Food Losses in a Life Cycle Perspective: A comparative analysis of five food items. Journal of Cleaner Production, 19: 43–48.
WRAP. The Waste and Resources Action Programme. 2016. Available at: www.wrap.org.uk.
Xin, Z., Kai, H.W. & Anqi, C. 2012. Waste not, want not. China Daily. Available at: www.chinadaily.com.cn/cndy/2012-01/19/content_14472383.htm.


32 Food Loss and Waste: Facts and Futures
WWW.WWF.OrG.zaFood Loss and Waste: Facts and Futures
za
WWF-SA is a registered Non-Profit Organisation, number 003-226 NPO. © 1986 panda symbol and ® “WWF” Registered Trademark of WWF-World Wide Fund for nature (formerly World Wildlife Fund). 1st Floor, Bridge house, Boundary Terraces, Mariendahl Lane, newlands, Cape Town, Po Box 23273, Claremont 7735, t: +27 21 657 6600, e: [email protected], www.wwf.org.za
snIFF Understand date labels, often
food past its sell-by date is still good to eat for a few days
When IT COMes TO WasTe, nO aCTIOn Is WasTeD
aVOIDMulti-pack promotions if you won’t be able to eat it all
appreCIaTeGet curious about where your food came from
praCTIseReducing, reusing, recycling and compostingsTOre
Freeze leftover or surplus food and store fresh produce where it is easy to see
COOkPrepare meals from local, seasonal and fresh foods, in company whenever possible, and get creative with leftovers