yue yuen industrial 2018 1q results · disclaimer yue yuen and pou sheng have taken every...
TRANSCRIPT

Yue Yuen Industrial 2018 1Q Results
14 May 2018

Disclaimer
Yue Yuen and Pou Sheng have taken every reasonable care in preparing this presentation. However, please be
reminded that the information, materials, opinions and statements contained or referred to in this presentation are all
provided on an "as is" basis. None of the aforesaid information, materials, opinions and statements constitutes or will
be viewed as investment advice or an offer, or a solicitation, recommendation or suggestion by Yue Yuen or Pou Sheng
to deal in any investment products including securities, or other financial products and instruments.
If there is any forward-looking statements contained or referred to in this presentation, these forward-looking
statements are based on current expectations and assumptions, of which many are beyond our control. In addition,
these statements are subject to a number of risks, uncertainties and factors and if any of these risks or uncertainties
materialize, or if underlying expectations not occur or assumptions prove incorrect, actual results, performance or
achievements of Yue Yuen and/or Pou Sheng may vary materially from those described explicitly or implicitly in the
relevant forward-looking statement. Neither Yue Yuen nor Pou Sheng intends or assumes any obligation, to update or
revise these forward-looking statements in light of any difference from those anticipated.
Yue Yuen and Pou Sheng including their respective subsidiaries, associated or affiliated companies, or any of their
respective directors, employees, agents, representatives or associates accepts no liability for and shall not be
responsible or liable for any loss or damage of whatever kind or nature, directly or indirectly, arising from action taken,
or not taken, in reliance on, or resulting from access to or use of the aforesaid information, materials, opinions and
statements (including forward-looking statements, if any) contained or referred to in the presentation.
2
Vietnam Indonesia PRC Others*
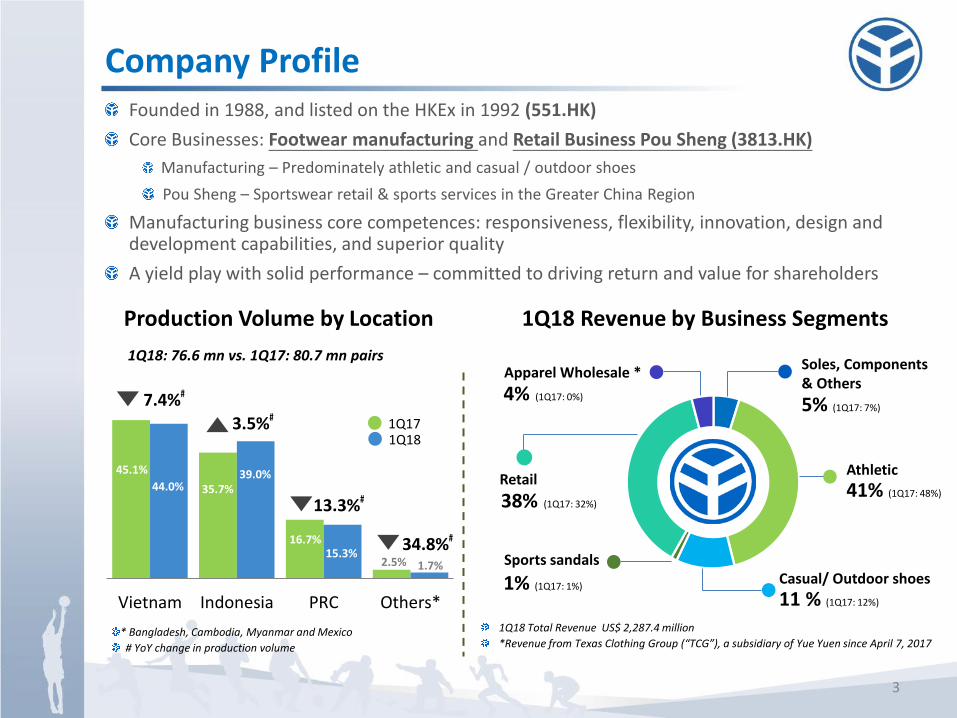
Company Profile Founded in 1988, and listed on the HKEx in 1992 (551.HK)
Core Businesses: Footwear manufacturing and Retail Business Pou Sheng (3813.HK)
Manufacturing – Predominately athletic and casual / outdoor shoes
Pou Sheng – Sportswear retail & sports services in the Greater China Region
Manufacturing business core competences: responsiveness, flexibility, innovation, design and development capabilities, and superior quality
A yield play with solid performance – committed to driving return and value for shareholders
1Q18 Revenue by Business Segments Production Volume by Location
1Q17 1Q18
45.1%
7.4%
3.5%
* Bangladesh, Cambodia, Myanmar and Mexico
# YoY change in production volume
1Q18: 76.6 mn vs. 1Q17: 80.7 mn pairs
1Q18 Total Revenue US$ 2,287.4 million
*Revenue from Texas Clothing Group (“TCG”), a subsidiary of Yue Yuen since April 7, 2017
34.8%
13.3%
44.0% 35.7% 39.0%
16.7% 15.3%
2.5% 1.7%
5% (1Q17: 7%)
Casual/ Outdoor shoes
Soles, Components & Others
Athletic
Sports sandals
38% (1Q17: 32%)
11 % (1Q17: 12%)
1% (1Q17: 1%)
41% (1Q17: 48%) Retail
3
4% (1Q17: 0%)
Apparel Wholesale *
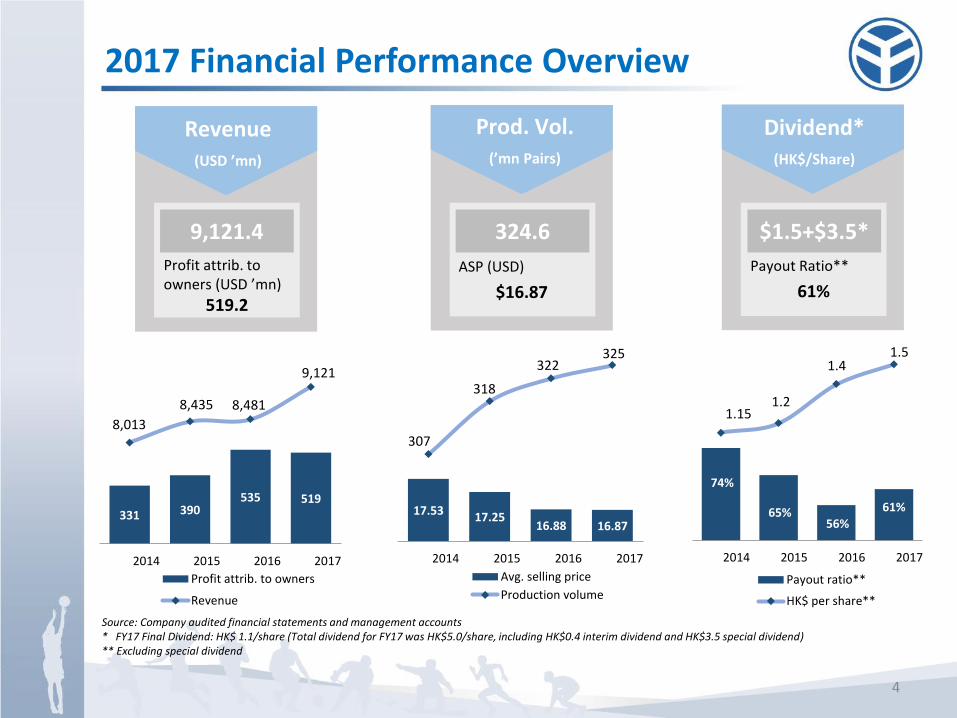
Source: Company audited financial statements and management accounts * FY17 Final Dividend: HK$ 1.1/share (Total dividend for FY17 was HK$5.0/share, including HK$0.4 interim dividend and HK$3.5 special dividend) ** Excluding special dividend
Revenue (USD ’mn)
Profit attrib. to owners (USD ’mn)
519.2
9,121.4
74%
65% 56%
61%
1.15 1.2
1.4 1.5
2014 2015 2016 2017
Payout ratio**
HK$ per share**
Dividend* (HK$/Share)
Payout Ratio**
61%
$1.5+$3.5*
Prod. Vol. (’mn Pairs)
ASP (USD)
$16.87
324.6
17.53 17.25 16.88 16.87
307
318
322 325
2014 2015 2016 2017
Avg. selling price
Production volume
331 390 535 519
8,013
8,435 8,481
9,121
2014 2015 2016 2017
Profit attrib. to owners
Revenue
2017 Financial Performance Overview
4

Our Growth Strategy
Speed
Sustainability
Flexibility
Innovation
Quality
Design
OEM / ODM
Material
Process
Equipment
Apparel
Accessories
Footwear
Retail
Values
5
Directions
4
Segments
3
End to End Platform
2
World’s Leading Sporting Goods
MFG Platform
1
Vertical Integration
Horizontal Integration
5
1Q 2018
Financial Highlights

Revenue
RMB 5.5 bn + 17.7%
OP Margin
4.6% RMB 252.2 mn
+ 19.3%
Pou Sheng
Revenue
US$ 2,287.4 mn + 8.9%
GP Margin
20.1% US$ 287.4 mn
- 3.9%
Production Volume
76.6 mn pairs
ASP
US$ 15.75
Profit Attrib. to Owners
US$ 95.4 mn - 23.3%
Group
Group excl. PS* * Group excl. PS used in this presentation, unless otherwise specified, includes manufacturing business and TCG
Operating Profit
US$ 125.5 mn - 3.1%
Key Financial Highlights for 1Q 2018
7

996.1
261.4 29.8
676.4
-
137.1
938.0
241.4 27.0
858.5
99.5 123.0
Athletic Casual/Outdoor
SportsSandals
Retail ApparelWholesale*
Others**
1Q17 1Q18
26.9%
10.3%
N/A
5.8%
(US$’ mn) 1Q18 Shoe Production Revenue by Product Categories
Casual/Outdoor
Sports sandals
Athletic
78%
20%
2%
7.7%
9.4%
Shoe Production
Rev: US$ 1,206.4 mn
Volume 5.1%
ASP 1.3% * TCG (since April 7, 2017)
** Soles, Components & Others
Y-o-Y Revenue by Product Category
8

Production Volume by Location for 1Q18
9
1Q FY18 Production Volume: 76.6 mn pairs
China
Indonesia Vietnam
39%
44%
15%

Operation Efficiency Indicator
2014 2015 2016 2017
307.1
317.5 322.0
324.6
386.1K
386.0K
326.4K
330.5K
315,000
355,000
395,000
435,000
2014 2015 2016 2017
280
290
300
310
320
330
Production Volume 'mn
MFG Employees
PPH Index
Productivity – Pairs of shoes produced vs MFG employees from 2014 to 2017
PPH Index – Pairs per person per hour from 2014 (index from 100) to 2017
100 105.4 113.5 123.0
10

Revenue
In US$’mn
Profit Attrib. to Owners
In US$’mn
Pou Sheng
Group excl. PS
The above figures of Pou Sheng exclude profit attributable to “Non-YY” shareholders (i.e. the 37.6% minority interests)
Pou Sheng
Group excl. PS
13.75
81.69
9.36
115.13
-23.3%
1Q17 1Q18
676.42
1,424.39
+8.9%
1Q17 1Q18
858.52
1,428.87
+26.9%
+0.3%
+46.9%
-29.0%
Revenue & Profit Attributable to Owners
11

Source: Company accounts Please refer to the announcement on the HKEx website for the unaudited consolidated income statements of 1Q2018 & 1Q2017
YY Group Financial Highlights
1Q 2018 1Q 2017 Y-o-Y
US$'000 % US$'000 % + / -
Revenue 2,287,391 100.00 2,100,810 100.00 8.88%
Cost of Sales (1,710,035) -74.76 (1,574,793) -74.96 8.59%
Gross Profit 577,356 25.24 526,017 25.04 9.76%
SG&A (432,288) -18.90 (364,735) -17.36 18.52%
Other Income & Expenses, net (19,542) -0.85 (31,791) -1.51 -38.53%
Operating Profit 125,526 5.49 129,491 6.16 -3.06%
Share of Results of A&JV 15,300 0.67 14,242 0.68 7.43%
Finance Cost & Other Gains/(Losses) (11,686) -0.51 11,488 0.55 N/A
Income Tax (23,853) -1.04 (22,764) -1.08 4.78%
Profit for the Period 105,287 4.60 132,457 6.31 -20.51%
Profit attrib. to Owners 95,441 4.17 124,491 5.93 -23.34%
12

(US$’mn) 1Q 2018 1Q 2017
Depreciation & Amortization 83.7 71.5
EBITDA 206.4 198.8
Capital Expenditure 156.5 117.6
Product Development 50.4 52.8
31 March 2018 31 March 2017
Total Borrowings 2,023.1 1,016.6
Net Borrowings 1,070.2 Net Cash: 163.2
Total Debt to Equity (%) 42.0% 19.4%
Net Debt to Equity (%) 22.2% N / A
1Q 2018 1Q 2017
Total Debt to EBITDA (X) annualized 2.5X 1.3X
Net Debt to EBITDA (X) annualized 1.3X N/A
Return on Owner’s Equity (%) annualized 8.7% 10.2%
Return on Asset (%) annualized 5.0% 6.7%
Source: Company accounts (figures rounded) Please refer to the announcement on the HKEx website for the unaudited consolidated income statements of 1Q2018 & 1Q2017
Financial Ratios
13

YY Group ROE Trend
8.0
7.5
9.9
8.7
9.4
11.3 11.3
12.1
6M14 FY14 6M15 FY15 6M16 FY16 6M17 FY17
ROE
(%)
Remark: ROE=Profit attributable to owners of the company/ (Total Equity - Minority Interests); half year data is on LTM basis
14

Group excl. PS Note: The figures in the following slides covers the core manufacturing and other operations of the consolidated entity of Yue Yuen Group, and
are for analytical purposes only (prepared using the management accounts)

Group excl. PS Financial Highlights
1Q 2018 1Q 2018 – MFG only 1Q 2017 Y-o-Y –
MFG only
US$'000 % US$'000 % US$'000 % + / -
Revenue 1,428,873 100.00 1,329,396 100.00 1,424,390 100.00 -6.67%
Cost of Sales (1,141,489) -79.89 (1,081,441) -81.35 (1,125,405) -79.01 -3.91%
Gross Profit 287,384 20.11 247,955 18.65 298,985 20.99 -17.07%
SG&A (168,085) -11.76 (138,919) -10.45 (159,075) -11.17 -12.67%
Other Income & Expenses, net (33,449) -2.34 (33,238) -2.50 (41,214) -2.89 -19.35%
Operating Profit 85,850 6.01 75,798 5.70 98,696 6.93 -23.20%
Share of Results of A&JV 15,634 1.09 15,634 1.18 15,119 1.06 3.41%
Finance Cost & Other Gains/(Losses) (6,293) -0.44 (5,430) -0.41 15,074 1.06 N/A
Income Tax (12,430) -0.87 (9,006) -0.68 (12,114) -0.85 -25.66%
Profit for the Period 82,761 5.79 76,996 5.79 116,775 8.20 -34.06%
Profit Attrib. to Owners 81,699 5.72 75,934 5.71 115,129 8.08 -34.04%
Source: Company management accounts
16

Group excl. PS Financial Ratios
(US$’mn) 1Q 2018 1Q 2018– MFG only 1Q 2017
Depreciation & Amortization 64.3 62.7 58.6
EBITDA 147.6 136.0 155.3
Capital Expenditure 144.3 142.3 102.6
31 March 2018 31 March 2018– MFG only 31 March 2017
Total Borrowings 1,550.7 1,452.5 813.9
Net Borrowings 631.8 536.9 Net Cash: 342.4
Total Debt to Equity (%) 38.3% 36.6% 17.6%
Net Debt to Equity (%) 15.6% 13.5% N / A
1Q 2018 1Q 2018– MFG only 1Q 2017
Total Debt to EBITDA (X) annualized 2.6 X 2.7 X 1.3 X
Net Debt to EBITDA (X) annualized 1.1 X 1.0 X N / A
Return on Owner’s Equity (%) annualized 8.1% 7.7% 10.0%
Return on Asset (%) annualized 4.9% 4.8% 7.1%
Source: Company management accounts (figures rounded)
17

18.7
19.1
18.9
21.9
19.8
20.5 20.5
22.8
21.0
21.6 21.6
22.7
20.1
1Q15 2Q15 3Q15 4Q15 1Q16 2Q16 3Q16 4Q16 1Q17 2Q17 3Q17 4Q17 1Q18
Gross Profit Margin
Group excl. PS GP Margin Trend
(%)
GP Margin % - MFG only
2Q17 3Q17 4Q17 1Q18
20.7 20.4 21.8 18.7
18

Group excl. PS OP Margin Trend
(%)
5.3
6.1
3.7
6.8
5.9
7.5
6.7
9.8
6.9
7.1
8.0
8.4
6.0
1Q15 2Q15 3Q15 4Q15 1Q16 2Q16 3Q16 4Q16 1Q17 2Q17 3Q17 4Q17 1Q18
Operating Profit Margin
OP Margin % - MFG only
2Q17 3Q17 4Q17 1Q18
7.2 7.8 8.6 5.7
19

Pou Sheng International Note: The figures in the following slides are based on Pou Sheng’s
management accounts and announcements, and Pou Sheng adopts RMB as its reporting currency

Pou Sheng Key Business Activities
Retail Business
Leading distributor of footwear, apparel & accessories for international brands in China
A key partner to Nike and adidas
Sells through directly operated stores, or on a wholesale basis to sub-distributors, online & offline
Store locations include department stores, shopping malls, sports cities, street level & outlets
Brand licensee Business
Sport Services Platform
Provides full range of sports services
Products + Services
364 + 1
Online & Offline
Mainland China & Taiwan
21

Directly Operated Stores
Sub-Distributor Stores Mono Brand Stores
Multi-Brand Stores
YY Sports Outlets: New shopping experience for fast growing
brands
Omni-Channel Strategy Across China
Brick and Mortar Stores
Online Stores
Retail Network
YYsports.com
Rockport.com.cn
3rd party: T-Mall, JD Mall..etc. B2B services
Covers 300 cities in the Greater China
B2B
B2C
22

Distinguished Partners and Events
23

Pou Sheng Financial Highlights (in RMB)
1Q 2018 1Q 2017 Y-o-Y
RMB’mn % RMB’mn % + / -
Revenue 5,503 100.00 4,674 100.00 17.74%
Cost of Sales (3,644) -66.22 (3,105) -66.43 17.36%
Gross Profit 1,859 33.78 1,569 33.57 18.48%
SG&A (1,699) -30.87 (1,427) -30.53 19.06%
Other Income & Expenses, net 92 1.67 69 1.48 33.33%
Operating Profit 252 4.58 211 4.51 19.43%
Share of Results of A&JV (2) -0.04 (6) -0.13 -66.67%
Finance Cost & Other Gains/(Losses) (33) -0.60 (23) -0.49 43.48%
Income Tax (73) -1.33 (74) -1.58 -1.35%
Profit for the Period 144 2.62 108 2.31 33.33%
Profit Attrib. to Owners 141 2.56 104 2.23 35.58%
Source: Based on Pou Sheng’s announcement on the HKEx website for the unaudited consolidated income statements of 1Q18 & 1Q17
24
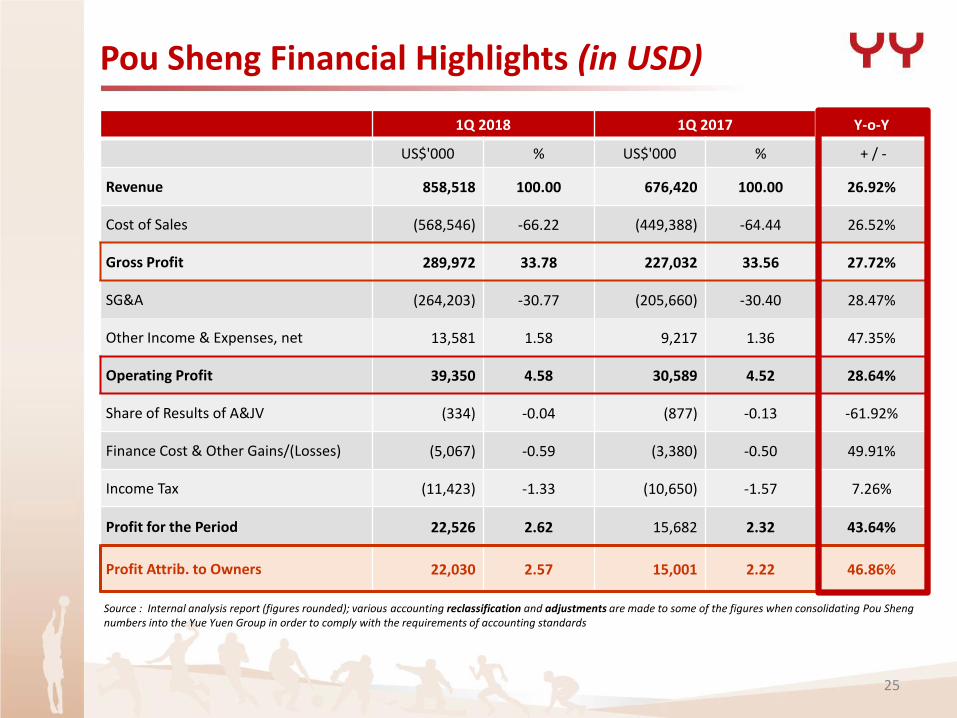
Pou Sheng Financial Highlights (in USD)
1Q 2018 1Q 2017 Y-o-Y
US$'000 % US$'000 % + / -
Revenue 858,518 100.00 676,420 100.00 26.92%
Cost of Sales (568,546) -66.22 (449,388) -64.44 26.52%
Gross Profit 289,972 33.78 227,032 33.56 27.72%
SG&A (264,203) -30.77 (205,660) -30.40 28.47%
Other Income & Expenses, net 13,581 1.58 9,217 1.36 47.35%
Operating Profit 39,350 4.58 30,589 4.52 28.64%
Share of Results of A&JV (334) -0.04 (877) -0.13 -61.92%
Finance Cost & Other Gains/(Losses) (5,067) -0.59 (3,380) -0.50 49.91%
Income Tax (11,423) -1.33 (10,650) -1.57 7.26%
Profit for the Period 22,526 2.62 15,682 2.32 43.64%
Profit Attrib. to Owners 22,030 2.57 15,001 2.22 46.86%
Source : Internal analysis report (figures rounded); various accounting reclassification and adjustments are made to some of the figures when consolidating Pou Sheng numbers into the Yue Yuen Group in order to comply with the requirements of accounting standards
25

30.9
33.4
33.2
35.8
34.9
36.3
36.2
34.8
33.6
35.6
34.5
36.3
33.8
1Q15 2Q15 3Q15 4Q15 1Q16 2Q16 3Q16 4Q16 1Q17 2Q17 3Q17 4Q17 1Q18
Gross Profit Margin
Pou Sheng GP Margin Trend
(%)
26

3.5
5.8
4.3
2.9
6.6 7.2
5.5
3.5
4.5
6.1
2.9 2.8
4.6
1Q15 2Q15 3Q15 4Q15* 1Q16* 2Q16* 3Q16* 4Q16 1Q17 2Q17 3Q17 4Q17 1Q18
Operating Profit Margin
Pou Sheng OP Margin Trend
(%)
* the figures have been restated due to the application of merger accounting
27

Pou Sheng Financial Ratios (in RMB)
(RMB’mn) 1Q 2018 1Q 2017
Depreciation & Amortization 124.5 88.7
EBITDA 376.6 295.1
Capital Expenditure 78.8 103.7
31 March 2018 31 March 2017
Total Borrowings 3,011.0 1,826.3
Net Total Borrowings 2,755.7 1,583.0
Total Debt to Equity (%) 45.7% 29.3%
Net Debt to Equity (%) 41.8% 25.4%
1Q 2018 1Q 2017
Total Debt to EBITDA (X) annualized 2.0 X 1.5 X
Net Debt to EBITDA (X) annualized 1.8 X 1.3 X
Return on Owner’s Equity (%) annualized 8.6% 6.7%
Return on Asset (%) annualized 4.7% 4.0%
Source: Internal analysis report (figures rounded)
28

Operation Efficiency
28
149
2017 1Q18
16
146
Receivable Days
Inventory Days
Payable Days
Based on RMB
29
19
29

Pou Sheng Store Performance
Number of Stores
Directly Operated Sub-Distributors Total Stores
As at December 31, 2017 5,465 3,313 8,778
Net New Store + / (-) * 52 6 58
As at March 31, 2018 5,517 3,319 8,836
2018 1Q 2Q 3Q 4Q
Directly Operated Stores 10.1%
Same Store Sales Growth (SSSg)
30

Appendix

Shareholding Structure
Tsai Family
Pou Chen (9904.TT)
Public Float
Manufacturing & Others
Pou Sheng (3813.HK)
Yue Yuen Industrial (Holdings) Ltd. (551.HK)
62.4%
7% 42.8%
50.2%
* As at May 14, 2018
32
100%

Company Milestones Sales channels reached 8,778
Started first overseas production in South China
Established production bases in Vietnam & Huangjiang, China
Established production bases in Mexico
Established production bases in eastern and inland China
Began operations at the new headquarters in Taichung, Taiwan
Established production bases in Bangladesh & Cambodia
Established production bases in Myanmar
1988
1992
1994
1998
2001
2002
2006
2008
2009
2014
2015
Expanded into retail business in China
Brand licensee for Hush Puppies in Taiwan
Pou Sheng International listed on HKEX (3813.hk)
Brand licensee for Pony in Taiwan & China
Yue Yuen
Pou Sheng
2012 New CEO on board
Yue Yuen Industrial listed on HKEX (551.hk)
Yue Yuen Industrial founded
2017 Revenue and DPS reached historical high of US$9.1bn and HK$5.0 per share (including special dividend: HK$3.5)
33

Group excl. PS Financial Highlights
FY2017 FY2017 – MFG only FY2016* Y-o-Y –
MFG only
US$'000 % US$'000 % US$'000 % + / -
Revenue 6,346,026 100.00 6,092,328 100.00 6,036,828 100.00 0.92%
Cost of Sales (4,966,554) -78.26 (4,814,517) -79.03 (4,772,468) -79.06 0.88%
Gross Profit 1,379,472 21.74 1,277,811 20.97 1,264,360 20.94 1.06%
SG&A (735,595) -11.59 (652,819) -10.72 (658,855) -10.91 -0.92%
Other Income & Expenses, net (159,578) -2.52 (157,951) -2.59 (149,193) -2.47 5.87%
Operating Profit 484,299 7.63 467,041 7.67 456,312 7.56 2.35%
Share of Results of A&JV 65,112 1.03 65,112 1.07 68,639 1.14 -5.14%
Finance Cost & Other Gains/(Losses) (10,963) -0.17 (7,786) -0.13 (2,026) -0.03 284.30%
Income Tax (50,277) -0.79 (52,158) -0.86 (36,621) -0.61 42.43%
Profit for the Period 488,171 7.69 472,209 7.75 486,304 8.06 -2.90%
Profit Attrib. to Owners 482,959 7.61 466,997 7.67 479,839 7.95 -2.68%
Source: Company management accounts
* The figure has been adjusted due to reclassification of selling and distribution expenses and other expenses in the consolidated income statement
34

Pou Sheng Financial Highlights (in RMB)
FY2017 FY2016 Y-o-Y
RMB’mn % RMB’mn % + / -
Revenue 18,833 100.00 16,236 100.00 16.00%
Cost of Sales (12,239) -64.99 (10,468) -64.47 16.92%
Gross Profit 6,594 35.01 5,768 35.53 14.32%
SG&A (6,052) -32.14 (5,072) -31.24 19.32%
Other Income & Expenses, net 228 1.21 228 1.40 -0.00%
Operating Profit 770 4.09 924 5.69 -16.67%
Share of Results of A&JV (4) -0.02 (12) -0.07 -66.67%
Finance Cost & Other Gains/(Losses) (109) -0.58 (80) -0.49 36.25%
Income Tax (242) -1.28 (262) -1.61 -7.63%
Profit for the Period 415 2.20 570 3.51 -27.19%
Profit Attrib. to Owners 394 2.09 561 3.46 -29.77%
Source: Based on Pou Sheng’s announcement on the HKEx website for the unaudited consolidated income statements of FY17 & FY16
35

Pou Sheng Financial Highlights (in USD)
FY2017 FY2016 Y-o-Y
US$'000 % US$'000 % + / -
Revenue 2,775,400 100.00 2,443,730 100.00 13.57%
Cost of Sales (1,803,726) -64.99 (1,575,525) -64.47 14.48%
Gross Profit 971,674 35.01 868,205 35.53 11.92%
SG&A (886,324) -31.94 (756,975) -30.98 17.09%
Other Income & Expenses, net 28,163 1.02 31,860 1.30 -11.60%
Operating Profit 113,513 4.09 143,090 5.86 -20.67%
Share of Results of A&JV (526) -0.02 (1,793) -0.07 -70.66%
Finance Cost & Other Gains/(Losses) (16,135) -0.58 (12,066) -0.50 33.72%
Income Tax (35,690) -1.29 (39,468) -1.62 -9.57%
Profit for the Period 61,162 2.20 89,763 3.67 -31.86%
Profit Attrib. to Owners 58,110 2.09 88,403 3.62 -34.27%
Source : Internal analysis report (figures rounded); various accounting reclassification and adjustments are made to some of the figures when consolidating Pou Sheng numbers into the Yue Yuen Group in order to comply with the requirements of accounting standards
36

Thank you
Q&A