youth re-entry into out-of-home placement · youth re-entry into out-of-home placement ... 2.2...
TRANSCRIPT

Policy Research Shop
YOUTH RE-ENTRY INTO OUT-OF-HOME PLACEMENT
Determinants of Repeated Placements in New Hampshire
Presented to the New Hampshire Department of Health and Human Services, Division for Children Youth and Families
PRS Policy Brief 1314-09 August 28, 2014
Prepared By:
Sakina Abu Boakye
Chelsea Lim Sarah Ogren
This report was written by undergraduate students at Dartmouth College under the direction of professors in the Rockefeller Center. The Policy Research Shop is supported by a grant from the Fund for the
Improvement of Postsecondary Education (FIPSE). The PRS reports were developed under FIPSE grant P116B100070 from the U.S. Department of Education. However, the contents of the PRS reports do not
necessarily represent the policy of the U.S. Department of Education, and you should not assume endorsement by the Federal Government.
Contact: Nelson A. Rockefeller Center, 6082 Rockefeller Hall, Dartmouth College, Hanover, NH 03755
http://rockefeller.dartmouth.edu/shop/ • Email: [email protected]

TABLE OF CONTENTS
EXECUTIVE SUMMARY 11. INTRODUCTION 12. DEFINITION OF TERMS 2
2.1 CHILDREN AND YOUTH 22.2 JUVENILE DELINQUENT 22.3 REENTRY 22.4 SPELL 22.5 ABUSED CHILD/YOUTH 22.6 NEGLECTED CHILD/YOUTH 22.7 ABANDONMENT 3
3. CPS PLACEMENT CATEGORIES 33.1 CONGREGATE CARE 33.2 FOSTER HOME 33.3 KINSHIP CARE 33.4 MEDICAL TREATMENT 43.5 RUNAWAY 43.6 SECURE DETENTION 43.7 SECURE TREATMENT 43.8 SHELTER CARE 53.9 OTHER AND UNKNOWN 5
4. DATA ANALYSIS 54.1 DATA OVERVIEW 5 4.2 RE-ENTRY INTO OUT-OF-HOME PLACEMENT 6
4.2.1 RE-ENTRY BY COHORT YEAR 4.2.2 RE-ENTRY BY COUNTY 4.2.3 RE-ENTRY BY ETHNICITY 4.2.4 RE-ENTRY BY PLACEMENT TYPE AND YEAR 4.2.5 RE-ENTRY BY INITIAL PLACEMENT TYPE 4.2.6 RE-ENTRY BY GENDER
4.3 MULTIVARIATE ANALYSIS 11 4.4 SIMILARITIES AND DIFFERENCES ACROSS METHODS 15
5. CONCLUSION 166. APPENDIX 177. REFERENCES 19

1
EXECUTIVE SUMMARY When a child or youth enters out-of-home placement, one of the primary goals of the New Hampshire Division for Children Youth and Families (DCYF) in the Department of Health and Human Services (NH DHHS) is to maintain a stable environment. With more stable living situations, fewer youth re-enter into child protective and juvenile justice placements. DCYF maintains data on all youth in out-of-home care in New Hampshire, which can be analyzed in support of the goal of formulating strategies to reduce re-entry. This report provides background on DCYF programs and examines data on all youth placed in out-of-home care in New Hampshire between 2003 and 2012. Descriptive and multivariate analyses are used to identify determinants of re-entry. The results highlight several factors associated with higher and lower likelihoods of re-entry, including county of residence, age, and, under some conditions, ethnicity. 1. INTRODUCTION Under the New Hampshire Department of Health and Human Services, the DCYF works to assist families by protecting children through a range of developmental, permanency and community programs.1 DCYF offers a range of services that primarily fall broadly under the categories of child protection and juvenile justice services. DCYF oversees placements for both youth in the Juvenile Justice System (JJS) and youth under the care of Child Protection Services (CPS).2 Since the guidelines for CPS and JJS placements differ, the report’s analysis examines CPS and JJS separately. Specifically, the Juvenile Justice Services (JJS) is "responsible for providing supervision and rehabilitative services to youth adjudicated under state law as a delinquent or as a Children In Need of Services (CHINS)."3 JJS aims to provide case management and other rehabilitative services to youths and mainly focuses on Community Programs, Probation and Parole, and Institutional Services.4 Placement into a JJS program involves a pre and post-hearing process, through which a youth may be court-ordered into either an institutional or community-based program. Placement offered by CPS is designed to prevent harm to children who have suffered, or are in danger of suffering, from physical or mental injury, sexual abuse, exploitation, or neglect by a person that is responsible for the child’s welfare.5 There are two steps that precede placement being offered to a child in need: first, the Division of Children, Youth and Families (DCYF) receives reports of child abuse or neglect through the Central Intake. Second, District Office Child Protection staff assesses the claims of the reports of child abuse and neglect. In the event that sufficient evidence is confirmed, the District Office Child Protection offers home or community based services or placement .6 The report proceeds in four stages. First, the report describes the key terms and placement types. The second stage uses data on all CPS and JJS placements from 2003 to 2012 to describe the distribution placements by youth age, year, county of residence, and

2
ethnicity. In the third stage of the report, we examine re-entry rates for each of these demographic, geographic, and placement categories. Finally, we conduct a logistic regression analysis of re-entry rates to determine the unique contribution of each factor. In order to make the report’s quantitative analysis meaningful, it is important to define the terms related to CPS and JJS placements. 2. DEFINITION OF TERMS Since states have varying laws and programs pertaining to children and youth out-of-home care, this section defines terms as used within the context of New Hampshire law and DCYF programs. 2.1 Children and Youth Children are any individuals under the age of 17, as described by New Hampshire law.7 2.2 Juvenile Delinquent Juvenile delinquent is any individual under the age of 17 who commits an offense that if committed by an adult would be the equivalent of a felony or misdemeanor crime.8 2.3 Re-Entry Re-entry refers to re-admittance of a youth who was first placed in out-of-home care through a DCYF program and later placed into either the same or different DCYF placement. 2.4 Spell Spell refers to the period of time in which a youth is enrolled in a CPS or JJS placement. In the event that a youth has “reentered”, the youth will have completed one spell, and once placed into another or the same placement, the child will begin his/her subsequent spell. 2.5 Child or Youth Abuse Abuse includes sexual abuse, intentional physical injury, or any physical injury by other than accidental means.9 2.6 Child or Youth Neglect Neglect occurs when a child does not have proper parental care or control, subsistence, or education as required by law, or other care/control necessary for his or her physical, mental, or emotional health.10

3
2.7 Abandonment Abandonment is a situation in which an individual has been left by his or her parent, guardian, or custodian without provision for his or her care, supervision, or financial support, although his parent, guardian, or custodian is financially able to provide such support.11 2.8 Cohort Year Cohort year refers to the year that the youth entered his or her first placement. 3. PLACEMENT CATEGORIES Out-of-home child protective and juvenile justice services placement decisions are intended to consider the strengths and specific needs of a child, the skills of available caretakers and facilities, and the child’s prospects of permanency with family placements.12 DCYF aims to provide stability by minimizing the number of placements a child must undergo through his or her lifetime. 3.1 Congregate Care Congregate care provides services for eligible children and youths who receive residency, meals, skilled nursing and rehabilitative care, medical services, and protective supervision. Congregate care programs are an alternative to institutionalization. Such programs work with children in need of a structured environment, and provide therapeutic, educational, and medical help. Examples include community-based group homes for youth, and residential campus facilities for children/youths with mental or behavioral problems. 3.2 Foster Home After investigating allegations of child abuse or neglect, substance abuse, or mental illness, if DCYF determines that a child is in imminent danger or likely to suffer harm, or their safety is at risk, DCYF may file a petition to the court. The child may be removed from his or her family and placed into foster care, where the child may still participate in community-related activities and attend public schooling. 13 Foster care is also available for delinquent youths. 3.3 Kinship Care Kinship care involves a relative assuming the full-time care of a child that has been removed from his or her birth parents. This placement enables a child to maintain connections with his or her family, and is separated into two categories: formal and informal. Informal kinship care refers to a situation in which a family decides to place the
4
child under the care of a relative. While DCYF assists in creating sustainable living arrangement for the child, DCYF does not assume legal custody or responsibility for the child. Formal kinship care refers to a situation in which the court, and not the family, decides to place a child under the care of his or her relatives. The child is placed in the legal custody of DCYF, and kinship caregivers may access Social Security funds and Temporary Assistance for Needy Families (TANF) funds. Kinship caregivers may become licensed foster homes and receive payments through DCYF. 3.4 Medical Treatment Medical placements are provided by DCYF and covered by NH Medicaid. In circumstances of child abuse or neglect, a medical professional will assess and document the nature or extent of injuries. Medical placement services include inpatient psychology, nursing homes, or rehabilitative services. Other services include physician, nursing facilities, psychotherapy, and personal care. 3.5 Runaway Runaway placement represents a situation in which a youth has escaped control or proper confinement of DCYF. 3.6 Secure Detention Placement into secure detention is determined through a pre- and post-hearing process by the court. A youth may be entered into the Youth Detention Services Unit (YDSU), a secure detention facility.
YDSU is a co-educational, secure detention center for youth up to 17 years of age, who are awaiting the court's decision.14 Typically, a youth’s stay ranges from 7-21 days. YDSU offers not only accredited education programs similar to those offered in SYSC, but also psycho-educational group and crisis counseling. Once a decision is made on the youth’s court case, the youth is either placed in SYSC for secure treatment or placed in a community setting that is less restrictive.15 3.7 Secure Treatment
Placement into secure treatment is also determined through a pre and post-hearing process by the court, after which a child may be entered into the Sununu Youth Services Center (SYSC), a secure treatment program. SYSC is a treatment facility for delinquent youths between the ages of 13 to 17.16
5
After being admitted into SYSC, the youths who have been committed to Secure Treatment are assigned to specific residential units and behavioral programs. Completion of a behavioral program serves as a first step to transition back into the community. The New Hampshire Juvenile Parole Board facilitates this transition. The youths participate in an accredited education program throughout the year, and may work towards a high school diploma, vocational education experience, or college preparation. It is expected that, before completing the program, the “youth will restore any harm caused to others in the commission of the delinquent acts.”17 3.8 Shelter Care Shelter care is a placement in which temporary care is given to a child who requires additional supervision. Children who are given shelter care include: JJS-involved youths whose parents are unable to give the child necessary supervision; juveniles who may refuse to return home; children whose parents refuse to provide supervision; or children whose parents cannot be located within a reasonable time.18 3.9 Other and Unknown In the event that a youth is in a placement that is not listed within the data dictionary, the child’s spell is reported as “Other.” In the event that the placement category of the youth is unknown, the child’s spell is recorded as “Unknown.” 4. DATA ANALYSIS 4.1 Data Overview The data for this report are from the Chapin Hall Center for Children’s longitudinal files, obtained from the NH DCYF. The data describe 33,096 spells from 1988 to March 31, 2013. In order to highlight only recent determinants of re-entry, the report examines spells from 2003 to 2012. This subset includes 12,345 spells, describing 7,949 youth. CPS and JJS spells are analyzed separately. All cases were de-identified by the NH DCYF to protect children’s identities. The data include information on a wide range of geographic, demographic, and placement characteristics for each youth placement spell. Geographic characteristics include the county and urban designation of the child’s spell. The demographic characteristics include gender, ethnicity, age at initial placement, and exit age for each youth spell. The type of placement (e.g., foster home, congregate care), number of placements in each spell, CPS or JJS program designation, and spell duration are also included. Most importantly for this report’s analysis, the data include an indicator of whether or not the youth experienced any subsequent spells until March 2013 (re-entry into placement). Children with an unknown date of birth, or individuals older than 21 years of age, are excluded from the data. If a child returns back to his/her prior placement

6
within a 6-month period of a trial home visit, a court-ordered placement to the care of a parent or guardian, it is not considered a re-entry. While trial home visits occur in practice, they are not reflected in the data set. Based on the duration, certain youths that run away and are later placed into the same placement from which they ran away are not considered to have re-entered. Table 1 summarizes the ages of children and youth when initially entering into DCYF placements from 2003 to 2012. Youth with CPS placements are significantly younger on average than youth with JJS placements. Approximately two-thirds of those with CPS placements are below age 10, while the majority of youth with JJS placements are 15 and older. It is important to note that there are different circumstances that lead to placements into CPS or JJS. Youths that enter into CPS have suffered abuse or neglect, while JJS placements typically involve crimes committed by the youth.
Table 1. Distribution of CPS and JJS Spells, by Age at Initial Placement
CPS JJS*
N % N % Age 0-4 1,883 45.7% --- --- Age 5-9 905 21.9% --- --- Age 10-14 888 21.5% 3,724 45.3% Age 15+ 448 10.9% 4,497 54.7% All Ages 4,124 100.0% 8,221 100.0%
Note: * Children with JJS spells below age 10 are included in the age 10-14 category, since they represent fewer than 1% of JJS spells.
4.2 Re-Entry into Out-of-Home Placement
4.2.1 Re-Entry Rate by Cohort Year
Table 2 shows the percentage of spells resulting in re-entry (the re-entry rate) for CPS and JJS placements. The table indicates that youth with JJS placements had a much higher likelihood of re-entering than youth with CPS placements. On average, the re-entry rate for JJS placements (45.3 percent) was almost three times higher than for CPS placements (16.4 percent).
7
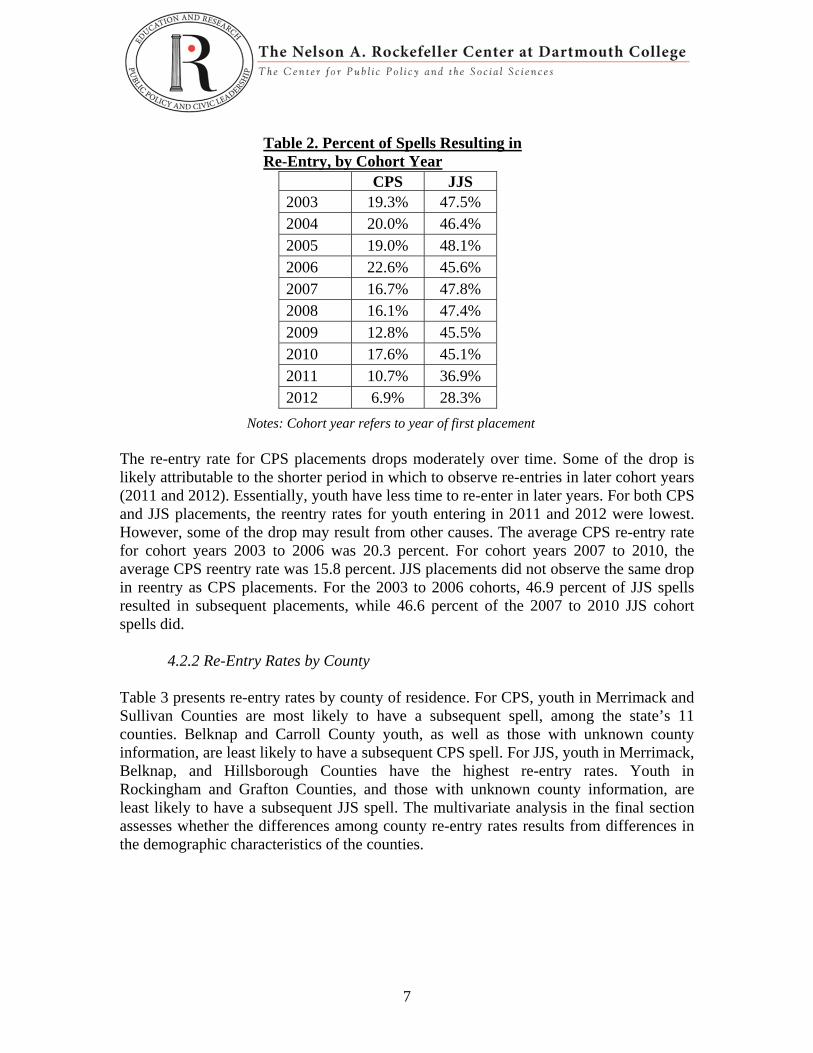
Table 2. Percent of Spells Resulting in Re-Entry, by Cohort Year
Notes: Cohort year refers to year of first placement The re-entry rate for CPS placements drops moderately over time. Some of the drop is likely attributable to the shorter period in which to observe re-entries in later cohort years (2011 and 2012). Essentially, youth have less time to re-enter in later years. For both CPS and JJS placements, the reentry rates for youth entering in 2011 and 2012 were lowest. However, some of the drop may result from other causes. The average CPS re-entry rate for cohort years 2003 to 2006 was 20.3 percent. For cohort years 2007 to 2010, the average CPS reentry rate was 15.8 percent. JJS placements did not observe the same drop in reentry as CPS placements. For the 2003 to 2006 cohorts, 46.9 percent of JJS spells resulted in subsequent placements, while 46.6 percent of the 2007 to 2010 JJS cohort spells did.
4.2.2 Re-Entry Rates by County Table 3 presents re-entry rates by county of residence. For CPS, youth in Merrimack and Sullivan Counties are most likely to have a subsequent spell, among the state’s 11 counties. Belknap and Carroll County youth, as well as those with unknown county information, are least likely to have a subsequent CPS spell. For JJS, youth in Merrimack, Belknap, and Hillsborough Counties have the highest re-entry rates. Youth in Rockingham and Grafton Counties, and those with unknown county information, are least likely to have a subsequent JJS spell. The multivariate analysis in the final section assesses whether the differences among county re-entry rates results from differences in the demographic characteristics of the counties.
CPS JJS 2003 19.3% 47.5% 2004 20.0% 46.4% 2005 19.0% 48.1% 2006 22.6% 45.6% 2007 16.7% 47.8% 2008 16.1% 47.4% 2009 12.8% 45.5% 2010 17.6% 45.1% 2011 10.7% 36.9% 2012 6.9% 28.3%

8
Table 3. Percent of Spells Resulting in Re-Entry, by County
County CPS JJS
N Re-Entry % N Re-Entry % Belknap 286 13.6% 508 48.8% Carroll 168 13.1% 242 41.3% Cheshire 259 17.4% 475 40.0% Coos 215 15.8% 258 40.7% Grafton 297 17.5% 365 39.7% Hillsborough 1,183 17.2% 2,921 47.9% Merrimack 314 20.7% 979 50.8% Rockingham 375 17.6% 1,276 39.0% Strafford 538 16.5% 806 45.3% Sullivan 253 20.9% 365 45.8% Unknown 236 3.0% 26 30.8%
4.2.3 Re-Entry Rates by Ethnicity
Re-entry rates by race and ethnicity for Cohort Years 2003 to 2012 indicate that Hispanic youth have the highest CPS and JJS re-entry rates. Table 4 displays the rates for each ethnicity category. The high proportion of spells for Hispanic youth resulting in re-entry suggest that further investigation into the reasons might be examined. The multivariate analysis in the final section explores several potential reasons. Census Bureau data collected in 2010 and 2011 indicate that three percent of New Hampshire youth are identified as Hispanic and 90 percent are identified as white. In the out-of-home placement data, 8.0 percent of all CPS spells are for Hispanic youth, and 76.0 percent are for white youth. 8.3 percent of all JJS spells are for Hispanic youth, and 82.2 percent for white youth.
Table 4. Percent of Spells Resulting in Re-Entry, by Ethnicity
CPS JJS
N Re-Entry
% N
Re-Entry %
African American 232 15.5% 405 45.4%
Hispanic 332 18.4% 680 51.6%
Non-Hispanic White 3,132 16.7% 6,756 44.5%
Other 428 13.1% 380 46.8%

9
4.2.4 Re-Entry Rates by Primary Placement Type and Year
Table 5 displays the distribution of CPS spells by type of primary placement and cohort year. As shown by the table, foster care, kinship care and congregate care are the three most common types of CPS placement. Between 2003 and 2012, the overall percentage of youth placed in congregate care decreased from 11.1 percent to 9.4 percent, and foster care declined from 66.3 percent to 59.3 percent. Furthermore, there has been a general increase in the percentage of youths within kinship care, which increased from 18.4 percent to 29.3 percent.
Table 5. Percent of CPS Spells, by Placement Type and Cohort Year
2003 2004 2005 2006 2007 2008 2009 2010 2011 2012
Congregate Care 11.1 13.2 16.8 12.8 8.7 10.6 6.4 8.3 7.9 9.0
Foster Home 66.3 58.6 60.3 63.8 66.5 64.6 59.0 63.3 57.1 59.3
Kinship Care 18.4 26.4 20.7 20.5 20.8 22.9 31.7 26.7 32.7 29.3
Medical 0.7 ------- ------- 0.2 0.2 ------ ------ ------ 0.3 ------
Mixed 0.9 0.3 0.7 0.8 1.5 0.4 0.5 ------ 1.1 1.1
Shelter ------- ------- 0.5 0.6 0.9 0.2 0.7 0.6 0.8 0.5
Other/Unknown 2.7 1.6 1.0 1.3 1.5 ------ 0.7 1.1 0.3 0.8
Total 100.0 100.0 100.0 100.0 100.0 100.0 100.0 100.0 100.0 100.0
Notes: Dashed lines indicate no placements in that category. Rows may not sum to 100.0 due to rounding. Table 6 below shows the distribution of placements within JJS by cohort year. As shown by the table, Congregate Care, Shelter Care, Secure Detention, and Secure Treatment represent the four most frequently entered programs within a JJS Placement. From the year 2003 to 2012, the percentage of youth and children within Congregate Care increases steadily from 36.6 percent to 51.8 percent. The percentage within Shelter Care has also increased within this time period, from 23.6 percent to 29.6 percent. Conversely, the percentage of youths within Secure Detention has decreased by almost a half, from 18.7 percent to 9.7 percent. In addition, there has been a reduction of the percentage of youth placed into Secure Treatment. This trend may reflect changes in JJS’s placement preferences—there appears to be a movement away from Secure Detention and Secure Treatment, while other community-based programs, which provide more flexibility for the child, are prioritized.

10
Table 6. Percent of JJS Spells, by Placement Type and Cohort Years
2003 2004 2005 2006 2007 2008 2009 2010 2011 2012 Congregate Care 36.8 36.6 39.1 38.0 38.9 46.6 45.1 46.7 52.8 51.8
Foster Home 4.2 3.8 2.4 2.4 1.7 1.4 1.6 1.2 1.6 1.0
Kinship Care 1.7 2.5 2.0 1.9 1.1 1.3 0.9 0.4 2.0 2.6
Medical 0.5 0.4 1.3 0.3 0.3 0.2 ----- ----- ----- -----
Mixed 1.8 1.6 1.6 2.0 1.9 0.4 1.8 1.9 1.2 1.0
Secure Detention 21.0 18.7 17.6 18.6 11.9 9.9 10.8 7.5 8.8 9.7
Shelter 18.5 23.6 23.3 23.6 28.8 29.3 32.6 32.1 28.5 29.6
Secure Treatment 15.0 12.4 12.0 12.8 14.8 10.0 6.3 8.6 4.8 3.8
Other/Unknown 0.5 0.5 0.5 0.5 0.6 0.8 0.9 1.6 0.4 0.5
Total 100.0 100.0 100.0 100.0 100.0 100.0 100.0 100.0 100.0 100.0
Notes: Dashed lines indicate no placements in that category. Rows may not sum to 100.0 due to rounding.
4.2.5 Re-Entry Rate by Initial Placement Type Table 7a displays re-entry rates for each type of initial placement. For both CPS and JJS placements, youth whose first placement is Shelter Care, Secure Detention, or Medical Care tend to have higher re-entry rates. Conversely, Foster Care and Kinship Care have the lowest re-entry rates. The high Foster and Kinship Care rates of re-entry may be due to the more long-term nature of these placements.
Table 7a. Percent of Spells Resulting in Re-Entry, by Initial Placement Type
CPS JJS
N Re-Entry
% N Re-Entry
% Congregate Care 434 27.6% 3,444 36.5% Foster Care 2,562 15.6% 190 31.6% Kinship Care 1,021 12.5% 132 38.6% Medical Care NA NA 30 70.0% Mixed 31 16.1% 128 43.8% Secure Detention NA NA 1,179 57.7% Shelter 19 68.4% 2,160 57.5% Secure Treatment NA NA 900 36.3% Other/Unknown 43 9.3% 58 43.1% All Placement Types 4,124 16.4% 8,221 45.3%
Notes: NA indicates no spells or too few spells to reliably calculate the re-entry rate in the category.

11
In recent years New Hampshire has relied less on secure detention and secure treatment in its JJS programs, and more on congregate care. To determine whether these changes influenced the re-entry rate, Table 7b compares re-entry rates by placement type for the six years from 2001 to 2006 and the subsequent six years, from 2007 to 2012. The results indicate that re-entry rates for secure detention and secure detention have declined. The finding is notable since these placemen types represent a smaller share of total placements in later years, presumably leaving a more high-risk group in those placements. Congregate care youth also saw a slight reduction in their re-entry rate over this time period.
Table 7b. Changes from 2001-2006 to 2007-2012 in Percent of JJS Spells Resulting in Re-Entry, by Initial Placement Type
2001-2006 2007-2012 JJS
Re-Entry Change N
Re-Entry % N
Re-Entry %
Congregate Care 2,312 36.7% 1,938 35.8% -1.0%
Secure Detention 1,102 57.7% 418 51.4% -6.3%
Shelter 1,217 56.5% 1,274 57.5% 1.1%
Secure Treatment 766 39.4% 376 34.3% -5.1%
Foster Care 286 37.1% 61 32.8% -4.3%
Kinship Care 124 41.1% 52 36.5% -4.6%
Mixed 99 56.6% 59 28.8% -27.8%
Other/Unknown 42 47.6% 35 40.0% -7.6%
Medical 39 61.5% 5 NA NA
Total 5,987 45.6% 4,218 43.7% -1.9%
4.2.6 Re-Entry Rate by Gender Table 8 displays the re-entry rate by gender for cohort years 2003 to 2012. Male and female youth have similar re-entry rates for both CPS and JJS placements. As shown in prior sections, the re-entry rate for JJS placements is much higher on average.
Table 8. Re-Entry Rate, by Gender
CPS JJS
N Re-Entry
% N
Re-Entry %
Female 2,039 16.3% 2,779 45.1% Male 2,085 16.5% 5,442 45.4%

12
4.3 Multivariate Regression Analysis The prior sections assess rates of re-entry into CPS and JJS placements for several demographic groups and placement types. Some of the differences in re-entry rates may arise due to confounding factors, though. For example, Merrimack County’s rate for CPS-involved youth may be higher simply because it has a larger share of older youth, who tend to have a higher likelihood of future spells. To determine whether re-entry rate differences hold while controlling for other demographic factors, this section summarizes the results of a multivariate regression analysis. Specifically, the analysis determines the effects of youth characteristics (e.g., living in Merrimack County) on the likelihood of future re-entry, holding constant age, ethnicity, county, and gender. Separate analyses are performed for CPS and JJS placements. All youth with initial placements from 2003 to 2012 are included. The full set of regression results are reported in the appendix, along with additional discussion of the methodology. Figures 1 through 4 summarize the primary effects. Figure 1 displays the predicted probability of CPS re-entry for each county. Youth living in Belknap and Carroll Counties are, on average, significantly less likely to have a subsequent CPS spell, holding constant age group, ethnicity, and gender. Spells for youth with unknown county information (5.7 percent of the sample) are also less likely to have a subsequent spell on average. The CPS results further indicate that ethnicity does not appear to be a significant determinant of CPS re-entry, holding constant other demographic factors. No ethnicity effects can be statistically distinguished from 0. Additionally, female youths are not more likely to re-enter into CPS placement, all other demographic factors being equal. However, Figure 2 shows that youths with initial CPS placements from age 10 to 14 are substantially more likely to have a subsequent placement, and youths 15 and older are substantially less likely. The finding for youths 15 and older may reflect a shorter time in which to have a future spell, since individuals “age out” of CPS placement when they turn 18 under most circumstances. DCYF might further investigate the effects for youths age 10 to 14, given their seemingly much higher likelihood of future CPS involvement.

13

14
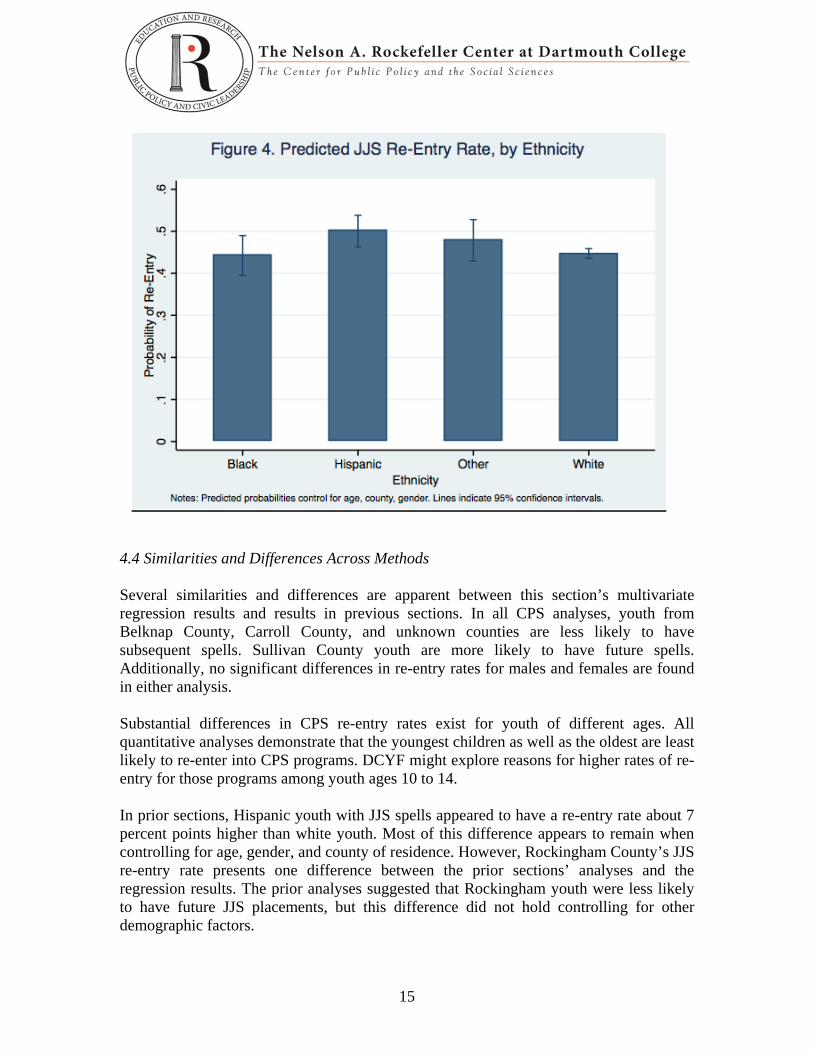
The main JJS re-entry results are displayed in Figures 3 and 4. As reflected in Figure 3, youth in Rockingham County are, on average, less likely to re-enter into JJS placement. The effect is statistically significant at conventional levels. Additionally, Hispanic youth with JJS placements appear more likely to have subsequent spells, holding constant age group, county, and gender. The difference between white and Hispanic youths is statistically significant. However, under a few specifications the effect of being Hispanic on JJS re-entry does not quite reach statistical significance. Future analysis might examine possible over-time changes that may have resulted in higher re-entry among Hispanic youths. The multivariate results also indicate that female youth are not significantly more likely than male youth to re-enter into JJS placement. Those results are shown in the appendix. Youths ages 15 and older are, however, more likely to have a future JJS spell than younger individuals.
15
4.4 Similarities and Differences Across Methods Several similarities and differences are apparent between this section’s multivariate regression results and results in previous sections. In all CPS analyses, youth from Belknap County, Carroll County, and unknown counties are less likely to have subsequent spells. Sullivan County youth are more likely to have future spells. Additionally, no significant differences in re-entry rates for males and females are found in either analysis. Substantial differences in CPS re-entry rates exist for youth of different ages. All quantitative analyses demonstrate that the youngest children as well as the oldest are least likely to re-enter into CPS programs. DCYF might explore reasons for higher rates of re-entry for those programs among youth ages 10 to 14. In prior sections, Hispanic youth with JJS spells appeared to have a re-entry rate about 7 percent points higher than white youth. Most of this difference appears to remain when controlling for age, gender, and county of residence. However, Rockingham County’s JJS re-entry rate presents one difference between the prior sections’ analyses and the regression results. The prior analyses suggested that Rockingham youth were less likely to have future JJS placements, but this difference did not hold controlling for other demographic factors.

16
Comparing re-entry rates for CPS and JJS programs, it is noteworthy that Belknap County’s re-entry for CPS programs is lower than other counties’ rate, while its re-entry rate for JJS programs is higher than other counties. These analyses did not offer concrete explanations for the difference. 5. CONCLUSION This report seeks to identify characteristics associated with higher rates of youth re-entry into CPS and JJS placements. DCYF might utilize the information to develop strategies to reduce re-entry for youths with these characteristics. Specifically, the report analyzes rates of youth re-entry into out-of-home placements by year, ethnicity, county, placement type, and gender for those with an initial placement from 2003 to 2012. It includes a range of descriptive analyses and a multivariate analysis of re-entry that controls for several factors simultaneously. Because the multivariate analysis controls for multiple factors at the same time, it may provide additional guidance in formulating plans to reduce re-entry. For CPS placements, youth in Belknap and Carroll Counties appear to be less likely to re-enter. Children who enter CPS placements between the ages of 10 and 14 years old are the most likely to re-enter. For JJS programs, Hispanic youth and those in Merrimack County are more likely to have future placements. Additionally, New Hampshire’s reduced reliance on secure detention and treatment do not appear to have resulted in a higher incidence of JJS re-entry. In fact, JJS program re-entry rates have declined somewhat since the mid-2000s. Overall, the report’s findings may highlight several starting points for DCYF to evaluate strategies to reduce re-entry in the coming years. With regard to CPS and foster care placements, DCYF may consider whether youth in Belknap and Carroll Counties face different underlying situations that make them less likely to re-enter, or if the differences arise due to availability of resources or handling of cases. If the differences arise due to different resource levels, case handling, or policies, DCYF might consider relying on those strategies in other counties. In terms of JJS and detention policies, future research might also investigate reasons for higher re-entry among Hispanic youth and those in Merrimack County. Potentially useful avenues include analyzing differences in law enforcement approaches across jurisdictions, state policy changes over time, and differences in household characteristics of youth who face the highest likelihood of re-entry.

17
6. APPENDIX The appendix provides further information about the multivariate regression estimation methods and results. Logistic regression models are estimated separately for CPS and JJS placements. Logistic regression is appropriate when the dependent variable takes a value of either 0 or 1. The dependent variable in each model is an indicator of re-entry that equals 1 if the youth re-enters into placement and 0 otherwise. The first column in Appendix Table 1 presents the model results for CPS re-entry. The model appears to fit the data well. The likelihood ratio chi-square value is 119.3 and statistically significant (p<.001), indicating that the independent variables are a significant improvement over an “empty” model without them. The table’s entries are logistic regression odds ratios. Odds ratios greater than 1 indicate that the independent variable is associated with a higher probability of re-entry relative to the reference category, and values below 1 indicate the variable is associated with a lower likelihood of re-entry relative to the reference category. Since the independent variables are all dummy variables, one county variable is excluded as the reference category (Sullivan County), as well as one ethnicity variable (white), one gender (male), and one age category. Asterisks indicate statistically significant effects. In the CPS column, the odds ratios for Belknap and Carroll Counties are statistically significant and well below 1. This indicates that youth living in these counties are on average less likely to re-enter into CPS placement than youth in Sullivan County, the reference category, holding the other factors constant. Youth with unknown county information, 5.7 percent of the sample, are also less likely to re-enter on average.
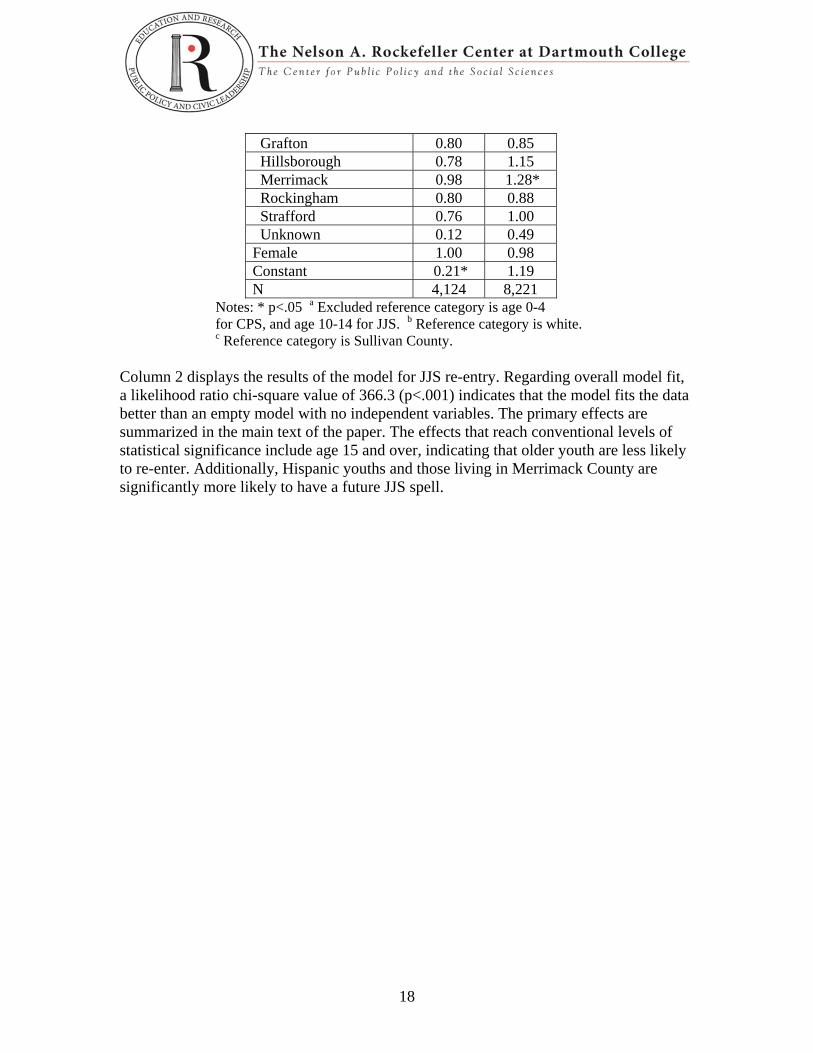
Appendix Table 1. Effects of Demographic Factors on Re-Entry, Logistic Regression Odds Ratios, 2003-2012
CPS JJS Odds Ratio
Odds Ratio
Agea 5-9 1.38* --- 10-14 2.13* --- 15+ 0.92 0.46** Race/Ethnicityb African American 0.85 0.98 Hispanic 1.20 1.25** Other 0.81 1.14 Countyc Belknap 0.59* 1.17 Carroll 0.57* 0.87 Cheshire 0.81 0.85 Coos 0.73 0.84
18
Grafton 0.80 0.85 Hillsborough 0.78 1.15 Merrimack 0.98 1.28* Rockingham 0.80 0.88 Strafford 0.76 1.00 Unknown 0.12 0.49 Female 1.00 0.98 Constant 0.21* 1.19 N 4,124 8,221
Notes: * p<.05 a Excluded reference category is age 0-4 for CPS, and age 10-14 for JJS. b Reference category is white. c Reference category is Sullivan County.
Column 2 displays the results of the model for JJS re-entry. Regarding overall model fit, a likelihood ratio chi-square value of 366.3 (p<.001) indicates that the model fits the data better than an empty model with no independent variables. The primary effects are summarized in the main text of the paper. The effects that reach conventional levels of statistical significance include age 15 and over, indicating that older youth are less likely to re-enter. Additionally, Hispanic youths and those living in Merrimack County are significantly more likely to have a future JJS spell.
19
7. REFERENCES 1 Child Protection Services. (2010). New Hampshire Department of Health and Human Services. Retrieved November 3, 2013, from http://www.dhhs.nh.gov/dcyf/cps/index.htm. 2 Division for Juvenile Justice Services (DJJS). New Hampshire Department of Health and Human Services. Retrieved October 24, 2012, from http://www.dhhs.nh.gov/ocom/documents/djjs.pdf. 3 Ibid. 4 Ibid. 5Division for Children, Youth & Families. (2010). New Hampshire Department of Health and Human Services. Retrieved November 5, 2013, from http://www.dhhs.nh.gov/dcyf/index.htm. 6 Child Protection Services. (2010). New Hampshire Department of Health and Human Services. Retrieved November 5, 2013, from http://www.dhhs.nh.gov/dcyf/cps/index.htm 7 Youth Operator. (2012). New Hampshire Department of Safety Division of Motor Vehicles. Retrieved November 3, 2013, fromhttp://www.nh.gov/safety/divisions/dmv/ driver-licensing/apply/youth-operator.htm. 8 Juvenile Delinquency. (2010). New Hampshire Department of Health and Human Services. Retrieved November 5, 2013, from http://www.dhhs.nh.gov/djjs/probation/delinquency.htm 9 Definitions of Child Abuse and Neglect. (2011). Child Welfare Information Gateway. Retrieved November 9, 2013, from https://www.childwelfare.gov/systemwide/laws_policies/statutes/define.pdf. 10 Ibid. 11 Ibid. 12 Placement Decisions. (2013). Child Welfare Information Gateway. Retrieved November 13, 2013 from https://www.childwelfare.gov/outofhome/placement/. 13 Foster Care & Adoption Services. New Hampshire Department of Health and Human Services. Retrieved November 11, 2013, from http://www.dhhs.nh.gov/dcyf/adoption/ 14 Institutional Services. New Hampshire Department of Health and Human Services. Retrieved November 11, 2013, from http://www.dhhs.nh.gov/djjs/institutional/index.htm 15 PRS Report 16 Institutional Services. New Hampshire Department of Health and Human Services. Retrieved November 11, 2013, from http://www.dhhs.nh.gov/djjs/institutional/index.htm. 17 PRS Report 18 Shelter Services. New Hampshire Department of Health and Human Services. Retrieved November 11, 2013, from http://www.dhhs.nh.gov/dcbcs/bhhs/shelter.htm