young children's comprehension of logical...
TRANSCRIPT
YOUNG CHILDREN'S COMPREHENSION OF LOGICAL CONNECTIVES
by
Patrick Suppes and Shirley Feldman
TECHNICAL REPORT NO. 150
October 15, 1969
PSYCHOLOGY SERIES
Reproduction in Whole or in Part is Permitted for
any Purpose of the United States Government
INSTITUTE FOR MATHEMATICAL STUDIES IN THE SOCIAL SCIENCES
STANFORD UNIVERSITY
STANFORD) CALIFORNIA


1Young Children's Comprehension of Logical Connectives-
Patrick Suppes and Shirley Feldman
Stanford UniversityStanford, California 94305
The development of children's understanding of logical connectives
has been discussed by a number of people over the past decade and a half,
Without attempting to review this literature in detail, we cite Furth
and Youniss (1965), Hill (1961), Inhelder and Matalon (1960), Inhelder
and Piaget (1964), McLaughlin (1963), Piaget (1957), Suppes (1965), and
Youniss and Furth (1964, 1967). Nevertheless, none of these studies reports
the extent to which children of preschool age show comprehension of the
meaning of the logical connectives in a well-defined experimental situation,
The importance of understanding the extent and limitations of children's
mastery of the logical connectives is evident for any cognitive theory of
development, The recent work in psycholinguistics, emphasizing the complex
nature of the grammar and semantics of the language of children, has pro-
vided further impetus for seeking such understanding,
It seems clear that the development of a better theory about children's
behavior and the changes in that behavior with age re~uires much more
detailed information about their linguistic habits and competence than
we now have, The present study, which consists of two closely related
experiments, is meant to contribute to the accumulation of such systematic
informatiollo
The data of the experiments have been analyzed in terms of several
specific regression models to provide a deeper insight into what aspects
1
of comprehension of sentential connectives are most difficult. In addition,
a more detailed mathematical model is applied to the data of Experiment 2
to predict the distribution of actual responses, not just the proportion
of response errors.
The formal relations between various English idioms expressing
conjunction, disjunction, and negation; and the set-theoretical operations
of intersection, union, and complementation are not deeply explored in
this paper, but our assumptions about these connections are obvious and
uncontroversial. Deeper investigation of these linguistic and semantical
matters seems desirable as part of any further extensive study of children's
comprehension of logical connectives.
EXPERIMENT 1
The primary aim of the first experiment was to investigate the extent
to which children between the ages of four and six comprehend the logical
connectives of conjunction, disjunction, and negation. It waa also antic
ipated that the exact formulation of the idiom in terms of which the con
nectives were expressed would affect the results. Consequently; a second
aim waa to investigate the relative ease or difficulty of various idioms
used to express the connectives. A third, subsidiary aim of the experiment
was to examine the effects of sex, age, and socioeconomic status on the
performances of the children in comprehending the meaning of the connectives.
Method and Procedure
Experimental Design
The differences in performance as a function of the type of logical
connective and idiom were examined in a within-subject design. A
2

2 x 2 x 2 factorial design was used to examine the between-subject
effects of age, sex, and socioeconomic status (SES).
Subjects
Sixty-four subjects participated in the experiment. Thirty-two
kindergarten children between the ages of 5.7 and 6.7 yeara were drawn
from two sources: a middle-class elementary school and a school in a
disadvantaged area. The other 32 children were between the ages of 4.5
and 5.4 years and attended either a preschool headstart class or a middle
class nursery school. Eight boys and 8 girls were tested from each of
the four sources. The children from the preschool headstart class and
from the school in a disadvantaged area were considered culturally de
prived by the standards of the Office of Economic Opportunity.
Experimental Materials
Eighteen wooden blocks were used. Each block had two salient
properties: shape (star, circle, or square) and color (red, green,
or black), Each combination of color and shape was represented by
two blocks. The blocks were approximately 3-1/2 inches square and
1/2 inch deep.
Procedure
The children were pretested to ensure that they could identify the
elementary properties (color and shape) of the blocks. Three children
were eliminated at this stage, but were replaced by others so that 64
subjects were tested.
Each subject was tested individually. After some preliminary
commands, the subjects received 12 test commands to hand various blocks
to the experimenter. The subjects were told to give all the blocks
3

asked for, and none of the others. Throughout the session the experimenter
behaved in a positively reinforcing manner.
The commands were stated with as much inflection as possible. For
example, command 11 was expressed as "the things that are green-or-square,"
with the hyphenated words spoken as a coherent unit. Words were stressed
and pauses were used to heighten the effect of the logical connectives.
Each command was repeated several times.
The commands were as follows:
l. Give me the green stars.
2. Give me the red things and the square things.
3. Give me the things that are black, but not round.
4. Give me all the red things, and then everything else, but not the stars.
5· Give me all the things that are black and square.
6. Give me the green things, or, the round things.
7. Give me the stars that are red.
8. Give me the things that are black and not square.
9. Give me all the things that are green, and then everything else but
not the stars.
10. Give me the black things that are round.
11. Give me the things that are green or square.
12. Give me the things that are not round but are red.
Seven commands--commands 1, 3, 5, 7, 8, 10, and 12--tested the
conjunction or the intersection of two sets. Three of these, namely,
commands 3, 8, and 12, also used negation; i.e., they asked for the
intersection of sets when one of the sets was a complement. To inves
tigate disjunction or the union of sets, four alternate forms of the
4

commands were given. These were commands 2, 4, 9, and 11; of these,
commands 4 and 9 involved negation or complementation. One command,
namely, command 6, used the "exclusive-or" connective. The commands
not using negation will be called positive commands; the commands using
"not" will be called negative commands.
Results and Discussion
Three types of analyses were performed: one on the differences in
performance between the various groups of subjects, one on the types
of responses made to the different connectives and the different idioms
used to express the connectives, and one on the predictive worth of a
regression model.
Group Differences
To evaluate the contribution of age, sex, and socioeconomic status
(SES), five three-way analyses of variance on the number of correct
responses were carried out: one each on the total score, the score
to conjunction commands, to disjunction commands, to negation commands,
and to the exclusive-or command. In Table 1, the significant results
Insert Table 1 about here
from these analyses are presented. In four of the five analyses, SES was
a significant variable with children from culturally deprived homes con-
sistently making fewer correct responses than children from advantaged
homes. Age also was important in comprehending the connectives of
conjunction and negation, with the older children making more correct
responses than the younger children. However, it should be noted that
5

TABLE 1
Summary of Significant Variables from Five Tbree-Way Analyses
of Variance on Correct Responses in Experiment 1
AnalysisSignificant
MS df Fvariables
"._----"-- ._-- ---_._--
1. Total commands SES 76,6 1 33,0**I
(Error) 56,i 2.3I,
-lI
I,
2. Conj'uncti()n ' commands I SES 34.5 1 28.3**I
! IAge 15. 1 1 12·3**
(Error) 1.2 56
3. DisD,unctioncommands SEG 5. 1 1 10·5**
Age X Sex X SES 2.3 1 4.7*
I I (Error) 0·5 56
4. Negation commands SES 40.6 1 35.6**
Age 8.3 1 7.2**
(Error) 1.1 56
5· Exclusive-Or commands -
* p < .05-** p < 001
6

the connectives of conjunction and negation were not independent. Sex
did not affect performance differentially. Finally, only 1 of a possible
20 interactions was significant. It tentatively may be concluded that
the three main effects are independent of one another. The fact that
socioeconomic status was a uniformly more significant variable than age
is to be emphasized.
Response Distributions
The number of correct responses to a logical connective is an
estimate of the difficulty of the operation. The rank-order of the diffi-
culty of the binary connectives from least to most difficult is as follows:
conjunction (71 per cent correct), exclusive-or (67 per cent), and
disjunction (11 per cent). Significant differences are found between
conjunction and disjunction (~ = 9.1, £ < .001), between exclusive-or
and disjunction (z = 8.2, P < .001), but not between conjunction and- -
exclusive-or. For the combined connectives negation substantially
increases the difficulty of the commands (~ = 3.8, £ < .01). However,
it does not affect the rank-order of the different connectives, and from
least to most difficult the order is as follows: positive conjunction
(81 per cent correct), exclusive··or (67 per cent), conjunction-negation
(56 per cent), positive disjunction (18 per cent), and disjunction-
negation (6 per cent).
The errors that the children made to the commands indicate the
SOurce of difficulty in understanding connectives. In Table 2 the notation
Insert Table 2 about here
7

TABLE 2
Legend of Notation Used to Describe Subjects' Responses in Both Experiments
- - ._-_._.," ."_. - --- . ._.._-_ .. ....._.. _- -_._._--_._~ ----
I Example: X ~ redSymbol 4- Definition Y ~ square
.-.~~-~-- -.~---..-.".--._._-.----~--_. --~----
.
X The set of elements with attribute X. All the red blocks.
..Conjunction. The intersection of
X n Y sets X and Yo Each object has both The red squares 0
attributes X and Y..
II Disjunction. The union of sets X The red blocks andI X U Y and Y. Each object has at least one the blocks.! of the attributes X and Y. square
The exclusive-or (All members of the The set of red blocksX or Y set X or all members of the set Y, or the set of square
but not both) . blocks •.
,- Negation. The complementary set of X. Green blocks andX The not-X objects. black blocks.
lx The incomplete set of X objects 0
Five or less (of then six) red blocks.
1The incomplete set of blocks belonging Five or less of the
- (X UY) to the union of X and Y, where mem-bers red and five or lessn of' both X and Y represented. of the blocks.are square
1 -The incomplete complementary set where Some, but not all of
-.X members of both subsets in the comple- the green blocks andn mentary set are represented. black blocks.
Misc. Miscellaneous--any response notdefined by the above categories.
--~---
8

used to describe the responses is presented. In Table 3 the response
distribution for the 12 commands is shown. For the positive conjunction
-----------------------~-Insert Table 3 about here
commands, three of the four commands (1, 7, and 10) have 'similar distribu
tions. We it') SponseS to the three conjunction-negation commands (3, 8, and 12)
al~oi;S~bWa similar distribution to one another. The distribution of the
responses to the two positive disjunction commands (2 and 11) are not alike,
a differe~ce probably due to the different idioms used.
In general, an inverse relationship exists between number of blocks
for a c0rrect response and performance.
Wller1, thEe command was for the set X n Y, giving the intersection of
one set with only a part of the complementary set was the most frequent
error. It is not clear whether the difficulty was in identifying the ex-
tension of the cOmplementary set or in the operation of intersection. Some
recent evidence (Feldman, 1968) indicates that 4- to 6-year olds have dif-
ficulty in being exhaustive with the complementary set, which seems to
suggest that the complementation caused the difficulty in these commands
rather than the intersection. Another frequent error was to give the
first-mentioned set, as may be seen in Table 3.
The neg&t'ive disjunction commands (4 and 9) were difficult for the
subjects, ,'inC\lf\aqV'er:rorpwere made. The first-mentioned set appears in
9 percent of the responses. Observations of the children revealed that
many of them had genuine conflict over where to place the blocks that
belonged to X n Y; for example, in command 4, placement of the red
stars when the red things and the not-stars were requested. Many children
9
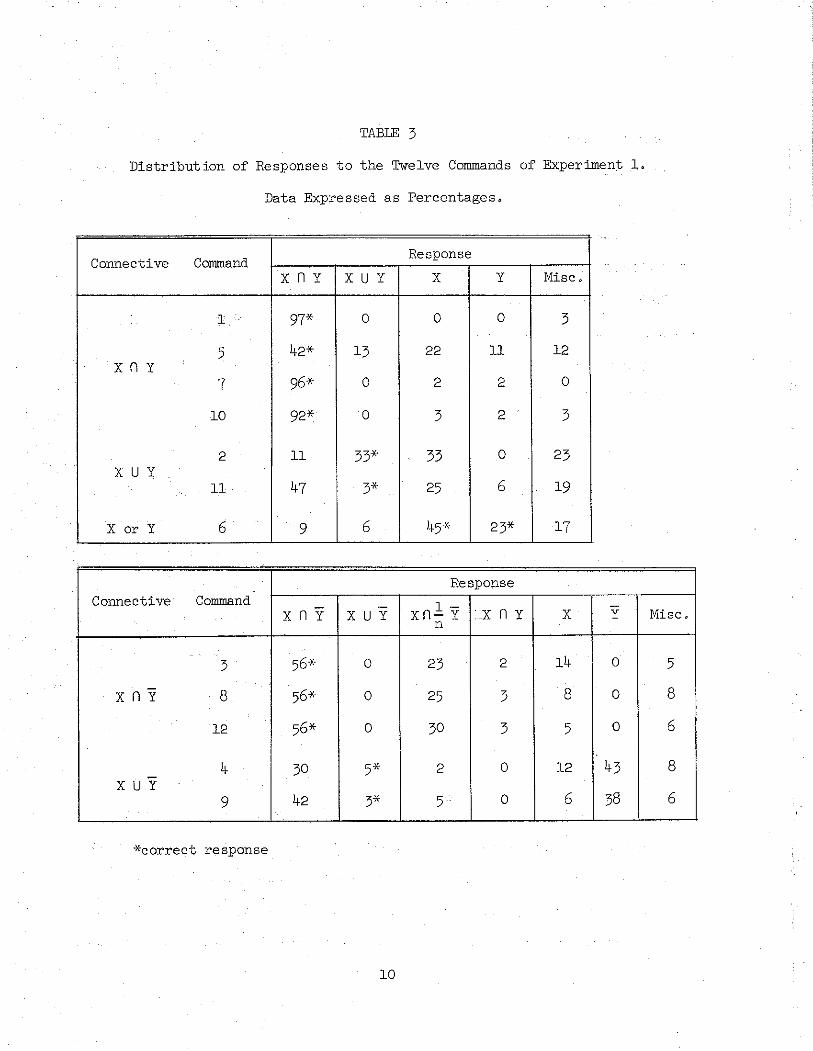
TABLE 3
Distribution of Responses to the Twelve Commands of Experiment L
Data Exp~essed as Percentages.
Connective ConnnandResponse
X n y XU Y X Y Misc.
1 97* 0 0 0 3
5 42* 13 22 11 12X n y
7 96* 0 2 2 0
10 92* 0 3 2 3
2 11 33* 33 0 23X U y
11 47 3* 25 6 19
X or Y 6 9 6 45* 23* 17
ResponseConnective Command - xn l y -
X n Y XU Y X n y X Y Misc.n
3 56* 0 23 2 14 0 5
X n y 8 56* 0 25 3 8 0 8
12 56* 0 30 3 5 0 6
4 30 5* 2 0 12 43 8XU y
9 42 3* 5 0 6 38 6
*cor~ect ~esponse
10

first included the red stars (in response to command 4) with the objects
they gave to the experimenter, but then verbalized "But these are stars,
and you said the red things and the things that are not stars," and with
this comment removed the red stars. Although an order of selection clearly
was suggested by the phrase "and then everything else ••• " very few children
selected their blocks in this manner. Most children picked up each block
as it came to hand and apparently tested it against a memorized version
of the command.
For the exclusive-or command the correct response category is probably
inflated, for the first-mentioned,set is a highly probable component of the
response irrespective of the connective used.
Idiom. Table 3 shows that the form of the idiom used to express a
particular logical connective affected the difficulty of the command for
the subject$ In the case of conjunction, the idiom of command 5, "Give
me all the things that are X and Y," was especially difficult. The other
three (commands 1,7, and 10) were gyite easy, as reflected in the high
proportion of correct responses. As for disjunction, only one idiom was
understood with any success and that was "Give me the X things and the
Y things" (command 2). The idiom of command 11 was obviously very difficult
for the children.
Regression Models
The discussion of regression models follows Suppes, Hyman, and
Jerman (1967). The main task is to identify the factors that contribute
to the difficulty of the commands. Factors to be examined include variation
in the connective, the idiom, and the order of the properties. As a matter
of notation, the jth factor of command i in a given set of commands is
11
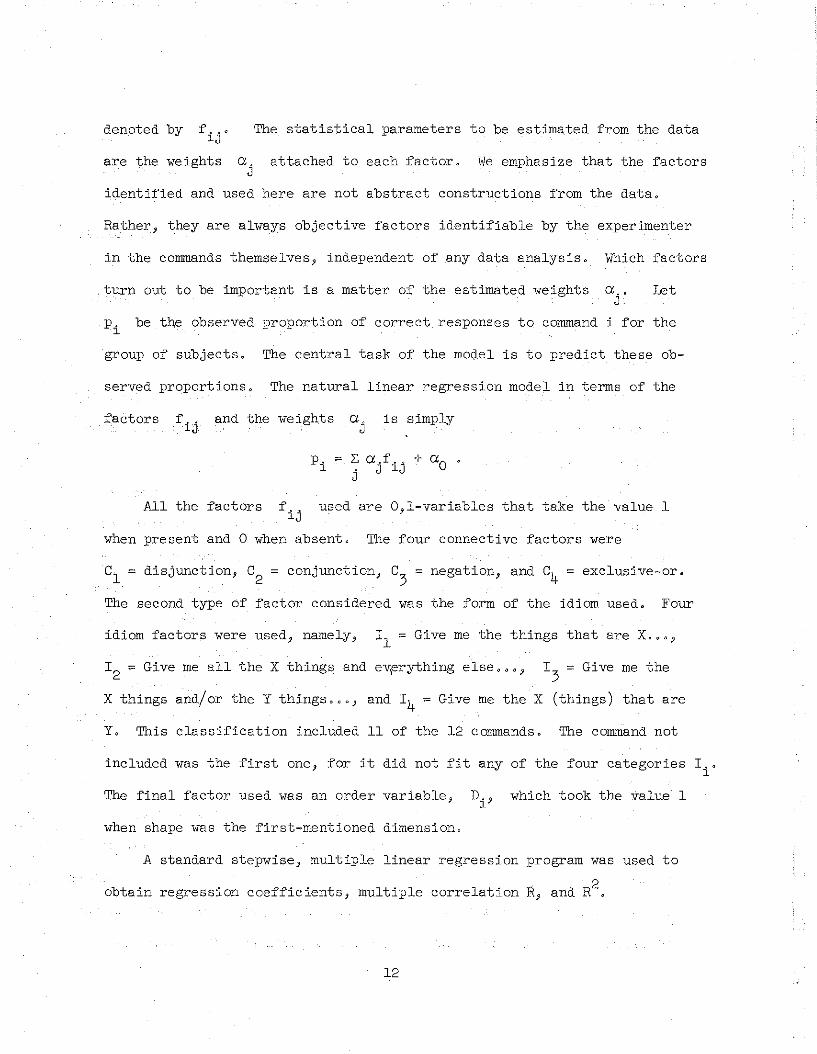
denoted by The statistical parameters to be estimated from the dataf . .alJ
are the weights 0:.J
attached to each factor. We emphasize that the factors
identified and used here are not abstract constructions from the data.
Rather, they are always objective factors identifiable by the experimenter
in the commands themselves, independent of any data analysis. Which factors
turn out to be important is a matter of the estimated weights 0: .•J
Let
Pi be the observed proportion of correct responses to command i for the
group of subjects. The central task of the model is to predict these ob-
served proportions. The natural linear regression model in terms of the
factors f ij and the weights O:j is simply
P. ~ Z o:.f .. + 0:0 •1 j J lJ
used are O,l-variables that take the value 1All the factors fij
when present and °when absent. The four connective factors were
Cl
~ disjunction, C2
~ conjunction, C3
~ negation, and C4
~ exclusive-or.
The second type of factor considered was the form of the idiom used. Four
idiom factors were used, namely, 11 ~ Give me the things that are X.•• ,
12
~ Give me all the X things and ev~rything else ••• , 13
~ Give me the
X things and/or the Y things ••. , and 14 ~ Give me the X (things) that are
Y. This classification included 11 of the 12 commands. The command not
included was the first one, for it did not fit any of the four categories Ii'
The final factor used was an order variable, Di , which took the value 1
when shape was the first-mentioned dimension.
A standard stepwise, multiple linear regression program was used to
. 2obtain regression coefficients, multiple correlation R, and R •
12

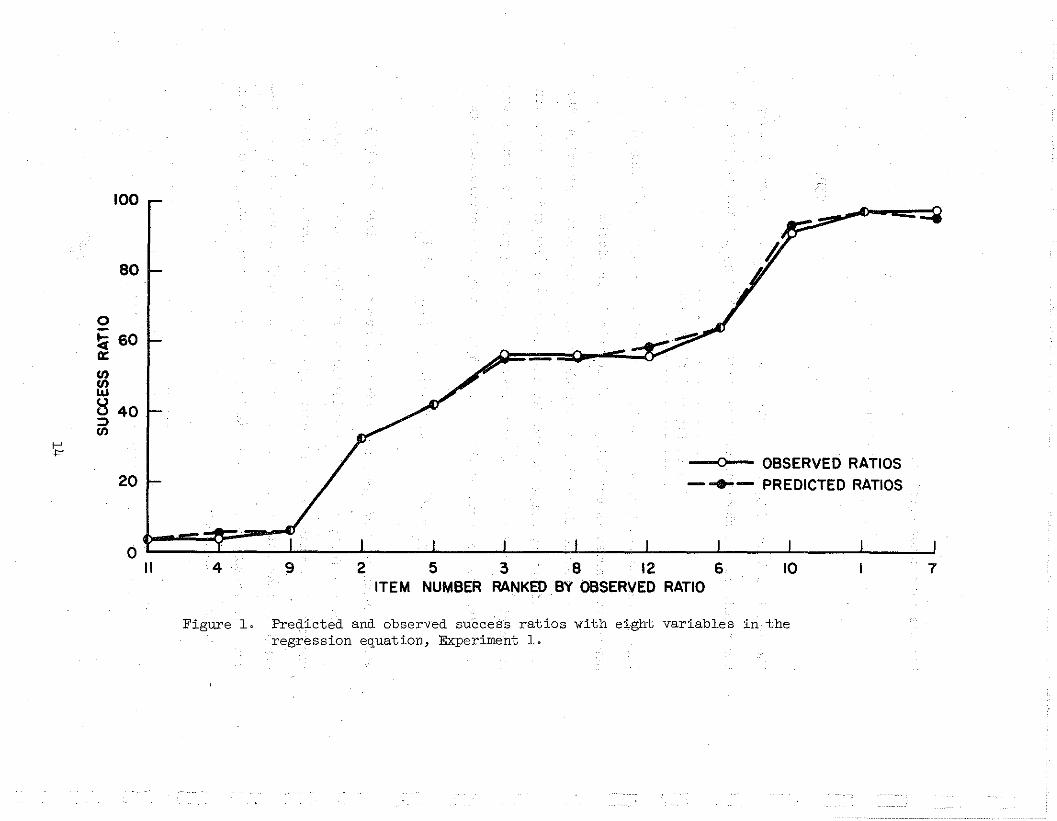
For the regression equation
the multiple R .is .995, with a standard error of.0203. Figure 1 shows
the predicted and observed success ratios. Although the fit is good, it
Insert Figure 1 about here
must be remembered that 9 parameters are being estimated (and thus 8
structural variables are being used) to make 11 predictions.
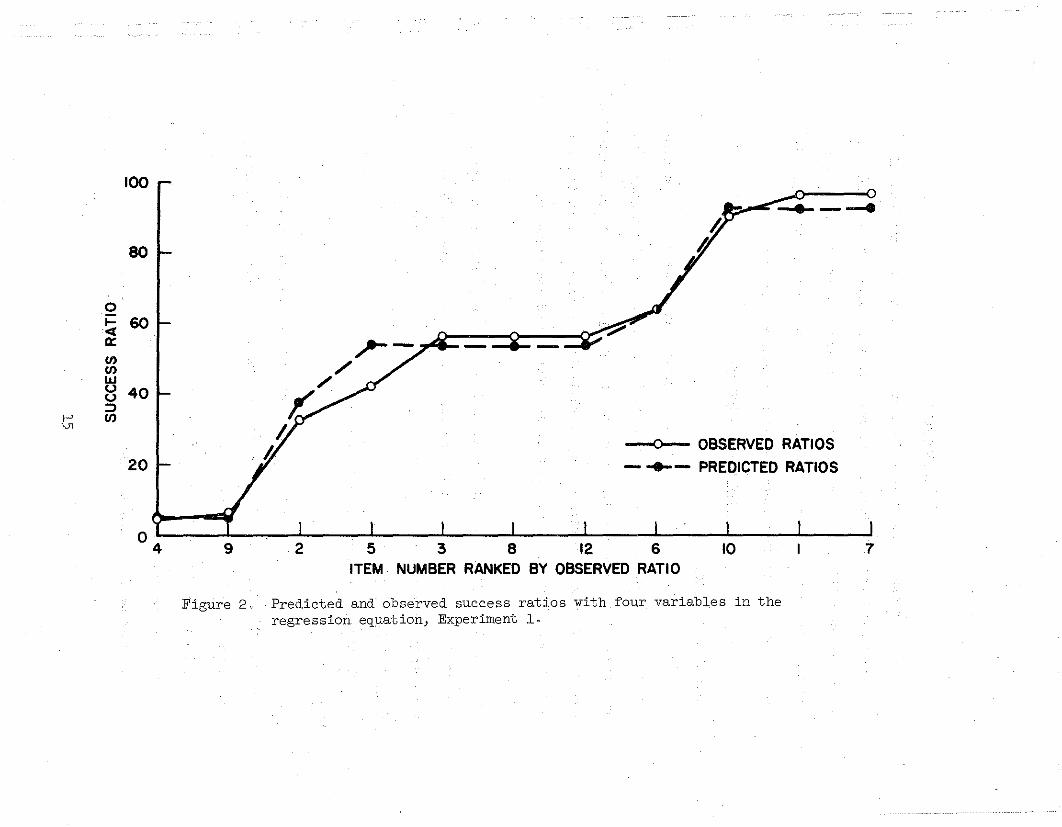
If we reduce the number of variables in the regression equation, the
problem of interpreting the coefficients is made easier and the reduction
in multiple Rand R2 is not very great. Considering only the first four
variables that entered in the stepwise regression, the equation becomes
with a multiple .R of .991, and a standard error of estimate of .0579.
Several features of the regression coefficients should be noted.
Disjunction commands are difficult, and conjunction commands are easy.
Negation does not enter into this regression equation, and the predictions
are satisfactory without this variable. Figure 2 shows the predicted and
observed success ratios.
Insert Figure 2 about here
13
100
7102 5 3 8 12 6ITEM NUMBER RANKED. BY OBSERVED RATIO
94o
II
80
0!ci 60 L -~
a::II)II)I&J
g 40:::>II)
t-'.,. ---0-- OBSERVED RATIOS
20 I- / - ..... - PREDICTED RATIOS
Figure 10 Predicted and observed success ratios with eight variables in theregression equation, Experiment 10
100
~...... - .......
--0-- OBSERVED RATIOS
- .... - PREDICTED RATIOS
r/
",;4
/)
40
80
o I I I I I I I I I I I
4 9 2 5 3 8 12 6 10 I 7ITEM NUMBER RANKED BY OBSERVED RATIO
20
oi=60cra:II)II)UJ(.)(.)::>II)f-'
Vl
Figure 20 Predicted and observed succesS ratios with four variables in theregression equation, Experiment 10

EXPERIMENT 2
Both regression analyses in Experiment 1 show the significance of
connective and idiom variables. In order to investigate further the role
of idioms in children's understanding of sentential connectives) we per-
formed a second experiment with a new group of subjects in which the con-
nectives and idioms were standardized in a manner described below.
Me±hbdland Procedure..~
Experimental Design
The subjects were divided into four groups, with age and sex equated
across the groUps. Each group was given the same set of 12 commands, with
the order of the commands different for each group. Thus, type of connective
and type of idiom were within-subject variables and order of commands was
a between-subject variable. Each subject was tested individually.
Subjects
The 112 subjects between 4.6 and 6.0 years of age were drawn from
the Stanford Nursery School and from the kindergarten classes of local
elementary schools.
Experimental Materials
These were the same as in Experiment L
Procedure
The task and the instructions were similar to those described in
Experiment 1. However, the idiom and the connectives were standardized.
Three forms of idioms were used. They were:
1. Give me the things that are X and/or Y.
2. Give me the X things and/or the Y things.
3. Give me the X and/or Y things.
16

The operations included six disjunction commands, four conjUnction commands,
and two exclusive-or commands, Half of the commands within each connective-
type'> involved negation.
The commands were as follows:
L Give me the things that are red and square.
2, Give me the round and black things.
3. Give me the things that are round or green.
4, Give me the black things and the square things,
5· Give me the red or star things.
6, Give me the stars or the green things.
7· Give me the things that are stars and not black.
8. Give me the red, and not round things.
9. Give me the things that are red and not square.
10. Give me the round things "nd the not green things.
lik. Give me the square or not green things.
12. Give me the black things or the not star things.
Four different orders of the commands were given.
RESULTS AND DISCUSSION
Response Distributions
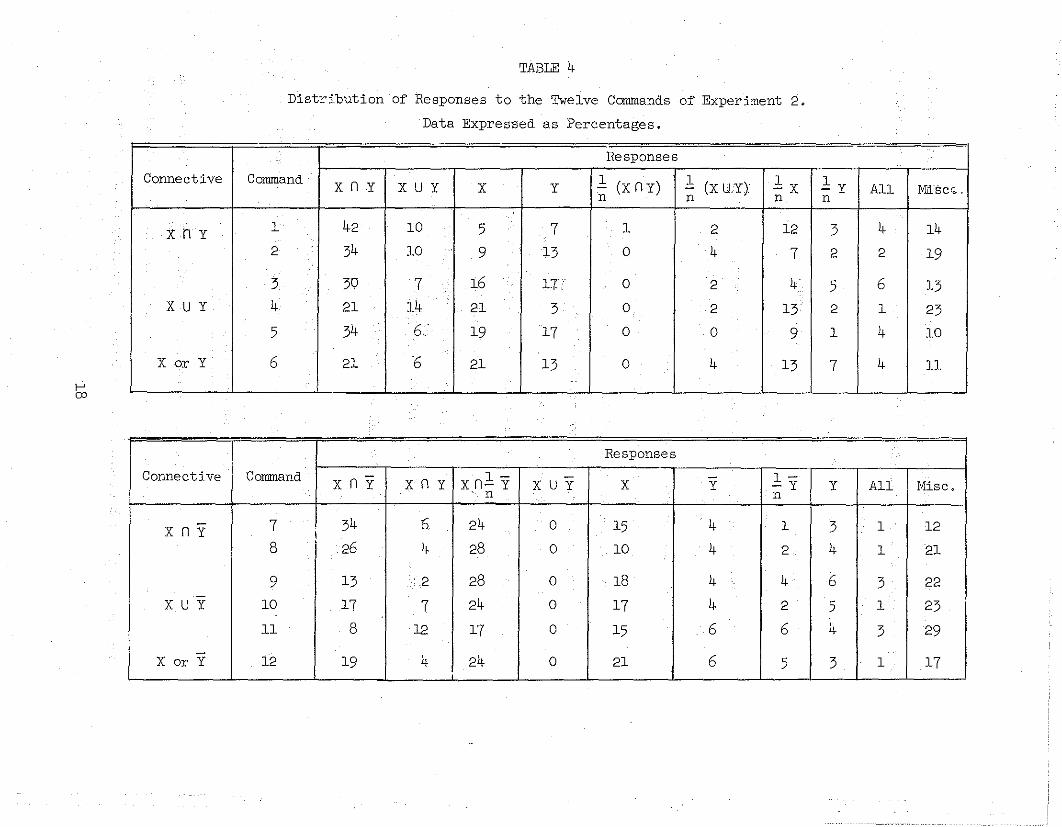
An analysis of the responses made to the 12 crommands is presented
in Table 4. The most strikil)g finding for the six positive commands
Insert Table 4 about here
is that irrespective of the connective and the idiom used the d,istribution
of responses for different commands is similar; the most frequent response
was the intersection of two sets, followed in frequency by one of the
17
f-'ill
TABLE 4
Distribution of Responses to the Twelve Commands of Experiment 2.
Data Expressed as Percentages.
Responses
Connective Command X n y XU Y X y lo (X n y) lo (X U,y) lox loy All rvTIi-sc'o: .n n n n
J( n y 1 42 10 5 7 1 2 12 3 4 142 . 34 10 9 13 0 4 7 2 2 19
3 30 7 , 16 11 0 2 4 5 6 13XU y 4 21 14 21 3 0 2 13 2 1 23
5 34 6- 19 17 0 0 9 1 4 10
X or Y 6 21 6 21 13 0 4 13 7 4 11.,
Responses,..
Connective Command X n y X n y X nlo y XU Y X y loy Y All Misc •. . n n
X n y 7 34 6 24 0 15 4 1 3 1 12!
8 26 4 28 0 10 4 2 4 1 . 21
9 . 13 _2 28 0 18 4 4 6 3 22XU Y 10 17 7 24 0 17 4 2 5 1 23
11 8 12 17 0 15 6 6 4 3 29
X or Y 12 19 4 24 0 21 6 5 3 1 17
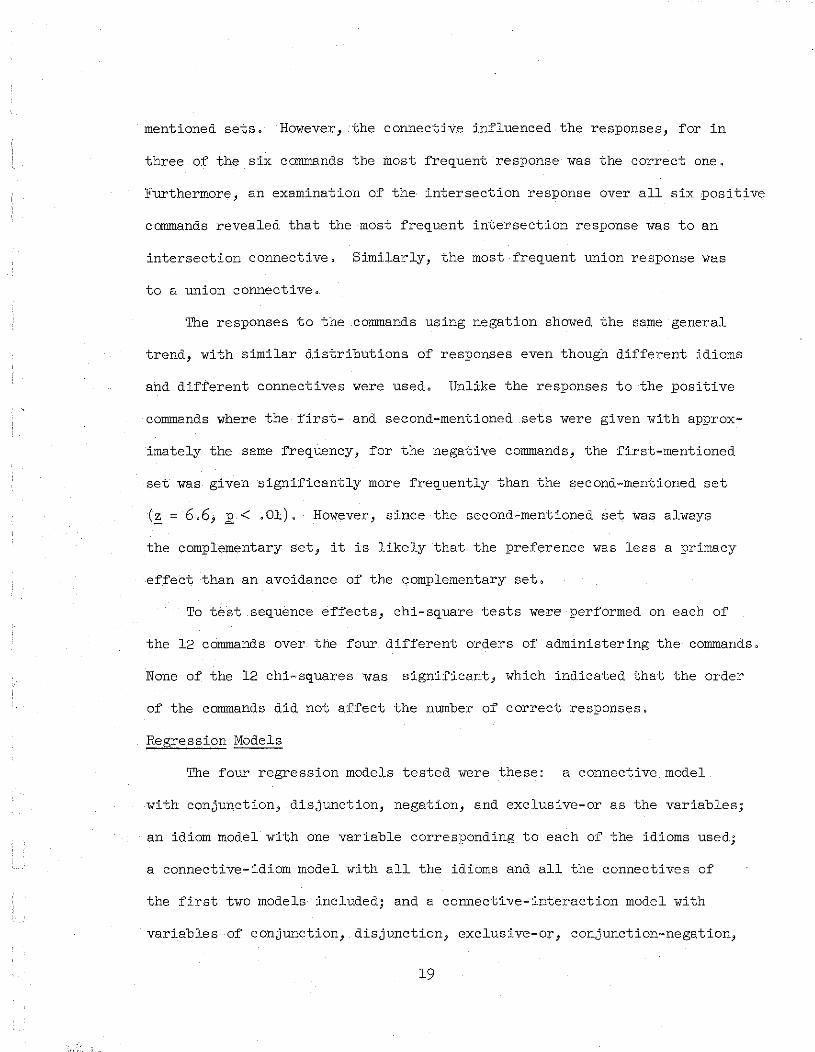
mentioned sets. However, the connective influenced the responses, for in
three of the six commands the most fre~uentresponsewas the correct one.
Furthermore, an examination of the intersection response over all six positive
commands revealed that the most fre~uent intersection response was to an
intersection connective. Similarly, the most fre~uent union response was
to a union connectiveo
The responses to the commands using negation showed the same general
trend, with similar distributions of responses even though different idioms
and different connectives were used. Unlike the responses to the positive
commands where the first- and second-mentioned .sets were given with approx
imately the same fre~uency, for the negative commands, the first-mentioned
set was given significantly more fre~uently than the second-mentioned set
(~~ 6.6, g < .01). However, since the second-mentioned set was always
the complementary set, it is likely that the preference was less a primacy
effect than an avoidance of the complementary set.
To test se~uence effects, chi-s~uare tests were performed on each of
the 12 commands over the four different orders of administering the commands.
None of the 12 chi-s~uareswas significant, which indicated that the order
of the commands did not affect the number of correct responses.
Regression Models
The four regression models tested were these: a connective model
with conjunction, disjunction, negation, and exclusive-or as the variables;
an idiom model with one variable corresponding to each of the idioms used;
a connective-idiom model with all the idioms and all the connectives of
the first two models included; and a connective~interaction model with
variables of conjunction, disjunction, exclusive-or, conjunction-negation,
19
disjunction-negation, and exclusive-or-negation. The results of these
four models are Summarized in Table 5. The column headed Number of
Variables gives the number of variables that entered the stepwise
Insert Table 5 about here
regression with significant effect.
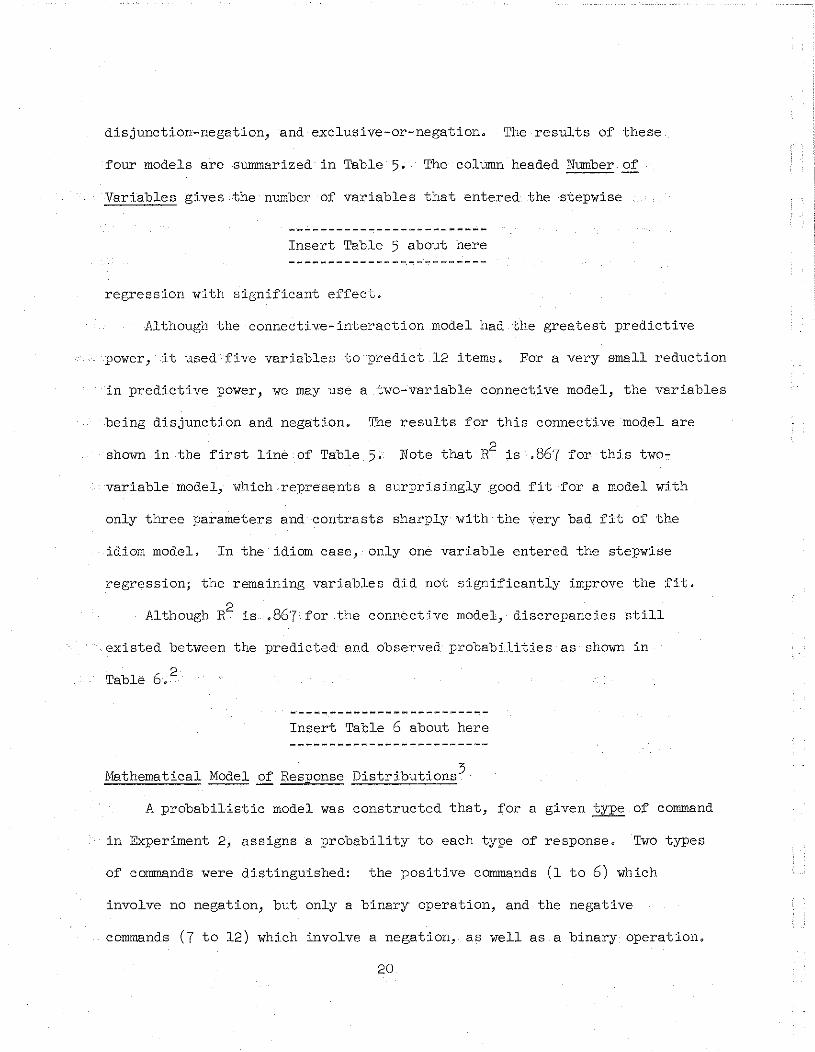
Although the connective-interaction model had the greatest predictive
power, it used five variables to predict 12 items. For a very amall reduction
in predictive power, we may use a two-variable connective model, the variables
being disjunction and negation. The results for this connective model are
shown in the first line of Table 5; Note that R2 is .867 for this two-
variable model, which represents a surprisingly good fit for a model with
only three parameters and contrasts sharply with the very bad fit of the
idiom model. In the idiom case, only one variable entered the stepwise
regression; the remaining variables did not significantly improve the fIt.
2Although R Is .867 for the connectIve model, discrepancies still
existed between the predicted and observed probabIlities as shown in
2Table 6.
Insert Table 6 about here
~~thematical Model of Response DistrIbutions3
A probabilistic model was constructed that, for a given type of command
in Experiment 2, assigns a probability to each type of response. Two types
of commands were distinguished: the positIve commands (1 to 6) which
involve no negation, but only a binary operation, and the negative
commands (7 to 12) which involve a negation, as well as a binary operation.
20

TABLE 5
Summary of Four Regression Models Built
to Predict Correct Response to 12 Commands
. .
R2 Number OfModel R cr.e variables*
Connective 0931 0354 0867 2
Idiom 0067 0918 .005 1
Connective-Idiom 0936 0417 .877 5
Connec.tive Interaction ·992 .154 .983 5
*This refers to the number of variables which enteredinto the model with significant effect.
21

TABLE 6
Observed and Predicted Probabilities of an Error
Using the Two-Variable Connective Model, Experiment 2 •.. .-
.!iCommand Obs. Pred. Command Obs. Pred. ,i._.
1 .58 .47 7 .66 .83 I
2 .66 .47 8 .74 .83
3 .93 .95 9 LOO .99
4 .86 .95 10 LOO .99. ..
5 .94 .95 11 LOO .99
6 .66 .47 12 .73 .83--_•.._"-- .. ......--_._".-.-.~ --- ..
22

In order to arrive at a complete response, for a given command, the subject
must proceed through several steps. At each step he hands one or two objects
to the experimenter. The final answer, or complete response, consists of
the set of all objects that the subject gave to the experimenter. Different
types of responses correspond to different strategies the subject may adopt.
Asa first attempt to apply a quantitative analysis to the types of
errors made, we have grouped the response data together independently of
the command to which a response was given. Thus, the first assumption of
our model is that the strategy adopted is independent of the command. We
do not believe this is· true when the finer details of the data are examined,
but, as we shall see, we can use it in conjunction with some other simplified
assumptions to obtain a model that fits the grouped response data fairly
well.
The model is based on the subjects' choosing, with probability Pi'
one of four mutually exclusive and exhaustive response strategies. Strategy 1
is to respond ona random basis. Strategy 2 is to respond as if the binary
connective of the command were that of conjunction or intersection. Strat
egy 3 is to respond to the command by paying attention to only one of the
two properties referred to in the command. Strategy 4 is to respond to
the command by treating the binary connective as one of disjunction or
The properties of our model maybe formulated in four simple axioms.
Axiom 1. The subject chooses with probability Pi' i ~ 1, 2, 3, or 4,
independent of the actual command, one of the four strategies.
~ 2. If the subject adopts strategy 3, he considers either
property with equal probability.
23
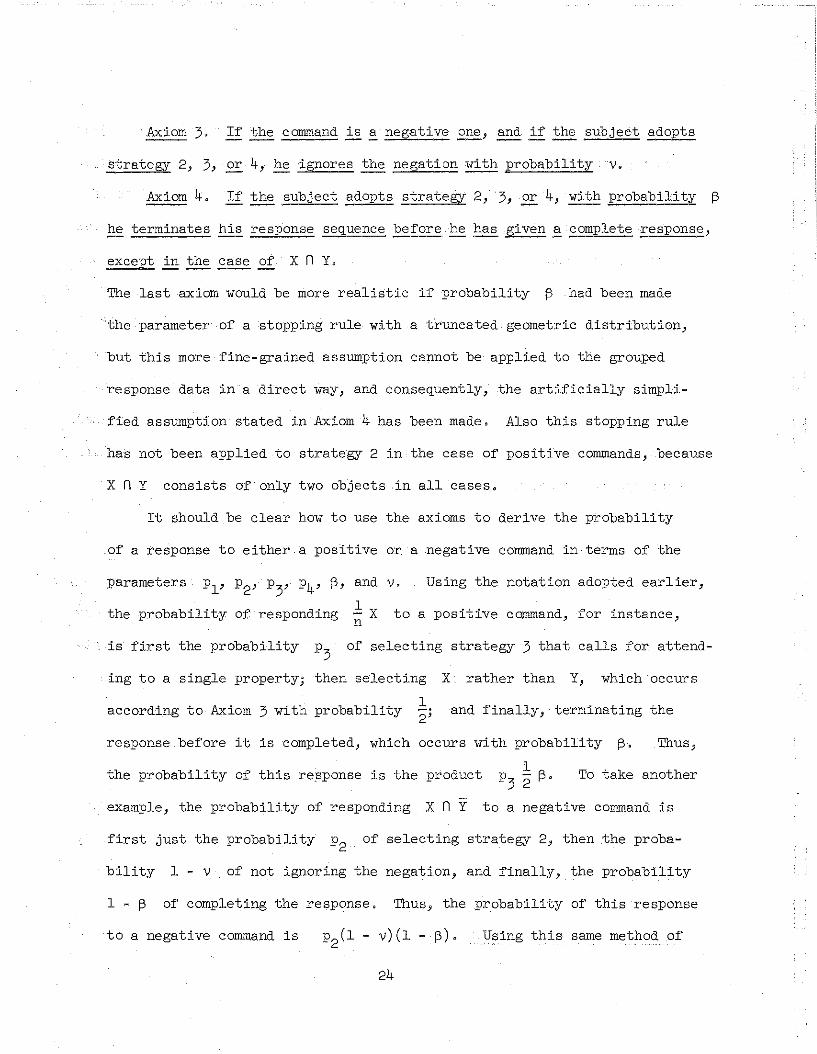
Axiom 3. If the command is ~ negative ~, and g the subject adopts
strategy 2, 3, ££ 4, he ignores the negation with probability v.
Axiom 4. If the subject adopts strategy 2,3, ££4, with probability ~
he terminates his response seQuence before he has given ~ complete response,
except in the case of X n Y.
The last axiom would be more realistic if probability ~ had been made
. the parameter of a stopping rule with a truncated geometric distribution,
but this more fine-grained assumption cannot be applied to the grouped
response data in a direct way, and consequently, the artificially simpli-
fied assumption stated in Axiom 4 has been made. Also this stopping rule
has not been applied to strategy 2 in the case of positive commands, because
X n Y consists of only two objects in all cases.
It should be clear how to use the axioms to derive the probability
of a response to either a positive Or a negative command in terms of the
the probability of responding
Using the notation adopted earlier,
to a positive command, for instance,
and finally, terminating the
is first the probability P3 of selecting strategy 3 that calls for attend
ing to a single property; then selecting X rather than Y, which occurs
12'
according to Axiom 3 with probability
To take anotherthe probability of this response is the product
response before it is completed, which occurs with probability ~.
1P3 2: ~.
Thus,
example, the probability of responding X n Y to a negative command is
first just the probability P2 of selecting strategy 2, then the proba
bility 1 - V of not ignoring the negation, and finally, the probability
1 - ~ of completing the response. Thus, the probability of this response
to a negative command is Using this same method of
24
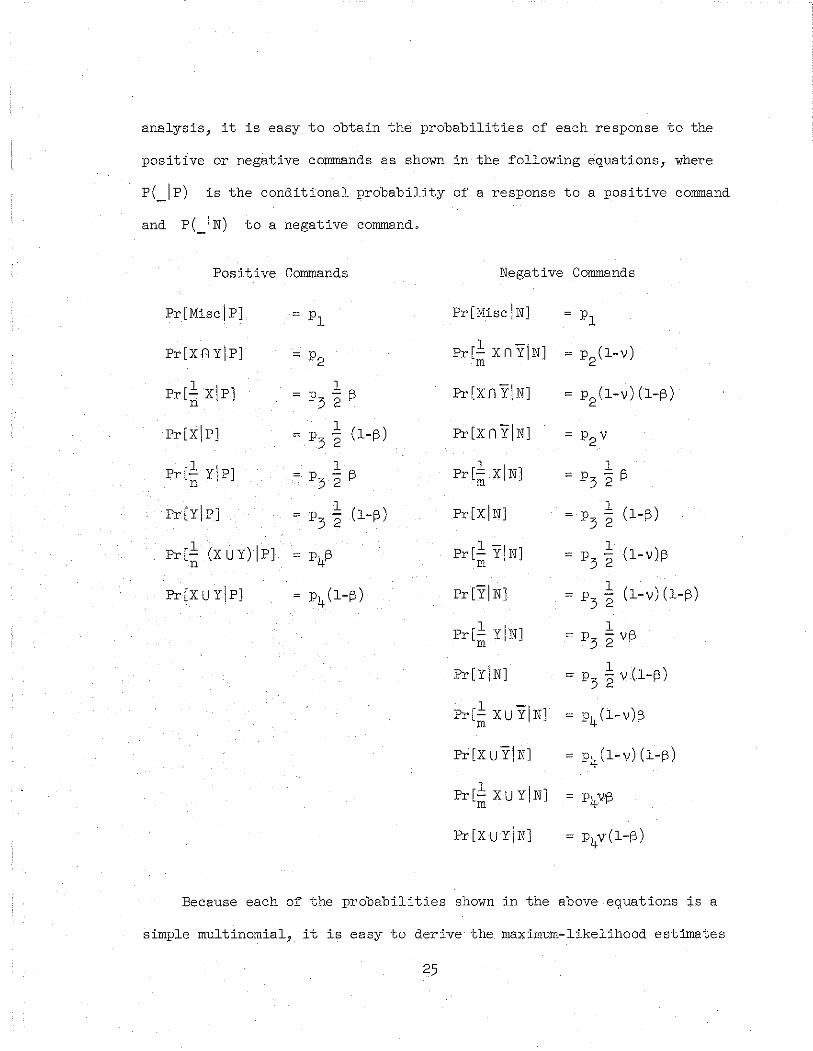
analysis, it is easy to obtain the probabilities of each response to the
positive or negative commands as shown in the following equations, where
p(_lp) is the conditional probability of a response to a positive command
and P(_IN) to a negative command,
Negative Commands
Pr[XnyIN] = p V2
Pr[~ xlN]1
~ p - ~3 2
Pr[X!N]1
(l-~)~ p -3 2
1 -I 1(l-V)~pr[- Y N] ~ p -
m 3 2
pr[YI N] 1 (l-V) (l-~)~ p -3 2
pr[1: YiN] 1~ P - V~m 3 2
Pr[Y!N] 1~ P3 '2 v(l-~)
Pr[1: XUY IN] ~ P4(1-V)~m
Pr [X UY! N] ~ P4 (l-v) (l-~)
Pr[1: XUY!N] ~ P4V'~m
Pr[X UYiN] ~ P4V(1-~)
Positive Commands
Pr[Misclp] ~ p1
pr[xn yip] ~ P2
Pr[1: xl P] 1~ P3 "2 ~n
Pr[X!P]1
(l-~ )~
P3 '2
pr[1: Y! P] 1~ P - ~n 3 2
Pr[Y!P]1
(l-~)~p -3 2
1 (X UY) Ip]Pr[- ~ P4~n
pr[xUYIP] ~ P4(1-~)
Pr[Misc IN]
pr[xnY!N]
~ P1
~ P (l-V)2
~p (l-v)(l-~)2
Because each of the probabilities shown in the above equations is a
simple multinomial, it is easy to derive the maximum-likelihood estimates
25
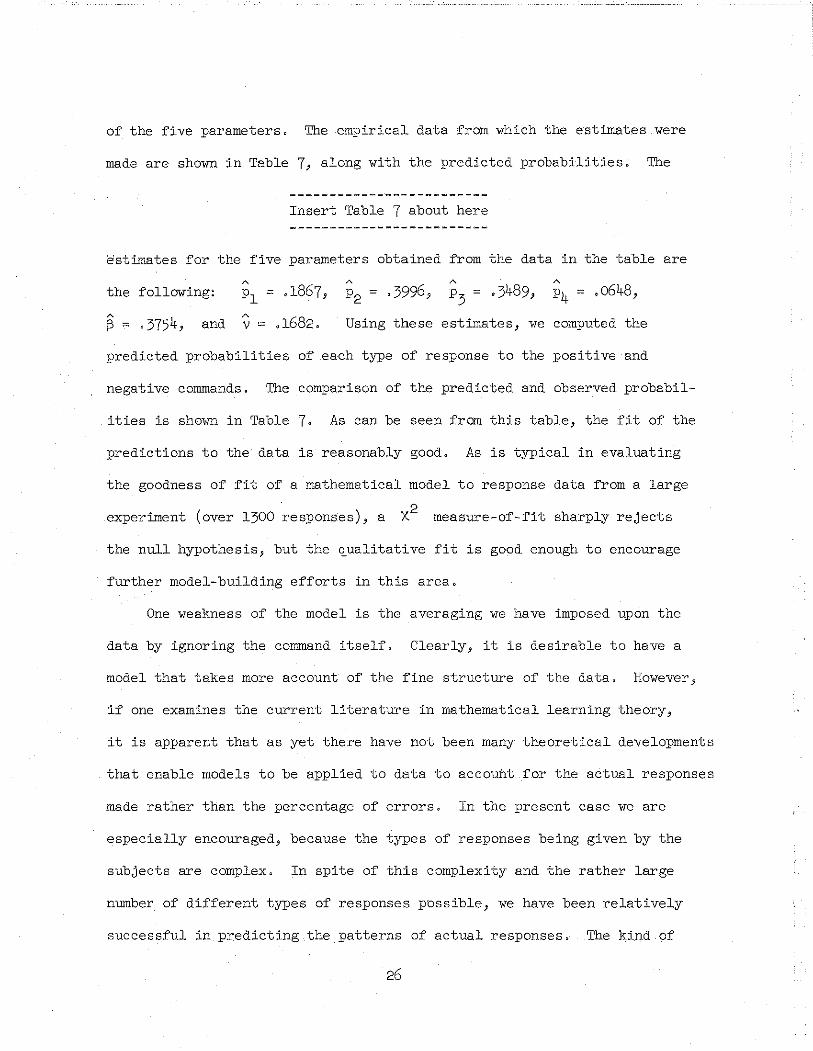
of the five parameters. The empirical data from which the estimates were
made are shown in Table 7, along with the predicted probabilities. The
Insert Table 7 about here
estimates for the five parameters obtained from the data in the table are
A
the following: Pl ~ .1867,
S ~ .3754, and V~ .1682.
A
P4 ~ .0648,
Using these estimates, we computed the
predicted probabilities of each type of response to the positive and
negative commands. The comparison of the predicted and observed probabil-
ities is shown in Table 7. As can be seen from this table, the fit of the
predictions to the data is reasonably good. As is typical in evaluating
the goodness of fit of a mathematical model to responae data from a large
experiment (over 1300 responses), a X2 measure-of--fit sharply rejects
the null hypothesis, but the ~ualitative fit is good enough to encourage
further model-building efforts in this area.
One weakness of the model is the averaging we have imposed upon the
data by ignoring the command itself. Clearly, it is desirable to have a
model that takes more account of the fine structure of the data. However,
if one examines the current literature in mathematical learning theory,
it is apparent that as yet there have not been many theoretical developments
that enable models to be applied to data to account for the actual responses
made rather than the percentage of errors. In the present case we are
especially encouraged, because the types of responses being given by the
subjects are complex. In spite of this complexity and the rather large
number of different types of responses possible, we have been relatively
successful in predicting the patterns of actual responses. The kind of
26

TABLE 7
Empirical Frequencies, and Observed and Predicted Probabilities
of Each Type of Response in Experiment 2.
.12
.11
.20
.07
.07
.02
.05
.09
.16
.20
.24
.01
.06
.03
.05
.014
39
9
23
28
163
131
107X
1~y
m
y
lym
x n y
lxm
xn'Y
lxnym
.11
.19
.40
.07
.09
.07
.03
.04
.12
.15
.04
.15
.30
.08
.08
.09
22
65
59
78
14
129
204
101
,Positive Commands Negative Commands !
- --~- f - -- - --- -,Empirical . Empirical ~ I"
Freq. Observed Predlcted T~e.; -----t ~re~____ ~bser~e~__T-~~edlcted ~
Mlsc. 122 .19 .19 1III
Type
Misc.
xlyn
x n y
lxn
xu y
y
lxUYn
II
ro--l
y
lxU'Ym
22
6
.03
.01
.02
.02
xu y
1 XU ym
xu y
o
8
o
.00
.01
.00
.03
.00
.01 I
experimental situation used in our two studies permits a more detailed
recording of data than has been reported here, The experimenter can
record the actual sequence of objects given in turn to the experimenter
by the subject, and also with some additional effort, the latency of
these partial responses, What is most desirable hi tlJat [)ubsequent
studies· attempt to take account of these additional aspects of subjects'
responses.
CONCLUSIONS
The two experiments reported here lead to results that must be
regarded as preliminary in character, More extensive and more detailed
studies, especially of the language in which logical connectives are
embedded, are required before any general conclusions about the compre
hension of logical connectives can be drawn, On the other hand, the
results of the two experiments, especially the results embodied in the
several linear regression mOdels presented in the paper, show that we
can account for a large part of the variance in responses .of the children
by looking at the particular connectives used in a command and also by
examining the idiom in which these connectives were expressed, ·When the
idioms are standardized as in the second experiment, the analysis of the
connectives alone is sufficient to account for more than 85 per cent of
the variance in the behavior, It is to be noted.of course that this
remark applies to the mean probabilities of response, not to individual
responses, Considering the results that have been reported in a wide
variety of literature, it is not surprising that negation enters as an
important variable in the second experiment, From the studies of
Eifermann (1961), Wason (1959, 1961), Wason and Jones (1963), and
28
others, it might have been predicted that in a regression analysis of
comprehension, negation would be a salient connective in terms of dif
ficulty of comprehension. On the other hand, it was unexpected that
negation would not be a significant variable in the first experiment.
This is probably the result of a considerable dependence between negation
and idiom variables, with the idiom variables being somewhat better pre
dictors.
It is easy enough to characterize additional lines of research
needed in terms of the comprehension of logicai connectives. We have
not been able to present in this paper any picture of the developmental
sequence in terms of age. It would be desirable to know more about how
comprehension changes with age and with linguistic exposure. From a
psychological standpoint, it would be especially valuable to have a
deeper understanding of why particular sorts of errors were made. The
mathematical model we have tested marks only a beginning in this direction.
29
References
Eifermann, R. Negation: A linguistic variable. Acta Psychologia, 1961,
18, 258-273.
Feldman, S. S. Children's understanding of negation as a logical operation.
Unpublished doctoral dissertation, Stanford University, 1968.
Furth, H. G., and Youniss, J. The influence of language and experience
on discovery and use of logical symbols. British Journal of Psychology,
1965, 56, 381-390.
Hill, S. A. A study of the logical abilities of children. Unpublished
doctoral dissertation, Stanford University, 1961.
Inhelder, B., and Matalon, B. The study of problem solving and thinking.
In P. Mussen (Ed.), Handbook of research methods ~~ development.
New York: Wiley, 1960. Pp. 421-455.
Inhelder, B., and Piaget, J. The early growth of logic in the child:
Classification and seriation. New York: Harper and Row, 1964.
McLaughlin, G. H. PsychOlogic: A possible alternative to Piaget's
formulation. British Journal of Educational Psychology, 1963, 33,
61-67.
Piaget, J. c,LQg~c and psychology. New York: Basic Books, 1957.
Suppes, P. On the behavioral foundations of mathematical concepts. Monographs
of the Society for Research in Child Development, 1965, 30, 60-96.
Wason, P. C. The processing of positive and negative information.
Quarterly Journal of Experimental Psychology, 1959, 11, 92-107.
Wason, P. C. Response to affirmative and negative binary statements.
British Journal of Psychology, 1961, ~, 133-142.
30
Wason, P. C., and Jones, S. Negatives: Denotation and connotation.
British Jo~nal of Psychology, 1963, 54, 299-307.
Youniss, J.,c:andFurth, M. G. Attainment and transfer·of logical connectives
in children. Journal of Educational Psychology, 1964, 55, 357-361.
Youniss, J., and Furth,M. G. Learning of logical connectives by adolescents
with single and multiple instances. Journal of Educational Psychology,
1967, 58, 222-230.
31

Footnotes
IThis research has been supported by the U. S. Office of Education and
the National Science Foundation. We are indebted to Mona Morningstar
for a number of useful comments On the manuscript.
2To avoid problems about the conservation of probability, i.e., to guarantee
the predicted Pi always lie between 0 and 1, in Experiment 2 the standard
transformation
I-p.~
Z. = log----~ Pi
was used, and the regression analysis was made in terms of zi' not
The reported R2 is for z . .~
3The first draft of this section was written in collaboration with Bernard
Zarca, but he was not able to participate in writing the final draft of
the paper.