“you mean we have to work together!?!” -...
TRANSCRIPT
“You Mean we Have to Work Together!?!”: A study of the formation and interaction of programming teams
in a college course setting David L. Largent Ball State University
2000 W. University Ave. Muncie, IN 47304
Chris Lüer Ball State University
2000 W. University Ave. Muncie, IN 47304
ABSTRACT We explored how software development teams form and interact in a computer science college course setting and what an instructor can do to enhance effective teamwork. The experiences of computer science college course’s teams are compared and contrasted to the theory of Bruce Tuckman’s stages of small group development model, which he characterized as forming, storming, norming, performing and adjourning. Participants repeatedly self-assessed their enthusiasm and skill levels over time using a questionnaire by agreeing or disagreeing to statements utilizing a five-point Likert scale. The data shows patterns similar to that of Tuckman’s model. Since most people find his model easy to understand, it may provide an effective tool to teach teamwork and monitor team development. Indicators for which instructors or students can watch to identify a team that is struggling are provided.
Categories and Subject Descriptors D.2.9 [Software Engineering]: Management – programming teams, productivity. K.3.2 [Computers and Education]: Computer and Information Science Education – computer science education
General Terms Management, Measurement, Human Factors.
Keywords Team, teamwork, education, small group development, Tuckman small group development model.
1. INTRODUCTION Most undergraduate and graduate computer science students find the focus of their class material is almost always on “technical”
topics such as data structures, programming languages, networks and other similar topics, and very seldom on “human” topics like working within a team [14, 34]. On the surface, this seems very appropriate; if one is studying computer science, one would expect to be taught these sorts of technical topics. Computer science students need something more than a solid technical background to survive and prosper outside of the isolated world of academia, however. They need (among other things) significant experience working within a team.
The Joint Task Force on Computing Curricula stated in their Computing Curricula 2001 final report:
“Few computer professionals can expect to work in isolation for very much of the time. Software projects are usually implemented by groups of people working together as a team. Computer science students therefore need to learn about the mechanics and dynamics of effective team participation as part of their undergraduate education. Moreover, because the value of working in teams (as well as the difficulties that arise) does not become evident in small-scale projects, students need to engage in team-oriented projects that extend over a reasonably long period of time, possibly a full semester or a significant fraction thereof.” [1]
The National Association of Colleges and Employers (NACE) conducts annual surveys of its employer members to determine hiring trends and qualities employers want in an ideal job candidate. For at least the last five years, job candidates with team skills consistently appeared in the top three to five qualities for which employers were looking [2]. NACE’s studies also found that employers felt students were lacking in team skills when they graduated from college.
Despite the prominence of team-oriented work in industry [7, 13, 18] and the desire to have new employees skilled in teamwork, academic computer science pedagogy often ignores the importance of learning to work in teams. All too often, professors are not aware of effective pedagogies for team building and teaching teamwork, or even how to know if teams are working effectively. If computer science educators are to empower their students to survive and prosper outside of academia, they must, along with the technical topics, introduce into their curricula the human side of software development in general, and how to work in a software development team, specifically [9, 11, 15, 29].
Permission to make digital or hard copies of all or part of this work for personal or classroom use is granted without fee provided that copies are not made or distributed for profit or commercial advantage and that copies bear this notice and the full citation on the first page. To copy otherwise, or republish, to post on servers or to redistribute to lists, requires prior specific permission and/or a fee. ICER’10, August 9–10, 2010, Aarhus, Denmark. Copyright 2010 ACM 978-1-4503-0257-9/10/08...$10.00.
41
In addition to good verbal and written communication, team members must be able to [20]:
• Trust other team members
• Deal effectively with conflict
• Make commitments to each other
• Be accountable to each other
• Focus on desired results rather than themselves
Team members unskilled at working in a team environment can be disruptive to both the team process and its productivity. For example, if a struggling team member communicates early to their team about a given challenge, the team can work together to resolve it. A team member who is unable to communicate effectively can cause team members to distrust them because of broken commitments, simply because they were not aware of any issues until it is too late to do anything about them.
While the ability to work in teams has always been important, with the move towards agile software development methodologies (which heavily depend on teams) in recent years, individuals who are able to effectively work in teams become all the more critical and valuable [10, 24].
Since industrial and commercial software is practically always developed by teams who must collaborate with internal and/or external clients, the exploration of how teams form and interact in a college course setting and what a course instructor can do to facilitate this process is beneficial. Without offering this kind of “human” training, computer science educators may produce nothing more than “coders,” or worse, individuals that will actually impede software development because of their lack of understanding about how to work in a team environment.
2. BACKGROUND AND RELATED WORK The formation and interaction of groups or teams has been widely studied; a literature search will easily locate hundreds of papers or books on the general topic. The literature also has much about programming teams and team-based university computer science courses. Examples include Richards [27], Steenkamp [35], Rutherfoord [30], Waite et al. [40], Walker and Slotterback [41], Liu et al. [23], and Seethamraju and Borman [31].
Begel and Simon [6] provided a revealing assessment of just how well new college graduates fare in the world outside of academia. They studied eight recent college graduates who were hired by Microsoft Corporation shortly before their study began. The study revealed that, while the new hires generally did well, there were observable problems which centered around communication and collaboration, among others. Communication and collaboration issues can both be attributed to a lack of team experience.
The literature provides advice on how teams should be formed [12, 21, 26, 30]. However, little work has been done on studying the development of student programming teams after they have been formed. We decided to investigate Tuckman’s model for small group development and to find out whether it was applicable for student programming teams.
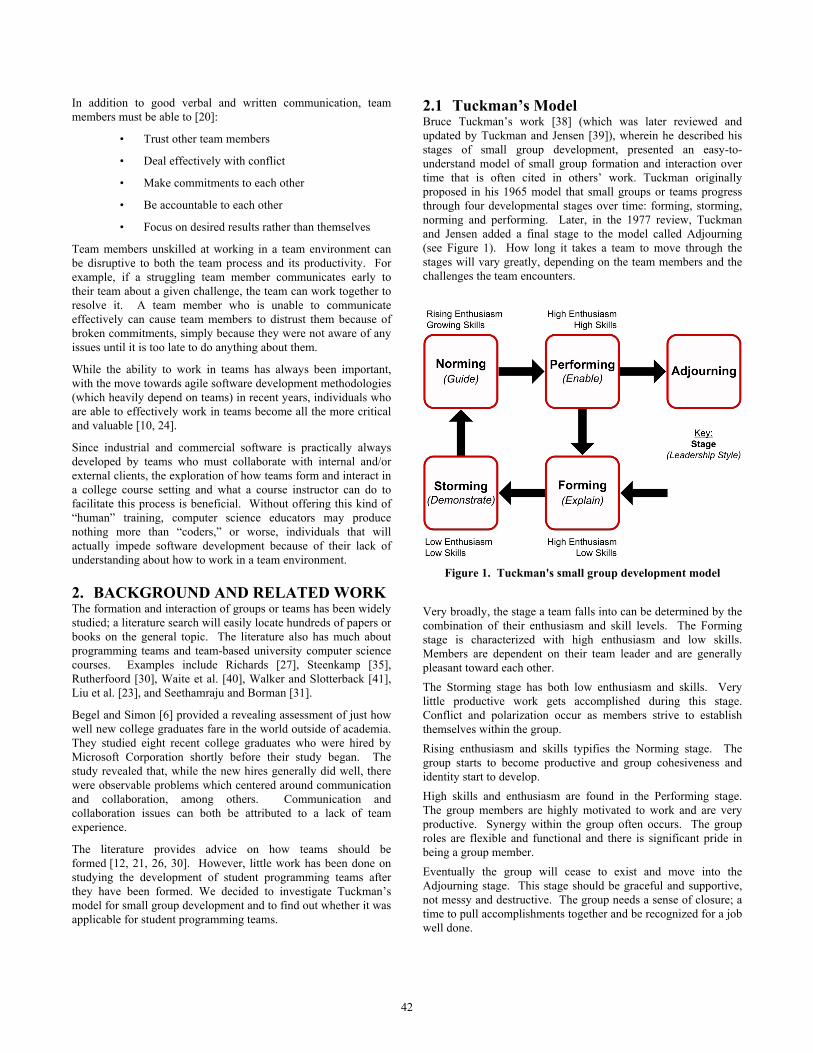
2.1 Tuckman’s Model Bruce Tuckman’s work [38] (which was later reviewed and updated by Tuckman and Jensen [39]), wherein he described his stages of small group development, presented an easy-to-understand model of small group formation and interaction over time that is often cited in others’ work. Tuckman originally proposed in his 1965 model that small groups or teams progress through four developmental stages over time: forming, storming, norming and performing. Later, in the 1977 review, Tuckman and Jensen added a final stage to the model called Adjourning (see Figure 1). How long it takes a team to move through the stages will vary greatly, depending on the team members and the challenges the team encounters.
Figure 1. Tuckman's small group development model
Very broadly, the stage a team falls into can be determined by the combination of their enthusiasm and skill levels. The Forming stage is characterized with high enthusiasm and low skills. Members are dependent on their team leader and are generally pleasant toward each other. The Storming stage has both low enthusiasm and skills. Very little productive work gets accomplished during this stage. Conflict and polarization occur as members strive to establish themselves within the group. Rising enthusiasm and skills typifies the Norming stage. The group starts to become productive and group cohesiveness and identity start to develop. High skills and enthusiasm are found in the Performing stage. The group members are highly motivated to work and are very productive. Synergy within the group often occurs. The group roles are flexible and functional and there is significant pride in being a group member. Eventually the group will cease to exist and move into the Adjourning stage. This stage should be graceful and supportive, not messy and destructive. The group needs a sense of closure; a time to pull accomplishments together and be recognized for a job well done.
42
Note that the first four stages of group development in Tuckman’s model form a cycle. As a group experiences a new task for the first time or the people in the group change, for example, they may well find they will move from the Performing to the Forming stage and start the cycle all over again. In fact, a group may backtrack to an earlier stage from any of the stages. A well functioning group will usually move through the stages back to the Performing stage fairly quickly, however. The transitioning of a group to the Adjourning stage can occur from any of the first four stages, but this would normally be a terminal transition, not returning to a previous stage.
2.2 Applications of Tuckman’s Model Although he presented it in his papers as a hypothesis or model, Tuckman’s stages have stood the test of time exceptionally well. Others referencing his work include Kivlighan and Goldfine [16], Lindell and Brandt [22], Neuman and Wright [25], Skopec and Smith [33], Strong et al. [36] and Sundstrom et al. [37]. These studies found that Tuckman’s model generally fit well in many different types of small groups, but none of them specifically looked at student programming teams. The model has also been used to understand agile programming projects; Lee [19] and Rowley and Lange [28] report that the model matched the development of their teams over a period of months very well. Wells [42] discusses the use of Tuckman’s model in understanding information systems student teams, but does not provide any data to support its applicability. While we hence consider it accepted fact that Tuckman’s model applies to most types of small groups, it is an open question whether it applies to student programming teams in particular.
3. RESEARCH AREA Although much was found in the literature about how to assemble teams, very little was found about what to expect from software development teams over time. No evidence was found in the literature of Tuckman’s stages of small group development model being directly used in a study to help evaluate the formation and interactions of software development teams in a college course setting. Since most people find his stages model easy to understand (as evidenced by the multitude of citations), we worked in this study to fill that gap.
This study was primarily an investigation to see if Tuckman’s stages model applies to software development teams in a college course setting. For purposes of this study, we used the following general definition of the Tuckman model:
• Over time, the team’s skill level rises
• Over time, the team’s enthusiasm level starts high, drops, and then returns to a high level.
A more detailed definition will be provided later.
To be able to compare and contrast team building and teamwork theory to the environment of a college course, data were gathered from the participants of a two-semester undergraduate computer science capstone course that involved teams as part of the course pedagogy.
4. METHOD The students in the selected course were asked to complete a series of periodic questionnaires throughout the year as well as a few short interviews about their experiences working in the course team. The periodic questionnaires were distributed and collected every one to two weeks and contained a list of twenty-four statements to which the participants were asked to agree or disagree using a five-point Likert scale. Half of the statements were selected to relate to skill level and the other half to relate to enthusiasm level. Sample statements include:
• I am currently very happy to be a part of my team.
• I am frustrated with one or more of my team members.
• All members on my team are working well together.
• I feel I have every skill I need for my project.
• I need to learn new skills to do my team job well.
• I need to improve my skills to do my team job well.
The first three of these sample statements were designed to evaluate the participant’s enthusiasm level, while the last three focused on their skill level. Note that statements were worded both positively and negatively so as to provide counter balancing of items and to permit checking for internal consistency, that is, checking that the items measure the same latent variable.
For coding purposes, the Likert scale was converted to a number ranging from negative two to positive two, where negative two represented an extreme lack of skill or enthusiasm, and positive two represented an extreme presence of skill or enthusiasm, depending on the statement.
A suitable questionnaire wase not found in the literature, and thus we developed one specifically for this study. Existing questionnaires, such as the Myers-Briggs Type Indicator (MBTI) [3], Minnesota Multiphasic Personality Inventory-2 (MMPI-2) [8] and Keirsey Temperament Sorter (KTS) [5] which assess personality or temperament, were either deemed to be too extensive1 (and thus would take too long to administer), or not inclusive of the study’s need to measure skill and enthusiasm levels of team members.
The questionnaire we developed was verified for internal consistency using a maximum likelihood factor analysis with varimax rotation. However, validity has not yet been established to show that it actually measures skill and enthusiasm levels.
Short interviews were conducted with the student participants, as needed, to clarify and augment the data. The course instructor was also asked to periodically provide their observations about the course’s teams’ formation and interactions.
5. DATA COLLECTION AND ANALYSIS Four teams were studied, consisting of two teams of four students each and two teams of five students each.
1 The MBTI contains 93 questions. The MMPI-2 contains 567
items. The Keirsey Temperament Sorter contains 70 questions.
43
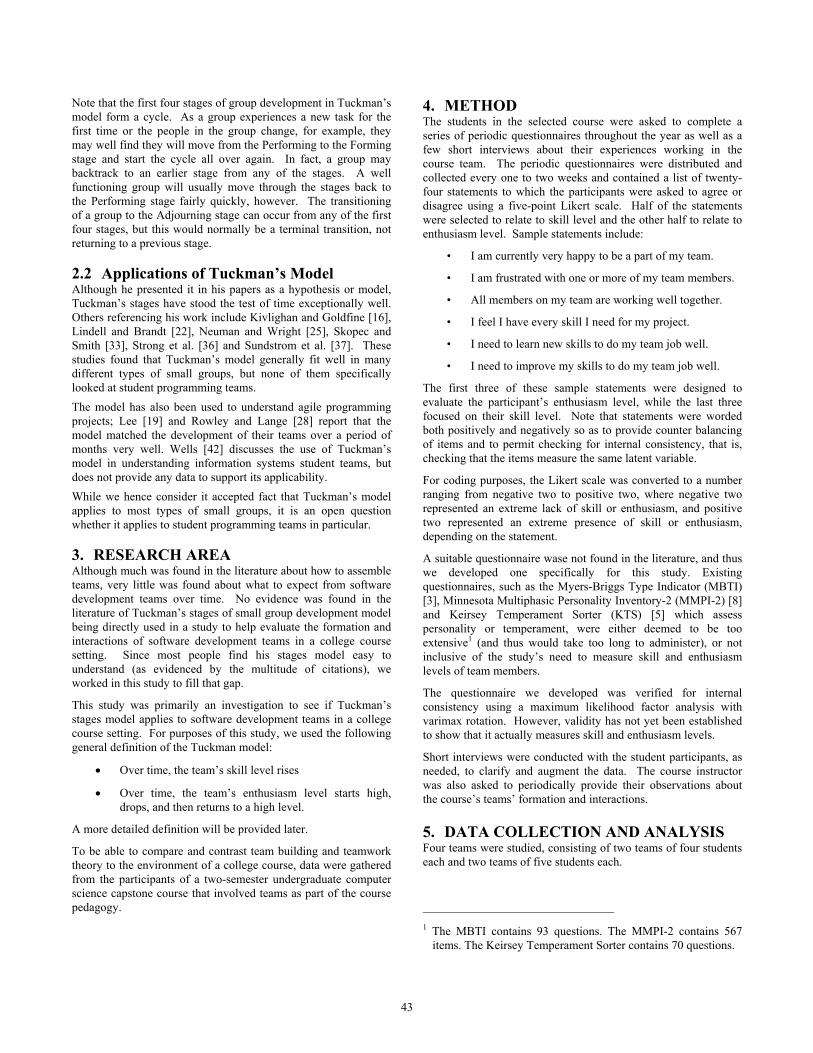
The periodic questionnaire had an overall completion rate of 74%. Figure 2 shows the completion rate for each of the trials. Because the periodic questionnaire was administered at the end of regular class sessions, the response rates are generally fairly high, since most students attended class most of the time. (The low completion rates for trials seven and eighteen can be attributed to administering those trials completely by e-mail. We are not sure why the completion rate for trial eleven was so low.)
Figure 2. Periodic questionnaire completion rates
5.1 Skill self-evaluation background research As data collection and preliminary data analysis commenced for this study, the participants’ skill level ratings were discovered to be unusually high compared to what was expected. This was especially evident on the first few trials, taken before the teams really knew what skills they would be utilizing and therefore did not know what they did not know. For example, at the start of the project, individuals were expected to rate their own skill levels low and then, over time, these ratings would rise as the individuals gained more experience and skills for the project at hand. The fact that the reported skill levels were high meant that either participants were overestimating their skill levels, or they truly had most of the skills they needed for the project. To explore the possibility that they were overestimating their skills, prior research was sought to gain an understanding of what was being observed.
Kruger and Dunning [17] found across four studies that if an individual’s actual test score placed them in the bottom two quartiles, the individual was very likely to overestimate their skill in the tested domain. If the individual fell into the bottom quartile, they tended to grossly overestimate their skill level. Interestingly, those individuals whose actual test scores placed them in the top quartile usually underestimated their abilities. It was those individuals that fell into the third quartile who were the most likely to come the closest to accurately estimating their abilities. Kruger and Denning’s studies tested individuals’ ability to recognize humor, to reason logically, and to produce and recognize written documents that met the standards of American Standard Written English. Regardless of which of these domains were being measured and how skilled the individuals actually were, the individuals tended to rate themselves roughly between
the 55th and 75th percentiles. It seems the less they knew the more they thought they knew in relation to others, or stated differently, they did not know what they did not know!
Larres et al. [29] studied the validity of self-assessment by measuring computer literacy among beginning accounting degree undergraduates. The results of their study indicated a significant overestimation of skills by most students compared to their actual computer literacy as measured by an objective test. The study also found that the more-capable students’ self-assessments were much closer to their actual computer literacy. Similarly, in a study that sought to assess basic IT skills in first-year undergraduate students in medical sciences, Sieber [32] also found that students overestimated their skill levels. This was especially true of the weaker students.
More careful analysis will need to be performed to fully understand this phenomenon. As we will show later, most of the teams did not report a significant increase in team skill levels over time. This could mean they had most of the required skills and their skill levels did not change. The other (more likely) possibility however, is that the team skill levels did in fact increase, but as the true skill level increased the perceived – and thus reported – skill level dropped proportionally, thus the reported skill level stayed substantially the same.
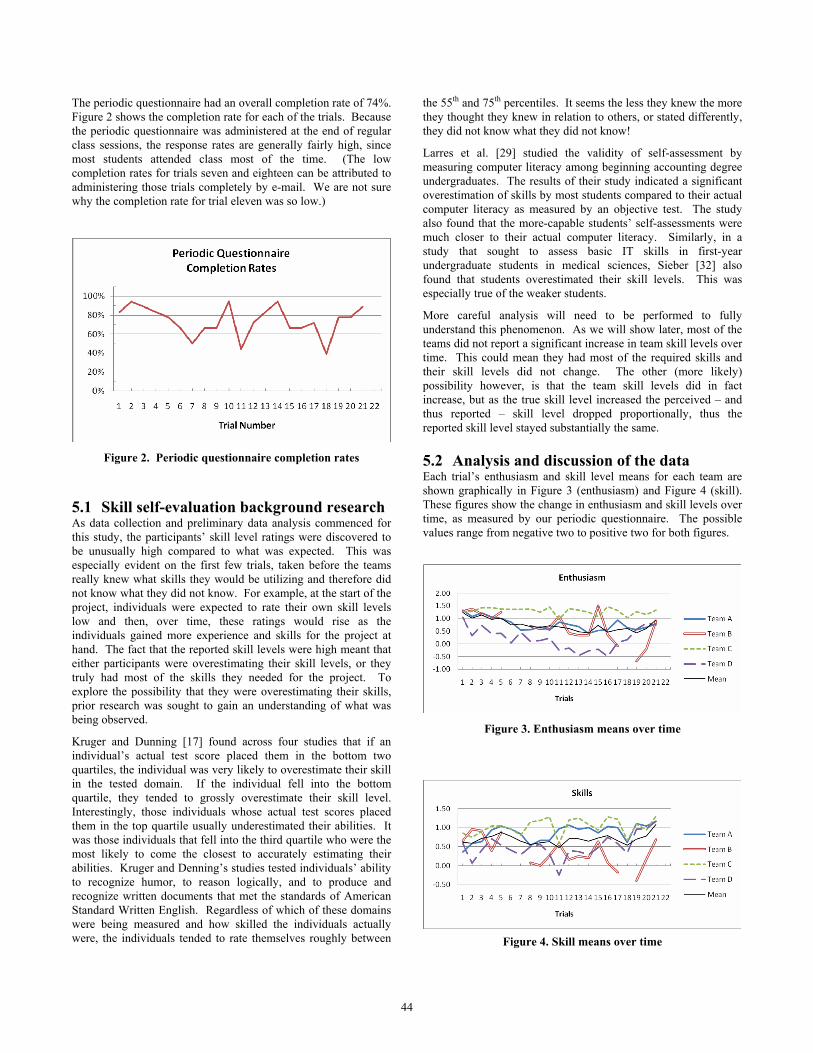
5.2 Analysis and discussion of the data Each trial’s enthusiasm and skill level means for each team are shown graphically in Figure 3 (enthusiasm) and Figure 4 (skill). These figures show the change in enthusiasm and skill levels over time, as measured by our periodic questionnaire. The possible values range from negative two to positive two for both figures.
Figure 3. Enthusiasm means over time
Figure 4. Skill means over time
44

And finally, the enthusiasm and skill level means for each team are shown together over time in Figure 5 through Figure 8 by using a two trial moving mean to smooth the line. Tuckman theorized in his stages of small group development model [38, 39] that when a group is in the Forming stage, they will have high enthusiasm and low skills. Next, in the Storming stage, their enthusiasm drops and they still have low skills. Their enthusiasm and skills rise in the Norming stage, and both move to a high level in the Performing stage. Thus, if a team precisely followed Tuckman’s model through one cycle, they would start in the lower right quadrant of Figure 5 through Figure 8 and progress through each quadrant in a clockwise direction, ending in the upper right quadrant. None of the subject teams exhibited this pattern precisely, although some generally followed the pattern. This is especially easy to see if only the last half of the trials are considered. When reviewing other collected data, possible explanations for the departure from the “Tuckman curve” come to light and are discussed below.
Figure 5. . Enthusiasm and skill means over time - Team A
Figure 6. Enthusiasm and skill means over time - Team B
Figure 7. Enthusiasm and skill means over time - Team C
Figure 8. Enthusiasm and skill means over time - Team D
All of the teams showed a drop in enthusiasm as their projects progressed, which is consistent with Tuckman’s model. Most of the teams reported a mild to significant regaining of their enthusiasm level. Most of the teams showed a general increase in skills, which is also consistent with Tuckman’s stages, especially if they were over-estimated to begin with.
Possible skewing of the data from one trial to the next is likely for some of the teams because of the small size of each team. Even though the response rates have generally been high, with only four or five people on a team, missing one or two people’s opinions can make a noticeable difference in the team’s mean scores, especially if the missing data tended to normally be an outlier on the extremes.
To provide for a more precise analysis of the data, we established the following definition of the Tuckman model:
• Over time the team’s reported skill level will generally increase, ending higher than at the start.
45
• Over time, the team’s reported enthusiasm level will start high, drop, and then return to a high level.
We developed the following algorithm to identify enthusiasm patterns of teams that have at least progressed into Tuckman’s Norming stage after progressing through the Forming and Storming stages:
1. Identify the absolute minimum and maximum enthusiasm levels for the team.
2. Ensure the first trial is near the maximum: (maximum - minimum) * 90% < first trial ≤ maximum
3. Ensure the last trial is not too close to the minimum: (maximum - minimum) * 33% < last trial ≤ maximum
4. Ensure that the minimum and most other values are not near the maximum: value < (maximum - minimum) * 90%
Based on this definition, we see that all four teams follow the Tuckman model for Skill level, although Team B reported very little increase. When our earlier discussion about inflated self-assessment of skills and the likelihood that the teams were self-adjusting the scales by which they measured themselves over time is considered, Team B’s result may not be surprising.
While all the teams exhibited rising skill levels between start and end overall, the fact that three out of four reported lowered skill levels at some point in-between is unexplained.
Three of the teams satisfy our requirements for Enthusiasm, based on this definition. Team C fails to meet the requirements only because its first trial is less than the allowed threshold.
Since trial values are self-reported based on a relative scale, it is hard to compare one team's absolute values to another team's. Instead, we base the determination of the patterns on percentages based on each team's minimum value (0%) and maximum value (100%). The general patterns are comparable.
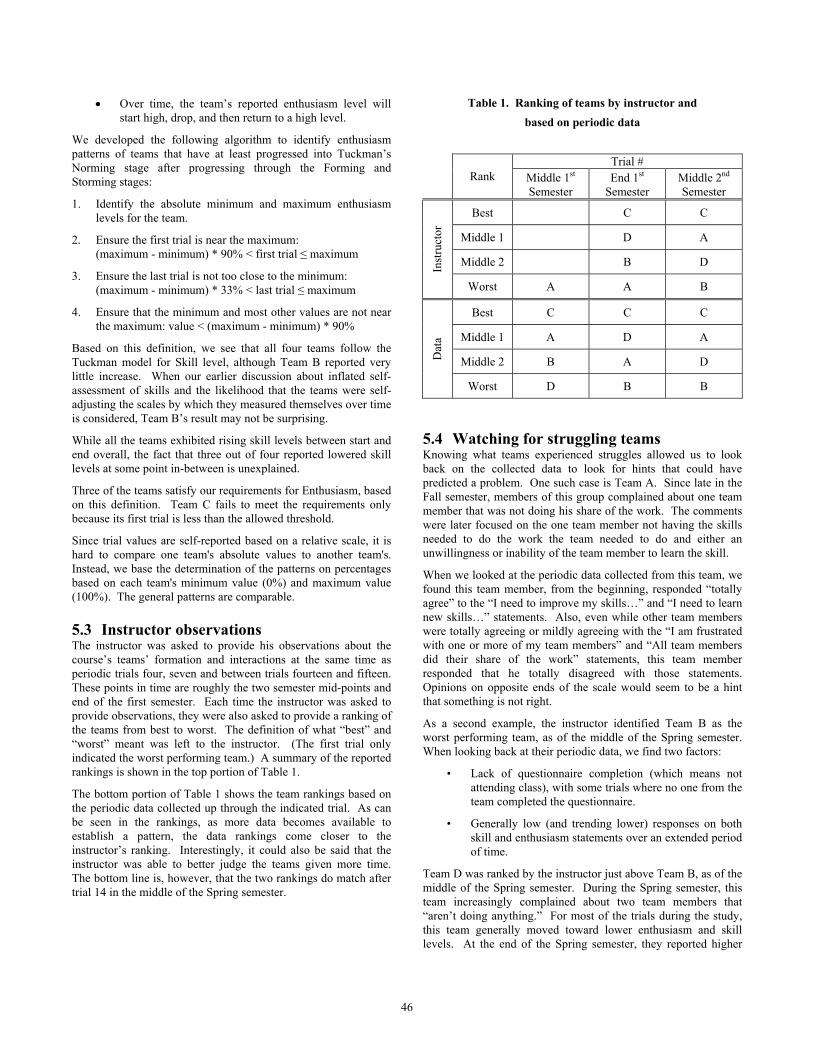
5.3 Instructor observations The instructor was asked to provide his observations about the course’s teams’ formation and interactions at the same time as periodic trials four, seven and between trials fourteen and fifteen. These points in time are roughly the two semester mid-points and end of the first semester. Each time the instructor was asked to provide observations, they were also asked to provide a ranking of the teams from best to worst. The definition of what “best” and “worst” meant was left to the instructor. (The first trial only indicated the worst performing team.) A summary of the reported rankings is shown in the top portion of Table 1.
The bottom portion of Table 1 shows the team rankings based on the periodic data collected up through the indicated trial. As can be seen in the rankings, as more data becomes available to establish a pattern, the data rankings come closer to the instructor’s ranking. Interestingly, it could also be said that the instructor was able to better judge the teams given more time. The bottom line is, however, that the two rankings do match after trial 14 in the middle of the Spring semester.
Table 1. Ranking of teams by instructor and based on periodic data
Trial # Rank Middle 1st
Semester End 1st
Semester Middle 2nd Semester
Best C C
Middle 1 D A
Middle 2 B D Inst
ruct
or
Worst A A B
Best C C C
Middle 1 A D A
Middle 2 B A D Dat
a
Worst D B B
5.4 Watching for struggling teams Knowing what teams experienced struggles allowed us to look back on the collected data to look for hints that could have predicted a problem. One such case is Team A. Since late in the Fall semester, members of this group complained about one team member that was not doing his share of the work. The comments were later focused on the one team member not having the skills needed to do the work the team needed to do and either an unwillingness or inability of the team member to learn the skill.
When we looked at the periodic data collected from this team, we found this team member, from the beginning, responded “totally agree” to the “I need to improve my skills…” and “I need to learn new skills…” statements. Also, even while other team members were totally agreeing or mildly agreeing with the “I am frustrated with one or more of my team members” and “All team members did their share of the work” statements, this team member responded that he totally disagreed with those statements. Opinions on opposite ends of the scale would seem to be a hint that something is not right.
As a second example, the instructor identified Team B as the worst performing team, as of the middle of the Spring semester. When looking back at their periodic data, we find two factors:
• Lack of questionnaire completion (which means not attending class), with some trials where no one from the team completed the questionnaire.
• Generally low (and trending lower) responses on both skill and enthusiasm statements over an extended period of time.
Team D was ranked by the instructor just above Team B, as of the middle of the Spring semester. During the Spring semester, this team increasingly complained about two team members that “aren’t doing anything.” For most of the trials during the study, this team generally moved toward lower enthusiasm and skill levels. At the end of the Spring semester, they reported higher
46
skill and enthusiasm levels. Based on the fact that complaints still continued to be reported, we do not believe that these team members started participating, but rather, we suspect, that the “working” team members simply decided to move on without their help and were resigned to the situation.
5.5 Observations Team C consisted of individuals that knew each other and had worked as a team prior to taking the studied course. This may explain the minimal movement of their enthusiasm and skill levels, as they likely moved into the Performing stage very quickly and stayed there. Team D struggled for the Fall semester, but apparently moved into the Performing stage very close to the end of the Spring semester and reported very high enthusiasm and skill levels compared to previous levels. Team B struggled both semesters, and may have only made it past the Storming stage as of the last trial. Team A may be a good example of a team that cycled through the Storming and Norming stages multiple times, and is possibly ready to move into the Performing stage as of the last trial.
6. CONCLUSIONS According to Tuckman’s stages of small group development model, the stage a team falls into can be determined by the combination of their enthusiasm and skill levels [4, 33, 38, 39]. This study was designed to be a quantification of his model. Data were collected from the members of each team via a periodic questionnaire (which was designed to collect self-assessed skill and enthusiasm levels) over the course of a two-semester undergraduate class. We showed that three out of four of the team’s data exhibited a pattern similar to the “Tuckman curve,” and thus conclude that the Tuckman model may be a good tool to use for teaching and monitoring team development.
We observed that Teams A, B and D all reported on the periodic questionnaires skill and enthusiasm levels in general and provided responses to specific statements in particular, that could easily be interpreted as indicators of struggling teams, based on participant reports of problems. In particular, we observed the following:
• Wide range of responses on a given statement
• Sequence of negative responses over multiple trials
• Continuous drop in responses over multiple trials
Note however, that although the periodic questionnaire was shown to be internally consistent, validity has not yet been established to show that it actually measures skill and enthusiasm levels.
7. DISCUSSION In the early data collection trials, the collected data provided some doubt about the applicability of Tuckman’s model. As the trials progressed, however, it has become clearer that the model does substantially fit. During the last half of the trials in this study, three of the four teams have reported behavior consistent with the classic “Tuckman curve,” albeit, stuck on the end of an atypical curve. Their self-reported skill level has generally risen over time, and their self-reported enthusiasm first dropped and then later rose as reported skill levels started to rise. Some of the
teams exhibited multiple cycles through the model. These behaviors are all consistent with the Tuckman model.
If an instructor is able to determine in what stage a team is, they will be better able to appropriately interact with that team. Additionally, team members, especially the team leader, may find it helpful to know what stage their team is in so as to better understand why the team is performing as it is.
A useful tool to monitor for struggling teams is a validated periodic questionnaire such as the one used in this study, or a similar instrument. Once an instrument such as this is proven valid and is administered and the collected data reviewed on a regular basis, how a team is progressing through the stages may be determined. Additionally, if a few members report significantly different opinions on some of the statements, it can be an indication that the team is struggling, or at least has a difference of opinion. Instructors or students can watch for the patterns mentioned in the conclusion.
8. IMPACT We analyzed the applicability of the Tuckman model of small group development to a college programming course and determined that, in the majority of cases studied, it does apply. We expect our study to have an impact on educational practice and future educational research because educators will be prepared to see the typical Tuckman stages in the teams that they advise. This will help them understand team progress and to react to it appropriately, e.g., by applying the teaching styles suggested for each stage by Tuckman. Specifically, the model may help educators to distinguish between normal difficulties in team development (e.g., in the Storming stage), and team difficulties that are abnormal and may require intervention by the instructor. This work will thus help educators to teach courses involving teamwork more effectively by helping them understand and control team development. Students will benefit by having a more rewarding teamwork experience with less avoidable difficulties in team development, and by learning more about team development itself, which may be of use in later teamwork situations in a job.
9. FUTURE WORK Much more about this subject can be explored. A discussion of a few of the areas follows.
9.1 Study skill self-evaluation bias Further work needs to be done to better understand the effect self-evaluation has on the data being collected. Reported skill levels in this study appear to be overestimated, especially at the beginning of the teams’ projects. A better way to assess the students’ skill level could be investigated. This study chose to utilize a short questionnaire that could be completed by the participants in three to five minutes each time it was administered. Perhaps there is a better approach that would still collect reliable data from the study participants while still minimizing the time and effort expended by the study participants. One possible solution is to see if a student’s recent (last two semesters) major GPA is indicative of their starting skill level for the course. If so, perhaps it can be used as an adjustment factor to the skill ratings they report on the periodic questionnaire.
47
9.2 Further analyze collected data Additional analysis of the collected data could result in more information. Major themes have been identified and reported in this study, but it is expected that much more is waiting to be discovered. For example, the emphasis of this study has been on teams and thus the data analysis has been performed at the team level. Since the data was collected at the participant level, further statistical analysis could be performed that is focused on the individual. Example areas to explore include:
• What functional effect, if any, does a pessimist or optimist have on a team?
• If one considers a pessimist to be at the opposite end of the scale from an optimist, it is expected that a pessimist’s periodic questionnaire responses will be more negative than an optimist’s. If this is true, the team’s mean ratings will be lower when the pessimist’s responses are included. If the pessimist does not complete the periodic questionnaire on a regular basis, the team’s mean ratings will fluctuate. The opposite effect would be expected for an optimist on the team.
9.3 Study additional teams To gain a clearer understanding of the applicability of Tuckman’s stages of small group development model to software development teams in a college course setting further research similar to this study is suggested. Additional software development teams could be studied from this university’s Department of Computer Science courses or from related departments, which also have a similar two semester capstone course sequence for their undergraduates. Additionally, other universities or colleges could be approached to conduct a similar study with their computer science students.
10. REFERENCES [1] Computing curricula 2001. J. Educ. Resour. Comput., 1, 3es
(2001), 1. [2] Job Outlook 2006-2010. National Association of Colleges
and Employers, 2005-2009. [3] My MBTI Results. 2010 [cited 2010 02/15/2010]; Available
from: http://www.myersbriggs.org/my-mbti-personality-type/my-mbti-results/.
[4] National youth leadership training: staff guide, staff development guide, syllabus. Boy Scouts of America, Irving, TX, 2004.
[5] Personality Test - Keirsey Temperment Website. 2010; Available from: http://www.keirsey.com/.
[6] Begel, A. and Simon, B. Struggles of new college graduates in their first software development job. In Proceedings of the 39th SIGCSE technical symposium on Computer science education (Portland, OR, USA, 2008). ACM.
[7] Beranek, G., Zuser, W. and Grechenig, T. Functional group roles in software engineering teams. SIGSOFT Softw. Eng. Notes, 30, 4 (2005), 1-7.
[8] Butcher, J. N., Dahlstrom, W. G., Graham, J. R., Tellegen, A. and Kaemmer, B. The Minnesota Multiphasic Personality Inventory-2 (MMPI-2): Manual for administration and
scoring. University of Minnesota Press, Minneapolis, MN, 1989.
[9] Chinn, D. and Vandegrift, T. Uncovering student values for hiring in the software industry. J. Educ. Resour. Comput., 7, 4 (2008), 1-25.
[10] Chong, J. and Hurlbutt, T. The Social Dynamics of Pair Programming. In Proceedings of the 29th international conference on Software Engineering (2007). IEEE Computer Society.
[11] Fox, M. A. and Hackerman, N. Evaluating and improving undergraduate teaching in science, technology, engineering, and mathematics. National Acedemic Press, City, 2003.
[12] Gorla, N. and Lam, Y. W. Who should work with whom?: building effective software project teams. Commun. ACM, 47, 6 (2004), 79-82.
[13] Guinan, P. J., Cooprider, J. G. and Faraj, S. Enabling Software Development Team Performance During Requirements Definition: a Behavioral Versus Technical Approach. Info. Sys. Research, 9, 2 (1998), 101-125.
[14] Hart, G. and Stone, T. Conversations with students: The outcomes of focus groups with QUT students. In Proceedings of the 2002 Annual International Conference of the Higher Education Research and Development Society of Australasia (HERDSA) (2002).
[15] Havill, J. T. and Ludwig, L. D. Technically speaking: fostering the communication skills of computer science and mathematics students. In Proceedings of the 38th SIGCSE technical symposium on Computer science education (Covington, Kentucky, USA, 2007). ACM.
[16] Kivlighan, D. M. and Goldfine, D. C. Endorsement of therapeutic factors as a function of stage of group development and participant interpersonal attitudes. Journal of Counseling Psychology, 38, 2 (1991), 150-158.
[17] Kruger, J. and Dunning, D. Unskilled and unaware of it: how difficulties in recognizing one's own incompetence lead to inflated self-assessments. Journal of personality and social psychology, 77, 6 (1999), 1121-1134.
[18] Lang, J. D., Cruse, S., McVey, F. D. and McMasters, J. Industry Expectations of New Engineers: A Survey to Assist Curriculum Designers. Journal of Engineering Education, 88, 1 (January 1999 1999), 43-51.
[19] Lee, E. C. Forming to Performing: Transitioning Large-Scale Project Into Agile. In Agile 2008 Conference (Toronto, 2008).
[20] Lencioni, P. Overcoming the Five Dysfunctions of a Team: A field guide for leaders, managers, and facilitators. Josey-Bass, San Francisco, CA, 2005.
[21] Licorish, S., Philpott, A. and MacDonell, S. G. Supporting agile team composition: A prototype tool for identifying personality (In)compatibilities. In Proceedings of the 2009 ICSE Workshop on Cooperative and Human Aspects on Software Engineering (2009). IEEE Computer Society.
[22] Lindell, M. K. and Brandt, C. J. Climate quality and climate consensus as mediators of the relationship between organizational antecedents and outcomes. Journal of Applied Psychology, 85, 3 (2000), 331-348.
48

[23] Liu, J., Marsaglia, J. and Olson, D. Teaching software engineering to make students ready for the real world. J. Comput. Small Coll., 18, 2 (2002), 43-50.
[24] Nerur, S., Mahapatra, R. and Mangalaraj, G. Challenges of migrating to agile methodologies. Commun. ACM, 48, 5 (2005), 72-78.
[25] Neuman, G. A. and Wright, J. Team effectiveness: Beyond skills and cognitive ability. Journal of Applied Psychology, 84, 3 (1999), 376-389.
[26] Redmond, M. A. A computer program to aid assignment of student project groups. In Proceedings of the thirty-second SIGCSE technical symposium on Computer Science Education (Charlotte, North Carolina, United States, 2001). ACM.
[27] Richards, D. Designing Project-Based Courses with a Focus on Group Formation and Assessment. Trans. Comput. Educ., 9, 1 (2009), 1-40.
[28] Rowley, D. and Lange, M. Forming to Performing: The Evolution of an Agile Team. In Agile 2007 Conference (Washington, DC, 2007).
[29] Rugarcia, A., Felder, R. M., Woods, D. R. and Stice, J. E. The Future of Engineering Education: Part 1. A Vision for a New Century. Chemical Engineering Education (CEE), 34, 1 (2000), 16-25.
[30] Rutherfoord, R. H. Using personality inventories to form teams for class projects: a case study. In Proceedings of the 7th conference on Information technology education (Minneapolis, Minnesota, USA, 2006). ACM.
[31] Seethamraju, R. and Borman, M. Influence of group formation choices on academic performance. Assessment & Evaluation in Higher Education, 34, 1 (2009), 31-40.
[32] Sieber, V. Diagnostic online assessment of basic IT skills in 1st-year undergraduates in the Medical Sciences Division, University of Oxford. British Journal of Educational Technology, 40, 2 (2009), 215-226.
[33] Skopec, E. W. and Smith, D. M. How to use team building to foster innovation throughout your organization Contemporary Books, Lincolnwood, Ill, 1997.
[34] Smarkusky, D., Dempsey, R., Ludka, J. and Quillettes, F. d. Enhancing team knowledge: instruction vs. experience. In Proceedings of the 36th SIGCSE technical symposium on Computer science education (St. Louis, Missouri, USA, 2005). ACM.
[35] Steenkamp, A. L. A Standards-Based Approach to Team-Based Student Projects in an Information Technology Curriculum, 2002.
[36] Strong, S. R., Welsh, J. A., Corcoran, J. L. and Hoyt, W. T. Social psychology and counseling psychology: The history, products, and promise of an interface. Journal of Counseling Psychology, 39, 2 (1992), 139-157.
[37] Sundstrom, E., de Meuse, K. P. and Futrell, D. Work teams: Applications and effectiveness. American Psychologist, 45, 2 (1990), 120-133.
[38] Tuckman, B. W. Developmental sequence in small groups. Psychological Bulletin, 63, 6 (1965), 384-399.
[39] Tuckman, B. W. and Jensen, M. A. C. Stages of Small-Group Development Revisited. Group & Organization Studies, 2, 4 (1977), 419-427.
[40] Waite, W. M., Jackson, M. H., Diwan, A. and Leonardi, P. M. Student culture vs group work in computer science. In Proceedings of the 35th SIGCSE technical symposium on Computer science education (Norfolk, Virginia, USA, 2004). ACM.
[41] Walker, E. L. and Slotterbeck, O. A. Incorporating realistic teamwork into a small college software engineering curriculum. J. Comput. Small Coll., 17, 6 (2002), 115-123.
[42] Wells, C. E. Teaching Teamwork in Information Systems. In Challenges of information technology education in the 21st century, edited by E. B. Cohen. Idea Group Publishing, Hershey, PA, 2002.
49