yemen development
TRANSCRIPT
YemenDevelopment Policy Review
Yemen
Develo
pm
ent P
olicy R
eviewT
HE
WO
RLD
BA
NK
10414-CoverFINAL.qxd 4/17/08 11:13 AM Page 1
43600
Pub
lic D
iscl
osur
e A
utho
rized
Pub
lic D
iscl
osur
e A
utho
rized
Pub
lic D
iscl
osur
e A
utho
rized
Pub
lic D
iscl
osur
e A
utho
rized

YemenDevelopment Policy Review
10414-00_FM.qxd 4/17/08 11:09 AM Page i

10414-00_FM.qxd 4/17/08 11:09 AM Page ii
YemenDevelopment Policy Review
Report No. 35393-RY
Social and Economic Development Sector UnitMiddle East and North Africa Region
10414-00_FM.qxd 4/17/08 11:09 AM Page iii

10414-00_FM.qxd 4/17/08 11:09 AM Page iv

E X E C U T I V E S U M M A R Y . . . . . . . . . . . . . . . . . . . . . . . . . . . . . . . . . . . . . . xiii
Yemen Today: Mixed Development Outcomes . . . . . . . . . . . . . . . . . . . . . . 1Macroeconomic Outcomes . . . . . . . . . . . . . . . . . . . . . . . . . . . . . . . . . . . . . . . 2Poverty and Unemployment Outcomes. . . . . . . . . . . . . . . . . . . . . . . . . . . . . 5Social Outcomes . . . . . . . . . . . . . . . . . . . . . . . . . . . . . . . . . . . . . . . . . . . . . . . 6Achievability of the Millennium Development Goals (MDGs) . . . . . . . . . . 7Implementation of the Poverty Reduction Strategy. . . . . . . . . . . . . . . . . . . . 8Priorities for Reform . . . . . . . . . . . . . . . . . . . . . . . . . . . . . . . . . . . . . . . . . . . . 9
Yemen Tomorrow: Prospects For Good Governance and Economic Growth . . . . . . . . . . . . . . . . . . . . . . . . . . . . . . . . . . . . . . . . . . . . . 11The Quality of Governance . . . . . . . . . . . . . . . . . . . . . . . . . . . . . . . . . . . . . . 11Understanding Yemen’s Poor Governance. . . . . . . . . . . . . . . . . . . . . . . . . . 12Understanding Yemen’s Recent Economic Experience . . . . . . . . . . . . . . . . 16Building the Will for Reform. . . . . . . . . . . . . . . . . . . . . . . . . . . . . . . . . . . . . 20
Maintaining Fiscal Sustainability . . . . . . . . . . . . . . . . . . . . . . . . . . . . . . . . 23Yemen’s track record on fiscal sustainability . . . . . . . . . . . . . . . . . . . . . . . . 23Medium term outlook . . . . . . . . . . . . . . . . . . . . . . . . . . . . . . . . . . . . . . . . . . 31Perilously Increasing Public Debt . . . . . . . . . . . . . . . . . . . . . . . . . . . . . . . . . 38External Debt Sustainability Critically Depends on Oil Price Trajectories . . . 40The Reform Agenda to Maintain Fiscal Balance. . . . . . . . . . . . . . . . . . . . . . 40
Improving the Investment Climate . . . . . . . . . . . . . . . . . . . . . . . . . . . . . . . 43The Reform Agenda to Improve the Investment Climate . . . . . . . . . . . . . . 48
4
3
2
1
v
Contents
10414-00_FM.qxd 4/17/08 12:14 PM Page v

Managing Energy Resources . . . . . . . . . . . . . . . . . . . . . . . . . . . . . . . . . . . . 51Conditions and Challenges in the Oil and Gas Sectors . . . . . . . . . . . . . . . 51The Reform Agenda for Oil and Gas. . . . . . . . . . . . . . . . . . . . . . . . . . . . . . . 52Conditions and Challenges in the Power Sector . . . . . . . . . . . . . . . . . . . . . 55The Reform Agenda in the Power Sector . . . . . . . . . . . . . . . . . . . . . . . . . . . 58
Managing Water Resources . . . . . . . . . . . . . . . . . . . . . . . . . . . . . . . . . . . . . 61Challenges in the Water Sector . . . . . . . . . . . . . . . . . . . . . . . . . . . . . . . . . . . 62The Reform Agenda for Water Resources . . . . . . . . . . . . . . . . . . . . . . . . . . . 66
Slowing Population Growth . . . . . . . . . . . . . . . . . . . . . . . . . . . . . . . . . . . . . 69The Reform Agenda for Population Policy. . . . . . . . . . . . . . . . . . . . . . . . . . 73
7
6
5
vi C O N T E N T S
10414-00_FM.qxd 4/17/08 12:15 PM Page vi

List of Figures
1 GDP Growth Over Recent Reform Periods . . . . . . . . . . . . . . . . . . . . . . . . . xiii2 Oil Production in Yemen. . . . . . . . . . . . . . . . . . . . . . . . . . . . . . . . . . . . . . . . xv3 Quality of Governance in Yemen . . . . . . . . . . . . . . . . . . . . . . . . . . . . . . . . xvii4 Fertility in Yemen . . . . . . . . . . . . . . . . . . . . . . . . . . . . . . . . . . . . . . . . . . . . xviii1.1 Risk of Internal Conflict and Quality of Governance . . . . . . . . . . . . . . . . . . 31.2 Domestic Investment, percentage of GDP . . . . . . . . . . . . . . . . . . . . . . . . . . . 31.3 Foreign Direct Investment . . . . . . . . . . . . . . . . . . . . . . . . . . . . . . . . . . . . . . . . 42.1 Quality of Governance in yemen, 1996-2004 . . . . . . . . . . . . . . . . . . . . . . . 122.2 Quality of Governance in Yemen and Comparator Countries . . . . . . . . . . 133.1 Overall fiscal balance and oil Revenues . . . . . . . . . . . . . . . . . . . . . . . . . . . . 243.2 Primary non-oil balance (% of gdp) . . . . . . . . . . . . . . . . . . . . . . . . . . . . . . 243.3 Primary Non-Oil Balance, with and without subsidies (% of gdp) . . . . . . 263.4 Oil Subsidies and Oil Prices . . . . . . . . . . . . . . . . . . . . . . . . . . . . . . . . . . . . . 263.5 Indirect Tales and Subsidies (% of gdp) . . . . . . . . . . . . . . . . . . . . . . . . . . . 273.6 Saving From Oil Revenue . . . . . . . . . . . . . . . . . . . . . . . . . . . . . . . . . . . . . . . 283.7 Oil Revenue and Expenditures (% of GDP). . . . . . . . . . . . . . . . . . . . . . . . . 293.8 Current Expenditure Breakdown . . . . . . . . . . . . . . . . . . . . . . . . . . . . . . . . . 293.9 Exports and the Real Effective Exchange Rate . . . . . . . . . . . . . . . . . . . . . . . 303.10 Evolution of External Debt . . . . . . . . . . . . . . . . . . . . . . . . . . . . . . . . . . . . . . 303.11 Evolution of Arrears. . . . . . . . . . . . . . . . . . . . . . . . . . . . . . . . . . . . . . . . . . . . 31 3.12 Government Revenue . . . . . . . . . . . . . . . . . . . . . . . . . . . . . . . . . . . . . . . . . . 333.13 Government Expenditure . . . . . . . . . . . . . . . . . . . . . . . . . . . . . . . . . . . . . . . 333.14 Real GDP Growth by Sector . . . . . . . . . . . . . . . . . . . . . . . . . . . . . . . . . . . . . 343.15 Oil and Non-Oil GDP Growth . . . . . . . . . . . . . . . . . . . . . . . . . . . . . . . . . . . 343.16 Poverty Headcount Ratio. . . . . . . . . . . . . . . . . . . . . . . . . . . . . . . . . . . . . . . . 353.17 Fixed Investment By Sector . . . . . . . . . . . . . . . . . . . . . . . . . . . . . . . . . . . . . . 363.18 Direct Foreign Investment . . . . . . . . . . . . . . . . . . . . . . . . . . . . . . . . . . . . . . . 373.19 Projected Balance of Payments . . . . . . . . . . . . . . . . . . . . . . . . . . . . . . . . . . . 373.20 Yemen Oil Price . . . . . . . . . . . . . . . . . . . . . . . . . . . . . . . . . . . . . . . . . . . . . . . 383.21 Indicators of Public Debt Under Alternative Scenarios . . . . . . . . . . . . . . . . 393.22 Indicators of Public and Publicly Guaranteed External Debt
Under Alternative Scenarios . . . . . . . . . . . . . . . . . . . . . . . . . . . . . . . . . . . . . 414.1 Leading Investment Climate Constraints . . . . . . . . . . . . . . . . . . . . . . . . . . . 444.2 ranking of cost of doing business indicators . . . . . . . . . . . . . . . . . . . . . . . . 455.1 Infrastructure Interruptions—2001 and 2005 . . . . . . . . . . . . . . . . . . . . . . . 565.2 Yemen: Electricity Demand Forecast (2005-20) . . . . . . . . . . . . . . . . . . . . . 577.1 Total Fertility Rate . . . . . . . . . . . . . . . . . . . . . . . . . . . . . . . . . . . . . . . . . . . . . 70
List of Tables
1.1 Yemen: Sectoral Contribution to Real GDP, 1991-2004 (%) . . . . . . . . . . . . 41.2 Poverty Lines and Poverty Measures: 1992-1998. . . . . . . . . . . . . . . . . . . . . . 53.1 Non-Oil Exports Growth. . . . . . . . . . . . . . . . . . . . . . . . . . . . . . . . . . . . . . . . 325.1 Yemen—Petroleum Product Subsidies. . . . . . . . . . . . . . . . . . . . . . . . . . . . . 53
C O N T E N T S vii
10414-00_FM.qxd 4/17/08 12:16 PM Page vii
5.2 Power Interruptions and Generator Supply, 2005. . . . . . . . . . . . . . . . . . . . 566.1 Water Withdrawal by Using Sector in Yemen and Comparators, 1998-2002
(In Percent of Total) . . . . . . . . . . . . . . . . . . . . . . . . . . . . . . . . . . . . . . . . . . . 626.2 Reaching the Water Sector MDGs . . . . . . . . . . . . . . . . . . . . . . . . . . . . . . . . . 64
List of Boxes
3.1 Fiscal Sustainability Analysis for Oil-Rich Countries. . . . . . . . . . . . . . . . . . 253.2 Promoting Non-Oil Exports . . . . . . . . . . . . . . . . . . . . . . . . . . . . . . . . . . . . . 327.1. Lessons from MENA Countries that have Progressed Rapidly
in Fertility Control . . . . . . . . . . . . . . . . . . . . . . . . . . . . . . . . . . . . . . . . . . . . . 71
E N D N O T E S . . . . . . . . . . . . . . . . . . . . . . . . . . . . . . . . . . . . . . . . . . . . . . . . . . . . . . 75
R E F E R E N C E S . . . . . . . . . . . . . . . . . . . . . . . . . . . . . . . . . . . . . . . . . . . . . . . . . . . . 79
List of Appendix Tables
A1 GDP at Producers Prices by Economic Activity (in 1990 Constant Prices), 1990–2004 (Million Yemeni Rials) . . . . . . . . . . . . . . . . . . . . . . . . . . . . . . . 86
A2 GDP at Producers Prices by Economic Activity (in Current Prices), 1990–2004 (Million Yemeni Rials) . . . . . . . . . . . . . . . . . . . . . . . . . . . . . . . 88
A3 GDP by Expenditure ( in Current Prices), 1990–2004 (Million Yemeni Rials) . . . . . . . . . . . . . . . . . . . . . . . . . . . . . . . . . . . . . . . . . 90
A4 Investment by sector (in percent of GDP) . . . . . . . . . . . . . . . . . . . . . . . . . . 90A5 Republic of Yemen: Central Government Finance, 1990–2004 . . . . . . . . . 92A6 Republic of Yemen: Balance of Payments (Analytic Presentation),
1990–2004. . . . . . . . . . . . . . . . . . . . . . . . . . . . . . . . . . . . . . . . . . . . . . . . . . . 96A7 Republic of Yemen: Prices, 1990–2004 . . . . . . . . . . . . . . . . . . . . . . . . . . . . 98A8 Republic of Yemen—Key Exposure Indicators, 1990–2004 . . . . . . . . . . . . 98A9 Republic of Yemen: Select Governance Indicators, 1994–2006 . . . . . . . . 100A10 Alternative Governance indicators for Yemen, 1996–2004 . . . . . . . . . . . 101A11 Projections for Selected Economic Indicators: No Adjustment Scenario,
2005–25 . . . . . . . . . . . . . . . . . . . . . . . . . . . . . . . . . . . . . . . . . . . . . . . . . . . . 102A12 Projections for Selected Economic Indicators: Most Recent Base Case
Scenario, 2005–25. . . . . . . . . . . . . . . . . . . . . . . . . . . . . . . . . . . . . . . . . . . . 106A13 Projections for Selected Economic Indicators: Low Oil Price Scenario,
2005–25 . . . . . . . . . . . . . . . . . . . . . . . . . . . . . . . . . . . . . . . . . . . . . . . . . . . . 110A14 Country: External Debt Sustainability Framework, Baseline Scenario,
2006–2026 (in percent of GDP). . . . . . . . . . . . . . . . . . . . . . . . . . . . . . . . . 112A15 Country Sensitivity Analyses for Key Indicators of Public and
Publicly Guaranteed External Debt, 2006–25 (in percent). . . . . . . . . . . . 116A16 Yemen: Public Sector Debt Sustainability Framework, Baseline Scenario,
2006–2026 (in percent of GDP). . . . . . . . . . . . . . . . . . . . . . . . . . . . . . . . . 120A17 Yemen: Sensitivity Analysis for Key Indicators of
Public Debt 2006–2025 . . . . . . . . . . . . . . . . . . . . . . . . . . . . . . . . . . . . . . . 124A18 Millennium Development Goals for Yemen, 1990–2004 . . . . . . . . . . . . 126A19 Progress under the first poverty reduction strategy in
Yemen, 2003–05 . . . . . . . . . . . . . . . . . . . . . . . . . . . . . . . . . . . . . . . . . . . . . 128A20 Specific measures to reduce fertility and maternal mortality in Yemen . . . . 129
viii C O N T E N T S
10414-00_FM.qxd 4/17/08 12:16 PM Page viii
CURRENCY AND EQUIVALENTS(As of March 27, 2006)
Currency Unit – Yemeni Rial (YR)US$1 = YR 196
FISCAL YEARJanuary 1-December 31
AFMIS Accounting and Financial Management System
AFPPF Agriculture and Fisheries Production Promotion Fund
A21A Agenda 21 for Agriculture
COCA Central Organization for Control and Audit
CM Certified Midwife
CPIA Country Policy and Institutional Assessment
DFID Department for International Development
DHS Demographic and Household Survey
EITI Extractive Industries Transparency Initiative
EIU The Economic Intelligence Unit
ERF Economic Research Forum
ERP Economic Reform Program
ESMAP Energy Sector Management Assistance Program
FDI Foreign Direct Investment
FHS Family health Survey
FP Family Planning
GAREW-GARWSP General Authority for Rural Water
ix
Acronyms and Abbreviations
10414-00_FM.qxd 4/17/08 11:09 AM Page ix
GCC Gulf Cooperation Council
GDI Gender Development Index
GDP Gross domestic product
GEF Global Environmental Facility
GoY Government of Yemen
GPC General People’s Congress
GST General Sales Tax
HBS Household Budget Survey
HCC Higher Committee for Coordination
HD Human Development
HDI Human Development Index
HIS Health Information System
HU Health Unit
ICA Investment Climate Assessment
IDA International Development Association
IEC Information, Education, and Communication
IMCI Integrated Management of Childhood Illnesses
IMF International Monetary Fund
IMR Infant Mortality Rate
JIA Judicial Inspection Authority
KAP Knowledge, Attitude and Practice
KIT Royal Tropical Institute
KKM Kaufmann, Kraay and Mastruzzi
LAEO Literacy and Adult Education Organization
LC Local Corporations
LDA Local Development Association
MAI Ministry of Agriculture and Irrigation
MCA Millennium Challenge Account
MDGs Millennium Development Goals
MENA Middle East and North Africa
MNA Middle East and North Africa
MNSIF Middle East and North Africa Finance, Private Sector and
Infrastructure Department
MoCS Ministry of Civil Service
MoE Ministry of Education
MoF Ministry of Finance
MoJ Ministry of Justice
MoPHP Ministry of Population and Public Health
x A C R O N Y M S A N D A B B R E V I A T I O N S
10414-00_FM.qxd 4/17/08 11:09 AM Page x
MMR Maternal Mortality Rate
MWE Ministry of Water and Environment
NGOs Non Governmental Organizations
NPC National Population Council
NPP National Population Policy
NWRA National Water Resources Authority
NWSA National Water and Sanitation Authority
NWSSIP National Water Sector Strategic Investment Plan
ORS Oral Rehydration Solution
PAP Population Action Program
PDRY People’s Democratic Republic of Yemen
PEC Public Electricity Corporation
PFM Public Financial Management
PRS Poverty Reduction Strategy
PRSP Poverty Reduction Strategy Paper
PSA Production Sharing Agreements
PSP Private Sector participation
PWP Public Work Program
RH Reproductive Health
SFD Social Fund for Development
SDP Service Delivery Points
SJC Supreme Judicial Council
TFR Total Fertility Rate
UAE United Arab Emirates
UN United Nations
UNDP United Nations Development Program
UNESCO United Nations Educational, Scientific and Cultural
Organization
UNICEF United Nations Children’s Fund
US United States
GST General Sales Tax
WB World Bank
WHO World Health Organization
YAR Yemen Arab Republic
YEM Yemen
YR Yemeni Rial
YSV Yemen Strategic Vision
A C R O N Y M S A N D A B B R E V I A T I O N S xi
10414-00_FM.qxd 4/17/08 11:09 AM Page xi
Vice President Daniela GressaniCountry Director Emmanuel Mbi
Chief Economist & Sector Director Mustapha K. NabliSector Manager Miria Pigato
Task Manager Srinivasan Thirumalai
Team Members. Isabelle Chaal (Team Assistance), Ingrid Ivins (MacroeconomicAnalysis), Thilakaratna Ranaweera (Macroeconomic Projections and Scenarios),Carolin Geginat (Debt Sustainability Analysis), Hadi Esfahani (Political Economyof Reforms), GV Rao (Research and Database), Irina Shaorshadze (Research Assis-tance), Claudia Nassif (Judicial, Legal Reforms and Land Registration, Fisheries),Gail Richardson and Sharon Beatty (Population Policy), Jonathan Walters, TjaardaP. Strom Van Leeuven, Somin Mukherjee, Pierre Audinet (Energy Sector issues),Maher F. Abu-Taleb, Naji Abu-Hatim (Water). Yahia Alanssi provided valuablehelp in facilitating country consultations. Hadi Esfahnai, professor at University ofIllinois at Urbana-Champaign and Sharon Beatty, consultant provided backgroundpapers on political economy of reforms and population policy, respectively. Spe-cial thanks to Mustapha Rouis, Country Manager, Yemen, and peer reviewers BrianPinto and Dorsati Madani for valuable suggestions in guiding the work. EmmanuelMbi, Mustapha K. Nabli, Miria Pigato and Farrukh Iqbal provided critical com-ments and guidance in writing the report.
The team wishes to thank Dr. Mutahar Al-Abassy and Dr. Yahya Mutawakeel andhis team for providing valuable insights in the early stages of the work and for com-menting on the final draft. The DPR team owes it thanks also to government offi-cials, business leaders, parliamentarians and members of civil society for providingvaluable information and interview during DPR mission and for feedback duringconsultation on early results presented in Yemen Roundtable on Growth, Employ-ment and Social Progress, April 9-10, Sanaa, Yemen and a series of three workshopsin conjunction with Country Assitance Strategy consultation held from November19-22, 2005 in Aden and Sanaa, Yemen.
xii A C R O N Y M S A N D A B B R E V I A T I O N S
10414-00_FM.qxd 4/17/08 11:09 AM Page xii
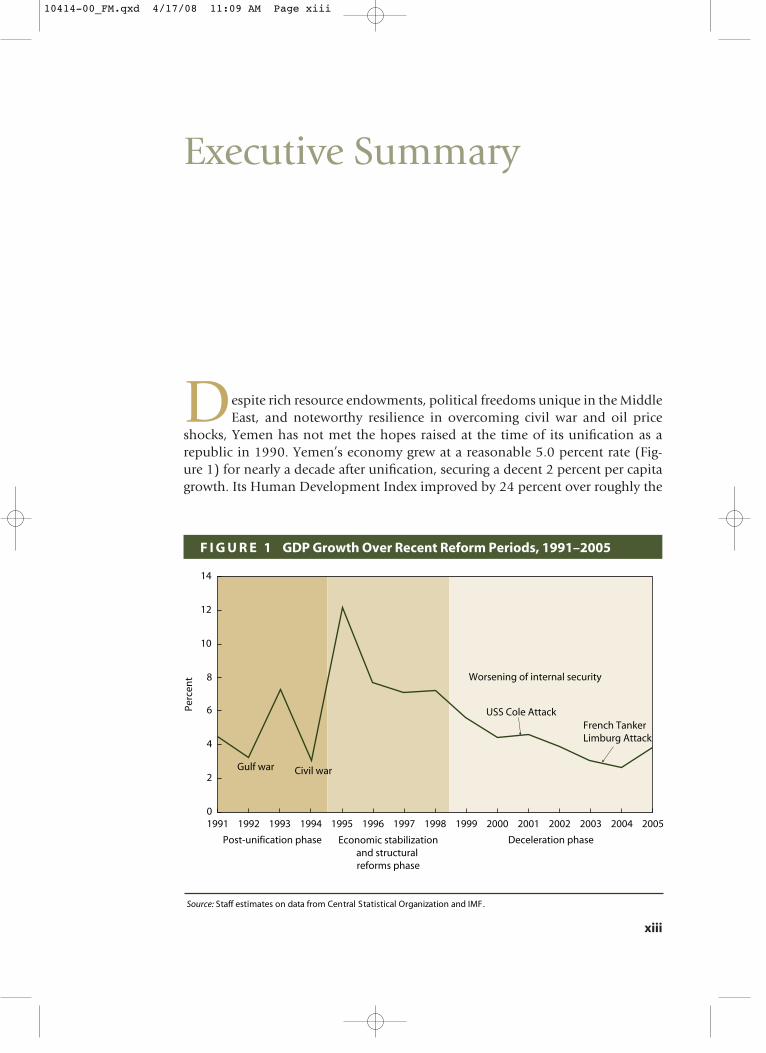
Despite rich resource endowments, political freedoms unique in the MiddleEast, and noteworthy resilience in overcoming civil war and oil price
shocks, Yemen has not met the hopes raised at the time of its unification as arepublic in 1990. Yemen’s economy grew at a reasonable 5.0 percent rate (Fig-ure 1) for nearly a decade after unification, securing a decent 2 percent per capitagrowth. Its Human Development Index improved by 24 percent over roughly the
xiii
Executive Summary
F I G U R E 1 GDP Growth Over Recent Reform Periods, 1991–2005
0
2
4
6
8
10
12
14
Perc
ent
1996
Post-unification phase Economic stabilizationand structural reforms phase
Deceleration phase
Worsening of internal security
USS Cole Attack
Gulf war Civil war
Source: Staff estimates on data from Central Statistical Organization and IMF.
20052004200320022001200019991991 1992 1993 1994 199819971995
French Tanker Limburg Attack
10414-00_FM.qxd 4/17/08 11:09 AM Page xiii
same period, reaching 0.489 by 2003—the second highest improvement for allcountries with low human development.1 Now, however, Yemen has lost momen-tum and trails behind most countries in important dimensions of development.
Today, Yemen is the second poorest country in the Middle East and NorthAfrica region, with 42 percent of its population counted as poor in 1998. GDP hasstagnated at around US$530 per capita in real terms since 2002. Unemployment,estimated at 11.5 percent in 1999, is expected to have worsened as the populationhas climbed at 3 percent a year and the labor force has burgeoned. Extreme genderinequalities persist. Malnutrition is so severe that Yemeni children suffer theworld’s second worst stunting in growth. And natural resources are increasinglyconstrained. Two-thirds of Yemen’s known oil reserves were depleted by 2003, andproduction has already begun to decline and will plummet by 2012 if no newreserves are discovered. Freshwater is also increasingly scarce: per capita avail-ability in Yemen is about 2 percent of the world average and projected to dimin-ish by a third in the next 20 years because of the expected increase in population.
Growth of gross domestic product has slowed as reforms have stalled
Compounding these economic, social, and resource problems are Yemen’s policyand institutional failings, which have prompted donors to cut aid. Yemen receiveda meager US$13 in development assistance per capita in 2004. In 2005, the Devel-opment Assistance Committee cut IDA 14 (2006–08) allocations to Yemen bynearly a third, and the U.S. government’s Millennium Challenge Corporationsuspended Yemen’s eligibility for assistance because of its worsening corruption,regulatory quality, and fiscal policies.
All of these identified challenges, if not well managed, could wreck macro-economic management, fail to revive private sector investment, further depletescarce resources, and add to human suffering, precisely at a time when the govern-ment expenditures will need to be pruned back substantially because of the declinein oil revenues. This Development Policy Review for Yemen reviews recent devel-opment outcomes, identifies key challenges that will affect Yemen’s development,and proposes a selective agenda of reforms. The reforms include measures toimprove fiscal and public sector management, combat corruption, strengthen judi-cial and legal systems, improve land registry, and revise energy, water and popula-tion policies. This report is intended to inform Yemeni authorities in finalizing thesecond Poverty Reduction Strategy Paper (2006–10). It also strives to raise aware-ness about the consequences of the impending oil depletion and to promote morediversified and sustainable development.
Challenges Ahead
The main challenges to Yemen’s growth are the impending rapid decline in oil revenues, the weak capacity of governance institutions, the pressures of high pop-ulation growth, and the worsening scarcity of freshwater. The country has yet to
xiv E X E C U T I V E S U M M A R Y
10414-00_FM.qxd 4/17/08 11:09 AM Page xiv
come to grips with the imminent oil decline and its consequences. The Govern-ment is concerned about governance problems and is recently attempting to speedup reforms. The last two challenges—high population growth and water crisis—are long recognized by the government, but reforms have been slow.
Depleting oil revenues
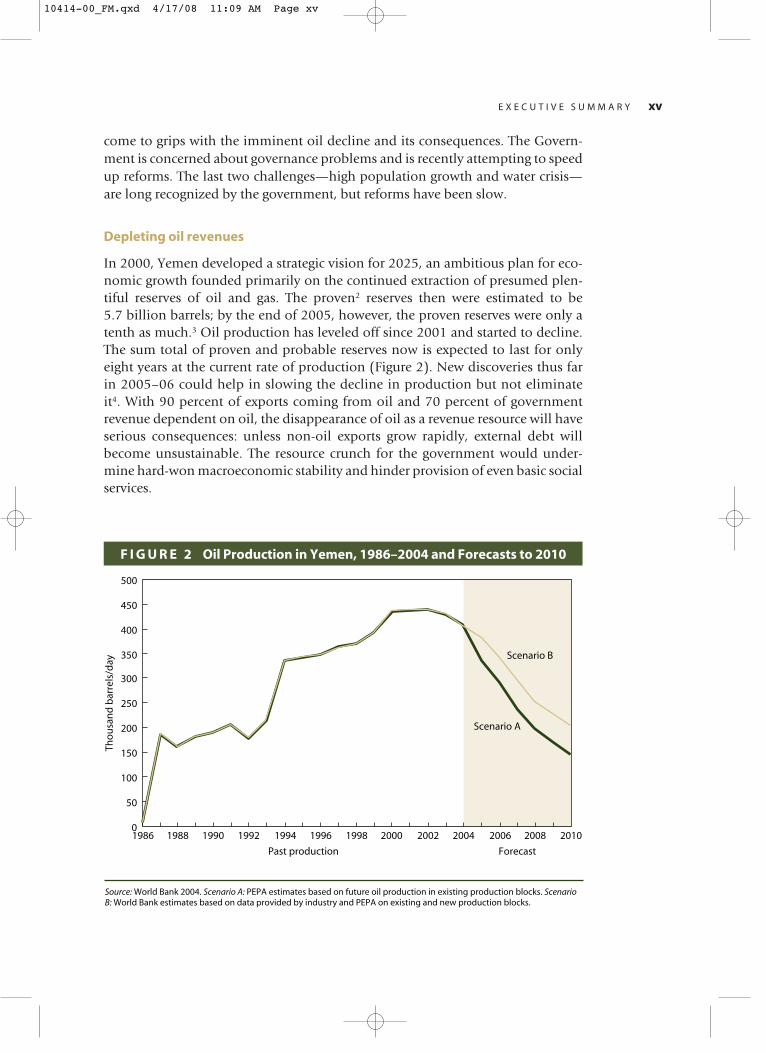
In 2000, Yemen developed a strategic vision for 2025, an ambitious plan for eco-nomic growth founded primarily on the continued extraction of presumed plen-tiful reserves of oil and gas. The proven2 reserves then were estimated to be 5.7 billion barrels; by the end of 2005, however, the proven reserves were only atenth as much.3 Oil production has leveled off since 2001 and started to decline.The sum total of proven and probable reserves now is expected to last for only eight years at the current rate of production (Figure 2). New discoveries thus far in 2005–06 could help in slowing the decline in production but not eliminate it4. With 90 percent of exports coming from oil and 70 percent of government revenue dependent on oil, the disappearance of oil as a revenue resource will haveserious consequences: unless non-oil exports grow rapidly, external debt willbecome unsustainable. The resource crunch for the government would under-mine hard-won macroeconomic stability and hinder provision of even basic social services.
E X E C U T I V E S U M M A R Y xv
F I G U R E 2 Oil Production in Yemen, 1986–2004 and Forecasts to 2010
0
50
100
150
200
250
300
350
400
450
500
1986 1988 1990 1992 1994 1996 1998 2000 2002 2004 2006 2008 2010
Tho
usa
nd
bar
rels
/day
Past production Forecast
Scenario A
Scenario B
Source: World Bank 2004. Scenario A: PEPA estimates based on future oil production in existing production blocks. Scenario B: World Bank estimates based on data provided by industry and PEPA on existing and new production blocks.
10414-00_FM.qxd 4/17/08 11:09 AM Page xv
The government of Yemen has found it difficult to diversity exports.5 The dis-covery of oil in 1984 averted a crisis looming because of the collapse of remittanceflows and external assistance. The initial estimate of low oil reserves of 1 billionbarrels was tripled subsequently. The initial estimate of gas reserves at 4 trillions ofcubic feet (tcf) was eventually quadrupled. Even now, the government is eitherexploring or producing oil from only 29 of the possible 78 blocks,6 supporting thehope that more oil could be found. More active exploration for gas could raise theestimate of gas reserves, too.
Yemen’s oil production will soon fall off dramatically
Although oil reserves could increase in the future and gas exports could partiallyoffset the loss of oil revenues, reorienting to non-oil-based development is urgentfor two important reasons. First, export diversification will generate jobs. The entireoil sector employed only about 21,000 Yemenis in 2003, while some 190,000 newentrants to the job market sought work. With youth unemployment raging at 30 percent or more, the need for labor-intensive growth is urgent. Second, diversi-fying the export base will take time. The history of countries that achieved success-ful diversification, such as Costa Rica, Malaysia, or the United Arab Emirates,shows that it takes at least a decade or more for diversification polices to bear fruit.
Weak governance
The quality of governance in Yemen deteriorated until 2004. Corruption andbureaucratic quality both worsened from 1996–98 to 2002–04. During the sameperiod, many other measures of administrative capacity, public accountability, andpolitical rights remained unchanged, but low. Besides, Yemen’s quality of gover-nance is the weakest among its neighbors.7
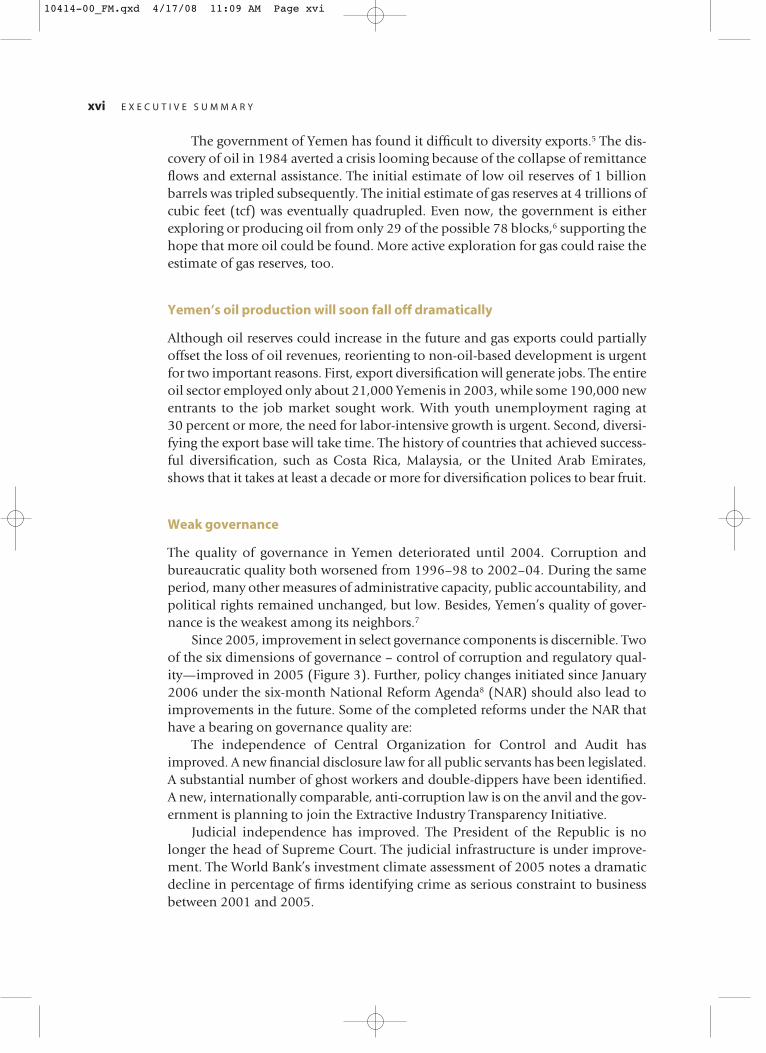
Since 2005, improvement in select governance components is discernible. Twoof the six dimensions of governance – control of corruption and regulatory qual-ity—improved in 2005 (Figure 3). Further, policy changes initiated since January2006 under the six-month National Reform Agenda8 (NAR) should also lead toimprovements in the future. Some of the completed reforms under the NAR thathave a bearing on governance quality are:
The independence of Central Organization for Control and Audit hasimproved. A new financial disclosure law for all public servants has been legislated.A substantial number of ghost workers and double-dippers have been identified.A new, internationally comparable, anti-corruption law is on the anvil and the gov-ernment is planning to join the Extractive Industry Transparency Initiative.
Judicial independence has improved. The President of the Republic is nolonger the head of Supreme Court. The judicial infrastructure is under improve-ment. The World Bank’s investment climate assessment of 2005 notes a dramaticdecline in percentage of firms identifying crime as serious constraint to businessbetween 2001 and 2005.
xvi E X E C U T I V E S U M M A R Y
10414-00_FM.qxd 4/17/08 11:09 AM Page xvi

Corruption is perceived to be a serious issue in Yemen, both by the govern-ment and by local firms. About 80 percent of the firms surveyed mentionedcorruption as a modest or very severe constraint on their operations. Many in-ternational rating agencies concur. Transparency International’s Corruption Per-ception Index places Yemen 103rd out of 159 countries surveyed in 2005. Since2003, the government has taken measures to set up laws and institutions for fight-ing corruption, and in 2005 it ratified the UN convention against corruption. Butto date, no case has been pursued against a high-profile person for corruption.
Severe water crisis
In Yemen’s water-scarce environment, the use of groundwater has been drivingrural growth for the past 30 years, but in an unsustainable and inequitable man-ner. Groundwater abstraction has steadily increased since the mid 1980s in mostareas of Yemen. There are about 50,000 private wells in the country (8,000 opera-tional wells in the Sana’a Basin alone, half of which are tubewells), together withmore than 200 drilling rigs. Groundwater use began to exceed recharge in the mid1980s, with more than 80 percent of abstraction going to irrigated agriculture. Atthe present rate of depletion, the sustainability of livelihoods is jeopardized.Already, farming has been scaled down or abandoned, and some communities andtowns are also running out of domestic water.
The average tariff in Sana’a for domestic water supply and sanitation is YR100 per cubic meter (US$0.52 per cubic meter), based on a typical household
E X E C U T I V E S U M M A R Y xvii
F I G U R E 3 Quality of Governance in Yemen, 1996–2005
–1.8
–1.6
–1.4
–1.2
–1
–0.8
–0.6
–0.4
–0.2
0
1996
Political stability/no violence
Regulatory quality
Rule of law
Control of corruption
Source: Governance Matters V: Governance Indicators for 1996–2005 by D. Kaufmann, A. Kraay, and M. Mastruzzi.
200520042003200220001998
Government effectiveness
Voice and accountability
10414-00_FM.qxd 4/17/08 11:09 AM Page xvii

that consumes less than 35 cubic meters per month. Given the efficiency losses inthe distribution system, the average monthly bill is not enough to cover operationsand maintenance costs plus depreciation, let alone investments. At these low levels of tariffs, consumers have no incentive for water conservation and suppliershave no incentive to improve performance.
High population growth
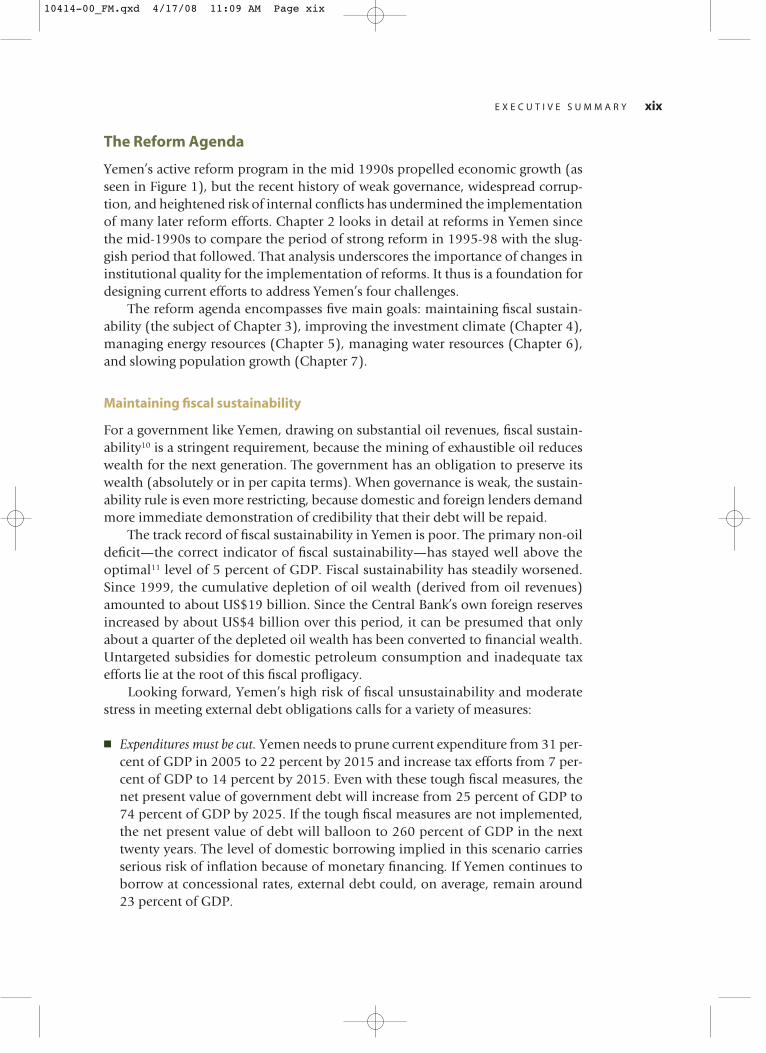
Yemen’s population growth, at 3 percent annually, is high by regional standardsand in comparison with countries with similar levels of per capita income. Yemen’sfertility rate began to slow in early 1990s, as economic and social developmentbrought conditions that have created a “demographic transition” to lowerbirthrates in many countries. But this transition appears to have stalled in Yemen(Figure 4). The rate of decline in the fertility rate has slowed between 1997 and2003.
The demographic transition to lower birth rates is slowing
On current trends, the population will nearly double to 40 million in 20 years,nearly 5 million higher than the target of the national population policy adoptedin 1997. Each new Yemeni child born is estimated to cost the government US$250annually in 2005 prices for education and health care.9 The slowing of fertilitydecline is mainly attributed to the slowing in the spread of contraceptive use since1997.
xviii E X E C U T I V E S U M M A R Y
F I G U R E 4 Fertility in Yemen, 1988–2004 and Forecasts to 2025
8.3
7.6 7.4
6.56.2
4
3.3
0
1
2
3
4
5
6
7
8
9
Target
Current Trend
Source: Staff calculations.
1988 1990 1992 1994 1996 1998 2000 2002 2004 2006 2008 2010 2012 2014 2016 2018 2020 2022 2024
10414-00_FM.qxd 4/17/08 11:09 AM Page xviii
The Reform Agenda
Yemen’s active reform program in the mid 1990s propelled economic growth (asseen in Figure 1), but the recent history of weak governance, widespread corrup-tion, and heightened risk of internal conflicts has undermined the implementationof many later reform efforts. Chapter 2 looks in detail at reforms in Yemen sincethe mid-1990s to compare the period of strong reform in 1995-98 with the slug-gish period that followed. That analysis underscores the importance of changes ininstitutional quality for the implementation of reforms. It thus is a foundation fordesigning current efforts to address Yemen’s four challenges.
The reform agenda encompasses five main goals: maintaining fiscal sustain-ability (the subject of Chapter 3), improving the investment climate (Chapter 4),managing energy resources (Chapter 5), managing water resources (Chapter 6),and slowing population growth (Chapter 7).
Maintaining fiscal sustainability
For a government like Yemen, drawing on substantial oil revenues, fiscal sustain-ability10 is a stringent requirement, because the mining of exhaustible oil reduceswealth for the next generation. The government has an obligation to preserve itswealth (absolutely or in per capita terms). When governance is weak, the sustain-ability rule is even more restricting, because domestic and foreign lenders demandmore immediate demonstration of credibility that their debt will be repaid.
The track record of fiscal sustainability in Yemen is poor. The primary non-oildeficit—the correct indicator of fiscal sustainability—has stayed well above theoptimal11 level of 5 percent of GDP. Fiscal sustainability has steadily worsened.Since 1999, the cumulative depletion of oil wealth (derived from oil revenues)amounted to about US$19 billion. Since the Central Bank’s own foreign reservesincreased by about US$4 billion over this period, it can be presumed that onlyabout a quarter of the depleted oil wealth has been converted to financial wealth.Untargeted subsidies for domestic petroleum consumption and inadequate taxefforts lie at the root of this fiscal profligacy.
Looking forward, Yemen’s high risk of fiscal unsustainability and moderatestress in meeting external debt obligations calls for a variety of measures:
� Expenditures must be cut. Yemen needs to prune current expenditure from 31 per-cent of GDP in 2005 to 22 percent by 2015 and increase tax efforts from 7 per-cent of GDP to 14 percent by 2015. Even with these tough fiscal measures, thenet present value of government debt will increase from 25 percent of GDP to74 percent of GDP by 2025. If the tough fiscal measures are not implemented,the net present value of debt will balloon to 260 percent of GDP in the nexttwenty years. The level of domestic borrowing implied in this scenario carriesserious risk of inflation because of monetary financing. If Yemen continues toborrow at concessional rates, external debt could, on average, remain around 23 percent of GDP.
E X E C U T I V E S U M M A R Y xix
10414-00_FM.qxd 4/17/08 11:09 AM Page xix

� Tax revenues need to be more than doubled. In 2004, tax revenue was 7 percent ofGDP. By 2015, tax revenues must raise to 15 percent of GDP to partly compen-sate for the loss of oil revenues. This increase will be due to the introduction ofthe general sales tax, recently revised downwards by the authorities from 10 per-cent to 5 percent. It is estimated that successful implementation of this tax couldgenerate 1–3 percent of GDP over the next few years.
� Public financial management must be improved. Completing reforms to publicfinancial management will hold the key to successful public expenditure man-agement. Public financial management needs to be strengthened in all majorareas – budget programming and prioritization; budget execution; treasury andcash management; internal controls; internal audit; external audit; financialreporting and oversight.
� Civil service reform must be completed. Completing civil service reforms is essen-tial to generate savings and build a competent civil service. Yemen’s civil serviceis considered to be underpaid, while at the same time overstaffed. The wage billaccounts for nearly one-quarter of the government’s current expenditure, one ofthe highest levels in Middle East and North Africa. The government started toimplement a four-stage National Wage Strategy in July 2005, and that planneeds to move forward.
Improving the investment climate
Private investment in Yemen has collapsed for lack of adequate returns. After peak-ing in 1998, private investment slumped in 1999 and continued to fall steadily toreach a mere 10 percent of GDP, halving from the average during the period ofreforms. After the initial enthusiastic response to stabilization and early reforms,private investors have held back on investment because of poor returns. Yemenishave consistently been saving more than they can invest since 1999. Most of banklending has been confined to trade credit. Foreign direct investment has beenrestricted to the oil sector.
The main constraints to investment in the private sector are identified by thenew Investment Climate Assessment (ICA) for Yemen. Based on firms’ own iden-tification of constraints and other analysis, the ICA finds four key areas where theinvestment climate constrains the ability of the private firms and investors torespond to market opportunities, stimulate growth, and generate jobs: (a) macro-economic instability, (b) tax and regulatory burdens, (c) weak governance, partic-ularly expressed as corruption and (d) inadequate infrastructure services, especiallyfor electricity, land, and water supply, and (e) insufficient access to finance.
Many of these constraints can be addressed by measures to strengthen gover-nance—notably, by creating greater accountability, transparency, and efficiency inthe judicial system. Though Yemen’s judiciary has newly acquired independenceunder the National Reform Agenda of 2006, judges and administrators are poorlytrained. The courts lack physical infrastructure to file and retrieve records quickly.The reform agenda is intended to do the following:
xx E X E C U T I V E S U M M A R Y
10414-00_FM.qxd 4/17/08 11:09 AM Page xx

� Speed the processing of cases. Providing training, computers, information manage-ment systems, and other resources to judges and court personnel would reducecase backlogs and accelerate the disposition of new disputes. Revising the pro-cedures for filing and resolving lawsuits would help to weed out procedures thatinvite delay and raise costs.
� Increase access to alternative dispute mechanisms: The creation of mediation andconciliation services and other alternatives to resolving disputes in the courtsreduces court costs, as does the introduction of small claim courts.
� Professionalize bench and bar. Professional training, now lacking in Yemen, isneeded to enhance the performance of the main actors and instill the values ofimpartiality, professionalism, competency, efficiency, and public service. Train-ing needs to target administrative and notary staff as well as judges, and addressthe different requirements in specialized courts.
� Improve the administration of land tenure security. This encompasses initiatives toincrease the limited demand for registration (by, for example, removing incen-tives for using court authentication as an alternative to registration), as well asenhance the quality and efficiency of registration services (by improving regis-tration processes and maintenance).
� Make state land management efficient. The present state land management processis in need of an overhaul. Key issues in improving state land management wouldinclude, among others, to more clearly define state-owned land in the law, setup a comprehensive and centralized inventory of state-owned land, betterenforce existing measures to curb land speculation, as well as to identify andapply standardized procedures for the disposition of state land.
� Take advantage from international experience in the current revision of the law gov-erning land registration. The government of Yemen is moving in the right direc-tion with its initiative to replace the current land registration law. The draft lawsproposed, however, show some weaknesses and could be amended to facilitateeffective registration, ensure financial sustainability of the registry system, andstrengthen the legal effect of the registry system.
Managing energy resources
Though Yemen’s oil reserves are depleting fast, management and investment of theremaining reserves, indicatively valued at US$ 30 billion (nearly 200 percent ofGDP) in 2005 prices, is of paramount importance to Yemen’s future. The govern-ment’s efforts to save oil revenues need to be strengthened. The government man-aged to add to its financial wealth only a quarter of the oil bonanza since 1999. Forimproving the management of oil and gas revenues, Yemen should consider join-ing the Extractive Industry Transparency Initiative, ending petroleum subsidies ina gradual but time-bound way, and improving the efficiency of the downstreampetroleum sector. An incentive framework to develop gas resources would alsohelp in finding and exporting gas. Additional reforms are also suggested in Chap-ter 5 to increase the reliability of electrical power generation.
E X E C U T I V E S U M M A R Y xxi
10414-00_FM.qxd 4/17/08 11:09 AM Page xxi

� Endorsing the Extractive Industries Transparency Initiative (EITI) would improve thegovernment’s credibility with civil society and the international donor commu-nity. This would call for regular publication of all oil, gas, and mining paymentsand revenues (by companies and by the government); making the publicationaccessible to the public; having payments and revenues subject to a credible,independent audit; and active engagement of the civil society in design, mon-itoring and evaluation of the EITI implementation process. Yemen placesdetailed oil sector information in the public domain, and is comparable tocountries that have already adopted the EITI12.
� Phasing out petroleum subsidies would improve macroeconomic stability. Despitethe steep raise in the administered prices of petroleum products for domesticconsumption, the subsidies remain large (9 percent of GDP in 2005), and theyare still well below international prices. Phasing the subsidy removal for all fueltypes gradually over two years would help avoid redirection of demand betweenfuels and allow the social protection mechanism to work.
� Improving efficiency in petroleum refining and distribution would conserve resourcesand improve fiscal sustainability. The absence of quality standards for refinedoil products combined with adopting inappropriate international referenceprices for calculating oil products that are sold domestically act as an incentiveto refineries to import low quality oil products for supplying to the domesticmarket and exporting higher quality products and crude oil. The power sectorsuffers from the varying and low quality of the fuel oil supply it is obligated tobuy from the government refineries. Yemen also lacks relevant environmentallaws and regulations on production and use oil and gas, and the establishmentof quality standards and requirements for oil products.
Managing water resources
The government is well aware of the water sector issues and started institutionalreforms since 1996 with donor support. Set against the key objectives in the watersector, the reform program has made a difference, but results have been slow. Inwater resources management, some instruments have been prepared and tested,but no significant reduction to groundwater overdraft, or improvement in inter-sectoral allocation or in water use efficiency is evident. In water supply and sanita-tion, reforms have started, but limited impact has been felt by the consumer, andonly in some urban areas. In irrigation, some efficiency gains have been achievedbut resource depletion has continued. In watershed management, resources andmanagement effort have been tied up in a controversial dams program, which ledto the neglect of broader objectives such as basin efficiency and poverty reduction.The reform agenda addresses:
� Depletion of groundwater. Lacking strong public governance structures, over-mining of groundwater can be controlled by alternative means. Such alternativemeans include intensive user involvement and organization, self-regulation by
xxii E X E C U T I V E S U M M A R Y
10414-00_FM.qxd 4/17/08 11:09 AM Page xxii

water user associations, monitoring and information sharing, tradable waterrights, and improving incomes through technological improvements.
� Watershed management. Current watershed management activities are concen-trated on the flawed small dams program, which does not often improve over-all basin efficiency and suffers from poor design, questionable contractingpractices, and low construction standards. Given the multi-institutional chal-lenge, there is scope for proactive involvement of donors and nongovernmen-tal organizations to relieve the burden on government agencies, which typicallyfind it hard to coordinate the multiple interventions needed for watershed management.
� Better allocation. Allocation of water to its best economic use can be improvedby introducing economic instruments. The problem with the present privatemarkets is that they are economically inefficient and informal. There is noenabling framework to encourage investment. Water rights are unclear and thereis no provision for equity or sustainable management in the source area. Thedevelopment of more formal water markets should be a priority. At the currentlow levels of tariffs for domestic water supply that does not even cover operat-ing and maintenance costs, consumers see no incentive for water conservationwhilst suppliers have no incentive to improve performance.
Slowing population growth
Speeding up the demographic transition is possible, as it has been achieved in Iranand Oman, countries culturally similar to Yemen. Iran lowered total fertility ratefrom 6.6 births per woman in 1985 to near replacement levels of 2 in 2005 byusing support from religious institutions, combined with sound maternal healthpolicies. In Oman, expansion of education opportunities for girls and health ser-vices seems to have helped in lowering the total fertility rate.
Yemen has a sound population policy that enjoys wide support. The Popula-tion Action Program 2001–10 follows a comprehensive and integrated approachof reproductive health care and human development. This comprehensive policyfollows international standards in targeting the most important known demo-graphic determinants and is consistent with the measures found to be successfulin other countries.
Implementation has been weak, however, because of limited resources andweak governance mechanisms. Per capita government expenditure on health isabout US$6, compared with the estimated requirement of US$54 per capita peryear needed to meet Yemen’s Millennium Development Goals for health. Imple-menting programs selectively to support information campaigns, health of chil-dren and mothers, and education of girls could help achieve reduction in fertility.
E X E C U T I V E S U M M A R Y xxiii
10414-00_FM.qxd 4/17/08 11:09 AM Page xxiii

10414-00_FM.qxd 4/17/08 11:09 AM Page xxiv

Yemen’s unification in 1990 has shaped the country’s subsequent development.The Yemen Arab Republic (North Yemen) was a lower middle-income coun-
try before 1990, functioning under a capitalist system. Compared with the People’sDemocratic Republic of Yemen (South Yemen), the North enjoyed a gross domesticproduct seven times larger, a population four times bigger, and a per capita GDPnearly 50 percent greater. The smaller and poorer South Yemen, however, had itsstrength in better health, education, and gender outcomes, because of 23 years ofsocialism preceding the unification. Some of the key problems facing united Yemenhave their origin in the era before unification and in the terms of merger. The largecivil service and difficulties in land titling are legacies of the socialist era of SouthYemen. Difficulties in improving health or gender outcomes arise from the relativelyconservative values in the northern part of Yemen.
Since unification, Yemen has successfully overcome a civil war in 1994, copedwith the return of around 800,000 Yemenis working in the Gulf countries, andweathered several adverse economic shocks, including interrupted flows of remit-tances, volatile oil prices, and suspension of most foreign aid. The negative spilloverfrom the Iraq War also affected Yemen. Yemen continues to suffer from internal secu-rity issues.13 Traffic through Aden—the best natural port in the region—has barelyrecovered to the levels of 1988.
Yemen continues to suffer from weak institutions and a high risk of internal con-flict. Although the World Bank ranks Yemen barely above the categorization of low-income countries under stress, the U.K. Department for International Development,an important bilateral donor for Yemen, has labeled Yemen as a fragile state sinceJanuary 2005.14 The index of failed states compiled by Foreign Policy magazine andthe Fund for Peace ranks Yemen eighth in a global list of 60 countries rated for riskof state failure, ahead of Afghanistan. The categorization of Yemen as a fragile stateunderscores its difficulties in initiating and sustaining sound economic and socialpolicies. This difficult operating environment calls for Yemen’s development part-ners to take a more selective, nuanced approach to reforms.
Yemen’s prospects are mixed, as democratic institutions are slowly taking rootbut the main engines of economic growth are sputtering. Helped by a vibrant but
1
Yemen TodayMixed Development Outcomes
1
10414-01_Ch01.qxd 4/17/08 11:15 AM Page 1
somewhat muzzled press (third worst in the Middle East and North Africa), anascent multiparty democratic tradition is taking root in Yemen. The holding ofthree multiparty parliamentary elections in 1993, 1997, and 2003, and the firstdirect presidential elections in 1999 are seen as substantial steps toward democ-racy. The passage of a law on local authority in 2000 is viewed as a major instru-ment of decentralization to elected councils at governorate and district levels.
Until 1984, foreign aid and worker remittances served as the main sources ofYemen’s foreign exchange. After the discovery of oil in 1984, it quickly emergedas the major foreign exchange earner, accounting for 90 percent of merchandiseexports. However, Yemen’s oil is depleting fast: at the current rate of production rate,oil supplies will be exhausted in merely eight years. Water resources, too, are scantand being overexploited. Demographic dynamics exacerbate the scarcity of Yemen’slimited and declining natural resources. High birth rates (six per woman) and pop-ulation growth (3 percent per year) combine with rising labor force participation(especially among women in rural areas) to keep Yemen’s labor force growing by3.8 percent per year. Thus Yemen faces the stark reality that, if oil runs out and thelooming water crisis cannot support sustained growth in agriculture, an exodus ofworkers abroad could become inevitable, unless non-oil sectors grow rapidly.
Macroeconomic Outcomes
For nearly a decade after the 1990 unification, Yemen achieved a reasonable annualGDP growth rate (around 5.2 percent), securing a decent 2 percent per capitagrowth. The integration of North and South Yemen provided a bigger market; newoil wells came on stream in 1994, boosting oil production by 80 percent; and a suc-cessful macroeconomic stabilization and reform program in the second half of the1990s controlled inflation, liberalized trade, reduced subsides, unified the exchangerate regime and reformed the financial sector. Economic growth peaked in the period1995 to 1998 (see Figure 1).
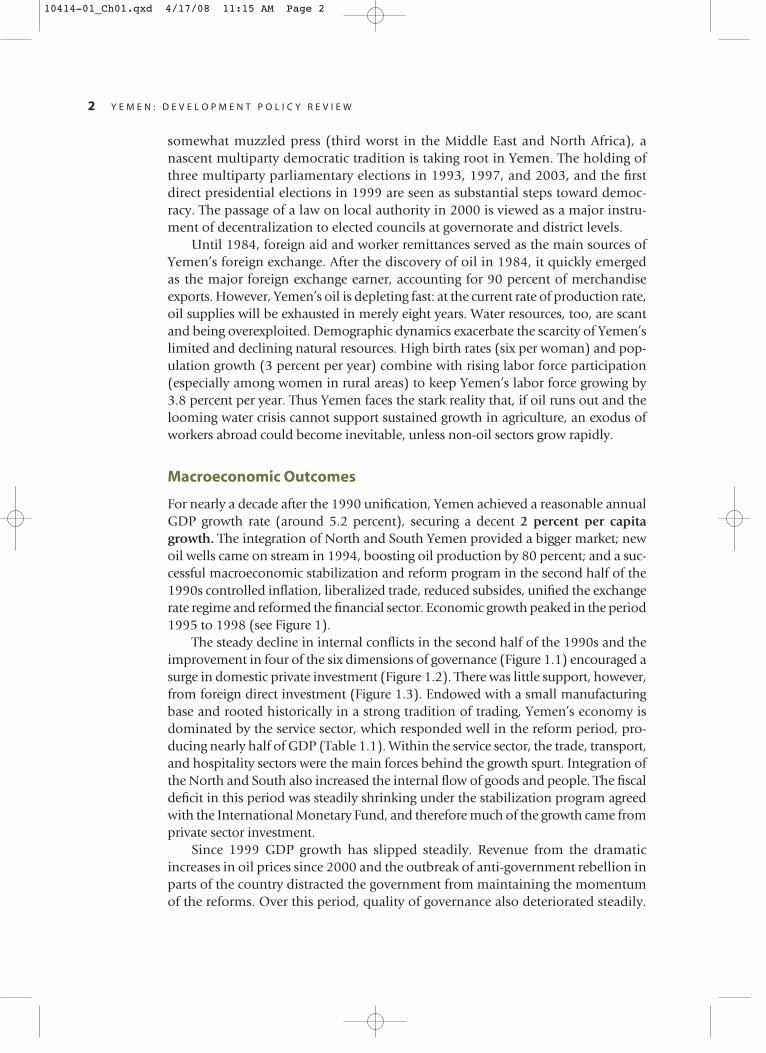
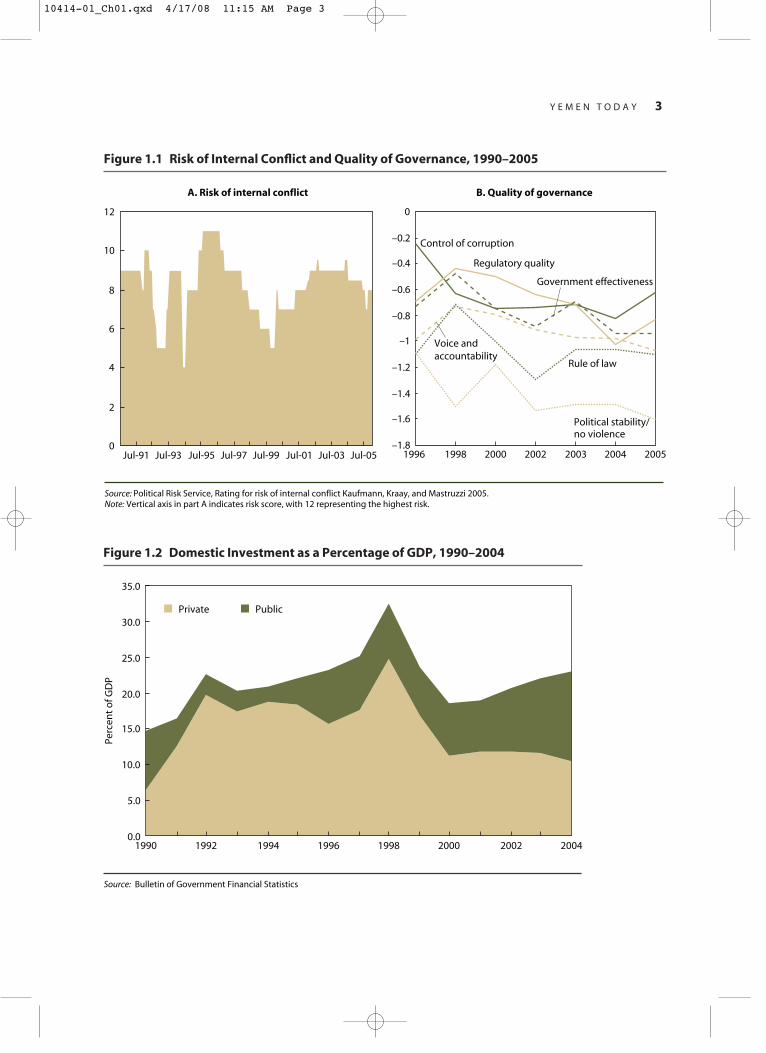
The steady decline in internal conflicts in the second half of the 1990s and theimprovement in four of the six dimensions of governance (Figure 1.1) encouraged asurge in domestic private investment (Figure 1.2). There was little support, however,from foreign direct investment (Figure 1.3). Endowed with a small manufacturingbase and rooted historically in a strong tradition of trading, Yemen’s economy isdominated by the service sector, which responded well in the reform period, pro-ducing nearly half of GDP (Table 1.1). Within the service sector, the trade, transport,and hospitality sectors were the main forces behind the growth spurt. Integration ofthe North and South also increased the internal flow of goods and people. The fiscaldeficit in this period was steadily shrinking under the stabilization program agreedwith the International Monetary Fund, and therefore much of the growth came fromprivate sector investment.
Since 1999 GDP growth has slipped steadily. Revenue from the dramaticincreases in oil prices since 2000 and the outbreak of anti-government rebellion inparts of the country distracted the government from maintaining the momentumof the reforms. Over this period, quality of governance also deteriorated steadily.
2 Y E M E N : D E V E L O P M E N T P O L I C Y R E V I E W
10414-01_Ch01.qxd 4/17/08 11:15 AM Page 2
Y E M E N T O D A Y 3
Figure 1.1 Risk of Internal Conflict and Quality of Governance, 1990–2005
Figure 1.2 Domestic Investment as a Percentage of GDP, 1990–2004
A. Risk of internal conflict
0Jul-91 Jul-93 Jul-95 Jul-97 Jul-99 Jul-01 Jul-03 Jul-05
2
4
6
8
10
12
Source: Political Risk Service, Rating for risk of internal conflict Kaufmann, Kraay, and Mastruzzi 2005. Note: Vertical axis in part A indicates risk score, with 12 representing the highest risk.
–1.8
–1.6
–1.4
–1.2
–1
–0.8
–0.6
–0.4
–0.2
0
1996
Political stability/no violence
Regulatory quality
Rule of law
Control of corruption
200520042003200220001998
Government effectiveness
Voice and accountability
B. Quality of governance
0.01990 1992 1994 1996 1998 2000 2002 2004
5.0
10.0
15.0
20.0
25.0
30.0
35.0
Perc
ent
of G
DP
Private Public
Source: Bulletin of Government Financial Statistics
10414-01_Ch01.qxd 4/17/08 11:15 AM Page 3

4 Y E M E N : D E V E L O P M E N T P O L I C Y R E V I E W
Figure 1.3 Foreign Direct Investment, 1990–2004
–400
–200
0
200
400
600
800
1000
1990 1991 1992 1993 1994 1995 1996 1997 1998 1999 2000 2001 2002 2003 2004
US$
mill
iion
s
Source: International Financial Statistics, IMF, various issues.
Table 1.1 Growth and Composition of GDP, by Sector, 1991–2004
Contribution to growth Share in growth Share in GDP
1991– 1996– 2001– 1991– 1996– 2001– 1991– 1996– 2001–95 00 04 95 00 04 95 00 04
GDP 6.1 7.1 4.2 100.0 100.0 100.0 100.0 100.0 100.0
Oil Sector 1.0 1.3 -0.1 16.4 18.1 -2.0 12.8 16.0 14.5
Non-oil sector 5.1 5.8 4.3 83.6 81.9 102.0 87.2 84.0 85.5
Agriculture 0.9 1.4 0.7 14.2 19.0 16.8 23.9 22.3 21.2
Industry 1.5 0.7 0.7 23.8 9.9 16.4 14.5 14.5 13.9
Services 2.8 3.8 2.9 45.6 53.0 68.8 48.8 47.2 50.4
Source: Staff estimates.
Several reform initiatives floundered: the privatization law of 1999 was never rat-ified, introduction of a general sales tax and the reduction in petroleum subsidieswere repeatedly shelved, political commitment for legal and judicial reformswavered, and the implementation of civil service modernization and health sectorreforms slowed. Since 2000, gains from strong oil prices contributed to terms oftrade gains averaging 4 percent of GDP, reversing the trend of the previous decade.
10414-01_Ch01.qxd 4/17/08 11:15 AM Page 4
Internal conflicts increased after February 2000, preceding the infamous attack onUSS Cole later that year and reversing the decline in violence over the precedingfive years. Private investment slumped in 1999 and continued to fall steadily toreach a mere 10 percent of GDP, half the average during the period of reforms.
Poverty and Unemployment Outcomes
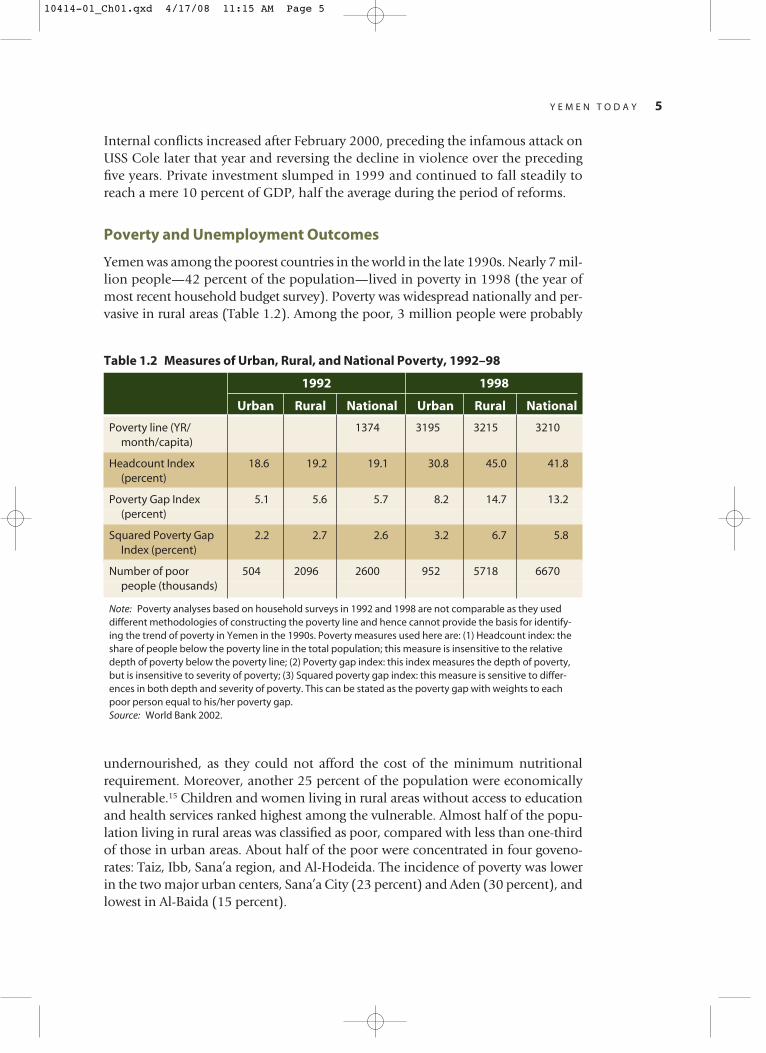
Yemen was among the poorest countries in the world in the late 1990s. Nearly 7 mil-lion people—42 percent of the population—lived in poverty in 1998 (the year ofmost recent household budget survey). Poverty was widespread nationally and per-vasive in rural areas (Table 1.2). Among the poor, 3 million people were probably
Y E M E N T O D A Y 5
Table 1.2 Measures of Urban, Rural, and National Poverty, 1992–98
1992 1998
Urban Rural National Urban Rural National
Poverty line (YR/ 1374 3195 3215 3210month/capita)
Headcount Index 18.6 19.2 19.1 30.8 45.0 41.8(percent)
Poverty Gap Index 5.1 5.6 5.7 8.2 14.7 13.2(percent)
Squared Poverty Gap 2.2 2.7 2.6 3.2 6.7 5.8Index (percent)
Number of poor 504 2096 2600 952 5718 6670people (thousands)
Note: Poverty analyses based on household surveys in 1992 and 1998 are not comparable as they useddifferent methodologies of constructing the poverty line and hence cannot provide the basis for identify-ing the trend of poverty in Yemen in the 1990s. Poverty measures used here are: (1) Headcount index: theshare of people below the poverty line in the total population; this measure is insensitive to the relativedepth of poverty below the poverty line; (2) Poverty gap index: this index measures the depth of poverty,but is insensitive to severity of poverty; (3) Squared poverty gap index: this measure is sensitive to differ-ences in both depth and severity of poverty. This can be stated as the poverty gap with weights to eachpoor person equal to his/her poverty gap.Source: World Bank 2002.
undernourished, as they could not afford the cost of the minimum nutritionalrequirement. Moreover, another 25 percent of the population were economicallyvulnerable.15 Children and women living in rural areas without access to educationand health services ranked highest among the vulnerable. Almost half of the popu-lation living in rural areas was classified as poor, compared with less than one-thirdof those in urban areas. About half of the poor were concentrated in four goveno-rates: Taiz, Ibb, Sana’a region, and Al-Hodeida. The incidence of poverty was lowerin the two major urban centers, Sana’a City (23 percent) and Aden (30 percent), andlowest in Al-Baida (15 percent).
10414-01_Ch01.qxd 4/17/08 11:15 AM Page 5
Without a recent and comparable household budget survey, it is not possible tomake accurate statements about trends in poverty since 1998. However, under theassumption of unchanged inequality, poverty must have changed little or even wors-ened since 1998, because per capita GDP growth has been very low. A recent povertyanalysis estimates that poverty in Yemen has slightly decreased from 42 percent 1998to about 40 percent in 2003.16 Most gains are estimated to have accrued to urbanhouseholds (poverty incidence dropped from 30.8 percent in 1998 to 21–28 percentin 2003), while rural poverty barely changed. Poverty in rural households is esti-mated to have stagnated between 1998 and 2003 (around 45 percent as in 1998).Given the large share of rural households in the total population, small changes inrural poverty rates more than offset large changes in urban poverty rates.
Inequality is a rising concern in Yemen. Access to water and land is increasinglyconcentrated in fewer hands. Youth, women, and rural people are increasingly mar-ginalized from the economy, as traditional livelihood systems decline but are notreplaced with new opportunities. With rapid urbanization, shanty dwellers areincreasingly marginalized socially and economically. And state expenditures tendto favor the non-poor (World Bank 2006a).
Unemployment is also a serious concern. Even in the early years of unification,unemployment raged at around 25–30 percent (World Bank 1996). The return ofsome 800,000 migrant workers aggravated the problem in the early 1990s. By 1999,with macroeconomic stabilization and growth, unemployment declined to 11.5 per-cent.17 Among the youth, however, unemployment was 18.7 percent. As elsewherein Middle East and North Africa, unemployment among women with higher educa-tion is very high, with one in every three women unemployed. The household bud-get survey in 1998 found unemployment to be largely an urban phenomenon, with13.4 percent unemployed compared to only 6.3 percent in the rural areas. Since1999, in the absence of labor force surveys, the unemployment situation has notbeen quantified. On the supply side, demographic trends of high birth rates andincreasing participation of women keep the growth of the labor force high. Laborforce growth is estimated at 3.8 percent per year (3.3 for men and 5.3 for women),but demand for labor is expanding only 2.8 percent per year,18 so the number ofunemployed could reach close to a million in 2006. Thus the implied unemploy-ment rate would be 17 percent for the overall population and 34 percent for theyouth (Republic of Yemen, 2003). The near doubling of estimated unemploymentrate for the youth since 1999 calls for urgent attention.
Social Outcomes
Measures of education, health, and social well-being in Yemen have improved since1990, but still remain very low. Yemen has made great strides in improving access toeducation, but it has a long way to go to achieve universal primary completion andgender parity. In 2003, gross primary enrollment was 83.5 percent (up from about65 percent in 1990), and net primary enrollment reached 72 percent (compared with52 percent in 1990).19 Between 1995 and 2000, total enrollment rates in basic edu-cation increased by 30 percent, while secondary education rates increased by 50 per-
6 Y E M E N : D E V E L O P M E N T P O L I C Y R E V I E W
10414-01_Ch01.qxd 4/17/08 11:15 AM Page 6
cent. However, the primary completion rate was only about 65 percent and hadfallen short of the two-thirds of population of the relevant age group by 2003. Theadult literacy rate was only 49 percent, and more than 70 percent of women wereilliterate. The government’s objective to achieve universal primary education in thenext ten years requires a much accelerated expansion of the basic education sector,as well as improved efficiency. However, with education spending at 8 percent ofGDP and 20 percent of total government expenditures, Yemen already spends muchmore on education than other countries in the region.
The health status of the Yemeni population is poor. Maternal mortality rate(570 per 100,000 live births) and total fertility rate (6.0 children per woman) arethe highest in the Middle East and North Africa region. Child malnutrition is alsothe highest in the region, and almost half of the Yemeni children suffer from stunt-ing. Contraceptive prevalence rate is very low at 23 percent. More than 1.2 millionYemenis have contracted malaria, and about 20,000 cases of tuberculosis have beenreported. Although a national strategy for combating HIV/AIDS has been devel-oped, no serious actions have been taken to implement it. The prevalence ofHIV/AIDS is not clearly known. In addition, the widespread chewing of Qat alsoaffects public health. Nonetheless, life expectancy has improved significantly forboth sexes since 1990. Women have increased their life expectancy from 52.6 yearsin 1990 to 58.1 in 2002. The infant mortality rate for every 1,000 births decreasedfrom 98 in 1990 to 83 in 2002. In 1998, total health spending was estimated at5.6 percent of GDP, of which about a third was from public sources (excluding allforeign assistance) and almost three-fifths came from private spending. At 3.3 per-cent of GDP, private (out-of-pocket) expenditures on health care in Yemen wereamong the highest in the region.
High rates of gender inequality stubbornly persist, although some progress hasbeen made. Yemen ranks 121 out of 140 countries on the Gender DevelopmentIndex (UNDP, 2005). Although in 1990 female literacy was as low as 12.9 percent,compared with 55.2 for males, by 2002 the female rate had increased to 28.5 per-cent, compared with 69.5 percent for males. Only 33 percent of rural girls wereenrolled in school, compared with 73 percent of rural boys and 78 percent of urbangirls. Female adult illiteracy (at 78 percent in rural areas and 40 percent in urbanareas) is more than twice that of males (32 percent in rural areas and 15 percent inurban areas). Young and relatively educated women (age 15–29) have a higher rateof unemployment than their male counterparts: 56 percent of all female unem-ployment is among young women compared with 47 percent for young men(World Bank 2004a).
Achievability of the Millennium Development Goals
Yemen is unlikely to meet most of the Millennium Development Goals, except foruniversal primary education and child mortality (see Appendix Table A.18).
� Universal primary education is the goal most likely to be met in Yemen. Despitepoverty and rapid growth of the school age population, Yemen has been able to
Y E M E N T O D A Y 7
10414-01_Ch01.qxd 4/17/08 11:15 AM Page 7
increase gross enrollment rates from 73 percent to 83 percent over 1998–2002.However, the government and donors must make a strong and sustained com-mitment to mobilize resources and implement the policy and institutionalreforms needed, since global experience demonstrates that the last 5 percent isthe toughest to achieve.
� Reducing the mortality rate of children less than five years old (per 1000 live births)by two-thirds may be achievable, if neonatal and antenatal health care can beimproved. The mortality rate for this group went down from 142 in 1990 toabout 113 in 2003.
Nonetheless, targets on alleviating poverty, reducing gender inequality, safe-guarding maternal health, combating HIV/AIDS, and increasing access to environ-mental resources all seem much more elusive. At the current rate of progress, the goalof halving the percentage of people under the national poverty line is unlikely to bemet, but under optimistic scenarios the absolute poor (those living below the $1poverty line) could potentially be halved with sustained effort. Closing the persis-tent gender gap in secondary school enrollment is also unlikely, because of the cul-tural discrimination against girls and the high dropout rate for girls, linked largelywith early marriage. Early marriage and pregnancy, combined with the widespreadmalnutrition and anemia, the poor quality of health services, and the low levels ofhealth coverage, also challenge Yemen’s goal for reducing maternal mortality.Increasing the proportion of pregnancies covered by the health care system wouldgo a long way in achieving this goal. Limited financial and other resources will alsorestrict Yemen’s ability to achieve its goals of combating the spread of HIV/AIDS,malaria, tuberculosis, and other infectious diseases or halving the proportion ofpeople without sustainable access to safe drinking water. The water problem maybe addressed in urban areas with proper utility management and pricing, but ruralareas are threatened by overall depletion of aquifers due to unrestricted agriculturaluse of water.
The UN Millennium Project report estimated a total investment requirement ofUS$57.5 billion over 10 years to reach MDG goals. As recognized in the report, thesimple addition of costs of reaching individual goals is biased upwards because ofinterlinkages among targets. On an annual basis, the investment needs to meetMDGs amount to an astounding 38 percent of GDP, compared to the total expen-diture of central government of 40 percent of GDP in 2005. There is no definitefinancing plan to meet the investment requirements of MDGs for Yemen. Even if thedonors were willing to lend support for such massive investment efforts, it is not cer-tain Yemen will have the capacity to absorb this scale of investment in the near-term.
Implementation of the Poverty Reduction Strategy
The implementation of Yemen’s poverty reduction strategy remains tardy. Progressmade under Yemen’s first poverty reduction strategy during 2003 and 2004 fellshort of the targets in many respects. The main goal of reducing the percentage of
8 Y E M E N : D E V E L O P M E N T P O L I C Y R E V I E W
10414-01_Ch01.qxd 4/17/08 11:15 AM Page 8
the poor by 13 percent is not likely to have been met. It is most likely that povertyexperienced little change in the first two years of the poverty reduction strategy.Missed targets in the period include GDP growth, mortality indicators for infants,children and mothers, and access to water, roads, and electricity. However, therehave been some successes in meeting targets for basic education enrollment (forboth boys and girls), road rehabilitation and maintenance, power plant operationand expanded coverage for social protection (see Appendix Table A.19).
Stalled reforms and weak governance have hampered Yemen’s realization of itspoverty goals. The government attributes the weak performance to dampenedinvestor confidence and interest in the region following the Iraq War and a slow-down in economic reforms following the elections of April 2003. Insufficient actionto reform public sector management and governance may also have hampered theinvestment climate in Yemen. The unprecedented oil price increases since 2003 hadthe potential to offset any negative regional or internal security shocks. The gov-ernment opted, however, to delay key reform programs until mid-2005 and to con-tinue to subsidize domestic fuel at prices well below international levels. Thesemeasures contributed to a misallocation of scarce government resources, providedonly marginal benefits to Yemen’s poor, and added to the problems of governanceand corruption. Further delays in the adoption of an amended general sales tax—now scheduled for implementation on January 1, 2007—was also a setback, giventhe critical need for Yemen to shift to non-oil sources of revenue. The recent deci-sion to increase public wages and salaries also poses serious problems unless othermajor challenges in civil service wage structure of high compression ratio and exces-sive labor force are also not addressed in a timely manner.
Priorities for Reform
As Yemen strives to meet the challenges that lie ahead—including depleting oil rev-enues, weak governance, severe water stress, and burgeoning population growth—it must focus on easing the constraints that are most likely to bind its social andeconomic development. The reform agenda proposed here identifies those con-straints that pose immediate problems and longer-term risks, and it recommendsspecific remedies.
Growth diagnostics analysis is used here to identify the “binding” near-termconstraints. Low returns to investment are a constraint, as they negatively affect allpotential investors, whether foreign or domestic, and prevent private investmentfrom functioning as a driver of growth. Low returns to investment also lead to lowproductivity. Looking closer at the causes of low return to investment, three mainissues are identified as “binding” in the short term: weak property rights, inequitiesin the judicial system, and inadequate infrastructure for energy resources. These fac-tors have been confirmed by surveys and focus groups of local business owners. TheYemen Investment Climate Assessment (World Bank 2005a) also confirms thesefindings, while raising several additional concerns: potentially unstable macro-economic conditions and weaknesses in the tax and regulatory regimes. In fact,
Y E M E N T O D A Y 9
10414-01_Ch01.qxd 4/17/08 11:15 AM Page 9
more Yemeni firms reported feeling constrained by the investment climate than didfirms in most of the other Middle Eastern countries that participated in the assess-ment. Within the list of firms’ concerns, governance, regulations, unfair competition,and infrastructure (power and land) issues emerged as top constraints.20 Womenentrepreneurs are more constrained by some aspects of the Yemeni investmentclimate. Cultural norms and restrictions constrain women’s ability to participateas workers and entrepreneurs. In addition, lower rates of education and literacy,lack of critical mass, supportive institutions and services (including childcare andtransport) and entrepreneurial networks particularly constrain women.
The growth diagnostics and investment climate assessment have helped toidentify six priorities for reform that could secure better returns to private sectorinvestment:
� Strengthening governance and economic stability. Given the fragile or nearly fragilestate of Yemen’s political institutions, a study of the political economy of reformand institutions in Yemen is the focus of Chapter 2.
� Maintaining fiscal sustainability. Because the rapid depletion of oil reserves is goingto pose a daunting fiscal challenge, concerns about fiscal sustainability underpinthe pervasive concerns about Yemen’s macroeconomic stability and investmentclimate. Chapter 3 analyzes the prospects for better fiscal management to replacelost oil revenues.
� Improving the investment climate. Strengthening the governance environment forprivate sector development is addressed in Chapter 4, with emphasis on enforc-ing property rights, reforming the judicial system, and eliminating corruption.
� Managing energy resources. Reforms to better manage Yemen’s energy sectors,including oil, gas, and power, and to build more efficient downstream infra-structure is discussed in Chapter 5.
� Managing water resources. As Yemen faces a deepening water crisis because of dis-tortions in the pricing of water, the risk of failing to meet the minimum needs forpotable water could seriously compromise government’s goals, as discussed inChapter 6.
� Slowing population growth. Containing demand on social goods by slowing thegrowth of population, as discussed in Chapter 7, would also prove useful tostretch the rapidly dwindling resources of oil and water and help in the long runto promote growth by improving potential for savings by reducing the depen-dency ratio.
10 Y E M E N : D E V E L O P M E N T P O L I C Y R E V I E W
10414-01_Ch01.qxd 4/17/08 11:15 AM Page 10
Yemen’s recent history of weak governance, widespread corruption, and height-ened risk of internal conflicts has already prompted many careful analyses of
its political culture and economic policies. The reformers in Yemen have a goodunderstanding of what is needed. The political will for change is often weak, like inother developing countries, and the implementation of reforms often flounders. Thischapter examines Yemen’s political culture and recent reform experience to assess theprospects for broadly strengthening Yemen’s governance institutions and macro-economic stability. It looks in detail at reforms in Yemen since the mid-1990s to compare the period of strong reform in 1995–98 with the sluggish period thatfollowed, presenting an opportunity to observe how changes in institutional qualityaffect the implementation of economic policies.
The Quality of Governance
Public sector governance—the nexus of relationships among citizens, politicians,and the administrative bureaucracy of government—is perhaps the most evident andimportant barrier to economic development in Yemen today.
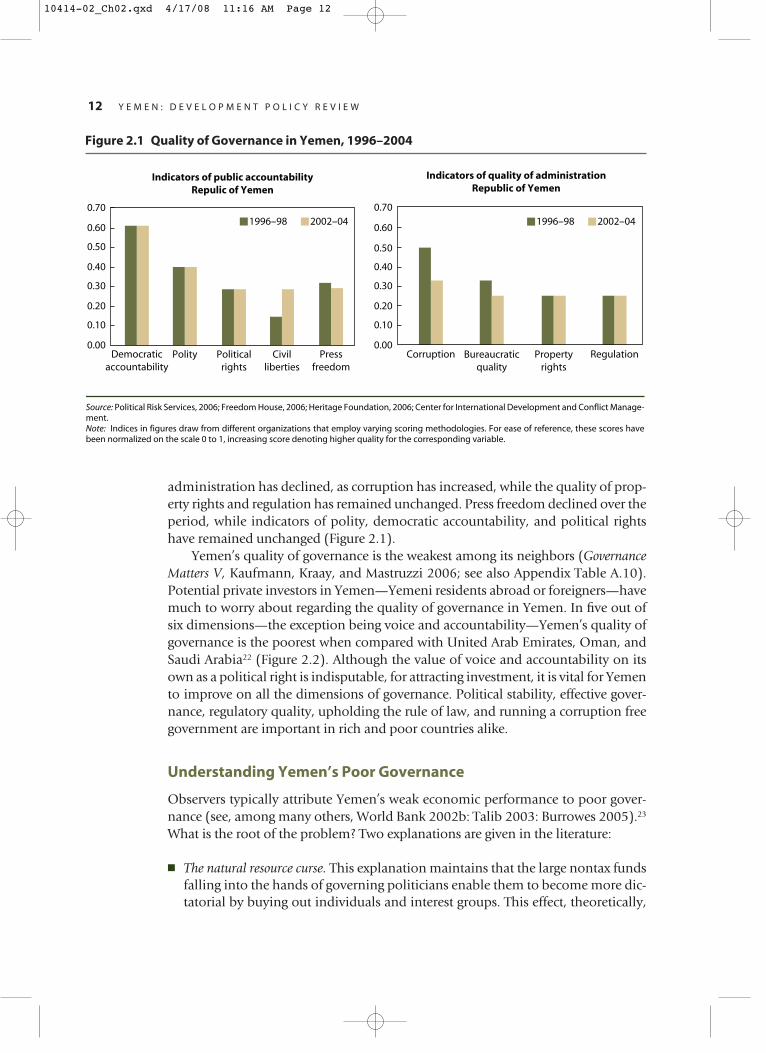
The poor functioning of market-supporting institutions blocks the entry ofmany new Yemeni businesses and constrains growth of established firms (WorldBank 2002). Using two alternative measures of governance quality, both of themfrom the World Bank, the conclusions remain the same. In most dimensions, thequality of governance worsened until 2004. By Kaufman et al measures of gover-nance (accountability, political instability and violence, government effectiveness,regulatory burden, rule of law, and control of corruption), the quality of governancein Yemen has mostly deteriorated since the mid-1990s to 2004, before improving in2005, as shown in Figure 1.1B (Chapter 1). The quality of governance has begunimproving in 2005 in two dimensions—control of corruption and regulatory qual-ity. By the alternative measures used by the World Bank (2003)21, which has dif-ferent dimensions of governance grouped under Public Accountability andBureaucratic quality, conclusions remain the same. The data from 1996 to 2004,spanning both active and sluggish reform periods, reveal that the quality of
11
Yemen TomorrowProspects for Good Governance and Economic Growth
2
10414-02_Ch02.qxd 4/17/08 11:16 AM Page 11
12 Y E M E N : D E V E L O P M E N T P O L I C Y R E V I E W
Indicators of public accountabilityRepulic of Yemen
0.00
0.10
0.20
0.30
0.40
0.50
0.60
0.00
0.10
0.20
0.30
0.40
0.50
0.60
0.70
Democraticaccountability
Polity Civilliberties
1996–98 2002–04 1996–98 2002–040.70
Indicators of quality of administrationRepublic of Yemen
Corruption Propertyrights
Regulation
Source: Political Risk Services, 2006; Freedom House, 2006; Heritage Foundation, 2006; Center for International Development and Conflict Manage-ment. Note: Indices in figures draw from different organizations that employ varying scoring methodologies. For ease of reference, these scores have been normalized on the scale 0 to 1, increasing score denoting higher quality for the corresponding variable.
Politicalrights
Pressfreedom
Bureaucraticquality
Figure 2.1 Quality of Governance in Yemen, 1996–2004
administration has declined, as corruption has increased, while the quality of prop-erty rights and regulation has remained unchanged. Press freedom declined over theperiod, while indicators of polity, democratic accountability, and political rightshave remained unchanged (Figure 2.1).
Yemen’s quality of governance is the weakest among its neighbors (GovernanceMatters V, Kaufmann, Kraay, and Mastruzzi 2006; see also Appendix Table A.10).Potential private investors in Yemen—Yemeni residents abroad or foreigners—havemuch to worry about regarding the quality of governance in Yemen. In five out ofsix dimensions—the exception being voice and accountability—Yemen’s quality ofgovernance is the poorest when compared with United Arab Emirates, Oman, andSaudi Arabia22 (Figure 2.2). Although the value of voice and accountability on itsown as a political right is indisputable, for attracting investment, it is vital for Yemento improve on all the dimensions of governance. Political stability, effective gover-nance, regulatory quality, upholding the rule of law, and running a corruption freegovernment are important in rich and poor countries alike.
Understanding Yemen’s Poor Governance
Observers typically attribute Yemen’s weak economic performance to poor gover-nance (see, among many others, World Bank 2002b: Talib 2003: Burrowes 2005).23
What is the root of the problem? Two explanations are given in the literature:
� The natural resource curse. This explanation maintains that the large nontax fundsfalling into the hands of governing politicians enable them to become more dic-tatorial by buying out individuals and interest groups. This effect, theoretically,
10414-02_Ch02.qxd 4/17/08 11:16 AM Page 12
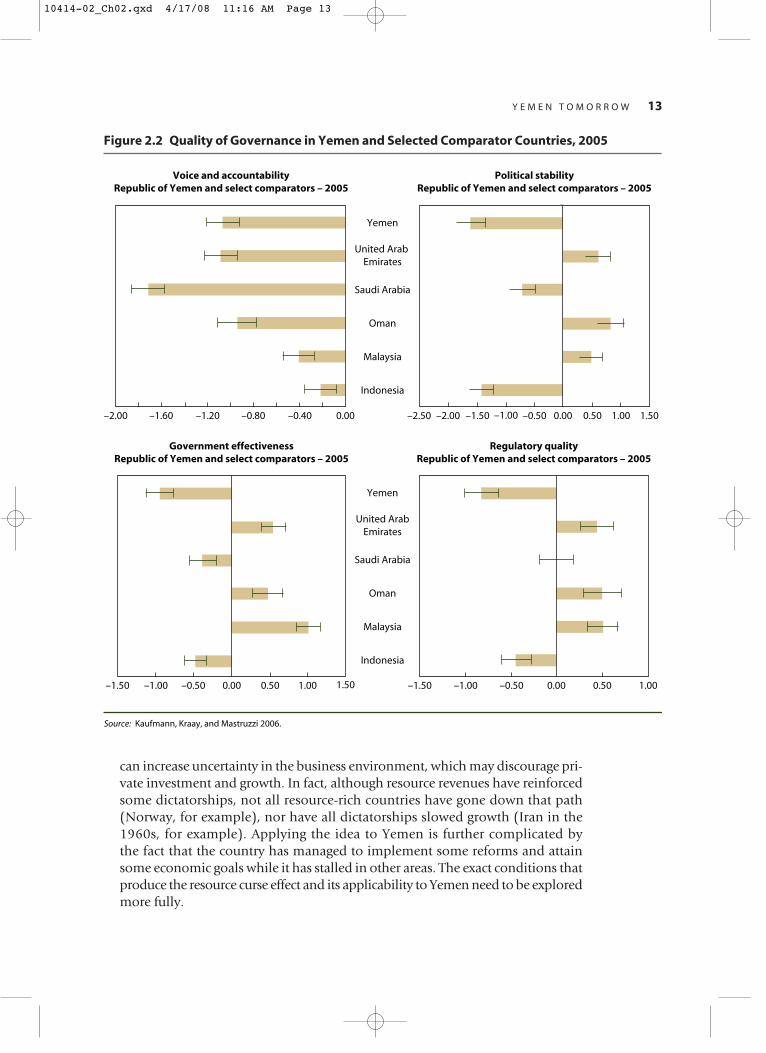
can increase uncertainty in the business environment, which may discourage pri-vate investment and growth. In fact, although resource revenues have reinforcedsome dictatorships, not all resource-rich countries have gone down that path(Norway, for example), nor have all dictatorships slowed growth (Iran in the1960s, for example). Applying the idea to Yemen is further complicated by the fact that the country has managed to implement some reforms and attainsome economic goals while it has stalled in other areas. The exact conditions thatproduce the resource curse effect and its applicability to Yemen need to be exploredmore fully.
Y E M E N T O M O R R O W 13
Voice and accountabilityRepublic of Yemen and select comparators – 2005
–2.00
Government effectivenessRepublic of Yemen and select comparators – 2005
Source: Kaufmann, Kraay, and Mastruzzi 2006.
0.00
0.00 0.50 1.00 1.50–0.50–1.00–1.50 0.00 0.50 1.00–0.50–1.00–1.50
–0.40–0.80–1.20–1.60 –2.00–2.50 1.501.000.500.00–1.00 –0.50–1.50
Indonesia
Malaysia
Oman
Saudi Arabia
United Arab Emirates
Yemen
Indonesia
Malaysia
Oman
Saudi Arabia
United ArabEmirates
Yemen
Political stabilityRepublic of Yemen and select comparators – 2005
Regulatory qualityRepublic of Yemen and select comparators – 2005
Figure 2.2 Quality of Governance in Yemen and Selected Comparator Countries, 2005
10414-02_Ch02.qxd 4/17/08 11:16 AM Page 13
� Traditional and tribal institutions. Yemen’s traditional institutions, especially itstribal structure, have evolved with the development of modern state institutionsand technology (Carapico 1998) which continue to survive as mechanisms thatcoordinated individuals within small groups to provide security and support foreach other, at the cost of broader interests and impersonal exchange. Such struc-tures may impede governance reforms because they can add to the costs of form-ing broad coalitions representing nationwide interests. If these are indeed theforces that have kept Yemen underdeveloped, they may have far-reaching impli-cations for the development of the country. Again, however, the theoretical expla-nation needs to be consistent with evidence of the government’s macroeconomicstabilization and trade liberalization, as well as the pattern of corruption and eco-nomic stagnation. Yemen’s current political culture is a blend of ancient tribalcultures and modern political institutions, including informal parties and formalinstitutions of government.
Tribal culture
Perhaps the most notable historical feature of Yemeni society is the significant roleof tribal institutions, particularly in the harsher North (Manea 2000). Althoughthe triumphant republicans who established Yemen Arab Republic in the Northwere determined to develop new state institutions and modernize the economy,the legacy of tribal institutions limited the power of the republican state to exert fullcontrol and bring about improvement in many areas of life in Yemen, geographi-cally and politically. In the southern parts of Yemen, better opportunities for settledagriculture had facilitated transition to more feudal relations long ago. The Britishrule from 1834 to 1967 and the socialist regime between 1967–90 managed to fur-ther weaken tribal relations, especially around Aden (Manea 2000). However, evenin that region, the state never became a sufficiently strong source of allegiance toovershadow the influence of kinship and other traditional groupings on economicand political exchange.
Because state capacity to deliver services is limited, in many parts of the coun-try, especially the northern highlands, the tribal system still provides an impor-tant mechanism for community organization. With the exception of villages thatare close to urban areas, the structure of the modern nation state has only mar-ginally touched rural areas. While rural inhabitants are increasingly relying ongovernment services and institutions, they often have to go outside their villagesto access these. As a result, tribal shaykhs24 continue to play a convening role bothin mobilizing the community for collective purposes and serving as the commu-nity’s interlocutors, lobbying local and central government for development pro-jects.25
Tribes have also managed to adapt to the development of modern state and mar-kets, and not only live with them, but penetrate and control them as much as possi-ble, using kinship and tribal culture as strong glues to maintain the cohesion of theirnetworks (Dresch 2000: 196–98). The majority of the cabinet members or parlia-mentarians are not tribal leaders. Yet, tribes also have had effective means of resist-
14 Y E M E N : D E V E L O P M E N T P O L I C Y R E V I E W
10414-02_Ch02.qxd 4/17/08 11:16 AM Page 14

ing the extension of government authority in some areas and their norms sometimesdefy political obligation to the state.
Thus tribal networks affect governance. One important implication of the frag-mentation and polarization in Yemen is that security and trust are major concernsthat give everyone, especially leading politicians, a preference to work with peoplewho are close to them by kinship and by long-term relations. This obviously limitsthe choices for each position and causes two major governance problems. First, manypositions end up being filled by individuals who are not best suited for conductingpublic policy. Second, the cost of misconduct in public office diminishes for theappointees because in cases of malfeasance, those who should be administering dis-cipline do not have the interest or sufficient options to take the necessary actions;they depend on those appointees and do not have many replacements for them.
Political parties
By far, the largest party is the General Peoples’ Congress (GPC), which was formedbefore unification to bring together most Northern political parties, tribal leaders,and political figures. GPC’s inclusiveness and flexible framework proved to be a suc-cessful strategy for winning a large block of seats and taking over the executive powerafter unification. The party has increased its share of parliamentary seats from 40 per-cent in 1993 to 79 percent in 2003.26 However, this success has come at the cost of avague platform, a lack of party discipline, and an implicit requirement to act as apatronage machine.
Southern elites also entered the unified government with their preexisting party,Yemen Socialist Party (YSP), hoping to gain broader mass support in the North.Although YSP appeared to have a more cohesive program and ideology, its appealwas narrower and more distant from the grassroots culture of Yemen at the time.Nevertheless, YSP’s modernist redistributive ideology maintains some following,especially in the South. Between 1993 and 2003, YSP’s share of parliamentary seatshas declined from 18.6 percent to 2.7 percent (18.8 percent and 3.8 percent, respec-tively, for the share of popular vote). Between GPC’s realpolitik and YSP’s leftist ide-ological platforms, there is a range of smaller parties: some left-leaning parties thattypically appeal to Arab nationalism (Baath and Nasserite) or religious parties (Islahand Ikhwan al-Muslimeen). Islah grew quickly in the early 1990s because it offeredan appealing compromise between tradition, religion, and modernism and adopteda pragmatic approach to economic policies. Islah’s share of seats have declined from20.9 percent in 1993 to 15.3 percent in 2003, while its share of total votes haveincreased from 17.3 percent to 22.6 percent during the same period.
Formal governmental institutions
Under the current constitution, Yemen has an elected president and parliament, aswell as a judiciary system to administer laws in accordance with Islamic jurisprudence.The presidency is a powerful office and its role has expanded over time. The powersof presidency and his own political skills and assets have enabled the President not
Y E M E N T O M O R R O W 15
10414-02_Ch02.qxd 4/17/08 11:16 AM Page 15
only to get reelected in 1999, but to initiate another constitutional amendment tofurther extend the presidential and legislative terms.
Yemen’s parliament has historically been in a weak position relative to the pres-ident, who holds dominance over the budget process and thus can reward and pun-ish members of parliament selectively and bring many of them into line. Thismechanism may in fact account for GPC’s significant gains in elections and its abilityto attract electable independent candidates, or even members of other parties. Theexecutive dominance over budget has further disadvantaged the parliament by effec-tively depriving it from having its own source of day-to-day expert advice on techni-cal matters concerning public policy. The judiciary’s weak performance, however, isnot entirely rooted in its politically vulnerable structure. The legal system is based ona mixture of Islamic law, customary law, vestiges of Ottoman codes, and Egyptian-patterned commercial, civil, and criminal codes. Customary and modern lawscoexist—each mediated by sets of different institutions (tribal shaykhs and courts)—but the state rarely interferes with tribal justice systems; the inconsistencies betweenmodernlaws and customary law are also a significant problem. In particular, these arenot always compatible with modern form of property rights and economic activity.
Lately, under the National Reform Agenda, the Presidential powers are beingnarrowed. The president is no longer the head of the Supreme Judicial Council andthe central auditing agency does not have to report first to the President.
As discussed in Chapter 4, the judiciary faces some familiar administrative prob-lems, including insufficient legal training of staff, inadequate administrative systemsand facilities, and heavy caseloads, as well as widespread corruption. It also faces anumber of difficult problems specific to Yemen. Land and property disputes repre-sent immense proportion of legal battles in Yemen. This is to some extent due toproperty confiscations in the South during the socialist regime, which are now diffi-cult to trace back. However, a far bigger problem is untitled lands that have gainedvalue and areas that have changed hands among tribes over decades. As a result, ordi-nary citizens are often discouraged from using the legal system and resort to tradi-tional dispute resolution mechanisms, so that access to justice is often arbitrary andinequitable. Too frequently tribal disputes turn into armed conflict, as a cursory lookat day-to-day news in Yemeni media quickly reveals. Furthermore, the constitutionalrequirement that makes Islamic law the source of all laws is not always easy to imple-ment, because it is not clear how new issues must be addressed, or how tribal andother customs can be brought into compliance (ARD, Inc. 2004). One consequenceof all these difficulties is that many disputes continue to be settled through tradi-tional mechanisms and the legal environment remains inhospitable for the expan-sion of modern industry, especially foreign direct investment.
Understanding Yemen’s Recent Economic Experience
At the end of 1994, the ruling elites in Yemen’s new coalition government faced aneconomy in crisis, but had rising revenues from oil exports to address the problems.However, some coordination was still needed to keep spending under control in theface of factional demands on the budget. How did they perform?
16 Y E M E N : D E V E L O P M E N T P O L I C Y R E V I E W
10414-02_Ch02.qxd 4/17/08 11:16 AM Page 16
Economic performance Issues under the coalition government
Although a variety of factors favored coordination (including the consolidation ofpolitical power in the new government and the strong pressure of donors whooffered large payoffs for coordinating over the deficit reduction policies27), the coali-tion government in 1994 did not have the ability to coordinate fiscal policy and carryout a thorough and efficient tax and budgetary reform. It mainly chose to slow downthe pay increases for government employees and contractors across the board, whichhelped make coordination much easier than a thorough prioritization and restruc-turing of government activities. There were attempts at some ministries and piece-meal progress was made in some units and ministries depending on the abilities andpersonalities of policymakers in charge. But, even those efforts were often hamperedby lack of coordination across departments. The same factors can help explain theuneven and often slow progress toward privatization, civil service reform, and infra-structure and public service development.
Why did similar factors not block trade liberalization? Trade restrictions inYemen before 1995 were not so much a means of protection as they were fiscal toolsto generate revenue for the government or, in the case of quotas, for the traders. Thismeant that there were few producers who would be hurt by tariff reductions, com-pared with the benefits that the buyers of imports could reap. In fact, most businessesin Yemen could benefit from cheaper imports because they were not competing withthose products. So, as soon as oil revenues increased, the government’s motive to relyon trade restriction as a source of revenue greatly diminished. Moreover, with theexpanded capacity to import, consumers’ loss from protection rose sharply, but thebenefits to potential producers remained unchanged, thus tilting the political calcu-lus of trade policy toward liberalization (Esfahani and Squire 2006).
A key question is why subsidies rose in the midst of attempts to impose fiscalausterity. A possible answer comes from the nature of Yemen’s political system.The public has a limited ability to put pressure on politicians through elections andriots, but cannot ensure that those who are elected will safeguard its interests. As aresult, it is possible that citizens use their limited powers to extract whatever rentsthey can from the government (Esfahani 2002). Since they cannot make sure thatany additional money in the treasury will be turned into better services and otherbenefits for the public, they ask for their share upfront, through subsidies on prod-ucts that are broadly used, especially the product that is the source of governmentrevenue—oil. Rather than letting the government charge a high price for oil prod-ucts and waiting for the politicians to put it to good use, citizens demand that theprice be kept low so that they can enjoy the immediate rent. Since this demand iscontingent on the price that everyone pays, the public has an easy way of mobiliz-ing against the government whenever the price rises, hence the continuation of thesubsidy and the phenomenon that it rises as the resource rents rise.
Economic performance since 1998
As political power consolidated in the hands of the president after 1998, Yemen’smacroeconomic policies produced a very stable, albeit stagnating, economy. A key
Y E M E N T O M O R R O W 17
10414-02_Ch02.qxd 4/17/08 11:16 AM Page 17
feature of this experience is the generally high oil revenues and the ability of the gov-ernment to manage its finances to build reserves and smooth out its expenditures.The government’s success in making this stability possible is all the more note-worthy given the decline in worker remittances, the export revenue shocks of 1998and 2003, and the fluctuations in other oil-exporting countries. This is a majorachievement that is closely related to the consolidation of power in the hands ofpolicymakers who have long horizons in office (Alesina and Perotti 1999). Nonethe-less, many economic reforms have stalled since 1998, and economic performancehas slackened:
� Inflation-depreciation tradeoff. Despite stable output and high reserves, inflation hasedged up to double-digit figures, although remaining rather steady. This seems tobe due to the difficulties in managing adjustments in prices and the lingeringeffects of subsidies that occasionally need to be reduced. As the government raisessome administered prices, some inflation is induced. Rather than trying to fightthe inflation by cutting back on aggregate demand, the government allows theinflation rate to remain at moderate levels. The only difficulty in this situation isthat the government is not devaluing the exchange rate fast enough, out of con-cern about further inflation. Consequently, the real exchange is appreciating andhurting whatever nonoil export incentives could exist.
� Investment rates. Although the government has raised its investment in infra-structure and some public services, the outputs of those activities remain largelyinadequate and contribute to the weak incentives for the private sector, thuskeeping the overall investment rate low. The government has found market solu-tions to some infrastructure and public service problems. In particular, the coun-try’s major telephone shortages have been relieved largely with the help ofmobile telephone systems. However, similar approaches have not worked in thecase of electricity where the regulatory contracting is more complex and demand-ing. As a result, electricity shortages in rural areas and blackouts in urban areasare continuing problems.
� Allocations to education and health. Among other public services, education is per-haps the only sector which has received increased budget allocations and shownsome results. This might be a self re-enforcing process, whereby the initial expan-sion of education in the mid-1990s created a large civil service force of more thanhalf public employment. This group now offers a block of votes that cannot beignored. This political support, together with strong backing from foreign donorsand broad interest from domestic constituents, seems to have kept the educationbudget high. In contrast, public health care has remained in a fragile state, andmost of the population has had to rely on private healthcare. Even private health-care remains limited, and public services such as immunizations are not widelydelivered.
� Capacity of the civil service. Major weaknesses in healthcare, education, and infra-structure are part of the larger civil service deficiencies that plague the entireYemeni administration. The government’s failure to reform the system and builda more effective and disciplined civil service is rooted in the regime’s central
18 Y E M E N : D E V E L O P M E N T P O L I C Y R E V I E W
10414-02_Ch02.qxd 4/17/08 11:16 AM Page 18

dilemma: how can the political leadership guarantee that the reform will be car-ried out properly and the results serve the purpose of maintaining the regime?This is a difficult problem because civil service reform cuts across all parts of thegovernment and requires massive cooperation and strong leadership. The prob-lem is further compounded by the uncertainty and illusiveness of benefits—several years from now a reformed bureaucracy may encourage investment andhelp generate more jobs and higher incomes. Meanwhile, the political leadershipwill have to bear the cost of convincing a large part of the population to take risksand trust a system that does not have a strong record of success. Putting all theseconsiderations together shows a good part of the forces that have held civil ser-vice reform back. The analysis also shows why starting first with a policy withmore tangible and immediate results, such as export promotion, can create pos-itive forces for more fundamental change down the road.
� Microeconomic reforms. Concerning microeconomic policies, the liberal traderegime has continued, with imports being relatively steady and non-oil exportsremaining low. The forces that induce liberalization—significant import capacityand a small import-competing sector—are by and large unchanged. Privatizationsaw some action in the case of small public enterprises in the early years after con-solidation of power. However, the process came to a halt when the turn came tolarger enterprises and resistance from their constituencies grew. The governmentmay have been able to proceed with privatization. But, there are probably threeconsiderations that have caused hesitation. First, private investment is already lowand attracting buyers for the large public enterprises is difficult. Second, even ifsuch investors can be found, there is no guarantee that they may not temporarilyoperate those enterprises and then close them down. Finally, the government mayhave to offer some support to the private sector anyway to keep the enterprisesoperational. Its current transfers achieve that end within a system that alreadyworks. Since budget constraint is not tight at present, the costs of maintainingpublic enterprises appears lighter than they were in the mid-1990s, hence lessurgency to privatize them.
� Subsidies. In the case of market controls, large energy subsidies have continuedunder the consolidated regime, though the greater control of the government andthe prospects of exhaustion seem to be motivating the policymakers to raise priceswith greater determination, as the experience of the fuel price increase in July 2005has shown. However, the public continues to suspect that the funds raisedthrough price hikes will not be turned into broad benefits, and there is plenty ofevidence from the past and current performance of the administration to supportthat suspicion. Therefore, the ultimate solution may have to wait until more fun-damental institutional reforms take place, or until there are no resource rents leftto distribute.
� Decentralization.28 Finally, it is important to mention an initiative in Yemen toreform through devolution of power to subnational governments. In Yemen, thelaw provides a mechanism for formalizing traditional democratic practices thathave served Yemeni society well and can also help mitigate the recent trend inpower concentration among a handful of shaykhs. It also builds on Yemen’s strong
Y E M E N T O M O R R O W 19
10414-02_Ch02.qxd 4/17/08 11:16 AM Page 19

tradition of promoting consultation and consensus in decision making, rootedboth in tribal and Islamic tradition. The principle of mutual consultation (shu-rah), consensus (ijma) and independent interpretive judgment (ijtihad) are impor-tant bases for communal decisionmaking and are recognized as essentialprocesses both within tribes and among them. There is a strong tradition of build-ing coalitions through consensus to counterbalance tendencies toward fragmen-tation. Teachers account for nearly 40 percent of those elected to district councilsand shaykhs and civil servants each account for roughly 7 percent of office hold-ers. The overwhelming number of teachers among the ranks of council memberssuggests the electorate votes on the basis of perceived qualifications, rather thansocial status. Decentralized governance presents a potential for improved publicdelivery systems, is anchored in traditional systems of governance, and has animportant precedent in the popular Local Development Association movementthat was active in the Highlands during the 1970s. The LDAs lost their earliercommunity-based character and weakened as central control increased and fundswere transferred to the central government. The interest in decentralization hasbeen reaffirmed in the constitutional amendments of 2001 and the governmenthas indicated support for the policy. In recent years, local councils have beenelected to supervise the management of the districts and governorates, though theadministration and budget remain highly centralized. This situation has not beenvery conducive to the solution of local problems. Many policy analysts have sug-gested that the administrative offices should also be turned to the localities andbe funded by block grants out of central government revenues. Of course, for thisto work well, many complementary institutions and policies are also needed. So,like many other reform proposals, such a reform entails risks that need to be man-aged by an effective central administration. This reform is unlikely to materializeif the government’s central problem is not solved.
Building the Will for Reform
A major concern inside and outside Yemen is that continuation of the current con-ditions will render it a failed state once oil revenues run out in the next decade. With-out oil, export revenues and government finances could crash, and the economy mayenter a free fall situation, bringing down with it the political and social system, as dif-ferent groups, especially the well-armed tribes, make desperate efforts to survive atthe cost of each other. Some of the economic implications ahead for Yemen areexamined in the next chapter and modeled in detail in the Appendix. The basic ques-tion, however, is whether the political system in Yemen has the means to reformitself and avoid the dire circumstances that are likely to lie ahead.
Yemen has weathered very difficult circumstances and has enough experiencewith building coalitions that the necessary political and economic adjustments arenot insurmountable. Yemeni tribes have particularly grown resilient to high leveltensions and can still come together to deal with crises, especially if supported by theinternational community. Nonetheless, this political analysis suggests that the risksare not negligible. The problem is that the concentration power has raised the stakes
20 Y E M E N : D E V E L O P M E N T P O L I C Y R E V I E W
10414-02_Ch02.qxd 4/17/08 11:16 AM Page 20
and has hardened the positions of most players. The dominance of uneducated,unemployed, and poor young people in the population also provides armies of footsoldiers for conflicts that can be triggered by uncalculated moves. Already, guns areplentiful and intertribe conflicts claim many young lives every year. It is true that thetribes themselves might play positive roles in containing their fighters, but those whoare not part of such networks may decide to enter the equation and trigger conflict.Therefore, it is possible that in the event of a major economic or political crisis, thesituation may get out of hand. To avoid such disastrous possibilities, a shifting eco-nomic strategy is essential, as described in Chapter 3, as well as specific institutionalreforms to improve the investment climate, as described in Chapter 4.
How can Yemen build incentives for better governance and less risk of internaldisruption around a strategy that promotes economic growth? The analysis here sug-gests that efforts should be put in building consensus around a new growth strategy,with focus on non-oil exports. The export-oriented strategy can offer gauges by whichsuccess is measured and contributions are evaluated. It can also offer means of build-ing trust in the government and softening the public’s position on subsidies. Even-tually, even tribal connections, which have been a source of fragmentation, may beturned into commerce and business networks that help bring healthy competitionto the economy in place of armed conflict.
Y E M E N T O M O R R O W 21
10414-02_Ch02.qxd 4/17/08 11:16 AM Page 21

10414-02_Ch02.qxd 4/17/08 11:16 AM Page 22
Weak fiscal management lies at the root of macroeconomic instability inYemen. The track record of fiscal management has not been favorable,
except for a brief period under an era of successful macroeconomic stabilization(1995–98), as mentioned in Chapter 2. The country’s oil and gas wealth is beingsteadily eroded by inadequate fiscal efforts to raise taxes and save on subsidies. Thischapter reviews the track record of fiscal management in Yemen since 1990 and thendevelops a long-term outlook (2005–25) to guide where Yemen is heading in thisregard. The long-term outlook looks challenging, with oil production set to declinerapidly. The outlook points to the conclusion that Yemen is likely to become mod-erately stressed regarding the sustainability of its external debt, as oil revenues fall.A reform agenda is developed to help balance the declining revenues by fosteringgrowth and controlling public expenditures. Nonetheless, Yemen’s fiscal sustain-ability is in serious peril, even if the reforms identified in this study are carried out.
Yemen’s Track Record on Fiscal Sustainability
After improving during the stabilization period of 1995–98, fiscal prudence hasweakened in the past five years. With over 70 percent of government revenuesattributed to oil, the overall fiscal balance in Yemen has closely followed the for-tunes of oil revenues (Figure 3.1). During the period of stabilization, the overallfiscal deficit remained around 6 percent of GDP, and the non-oil fiscal deficit wasreined back to 15 percent of GDP by reducing subsidies. The other main achievementduring this period was switching the financing of the deficit away from monetaryfinancing to sales of treasury bills to the general public. The oil price boom in 2000fetched a 10 percent increase in oil revenues, which was prudently used to repaypast advances from the Central Bank, partly helped by the expenditure restraintrequired under an IMF program (covering 1999–2001). Buoyant oil revenues(around 25 percent of GDP) in the past five years have helped Yemen run an over-all fiscal surplus in 2000–01 and then maintain a fiscal deficit below 5 percent ofGDP. However, indicators of fiscal sustainability have steadily worsened since1999 (Figure 3.2). In oil-exporting countries, it is more appropriate to look at the
23
Maintaining FiscalSustainability
3
10414-03_Ch03.qxd 4/17/08 11:16 AM Page 23
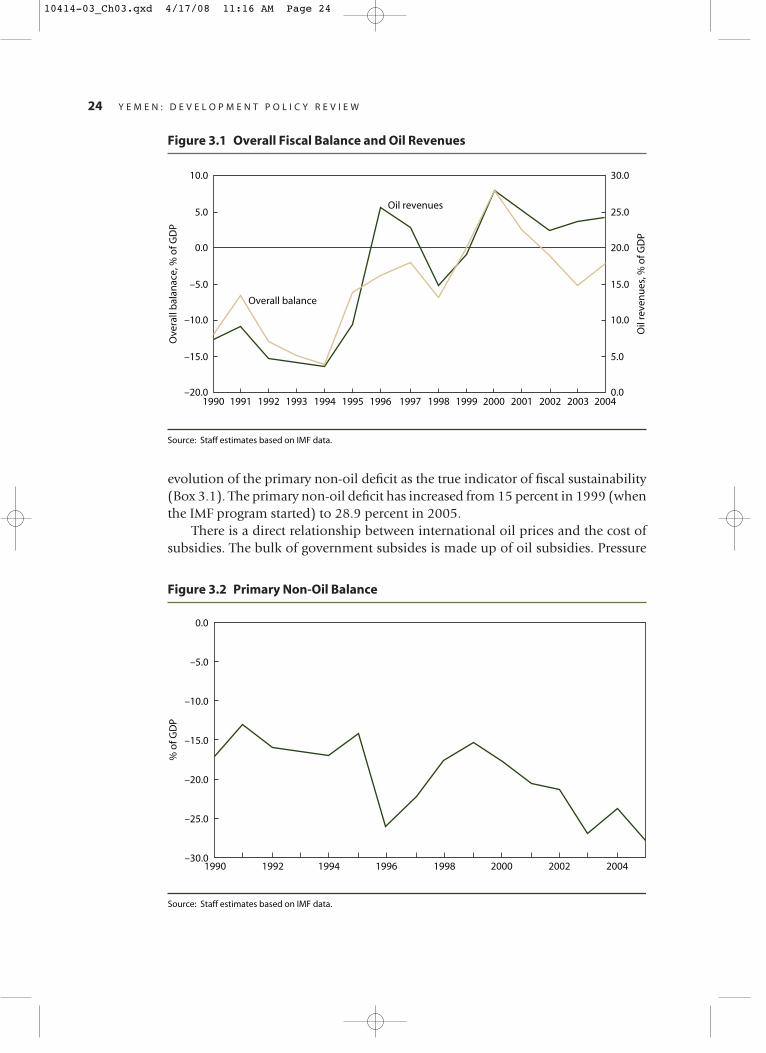
evolution of the primary non-oil deficit as the true indicator of fiscal sustainability(Box 3.1). The primary non-oil deficit has increased from 15 percent in 1999 (whenthe IMF program started) to 28.9 percent in 2005.
There is a direct relationship between international oil prices and the cost ofsubsidies. The bulk of government subsides is made up of oil subsidies. Pressure
24 Y E M E N : D E V E L O P M E N T P O L I C Y R E V I E W
Figure 3.1 Overall Fiscal Balance and Oil Revenues
Figure 3.2 Primary Non-Oil Balance
–20.0
–15.0
–10.0
–5.0
0.0
5.0
10.0
1990 1992 1994 1996 1998 2000 20021991 1993 1995 1997 1999 2001 2003 2004
Ove
rall
bal
anac
e, %
of G
DP
0.0
5.0
10.0
15.0
20.0
25.0
30.0
Oil
reve
nu
es, %
of G
DP
Overall balance
Oil revenues
Source: Staff estimates based on IMF data.
–30.0
% o
f GD
P
–25.0
–20.0
–15.0
–10.0
–5.0
0.0
1990 1992 1994 1996 1998 2000 2002 2004
Source: Staff estimates based on IMF data.
10414-03_Ch03.qxd 4/17/08 11:16 AM Page 24
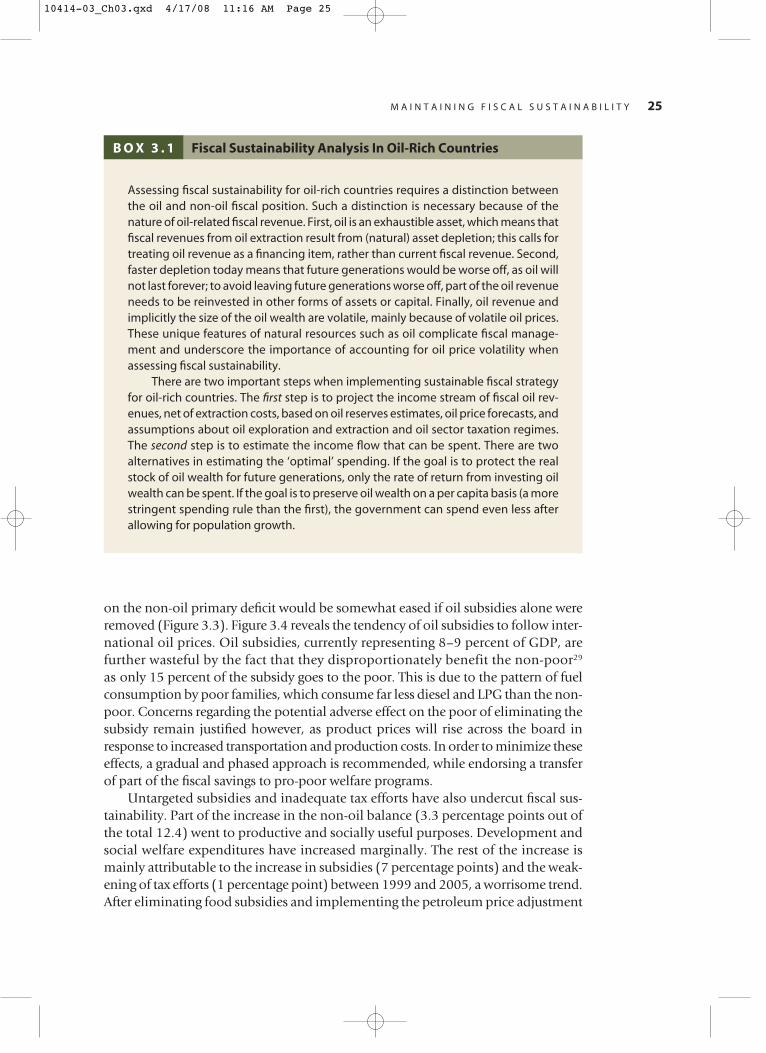
on the non-oil primary deficit would be somewhat eased if oil subsidies alone wereremoved (Figure 3.3). Figure 3.4 reveals the tendency of oil subsidies to follow inter-national oil prices. Oil subsidies, currently representing 8–9 percent of GDP, arefurther wasteful by the fact that they disproportionately benefit the non-poor29
as only 15 percent of the subsidy goes to the poor. This is due to the pattern of fuelconsumption by poor families, which consume far less diesel and LPG than the non-poor. Concerns regarding the potential adverse effect on the poor of eliminating thesubsidy remain justified however, as product prices will rise across the board inresponse to increased transportation and production costs. In order to minimize theseeffects, a gradual and phased approach is recommended, while endorsing a transferof part of the fiscal savings to pro-poor welfare programs.
Untargeted subsidies and inadequate tax efforts have also undercut fiscal sus-tainability. Part of the increase in the non-oil balance (3.3 percentage points out ofthe total 12.4) went to productive and socially useful purposes. Development andsocial welfare expenditures have increased marginally. The rest of the increase ismainly attributable to the increase in subsidies (7 percentage points) and the weak-ening of tax efforts (1 percentage point) between 1999 and 2005, a worrisome trend.After eliminating food subsidies and implementing the petroleum price adjustment
M A I N T A I N I N G F I S C A L S U S T A I N A B I L I T Y 25
B O X 3 . 1 Fiscal Sustainability Analysis In Oil-Rich Countries
Assessing fiscal sustainability for oil-rich countries requires a distinction betweenthe oil and non-oil fiscal position. Such a distinction is necessary because of thenature of oil-related fiscal revenue. First, oil is an exhaustible asset, which means thatfiscal revenues from oil extraction result from (natural) asset depletion; this calls fortreating oil revenue as a financing item, rather than current fiscal revenue. Second,faster depletion today means that future generations would be worse off, as oil willnot last forever; to avoid leaving future generations worse off, part of the oil revenueneeds to be reinvested in other forms of assets or capital. Finally, oil revenue andimplicitly the size of the oil wealth are volatile, mainly because of volatile oil prices.These unique features of natural resources such as oil complicate fiscal manage-ment and underscore the importance of accounting for oil price volatility whenassessing fiscal sustainability.
There are two important steps when implementing sustainable fiscal strategyfor oil-rich countries. The first step is to project the income stream of fiscal oil rev-enues, net of extraction costs, based on oil reserves estimates, oil price forecasts, andassumptions about oil exploration and extraction and oil sector taxation regimes.The second step is to estimate the income flow that can be spent. There are twoalternatives in estimating the ‘optimal’ spending. If the goal is to protect the realstock of oil wealth for future generations, only the rate of return from investing oilwealth can be spent. If the goal is to preserve oil wealth on a per capita basis (a morestringent spending rule than the first), the government can spend even less afterallowing for population growth.
10414-03_Ch03.qxd 4/17/08 11:16 AM Page 25
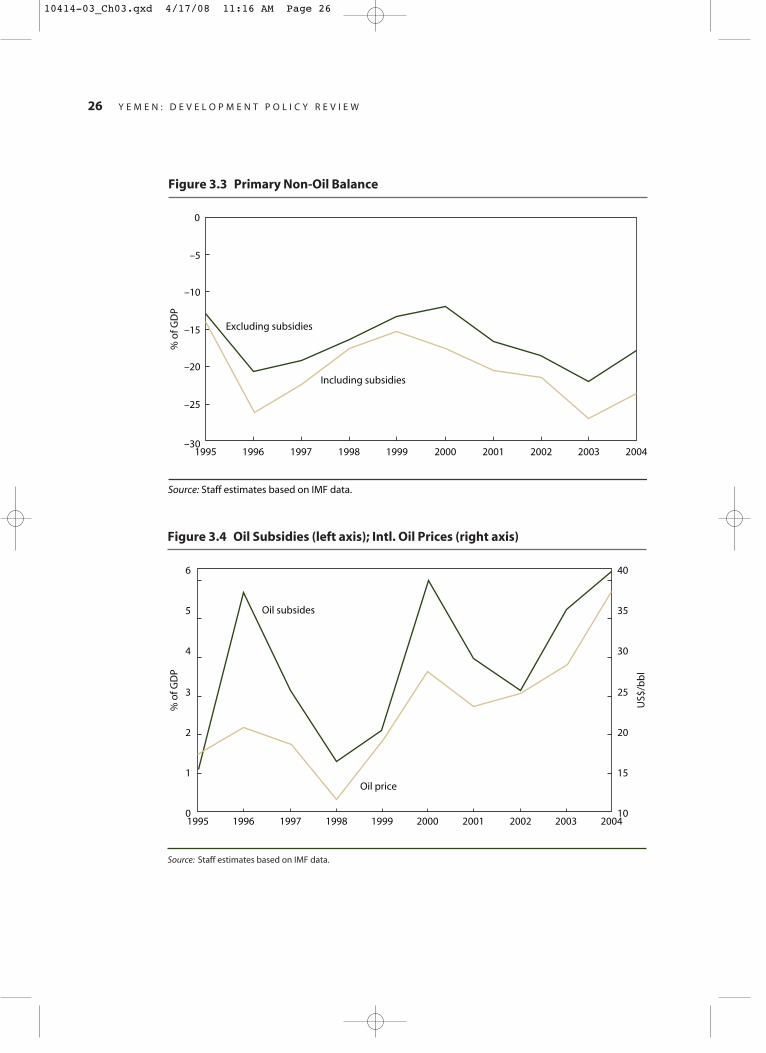
26 Y E M E N : D E V E L O P M E N T P O L I C Y R E V I E W
Figure 3.3 Primary Non-Oil Balance
Figure 3.4 Oil Subsidies (left axis); Intl. Oil Prices (right axis)
–30
–25
–20
–15
–10
–5
0
1995 1996 1997 1998 1999 2000 2001 2002 2003 2004
Including subsidies
Excluding subsidies
Source: Staff estimates based on IMF data.
% o
f GD
P
0
1
2
3
4
5
6
1995 1996 1997 1998 1999 2000 2001 2002 2003 2004
% o
f GD
P
10
15
20
25
30
35
40
US$
/bb
l
Oil subsides
Oil price
Source: Staff estimates based on IMF data.
10414-03_Ch03.qxd 4/17/08 11:16 AM Page 26
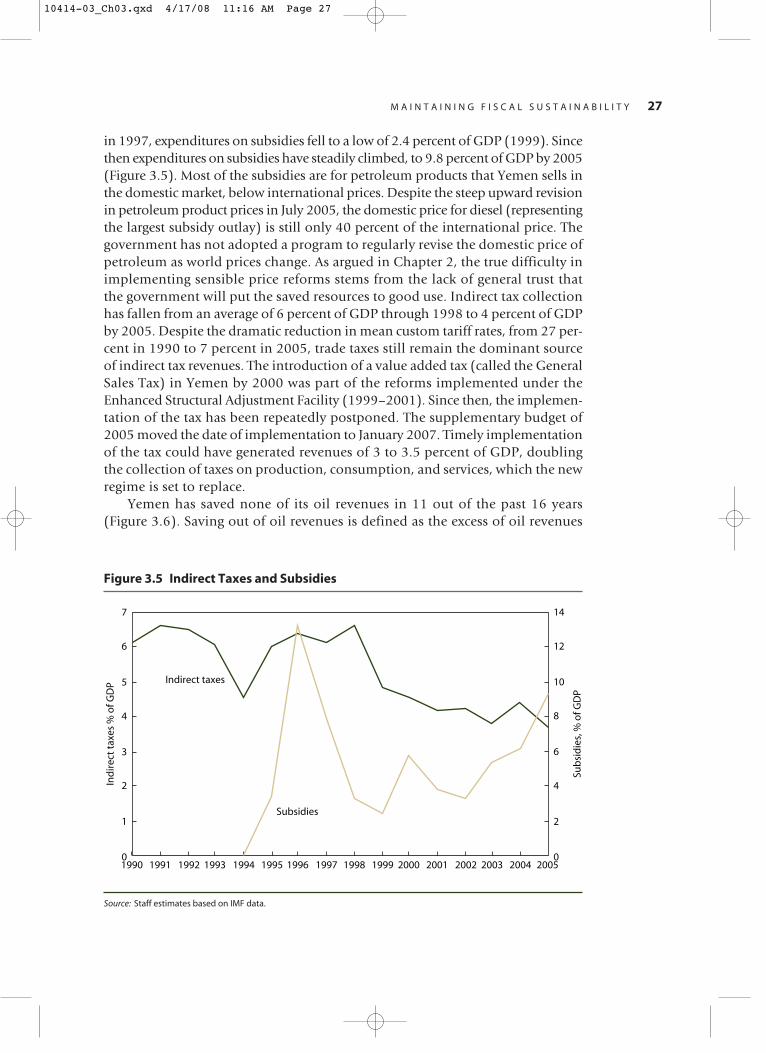
M A I N T A I N I N G F I S C A L S U S T A I N A B I L I T Y 27
Figure 3.5 Indirect Taxes and Subsidies
0
1
2
3
4
5
6
7
1990 1992 1994 1996 1998 2000 2002 20041991 1993 1995 1997 1999 2001 2003 2005
Ind
irec
t ta
xes
% o
f GD
P
0
2
4
6
8
10
12
14
Sub
sid
ies,
% o
f GD
P
Indirect taxes
Subsidies
Source: Staff estimates based on IMF data.
in 1997, expenditures on subsidies fell to a low of 2.4 percent of GDP (1999). Sincethen expenditures on subsidies have steadily climbed, to 9.8 percent of GDP by 2005(Figure 3.5). Most of the subsidies are for petroleum products that Yemen sells inthe domestic market, below international prices. Despite the steep upward revisionin petroleum product prices in July 2005, the domestic price for diesel (representingthe largest subsidy outlay) is still only 40 percent of the international price. Thegovernment has not adopted a program to regularly revise the domestic price ofpetroleum as world prices change. As argued in Chapter 2, the true difficulty inimplementing sensible price reforms stems from the lack of general trust thatthe government will put the saved resources to good use. Indirect tax collectionhas fallen from an average of 6 percent of GDP through 1998 to 4 percent of GDPby 2005. Despite the dramatic reduction in mean custom tariff rates, from 27 per-cent in 1990 to 7 percent in 2005, trade taxes still remain the dominant sourceof indirect tax revenues. The introduction of a value added tax (called the GeneralSales Tax) in Yemen by 2000 was part of the reforms implemented under theEnhanced Structural Adjustment Facility (1999–2001). Since then, the implemen-tation of the tax has been repeatedly postponed. The supplementary budget of2005 moved the date of implementation to January 2007. Timely implementationof the tax could have generated revenues of 3 to 3.5 percent of GDP, doublingthe collection of taxes on production, consumption, and services, which the newregime is set to replace.
Yemen has saved none of its oil revenues in 11 out of the past 16 years (Figure 3.6). Saving out of oil revenues is defined as the excess of oil revenues
10414-03_Ch03.qxd 4/17/08 11:16 AM Page 27
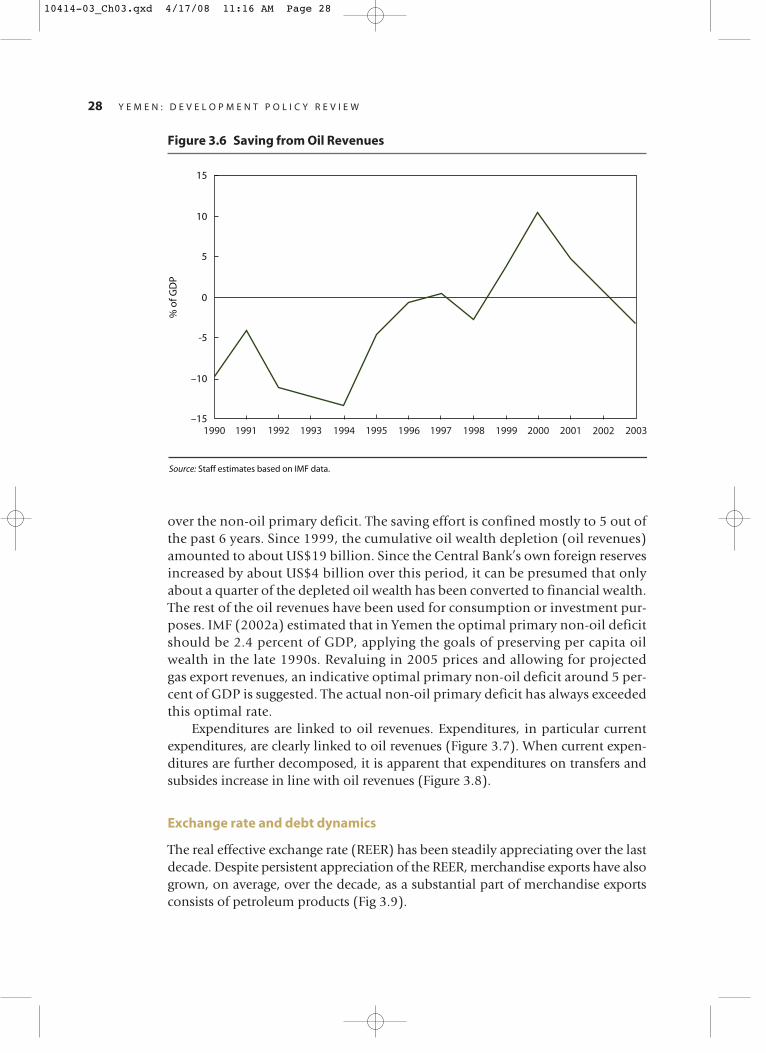
over the non-oil primary deficit. The saving effort is confined mostly to 5 out ofthe past 6 years. Since 1999, the cumulative oil wealth depletion (oil revenues)amounted to about US$19 billion. Since the Central Bank’s own foreign reservesincreased by about US$4 billion over this period, it can be presumed that onlyabout a quarter of the depleted oil wealth has been converted to financial wealth.The rest of the oil revenues have been used for consumption or investment pur-poses. IMF (2002a) estimated that in Yemen the optimal primary non-oil deficitshould be 2.4 percent of GDP, applying the goals of preserving per capita oilwealth in the late 1990s. Revaluing in 2005 prices and allowing for projectedgas export revenues, an indicative optimal primary non-oil deficit around 5 per-cent of GDP is suggested. The actual non-oil primary deficit has always exceededthis optimal rate.
Expenditures are linked to oil revenues. Expenditures, in particular currentexpenditures, are clearly linked to oil revenues (Figure 3.7). When current expen-ditures are further decomposed, it is apparent that expenditures on transfers andsubsides increase in line with oil revenues (Figure 3.8).
Exchange rate and debt dynamics
The real effective exchange rate (REER) has been steadily appreciating over the lastdecade. Despite persistent appreciation of the REER, merchandise exports have alsogrown, on average, over the decade, as a substantial part of merchandise exportsconsists of petroleum products (Fig 3.9).
28 Y E M E N : D E V E L O P M E N T P O L I C Y R E V I E W
Figure 3.6 Saving from Oil Revenues
–15
–10
% o
f GD
P
-5
0
5
10
15
Source: Staff estimates based on IMF data.
1990 1991 1992 1993 1994 1995 1996 1997 1998 1999 2000 2001 2002 2003
10414-03_Ch03.qxd 4/17/08 11:16 AM Page 28
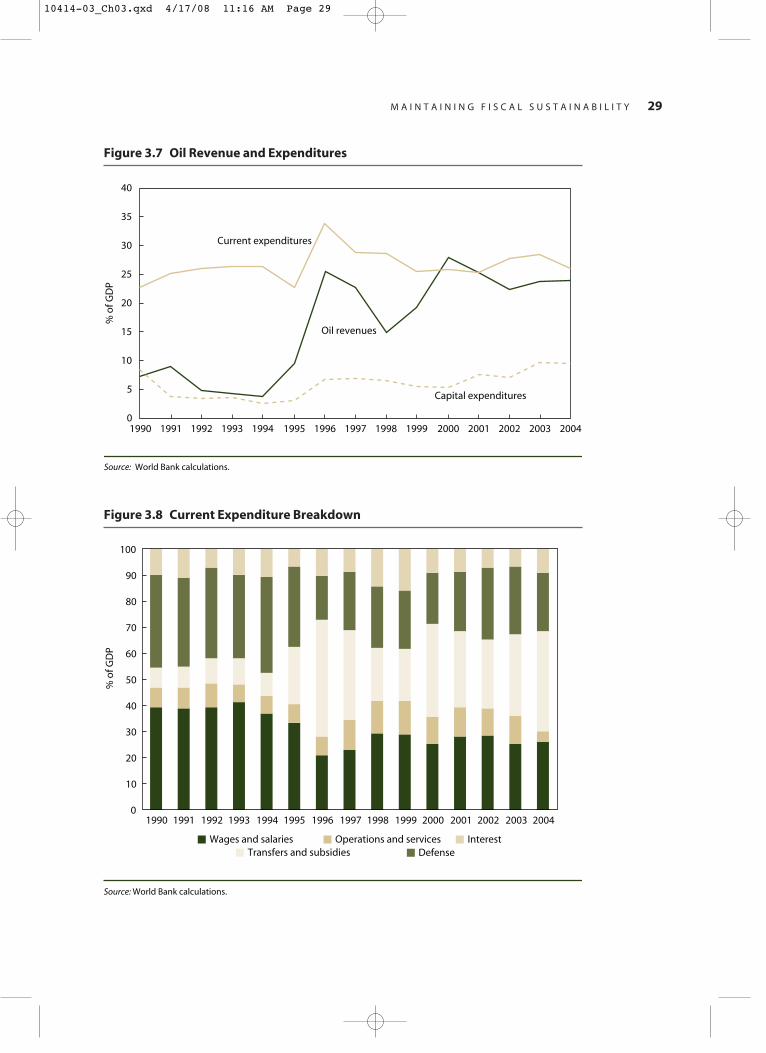
M A I N T A I N I N G F I S C A L S U S T A I N A B I L I T Y 29
Figure 3.7 Oil Revenue and Expenditures
Figure 3.8 Current Expenditure Breakdown
0
5
10
15
20
25
% o
f GD
P
30
35
40
1990 1991 1992 1993 1994 1995 1996 1997 1998 1999 2000 2001 2002 2003 2004
Oil revenues
Current expenditures
Capital expenditures
Source: World Bank calculations.
0
10
20
30
40
50
60
70
80
90
100
% o
f GD
P
1990 1991 1992 1993 1994 1995 1996 1997 1998 1999 2000 2001 2002 2003 2004
Wages and salaries Operations and services Transfers and subsidies Defense
Interest
Source: World Bank calculations.
10414-03_Ch03.qxd 4/17/08 11:16 AM Page 29

Yemen’s external debt composition has shifted from a high proportion ofprivate creditors to that of multilateral and bilateral lending. Yemen’s external debtlevels have remained fairly stable over the last several years, averaging US$5 billion,or 34 percent of GDP in 2005. The debt terms are generous, as the majority ofYemen’s debt is on concessional terms (currently 85 percent of total external debt,Fig 3.10). Arrears have also been contained since the macroeconomic adjustment
30 Y E M E N : D E V E L O P M E N T P O L I C Y R E V I E W
Figure 3.9 Yemen: Merchandise Exports (left axis) and REER (right axis)
Figure 3.10 Evolution of External Debt and Share of Concessional Debt
10
15
20
25
30
35
40
45
50
1995 1996 1997 1998 1999 2000 2001 2002 2003 2004
(US$
bill
ion
s)
60
80
100
120
140
160
180
200
(199
5 =
100
)
Merch. exports
REER
Source: World Bank calculations
0
500
1,000
1,500
2,000
2,500
3,000
3,500
4,000
1990 1991 1992 1993 1994 1995 1996 1997 1998 1999 2000 2001 2002 2003 20040
10
20
30
40
50
60
70
80
90
100
US$
mill
ion
s
Perc
ent
Multilateral Bilateral Private creditors, guar. Share of concess. debt
Source: World Bank calculations
10414-03_Ch03.qxd 4/17/08 11:16 AM Page 30

program of the mid-1990s (Fig 3.11). Domestic debt however has been increasing,from 33 percent of GDP in 2002 to 71 percent of GDP in 2005, putting furtherstrain on fiscal accounts as interest payments rise.
The Medium-term Outlook
To offset the decline in oil sector, efforts must be made to stimulate growth in non-oil sectors. Several areas of the Yemeni economy have been identified as potentialsources of non-oil growth: agriculture, particularly honey, which is known to be ofhigh quality, and fishing; building stones; leather products; and tourism (Table 3.1).Again, even substantial increases in exports of these sectors are not expected tocompletely offset the losses from oil sector. To balance those expected losses, Yemenneeds to further intensify its efforts to develop the still-emerging industrial andservice sectors. Box 3.2 discusses countries that have achieved success in diversifyingtheir exports and suggests policy actions. A temporary boost to GDP growth willbe felt in the construction phase (2006–08) of a US$2 billion gas project, describedbelow in the forecast for investment, and spillover effects of the gas project will beseen in the construction and services sectors. Gas production is expected to showa one-time jump in 2009 and remain constant thereafter.
Given these assumptions about growth prospects in Yemen, the analysis in thissection forecasts tax revenue, public expenditures, overall gross domestic product,poverty, investment, balance of payments, and debt for the period 2005–2500.This adjustment scenario (baseline) assumes that the authorities will move forwardon implementing reforms.
M A I N T A I N I N G F I S C A L S U S T A I N A B I L I T Y 31
Figure 3.11 Evolution of Arrears
0
500
1,000
1,500
2,000
2,500
3,000
1990 1991 1992 1993 1994 1995 1996 1997 1998 1999 2000 2001 2002 2003 2004
US$
mill
ion
s
Principal Interest
Source: World Bank calculations
10414-03_Ch03.qxd 4/17/08 11:16 AM Page 31
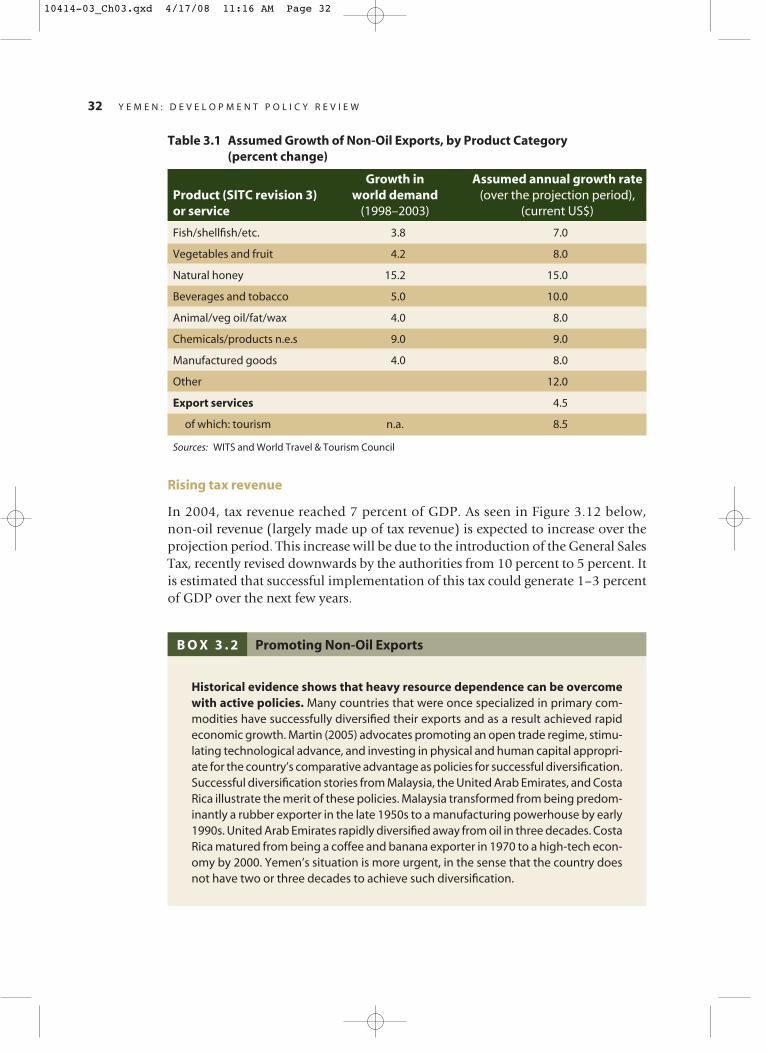
Rising tax revenue
In 2004, tax revenue reached 7 percent of GDP. As seen in Figure 3.12 below,non-oil revenue (largely made up of tax revenue) is expected to increase over theprojection period. This increase will be due to the introduction of the General SalesTax, recently revised downwards by the authorities from 10 percent to 5 percent. Itis estimated that successful implementation of this tax could generate 1–3 percentof GDP over the next few years.
32 Y E M E N : D E V E L O P M E N T P O L I C Y R E V I E W
Table 3.1 Assumed Growth of Non-Oil Exports, by Product Category (percent change)
Growth in Assumed annual growth rateProduct (SITC revision 3) world demand (over the projection period),or service (1998–2003) (current US$)
Fish/shellfish/etc. 3.8 7.0
Vegetables and fruit 4.2 8.0
Natural honey 15.2 15.0
Beverages and tobacco 5.0 10.0
Animal/veg oil/fat/wax 4.0 8.0
Chemicals/products n.e.s 9.0 9.0
Manufactured goods 4.0 8.0
Other 12.0
Export services 4.5
of which: tourism n.a. 8.5
Sources: WITS and World Travel & Tourism Council
B O X 3 . 2 Promoting Non-Oil Exports
Historical evidence shows that heavy resource dependence can be overcomewith active policies. Many countries that were once specialized in primary com-modities have successfully diversified their exports and as a result achieved rapideconomic growth. Martin (2005) advocates promoting an open trade regime, stimu-lating technological advance, and investing in physical and human capital appropri-ate for the country’s comparative advantage as policies for successful diversification.Successful diversification stories from Malaysia, the United Arab Emirates, and CostaRica illustrate the merit of these policies. Malaysia transformed from being predom-inantly a rubber exporter in the late 1950s to a manufacturing powerhouse by early1990s. United Arab Emirates rapidly diversified away from oil in three decades. CostaRica matured from being a coffee and banana exporter in 1970 to a high-tech econ-omy by 2000. Yemen’s situation is more urgent, in the sense that the country doesnot have two or three decades to achieve such diversification.
10414-03_Ch03.qxd 4/17/08 11:16 AM Page 32
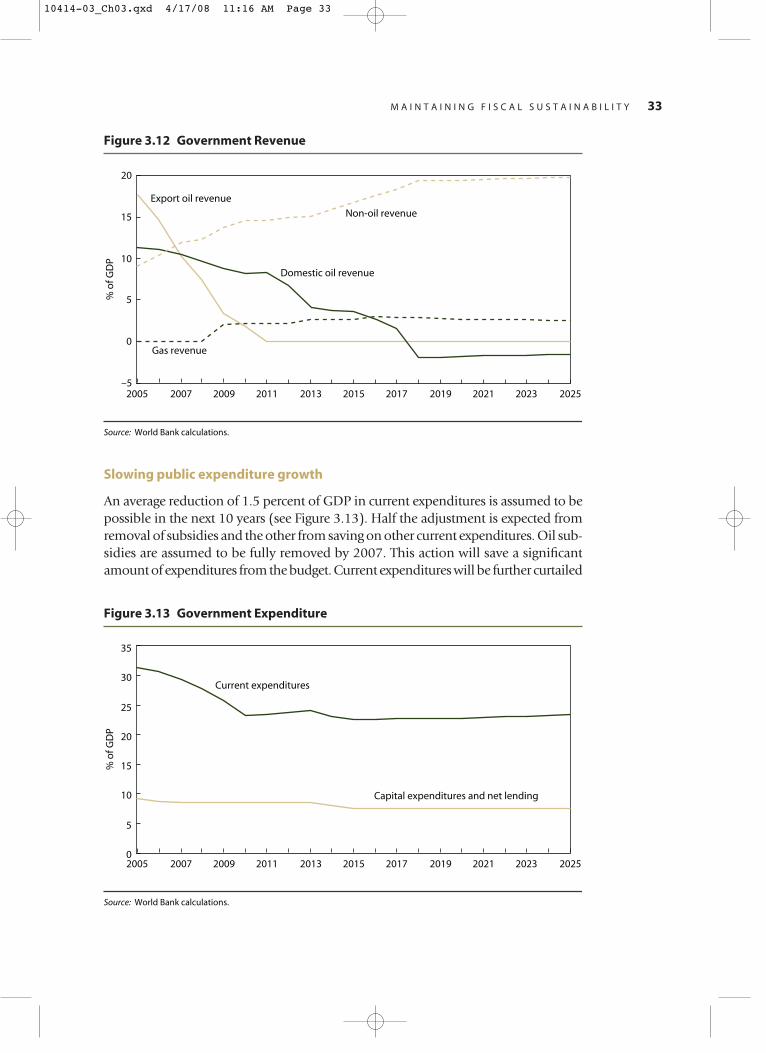
Slowing public expenditure growth
An average reduction of 1.5 percent of GDP in current expenditures is assumed to bepossible in the next 10 years (see Figure 3.13). Half the adjustment is expected fromremoval of subsidies and the other from saving on other current expenditures. Oil sub-sidies are assumed to be fully removed by 2007. This action will save a significantamount of expenditures from the budget. Current expenditures will be further curtailed
M A I N T A I N I N G F I S C A L S U S T A I N A B I L I T Y 33
Figure 3.12 Government Revenue
Figure 3.13 Government Expenditure
–5
0
5
10
15
20
2005 2007 2009 2011 2013 2015 2017 2019 2021 2023 2025
Export oil revenue
Domestic oil revenue
Gas revenue
% o
f GD
P
Non-oil revenue
Source: World Bank calculations.
2005 2007 2009 2011 2013 2015 2017 2019 2021 2023 2025
Capital expenditures and net lending
% o
f GD
P
Current expenditures
Source: World Bank calculations.
0
5
10
15
20
25
30
35
10414-03_Ch03.qxd 4/17/08 11:16 AM Page 33
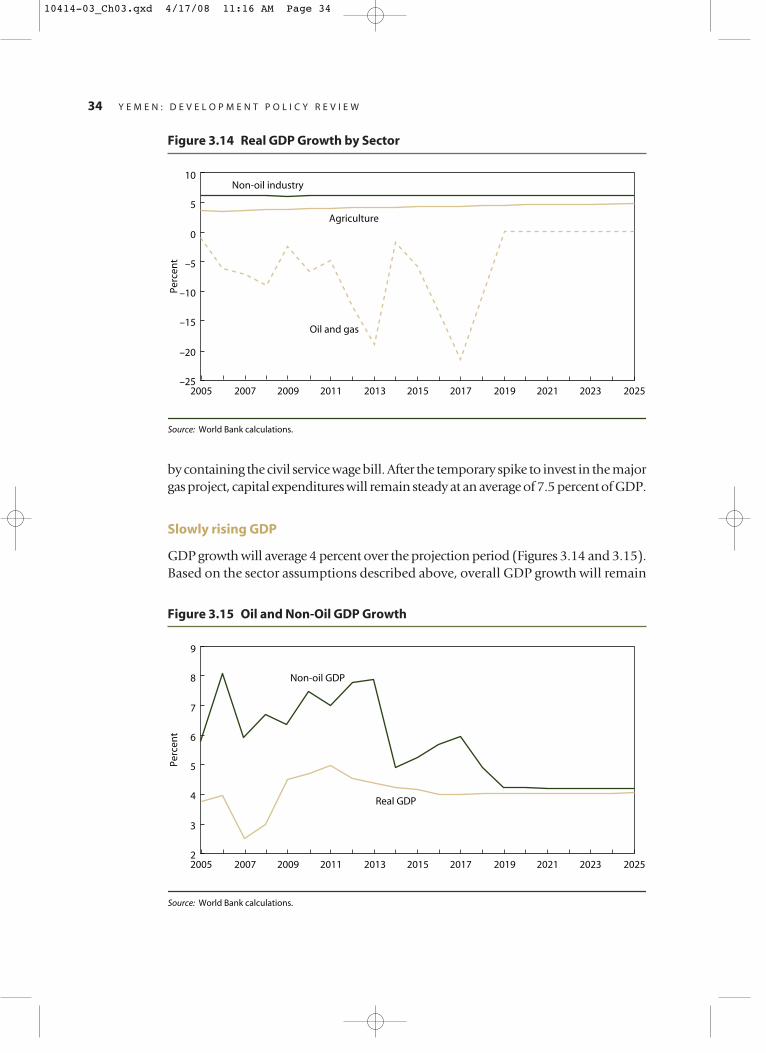
by containing the civil service wage bill. After the temporary spike to invest in the majorgas project, capital expenditures will remain steady at an average of 7.5 percent of GDP.
Slowly rising GDP
GDP growth will average 4 percent over the projection period (Figures 3.14 and 3.15).Based on the sector assumptions described above, overall GDP growth will remain
34 Y E M E N : D E V E L O P M E N T P O L I C Y R E V I E W
Figure 3.14 Real GDP Growth by Sector
Figure 3.15 Oil and Non-Oil GDP Growth
2005 2007 2009 2011 2013 2015 2017 2019 2021 2023 2025
Oil and gas
Perc
ent
Non-oil industry
Agriculture
Source: World Bank calculations.
–25
–20
–15
–10
–5
0
5
10
2005 2007 2009 2011 2013 2015 2017 2019 2021 2023 2025
Real GDP
Perc
ent
Non-oil GDP
Source: World Bank calculations.
2
3
4
5
6
7
8
9
10414-03_Ch03.qxd 4/17/08 11:16 AM Page 34
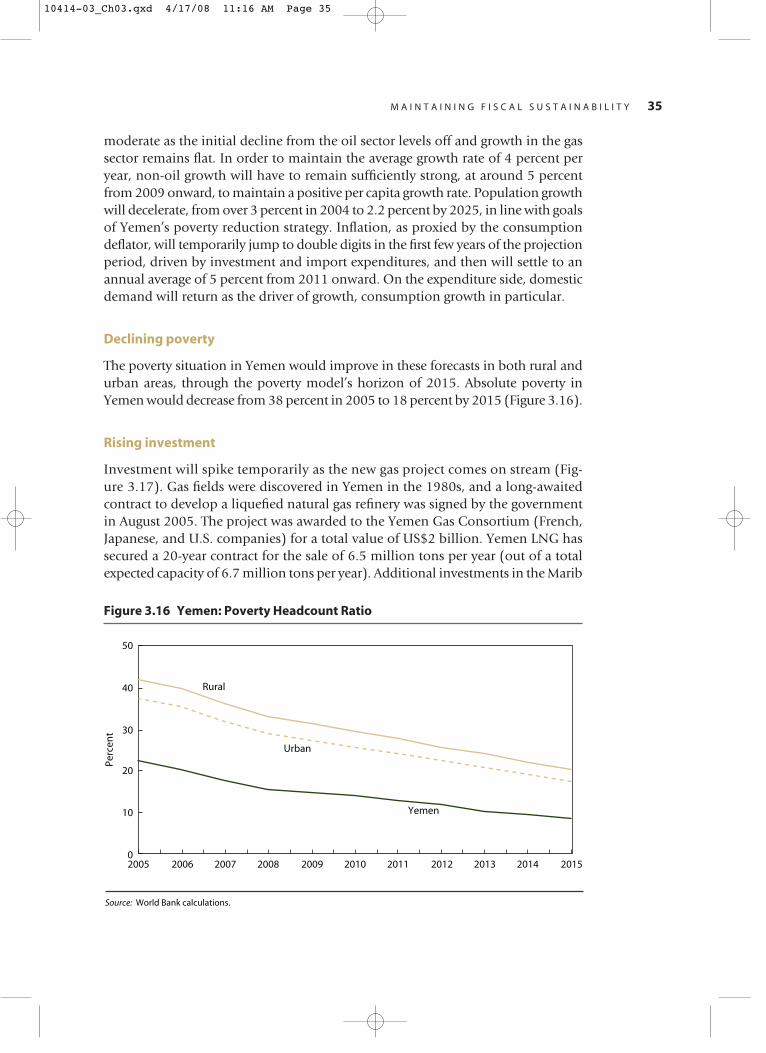
moderate as the initial decline from the oil sector levels off and growth in the gassector remains flat. In order to maintain the average growth rate of 4 percent peryear, non-oil growth will have to remain sufficiently strong, at around 5 percentfrom 2009 onward, to maintain a positive per capita growth rate. Population growthwill decelerate, from over 3 percent in 2004 to 2.2 percent by 2025, in line with goalsof Yemen’s poverty reduction strategy. Inflation, as proxied by the consumptiondeflator, will temporarily jump to double digits in the first few years of the projectionperiod, driven by investment and import expenditures, and then will settle to anannual average of 5 percent from 2011 onward. On the expenditure side, domesticdemand will return as the driver of growth, consumption growth in particular.
Declining poverty
The poverty situation in Yemen would improve in these forecasts in both rural andurban areas, through the poverty model’s horizon of 2015. Absolute poverty inYemen would decrease from 38 percent in 2005 to 18 percent by 2015 (Figure 3.16).
Rising investment
Investment will spike temporarily as the new gas project comes on stream (Fig-ure 3.17). Gas fields were discovered in Yemen in the 1980s, and a long-awaitedcontract to develop a liquefied natural gas refinery was signed by the governmentin August 2005. The project was awarded to the Yemen Gas Consortium (French,Japanese, and U.S. companies) for a total value of US$2 billion. Yemen LNG hassecured a 20-year contract for the sale of 6.5 million tons per year (out of a totalexpected capacity of 6.7 million tons per year). Additional investments in the Marib
M A I N T A I N I N G F I S C A L S U S T A I N A B I L I T Y 35
Figure 3.16 Yemen: Poverty Headcount Ratio
2005 2006 2007 2008 2009 2010 2011 2012 2013 2014 2015
Yemen
Rural
Perc
ent
Urban
Source: World Bank calculations.
0
10
20
30
40
50
10414-03_Ch03.qxd 4/17/08 11:16 AM Page 35
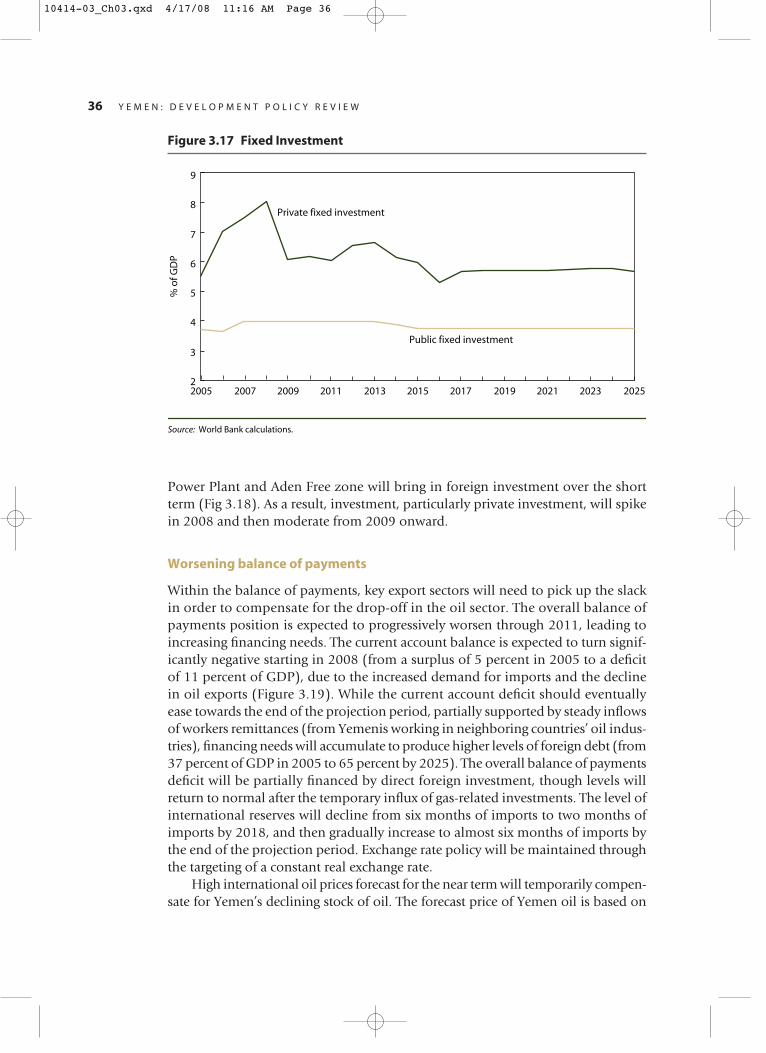
Power Plant and Aden Free zone will bring in foreign investment over the shortterm (Fig 3.18). As a result, investment, particularly private investment, will spikein 2008 and then moderate from 2009 onward.
Worsening balance of payments
Within the balance of payments, key export sectors will need to pick up the slackin order to compensate for the drop-off in the oil sector. The overall balance ofpayments position is expected to progressively worsen through 2011, leading toincreasing financing needs. The current account balance is expected to turn signif-icantly negative starting in 2008 (from a surplus of 5 percent in 2005 to a deficitof 11 percent of GDP), due to the increased demand for imports and the declinein oil exports (Figure 3.19). While the current account deficit should eventuallyease towards the end of the projection period, partially supported by steady inflowsof workers remittances (from Yemenis working in neighboring countries’ oil indus-tries), financing needs will accumulate to produce higher levels of foreign debt (from37 percent of GDP in 2005 to 65 percent by 2025). The overall balance of paymentsdeficit will be partially financed by direct foreign investment, though levels willreturn to normal after the temporary influx of gas-related investments. The level ofinternational reserves will decline from six months of imports to two months ofimports by 2018, and then gradually increase to almost six months of imports bythe end of the projection period. Exchange rate policy will be maintained throughthe targeting of a constant real exchange rate.
High international oil prices forecast for the near term will temporarily compen-sate for Yemen’s declining stock of oil. The forecast price of Yemen oil is based on
36 Y E M E N : D E V E L O P M E N T P O L I C Y R E V I E W
2005 2007 2009 2011 2013 2015 2017 2019 2021 2023 2025
Public fixed investment
% o
f GD
P
Private fixed investment
Source: World Bank calculations.
2
3
4
5
6
7
8
9
Figure 3.17 Fixed Investment
10414-03_Ch03.qxd 4/17/08 11:16 AM Page 36

M A I N T A I N I N G F I S C A L S U S T A I N A B I L I T Y 37
Figure 3.18 Direct Foreign Investment
Figure 3.19 Projected Balance of Payments, 2005–25
Source: World Bank calculations.
–400
–200
US$
mill
ion
s
0
200
400
600
800
1000
2005 2007 2009 2011 2013 2015 2017 2019 2021 2023 2025
0
1,000
2,000
3,000
4,000
5,000
6,000
7,000
8,000
2005 2007 2009 2011 2013 2015 2017 2019 2021 2023 2025–3,000
–2,500
–2,000
–1,500
–1,000
–500
0
500
1,000
US$
mill
ion
s
Merchandise exports
Merchandise importsCurrent account balance (right axis)
Source: World Bank calculations
10414-03_Ch03.qxd 4/17/08 11:16 AM Page 37
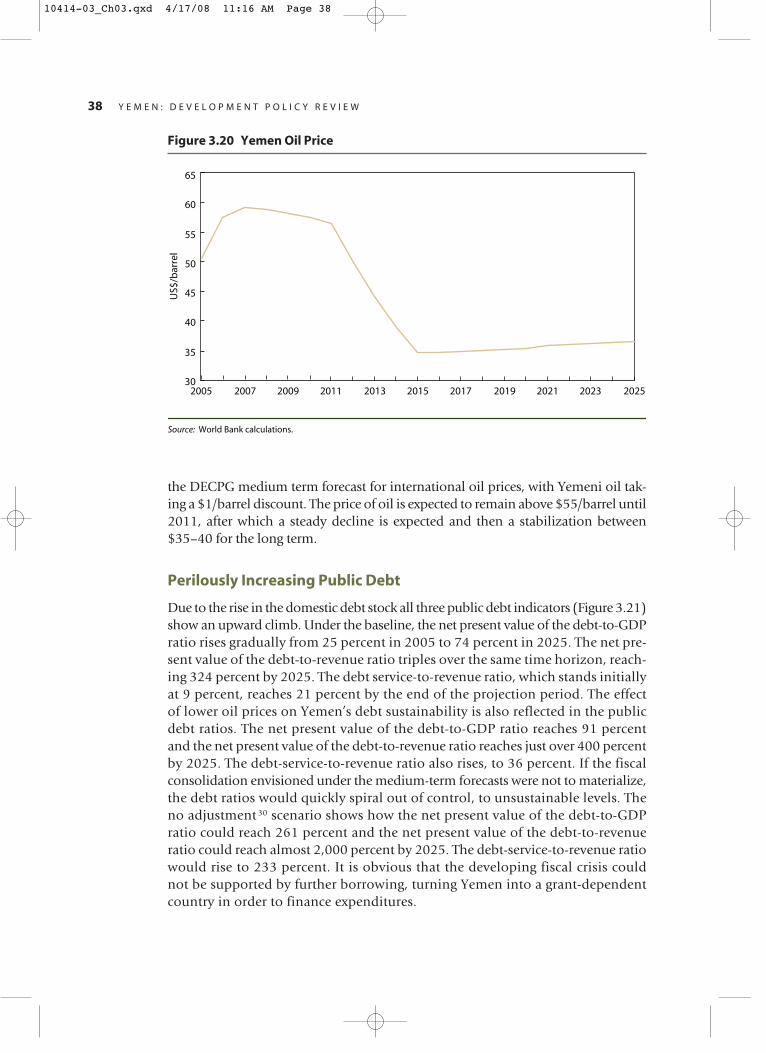
the DECPG medium term forecast for international oil prices, with Yemeni oil tak-ing a $1/barrel discount. The price of oil is expected to remain above $55/barrel until2011, after which a steady decline is expected and then a stabilization between$35–40 for the long term.
Perilously Increasing Public Debt
Due to the rise in the domestic debt stock all three public debt indicators (Figure 3.21)show an upward climb. Under the baseline, the net present value of the debt-to-GDPratio rises gradually from 25 percent in 2005 to 74 percent in 2025. The net pre-sent value of the debt-to-revenue ratio triples over the same time horizon, reach-ing 324 percent by 2025. The debt service-to-revenue ratio, which stands initiallyat 9 percent, reaches 21 percent by the end of the projection period. The effectof lower oil prices on Yemen’s debt sustainability is also reflected in the publicdebt ratios. The net present value of the debt-to-GDP ratio reaches 91 percentand the net present value of the debt-to-revenue ratio reaches just over 400 percentby 2025. The debt-service-to-revenue ratio also rises, to 36 percent. If the fiscalconsolidation envisioned under the medium-term forecasts were not to materialize,the debt ratios would quickly spiral out of control, to unsustainable levels. Theno adjustment 30 scenario shows how the net present value of the debt-to-GDPratio could reach 261 percent and the net present value of the debt-to-revenueratio could reach almost 2,000 percent by 2025. The debt-service-to-revenue ratiowould rise to 233 percent. It is obvious that the developing fiscal crisis couldnot be supported by further borrowing, turning Yemen into a grant-dependentcountry in order to finance expenditures.
38 Y E M E N : D E V E L O P M E N T P O L I C Y R E V I E W
Figure 3.20 Yemen Oil Price
2005 2007 2009 2011 2013 2015 2017 2019 2021 2023 2025
US$
/bar
rel
Source: World Bank calculations.
30
35
40
45
50
55
60
65
10414-03_Ch03.qxd 4/17/08 11:16 AM Page 38
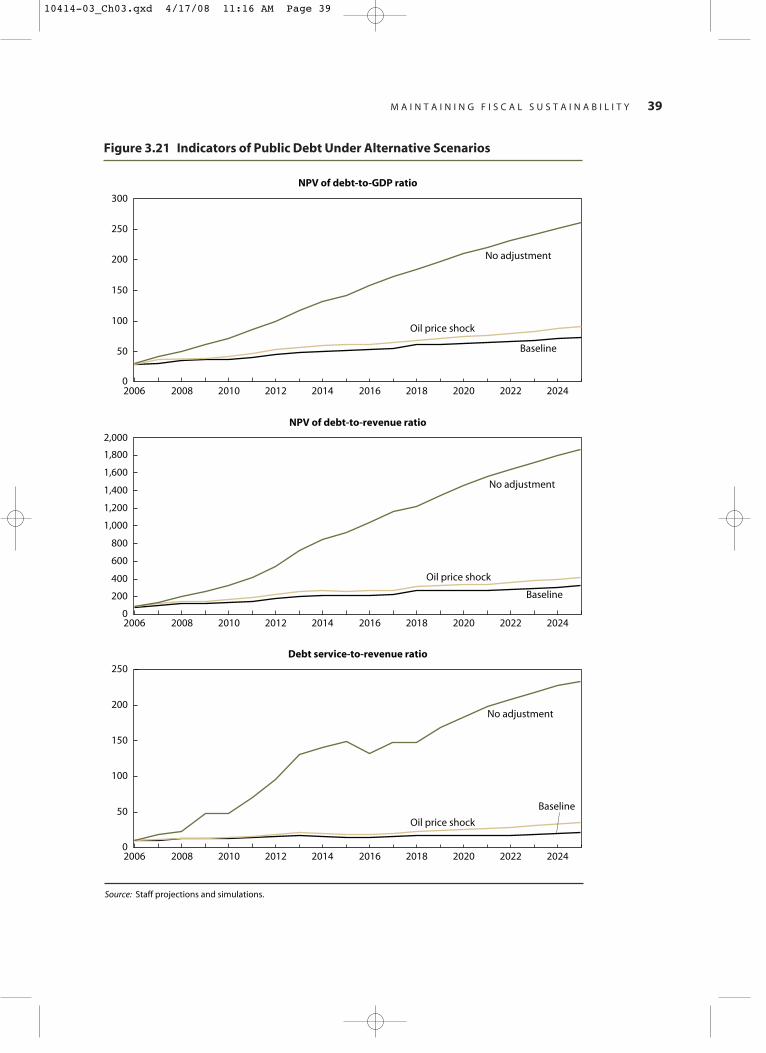
M A I N T A I N I N G F I S C A L S U S T A I N A B I L I T Y 39
Figure 3.21 Indicators of Public Debt Under Alternative Scenarios
Source: Staff projections and simulations.
NPV of debt-to-GDP ratio
2006 2008 2010 2012 2014 2016 2018 2020 2022 2024
Oil price shock
Baseline
No adjustment
0
50
100
150
200
250
300
NPV of debt-to-revenue ratio
Debt service-to-revenue ratio
2006 2008 2010 2012 2014 2016 2018 2020 2022 2024
Oil price shock
Baseline
No adjustment
0
400
200
600
1,400
1,200
1,000
800
1,600
1,800
2,000
2006 2008 2010 2012 2014 2016 2018 2020 2022 2024
Oil price shock
Baseline
No adjustment
0
50
100
150
200
250
10414-03_Ch03.qxd 4/17/08 11:16 AM Page 39
External Debt Sustainability Depends on Oil Price Trajectories
In the baseline medium-term forecast, Yemen’s external debt burden indicatorsremain below their indicative policy-dependent thresholds throughout the pro-jection period (Figure 3.22). The net present value of the debt-to-GDP ratio risesfrom 19 percent to 35 percent over the projection period. The net present value ofthe debt-to-export ratio rises gradually from 45 percent in 2005 to 147 percent in2018, and remains around that level through 2025. The debt service-to-exportsratio gradually rises from 3 percent in 2005 to 8–9 percent in the outer years of theprojection period. Equally, the net present value of the debt-to-revenue and thedebt-service-to-revenue ratios remain well below the indicative thresholds.
A permanently lower oil price would threaten Yemen’s external debt situation.In this scenario, the oil price projections under the baseline would be 10 percentlower in a given year, setting external debt indicators on a deteriorating path. Thenet present value of the debt-to-export ratio would cross the threshold by 2017,rising to a peak of 208 percent by 2018. The debt service-to-exports ratio wouldonly be moderately affected, to levels just above the baseline trend.
The no adjustment scenario would only marginally impact external debt ratios.Most of the burden would be felt on the fiscal front, with the net present value ofexternal debt-to-GDP trending around baseline levels. The net present value of debt-to-exports, however, would breach the threshold by 2017 and deteriorate at a rapidrate, reaching 416 percent by the end of the projection period. The debt service-to-exports ratio is also severely affected, due to lower exports under the no adjustmentscenario, surpassing the threshold by 2019 and rising to almost 60 percent by 2025.
In sum, Yemen faces a moderate risk of debt distress. Under the baseline medium-term forecasts all the relevant debt distress indicators stay below their respectivethresholds. However, several stress tests reveal that the baseline is vulnerable toshocks to the country’s weak and barely diversified export base. In particular, lowerthan anticipated future oil prices would lead to a rapid deterioration of Yemen’sprospects for external debt sustainability. The fiscal sustainability analysis underlinesthe importance of the planned fiscal adjustment program.
The Reform Agenda to Maintain Fiscal Balance
Looking forward, Yemen faces high risk in maintaining fiscal sustainability andmoderate stress in meeting external debt obligations. For fiscal reform to be effectivein diversifying revenues away from oil, its implementation needs to be accomplishedfar in advance of the expected oil depletion. Critical reforms include raising taxrevenues, cutting public expenditures, strengthening public financial management,and completing civil service reforms.
� Tax revenue must rise. Assessment and collection efforts need to be more thandoubled over the long-term. In 2004, tax revenue was 7 percent of GDP. By 2015,tax revenues must rise to 14 percent of GDP to partly compensate for the loss ofoil revenues. This increase will be due to the introduction of the General Sales
40 Y E M E N : D E V E L O P M E N T P O L I C Y R E V I E W
10414-03_Ch03.qxd 4/17/08 11:16 AM Page 40

M A I N T A I N I N G F I S C A L S U S T A I N A B I L I T Y 41
Figure 3.22 Indicators of Public and Publicly Guaranteed External Debt UnderAlternative Scenarios
Source: Staff projections and simulations.
NPV of debt-to-GDP ratio
NPV of debt-to-exports ratio
Debt service-to-exports ratio
Threshold
2006 2008 2010 2012 2014 2016 2018 2020 2022 2024
Oil price shock
Baseline
No adjustment
0
50
100
300
250
200
150
350
400
450
Threshold
2006 2008 2010 2012 2014 2016 2018 2020 2022 2024
Oil price shock
Baseline
No adjustment
0
20
10
30
40
50
60
70
2006 2008 2010 2012 2014 2016 2018 2020 2022 2024
Oil price shock
Baseline
No adjustment
Threshold
0
5
10
15
20
25
30
35
40
45
10414-03_Ch03.qxd 4/17/08 11:16 AM Page 41
Tax, recently revised downward by the authorities from 10 percent to 5 percent.It is estimated that successful implementation of this tax could generate 1–3 per-cent of GDP over the next few years. Strengthening of tax and customs admin-istration should also generate higher tax revenues. In addition, an excise tax maybe introduced when the oil subsidies are removed.
� Public expenditures must be cut. An average reduction of 1.5 percent of GDP per yearin current expenditures is assumed to be possible over the next 10 years. Halfthe adjustment is expected from removal of subsidies and the other from savingon other current expenditures. Oil subsidies are assumed to be fully removed by2007. This action will save a significant amount of expenditures from the budget.Current expenditures will be further curtailed by containing the civil servicewage bill.
� Public finances must be managed better. Completing reforms to public financial man-agement hold the key to successful public expenditure management. In August2005, the government approved a comprehensive reform strategy for publicfinancial management, with action plan milestones stretching up to 2015. Inimplementing this strategy, public financial management needs to be strengthenedin all major areas—budget programming and prioritization; budget execution;treasury and cash management; internal controls; internal audit; external audit;financial reporting and oversight. The budget lacks a medium-term expenditureframework and remains poorly linked to the government’s poverty reductionstrategy. After making some progress in areas of budget coverage, classification,and transparency in 1995–2001, reforms efforts slowed. The Accounting andFinancial Management System was planned to be a useful tool to support theprocess of budget reform, but implementation is behind schedule.
� Civil service reforms must be completed. Completing civil service reforms is essen-tial to generate savings and build a competent civil service. Yemen’s civil service,underpaid but overstaffed, accounts for nearly one-quarter of the government’scurrent expenditure, one of the highest levels in the Middle East and North Africaregion. The government started to implement a four-stage National Wage Strategyin July 2005. The agenda includes a revised pay and grading structure that rewardsgovernment employees based on well-defined job performance criteria insteadof formal qualifications and length of service. The strategy also increases decom-pression of pay and consolidates most allowances into a universal pay scale. Thesalaries for the highest-ranking officials will likely increase by a factor of 5 or6 when the program of reform is completed and salaries for lower level civilservants are expected to roughly double. The minimum wage will rise fromYR 11,000 to YR 20,000 per month.
42 Y E M E N : D E V E L O P M E N T P O L I C Y R E V I E W
10414-03_Ch03.qxd 4/17/08 11:16 AM Page 42
Dynamic and broad-based growth of the private sector is the key to reachingYemen’s goal of diversifying its economy and reducing its dependence on
shrinking oil reserves, as has been recognized in earlier analyses (World Bank 2002b,for example). Yet, Yemeni entrepreneurs still feel constrained by a host of issues(Figure 4.1). As discussed in chapter 1, a recent Investment Climate Survey (2005)showed that Yemeni firms perceive more obstacles to business than firms in mostother comparator countries and particularly complain of macroeconomic uncer-tainty, taxes, regulation, corruption, and many other barriers posed by poor gover-nance. The result has been a steady decline in private investment in Yemen. Arrestingand reversing that decline is possible only if the investment climate is improvedimmediately. This chapter focuses on relieving three recognized constraints to privateinvestment: corruption, judicial weaknesses, and lack of access to land.
Ranking of Yemen in most Doing Business indicators worsened from 2005 to2006. While overall Doing Business ranking of Yemen improved by three positions,ranking in eight out of ten indicators has gone down. Ranking improved for the ‘pay-ing taxes’ indicator by 38 positions, while ranking of ‘getting credit’ indicator hasremained unchanged (Figure 4.2).
Corruption
One of most dismal consequences of corruption is that it undermines political legit-imacy and raises the costs of private investments, directly through bribes paid to gov-ernment officials and indirectly through uncertainty over expected returns. Yemenshows signs of widespread and pervasive corruption. During the October, 2006 Pres-idential election, corruption was highlighted as a major concern. The TransparencyInternational Corruption Index 2005 ranks Yemen at 106 out of 159 countries, worsethan countries such as Egypt, Saudi Arabia, or Vietnam.31 Inefficiencies in the judiciarysystem increase the impunity of corrupt activities by decreasing transparency andaccountability.
Corruption imposes a significant economic and financial cost. The Yemeni Cen-tral Organization for Control and Audit estimated that corruption-related criminal
43
Improving theInvestment Climate
4
10414-04_Ch04.qxd 4/17/08 11:17 AM Page 43
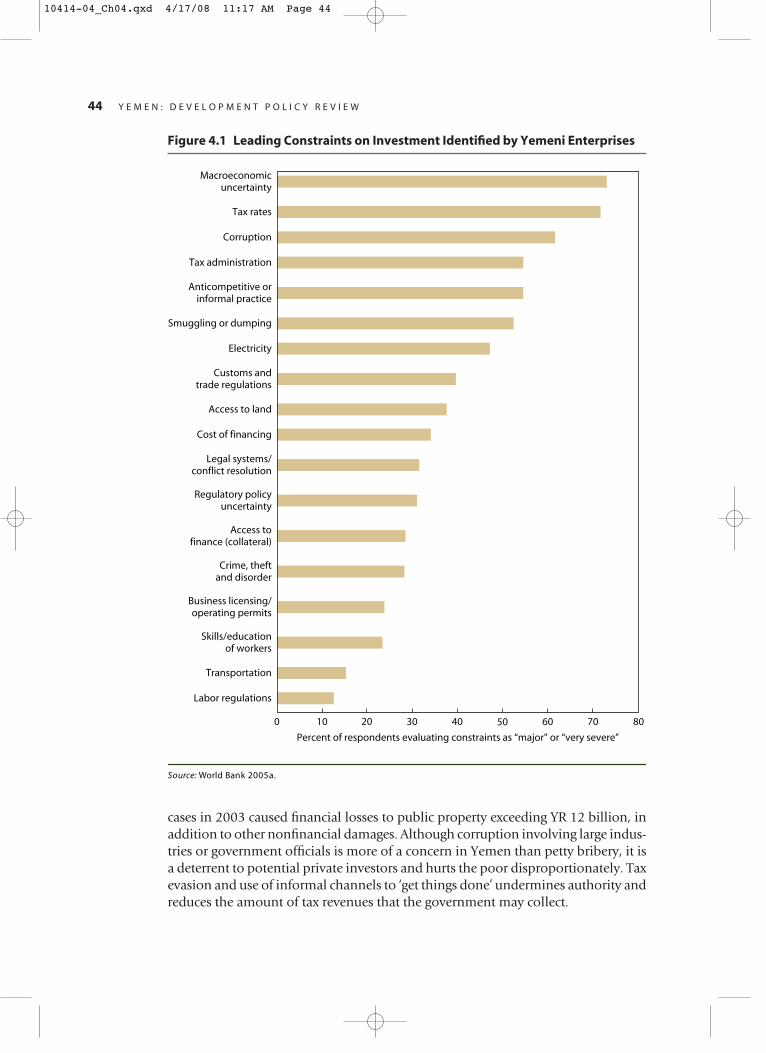
cases in 2003 caused financial losses to public property exceeding YR 12 billion, inaddition to other nonfinancial damages. Although corruption involving large indus-tries or government officials is more of a concern in Yemen than petty bribery, it isa deterrent to potential private investors and hurts the poor disproportionately. Taxevasion and use of informal channels to ‘get things done’ undermines authority andreduces the amount of tax revenues that the government may collect.
44 Y E M E N : D E V E L O P M E N T P O L I C Y R E V I E W
Legal systems/conflict resolution
Regulatory policyuncertainty
Access tofinance (collateral)
Crime, theftand disorder
Business licensing/operating permits
Skills/educationof workers
Transportation
Labor regulations
Cost of financing
Access to land
Customs andtrade regulations
Electricity
Smuggling or dumping
Anticompetitive orinformal practice
Tax administration
Corruption
Tax rates
Macroeconomicuncertainty
Source: World Bank 2005a.
0 8070605040302010
Percent of respondents evaluating constraints as “major” or “very severe”
Figure 4.1 Leading Constraints on Investment Identified by Yemeni Enterprises
10414-04_Ch04.qxd 4/17/08 11:17 AM Page 44
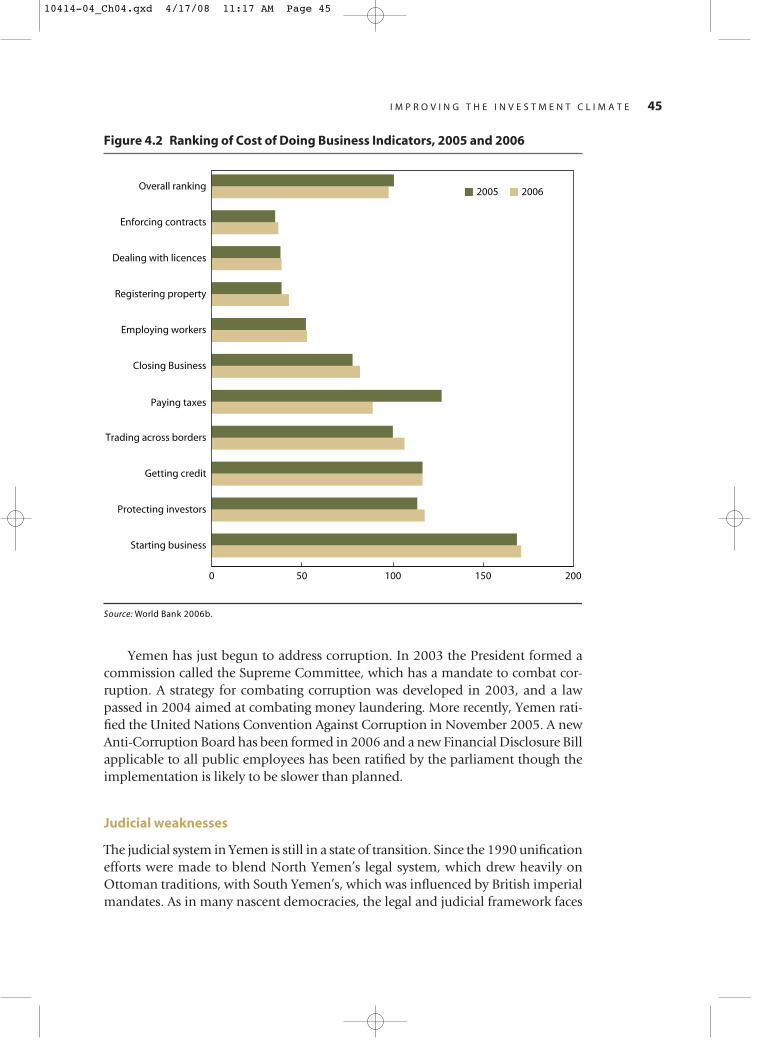
Yemen has just begun to address corruption. In 2003 the President formed acommission called the Supreme Committee, which has a mandate to combat cor-ruption. A strategy for combating corruption was developed in 2003, and a lawpassed in 2004 aimed at combating money laundering. More recently, Yemen rati-fied the United Nations Convention Against Corruption in November 2005. A newAnti-Corruption Board has been formed in 2006 and a new Financial Disclosure Billapplicable to all public employees has been ratified by the parliament though theimplementation is likely to be slower than planned.
Judicial weaknesses
The judicial system in Yemen is still in a state of transition. Since the 1990 unificationefforts were made to blend North Yemen’s legal system, which drew heavily onOttoman traditions, with South Yemen’s, which was influenced by British imperialmandates. As in many nascent democracies, the legal and judicial framework faces
I M P R O V I N G T H E I N V E S T M E N T C L I M A T E 45
0
Starting business
Protecting investors
Getting credit
Trading across borders
Paying taxes
Closing Business
Employing workers
Registering property
Dealing with licences
Enforcing contracts
Overall ranking 20062005
Source: World Bank 2006b.
20015010050
Figure 4.2 Ranking of Cost of Doing Business Indicators, 2005 and 2006
10414-04_Ch04.qxd 4/17/08 11:17 AM Page 45
many challenges and can be further improved. The main weaknesses of the Yemenijudiciary may be summarized as follows:
� Poor legal and administrative performance. As a result of a recruitment freeze and anincreasing number of disputes, the daily caseload in some courts reaches 20 casesper judge, four times the international average. This results in long delays and ageneral inability of the judges to examine the cases carefully, which in turn favorscorrupt practices such as bribery to speed proceedings along. The situation isaggravated by the inadequate training of administrators, notaries, and judges,which adds to the case burden per judge.
� Poor court administrative systems. Court procedures are generally inefficient and lackstandardization. Some courts have computer-based management systems, butmost of them are outdated. Often computers are only used for typing, because thenecessary software and training are missing. Thus in many cases courts cannotproperly file and record documents for on-going disputes, which delays resolutionand compromises the accountability and transparency of decisions.
� Poor use of alternative mechanisms for dispute resolution. Alternative dispute resolu-tion mechanisms are less expensive and time-consuming, while relieving thecourts from congestion. There has been a growing awareness for arbitration inYemen. The Centre for Conciliation and Arbitration, started as a private initiativein 1997, provides services to resolve commercial disputes. Traditionally, the pub-lic uses tribal arbitration, and it is estimated that around 70 percent of privatedisputes are settled by one of the eldest members of the tribe. Yet, tribal arbitra-tion has not been fully institutionalized or supported to provide a useful com-plement to the formal justice system. Other mechanisms such as professionaldispute mediation or small claim courts do not exist despite the fact that there areno legal restrictions on alternative dispute resolution.
Reforms of the judiciary have been limited and slow. Early reforms focused onadministrative organization and did not address the critical needs for efficiency andtransparency of the judiciary. Since the mid 1990s more attention has been given to reforms focused on organizational, human resource, and infrastructure-relatedaspects of the judiciary. In 2001, the government of Yemen presented a strategy torestructure the Ministry of Justice, establish commercial courts, enhance the role ofthe Judicial Inspectorate, improve court infrastructure, and provide training pro-grams. These endeavors were supported by donors, including GTZ, UN Develop-ment Programme, and the World Bank, but the pace of reform has been very slow.The strong opposition to reform from the conservative forces within the governmentis most likely why reforms have not been implemented.
Lack of access to land
The process of acquiring land for investment is fraught with many problems. Accord-ing to a survey of businessmen (World Bank 2002a), one-third of the respondentsidentified problems related to land ownership as a significant constraint in doing
46 Y E M E N : D E V E L O P M E N T P O L I C Y R E V I E W
10414-04_Ch04.qxd 4/17/08 11:17 AM Page 46
business in Yemen. A recent comprehensive study of the land administration systemin Yemen (World Bank 2005) describes the causes of the problems as follows:
� Insufficient registration. Official land registration is critical for defining real prop-erty rights; recording information about tenure, value, and use of land; protect-ing the validity of transactions; and enforcing contracts and judgments. Overall,there is very limited use of the land registry in Yemen. The utilization rate of theland registry is believed to be no more than 20 percent of all annual land prop-erty transactions in Yemen, signaling the low quality of the land administrationsystem.
� Unclear disposition. Few people use the registration system because they doubt thatthe act of registration is legally conclusive and they lack confidence in courts andjudicial processes. High costs of registration and lengthy bureaucratic proceduresadd to the problem. Alternative and cheaper forms of obtaining land security, suchas the authentication of transfer deeds at the courts, are preferred over securingproperty rights through formal land registration.
� Inadequate service. The quality of service provided by the Registry also discouragesuse. Problems include inadequate regulation of public notary activities, deficientregistration and maintenance procedures, and a weak legal and technical frame-work for deed registration.
� Inefficient state land management. In some governorates in Yemen, inefficientstate land management proved to be the main reason for about 30 percent of alllicensed investment projects not being initiated or becoming operational. More-over, problems with state land management have also curtailed local govern-ments’ ability to deliver public services.
Land disputes account for a third to a half of all civil cases at the primary districtcourts. The large volume of land disputes clogs the court system: instead of beingan arbitrator of last resort, the courts are in fact heavily relied on to bring about landtenure security, substituting in effect for the administrative mechanism of the landregistry. Most land ownership cases take three or four years to resolve. Moreover,the perception that courts are unable to resolve land disputes expeditiously may beseen as a threat to stability, as more land disputes are resolved violently outside ofthe legal system.
The government has embarked on a reform initiative to improve the willing-ness of businesses to invest and operate in Yemen by modernizing the judiciary andimproving access to land. In mid-2005 the government undertook the most com-prehensive set of economic and administrative reforms to date, despite large resis-tance within the government, political opposition, and civil society. In December2005 the Ministry of Justice presented a new strategy for the modernization of thejudicial sector to be implemented until 2016, which would require a 50 percentincrease in the judiciary budget. The government is also discussing two new draftlaws to reform land registration and the management of state- land, and it presenteda proposal on judicial and land reform to the Millennium Challenge AccountThreshold Program, but the program was recently suspended for Yemen. At this
I M P R O V I N G T H E I N V E S T M E N T C L I M A T E 47
10414-04_Ch04.qxd 4/17/08 11:17 AM Page 47
point, it is still unclear which elements of the different proposed reform projectswill be implemented.
The Reform Agenda to Improve the Investment Climate
As reform efforts move forward, a guiding principle should be the close link betweenvibrant growth in the private sector and clear accountability, transparency, and effi-ciency in the legal system. Reforms to improve the investment climate should bedesigned to achieve the following goals:
� Make the judicial branch more effective. An effective judiciary requires indepen-dence. This includes the way judges are selected, evaluated, disciplined and pro-moted to ensure that decisions are insulated from improper influence. To thisend, the Law of Judicial Authority (1991) needs to be amended to reflect thechanges in the constitution of 1994. Further consideration might be given toredefine the composition as well as the role of the Supreme Justice Council toreinforce the separation of powers between the three branches.
� Speed the processing of cases. Providing training, computers, information man-agement systems, and other resources to judges and court personnel wouldreduce case backlogs and accelerate the disposition of new disputes. Revising theprocedures for filing and resolving lawsuits would help to weed out proceduresthat invite delay and raise costs.
� Increase access to alternative dispute mechanisms. The creation of mediation and con-ciliation services and other alternatives to resolving disputes in the courts reducescourt costs, as does the introduction of small claims courts. Actions could alsoinclude transferring responsibilities for uncontentious matters, particularly forthe registration of property, to administrative agencies such as land registration,so that courts have more time for disputed cases.
� Professionalize bench and bar. Professional training, now lacking in Yemen, is neededto enhance the performance of the main actors and instill the values of impar-tiality, professionalism, competency, efficiency, and public service. Training needsto target administrative and notary staff as well as judges, and address the differentrequirements in specialized courts. Particular attention should be paid to infra-structure, resources, and the curriculum of the Higher Judicial Institute, which inits present state is not able to provide young judges with the necessary educationto appropriately perform their tasks and duties.
� Improve the administration of land tenure security. This encompasses initiatives toincrease the limited demand for registration (by, for example, removing incen-tives for using court authentication as an alternative to registration), as well asenhance the quality and efficiency of registration services (by improving regis-tration processes and maintenance).
� Make state land management more efficient. The present state land managementprocess is in need of an overhaul. Key issues in improving state land managementwould include, among others, to more clearly define state-owned land in the law,set up a comprehensive and centralized inventory of state-owned land, better
48 Y E M E N : D E V E L O P M E N T P O L I C Y R E V I E W
10414-04_Ch04.qxd 4/17/08 11:17 AM Page 48
enforce existing measures to curb land speculation, as well as to identify and applystandardized procedures for the disposition of state-owned Land. The governmentsubmitted a draft law to the House of Representatives in 2005, which addressedmany of the problems in the existing law that governs state land management.However, there are still several issues that are not resolved by the new draft andwhich require a more thorough revision of the law.
� Take advantage from international experience in the current revision of the law governingland registration. The government of Yemen is moving in the right direction withits initiative to replace the current land registration law. The draft laws proposed,however, show some weaknesses. The government might seize the opportunity ofthe present wind of change and amend the draft laws to facilitate effective regis-tration, ensure financial sustainability of the registry system, and strengthen thelegal effect of the registry system.
I M P R O V I N G T H E I N V E S T M E N T C L I M A T E 49
10414-04_Ch04.qxd 4/17/08 11:17 AM Page 49

10414-04_Ch04.qxd 4/17/08 11:17 AM Page 50
Although Yemen’s oil reserves are fast depleting, careful management andinvestment of the remaining reserves are of paramount importance to
Yemen’s future. The welcome development of gas resources will continue to keepthe hydrocarbon sector a vital part of the Yemeni economy. Yemen’s developmentpartners are increasingly demanding greater transparency in managing resourcerevenues as a condition for development assistance. For improving the manage-ment of oil and gas revenues, Yemen needs to join the Extractive Industry Trans-parency Initiative, end petroleum subsidies in a gradual but time-bound way, andimprove the efficiency of refining and distribution of petroleum (the so-calleddownstream functions). An incentive framework to develop gas resources wouldalso help in finding and exporting gas. In the power sector, the focus needs to beon improving the availability of electricity and bringing the public electricity cor-poration up to financial health.
Conditions and Challenges in the Oil and Gas Sectors
The hydrocarbon industry plays a central role in Yemen’s economy. Oil revenuesrepresented 90 percent of export revenues and over 70 percent of government rev-enues in 2005, fairly typical of non-diversified oil-exporting countries, such as thosein the Gulf Cooperation Council. The Yemeni government obtains oil revenuesthrough its share of oil production agreed with foreign mining companies underproduction sharing agreements. The government supplies crude oil to the two state-owned refineries, located in Aden and Marib, from its share of oil production. Theremaining share is exported to international markets. Because of the mismatchbetween domestic demand and supply of refined products, Yemen imports about10 percent of its domestic consumption (mainly diesel).
Transparent and efficient management of Yemen’s remaining hydrocarbonwealth is critical. Yemen has about 1.2 billion barrels of unexploited proven oilreserves and 17 trillion cubic feet (tcf) of gas reserves. Hydrocarbon wealth (net ofproduction sharing agreements with foreign oil companies) is valued at US$30 bil-lion, 2.5 times the U.S. dollar value of GDP in 2005. The state-owned Aden refinery,
51
Managing EnergyResources
5
10414-05_Ch05.qxd 4/17/08 11:20 AM Page 51

which processes most of the domestic crude, is a half-a-century old plant, operatingat nearly one-third of its installed capacity.
In the coming years, oil production is expected to decline by 12–16 percent peryear.32 Yemen discovered oil and gas in 1984 and production started in 1986. Even-tually, the original estimate of oil reserves tripled to 3 billion barrels and gas reservesquadrupled to 17 tcf. By the end of 2003, nearly two-thirds of Yemen’s total oilreserves, estimated at about 3 billion barrels, was depleted.33 With no export marketfor gas until very recently, Yemen has been prudently re-injecting gas into the field,even as it is released as associated gas with oil. Since 2000, daily oil production hasleveled off at around 420 thousand barrels. At current extraction rates, oil resourceswill be exhausted by 2012, if no new discoveries are made.34
Recent projections of oil production show that production from new oil fieldswill not be able to offset the decline in established fields. Yemen therefore faces theprospect of an unprecedented decline in oil production. Although the governmenthas recently initiated a gas development and export program, gas is unlikely to fillthe role of oil in the future. Yemen successfully secured (in a highly competitivemarket) 25-year contracts to develop and export of one-third of its gas reserves. Itis not known at this time what the net value will be of this program, as the price ofpaying for development, transport, and liquefaction have not yet been costed out.Estimates of the gross annual value of the secured export contract is likely to bearound US$1.5 billion (2005 prices), just a quarter of the value of crude oil exportsin 2005. However, with the dwindling oil supply, gas resources will also need tobe utilized for the energy needs of the domestic economy.
The Reform Agenda for Oil and Gas
The prospect of a steady decline in oil production will pose a major fiscal challengefor Yemen. Export revenues of oil accruing to the government are projected to declineby 14 percent a year, a slightly faster rate than the decline in oil production due torising domestic consumption needs. If expenditures are not reined in or alternativerevenues are not mobilized, the fiscal deficit could balloon to over 12 percent of GDPby the end of the decade. Attempts to shrink the fiscal deficit by pruning develop-ment expenditures would compromise goals on poverty alleviation. Monetizationof the growing fiscal deficit would feed the acceleration of inflation to near 14 per-cent by the end of the decade. In this context, a variety of policies could be adoptedto mitigate the fiscal impact of declining oil production.
Improving revenue management
To improve the management of oil revenues, adopting transparent policies for thedistribution of oil revenues and strengthening the governance of oil revenue man-agement are essential. Endorsing the Extractive Industries Transparency Initiative(EITI) would be a quick-win action to raise the government’s credibility with the civilsociety and the international donor community. Under EITI, it is required that eachgovernment-owned company that operates in the oil and gas sector publishes sepa-
52 Y E M E N : D E V E L O P M E N T P O L I C Y R E V I E W
10414-05_Ch05.qxd 4/17/08 11:20 AM Page 52

rate accounts35 to track financial flows generated from the refining, marketing, anddistribution of petroleum products in the downstream sector.36
Yemen is already placing detailed information about its oil sector into the pub-lic domain, comparable to countries that have already adopted the EITI. Yemenreleases information on production by block, field, and company, unlike mostother oil producers. But making the information available to the public speedily,auditing before releasing the information, better and clearer dissemination usingthe internet and engaging the civil society are the key steps that Yemen would needto take under EITI.
Reforming price subsidies
Another policy to better manage oil revenues would target Yemen’s large and grow-ing subsidies on domestic petroleum consumption. Most oil exporters subsidizedomestic consumption,37 particularly diesel and residential fuel oil, motivated bya desire to share the oil wealth among a wider population. The subsidy for dieselin Yemen is the fourth highest in the world. Yemen imports 55 percent of its dieseland 90 percent of its fuel oil needs38 at international prices, but sells them at loweradministered prices. Estimates of petroleum subsidies for 2005, subsequent to thesteep increase in July 2005, are shown in Table 5.1 (representing 9 percent ofGDP). The main reason for the rise in subsidies is the infrequent adjustment inretail prices of petroleum products. As a result, domestic prices have deviated frominternational prices sharply increasing the subsidy on petroleum products.
Nearly one-quarter of the petroleum subsidy is wasted.39 First, the budgetarycost to the government exceeds the benefit to the consumers. Of the total petroleumcash subsidy in 2003 (about YR 100 billion), up to YR 20 billion is wasted with nocorresponding benefit to the population.40 Second, estimates suggest that nearly 7 percent of diesel consumption in Yemen is smuggled abroad. Yemeni prices fordiesel and kerosene are well below international prices and are also often below thatof neighboring countries, particularly the African countries across the Gulf of Aden.The Yemeni diesel price was estimated to be US$0.18 per liter at the end of 2005,compared with US$0.25 in Eritrea, US$0.54 in Djibouti, and US$0.80 in Somalia
M A N A G I N G E N E R G Y R E S O U R C E S 53
Table 5.1 Petroleum Product Subsidies Before and After July 2005
Before July 2005 After July 2005
World price Retail price Ratio to world Retail price Ratio to world(YR/liter) (YR/liter) price (%) (YR/liter) price (%)
Diesel 90 17 50 35 39
LPG 909 250 43.7 400 44
Gasoline 86 35 75.6 60 70
Kerosene 97 16 46.9 35 36
Source: Staff estimates.
10414-05_Ch05.qxd 4/17/08 11:20 AM Page 53
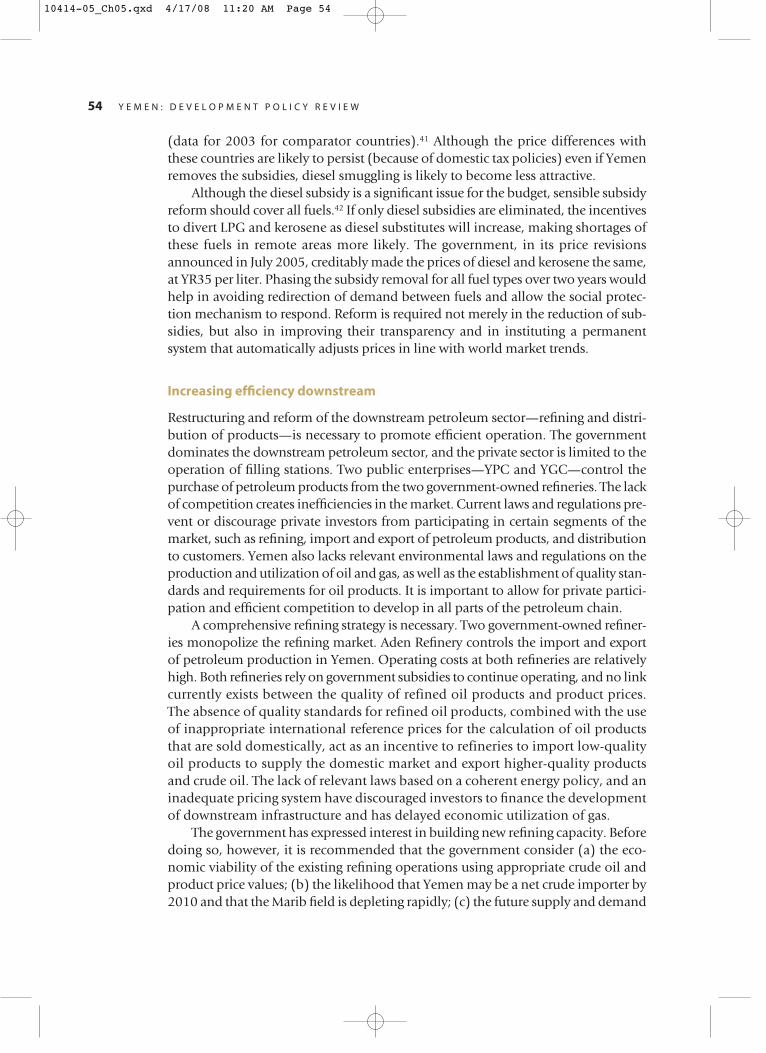
(data for 2003 for comparator countries).41 Although the price differences withthese countries are likely to persist (because of domestic tax policies) even if Yemenremoves the subsidies, diesel smuggling is likely to become less attractive.
Although the diesel subsidy is a significant issue for the budget, sensible subsidyreform should cover all fuels.42 If only diesel subsidies are eliminated, the incentivesto divert LPG and kerosene as diesel substitutes will increase, making shortages ofthese fuels in remote areas more likely. The government, in its price revisionsannounced in July 2005, creditably made the prices of diesel and kerosene the same,at YR35 per liter. Phasing the subsidy removal for all fuel types over two years wouldhelp in avoiding redirection of demand between fuels and allow the social protec-tion mechanism to respond. Reform is required not merely in the reduction of sub-sidies, but also in improving their transparency and in instituting a permanentsystem that automatically adjusts prices in line with world market trends.
Increasing efficiency downstream
Restructuring and reform of the downstream petroleum sector—refining and distri-bution of products—is necessary to promote efficient operation. The governmentdominates the downstream petroleum sector, and the private sector is limited to theoperation of filling stations. Two public enterprises—YPC and YGC—control thepurchase of petroleum products from the two government-owned refineries. The lackof competition creates inefficiencies in the market. Current laws and regulations pre-vent or discourage private investors from participating in certain segments of themarket, such as refining, import and export of petroleum products, and distributionto customers. Yemen also lacks relevant environmental laws and regulations on theproduction and utilization of oil and gas, as well as the establishment of quality stan-dards and requirements for oil products. It is important to allow for private partici-pation and efficient competition to develop in all parts of the petroleum chain.
A comprehensive refining strategy is necessary. Two government-owned refiner-ies monopolize the refining market. Aden Refinery controls the import and exportof petroleum production in Yemen. Operating costs at both refineries are relativelyhigh. Both refineries rely on government subsidies to continue operating, and no linkcurrently exists between the quality of refined oil products and product prices.The absence of quality standards for refined oil products, combined with the useof inappropriate international reference prices for the calculation of oil productsthat are sold domestically, act as an incentive to refineries to import low-qualityoil products to supply the domestic market and export higher-quality productsand crude oil. The lack of relevant laws based on a coherent energy policy, and aninadequate pricing system have discouraged investors to finance the developmentof downstream infrastructure and has delayed economic utilization of gas.
The government has expressed interest in building new refining capacity. Beforedoing so, however, it is recommended that the government consider (a) the eco-nomic viability of the existing refining operations using appropriate crude oil andproduct price values; (b) the likelihood that Yemen may be a net crude importer by2010 and that the Marib field is depleting rapidly; (c) the future supply and demand
54 Y E M E N : D E V E L O P M E N T P O L I C Y R E V I E W
10414-05_Ch05.qxd 4/17/08 11:20 AM Page 54
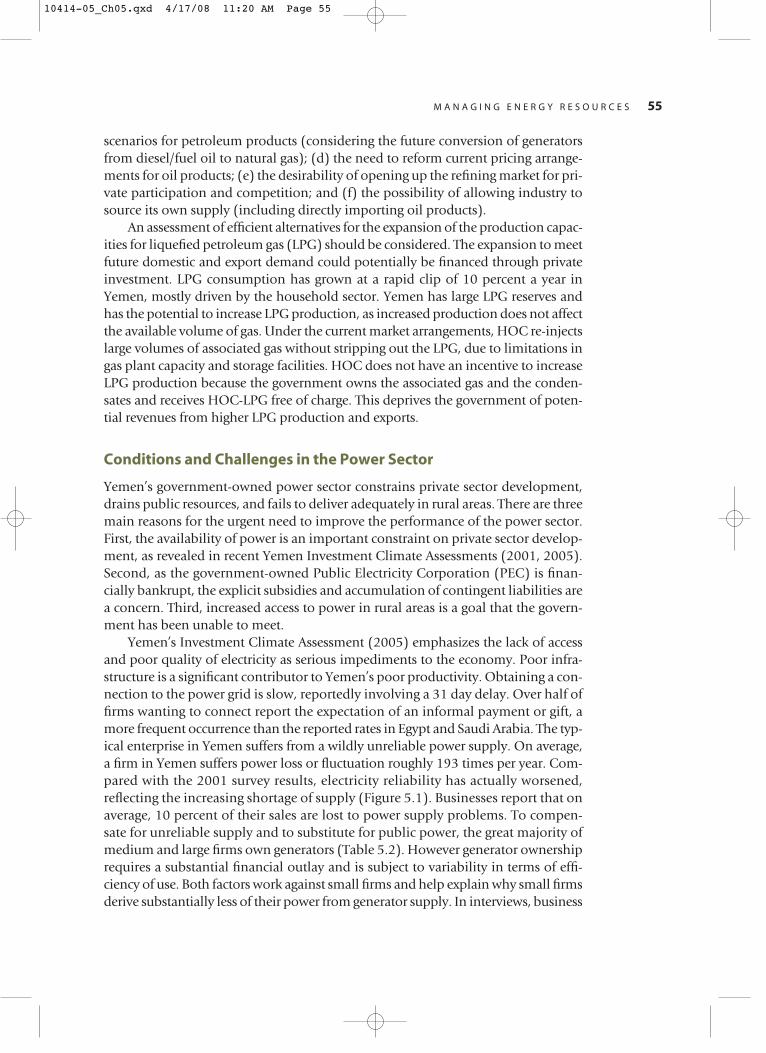
scenarios for petroleum products (considering the future conversion of generatorsfrom diesel/fuel oil to natural gas); (d) the need to reform current pricing arrange-ments for oil products; (e) the desirability of opening up the refining market for pri-vate participation and competition; and (f) the possibility of allowing industry tosource its own supply (including directly importing oil products).
An assessment of efficient alternatives for the expansion of the production capac-ities for liquefied petroleum gas (LPG) should be considered. The expansion to meetfuture domestic and export demand could potentially be financed through privateinvestment. LPG consumption has grown at a rapid clip of 10 percent a year inYemen, mostly driven by the household sector. Yemen has large LPG reserves andhas the potential to increase LPG production, as increased production does not affectthe available volume of gas. Under the current market arrangements, HOC re-injectslarge volumes of associated gas without stripping out the LPG, due to limitations ingas plant capacity and storage facilities. HOC does not have an incentive to increaseLPG production because the government owns the associated gas and the conden-sates and receives HOC-LPG free of charge. This deprives the government of poten-tial revenues from higher LPG production and exports.
Conditions and Challenges in the Power Sector
Yemen’s government-owned power sector constrains private sector development,drains public resources, and fails to deliver adequately in rural areas. There are threemain reasons for the urgent need to improve the performance of the power sector.First, the availability of power is an important constraint on private sector develop-ment, as revealed in recent Yemen Investment Climate Assessments (2001, 2005).Second, as the government-owned Public Electricity Corporation (PEC) is finan-cially bankrupt, the explicit subsidies and accumulation of contingent liabilities area concern. Third, increased access to power in rural areas is a goal that the govern-ment has been unable to meet.
Yemen’s Investment Climate Assessment (2005) emphasizes the lack of accessand poor quality of electricity as serious impediments to the economy. Poor infra-structure is a significant contributor to Yemen’s poor productivity. Obtaining a con-nection to the power grid is slow, reportedly involving a 31 day delay. Over half offirms wanting to connect report the expectation of an informal payment or gift, amore frequent occurrence than the reported rates in Egypt and Saudi Arabia. The typ-ical enterprise in Yemen suffers from a wildly unreliable power supply. On average,a firm in Yemen suffers power loss or fluctuation roughly 193 times per year. Com-pared with the 2001 survey results, electricity reliability has actually worsened,reflecting the increasing shortage of supply (Figure 5.1). Businesses report that onaverage, 10 percent of their sales are lost to power supply problems. To compen-sate for unreliable supply and to substitute for public power, the great majority ofmedium and large firms own generators (Table 5.2). However generator ownershiprequires a substantial financial outlay and is subject to variability in terms of effi-ciency of use. Both factors work against small firms and help explain why small firmsderive substantially less of their power from generator supply. In interviews, business
M A N A G I N G E N E R G Y R E S O U R C E S 55
10414-05_Ch05.qxd 4/17/08 11:20 AM Page 55
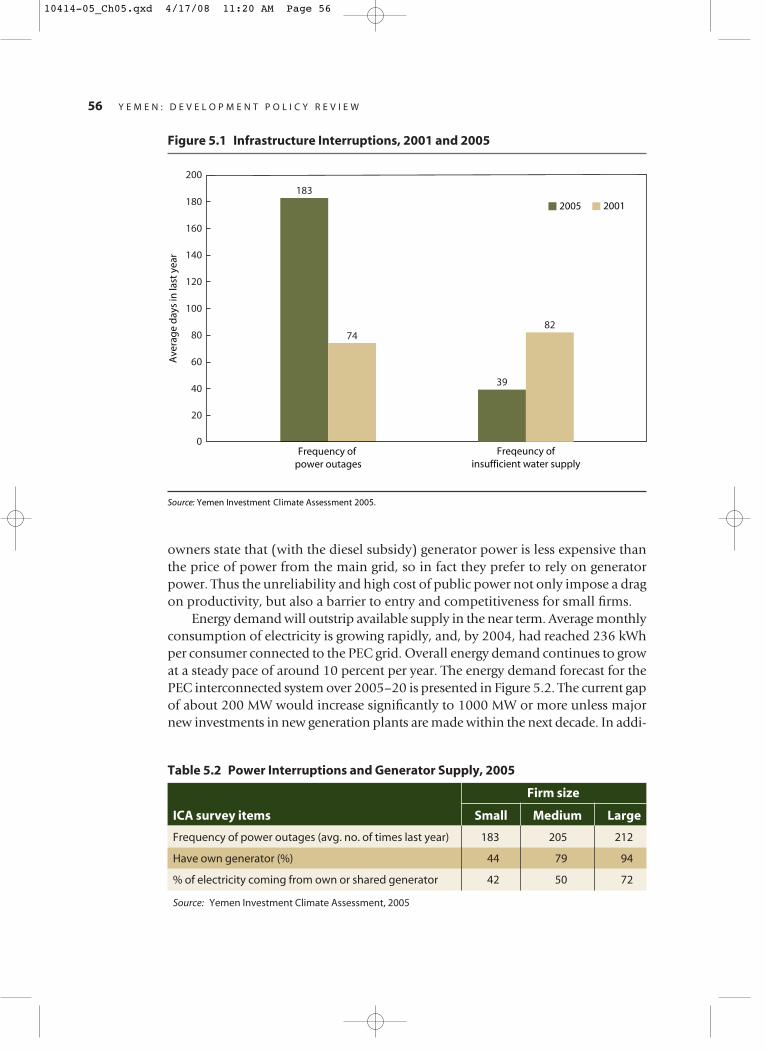
owners state that (with the diesel subsidy) generator power is less expensive thanthe price of power from the main grid, so in fact they prefer to rely on generatorpower. Thus the unreliability and high cost of public power not only impose a dragon productivity, but also a barrier to entry and competitiveness for small firms.
Energy demand will outstrip available supply in the near term. Average monthlyconsumption of electricity is growing rapidly, and, by 2004, had reached 236 kWhper consumer connected to the PEC grid. Overall energy demand continues to growat a steady pace of around 10 percent per year. The energy demand forecast for thePEC interconnected system over 2005–20 is presented in Figure 5.2. The current gapof about 200 MW would increase significantly to 1000 MW or more unless majornew investments in new generation plants are made within the next decade. In addi-
56 Y E M E N : D E V E L O P M E N T P O L I C Y R E V I E W
Frequency of power outages
74
183
0
20
40
60
80
100
120
140
160
180
200A
vera
ge
day
s in
last
yea
r
2005 2001
Source: Yemen Investment Climate Assessment 2005.
Freqeuncy ofinsufficient water supply
82
39
Figure 5.1 Infrastructure Interruptions, 2001 and 2005
Table 5.2 Power Interruptions and Generator Supply, 2005
Firm size
ICA survey items Small Medium Large
Frequency of power outages (avg. no. of times last year) 183 205 212
Have own generator (%) 44 79 94
% of electricity coming from own or shared generator 42 50 72
Source: Yemen Investment Climate Assessment, 2005
10414-05_Ch05.qxd 4/17/08 11:20 AM Page 56
tion to the 220 MW of new diesel plants being installed at the main load centers(Sana’a and Aden), a capacity of 300 MW of new generation capacity has been con-tracted to be installed and commissioned in 2008 in Marib so as to close the gapbetween projected demand and available capacity. To provide adequate reservecapacity for the PEC interconnected system, other gas turbine generation projectsneed to be executed soon.
The public power sector is financially unviable despite increasing tariffs.Weighted average tariffs have increased regularly over the last few years to reachUS$0.064 per kWH in 2005. This is not too low by regional standards and yet cov-ers only about 80 percent of operating costs. The tariff structure still acts as a blan-ket subsidy to a large share of consumers, such as households consuming electricitywithin the limits of the first tariffs block of 200 kWh per month. The policy pro-posed in Yemen’s poverty reduction strategy—to charge economic tariff rates,replacing the generous lifeline of 200 kWh, at below US$0.02 per kWh—has notbeen implemented. Furthermore, Yemen is the least electrified country in theMiddle East and North Africa region, with electricity coverage stagnating and reach-ing only 40 percent of total population. The low access and the absence of reliableelectricity supply, particularly in rural areas, have been recognized as severe con-straints to economic growth and poverty reduction.
Power sector reforms are proceeding slowly. The improved maintenance of theexisting power plants and the paring down of network losses contributed to increasesin the availability of the installed capacity, although not at a pace that surpassed thesteady growth in demand. Any improvement in access to electricity, particularly in
M A N A G I N G E N E R G Y R E S O U R C E S 57
Figure 5.2 Forecast of Demand for Electricity, 2005–20
0
500
1,000
1,500
2,000
2,500
3,000
2005 2006 2007 2008 2010 2015 2020
Source: Project Appraisal Document (PAD), Power Sector Project, Yemen, World Bank, 2006. Note: The forecast is derived from the PEC “low growth” projections of peak demand, assuming that system load factor remains at 65.5 percent.
Peak demand (MW)
Maximum available generation (MW)
10414-05_Ch05.qxd 4/17/08 11:20 AM Page 57
the rural areas, will require a strategy for improving rural access by judiciously com-bining alternative sources of power. The difficulties in mobilizing funding for theprojects identified in the poverty reduction strategy thwarted the objective of aug-menting installed capacity by nearly one-third (to 1,266 MW) by 2005. In the longterm, adequate incentives are needed to attract private investments in the genera-tion and distribution (including the development of sustainable rural electrificationprojects) of electricity.
The government plans to implement a gas-to-power policy. Generation of elec-tricity should be shifted from the very expensive liquid fuels (Heavy fuel oil, diesel)to the domestically available natural gas. The government has decided to meet itsfuture power needs primarily through gas-fired single cycle plants and has formallyallocated 5.2 tcf of natural gas for power generation for the next 25 years. The gov-ernment has also decided to locate these power plants near the load centers. Accord-ingly, there will be a need for natural gas pipelines to be built, and the optimumnetwork design is being covered under a gas utilization study.
The Reform Agenda in the Power Sector
Sustainable development of Yemen’s power sector will require a variety of mea-sures to improve the efficiency of operations, the equity of distribution, and theclarity of legal and regulatory frameworks.
� The operation of the state-owned utility PEC needs to be more efficient. In a bid toimprove its financial and technical performance, the PEC initiated aggressive pro-grams to collect unpaid bills, reduce electricity losses in the distribution networks,and rehabilitate its generation plants and transmission networks. Additional mea-sures will have to be implemented before PEC’s performance can be rated as sat-isfactory. Some of the major transmission and distribution measures that will betackled over the medium term include: (a) reduction of losses from the currentlevel of 25 percent to 19.5 percent by 2010; (b) establishment of tariff-settingprinciples within a reasonable timeframe to reach full cost recovery and tarifflevels in an equitable manner; (c) increased attention to maintenance expendi-tures, improved bill collection, etc; (d) functional unbundling of generation,transmission and distribution to strengthen cost control and accountability;and (e) restructuring to develop an effective organizational function, and defin-ing criteria for structuring regions and power plants.
� The challenge of rural electrification needs to be addressed. As a first step in addressingits rural electrification challenges, the government has launched a series of studiesto develop effective policies and encourage the establishment of community-owned and operated utilities in the rural and isolated areas. Under financing fromdonors such as the Global Environmental Facility, the government is formulatinga comprehensive rural electrification strategy. The strategies will initially be testedthrough pilot schemes before full-scale implementation.
� A legal framework needs to be adopted. A draft Electricity Law is currently underreview by the government. The ratification of this law is paramount to the imple-
58 Y E M E N : D E V E L O P M E N T P O L I C Y R E V I E W
10414-05_Ch05.qxd 4/17/08 11:20 AM Page 58
mentation of reforms in the electricity sector. The law will strengthen corporategovernance of PEC, provide an enabling environment for private sector partici-pation in the generation and distribution of electricity, provide adequate provi-sions for new institutional setups, and present policy directions for unbundlingthe sector at a later stage. Ratification of the law by the parliament is expected byJune 30, 2006.
� A regulatory framework needs to be established. The empowerment of an indepen-dent regulatory authority is essential for the development of a financially sus-tainable electricity sector. The Electricity Law is fundamental to the creation ofan independent regulatory authority, which will cover the legal aspects necessaryto create an independent regulatory entity and define the regulatory philosophyand principles of its application.
M A N A G I N G E N E R G Y R E S O U R C E S 59
10414-05_Ch05.qxd 4/17/08 11:20 AM Page 59

10414-05_Ch05.qxd 4/17/08 11:20 AM Page 60
Yemen’s deepening water crisis calls for immediate action. Yemen has one ofthe world’s lowest rates of per capita water availability (150 cubic meters per
year). It has no perennial surface water and depends entirely on rainfall, ground-water, and flash flooding. Much of what little water is available is allocated to agri-culture; in fact, Yemen has the lowest proportion of water used for domesticpurposes and the highest proportion used for agriculture among many comparablecountries (Table 6.1). Although Yemen has recently developed commercial irriga-tion systems for agriculture and piped water and sanitation services in both urbanand rural areas, these developments have raised demand beyond sustainable levels,resulting in very rapid mining of groundwater, extreme water supply shortages inthe major cities, and limited access to safe drinking water. The main causes of thewater crisis are clear: the rising demand as population grows and market-led agri-culture develops; the exploitation of groundwater, that is now getting out of hand;the institutional framework that has promoted expansion rather than efficient useand sustainable management; and the weak capacity of governance. The likelyincreases in water consumption in all sectors will cause per capita water availabilityto dip below 100 meters per year in the foreseeable future. Mining of groundwateris creating problems of equity, an unsustainable “bubble” of agricultural prosper-ity, and competition between urban and rural sectors for the resource.
Limited results, despite a decade of reform
Since the early 1990s, Yemenis have been aware of the impending water crisis. Earlymeasures focused on institutional restructuring and reform. The government movedfirst on the institutional front. The National Water Resources Authority (NWRA) wascreated in 1996 with support from the UN Development Programme and the Dutchgovernment, with the intention of locating responsibility and creating capacity foran integrated approach to water resources management. For urban water, a processof decentralization back to autonomous utilities (called “local corporations”) beganin the 1990s, and a restructuring program was developed over the period 1996–98with GTZ and World Bank support, and was formally adopted in 1999. The General
61
Managing WaterResources
6
10414-06_Ch06.qxd 4/17/08 11:21 AM Page 61

Authority for Rural Water was created in the early 1990s to bring together all gov-ernment activities on rural water supply and sanitation; however dramatically poorperformance is currently compelling a restructuring of the whole rural water sector.
Attempts were also made (largely under the IDA-financed Land and Water Con-servation Project) to refocus irrigation development on water use efficiency, partici-patory approaches to spate management, groundwater recharge and watershedmanagement. Following a diesel price hike in 1996, the government created the Agri-culture and Fisheries Production Promotion Fund to invest a proportion of the extrarevenue from diesel sales into projects promoting agricultural productivity. In 2003,a new Ministry of Water was created and charged with implementing the govern-ment’s National Water Sector Strategic Investment Plan, which is more integrated,targeted, participatory, and inclusive than previous strategies and, if implemented,should make the water sector more service-oriented and pro-poor. The plan remainsvague, however, on implementation of the water law and is generally weak on insti-tutions and sector management capacity. Overall, the reforms have made a contri-bution to reaching sector objectives, but broader and more sustained strategic actionsare needed to meet the challenges ahead.
Challenges in the Water Sector
Yemen’s water sector faces four challenges: (a) mismanagement of water resources,especially over-mining of groundwater and misallocation of water for unproductiveuses; (b) poor access of the population to water and sanitation; (c) deterioration ofwater sources and water quality; and (d) weak institutional capacity.
Mismanagement of water resources
Groundwater use is driving rural growth, but groundwater mining is unsustainableand inequitable. Aided by technology and a profitable market (particularly in qat),groundwater abstraction has steadily increased since the mid-1980s in most areas ofYemen. It is estimated that there are about 50,000 private wells in the country (8,000
62 Y E M E N : D E V E L O P M E N T P O L I C Y R E V I E W
Table 6.1 Water Withdrawal, by Sector, in Yemen and Comparative Countries, 1998–2002(percent of total)
SaudiAlgeria Israel Jordan Kenya Lebanon Qatar Arabia Tunisia Yemen
Agricultural use 64.9 62.4 75.2 63.9 66.7 72.4 89.0 82.0 92.0
Domestic use 21.9 30.7 20.8 29.7 32.6 24.1 9.8 13.8 6.9
Industrial use 13.2 6.8 4.0 6.3 0.7 3.4 1.2 4.2 1.1
Total 100 100 100 100 100 100 100 100 100
Domestic as % of 33.7 49.2 27.7 46.5 48.9 33.3 11.0 16.8 7.5agricultural use
Source: Aquastat Database, Food and Agriculture Organization, 2006.
10414-06_Ch06.qxd 4/17/08 11:21 AM Page 62
operational wells in the Sana’a Basin alone, half of which are tubewells) togetherwith more than 200 drilling rigs. By 1990, irrigated agriculture alone was consum-ing 130 percent of Yemen’s renewable water resources. By 2005, this ratio hadreached over 150 percent. If expansion continues, the overdraft will reach 200 per-cent by 2025—although many aquifers would be pumped dry before then. Apartfrom being unsustainable, groundwater mining is also inequitable. Under currentanarchic conditions, better-off farmers have captured the lion’s share of groundwater,and there is evidence that both shallow groundwater and springs available to poorerfarmers have been depleted or exhausted. Towns too, have typically helped them-selves to water from rural areas, leading to social unrest and rural impoverishment(for example, the case of Al Haima, a green wadi, or water area, which was made adesert when Ta’iz city pumped out its water). Attempts to negotiate transfers, tried inthe Ta’iz Pilot Project, have not produced a workable model.
Water markets are one way of solving the rural to urban transfer problem. Inpractice, water markets already serve 30 percent of the needs of Sana’a, and largeproportions of needs in other towns. In Ta’iz, 90 percent of drinking water is pro-vided from private purification plants. The present private markets, however, areeconomically inefficient and informal. They lack an enabling framework to encour-age investment, as well as clear water rights. Furthermore, there is no provision forequity or sustainable management in the source area.
The paradox of groundwater mismanagement in Yemen is that the nation hasthree incompatible objectives: conserving groundwater, sustaining the rural econ-omy, and transferring water from agricultural to higher value domestic and indus-trial use. If poverty reduction objectives are added to these objectives, it is clear thatYemen faces tough choices.
Poor access to water and sanitation
Overall access to safe drinking water is very low, estimated at 31 percent nationwide.Access to sanitation is lower still, at 21 percent. This low coverage contributes toYemen’s dramatically poor indicators of human development: a 42 percent povertyheadcount, a 78 percent illiteracy rate for adult females, and 46 percent malnour-ishment rate for children under five. Although Yemen has ambitious targets underthe Millennium Development Goals for water (Table 6.2), they will be difficult toachieve in urban and rural areas alike.
The Urban Water Sector
An urban water sector reform program is underway to improve coverage and servicelevels. However, the urban population is growing fast and a very high rate of invest-ment will be necessary for Yemen to achieve its Millennium Development Goal tar-get of “halving the number of people unserved by 2015.” Achieving the MillenniumDevelopment Goals target will also require adapting service levels to what peoplewant and are willing to pay for. It may, in fact, be better to treat the MDGs as long-term goals rather than fixed time-bound targets and to progressively muster the
M A N A G I N G W A T E R R E S O U R C E S 63
10414-06_Ch06.qxd 4/17/08 11:21 AM Page 63
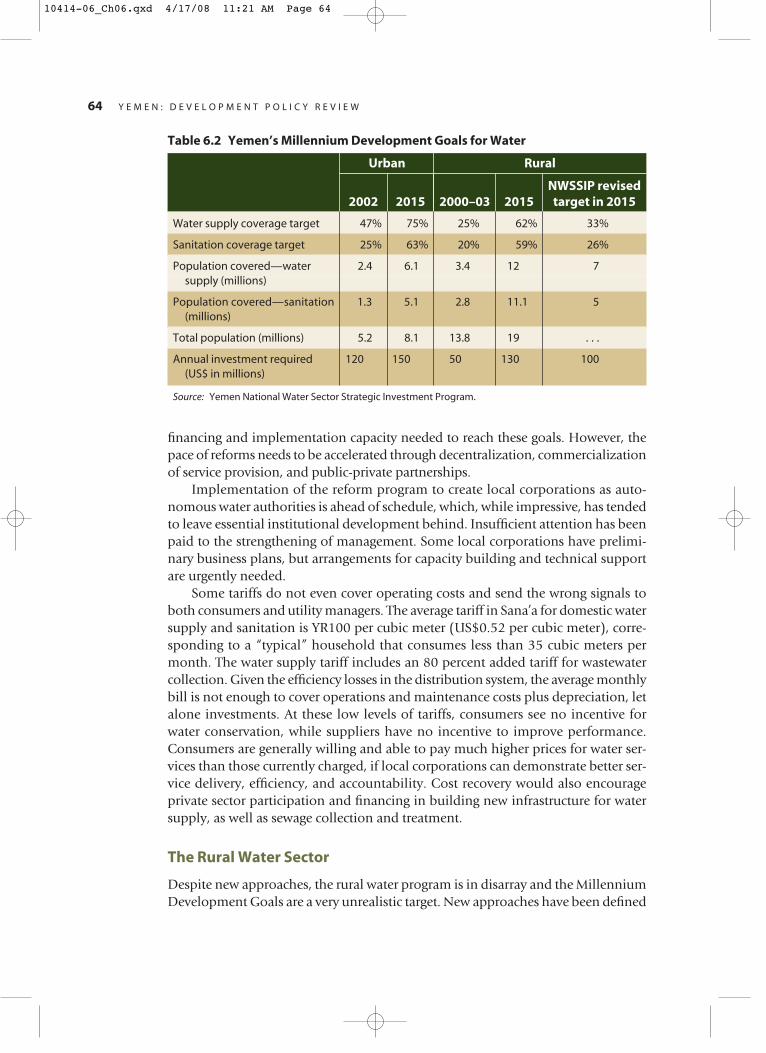
financing and implementation capacity needed to reach these goals. However, thepace of reforms needs to be accelerated through decentralization, commercializationof service provision, and public-private partnerships.
Implementation of the reform program to create local corporations as auto-nomous water authorities is ahead of schedule, which, while impressive, has tendedto leave essential institutional development behind. Insufficient attention has beenpaid to the strengthening of management. Some local corporations have prelimi-nary business plans, but arrangements for capacity building and technical supportare urgently needed.
Some tariffs do not even cover operating costs and send the wrong signals toboth consumers and utility managers. The average tariff in Sana’a for domestic watersupply and sanitation is YR100 per cubic meter (US$0.52 per cubic meter), corre-sponding to a “typical” household that consumes less than 35 cubic meters permonth. The water supply tariff includes an 80 percent added tariff for wastewatercollection. Given the efficiency losses in the distribution system, the average monthlybill is not enough to cover operations and maintenance costs plus depreciation, letalone investments. At these low levels of tariffs, consumers see no incentive forwater conservation, while suppliers have no incentive to improve performance.Consumers are generally willing and able to pay much higher prices for water ser-vices than those currently charged, if local corporations can demonstrate better ser-vice delivery, efficiency, and accountability. Cost recovery would also encourageprivate sector participation and financing in building new infrastructure for watersupply, as well as sewage collection and treatment.
The Rural Water Sector
Despite new approaches, the rural water program is in disarray and the MillenniumDevelopment Goals are a very unrealistic target. New approaches have been defined
64 Y E M E N : D E V E L O P M E N T P O L I C Y R E V I E W
Table 6.2 Yemen’s Millennium Development Goals for Water
Urban Rural
NWSSIP revised 2002 2015 2000–03 2015 target in 2015
Water supply coverage target 47% 75% 25% 62% 33%
Sanitation coverage target 25% 63% 20% 59% 26%
Population covered—water 2.4 6.1 3.4 12 7supply (millions)
Population covered—sanitation 1.3 5.1 2.8 11.1 5(millions)
Total population (millions) 5.2 8.1 13.8 19 . . .
Annual investment required 120 150 50 130 100(US$ in millions)
Source: Yemen National Water Sector Strategic Investment Program.
10414-06_Ch06.qxd 4/17/08 11:21 AM Page 64
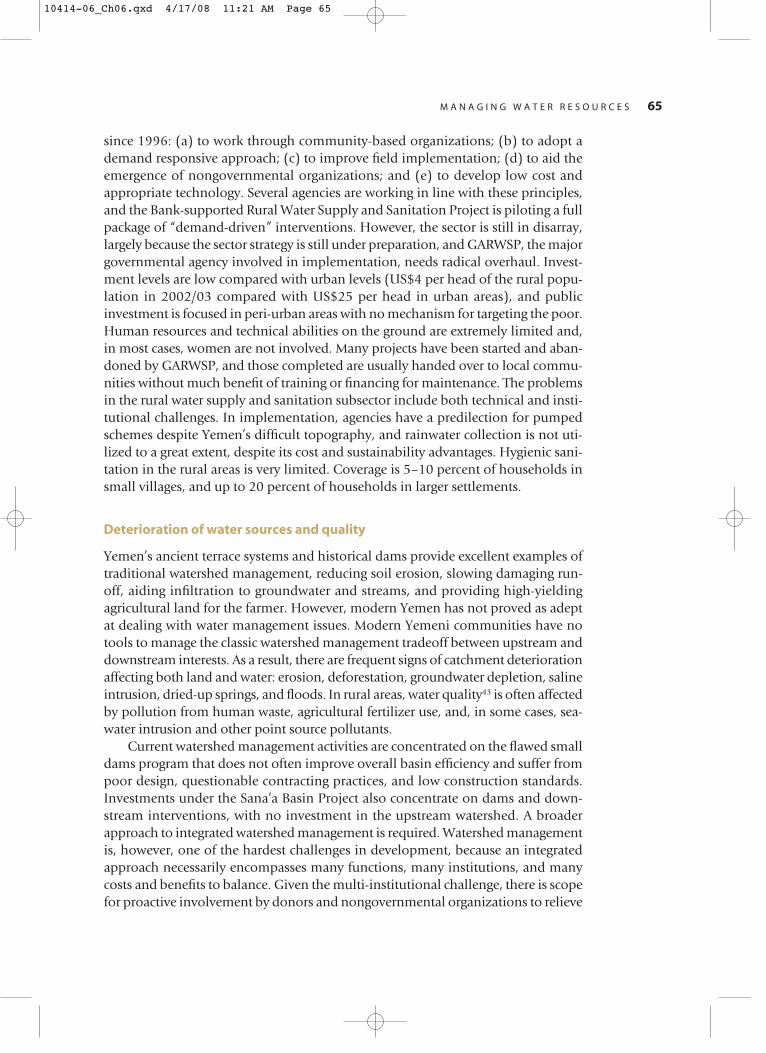
since 1996: (a) to work through community-based organizations; (b) to adopt ademand responsive approach; (c) to improve field implementation; (d) to aid theemergence of nongovernmental organizations; and (e) to develop low cost andappropriate technology. Several agencies are working in line with these principles,and the Bank-supported Rural Water Supply and Sanitation Project is piloting a fullpackage of “demand-driven” interventions. However, the sector is still in disarray,largely because the sector strategy is still under preparation, and GARWSP, the majorgovernmental agency involved in implementation, needs radical overhaul. Invest-ment levels are low compared with urban levels (US$4 per head of the rural popu-lation in 2002/03 compared with US$25 per head in urban areas), and publicinvestment is focused in peri-urban areas with no mechanism for targeting the poor.Human resources and technical abilities on the ground are extremely limited and,in most cases, women are not involved. Many projects have been started and aban-doned by GARWSP, and those completed are usually handed over to local commu-nities without much benefit of training or financing for maintenance. The problemsin the rural water supply and sanitation subsector include both technical and insti-tutional challenges. In implementation, agencies have a predilection for pumpedschemes despite Yemen’s difficult topography, and rainwater collection is not uti-lized to a great extent, despite its cost and sustainability advantages. Hygienic sani-tation in the rural areas is very limited. Coverage is 5–10 percent of households insmall villages, and up to 20 percent of households in larger settlements.
Deterioration of water sources and quality
Yemen’s ancient terrace systems and historical dams provide excellent examples oftraditional watershed management, reducing soil erosion, slowing damaging run-off, aiding infiltration to groundwater and streams, and providing high-yieldingagricultural land for the farmer. However, modern Yemen has not proved as adeptat dealing with water management issues. Modern Yemeni communities have notools to manage the classic watershed management tradeoff between upstream anddownstream interests. As a result, there are frequent signs of catchment deteriorationaffecting both land and water: erosion, deforestation, groundwater depletion, salineintrusion, dried-up springs, and floods. In rural areas, water quality43 is often affectedby pollution from human waste, agricultural fertilizer use, and, in some cases, sea-water intrusion and other point source pollutants.
Current watershed management activities are concentrated on the flawed smalldams program that does not often improve overall basin efficiency and suffer frompoor design, questionable contracting practices, and low construction standards.Investments under the Sana’a Basin Project also concentrate on dams and down-stream interventions, with no investment in the upstream watershed. A broaderapproach to integrated watershed management is required. Watershed managementis, however, one of the hardest challenges in development, because an integratedapproach necessarily encompasses many functions, many institutions, and manycosts and benefits to balance. Given the multi-institutional challenge, there is scopefor proactive involvement by donors and nongovernmental organizations to relieve
M A N A G I N G W A T E R R E S O U R C E S 65
10414-06_Ch06.qxd 4/17/08 11:21 AM Page 65
the burden on government agencies that typically find it hard to coordinate the mul-tiple interventions needed for watershed management.
Weak institutional capacity
Despite an impressive record in creating a modern administration from virtuallynothing over the last thirty years, Yemen faces an enormous set of problems in itspublic service. Competencies, management, and motivation are all low and, as aresult, performance is frequently negligible or perverse. This contributes to a veryweak governance environment; the more complex or innovative activities are a par-ticular problem—for example, the promotion of conjunctive use of surface waterand groundwater, or wastewater reuse, or watershed management—all requireenergy and coordination skills lacking in the public sector.
Clearly, it is essential to minimize the burden placed on government and toplace more reliance on nongovernmental and community organizations, the uni-versities, and the private sector. For functions that are the core responsibility of thegovernment, outsourcing and contracting may be possible. Participation at everylevel is key. Wherever possible, public interventions should be carried out throughdecentralized structures, which are more accountable and subject to feedback fromcommunities.
Where there is no alternative to working through the public sector, civil servicereform may offer some hope. For the water sector, the Ministry of Agriculture andInterior’s reform program ‘Agenda 21 for Agriculture’, prepared in 1998–99, is onesuch program ready to go.44
The Reform Agenda for Water Resources
The most critical measures needed to avert severe water stresses are intended toaddress weaknesses of governance, to increase participation in decision-making, andto introduce market-based mechanisms to improve allocation of scarce resources:
� Depletion of groundwater. Lacking strong public governance structures, over-miningof groundwater can be controlled by alternative means. Such alternative meansinclude intensive user involvement and organization, self-regulation by wateruser associations, monitoring and information sharing, tradable water rights,and improving incomes through technological improvements.
� Watershed management. Current watershed management activities are concen-trated on the flawed small dams program, which does not often improve overallbasin efficiency and suffers from poor design, questionable contracting practices,and low construction standards. Given the multi-institutional challenge, there isscope for proactive involvement of donors and nongovernmental organizationsto relieve the burden on government agencies, which typically find it hard to coor-dinate the multiple interventions needed for watershed management.
� Better allocation. Allocation of water to its best economic use can be improved byintroducing economic instruments. The problem with the present private markets
66 Y E M E N : D E V E L O P M E N T P O L I C Y R E V I E W
10414-06_Ch06.qxd 4/17/08 11:21 AM Page 66

is that they are economically inefficient and informal. There is no enabling frame-work to encourage investment. Water rights are unclear and there is no provisionfor equity or sustainable management in the source area. The development ofmore formal water markets should be a priority. At the current low levels of tar-iffs for domestic water supply that do not even cover operating and maintenancecosts, consumers see no incentive for water conservation while suppliers have noincentive to improve performance.
M A N A G I N G W A T E R R E S O U R C E S 67
10414-06_Ch06.qxd 4/17/08 11:21 AM Page 67

10414-06_Ch06.qxd 4/17/08 11:21 AM Page 68

Population growth in Yemen, at 3 percent per year, is well above the region’saverage of 1.9 percent and the average of 2.1 percent for low-income countries.
Yemen’s population of approximately 19.7 million (in 2004) is youthful, which willmean that an increasing number of couples will be having children in the comingdecades. Even if fertility were to drop immediately to the “replacement level” of twochildren per couple, the population would continue to grow for a long time, as theincrease in the number of younger couples having children will more than offsetthe decline in fertility. Although an increase in Yemen’s population is inevitable, thegrowth rate can gradually be reduced by selectively implementing the country’s com-prehensive population policies, for example, by increasing the demand for familyplanning, meeting that demand, and reducing the population momentum by encour-aging later marriage.
Yemen is carrying the burden of a stalled demographic transition.45 With declin-ing mortality rates, Yemen entered the second stage of demographic transitionaround 1990. Lately, the transition appears to have stalled. Annual child mortalityreductions are stagnating, and fertility decline is slow. As of 2003, with the total fer-tility rate is estimated at 6.2 children per woman, the crude birth rate at 41.3 (per1000 population), and the crude death rate at 11.3 (per 1000 population), little haschanged from the 1997 estimates of the Demographic and Household Survey(Republic of Yemen, 2005). On current trends, the population will nearly double to40 million in 20 years, nearly 5 million higher than the target of the national popu-lation policy adopted in 1997 (Figure 7.1).
Each additional Yemeni child born is estimated to cost the government US$250annually in 2005 prices for education and health care.46 The maternal mortality ratealso appears to be stagnating, with little change between the 1997 estimate of 351per 100,000 live births (Central Statistical Office and Marco International 1994) andthe 2003 rate of 365 per 100,000 live births (Republic of Yemen 2005). These ratesare among the highest in the world, with levels similar to those in Sub-Saharan Africa(Rushwan 2005). Yemen’s population is very young, with 45.7 percent under age 15,resulting in a high dependency ratio, and fueling the population momentum(Republic of Yemen 2005). Urbanization is also proceeding rapidly, with the urban
69
Slowing Population Growth
7
10414-07_Ch07.qxd 4/17/08 11:21 AM Page 69
population currently estimated at 26 percent, up from 17 percent in 1975. Yemen’spopulation is 19.7 million, according to preliminary results of the 2004 census(Republic of Yemen, Central Statistical Organization 2005). Using these preliminaryfigures, average household size is calculated at 6.84 persons, down from 7.0 in 1997.
Two important proxies of fertility—contraceptive use and age of marriage—havealso improved. While this represents significant progress, recent rates of improve-ment show signs of slowing:
� The spread of contraceptive use has slowed. The gap between the number of childrenwomen want and the actual number of children born has decreased steadily since1992 (5.4 versus 7.7 in 1992, compared with 4.6 versus 6.2 in 2003), but remainshigh. This suggests that contraceptive needs are being met to a greater extent thanthey were in 1992, but there is still a long way to go. As of 1997, 43 percent of ruraland 80 percent of urban women knew a source for obtaining contraceptives, withno more recent data available for comparison. Public hospitals and health centersremain the primary source for contraceptives (52.1 percent of users) according tothe 2003 Family Health Survey. Public sources of contraceptives and reproductivehealth services are increasing, from approximately 300 in 1999 (Bos, 2003) to1,239 in 2005, according to Ministry of Population and Public Health data, butwith actual regular availability of contraceptives being much more limited.
� Median age at marriage has improved steadily. Median age at first marriage is rising(17.2 years in 2003 versus 15.8 in 1991/92), and the pace of change appears tobe accelerating. The difference in age of marriage between women age 20–24 andthose aged 25–29 is a full two years. However, the mean age at which it is con-sidered ideal for a woman to marry is still low—18.3 years, with nearly 50 percent
70 Y E M E N : D E V E L O P M E N T P O L I C Y R E V I E W
0
1
2
3
4
5
6
7
8
9
Yemen, Rep.
Low incomeMiddle East &North Africa
Sub-Saharan Africa
High income: OECD
East Asia & Pacific
1962 1967 1972 1977 1982 1987 1992 1997 2002 2003
Source: Demographic Health Surveys.
Figure 7.1 Total Fertility Rate in Yemen and Selected Comparator Countries
10414-07_Ch07.qxd 4/17/08 11:21 AM Page 70

of married women preferring a marriage age of below 20 years for their daughters.Fertility levels decrease with rise in age of first marriage, and school attendance isa powerful deterrent to teenage pregnancy, with only 1.4 percent of 15–19 yearolds in school becoming pregnant or mothers versus 12.3 percent of those not inschool. This suggests the crucial role of education in decreasing fertility.
Yemen’s population indices are worse than any other country in the Middle East andNorth Africa region, across the board for all of the indicators of fertility and mater-nal health. Similarly, child health indicators are significantly worse, including thepercentage of children under five who are malnourished and the level of educationenrollment. The lessons from across the region and the developing world show that,even with limited means, countries can put into place effective measures to reducefertility rates. The most important factors are effective education and health care sys-tems, strong government support, and well-planned family planning and counsel-ing services (Box 7.1).
S L O W I N G P O P U L A T I O N G R O W T H 71
B O X 7 . 1 Lessons on Controlling Fertility from Other Countries in the Region
The experience of Middle East and North African countries shows that the religionand culture of the region are not absolute deterrents to reductions in fertility.
Iran is one of the success stories in the region, with fertility dropping from 6.6children per woman in 1985 to 2.5 in 2000. Policies that ensured this success werestrong political will and support from religious authorities, including the use of fat-was (religious rulings) in support of family planning, which were often displayed inhealth clinics, and the use of mosques to preach a policy of small families, as well asthe provision of family planning services by the Ministry of Health for womenbetween the ages of 15 and 49 years on a sustainable and regular basis, with astrong focus on counseling and gaining back women who broke off counseling.These policies were built on a well-functioning national health system.
Egypt has successfully used some of these same measures, including the issu-ing of fatwas, but cultural reasons still act as barriers for many Egyptian couples toaccess family planning services, and thus the gains have not been as great in Egypt.Despite such relative successes, it is not unusual for family planning to becomepoliticized in Muslim countries, which remains a danger in Yemen, and a reason toproceed carefully. The prevailing prices of birth control pills and devices are not aconstraint in Egypt, but perhaps are in Yemen, as only families at the higher eco-nomic levels tend to use modern contraceptives in Yemen.
Oman, like Yemen. had very high fertility rates in the late 1980s. In slightly morethan a decade the total fertility rate in Oman declined by 3.5 live births per womanto 5.1, whereas Yemen’s fertility decline has been slow. The difference is related toOman’s political stability, expansion of education opportunities for girls, and rapidexpansion of health and sanitation services. To date, Yemen’s decline in fertility hasbeen primarily due to women controlling fertility within marriage, whereas, inOman, it was due to delayed age of marriage (Eltigani, 2001).
10414-07_Ch07.qxd 4/17/08 11:21 AM Page 71
Yemen’s population policy
Yemen has set a national population policy for 2001–25, which focuses on reduc-ing maternal and child mortality, decreasing population growth, promoting con-traceptive use, addressing population distribution issues, and promoting humanand economic development. Its Population Action Program is the country’s majorvehicle for population policy. The 2001–05 program has been extended to 2010,and follows a comprehensive and integrated approach to reproductive health careand human development. It proposes a broad set of actions to reach its populationtargets, encompassing improvement in health care delivery, especially for womenand children; information and education about family planning and availability ofcontraceptives; and improvement of the economic, social, and educational statusof women.
This comprehensive policy follows international standards in targeting the mostimportant known demographic determinants and is consistent with the measuresfound to be successful in other countries. The Population Action Program is broadlyconsistent with the other sectoral and human development plans, such as the povertyreduction strategy, the five-year development plans, and the Millennium Develop-ment Goals, with which they have been integrated. Nonetheless, a good deal of workneeds to be done to bring them all into full alignment for consistency, follow up,and costing. Thus, Yemen’s population policies are appropriate and enjoy a widebase of support. It is likely that under the current policy fertility will continue todecline slowly, but that child mortality will experience slower declines, and urban-ization will continue at a rapid rate.
The problem has been implementation, rather than the policies themselves.Most of the objectives of the population action program have not been achieved.Two overriding factors have influenced the success of implementation. One is weakgovernance; the other is budget constraints:
� Weak governance. Accountability, efficiency, administrative capacity, and trans-parency have been increasingly identified as major factors slowing developmentprogress in Yemen, and measures to address these deficiencies will improve theability of government to implement effective population policies. Strengtheninggovernance is a long-term endeavor, however, as are the majority of the policies ofthe Population Action Program.
� Budget constraints. The poverty reduction strategy 2003–05 has costed out its pro-gram, which is broadly consistent with the Millennium Development Goals andwith the Population Action Program. However, as pointed in this analysis, accu-rate costing cannot as yet be carried out because the three human developmentframeworks are not properly conceptualized and do not provide a consistent,comprehensive, and quantified set of processes and outputs. One conclusion ofthis analysis is that the “poverty reduction strategy, Population Action Programand Millennium Development Goals will be confined to a limited share of natio-nal resources as long as they do not tap into the five-year planning resources.” Itremains unclear as to what extent these policies and programs are affordable.
72 Y E M E N : D E V E L O P M E N T P O L I C Y R E V I E W
10414-07_Ch07.qxd 4/17/08 11:21 AM Page 72
According to the poverty reduction strategy, the cost of development of humanresources in 2003–05 will be YR 210,923 million (Republic of Yemen, 2002).
Given these budget uncertainties, as well as the weak implementation capacities, itis likely that Yemen’s MDG targets in health and population are unattainable. TheMinistry of Public Health and Population calculated the cost of reaching all the Mil-lennium Development Goals related to health to be $53.52 per capita per yearbetween 2006 and 2015. This compares unfavorably with the 2002 levels of percapita government expenditures for health of only US$6 (WHO, 2005). Given thecurrent resource envelope, it is unlikely that such a dramatic increase in governmentfunds will be made available.
Program selectivity will be key to achieving success on population issues, giventhe constrained resource envelope. This does not argue against the broad strategy ofthe Population Action Program. It is well recognized that progress in the demo-graphic transition is linked with overall human and economic development, bothas a cause and an effect. In addition, overall institutional strengthening of the healthand education sectors are the necessary foundation for improving family planning,mortality, and girls’ education indicators in the long term. Nevertheless, it is possi-ble to prioritize within the short term. A second implication of this costing exerciseis that the health sector, key to any efforts to improve contraceptive usage anddecrease mortality, is vastly under funded at present levels. Even if donor and pub-lic sector efficiency were to improve to optimal levels, funding would still need toincrease. Although funding cannot increase tenfold to the levels suggested by theMDG-costing exercise, significant additional investment will be required to imple-ment essential population programs.
The Reform Agenda for Population Policy
The broad-based human development focus of the Population Policy should con-tinue. However, given the cost of implementing this broad program and the hugetask of building efficient and effective institutions in this fragile state, progress isexpected to be slow. With the population momentum now building, proceeding ata slow pace will lead to the creation of a high population burden in the future, withits attendant economic and human development costs.
Creating a takeoff in fertility and mortality reductions should be the focus inthe short term. Such a takeoff is entirely possible in Yemen, given the backgroundconsensus building, policy initiatives, and coordination that have taken place overthe past 10–13 years since the National Population Council was formed. The mostimportant tasks for the short term are rapid improvement of reproductive health,family planning, and child health services; acceleration of girls’ school enrollmentand women’s literacy; promotion of family planning to the household level; andeffective targeting of poor, illiterate, and rural households. Within these priorityareas, concrete actions need to be taken. Candidates for such action are describedin detail in Appendix Table A.20.
S L O W I N G P O P U L A T I O N G R O W T H 73
10414-07_Ch07.qxd 4/17/08 11:21 AM Page 73

Yemen’s current rapid population growth can be slowed down, even given all ofthe constraints posed by the lack of budget resources and governance capacities.Yemen has a sound population policy that follows a comprehensive and integratedapproach to reproductive health care and human development. This policy followsinternational standards in targeting the most important known demographic deter-minants and is consistent with the measures found to be successful in other coun-tries and the policy enjoys broad public support. Although implementation has beenweak so far, it can begin to be implemented selectively in the short term, focusing oninformation campaigns, health of children and mothers, and education of girls, forexample, to help Yemen’s demographic transition to take off.
74 Y E M E N : D E V E L O P M E N T P O L I C Y R E V I E W
10414-07_Ch07.qxd 4/17/08 11:21 AM Page 74
1. Countries with low human development are those with scores less than 0.5.2. Proven reserves are the reserves that have a reasonable probability of being
recovered at the current oil price, extraction costs and technology.3. Based on Ministry of Oil and Minerals (Petroleum Exploration and Produc-
tion Authority) estimate, proven reserves stood at 675.26 million barrels.4. The new estimate (end-June 2006) for the sum total of proven, probable and
possible reserves amounted to 1.417 billion barrels and the proven reserveswere 707 million barrels. These estimates are higher than the estimate at theend of 2005 by 5 percent for proven reserves and 17 percent for all reserves.
5. The World Bank has been calling for diversification of export revenuessince 1986.
6. Data on blocks at the end of 2003.7. In five of the six dimensions of governance identified by Kaufman, Kraay,
and Mastruzzi (2005)—the exception being voice and accountability—Yemen’s quality of governance is the poorest when compared to UnitedArab Emirates, Oman and Saudi Arabia.
8. Details on the national reform agenda and the progress under it are avail-able at http://www.ymenccg.org
9. World Bank (1997) estimated saving in public expenditure per birth avertedat US$161.22 per year in 1995 prices. To derive the estimate in 2005 pricesthis has been adjusted for changes to inflation and exchange rates between1995 and 2005.
10. Fiscal sustainability is the requirement that the government should generateenough primary surplus to pay off all outstanding debt. Primary surplus isthe excess of non-interest revenues less non-interest expenditures.
11. Optimal in the sense of preserving per capita oil wealth.12. The government has started taking steps to join the EITI initiative.13. This has been highlighted by the kidnappings of foreigners in 1998, the ter-
rorist attack on the USS Cole on October 12, 2000, and the explosion of aFrench tanker on October 6, 2002.
14. The categorization as “low-income country under stress” or “fragile” bothdraw on the World Bank’s Country Policy and Institutional Assessment
75
Notes
10414-08_Notes.qxd 4/17/08 11:22 AM Page 75

indicators (CPIA). The initiative defines 35 countries with CPIA score of 3.2or below in 2005. Yemen misses the categorization by a whisker with CPIArating of 3.3 in 2005. DFID labels 46 countries as fragile states on the crite-rion that they were in the first two quartiles of CPIA ratings any year between1999–2003.
15. World Bank’s Yemen Poverty Update (2002) estimated the poverty line onthe basis of the 1998 Household Budget Survey. The food poverty lines forYemen are YR2,101 (US$15.5) per person, per month at the national level,YR2,093 (US$15.4) in urban areas, and YR2,103 (US$15.5) in rural areas.Nationally, in 1998 the poverty lines for Yemen were YR3,210(US$23.6)per person per month, YR3,195 (US$23.5) in urban areas, and YR3,215(US$23.7) in rural areas.
16. See “Notes on Poverty Predictions and Projections for Yemen, 1998–2003,”World Bank, April 25, 2003. In the absence of up-to-date household surveydata, the analysis pursued a twofold approach. A consumption function wasestimated over the 1998 data, and then fitted to the Arab Family Health Sur-vey, carried out in 2003. The predicted household per capita expenditureswere then used to calculate predictions for poverty rates. Second, poverty pro-jections were obtained by carrying out a micro simulation over the 1998 data,under the assumption that household per capita expenditure grew at thesame rate as per capita output in the sector of activity of the household head.
17. The definition of unemployed includes those who are available for workbut not seeking. Open unemployment rates do not tell a full story in pooreconomies because the poor cannot afford to be openly unemployed.
18. Based on labor demand surveys.19. The gender dimension of the education sector highlights Yemen’s achieve-
ments over the past decade. Female gross primary enrollment rate has dou-bled from 34 percent in 1990 to 68 percent in 2002. Female net primaryenrollment has also shot up from 28 percent to 59 percent over the sameperiod and compares favorably to the male percentage, which has movedup from 74 percent to 84 percent.
20. However, the surveys report some perceived improvements in the areas ofcrime, theft, and disorder, regulatory policy uncertainty and a sharplyimproved waiting time for services and approvals.
21. No update available for 2005 by this measure.22. The list of comparators include Malaysia and Indonesia because Yemeni
nationals have migrated to these countries in the past century.23. Yemen’s institutional history and scattered nature of settlements also con-
tribute challenges to governance in Yemen. Not until the 1970s a civil ser-vice structure was established in the northern part of Yemen unlike the southor in some other developing countries. The geographically dispersed settle-ments with difficult access also inhibits quick and effective governance.
24. In today’s Yemen, the term shayakh has come to denote not only triballeaders but also rich and powerful social leaders who like themselves to becalled so.
76 N O T E S
10414-08_Notes.qxd 4/17/08 11:22 AM Page 76
25. Yemen Country Social Analysis, World Bank January, 2006.26. Election results in this section are obtained from Saif (2000) and www.
ElectionGuide.org.27. In addition, as Rodrik (1994) argues, the political benefit-cost ratio of
macroeconomic stabilization is relatively high because the benefits arebroadly distributed and the redistributive costs are usually not as large asthose of structural reform.
28. This section draws from the Yemen Country Social Analysis.29. Yemen Policy Note—Budgetary and Poverty Impacts of Petroleum Pricing in
Yemen (December 2004), World Bank.30. The no adjustment scenario assumes that key policy assumptions made in
the baseline scenario, such adjustments on tax policy and administration,as well as expenditure policy, financial management, and enhancement ofgrowth strategies for the non-oil sector, are not implemented.
31. Yemen also rates poorly, below the average for the Middle East and NorthAfrica, in the governance indicators calculated by Kaufmann, Kraay, andMastruzzi (2005). The World Bank’s “Doing Business” publication alsoevaluates Yemen as having high barriers to entry for businesses and lowperformance in maintaining rule of law.
32. The two likely scenarios both indicate a rapid decline in oil production. Sce-nario A is the least optimistic scenario, with output coming only from thecurrent seven production blocks. Under this scenario, production is likely todecline at an annual rate of nearly 16 percent, from the current level of406,000 b/d in 2004 to 144,000 b/d by 2010. Scenario B is more optimistic,including new production fields that the government anticipates to comeinto production over the next five years. Under this scenario, productionwould decline by an average of 11.7 percent per year, from 383,000 b/d in2005 to 205,000 b/d in 2010.
33. Yemen has large geographical areas that are currently unexplored. Some 84oil concession blocks exist, of which 33 have been licensed for E&P activi-ties and only 7 are currently producing crude oil.
34. Based on the Oil Ministry official estimates of remaining reserves of 1.3 bil-lion barrels (September 2004).
35. Yemen’s budget accounts publish aggregate cash flows received from oilcompanies including signing bonuses.
36. There are no published accounts available for YOGC, ARC, MRC, YPC,and YGC.
37. In 1999, the average petroleum subsidy in major oil exporters was 3.5 per-cent of GDP.
38. Based on Oil, Gas and Mineral Statistics, Annual Bulletin 2002.39. This paragraph draws on ESMAP (2004).40. Economists refer to this as “deadweight loss.”41. Based on International Fuel Prices, 2003, published by GTZ.42. Price reform should cover changes to fuel oil pricing to reflect the quality of
fuel (changing the benchmark international price used in compensating oil
N O T E S 77
10414-08_Notes.qxd 4/17/08 11:22 AM Page 77
refineries to Platt’s Gulf), charge freight charges more appropriate to Yemen,and broaden the tax base for road and maintenance tax to include lorries.
43. Water quality details are not known for the whole of Yemen, even thoughthere is a water laboratory in each governorate: the laboratory only checksthe water quality of each new well, with no arrangements for periodicmonitoring.
44. Agenda 21 is a program of the United Nations related to sustainable devel-opment. It is a comprehensive plan of action to be taken globally, nation-ally and locally by organizations of the UN, governments, and major groupsin every area in which humans impact on the environment.
45. Demographic transition is a four-stage process of demographic develop-ment, consisting of (a) stage 1: high fertility and high mortality, resultingin low population growth; (b) stage 2: high fertility and declining mortal-ity, resulting in accelerated population growth; (c)stage 3: declining fertil-ity and declining to low mortality, resulting in deceleration of populationgrowth; and (d) stage 4: low fertility and low mortality, resulting in lowpopulation growth.
46. World Bank had estimated saving in public expenditure per birth avertedat US$161.22 per year in 1995 prices. To derive the estimate in 2005 pricesthis has been adjusted for changes to inflation and exchange rates between1995 and 2005.
78 N O T E S
10414-08_Notes.qxd 4/17/08 11:22 AM Page 78
ADRA Yemen, 2005. Basic Health and Education Program, 12th Quarterly ProgressReport, Yemen, December.
ARD, Inc. 2004. Democracy and Governance: Assessment of Yemen, USAID Bureau ofDemocracy, www.dec.org/pdf_docs/PNACX728.pdf.
Alesina, Alberto, and Roberto Perotti. 1999. “Fiscal Institutions and Fiscal Perfor-mance.” in Poterba, James M., and Jurgenvon Hagen, eds., Chicago: The Univer-sity of Chicago Press, 1999, pp. 13–36.
Al-Maitami, Mohammed. 1998. “Efforts of Economic Program and Structural Adjust-ment,” Yemen Gateway, www.al-bab.com/yemen/econ/maitami2.htm.
Al-Asaly, Saif M. 2003. “Political Economy of Economic Growth Policies: The CaseOf Yemen Republic,” Economic Research Forum, Cairo, Egypt.
Al-Mansoob, Muhammed, and Al-Awg, Adul Karim, 2004. Children and Womenin Yemen: A Situation Analysis 2004, UNICEF, Yemen, September.
Al Serouri, Abdul W, Dina Balabanoiva, and Souad al Hibshi, 2002. Cost Sharingfor Primary Health Care: Lessons from Yemen, Oxfam.
Bos, Eduard, 2003. Republic of Yemen Population Note on Recent trends on populationin Yemen, The World Bank, March 28.
Burrowes, Robert D. 2005. “Yemen, Its Political Economy and the Effort againstTerrorism,” in Robert I. Rotberg, ed., Battling Terrorism in the Horn of Africa,Washington, DC: Brookings Institution Press/WPF.
Carapico, Sheila. 1998. Civil Society in Yemen: The Political Economy of Activism inModern Arabia, Cambridge, UK: Cambridge University Press.
Central Statistical Organization (ROY) and Macro International 1994., Yemen Demo-graphic and Maternal and Child Health Survey, 1991/92, Calverton Maryland:Macro International, March.
Central Statistical Organization (ROY) and Macro International, 1998. YemenDemographic and Maternal and Child Health Survey, 1998, Calverton Maryland:Macro International.
Central Statistical Organization (ROY), 2005. General Enumeration of the 2004 Pop-ulation, Housing, and Institutional Census 2004, Preliminary Results.
Compernolle, Phil, 2005. Estimating the Costs of Addressing the Health MDGs in Yemen(draft), Royal Tropical Institute (KIT), WHO, March (with MoPHP inputs).
79
References
10414-09_Refs.qxd 4/17/08 11:23 AM Page 79
DFID (Department of International Development), 2005. Why we need to workmore effectively in fragile States, January, United Kingdom.
Dresch, Paul. 2000. A History of Modern Yemen, Cambridge University Press.The Economic Intelligence Unit (EIU), 2004. Yemen Country Profile, February.Eltigani, Eltigani E., 2001. “Levels and Trends of Fertility in Oman and Yemen”,
Workshop on Prospects for Fertility Decline in High Fertility Countries, UN/POP/2001/8, June 7.
Esfahani, Hadi Salehi. 2002. “A Political Economy Model of Resource Pricing withEvidence from the Fuel Market,” manuscript. University of Illinois at Urbana-Champaign.
Esfahani, Hadi Salehi, and Farzad Taheripour. 2002. “Hidden Public Expendituresand Economic Performance in Iran,” International Journal of Middle East Studies,34: 691–718.
Esfahani, Hadi Salehi, and Lyn Squire. 2006. “Explaining Trade Policy in the Mid-dle East and North Africa,” Quarterly Review of Economics and Finance.
ESMAP, 2004. “Household Energy Supply and Use in Yemen”, Joint UNDP/WorldBank Energy Sector Management Assistance Programme(ESMAP), Decem-ber 18, Washington DC.
Eurelectric, 2000. “Electricity tariffs as of 1 January 2000 (Published tariffs),” Ref:2000-030-0337, June, Union of the Electricity Industry.
Fairbank, Alan 2005. “Public Expenditure Review, Health Sector, Republic ofYemen, 1999–2003”. February.
Finkel, David. 2005a. “Exporting Democracy: A Call From the Sheiks: U.S. IdealsMeet Reality in Yemen,” Washington Post, December 18. www.washingtonpost.com/wp-dyn/content/article/2005/12/17/AR2005121701237.html.
Finkel, David. 2005b. “Exporting Democracy: A Place Called Al Jawf: A Strugglefor Peace in a Place Where Fighting Never Ends,” Washington Post, December20. www.washingtonpost.com/wp-dyn/content/article/2005/12/18/AR2005121801070.html
Finkel, David. 2005c. “Exporting Democracy: The President’s Concerns: In the End,a Painful Choice,” Washington Post, December 20. www.washingtonpost.com/wp-dyn/content/article/2005/12/19/AR2005121901787
Hausman, R., D. Rodrik and A. Velasco, 2004. “Growth Diagnostics”, HarvardUniversity.
International Finance Corporation (IFC), 2005. “Gender Entrepreneurship Mar-kets (GEM): GEM Country Brief—Yemen,” Washington DC.
IMF. 2002a. Yemen in the 1990s: From Unification to Economic Reform, Washington,DC: International Monetary Fund.
IMF. 2002b. Article IV Consultations, various issues.IMF. 2005. Article IV Consultations, various issues.Katulis, B. 2004. Yemen Governance Country Profile.Kaufmann D., A. Kraay, and M. Mastruzzi, 2005. “Governance Matters IV: Governance
Indicators for 1996–2004,” World Bank, Washington DC.Political Risk Service, various years, Rating for risk of internal conflict.
80 R E F E R E N C E S
10414-09_Refs.qxd 4/17/08 11:23 AM Page 80

Manea, Elham M. 2000. “Yemen, the Tribe and the State,” Yemen Gateway,www.al-bab.com/yemen/soc/manea1.htm.
Martin, Will, 2005. “Outgrowing resource dependence theory and some recent develop-ments,” Policy Research Working Paper Series 3482, The World Bank.
Ministry of Education (ROY), 2003. National Strategy for Development of Basic Edu-cation in the Republic of Yemen 2003–2105, Yemen.
Ministry of Planning and International Cooperation (PRSP Unit), 2005. PovertyReduction Strategy, First Progress Report 2003–04, Yemen, May.
Ministry of Public Health and Population and Central Statistical Organization(ROY), and League of Arab States, 2005. Social Sector, Yemen Family HealthSurvey- Principal Report (2003).
Ministry of Public Health and Population (ROY), 2005. “Datasheet on staffing andservices for RH/FP (Population Sector),” Yemen.
Ministry of Public Health and Population (Population Sector), 2005. TOR for theNational Reproductive Health Technical Group.
National Population Council (ROY) 2005. The National Population Policy of theRepublic of Yemen, Population Action Programme 2001–2005.
Nonneman, Gerd. 1997. “Key Issues in the Yemeni Economy,” in E. G. H. Joffe, M. J.Hachemi, and E. W. Watkins, eds., Yemen Today: Crisis and Solutions, London:Caravel Press. Also available on Yemen Gateway, www.al-bab.com/yemen/econ/nonne1.htm.
Population Reference Bureau, 2004. The Wealth Gap in Health, Data on Women andChildren in 53 Developing Countries, May.
Republic of Yemen, 2002. Poverty Reduction Strategy Paper (2003–2005), Yemen.Republic of Yemen, 2003. Results of Labor Force Demand Survey in Establishments
Sector, Ministry of Social Affairs and Labour (Labour Market InformationSystem).
Republic of Yemen, 2004. Bulletin of Government Finance Statistics, Issue No.18,4th Quarterly, Ministry of Finance, Yemen.
Republic of Yemen (various issues). Bulletin of Government Finance Statistics, Min-istry of Finance, Yemen.
Republic of Yemen, 2004. “National Water Sector Strategy and Investment Pro-gram (NWSSIP),” December, Yemen.
Republic of Yemen, 2005. Demographic Health Survey, Yemen.Rodrik, Dani. 1994. “The Rush to Free Trade. Why so Late? Why Now? Will it Last?”
in Stephan Haggard and Steven Webb, eds., Voting for Reform, Oxford, UK:Oxford University Press.
Rushwan, Hamid, 2005. Safe Motherhood and Child Survival, Current Situation andKnowledge, National Safe Motherhood Conference, 12–14 December, Sana’a,Yemen.
Saif, Ahmed Abdelkareem. 2000a. “Yemen: State Weakness and Society Alien-ation,” Yemen Gateway, www.al-bab.com/yemen/pol/saifstate.htm.
Saif, Ahmed Abdelkareem. 2000b. “ Yemeni Electoral and Party Systems,” YemenGateway, www.al-bab.com/yemen/pol/saif000419.htm.
R E F E R E N C E S 81
10414-09_Refs.qxd 4/17/08 11:23 AM Page 81
Talib, Saadaldeen Ali. 2003. “A Decade of Pluralist Democracy in Yemen: theYemen Parliament After Unification (1990–2003),” in Ali Sawi, ed., Parliamen-tary Reform, Faculty of Economics & Political Science-Cairo University.
Toonen, Jurrien, 2005. Health Sector Development in Yemen, Making Choices: Towardsa Strategic Planning for the DPRP, final draft report, Royal Tropical Institute, Ams-terdam.
United Nations (Population Division, DESA), 2003. World Population Policies 2003,December 31.
United Nations Development Program (UNDP). 2005a. Human DevelopmentReport.
United Nations Development Program (UNDP). 2005b. “Yemen,” www.pogar.org.United Nations, 2005a. United Nations Common Country Assessment, Republic
of Yemen, Yemen, August 23.United Nations, 2005b. Millennium Development Goals Needs Assessment,
Yemen Country Report, June.USAID. 2005. “Findings from the Health Facility Survey 2004–05, Amran Gover-
norate, Yemen,” Washington, DC: United States Agency for InternationalDevelopment, Partners for Health Reformplus. September 2005.
WHO, 2005. The World Health Report, Statistical Annex.World Bank. 1996. “Republic of Yemen: Poverty Assessment”, Report No. 15158,
Washington DC.World Bank, 2002a. Doing Business, Washington DC.World Bank. 2002b. Economic Growth in the Republic of Yemen: Sources, Constraints,
and Potentials, Washington DC.World Bank. 2002c. Yemen Poverty Update, Report No. 24422-YEM, Washington DC.World Bank. 2002d. GenderStats database of Gender Statistics, Republic of Yemen,
Washington DC.World Bank, 2002e. “Republic of Yemen, Energy Sector Performance Improvement
and Future Development: The Way Forward”, April, Washington DC.World Bank, 2003. “Better Governance for Development in the Middle East and
North Africa”, Washington DC.World Bank, 2004a. Yemen Gender Note.World Bank, 2004b. Republic of Yemen: Population Action Program Design and Costing,
Technical Report, October, Washington DC.World Bank, 2004c. “The Oil and Gas Sector in the Republic of Yemen: A Back-
ground and Issues Report”, November 18, Washington DC.World Bank, 2005a. “Republic of Yemen: Investment Climate Assessment: Priorities
and Recommendations for Accelerating Private-led Growth”, Draft, March,Washington DC.
World Bank, 2005b. Republic of Yemen: Second Rural Access Project AppraisalDocument, October 11, Washington DC.
World Bank, 2005c. Country Water Resources Assistance Strategy for Yemen,Washington DC.
World Bank, 2006a. “Republic of Yemen: Country Social Analysis”, Report No.:34008-YE, Washington DC.
82 R E F E R E N C E S
10414-09_Refs.qxd 4/17/08 11:23 AM Page 82

World Bank, 2006b. Doing Business, Washington DC.World Bank, 2006c. “Republic of Yemen: Sector Wide Approach (SWAp) in the
Water Sector: Assessment of Readiness and Opportunities”, Draft, February 2,Washington DC.
World Bank, 2006d. “Republic of Yemen: Making Multi-Sectoral Approach WorkFor Children and Youth”, February 8, Washington DC.
R E F E R E N C E S 83
10414-09_Refs.qxd 4/17/08 11:23 AM Page 83

10414-09_Refs.qxd 4/17/08 11:23 AM Page 84
Appendix
Table A.1 GDP at Constant Producers Prices in Yemen, by Economic Activity, 1990–2004 (millions of Yemeni rials) 86
Table A.2 GDP at Current Producers Prices in Yemen, by Economic Activity, 1990–2004 (millions of Yemeni rials) 88
Table A.3 GDP by Expenditure at Current Prices in Yemen, 1990–2004 (millions of Yemeni rials) 90
Table A.4 Investment in Yemen, by Sector, 1990–2004 (in percent of GDP) 90
Table A.5 Central Government Finance in Yemen, 1990–2004(in percent of GDP) 92
Table A.6 Balance of Payments in Yemen (Analytic Presentation),1990–2004 96
Table A.7 Prices in Yemen, 1990–2004 98Table A.8 Exposure Indicators for Yemen, 1990–2004 98Table A.9 Selected Governance Indicators for Yemen, 1994–2006 100Table A.10 Alternative Governance Indicators for Yemen, 1996–2004 101Table A.11 Projections for Selected Economic Indicators,
No Adjustment Scenario for Yemen, 2005–25 102Table A.12 Projections for Selected Economic Indicators,
Most Recent Base Case Scenario for Yemen, 2005–25 106Table A.13 Projections for Selected Economic Indicators,
Low Oil Price Scenario for Yemen, 2005–25 110Table A.14 External Debt Sustainability Framework,
Baseline Scenario for Yemen, 2006–26(in percent of GDP, unless otherwise indicated) 112
Table A.15 Sensitivity Analyses for Key Indicators of Public and PubliclyGuaranteed External Debt in Yemen, 2006–25 (in percent) 116
Table A.16 Public Debt Sustainability Framework, Baseline Scenario for Yemen, 2006–26 (in percent of GDP, unless otherwise indicated) 120
Table A.17 Sensitivity Analysis for Key Indicators of Public Debt in Yemen, 2006–25 124
Table A.18 MiTllennium Development Goals for Yemen, 1990–2004 126Table A.19 Progress under the First Poverty Reduction Strategy
in Yemen, 2003–05 128Table A.20 Specific Measures to Reduce Fertility
and Maternal Mortality in Yemen 129
85
10414-10_AppA.qxd 4/17/08 11:23 AM Page 85
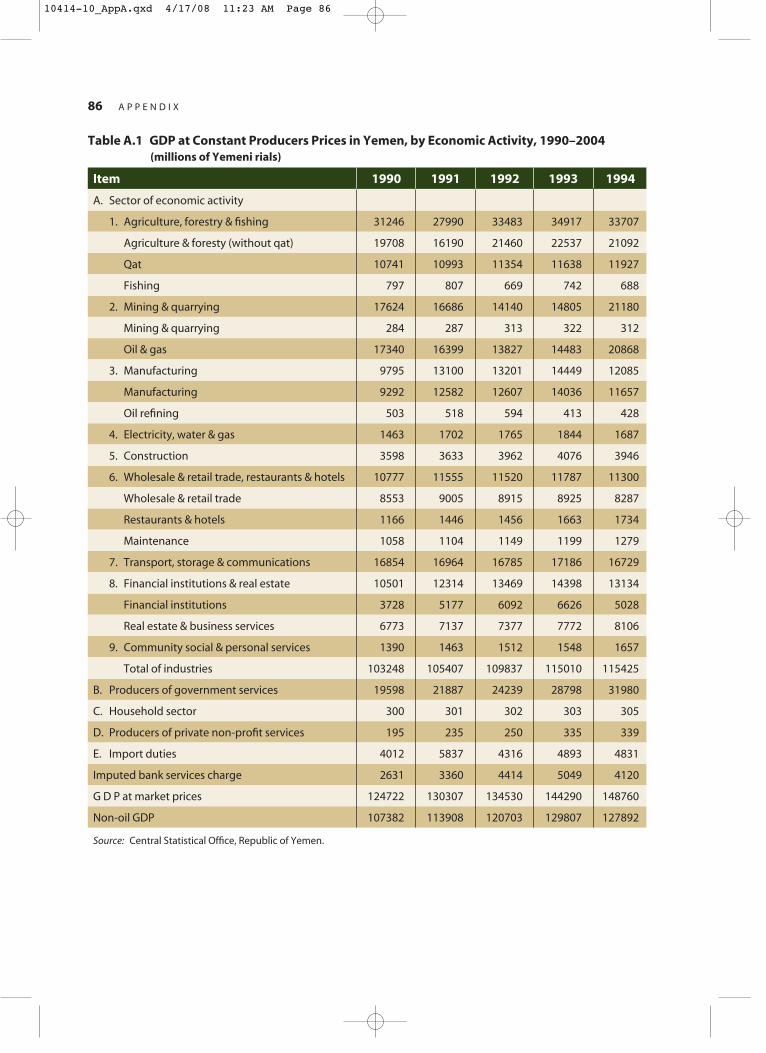
86 A P P E N D I X
Item 1990 1991 1992 1993 1994
A. Sector of economic activity
1. Agriculture, forestry & fishing 31246 27990 33483 34917 33707
Agriculture & foresty (without qat) 19708 16190 21460 22537 21092
Qat 10741 10993 11354 11638 11927
Fishing 797 807 669 742 688
2. Mining & quarrying 17624 16686 14140 14805 21180
Mining & quarrying 284 287 313 322 312
Oil & gas 17340 16399 13827 14483 20868
3. Manufacturing 9795 13100 13201 14449 12085
Manufacturing 9292 12582 12607 14036 11657
Oil refining 503 518 594 413 428
4. Electricity, water & gas 1463 1702 1765 1844 1687
5. Construction 3598 3633 3962 4076 3946
6. Wholesale & retail trade, restaurants & hotels 10777 11555 11520 11787 11300
Wholesale & retail trade 8553 9005 8915 8925 8287
Restaurants & hotels 1166 1446 1456 1663 1734
Maintenance 1058 1104 1149 1199 1279
7. Transport, storage & communications 16854 16964 16785 17186 16729
8. Financial institutions & real estate 10501 12314 13469 14398 13134
Financial institutions 3728 5177 6092 6626 5028
Real estate & business services 6773 7137 7377 7772 8106
9. Community social & personal services 1390 1463 1512 1548 1657
Total of industries 103248 105407 109837 115010 115425
B. Producers of government services 19598 21887 24239 28798 31980
C. Household sector 300 301 302 303 305
D. Producers of private non-profit services 195 235 250 335 339
E. Import duties 4012 5837 4316 4893 4831
Imputed bank services charge 2631 3360 4414 5049 4120
G D P at market prices 124722 130307 134530 144290 148760
Non-oil GDP 107382 113908 120703 129807 127892
Source: Central Statistical Office, Republic of Yemen.
Table A.1 GDP at Constant Producers Prices in Yemen, by Economic Activity, 1990–2004(millions of Yemeni rials)
10414-10_AppA.qxd 4/17/08 11:23 AM Page 86
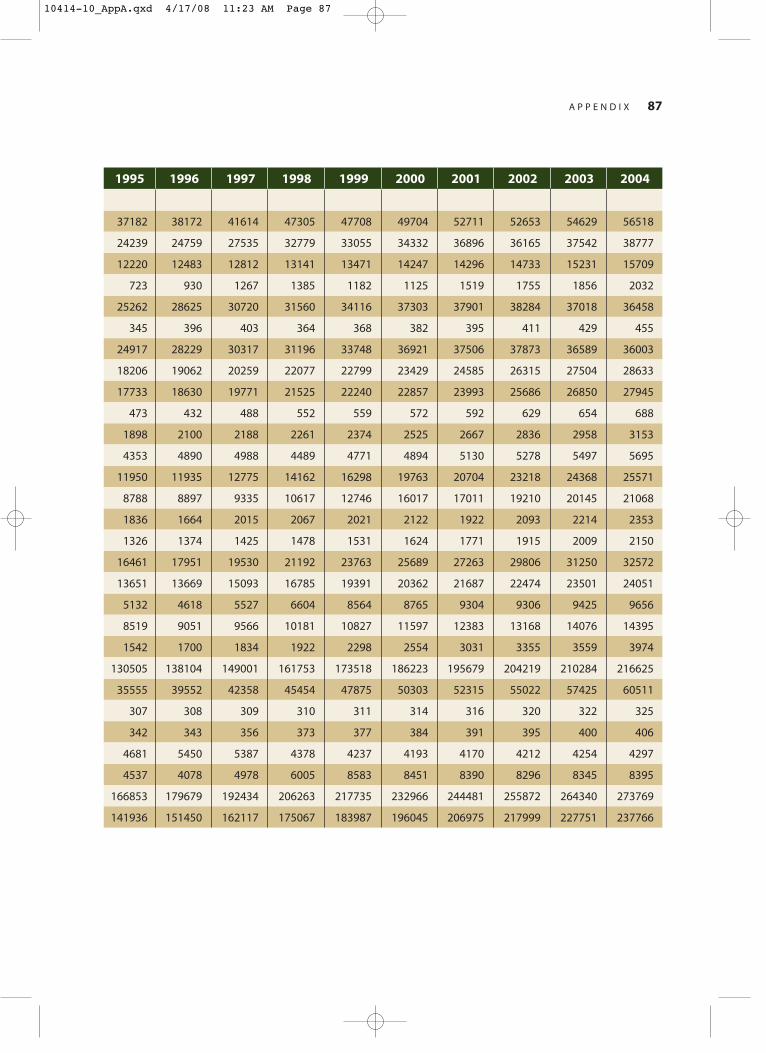
A P P E N D I X 87
1995 1996 1997 1998 1999 2000 2001 2002 2003 2004
37182 38172 41614 47305 47708 49704 52711 52653 54629 56518
24239 24759 27535 32779 33055 34332 36896 36165 37542 38777
12220 12483 12812 13141 13471 14247 14296 14733 15231 15709
723 930 1267 1385 1182 1125 1519 1755 1856 2032
25262 28625 30720 31560 34116 37303 37901 38284 37018 36458
345 396 403 364 368 382 395 411 429 455
24917 28229 30317 31196 33748 36921 37506 37873 36589 36003
18206 19062 20259 22077 22799 23429 24585 26315 27504 28633
17733 18630 19771 21525 22240 22857 23993 25686 26850 27945
473 432 488 552 559 572 592 629 654 688
1898 2100 2188 2261 2374 2525 2667 2836 2958 3153
4353 4890 4988 4489 4771 4894 5130 5278 5497 5695
11950 11935 12775 14162 16298 19763 20704 23218 24368 25571
8788 8897 9335 10617 12746 16017 17011 19210 20145 21068
1836 1664 2015 2067 2021 2122 1922 2093 2214 2353
1326 1374 1425 1478 1531 1624 1771 1915 2009 2150
16461 17951 19530 21192 23763 25689 27263 29806 31250 32572
13651 13669 15093 16785 19391 20362 21687 22474 23501 24051
5132 4618 5527 6604 8564 8765 9304 9306 9425 9656
8519 9051 9566 10181 10827 11597 12383 13168 14076 14395
1542 1700 1834 1922 2298 2554 3031 3355 3559 3974
130505 138104 149001 161753 173518 186223 195679 204219 210284 216625
35555 39552 42358 45454 47875 50303 52315 55022 57425 60511
307 308 309 310 311 314 316 320 322 325
342 343 356 373 377 384 391 395 400 406
4681 5450 5387 4378 4237 4193 4170 4212 4254 4297
4537 4078 4978 6005 8583 8451 8390 8296 8345 8395
166853 179679 192434 206263 217735 232966 244481 255872 264340 273769
141936 151450 162117 175067 183987 196045 206975 217999 227751 237766
10414-10_AppA.qxd 4/17/08 11:23 AM Page 87

88 A P P E N D I X
Item 1990 1991 1992 1993 1994
A. Sector of economic activity
1. Agriculture, forestry & fishing 31246 32206 44488 51205 69111
Agriculture & foresty (without qat) 19708 18566 28347 31595 41690
Qat 10741 12256 14240 17545 21607
Fishing 797 1384 1901 2065 5814
2. Mining & quarrying 17624 15369 13744 13180 18511
Mining & quarrying 284 310 441 609 858
Oil & gas 17340 15059 13303 12571 17653
3. Manufacturing 9795 13114 19005 26360 39798
Manufacturing 9292 12576 18461 25814 39300
Oil refining 503 538 544 546 498
4. Electricity, water & gas 1463 1914 1981 2095 2034
5. Construction 3598 5017 7634 8559 13139
6. Wholesale & retail trade, restaurants & hotels 10777 15820 20420 28633 40985
Wholesale & retail trade 8553 12334 15955 21683 30077
Restaurants & hotels 1166 2017 2650 4192 7007
Maintenance 1058 1469 1815 2758 3901
7. Transport, storage & communications 16854 20413 27193 37469 42505
8. Financial institutions & real estate 10501 15729 18933 23942 32608
Financial institutions 3728 6730 7122 9011 13868
Real estate & business services 6773 8999 11811 14931 18740
9. Community social & personal services 1390 1821 2179 3026 4141
Total of industries 103248 121403 155577 194469 262832
B. Producers of government services 19598 25170 32480 40893 48609
C. Household sector 300 310 320 340 360
D. Producers of private non-profit services 195 292 328 354 423
E. Import duties 4012 6012 6647 7535 7440
Imputed bank services charge 2631 4368 5160 6866 11364
G D P at market prices 124722 148819 190192 236725 308300
Non-oil GDP 107382 133760 176889 224154 290647
Source: Central Statistical Office, Republic of Yemen.
Table A.2 GDP at Current Producers Prices in Yemen, by Economic Activity, 1990–2004(millions of Yemeni rials)
10414-10_AppA.qxd 4/17/08 11:24 AM Page 88
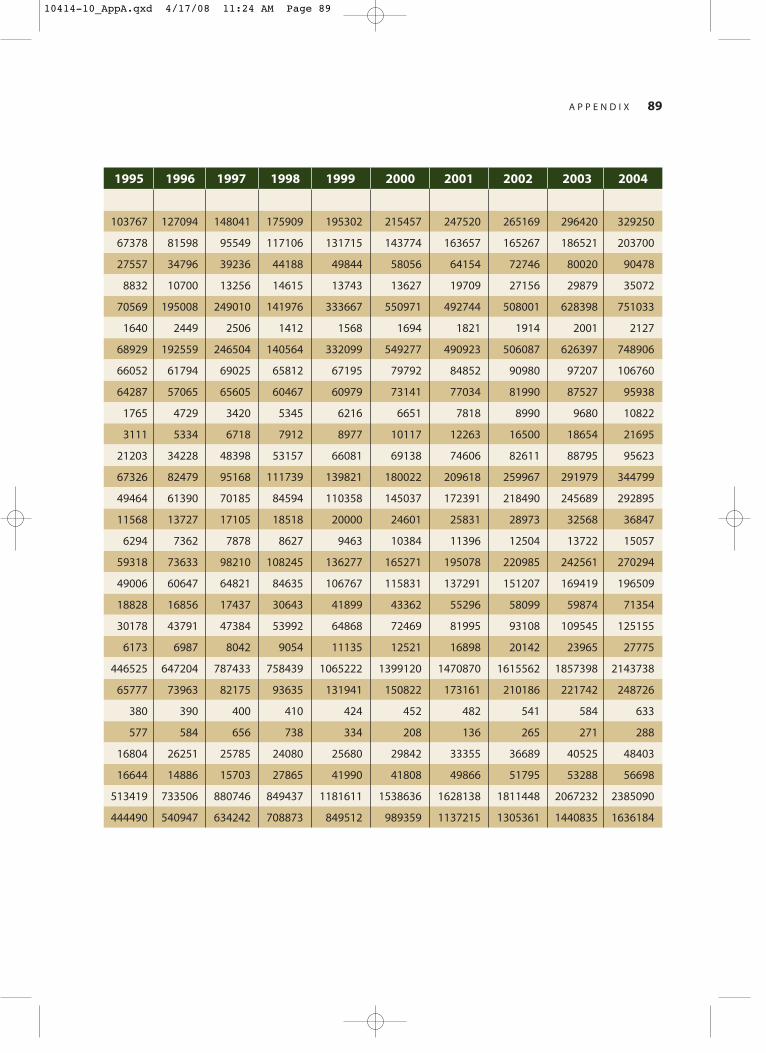
A P P E N D I X 89
1995 1996 1997 1998 1999 2000 2001 2002 2003 2004
103767 127094 148041 175909 195302 215457 247520 265169 296420 329250
67378 81598 95549 117106 131715 143774 163657 165267 186521 203700
27557 34796 39236 44188 49844 58056 64154 72746 80020 90478
8832 10700 13256 14615 13743 13627 19709 27156 29879 35072
70569 195008 249010 141976 333667 550971 492744 508001 628398 751033
1640 2449 2506 1412 1568 1694 1821 1914 2001 2127
68929 192559 246504 140564 332099 549277 490923 506087 626397 748906
66052 61794 69025 65812 67195 79792 84852 90980 97207 106760
64287 57065 65605 60467 60979 73141 77034 81990 87527 95938
1765 4729 3420 5345 6216 6651 7818 8990 9680 10822
3111 5334 6718 7912 8977 10117 12263 16500 18654 21695
21203 34228 48398 53157 66081 69138 74606 82611 88795 95623
67326 82479 95168 111739 139821 180022 209618 259967 291979 344799
49464 61390 70185 84594 110358 145037 172391 218490 245689 292895
11568 13727 17105 18518 20000 24601 25831 28973 32568 36847
6294 7362 7878 8627 9463 10384 11396 12504 13722 15057
59318 73633 98210 108245 136277 165271 195078 220985 242561 270294
49006 60647 64821 84635 106767 115831 137291 151207 169419 196509
18828 16856 17437 30643 41899 43362 55296 58099 59874 71354
30178 43791 47384 53992 64868 72469 81995 93108 109545 125155
6173 6987 8042 9054 11135 12521 16898 20142 23965 27775
446525 647204 787433 758439 1065222 1399120 1470870 1615562 1857398 2143738
65777 73963 82175 93635 131941 150822 173161 210186 221742 248726
380 390 400 410 424 452 482 541 584 633
577 584 656 738 334 208 136 265 271 288
16804 26251 25785 24080 25680 29842 33355 36689 40525 48403
16644 14886 15703 27865 41990 41808 49866 51795 53288 56698
513419 733506 880746 849437 1181611 1538636 1628138 1811448 2067232 2385090
444490 540947 634242 708873 849512 989359 1137215 1305361 1440835 1636184
10414-10_AppA.qxd 4/17/08 11:24 AM Page 89
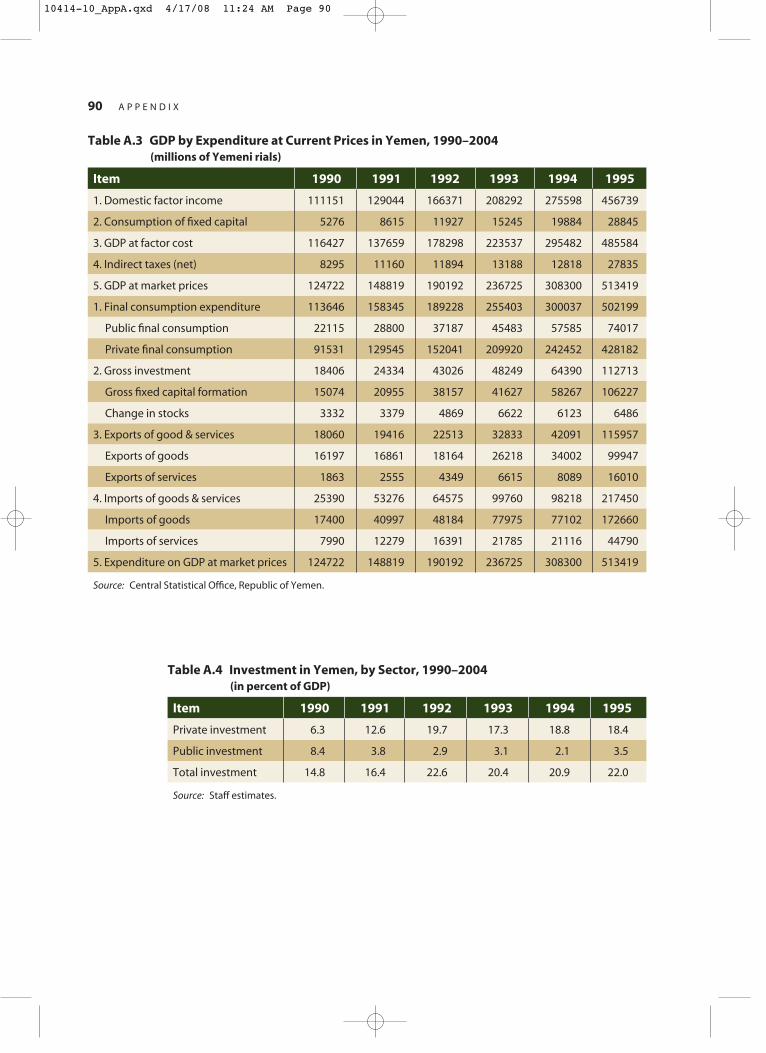
90 A P P E N D I X
Item 1990 1991 1992 1993 1994 1995
1. Domestic factor income 111151 129044 166371 208292 275598 456739
2. Consumption of fixed capital 5276 8615 11927 15245 19884 28845
3. GDP at factor cost 116427 137659 178298 223537 295482 485584
4. Indirect taxes (net) 8295 11160 11894 13188 12818 27835
5. GDP at market prices 124722 148819 190192 236725 308300 513419
1. Final consumption expenditure 113646 158345 189228 255403 300037 502199
Public final consumption 22115 28800 37187 45483 57585 74017
Private final consumption 91531 129545 152041 209920 242452 428182
2. Gross investment 18406 24334 43026 48249 64390 112713
Gross fixed capital formation 15074 20955 38157 41627 58267 106227
Change in stocks 3332 3379 4869 6622 6123 6486
3. Exports of good & services 18060 19416 22513 32833 42091 115957
Exports of goods 16197 16861 18164 26218 34002 99947
Exports of services 1863 2555 4349 6615 8089 16010
4. Imports of goods & services 25390 53276 64575 99760 98218 217450
Imports of goods 17400 40997 48184 77975 77102 172660
Imports of services 7990 12279 16391 21785 21116 44790
5. Expenditure on GDP at market prices 124722 148819 190192 236725 308300 513419
Source: Central Statistical Office, Republic of Yemen.
Table A.3 GDP by Expenditure at Current Prices in Yemen, 1990–2004(millions of Yemeni rials)
Item 1990 1991 1992 1993 1994 1995
Private investment 6.3 12.6 19.7 17.3 18.8 18.4
Public investment 8.4 3.8 2.9 3.1 2.1 3.5
Total investment 14.8 16.4 22.6 20.4 20.9 22.0
Source: Staff estimates.
Table A.4 Investment in Yemen, by Sector, 1990–2004(in percent of GDP)
10414-10_AppA.qxd 4/17/08 11:24 AM Page 90

A P P E N D I X 91
1996 1997 1998 1999 2000 2001 2002 2003 2004
683876 843105 772110 1062118 1474088 1530112 1691559 1974078 2148042
42080 57346 78691 97648 92917 98331 109997 129959 195752
725956 900451 850801 1159766 1567005 1628443 1801556 2104037 2343794
7550 –19705 –1364 21845 –28369 –305 9892 –36805 41296
733506 880746 849437 1181611 1538636 1628138 1811448 2067232 2385090
628835 737395 750099 930785 1141679 1306315 1448897 1643503 1768016
97458 116832 124473 175547 202955 237688 280497 332075 335127
531377 620563 625626 755238 938724 1068627 1168400 1311428 1432889
170879 221215 276465 278493 284568 308108 376462 456274 549498
158016 191666 267810 265371 256086 279377 361053 436733 527748
12863 29549 8655 13122 28482 28731 15409 19541 21750
285587 320822 228025 414527 645230 596005 695131 787195 930952
262407 293983 204327 385994 614336 567330 647339 719810 861828
23180 26839 23698 28533 30894 28675 47792 67385 69124
351795 398686 405152 442194 532841 582290 709042 819740 863376
285035 311112 311002 330263 401844 439189 541755 652556 687945
66760 87574 94150 111931 130997 143101 167287 167184 175431
733506 880746 849437 1181611 1538636 1628138 1811448 2067232 2385090
1996 1997 1998 1999 2000 2001 2002 2003 2004
15.6 17.6 24.7 16.8 11.2 11.8 11.8 11.7 10.5
7.7 7.5 7.9 6.7 7.3 7.1 9.0 10.4 12.5
23.3 25.1 32.5 23.6 18.5 18.9 20.8 22.1 23.0
10414-10_AppA.qxd 4/17/08 11:24 AM Page 91
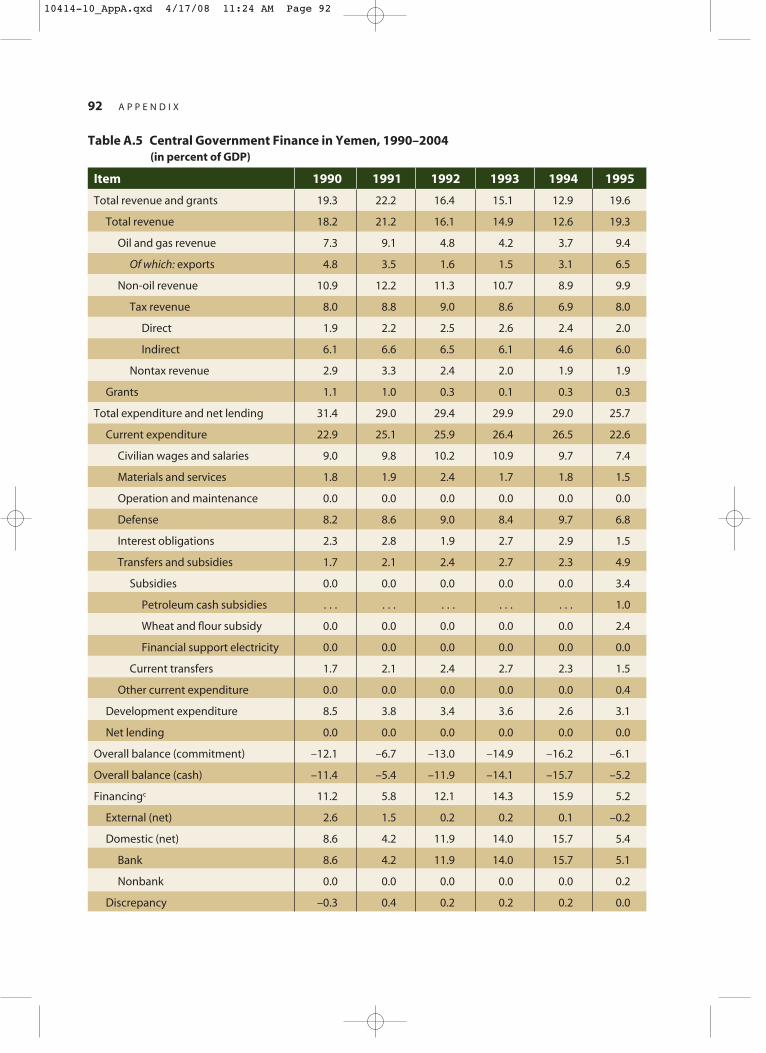
92 A P P E N D I X
Item 1990 1991 1992 1993 1994 1995
Total revenue and grants 19.3 22.2 16.4 15.1 12.9 19.6
Total revenue 18.2 21.2 16.1 14.9 12.6 19.3
Oil and gas revenue 7.3 9.1 4.8 4.2 3.7 9.4
Of which: exports 4.8 3.5 1.6 1.5 3.1 6.5
Non-oil revenue 10.9 12.2 11.3 10.7 8.9 9.9
Tax revenue 8.0 8.8 9.0 8.6 6.9 8.0
Direct 1.9 2.2 2.5 2.6 2.4 2.0
Indirect 6.1 6.6 6.5 6.1 4.6 6.0
Nontax revenue 2.9 3.3 2.4 2.0 1.9 1.9
Grants 1.1 1.0 0.3 0.1 0.3 0.3
Total expenditure and net lending 31.4 29.0 29.4 29.9 29.0 25.7
Current expenditure 22.9 25.1 25.9 26.4 26.5 22.6
Civilian wages and salaries 9.0 9.8 10.2 10.9 9.7 7.4
Materials and services 1.8 1.9 2.4 1.7 1.8 1.5
Operation and maintenance 0.0 0.0 0.0 0.0 0.0 0.0
Defense 8.2 8.6 9.0 8.4 9.7 6.8
Interest obligations 2.3 2.8 1.9 2.7 2.9 1.5
Transfers and subsidies 1.7 2.1 2.4 2.7 2.3 4.9
Subsidies 0.0 0.0 0.0 0.0 0.0 3.4
Petroleum cash subsidies . . . . . . . . . . . . . . . 1.0
Wheat and flour subsidy 0.0 0.0 0.0 0.0 0.0 2.4
Financial support electricity 0.0 0.0 0.0 0.0 0.0 0.0
Current transfers 1.7 2.1 2.4 2.7 2.3 1.5
Other current expenditure 0.0 0.0 0.0 0.0 0.0 0.4
Development expenditure 8.5 3.8 3.4 3.6 2.6 3.1
Net lending 0.0 0.0 0.0 0.0 0.0 0.0
Overall balance (commitment) –12.1 –6.7 –13.0 –14.9 –16.2 –6.1
Overall balance (cash) –11.4 –5.4 –11.9 –14.1 –15.7 –5.2
Financingc 11.2 5.8 12.1 14.3 15.9 5.2
External (net) 2.6 1.5 0.2 0.2 0.1 –0.2
Domestic (net) 8.6 4.2 11.9 14.0 15.7 5.4
Bank 8.6 4.2 11.9 14.0 15.7 5.1
Nonbank 0.0 0.0 0.0 0.0 0.0 0.2
Discrepancy –0.3 0.4 0.2 0.2 0.2 0.0
Table A.5 Central Government Finance in Yemen, 1990–2004(in percent of GDP)
10414-10_AppA.qxd 4/17/08 11:24 AM Page 92
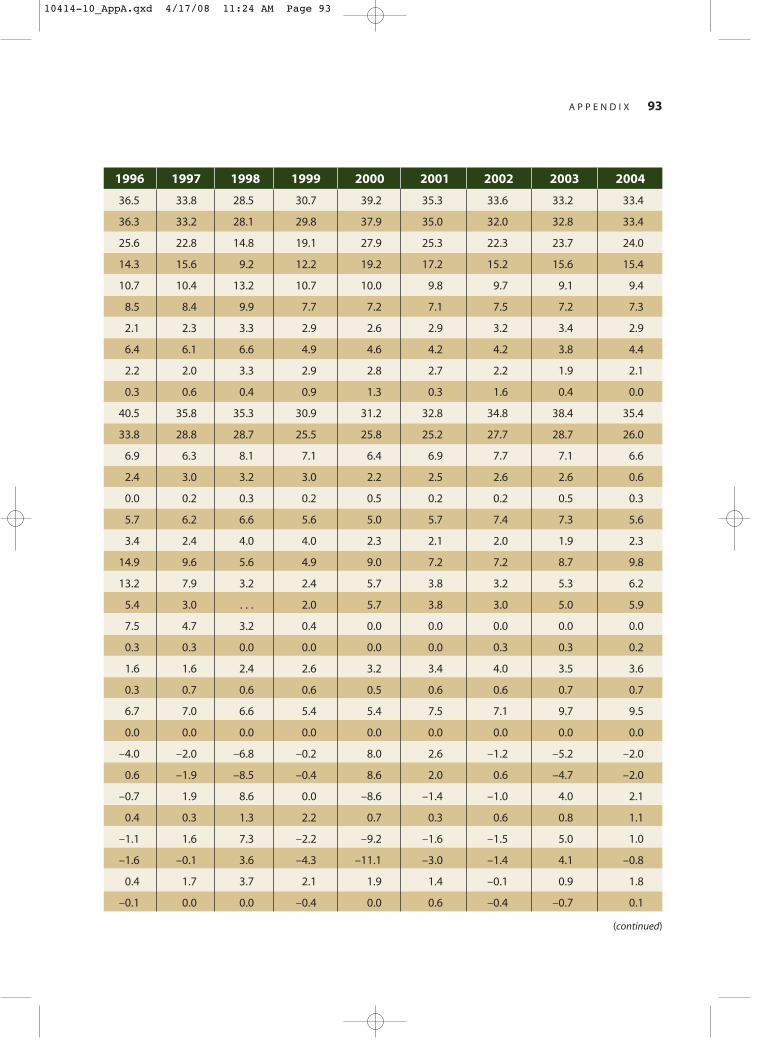
A P P E N D I X 93
1996 1997 1998 1999 2000 2001 2002 2003 2004
36.5 33.8 28.5 30.7 39.2 35.3 33.6 33.2 33.4
36.3 33.2 28.1 29.8 37.9 35.0 32.0 32.8 33.4
25.6 22.8 14.8 19.1 27.9 25.3 22.3 23.7 24.0
14.3 15.6 9.2 12.2 19.2 17.2 15.2 15.6 15.4
10.7 10.4 13.2 10.7 10.0 9.8 9.7 9.1 9.4
8.5 8.4 9.9 7.7 7.2 7.1 7.5 7.2 7.3
2.1 2.3 3.3 2.9 2.6 2.9 3.2 3.4 2.9
6.4 6.1 6.6 4.9 4.6 4.2 4.2 3.8 4.4
2.2 2.0 3.3 2.9 2.8 2.7 2.2 1.9 2.1
0.3 0.6 0.4 0.9 1.3 0.3 1.6 0.4 0.0
40.5 35.8 35.3 30.9 31.2 32.8 34.8 38.4 35.4
33.8 28.8 28.7 25.5 25.8 25.2 27.7 28.7 26.0
6.9 6.3 8.1 7.1 6.4 6.9 7.7 7.1 6.6
2.4 3.0 3.2 3.0 2.2 2.5 2.6 2.6 0.6
0.0 0.2 0.3 0.2 0.5 0.2 0.2 0.5 0.3
5.7 6.2 6.6 5.6 5.0 5.7 7.4 7.3 5.6
3.4 2.4 4.0 4.0 2.3 2.1 2.0 1.9 2.3
14.9 9.6 5.6 4.9 9.0 7.2 7.2 8.7 9.8
13.2 7.9 3.2 2.4 5.7 3.8 3.2 5.3 6.2
5.4 3.0 . . . 2.0 5.7 3.8 3.0 5.0 5.9
7.5 4.7 3.2 0.4 0.0 0.0 0.0 0.0 0.0
0.3 0.3 0.0 0.0 0.0 0.0 0.3 0.3 0.2
1.6 1.6 2.4 2.6 3.2 3.4 4.0 3.5 3.6
0.3 0.7 0.6 0.6 0.5 0.6 0.6 0.7 0.7
6.7 7.0 6.6 5.4 5.4 7.5 7.1 9.7 9.5
0.0 0.0 0.0 0.0 0.0 0.0 0.0 0.0 0.0
–4.0 –2.0 –6.8 –0.2 8.0 2.6 –1.2 –5.2 –2.0
0.6 –1.9 –8.5 –0.4 8.6 2.0 0.6 –4.7 –2.0
–0.7 1.9 8.6 0.0 –8.6 –1.4 –1.0 4.0 2.1
0.4 0.3 1.3 2.2 0.7 0.3 0.6 0.8 1.1
–1.1 1.6 7.3 –2.2 –9.2 –1.6 –1.5 5.0 1.0
–1.6 –0.1 3.6 –4.3 –11.1 –3.0 –1.4 4.1 –0.8
0.4 1.7 3.7 2.1 1.9 1.4 –0.1 0.9 1.8
–0.1 0.0 0.0 –0.4 0.0 0.6 –0.4 –0.7 0.1
(continued)
10414-10_AppA.qxd 4/17/08 11:24 AM Page 93
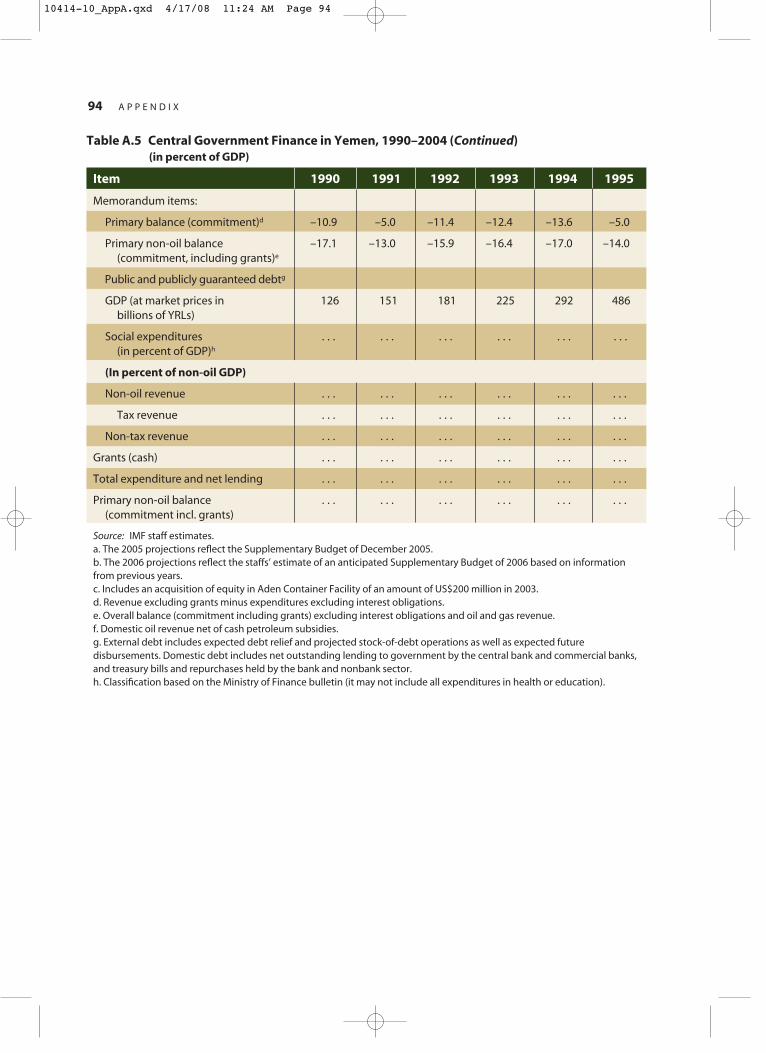
94 A P P E N D I X
Item 1990 1991 1992 1993 1994 1995
Memorandum items:
Primary balance (commitment)d –10.9 –5.0 –11.4 –12.4 –13.6 –5.0
Primary non-oil balance –17.1 –13.0 –15.9 –16.4 –17.0 –14.0(commitment, including grants)e
Public and publicly guaranteed debtg
GDP (at market prices in 126 151 181 225 292 486billions of YRLs)
Social expenditures . . . . . . . . . . . . . . . . . .(in percent of GDP)h
(In percent of non-oil GDP)
Non-oil revenue . . . . . . . . . . . . . . . . . .
Tax revenue . . . . . . . . . . . . . . . . . .
Non-tax revenue . . . . . . . . . . . . . . . . . .
Grants (cash) . . . . . . . . . . . . . . . . . .
Total expenditure and net lending . . . . . . . . . . . . . . . . . .
Primary non-oil balance . . . . . . . . . . . . . . . . . .(commitment incl. grants)
Source: IMF staff estimates.a. The 2005 projections reflect the Supplementary Budget of December 2005.b. The 2006 projections reflect the staffs’ estimate of an anticipated Supplementary Budget of 2006 based on information from previous years.c. Includes an acquisition of equity in Aden Container Facility of an amount of US$200 million in 2003.d. Revenue excluding grants minus expenditures excluding interest obligations.e. Overall balance (commitment including grants) excluding interest obligations and oil and gas revenue.f. Domestic oil revenue net of cash petroleum subsidies.g. External debt includes expected debt relief and projected stock-of-debt operations as well as expected future disbursements. Domestic debt includes net outstanding lending to government by the central bank and commercial banks, and treasury bills and repurchases held by the bank and nonbank sector.h. Classification based on the Ministry of Finance bulletin (it may not include all expenditures in health or education).
Table A.5 Central Government Finance in Yemen, 1990–2004 (Continued)(in percent of GDP)
10414-10_AppA.qxd 4/17/08 11:24 AM Page 94

A P P E N D I X 95
1996 1997 1998 1999 2000 2001 2002 2003 2004
–0.9 –0.1 –3.3 2.8 9.0 4.4 –0.8 –3.7 0.3
–26.2 –22.4 –17.7 –15.4 –17.6 –20.5 –21.5 –27.0 –23.7
129.2 102.9 58.8 57.8 52.8 56.2 44.7
690 826 794 1,102 1,539 1,608 1,754 2,027 2,409
4.7 6.0 9.5 8.9 7.8 8.5 9.5 9.2 5.2
. . . . . . 14.8 14.0 15.7 14.2 13.8 12.9 13.6
. . . . . . 11.2 10.1 11.3 10.3 10.6 10.1 10.5
. . . . . . 3.7 3.8 4.4 3.9 3.1 2.7 3.0
. . . . . . 0.5 1.2 2.0 0.5 2.3 0.6 0.0
. . . . . . 39.6 40.4 49.0 47.7 49.4 54.3 51.1
. . . . . . –19.9 –20.1 –27.7 –29.9 –30.6 –38.2 –34.2
10414-10_AppA.qxd 4/17/08 11:24 AM Page 95
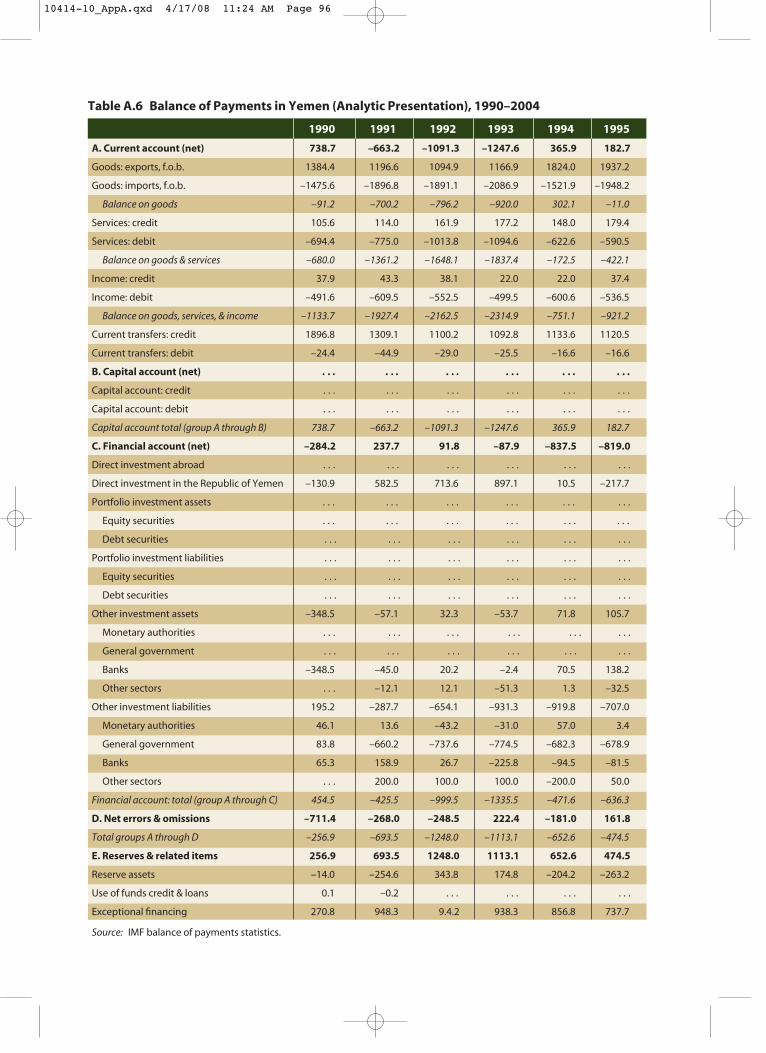
1990 1991 1992 1993 1994 1995
A. Current account (net) 738.7 –663.2 –1091.3 –1247.6 365.9 182.7
Goods: exports, f.o.b. 1384.4 1196.6 1094.9 1166.9 1824.0 1937.2
Goods: imports, f.o.b. –1475.6 –1896.8 –1891.1 –2086.9 –1521.9 –1948.2
Balance on goods –91.2 –700.2 –796.2 –920.0 302.1 –11.0
Services: credit 105.6 114.0 161.9 177.2 148.0 179.4
Services: debit –694.4 –775.0 –1013.8 –1094.6 –622.6 –590.5
Balance on goods & services –680.0 –1361.2 –1648.1 –1837.4 –172.5 –422.1
Income: credit 37.9 43.3 38.1 22.0 22.0 37.4
Income: debit –491.6 –609.5 –552.5 –499.5 –600.6 –536.5
Balance on goods, services, & income –1133.7 –1927.4 –2162.5 –2314.9 –751.1 –921.2
Current transfers: credit 1896.8 1309.1 1100.2 1092.8 1133.6 1120.5
Current transfers: debit –24.4 –44.9 –29.0 –25.5 –16.6 –16.6
B. Capital account (net) . . . . . . . . . . . . . . . . . .
Capital account: credit . . . . . . . . . . . . . . . . . .
Capital account: debit . . . . . . . . . . . . . . . . . .
Capital account total (group A through B) 738.7 –663.2 –1091.3 –1247.6 365.9 182.7
C. Financial account (net) –284.2 237.7 91.8 –87.9 –837.5 –819.0
Direct investment abroad . . . . . . . . . . . . . . . . . .
Direct investment in the Republic of Yemen –130.9 582.5 713.6 897.1 10.5 –217.7
Portfolio investment assets . . . . . . . . . . . . . . . . . .
Equity securities . . . . . . . . . . . . . . . . . .
Debt securities . . . . . . . . . . . . . . . . . .
Portfolio investment liabilities . . . . . . . . . . . . . . . . . .
Equity securities . . . . . . . . . . . . . . . . . .
Debt securities . . . . . . . . . . . . . . . . . .
Other investment assets –348.5 –57.1 32.3 –53.7 71.8 105.7
Monetary authorities . . . . . . . . . . . . . . . . . .
General government . . . . . . . . . . . . . . . . . .
Banks –348.5 –45.0 20.2 –2.4 70.5 138.2
Other sectors . . . –12.1 12.1 –51.3 1.3 –32.5
Other investment liabilities 195.2 –287.7 –654.1 –931.3 –919.8 –707.0
Monetary authorities 46.1 13.6 –43.2 –31.0 57.0 3.4
General government 83.8 –660.2 –737.6 –774.5 –682.3 –678.9
Banks 65.3 158.9 26.7 –225.8 –94.5 –81.5
Other sectors . . . 200.0 100.0 100.0 –200.0 50.0
Financial account: total (group A through C) 454.5 –425.5 –999.5 –1335.5 –471.6 –636.3
D. Net errors & omissions –711.4 –268.0 –248.5 222.4 –181.0 161.8
Total groups A through D –256.9 –693.5 –1248.0 –1113.1 –652.6 –474.5
E. Reserves & related items 256.9 693.5 1248.0 1113.1 652.6 474.5
Reserve assets –14.0 –254.6 343.8 174.8 –204.2 –263.2
Use of funds credit & loans 0.1 –0.2 . . . . . . . . . . . .
Exceptional financing 270.8 948.3 9.4.2 938.3 856.8 737.7
Source: IMF balance of payments statistics.
Table A.6 Balance of Payments in Yemen (Analytic Presentation), 1990–2004
10414-10_AppA.qxd 4/17/08 11:24 AM Page 96
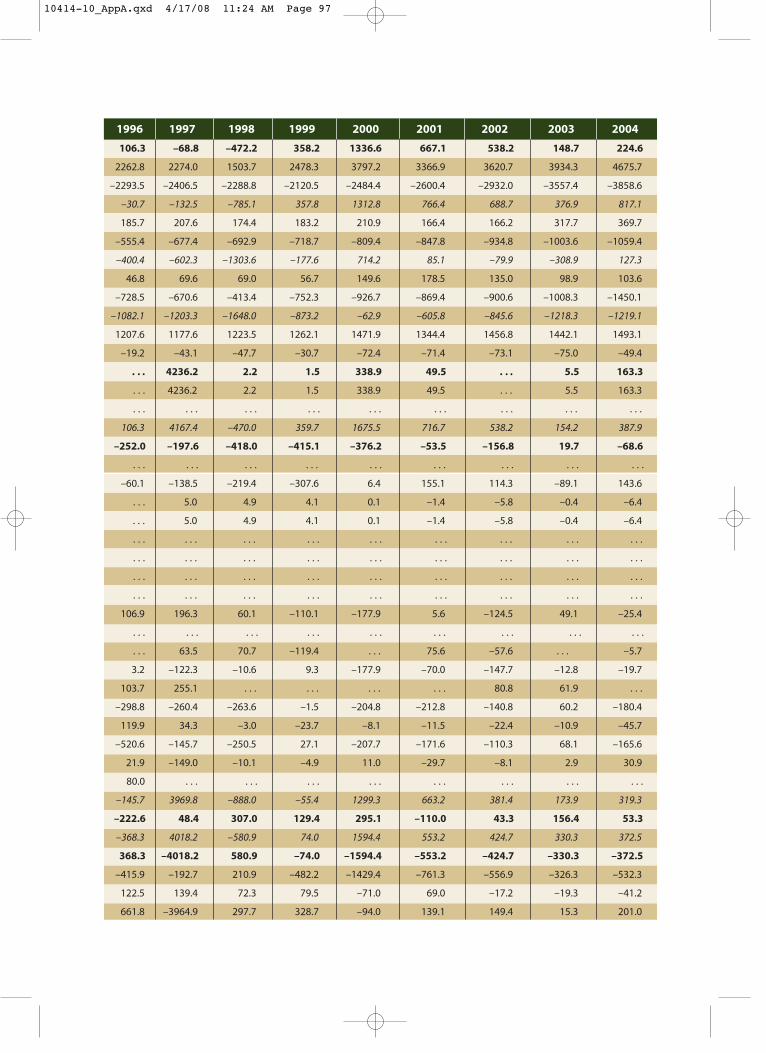
1996 1997 1998 1999 2000 2001 2002 2003 2004
106.3 –68.8 –472.2 358.2 1336.6 667.1 538.2 148.7 224.6
2262.8 2274.0 1503.7 2478.3 3797.2 3366.9 3620.7 3934.3 4675.7
–2293.5 –2406.5 –2288.8 –2120.5 –2484.4 –2600.4 –2932.0 –3557.4 –3858.6
–30.7 –132.5 –785.1 357.8 1312.8 766.4 688.7 376.9 817.1
185.7 207.6 174.4 183.2 210.9 166.4 166.2 317.7 369.7
–555.4 –677.4 –692.9 –718.7 –809.4 –847.8 –934.8 –1003.6 –1059.4
–400.4 –602.3 –1303.6 –177.6 714.2 85.1 –79.9 –308.9 127.3
46.8 69.6 69.0 56.7 149.6 178.5 135.0 98.9 103.6
–728.5 –670.6 –413.4 –752.3 –926.7 –869.4 –900.6 –1008.3 –1450.1
–1082.1 –1203.3 –1648.0 –873.2 –62.9 –605.8 –845.6 –1218.3 –1219.1
1207.6 1177.6 1223.5 1262.1 1471.9 1344.4 1456.8 1442.1 1493.1
–19.2 –43.1 –47.7 –30.7 –72.4 –71.4 –73.1 –75.0 –49.4
. . . 4236.2 2.2 1.5 338.9 49.5 . . . 5.5 163.3
. . . 4236.2 2.2 1.5 338.9 49.5 . . . 5.5 163.3
. . . . . . . . . . . . . . . . . . . . . . . . . . .
106.3 4167.4 –470.0 359.7 1675.5 716.7 538.2 154.2 387.9
–252.0 –197.6 –418.0 –415.1 –376.2 –53.5 –156.8 19.7 –68.6
. . . . . . . . . . . . . . . . . . . . . . . . . . .
–60.1 –138.5 –219.4 –307.6 6.4 155.1 114.3 –89.1 143.6
. . . 5.0 4.9 4.1 0.1 –1.4 –5.8 –0.4 –6.4
. . . 5.0 4.9 4.1 0.1 –1.4 –5.8 –0.4 –6.4
. . . . . . . . . . . . . . . . . . . . . . . . . . .
. . . . . . . . . . . . . . . . . . . . . . . . . . .
. . . . . . . . . . . . . . . . . . . . . . . . . . .
. . . . . . . . . . . . . . . . . . . . . . . . . . .
106.9 196.3 60.1 –110.1 –177.9 5.6 –124.5 49.1 –25.4
. . . . . . . . . . . . . . . . . . . . . . . . . . .
. . . 63.5 70.7 –119.4 . . . 75.6 –57.6 . . . –5.7
3.2 –122.3 –10.6 9.3 –177.9 –70.0 –147.7 –12.8 –19.7
103.7 255.1 . . . . . . . . . . . . 80.8 61.9 . . .
–298.8 –260.4 –263.6 –1.5 –204.8 –212.8 –140.8 60.2 –180.4
119.9 34.3 –3.0 –23.7 –8.1 –11.5 –22.4 –10.9 –45.7
–520.6 –145.7 –250.5 27.1 –207.7 –171.6 –110.3 68.1 –165.6
21.9 –149.0 –10.1 –4.9 11.0 –29.7 –8.1 2.9 30.9
80.0 . . . . . . . . . . . . . . . . . . . . . . . .
–145.7 3969.8 –888.0 –55.4 1299.3 663.2 381.4 173.9 319.3
–222.6 48.4 307.0 129.4 295.1 –110.0 43.3 156.4 53.3
–368.3 4018.2 –580.9 74.0 1594.4 553.2 424.7 330.3 372.5
368.3 –4018.2 580.9 –74.0 –1594.4 –553.2 –424.7 –330.3 –372.5
–415.9 –192.7 210.9 –482.2 –1429.4 –761.3 –556.9 –326.3 –532.3
122.5 139.4 72.3 79.5 –71.0 69.0 –17.2 –19.3 –41.2
661.8 –3964.9 297.7 328.7 –94.0 139.1 149.4 15.3 201.0
10414-10_AppA.qxd 4/17/08 11:24 AM Page 97
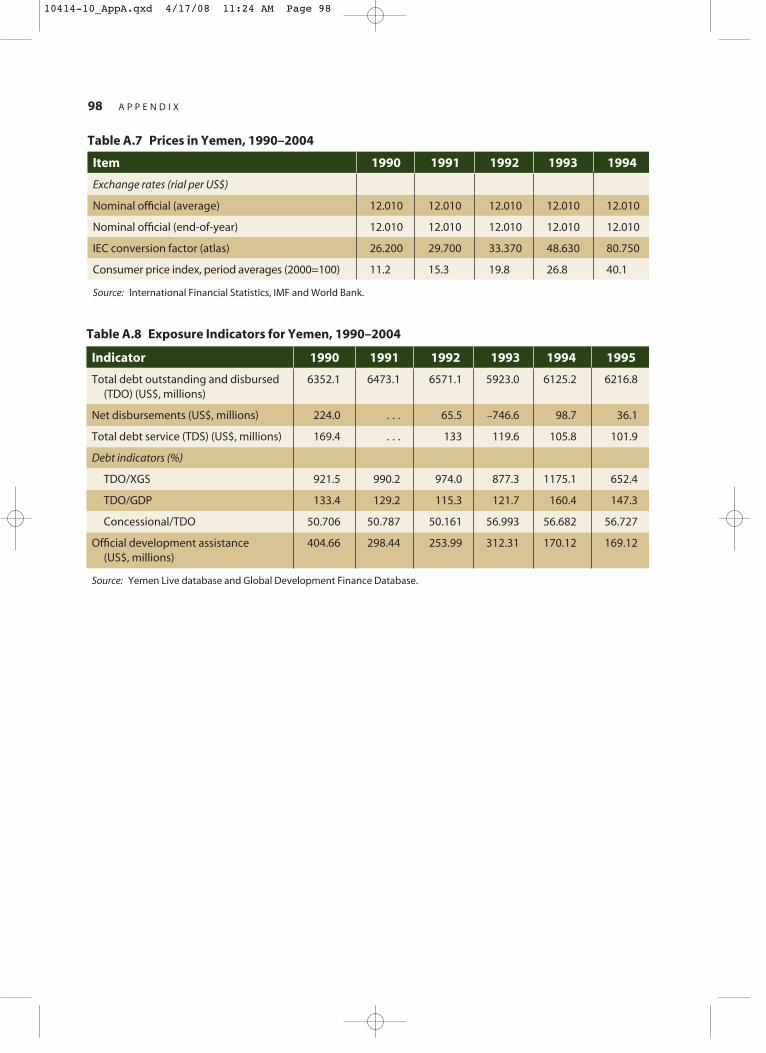
98 A P P E N D I X
Item 1990 1991 1992 1993 1994
Exchange rates (rial per US$)
Nominal official (average) 12.010 12.010 12.010 12.010 12.010
Nominal official (end-of-year) 12.010 12.010 12.010 12.010 12.010
IEC conversion factor (atlas) 26.200 29.700 33.370 48.630 80.750
Consumer price index, period averages (2000=100) 11.2 15.3 19.8 26.8 40.1
Source: International Financial Statistics, IMF and World Bank.
Table A.7 Prices in Yemen, 1990–2004
Indicator 1990 1991 1992 1993 1994 1995
Total debt outstanding and disbursed 6352.1 6473.1 6571.1 5923.0 6125.2 6216.8(TDO) (US$, millions)
Net disbursements (US$, millions) 224.0 . . . 65.5 –746.6 98.7 36.1
Total debt service (TDS) (US$, millions) 169.4 . . . 133 119.6 105.8 101.9
Debt indicators (%)
TDO/XGS 921.5 990.2 974.0 877.3 1175.1 652.4
TDO/GDP 133.4 129.2 115.3 121.7 160.4 147.3
Concessional/TDO 50.706 50.787 50.161 56.993 56.682 56.727
Official development assistance 404.66 298.44 253.99 312.31 170.12 169.12(US$, millions)
Source: Yemen Live database and Global Development Finance Database.
Table A.8 Exposure Indicators for Yemen, 1990–2004
10414-10_AppA.qxd 4/17/08 11:24 AM Page 98
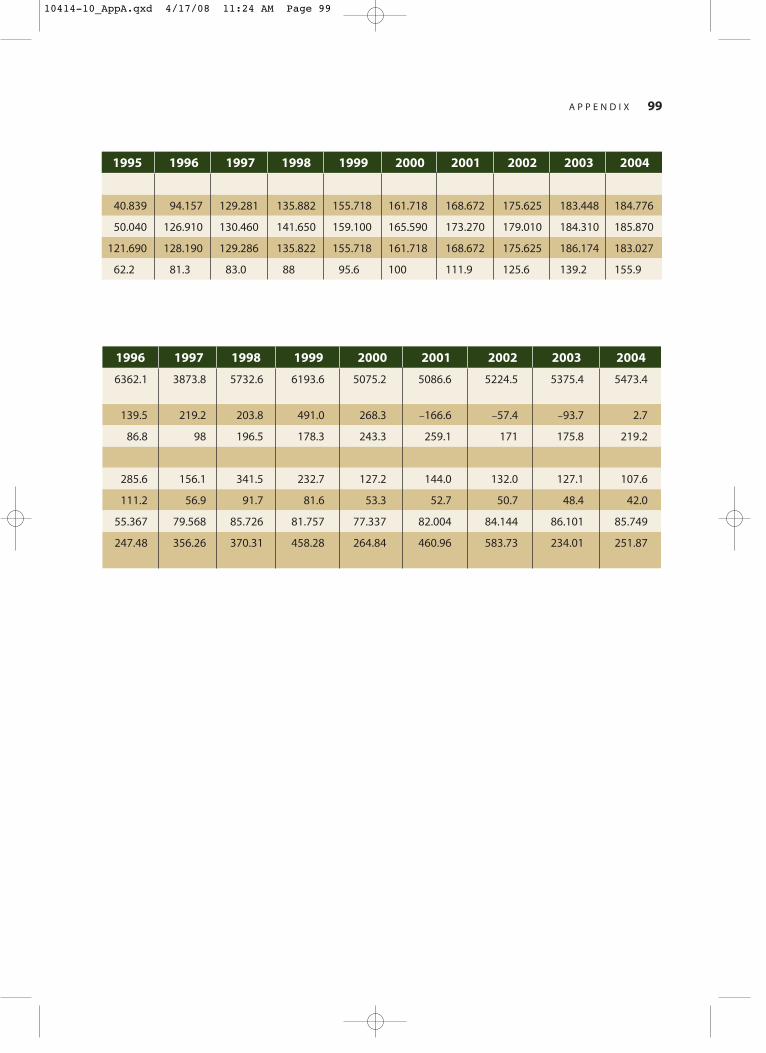
A P P E N D I X 99
1995 1996 1997 1998 1999 2000 2001 2002 2003 2004
40.839 94.157 129.281 135.882 155.718 161.718 168.672 175.625 183.448 184.776
50.040 126.910 130.460 141.650 159.100 165.590 173.270 179.010 184.310 185.870
121.690 128.190 129.286 135.822 155.718 161.718 168.672 175.625 186.174 183.027
62.2 81.3 83.0 88 95.6 100 111.9 125.6 139.2 155.9
1996 1997 1998 1999 2000 2001 2002 2003 2004
6362.1 3873.8 5732.6 6193.6 5075.2 5086.6 5224.5 5375.4 5473.4
139.5 219.2 203.8 491.0 268.3 –166.6 –57.4 –93.7 2.7
86.8 98 196.5 178.3 243.3 259.1 171 175.8 219.2
285.6 156.1 341.5 232.7 127.2 144.0 132.0 127.1 107.6
111.2 56.9 91.7 81.6 53.3 52.7 50.7 48.4 42.0
55.367 79.568 85.726 81.757 77.337 82.004 84.144 86.101 85.749
247.48 356.26 370.31 458.28 264.84 460.96 583.73 234.01 251.87
10414-10_AppA.qxd 4/17/08 11:24 AM Page 99
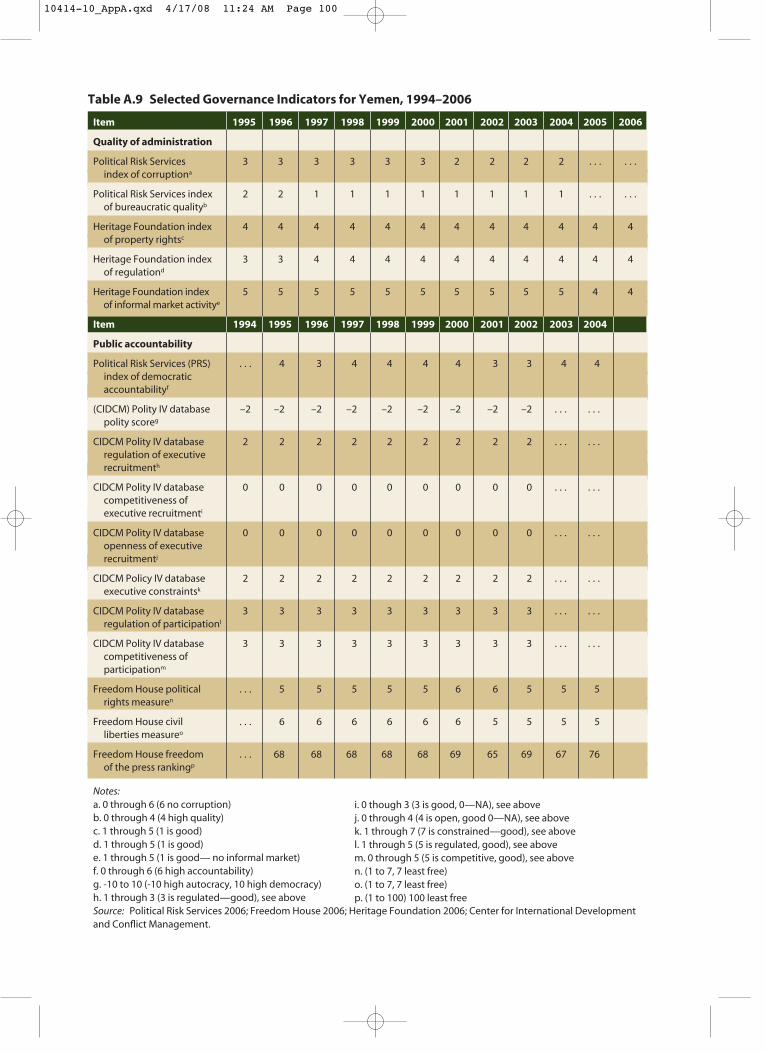
Table A.9 Selected Governance Indicators for Yemen, 1994–2006
Item 1995 1996 1997 1998 1999 2000 2001 2002 2003 2004 2005 2006
Quality of administration
Political Risk Services 3 3 3 3 3 3 2 2 2 2 . . . . . .index of corruptiona
Political Risk Services index 2 2 1 1 1 1 1 1 1 1 . . . . . .of bureaucratic qualityb
Heritage Foundation index 4 4 4 4 4 4 4 4 4 4 4 4of property rightsc
Heritage Foundation index 3 3 4 4 4 4 4 4 4 4 4 4of regulationd
Heritage Foundation index 5 5 5 5 5 5 5 5 5 5 4 4of informal market activitye
Item 1994 1995 1996 1997 1998 1999 2000 2001 2002 2003 2004
Public accountability
Political Risk Services (PRS) . . . 4 3 4 4 4 4 3 3 4 4index of democratic accountabilityf
(CIDCM) Polity IV database –2 –2 –2 –2 –2 –2 –2 –2 –2 . . . . . .polity scoreg
CIDCM Polity IV database 2 2 2 2 2 2 2 2 2 . . . . . .regulation of executive recruitmenth
CIDCM Polity IV database 0 0 0 0 0 0 0 0 0 . . . . . .competitiveness of executive recruitmenti
CIDCM Polity IV database 0 0 0 0 0 0 0 0 0 . . . . . .openness of executive recruitmentj
CIDCM Policy IV database 2 2 2 2 2 2 2 2 2 . . . . . .executive constraintsk
CIDCM Polity IV database 3 3 3 3 3 3 3 3 3 . . . . . .regulation of participationl
CIDCM Polity IV database 3 3 3 3 3 3 3 3 3 . . . . . .competitiveness of participationm
Freedom House political . . . 5 5 5 5 5 6 6 5 5 5rights measuren
Freedom House civil . . . 6 6 6 6 6 6 5 5 5 5liberties measureo
Freedom House freedom . . . 68 68 68 68 68 69 65 69 67 76of the press rankingp
Notes:a. 0 through 6 (6 no corruption)b. 0 through 4 (4 high quality)c. 1 through 5 (1 is good)d. 1 through 5 (1 is good)e. 1 through 5 (1 is good— no informal market)f. 0 through 6 (6 high accountability)g. -10 to 10 (-10 high autocracy, 10 high democracy)h. 1 through 3 (3 is regulated—good), see aboveSource: Political Risk Services 2006; Freedom House 2006; Heritage Foundation 2006; Center for International Developmentand Conflict Management.
i. 0 though 3 (3 is good, 0—NA), see abovej. 0 through 4 (4 is open, good 0—NA), see abovek. 1 through 7 (7 is constrained—good), see abovel. 1 through 5 (5 is regulated, good), see abovem. 0 through 5 (5 is competitive, good), see aboven. (1 to 7, 7 least free)o. (1 to 7, 7 least free)p. (1 to 100) 100 least free
10414-10_AppA.qxd 4/17/08 11:24 AM Page 100
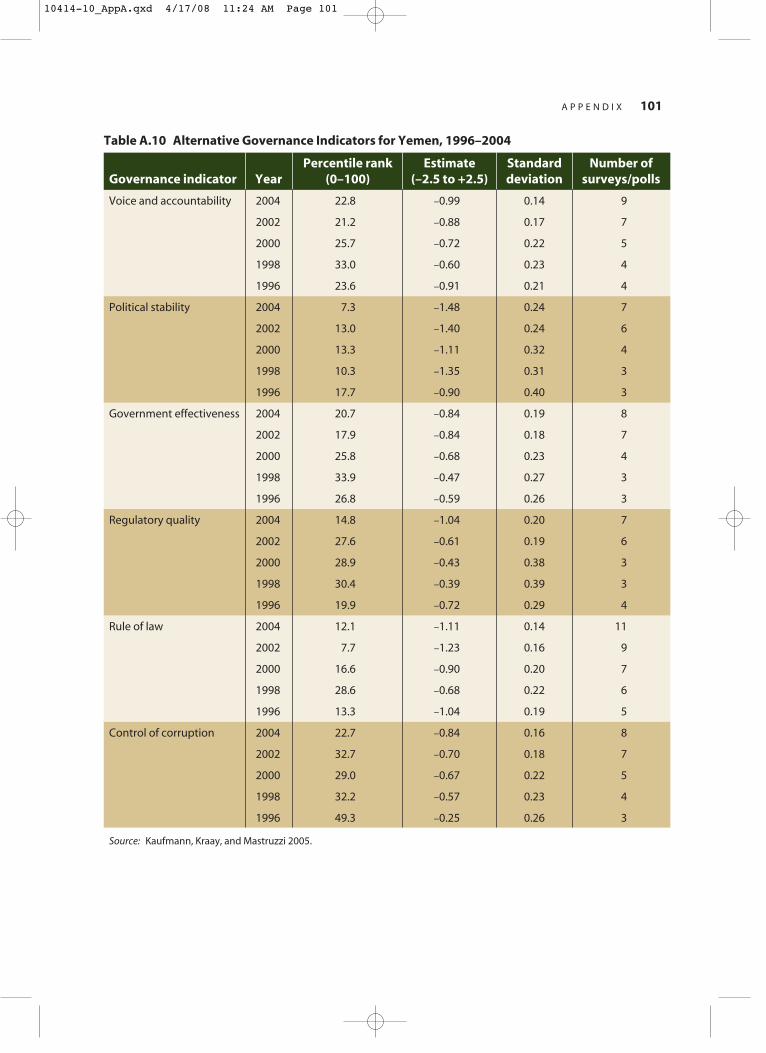
A P P E N D I X 101
Table A.10 Alternative Governance Indicators for Yemen, 1996–2004
Percentile rank Estimate Standard Number of Governance indicator Year (0–100) (–2.5 to +2.5) deviation surveys/polls
Voice and accountability 2004 22.8 –0.99 0.14 9
2002 21.2 –0.88 0.17 7
2000 25.7 –0.72 0.22 5
1998 33.0 –0.60 0.23 4
1996 23.6 –0.91 0.21 4
Political stability 2004 7.3 –1.48 0.24 7
2002 13.0 –1.40 0.24 6
2000 13.3 –1.11 0.32 4
1998 10.3 –1.35 0.31 3
1996 17.7 –0.90 0.40 3
Government effectiveness 2004 20.7 –0.84 0.19 8
2002 17.9 –0.84 0.18 7
2000 25.8 –0.68 0.23 4
1998 33.9 –0.47 0.27 3
1996 26.8 –0.59 0.26 3
Regulatory quality 2004 14.8 –1.04 0.20 7
2002 27.6 –0.61 0.19 6
2000 28.9 –0.43 0.38 3
1998 30.4 –0.39 0.39 3
1996 19.9 –0.72 0.29 4
Rule of law 2004 12.1 –1.11 0.14 11
2002 7.7 –1.23 0.16 9
2000 16.6 –0.90 0.20 7
1998 28.6 –0.68 0.22 6
1996 13.3 –1.04 0.19 5
Control of corruption 2004 22.7 –0.84 0.16 8
2002 32.7 –0.70 0.18 7
2000 29.0 –0.67 0.22 5
1998 32.2 –0.57 0.23 4
1996 49.3 –0.25 0.26 3
Source: Kaufmann, Kraay, and Mastruzzi 2005.
10414-10_AppA.qxd 4/17/08 11:24 AM Page 101
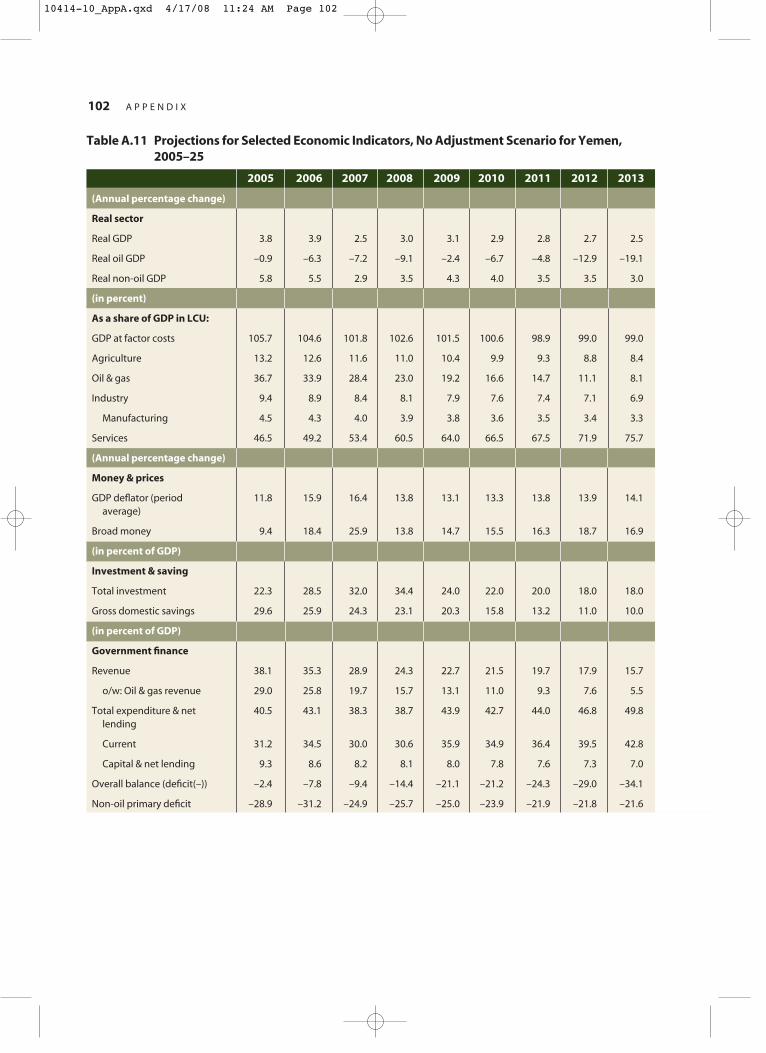
102 A P P E N D I X
(Annual percentage change)
Real sector
Real GDP 3.8 3.9 2.5 3.0 3.1 2.9 2.8 2.7 2.5
Real oil GDP –0.9 –6.3 –7.2 –9.1 –2.4 –6.7 –4.8 –12.9 –19.1
Real non-oil GDP 5.8 5.5 2.9 3.5 4.3 4.0 3.5 3.5 3.0
(in percent)
As a share of GDP in LCU:
GDP at factor costs 105.7 104.6 101.8 102.6 101.5 100.6 98.9 99.0 99.0
Agriculture 13.2 12.6 11.6 11.0 10.4 9.9 9.3 8.8 8.4
Oil & gas 36.7 33.9 28.4 23.0 19.2 16.6 14.7 11.1 8.1
Industry 9.4 8.9 8.4 8.1 7.9 7.6 7.4 7.1 6.9
Manufacturing 4.5 4.3 4.0 3.9 3.8 3.6 3.5 3.4 3.3
Services 46.5 49.2 53.4 60.5 64.0 66.5 67.5 71.9 75.7
(Annual percentage change)
Money & prices
GDP deflator (period 11.8 15.9 16.4 13.8 13.1 13.3 13.8 13.9 14.1average)
Broad money 9.4 18.4 25.9 13.8 14.7 15.5 16.3 18.7 16.9
(in percent of GDP)
Investment & saving
Total investment 22.3 28.5 32.0 34.4 24.0 22.0 20.0 18.0 18.0
Gross domestic savings 29.6 25.9 24.3 23.1 20.3 15.8 13.2 11.0 10.0
(in percent of GDP)
Government finance
Revenue 38.1 35.3 28.9 24.3 22.7 21.5 19.7 17.9 15.7
o/w: Oil & gas revenue 29.0 25.8 19.7 15.7 13.1 11.0 9.3 7.6 5.5
Total expenditure & net 40.5 43.1 38.3 38.7 43.9 42.7 44.0 46.8 49.8lending
Current 31.2 34.5 30.0 30.6 35.9 34.9 36.4 39.5 42.8
Capital & net lending 9.3 8.6 8.2 8.1 8.0 7.8 7.6 7.3 7.0
Overall balance (deficit(–)) –2.4 –7.8 –9.4 –14.4 –21.1 –21.2 –24.3 –29.0 –34.1
Non-oil primary deficit –28.9 –31.2 –24.9 –25.7 –25.0 –23.9 –21.9 –21.8 –21.6
Table A.11 Projections for Selected Economic Indicators, No Adjustment Scenario for Yemen, 2005–25
2005 2006 2007 2008 2009 2010 2011 2012 2013
10414-10_AppA.qxd 4/17/08 11:24 AM Page 102
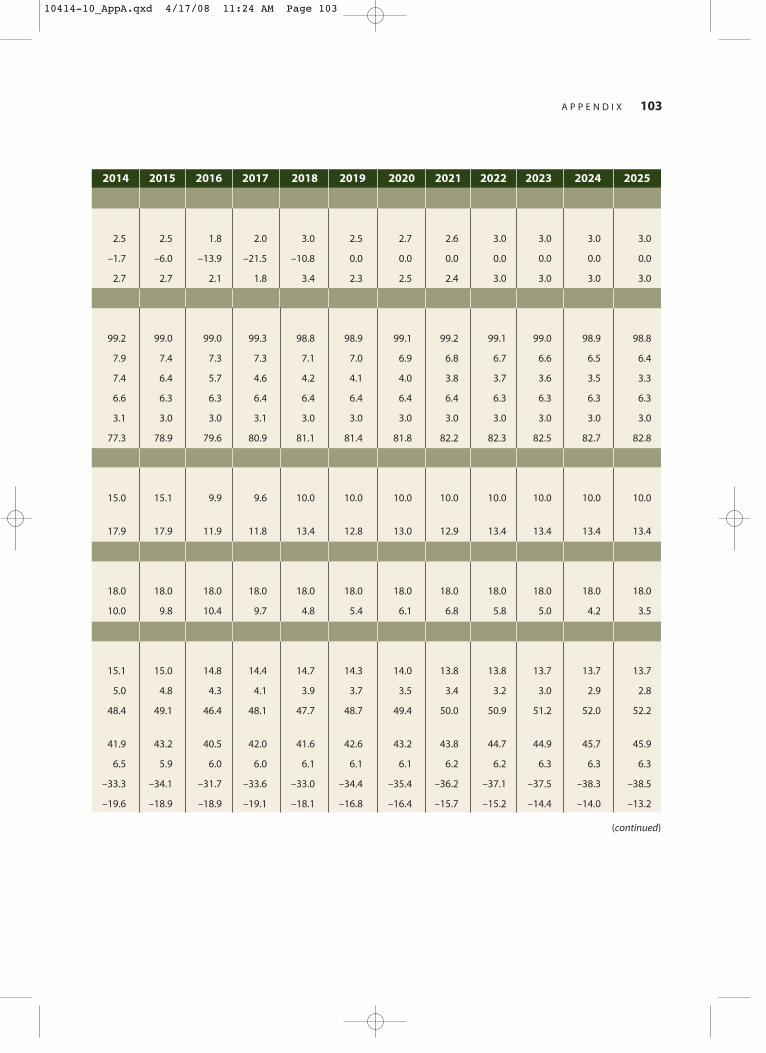
A P P E N D I X 103
(continued)
2.5 2.5 1.8 2.0 3.0 2.5 2.7 2.6 3.0 3.0 3.0 3.0
–1.7 –6.0 –13.9 –21.5 –10.8 0.0 0.0 0.0 0.0 0.0 0.0 0.0
2.7 2.7 2.1 1.8 3.4 2.3 2.5 2.4 3.0 3.0 3.0 3.0
99.2 99.0 99.0 99.3 98.8 98.9 99.1 99.2 99.1 99.0 98.9 98.8
7.9 7.4 7.3 7.3 7.1 7.0 6.9 6.8 6.7 6.6 6.5 6.4
7.4 6.4 5.7 4.6 4.2 4.1 4.0 3.8 3.7 3.6 3.5 3.3
6.6 6.3 6.3 6.4 6.4 6.4 6.4 6.4 6.3 6.3 6.3 6.3
3.1 3.0 3.0 3.1 3.0 3.0 3.0 3.0 3.0 3.0 3.0 3.0
77.3 78.9 79.6 80.9 81.1 81.4 81.8 82.2 82.3 82.5 82.7 82.8
15.0 15.1 9.9 9.6 10.0 10.0 10.0 10.0 10.0 10.0 10.0 10.0
17.9 17.9 11.9 11.8 13.4 12.8 13.0 12.9 13.4 13.4 13.4 13.4
18.0 18.0 18.0 18.0 18.0 18.0 18.0 18.0 18.0 18.0 18.0 18.0
10.0 9.8 10.4 9.7 4.8 5.4 6.1 6.8 5.8 5.0 4.2 3.5
15.1 15.0 14.8 14.4 14.7 14.3 14.0 13.8 13.8 13.7 13.7 13.7
5.0 4.8 4.3 4.1 3.9 3.7 3.5 3.4 3.2 3.0 2.9 2.8
48.4 49.1 46.4 48.1 47.7 48.7 49.4 50.0 50.9 51.2 52.0 52.2
41.9 43.2 40.5 42.0 41.6 42.6 43.2 43.8 44.7 44.9 45.7 45.9
6.5 5.9 6.0 6.0 6.1 6.1 6.1 6.2 6.2 6.3 6.3 6.3
–33.3 –34.1 –31.7 –33.6 –33.0 –34.4 –35.4 –36.2 –37.1 –37.5 –38.3 –38.5
–19.6 –18.9 –18.9 –19.1 –18.1 –16.8 –16.4 –15.7 –15.2 –14.4 –14.0 –13.2
2014 2015 2016 2017 2018 2019 2020 2021 2022 2023 2024 2025
10414-10_AppA.qxd 4/17/08 11:24 AM Page 103
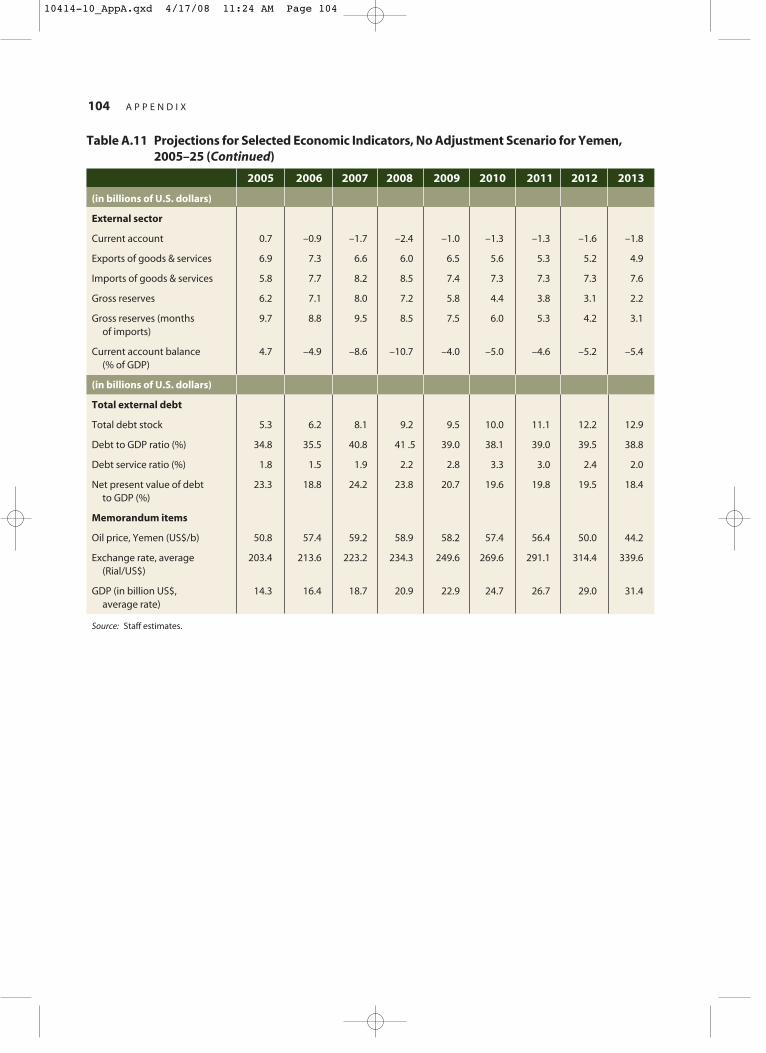
104 A P P E N D I X
Table A.11 Projections for Selected Economic Indicators, No Adjustment Scenario for Yemen, 2005–25 (Continued)
2005 2006 2007 2008 2009 2010 2011 2012 2013
(in billions of U.S. dollars)
External sector
Current account 0.7 –0.9 –1.7 –2.4 –1.0 –1.3 –1.3 –1.6 –1.8
Exports of goods & services 6.9 7.3 6.6 6.0 6.5 5.6 5.3 5.2 4.9
Imports of goods & services 5.8 7.7 8.2 8.5 7.4 7.3 7.3 7.3 7.6
Gross reserves 6.2 7.1 8.0 7.2 5.8 4.4 3.8 3.1 2.2
Gross reserves (months 9.7 8.8 9.5 8.5 7.5 6.0 5.3 4.2 3.1of imports)
Current account balance 4.7 –4.9 –8.6 –10.7 –4.0 –5.0 –4.6 –5.2 –5.4(% of GDP)
(in billions of U.S. dollars)
Total external debt
Total debt stock 5.3 6.2 8.1 9.2 9.5 10.0 11.1 12.2 12.9
Debt to GDP ratio (%) 34.8 35.5 40.8 41 .5 39.0 38.1 39.0 39.5 38.8
Debt service ratio (%) 1.8 1.5 1.9 2.2 2.8 3.3 3.0 2.4 2.0
Net present value of debt 23.3 18.8 24.2 23.8 20.7 19.6 19.8 19.5 18.4to GDP (%)
Memorandum items
Oil price, Yemen (US$/b) 50.8 57.4 59.2 58.9 58.2 57.4 56.4 50.0 44.2
Exchange rate, average 203.4 213.6 223.2 234.3 249.6 269.6 291.1 314.4 339.6(Rial/US$)
GDP (in billion US$, 14.3 16.4 18.7 20.9 22.9 24.7 26.7 29.0 31.4average rate)
Source: Staff estimates.
10414-10_AppA.qxd 4/17/08 11:24 AM Page 104

A P P E N D I X 105
2014 2015 2016 2017 2018 2019 2020 2021 2022 2023 2024 2025
–1.6 –1.6 –1.4 –1.5 –2.7 –2.6 –2.4 –2.1 –2.4 –2.7 –3.0 –3.3
5.1 5.0 4.9 4.6 3.2 3.4 3.7 4.0 3.8 3.6 3.4 3.2
7.7 7.8 7.4 7.4 7.6 7.7 7.8 7.9 8.1 8.2 8.3 8.5
2.2 2.2 2.1 2.1 1.5 1.5 1.6 1.6 1.6 1.6 1.7 1.7
3.0 3.0 3.0 3.0 2.2 2.1 2.2 2.2 2.2 2.2 2.2 2.2
–5.0 –4.9 –4.2 –4.5 –8.1 –7.6 –6.8 –6.0 –6.9 –7.7 –8.4 –9.1
14.3 15.5 17.1 18.6 20.6 23.0 25.4 27.3 29.8 32.6 35.8 39.2
44.7 46.1 50.7 55.4 60.6 67.2 73.4 78.5 84.6 91.5 99.1 107.1
1.6 1.2 1.4 1.6 1.9 2.3 2.8 3.2 3.6 4.1 4.6 5.1
20.7 20.0 20.8 21.6 23.4 26.0 27.9 28.5 30.0 31.9 34.1 36.5
39.1 34.6 34.7 34.9 35.1 35.3 35.6 35.8 36.0 36.2 36.4 36.6
417.3 467.4 523.4 586.3 656.6 735.4 823.6 922.5 1033.2 1157.2 1296.0 1451.5
30.1 31.7 31.6 31.6 32.0 32.2 32.5 32.8 33.2 33.6 34.0 34.4
10414-10_AppA.qxd 4/17/08 11:24 AM Page 105
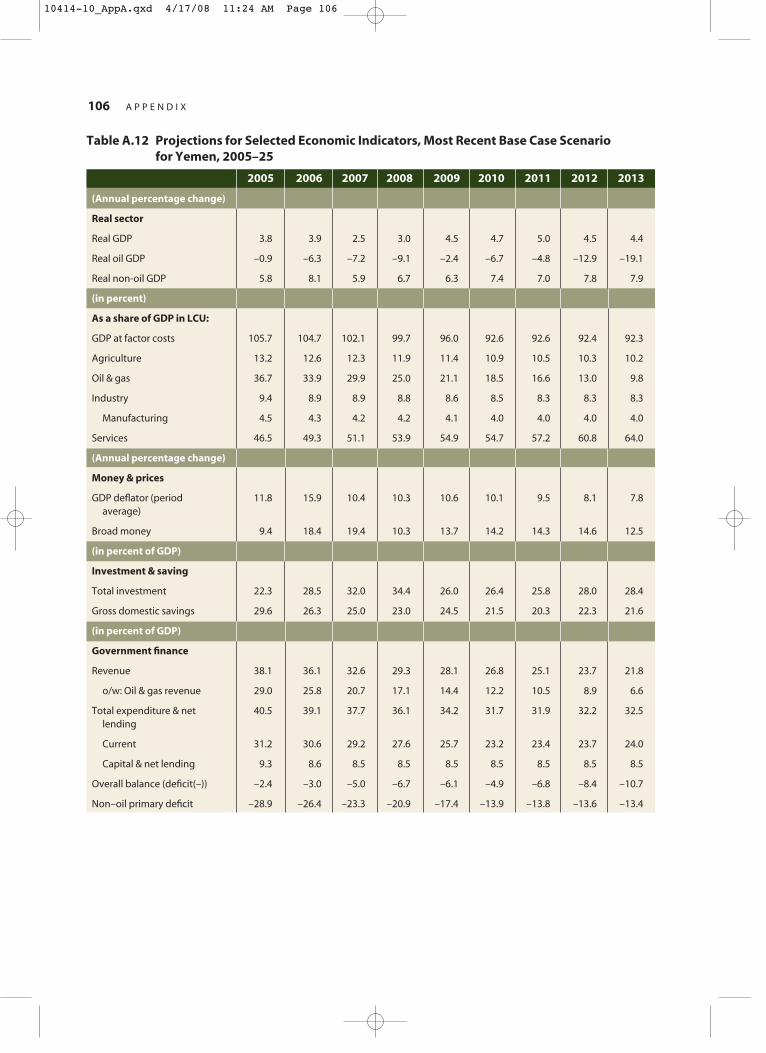
106 A P P E N D I X
(Annual percentage change)
Real sector
Real GDP 3.8 3.9 2.5 3.0 4.5 4.7 5.0 4.5 4.4
Real oil GDP –0.9 –6.3 –7.2 –9.1 –2.4 –6.7 –4.8 –12.9 –19.1
Real non-oil GDP 5.8 8.1 5.9 6.7 6.3 7.4 7.0 7.8 7.9
(in percent)
As a share of GDP in LCU:
GDP at factor costs 105.7 104.7 102.1 99.7 96.0 92.6 92.6 92.4 92.3
Agriculture 13.2 12.6 12.3 11.9 11.4 10.9 10.5 10.3 10.2
Oil & gas 36.7 33.9 29.9 25.0 21.1 18.5 16.6 13.0 9.8
Industry 9.4 8.9 8.9 8.8 8.6 8.5 8.3 8.3 8.3
Manufacturing 4.5 4.3 4.2 4.2 4.1 4.0 4.0 4.0 4.0
Services 46.5 49.3 51.1 53.9 54.9 54.7 57.2 60.8 64.0
(Annual percentage change)
Money & prices
GDP deflator (period 11.8 15.9 10.4 10.3 10.6 10.1 9.5 8.1 7.8average)
Broad money 9.4 18.4 19.4 10.3 13.7 14.2 14.3 14.6 12.5
(in percent of GDP)
Investment & saving
Total investment 22.3 28.5 32.0 34.4 26.0 26.4 25.8 28.0 28.4
Gross domestic savings 29.6 26.3 25.0 23.0 24.5 21.5 20.3 22.3 21.6
(in percent of GDP)
Government finance
Revenue 38.1 36.1 32.6 29.3 28.1 26.8 25.1 23.7 21.8
o/w: Oil & gas revenue 29.0 25.8 20.7 17.1 14.4 12.2 10.5 8.9 6.6
Total expenditure & net 40.5 39.1 37.7 36.1 34.2 31.7 31.9 32.2 32.5lending
Current 31.2 30.6 29.2 27.6 25.7 23.2 23.4 23.7 24.0
Capital & net lending 9.3 8.6 8.5 8.5 8.5 8.5 8.5 8.5 8.5
Overall balance (deficit(–)) –2.4 –3.0 –5.0 –6.7 –6.1 –4.9 –6.8 –8.4 –10.7
Non–oil primary deficit –28.9 –26.4 –23.3 –20.9 –17.4 –13.9 –13.8 –13.6 –13.4
Table A.12 Projections for Selected Economic Indicators, Most Recent Base Case Scenario for Yemen, 2005–25
2005 2006 2007 2008 2009 2010 2011 2012 2013
10414-10_AppA.qxd 4/17/08 11:24 AM Page 106
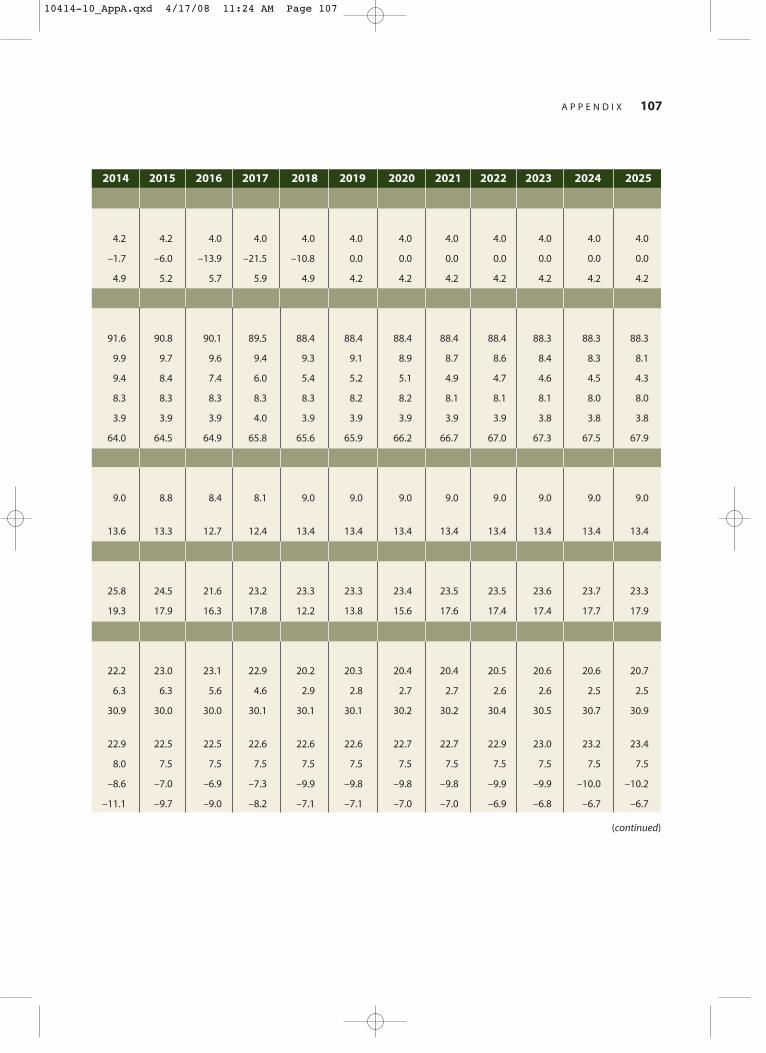
A P P E N D I X 107
4.2 4.2 4.0 4.0 4.0 4.0 4.0 4.0 4.0 4.0 4.0 4.0
–1.7 –6.0 –13.9 –21.5 –10.8 0.0 0.0 0.0 0.0 0.0 0.0 0.0
4.9 5.2 5.7 5.9 4.9 4.2 4.2 4.2 4.2 4.2 4.2 4.2
91.6 90.8 90.1 89.5 88.4 88.4 88.4 88.4 88.4 88.3 88.3 88.3
9.9 9.7 9.6 9.4 9.3 9.1 8.9 8.7 8.6 8.4 8.3 8.1
9.4 8.4 7.4 6.0 5.4 5.2 5.1 4.9 4.7 4.6 4.5 4.3
8.3 8.3 8.3 8.3 8.3 8.2 8.2 8.1 8.1 8.1 8.0 8.0
3.9 3.9 3.9 4.0 3.9 3.9 3.9 3.9 3.9 3.8 3.8 3.8
64.0 64.5 64.9 65.8 65.6 65.9 66.2 66.7 67.0 67.3 67.5 67.9
9.0 8.8 8.4 8.1 9.0 9.0 9.0 9.0 9.0 9.0 9.0 9.0
13.6 13.3 12.7 12.4 13.4 13.4 13.4 13.4 13.4 13.4 13.4 13.4
25.8 24.5 21.6 23.2 23.3 23.3 23.4 23.5 23.5 23.6 23.7 23.3
19.3 17.9 16.3 17.8 12.2 13.8 15.6 17.6 17.4 17.4 17.7 17.9
22.2 23.0 23.1 22.9 20.2 20.3 20.4 20.4 20.5 20.6 20.6 20.7
6.3 6.3 5.6 4.6 2.9 2.8 2.7 2.7 2.6 2.6 2.5 2.5
30.9 30.0 30.0 30.1 30.1 30.1 30.2 30.2 30.4 30.5 30.7 30.9
22.9 22.5 22.5 22.6 22.6 22.6 22.7 22.7 22.9 23.0 23.2 23.4
8.0 7.5 7.5 7.5 7.5 7.5 7.5 7.5 7.5 7.5 7.5 7.5
–8.6 –7.0 –6.9 –7.3 –9.9 –9.8 –9.8 –9.8 –9.9 –9.9 –10.0 –10.2
–11.1 –9.7 –9.0 –8.2 –7.1 –7.1 –7.0 –7.0 –6.9 –6.8 –6.7 –6.7
(continued)
2014 2015 2016 2017 2018 2019 2020 2021 2022 2023 2024 2025
10414-10_AppA.qxd 4/17/08 11:24 AM Page 107

108 A P P E N D I X
Table A.12 Projections for Selected Economic Indicators, Most Recent Base Case Scenario for Yemen, 2005–25 (Continued)
2005 2006 2007 2008 2009 2010 2011 2012 2013
(in billions of U.S. dollars)
External sector
Current account 0.7 –0.8 –1.5 –2.2 –0.4 –0.9 –0.7 –0.8 –1.1
Exports of goods & services 6.9 7.3 6.8 6.2 6.7 6.0 5.7 5.7 5.6
Imports of goods & services 5.8 7.7 8.1 8.5 7.1 7.1 7.1 7.2 7.4
Gross reserves 6.2 6.4 5.9 4.8 4.3 3.5 2.8 2.9 2.5
Gross reserves (months 9.7 8.0 7.2 5.7 5.9 4.8 4.1 4.2 3.5of imports)
Current account balance 4.7 –4.5 –7.9 –10.7 –1.6 –3.7 –2.9 –3.1 –4.1(% of GDP)
(in billions of U.S. dollars)
Total external debt
Total debt stock 5.3 5.4 5.5 5.8 6.1 6.4 6.6 7.5 8.0
Debt to GDP ratio (%) 34.8 31.1 29.3 28.4 27.5 27.0 26.3 28.5 29.2
Debt service ratio (%) 1.8 1.7 1.9 1.6 1.3 1.1 1.0 0.8 0.8
Net present value of debt 23.3 18.8 17.7 16.7 15.8 15.4 15.3 16.7 18.5to GDP (%)
Memorandum items
Oil price, Yemen (US$/b) 50.8 57.4 59.2 58.9 58.2 57.4 56.4 50.0 44.2
Exchange rate, average 203.4 213.6 223.2 234.3 249.6 269.6 291.1 314.4 339.6(Rial/US$)
GDP (in billion US$, 14.3 16.4 17.8 19.2 20.9 22.3 23.7 24.8 25.8average rate)
Source: Staff estimates.
10414-10_AppA.qxd 4/17/08 11:24 AM Page 108

A P P E N D I X 109
2014 2015 2016 2017 2018 2019 2020 2021 2022 2023 2024 2025
–0.9 –1.0 –0.7 –0.8 –2.4 –2.1 –1.7 –1.3 –1.1 –0.9 –0.5 –0.1
5.9 5.9 5.9 5.9 4.6 5.1 5.6 6.2 6.2 6.3 6.5 6.8
7.5 7.6 7.3 7.3 7.5 7.6 7.7 7.8 7.9 8.1 8.2 8.3
2.4 2.3 2.4 2.6 1.7 1.7 1.8 2.7 3.1 3.7 4.5 5.5
3.3 3.1 3.3 3.5 2.2 2.1 2.2 3.2 3.8 4.5 5.4 6.7
–3.4 –3.8 –2.7 –3.0 –9.0 –7.8 –6.4 –4.9 –4.1 –3.1 –1.9 –0.5
8.3 8.6 9.0 9.5 10.4 11.9 13.1 14.6 15.5 16.3 17.0 17.6
32.7 33.5 34.8 36.8 39.7 44.7 48.6 53.6 56.3 58.4 60.1 61.5
0.9 0.8 0.8 0.8 0.8 0.8 0.7 1.0 1.1 1.2 1.2 1.3
19.6 21.0 22.0 23.1 25.6 27.4 29.2 30.8 32.1 33.3 34.2 34.7
39.1 34.6 34.7 34.9 35.1 35.3 35.6 35.8 36.0 36.2 36.4 36.6
417.3 467.4 523.4 586.3 656.6 735.4 823.6 922.5 1033.2 1157.2 1296.0 1451.5
23.9 24.1 24.3 24.4 24.7 25.0 25.3 25.6 26.0 26.3 26.6 27.0
10414-10_AppA.qxd 4/17/08 11:24 AM Page 109
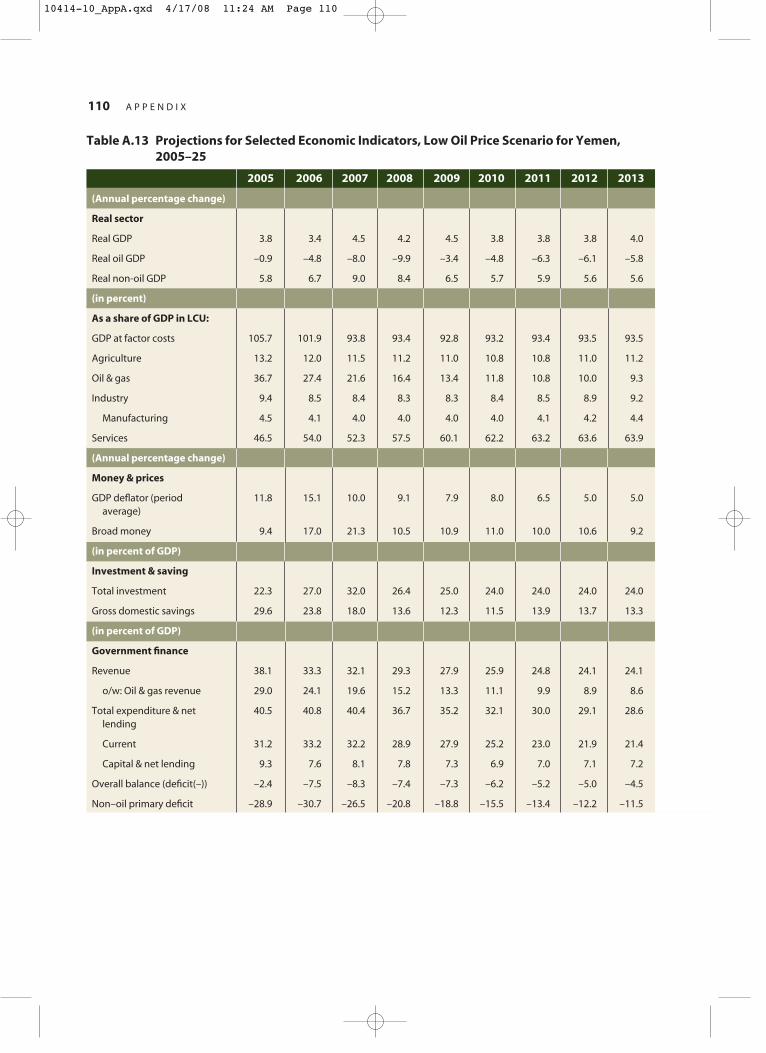
110 A P P E N D I X
(Annual percentage change)
Real sector
Real GDP 3.8 3.4 4.5 4.2 4.5 3.8 3.8 3.8 4.0
Real oil GDP –0.9 –4.8 –8.0 –9.9 –3.4 –4.8 –6.3 –6.1 –5.8
Real non-oil GDP 5.8 6.7 9.0 8.4 6.5 5.7 5.9 5.6 5.6
(in percent)
As a share of GDP in LCU:
GDP at factor costs 105.7 101.9 93.8 93.4 92.8 93.2 93.4 93.5 93.5
Agriculture 13.2 12.0 11.5 11.2 11.0 10.8 10.8 11.0 11.2
Oil & gas 36.7 27.4 21.6 16.4 13.4 11.8 10.8 10.0 9.3
Industry 9.4 8.5 8.4 8.3 8.3 8.4 8.5 8.9 9.2
Manufacturing 4.5 4.1 4.0 4.0 4.0 4.0 4.1 4.2 4.4
Services 46.5 54.0 52.3 57.5 60.1 62.2 63.2 63.6 63.9
(Annual percentage change)
Money & prices
GDP deflator (period 11.8 15.1 10.0 9.1 7.9 8.0 6.5 5.0 5.0average)
Broad money 9.4 17.0 21.3 10.5 10.9 11.0 10.0 10.6 9.2
(in percent of GDP)
Investment & saving
Total investment 22.3 27.0 32.0 26.4 25.0 24.0 24.0 24.0 24.0
Gross domestic savings 29.6 23.8 18.0 13.6 12.3 11.5 13.9 13.7 13.3
(in percent of GDP)
Government finance
Revenue 38.1 33.3 32.1 29.3 27.9 25.9 24.8 24.1 24.1
o/w: Oil & gas revenue 29.0 24.1 19.6 15.2 13.3 11.1 9.9 8.9 8.6
Total expenditure & net 40.5 40.8 40.4 36.7 35.2 32.1 30.0 29.1 28.6lending
Current 31.2 33.2 32.2 28.9 27.9 25.2 23.0 21.9 21.4
Capital & net lending 9.3 7.6 8.1 7.8 7.3 6.9 7.0 7.1 7.2
Overall balance (deficit(–)) –2.4 –7.5 –8.3 –7.4 –7.3 –6.2 –5.2 –5.0 –4.5
Non–oil primary deficit –28.9 –30.7 –26.5 –20.8 –18.8 –15.5 –13.4 –12.2 –11.5
Table A.13 Projections for Selected Economic Indicators, Low Oil Price Scenario for Yemen, 2005–25
2005 2006 2007 2008 2009 2010 2011 2012 2013
10414-10_AppA.qxd 4/17/08 11:24 AM Page 110

A P P E N D I X 111
4.0 4.0 4.0 4.0 4.0 4.0 4.0 4.0 4.0 4.0 4.0 4.0
–5.6 –5.3 –5.1 –4.8 –4.5 –4.3 –4.0 –3.8 –3.5 –3.3 –3.1 –2.8
5.4 5.2 5.0 4.9 4.8 4.7 4.6 4.6 4.5 4.4 4.4 4.4
93.5 93.5 93.5 93.5 93.4 93.4 93.3 93.2 93.0 92.9 92.7 92.5
11.3 11.5 11.7 11.9 12.1 12.3 12.6 12.8 13.0 13.3 13.6 13.9
8.7 8.2 8.0 7.7 7.4 7.2 7.0 6.8 6.7 6.6 6.5 6.3
9.5 9.8 10.1 10.5 10.8 11.2 11.6 11.9 12.3 12.8 13.2 13.6
4.5 4.7 4.8 5.0 5.2 5.3 5.5 5.7 5.9 6.1 6.3 6.5
64.0 64.0 63.7 63.5 63.1 62.7 62.2 61.7 61.0 60.3 59.5 58.7
5.0 5.0 5.0 5.0 5.0 5.0 5.0 5.0 5.0 5.0 5.0 5.0
9.2 9.2 9.2 9.2 9.2 9.2 9.2 9.2 9.2 9.2 9.2 9.2
24.0 24.0 25.0 25.0 25.0 25.0 25.0 25.0 25.0 25.0 25.0 25.0
12.8 12.4 13.7 13.5 13.3 13.1 12.7 12.2 11.8 11.3 10.9 10.3
23.7 23.3 23.6 23.6 23.5 23.4 23.6 23.8 24.0 24.2 24.4 24.7
7.9 7.3 7.4 7.1 6.8 6.5 6.3 6.3 6.3 6.2 6.2 6.2
28.0 27.5 27.5 27.5 27.5 27.5 27.5 27.5 27.5 27.5 27.5 27.5
20.7 20.1 20.1 20.0 19.9 19.9 19.8 19.8 19.8 19.7 19.7 19.7
7.3 7.4 7.4 7.5 7.6 7.6 7.7 7.7 7.7 7.8 7.8 7.8
–4.4 –4.2 –3.9 –3.9 –4.0 –4.1 –3.9 –3.7 –3.5 –3.3 –3.1 –2.8
–10.7 –9.8 –9.5 –9.2 –8.9 –8.9 –8.6 –8.4 –8.2 –7.9 –7.7 –7.4
(continued)
2014 2015 2016 2017 2018 2019 2020 2021 2022 2023 2024 2025
10414-10_AppA.qxd 4/17/08 11:24 AM Page 111

Table A.13 Projections for Selected Economic Indicators, Low Oil Price Scenario for Yemen, 2005–25 (Continued)
2005 2006 2007 2008 2009 2010 2011 2012 2013
(in billions of U.S. dollars)
External sector
Current account 0.7 –0.2 –2.0 –1.6 –1.6 –1.5 –1.2 –1.1 –1.1
Exports of goods & services 6.9 6.5 5.6 5.0 5.5 4.9 4.5 4.2 4.0
Imports of goods & services 5.8 7.1 8.2 7.5 8.0 7.4 6.5 6.2 6.0
Gross reserves 6.2 6.1 6.8 6.0 5.3 4.5 3.6 3.1 2.8
Gross reserves (months 9.7 8.7 8.8 8.6 7.2 6.7 5.9 5.3 5.0of imports)
Current account balance 4.7 –1.0 –10.6 –8.2 –8.4 –7.7 –6.3 –5.9 –5.7(% of GDP)
(in billions of U.S. dollars)
Total external debt
Total debt stock 5.3 6.3 8.4 9.3 10.0 10.4 10.5 10.7 10.9
Debt to GDP ratio (%) 34.8 31.2 34.1 36.1 38.2 40.2 40.1 40.7 41.5
Debt service ratio (%) 1.8 3.7 5.6 8.2 7.1 8.2 10.6 13.1 12.7
Net present value of debt 23.3 18.8 20.2 19.8 19.1 19.2 19.9 22.3 24.6to GDP (%)
Memorandum items
Oil price, Yemen (US$/b) 50.8 49.7 46.1 41.7 38.1 35.5 34.6 33.7 32.8
Exchange rate, average 203.4 220.6 242.4 268.1 293.3 330.6 367.4 402.7 441.3(Rial/US$)
GDP (in billion US$, 14.3 16.6 17.4 17.9 18.4 18.3 18.2 18.1 18.1average rate)
Source: Staff estimates.
Table A.14 External Debt Sustainability Framework, Baseline Scenario for Yemen, 2006–26(in percent of GDP, unless otherwise indicated)
Actual
1999 2000 2001 2002 2003 2004 2005
External debt (nominal)a 72.9 50.5 51.1 50.5 44.2 39.4 34.4
o/w public and publicly guaranteed (PPG) 72.9 50.5 51.1 50.5 44.2 39.4 34.4
Change in external debt –14.8 –22.4 0.5 –0.6 –6.3 –4.8 –5.1
Identified net debt–creating flows –20.9 –30.3 –7.8 –10.1 –11.6 –9.4 –8.3
Non-interest current account deficit –3.7 –13.8 –5.9 –5.9 –0.4 –2.3 –5.1
Deficit in balance of goods and services 6.4 –6.4 1.1 0.7 2.5 –1.1 –8.0
Exports 34.5 41.6 36.0 38.9 34.9 36.7 45.5
Imports 40.8 35.2 37.2 39.6 37.4 35.6 37.5
Net current transfers (negative = inflow) –17.5 –14.6 –13.4 –14.1 –10.0 –9.5 –7.7
Other current account flows (negative = net inflow) 7.4 7.2 6.3 7.4 7.1 8.2 10.6
Net FDI (negative = inflow) –0.6 –1.5 –2.7 –3.1 –2.6 –2.5 0.7
10414-10_AppA.qxd 4/17/08 11:24 AM Page 112
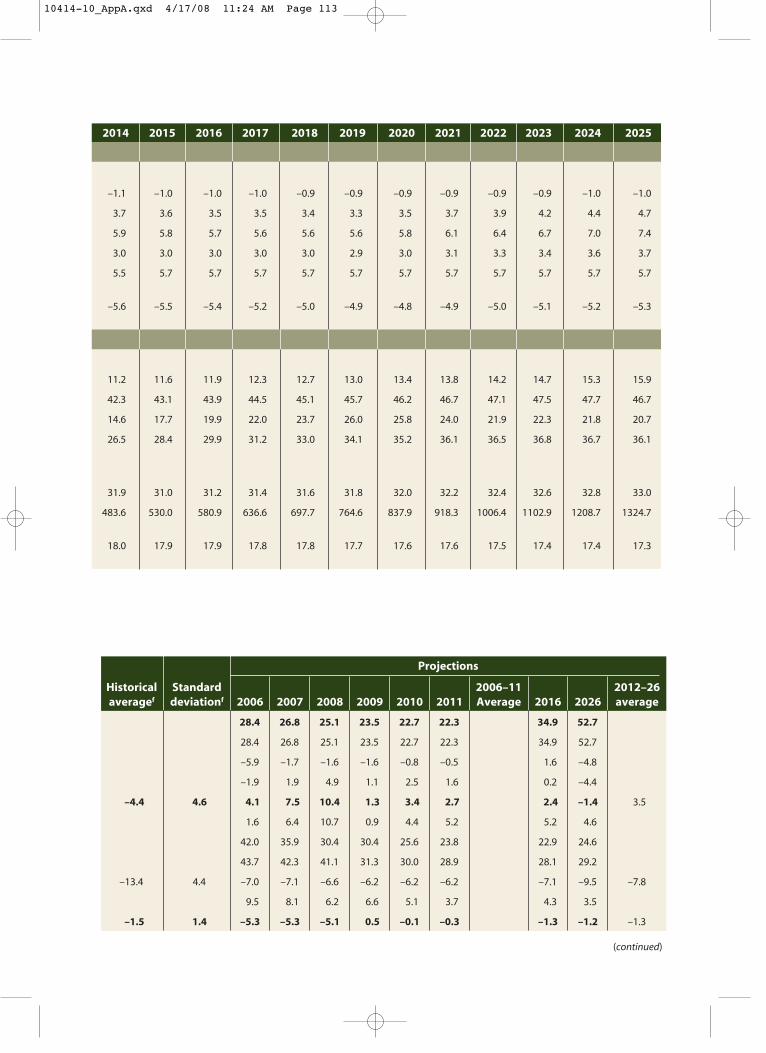
2014 2015 2016 2017 2018 2019 2020 2021 2022 2023 2024 2025
–1.1 –1.0 –1.0 –1.0 –0.9 –0.9 –0.9 –0.9 –0.9 –0.9 –1.0 –1.0
3.7 3.6 3.5 3.5 3.4 3.3 3.5 3.7 3.9 4.2 4.4 4.7
5.9 5.8 5.7 5.6 5.6 5.6 5.8 6.1 6.4 6.7 7.0 7.4
3.0 3.0 3.0 3.0 3.0 2.9 3.0 3.1 3.3 3.4 3.6 3.7
5.5 5.7 5.7 5.7 5.7 5.7 5.7 5.7 5.7 5.7 5.7 5.7
–5.6 –5.5 –5.4 –5.2 –5.0 –4.9 –4.8 –4.9 –5.0 –5.1 –5.2 –5.3
11.2 11.6 11.9 12.3 12.7 13.0 13.4 13.8 14.2 14.7 15.3 15.9
42.3 43.1 43.9 44.5 45.1 45.7 46.2 46.7 47.1 47.5 47.7 46.7
14.6 17.7 19.9 22.0 23.7 26.0 25.8 24.0 21.9 22.3 21.8 20.7
26.5 28.4 29.9 31.2 33.0 34.1 35.2 36.1 36.5 36.8 36.7 36.1
31.9 31.0 31.2 31.4 31.6 31.8 32.0 32.2 32.4 32.6 32.8 33.0
483.6 530.0 580.9 636.6 697.7 764.6 837.9 918.3 1006.4 1102.9 1208.7 1324.7
18.0 17.9 17.9 17.8 17.8 17.7 17.6 17.6 17.5 17.4 17.4 17.3
(continued)
Projections
Historical Standard 2006–11 2012–26averagef deviationf 2006 2007 2008 2009 2010 2011 Average 2016 2026 average
28.4 26.8 25.1 23.5 22.7 22.3 34.9 52.7
28.4 26.8 25.1 23.5 22.7 22.3 34.9 52.7
–5.9 –1.7 –1.6 –1.6 –0.8 –0.5 1.6 –4.8
–1.9 1.9 4.9 1.1 2.5 1.6 0.2 –4.4
–4.4 4.6 4.1 7.5 10.4 1.3 3.4 2.7 2.4 –1.4 3.5
1.6 6.4 10.7 0.9 4.4 5.2 5.2 4.6
42.0 35.9 30.4 30.4 25.6 23.8 22.9 24.6
43.7 42.3 41.1 31.3 30.0 28.9 28.1 29.2
–13.4 4.4 –7.0 –7.1 –6.6 –6.2 –6.2 –6.2 –7.1 –9.5 –7.8
9.5 8.1 6.2 6.6 5.1 3.7 4.3 3.5
–1.5 1.4 –5.3 –5.3 –5.1 0.5 –0.1 –0.3 –1.3 –1.2 –1.3
10414-10_AppA.qxd 4/17/08 11:24 AM Page 113

114 A P P E N D I X
Endogenous debt dynamicsb –16.6 –15.0 0.7 –1.1 –8.6 –4.6 –3.9
Contribution from nominal interest rate 0.9 0.5 0.6 0.5 0.5 0.4 0.5
Contribution from real GDP growth –2.4 –2.5 –2.3 –1.9 –1.3 –1.0 –1.3
Contribution from price and exchange rate changes –15.1 –13.0 2.5 0.3 –7.8 –4.0 –3.0
Residual (3–4)c 6.1 7.9 8.4 9.5 5.3 4.6 3.2
o/w exceptional financing –1.8 –0.6 0.0 0.0 0.0 –0.6 –1.0
NPV of external debtd . . . . . . . . . . . . . . . . . . 23.3
In percent of exports . . . . . . . . . . . . . . . . . . 51.2
NPV of PPG external debt . . . . . . . . . . . . . . . . . . 23.3
In percent of exports . . . . . . . . . . . . . . . . . . 51.2
Debt service-to-exports ratio (in percent) 10.6 6.1 6.4 3.8 3.4 3.3 3.3
PPG debt service-to-exports ratio (in percent) 10.6 6.1 6.4 3.8 3.4 3.3 3.3
Total gross financing need (billions of U.S. dollars) 0.0 –1.2 –0.6 –0.7 –0.2 –0.5 –0.5
Non–interest current account deficit that stabilizes debt ratio 11.1 8.6 –6.4 –5.4 5.9 2.5 0.0
Key macroeconomic assumptions
Real GDP growth (in percent) 3.5 4.4 4.6 3.9 3.1 2.6 3.8
GDP deflator in US dollar terms (change in percent) 20.8 21.6 –4.6 –0.7 18.1 10.0 8.2
Effective interest rate (percent)e 1.4 0.9 1.1 1.0 1.1 1.1 1.3
Growth of exports of G&S (US dollar terms, in percent) 54.2 53.4 –13.7 11.5 9.2 18.7 39.1
Growth of imports of G&S (US dollar terms, in percent) 9.9 9.6 5.2 10.1 14.9 7.5 18.1
Grant element of new public sector borrowing (in percent) . . . . . . . . . . . . . . .
Memorandum item:
Nominal GDP (billions of US dollars) 7.5 9.6 9.5 9.8 12.0 13.5 15.2
Source: Staff simulations.a. Includes both public and private sector external debt.b. Derived as [r − g − r(1+g)]/(1+g+r+gr) times previous period debt ratio, with r = nominal interest rate; g = real GDP growth rate, and r = growth rate of GDP deflator in U.S. dollar terms.c. Includes exceptional financing (i.e., changes in arrears and debt relief); changes in gross foreign assets; and valuation adjustments. For projections also includes contribution from price and exchange rate changes.d. Assumes that NPV of private sector debt is equivalent to its face value.e. Current-year interest payments divided by previous period debt stock.f. Historical averages and standard deviations are generally derived over the past 10 years, subject to data availability.
Table A.14 External Debt Sustainability Framework, Baseline Scenario for Yemen, 2006–26(in percent of GDP, unless otherwise indicated) (Continued)
Actual
1999 2000 2001 2002 2003 2004 2005
10414-10_AppA.qxd 4/17/08 11:24 AM Page 114
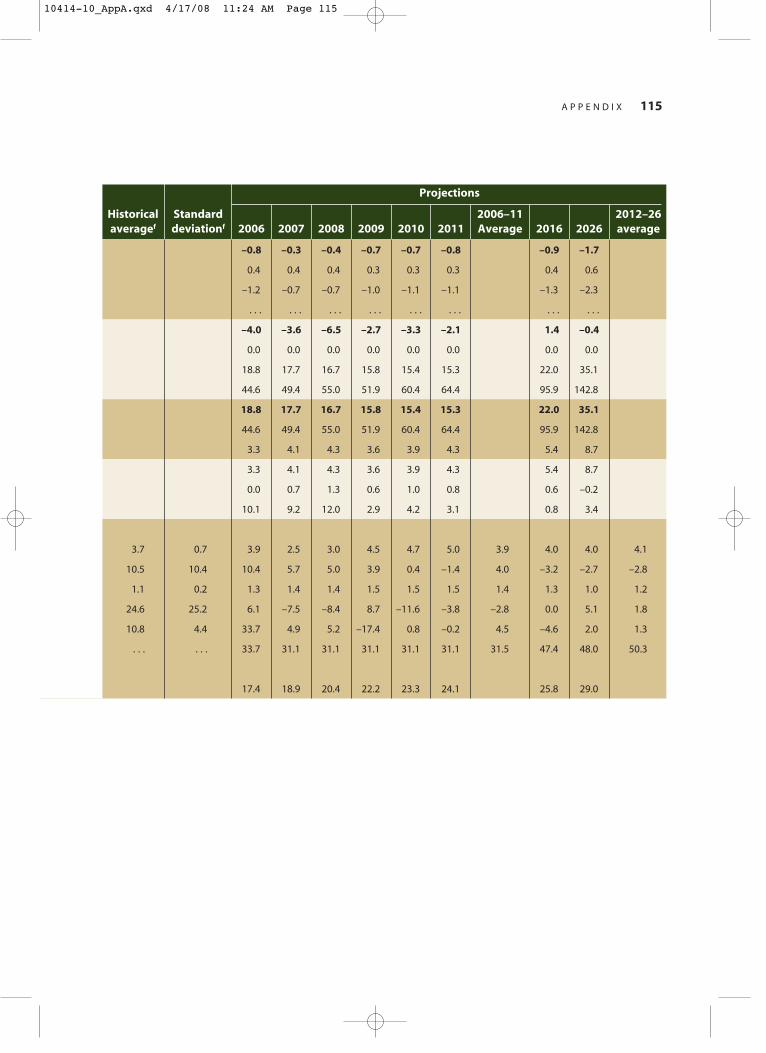
A P P E N D I X 115
–0.8 –0.3 –0.4 –0.7 –0.7 –0.8 –0.9 –1.7
0.4 0.4 0.4 0.3 0.3 0.3 0.4 0.6
–1.2 –0.7 –0.7 –1.0 –1.1 –1.1 –1.3 –2.3
. . . . . . . . . . . . . . . . . . . . . . . .
–4.0 –3.6 –6.5 –2.7 –3.3 –2.1 1.4 –0.4
0.0 0.0 0.0 0.0 0.0 0.0 0.0 0.0
18.8 17.7 16.7 15.8 15.4 15.3 22.0 35.1
44.6 49.4 55.0 51.9 60.4 64.4 95.9 142.8
18.8 17.7 16.7 15.8 15.4 15.3 22.0 35.1
44.6 49.4 55.0 51.9 60.4 64.4 95.9 142.8
3.3 4.1 4.3 3.6 3.9 4.3 5.4 8.7
3.3 4.1 4.3 3.6 3.9 4.3 5.4 8.7
0.0 0.7 1.3 0.6 1.0 0.8 0.6 –0.2
10.1 9.2 12.0 2.9 4.2 3.1 0.8 3.4
3.7 0.7 3.9 2.5 3.0 4.5 4.7 5.0 3.9 4.0 4.0 4.1
10.5 10.4 10.4 5.7 5.0 3.9 0.4 –1.4 4.0 –3.2 –2.7 –2.8
1.1 0.2 1.3 1.4 1.4 1.5 1.5 1.5 1.4 1.3 1.0 1.2
24.6 25.2 6.1 –7.5 –8.4 8.7 –11.6 –3.8 –2.8 0.0 5.1 1.8
10.8 4.4 33.7 4.9 5.2 –17.4 0.8 –0.2 4.5 –4.6 2.0 1.3
. . . . . . 33.7 31.1 31.1 31.1 31.1 31.1 31.5 47.4 48.0 50.3
17.4 18.9 20.4 22.2 23.3 24.1 25.8 29.0
Projections
Historical Standard 2006–11 2012–26averagef deviationf 2006 2007 2008 2009 2010 2011 Average 2016 2026 average
10414-10_AppA.qxd 4/17/08 11:24 AM Page 115
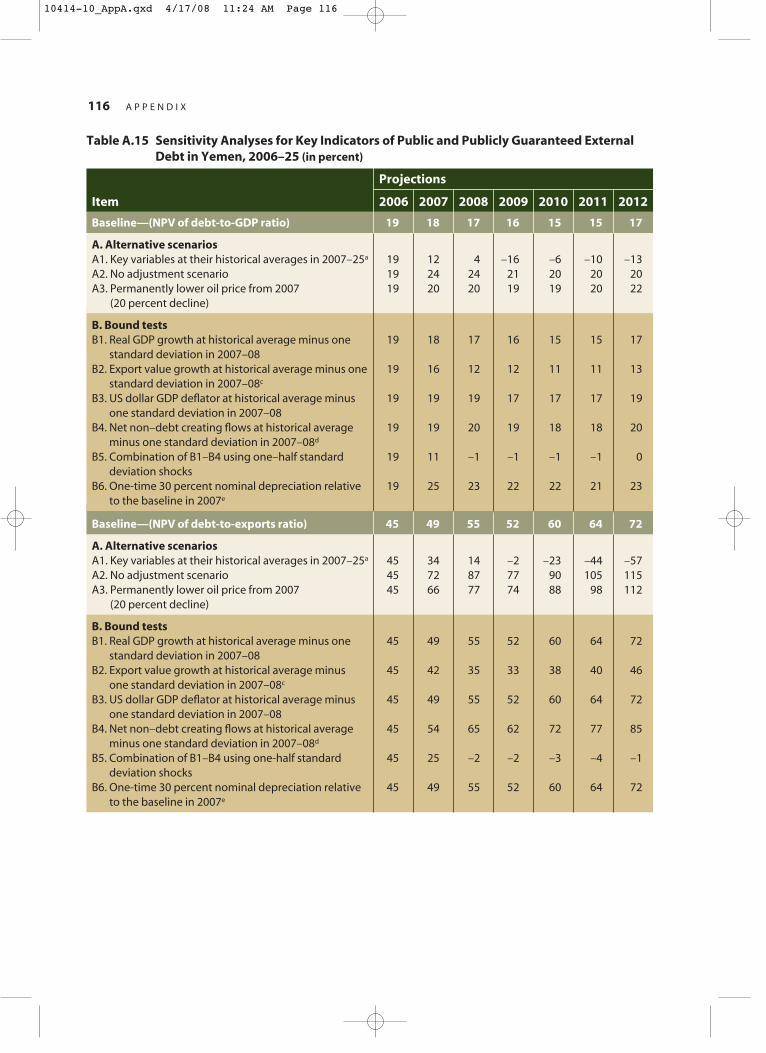
116 A P P E N D I X
Table A.15 Sensitivity Analyses for Key Indicators of Public and Publicly Guaranteed External Debt in Yemen, 2006–25 (in percent)
Projections
Item 2006 2007 2008 2009 2010 2011 2012
Baseline—(NPV of debt-to-GDP ratio) 19 18 17 16 15 15 17
A. Alternative scenariosA1. Key variables at their historical averages in 2007–25a 19 12 4 –16 –6 –10 –13A2. No adjustment scenario 19 24 24 21 20 20 20A3. Permanently lower oil price from 2007 19 20 20 19 19 20 22
(20 percent decline)
B. Bound testsB1. Real GDP growth at historical average minus one 19 18 17 16 15 15 17
standard deviation in 2007–08B2. Export value growth at historical average minus one 19 16 12 12 11 11 13
standard deviation in 2007–08c
B3. US dollar GDP deflator at historical average minus 19 19 19 17 17 17 19one standard deviation in 2007–08
B4. Net non–debt creating flows at historical average 19 19 20 19 18 18 20minus one standard deviation in 2007–08d
B5. Combination of B1–B4 using one–half standard 19 11 –1 –1 –1 –1 0deviation shocks
B6. One-time 30 percent nominal depreciation relative 19 25 23 22 22 21 23to the baseline in 2007e
Baseline—(NPV of debt-to-exports ratio) 45 49 55 52 60 64 72
A. Alternative scenariosA1. Key variables at their historical averages in 2007–25a 45 34 14 –2 –23 –44 –57A2. No adjustment scenario 45 72 87 77 90 105 115A3. Permanently lower oil price from 2007 45 66 77 74 88 98 112
(20 percent decline)
B. Bound testsB1. Real GDP growth at historical average minus one 45 49 55 52 60 64 72
standard deviation in 2007–08B2. Export value growth at historical average minus 45 42 35 33 38 40 46
one standard deviation in 2007–08c
B3. US dollar GDP deflator at historical average minus 45 49 55 52 60 64 72one standard deviation in 2007–08
B4. Net non–debt creating flows at historical average 45 54 65 62 72 77 85minus one standard deviation in 2007–08d
B5. Combination of B1–B4 using one-half standard 45 25 –2 –2 –3 –4 –1deviation shocks
B6. One-time 30 percent nominal depreciation relative 45 49 55 52 60 64 72to the baseline in 2007e
10414-10_AppA.qxd 4/17/08 11:24 AM Page 116
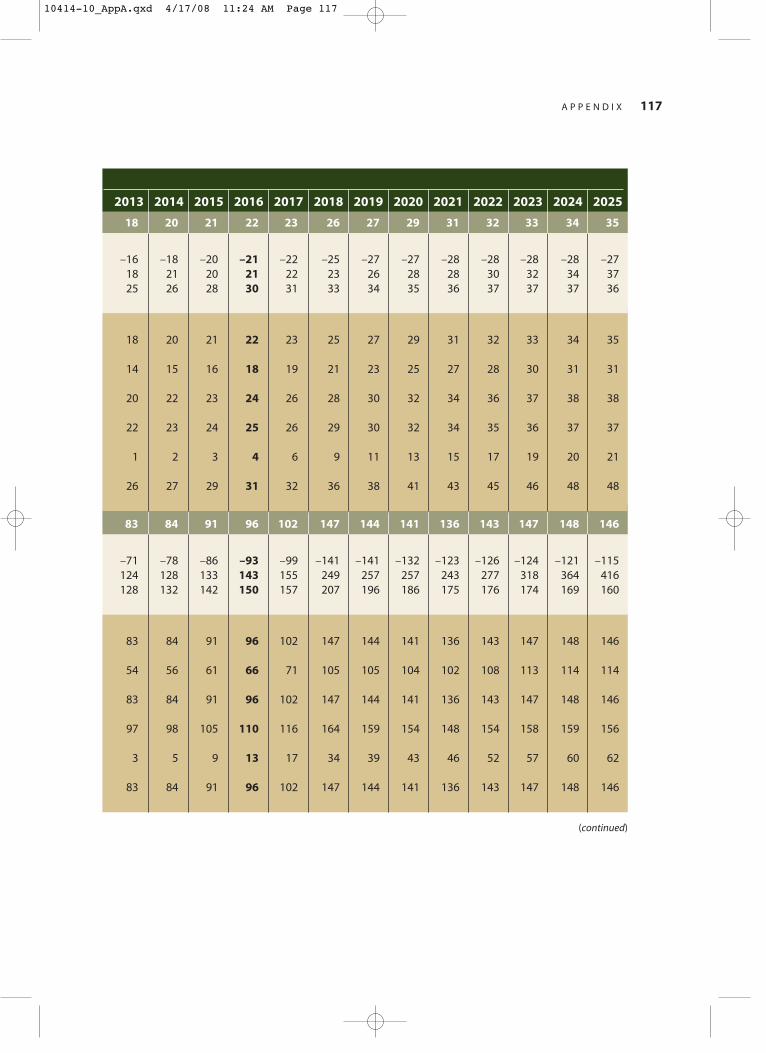
A P P E N D I X 117
2013 2014 2015 2016 2017 2018 2019 2020 2021 2022 2023 2024 2025
18 20 21 22 23 26 27 29 31 32 33 34 35
–16 –18 –20 –21 –22 –25 –27 –27 –28 –28 –28 –28 –2718 21 20 21 22 23 26 28 28 30 32 34 3725 26 28 30 31 33 34 35 36 37 37 37 36
18 20 21 22 23 25 27 29 31 32 33 34 35
14 15 16 18 19 21 23 25 27 28 30 31 31
20 22 23 24 26 28 30 32 34 36 37 38 38
22 23 24 25 26 29 30 32 34 35 36 37 37
1 2 3 4 6 9 11 13 15 17 19 20 21
26 27 29 31 32 36 38 41 43 45 46 48 48
83 84 91 96 102 147 144 141 136 143 147 148 146
–71 –78 –86 –93 –99 –141 –141 –132 –123 –126 –124 –121 –115124 128 133 143 155 249 257 257 243 277 318 364 416128 132 142 150 157 207 196 186 175 176 174 169 160
83 84 91 96 102 147 144 141 136 143 147 148 146
54 56 61 66 71 105 105 104 102 108 113 114 114
83 84 91 96 102 147 144 141 136 143 147 148 146
97 98 105 110 116 164 159 154 148 154 158 159 156
3 5 9 13 17 34 39 43 46 52 57 60 62
83 84 91 96 102 147 144 141 136 143 147 148 146
(continued)
10414-10_AppA.qxd 4/17/08 11:24 AM Page 117
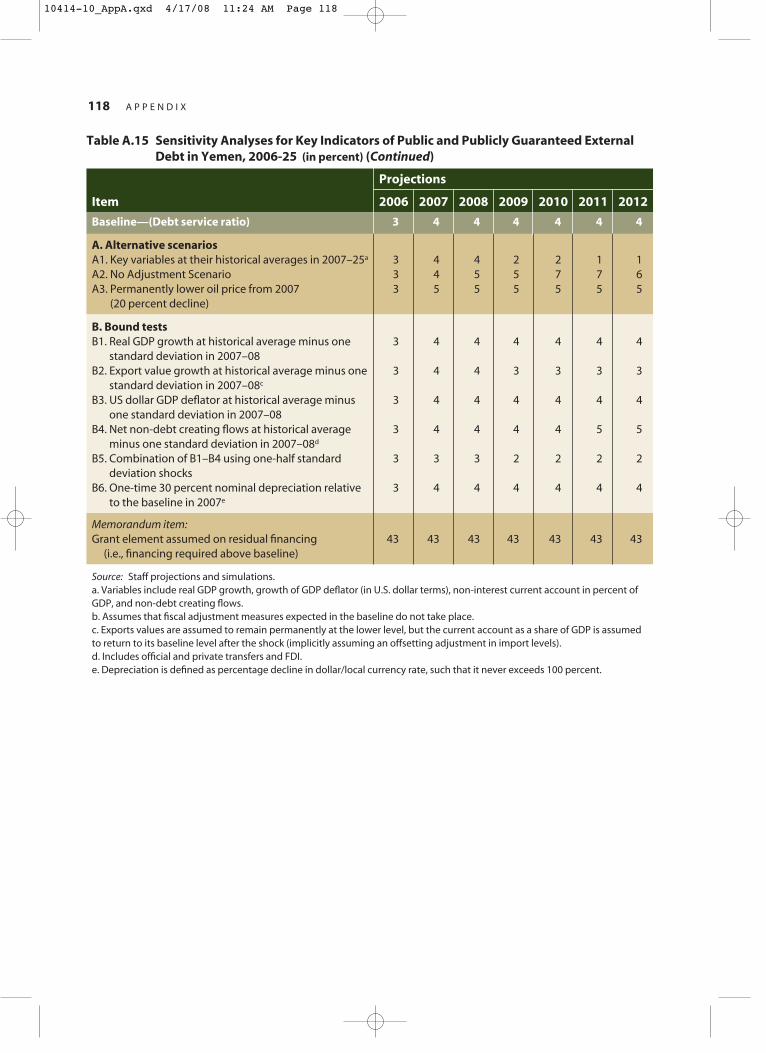
118 A P P E N D I X
Baseline—(Debt service ratio) 3 4 4 4 4 4 4
A. Alternative scenariosA1. Key variables at their historical averages in 2007–25a 3 4 4 2 2 1 1A2. No Adjustment Scenario 3 4 5 5 7 7 6A3. Permanently lower oil price from 2007 3 5 5 5 5 5 5
(20 percent decline)
B. Bound testsB1. Real GDP growth at historical average minus one 3 4 4 4 4 4 4
standard deviation in 2007–08B2. Export value growth at historical average minus one 3 4 4 3 3 3 3
standard deviation in 2007–08c
B3. US dollar GDP deflator at historical average minus 3 4 4 4 4 4 4one standard deviation in 2007–08
B4. Net non-debt creating flows at historical average 3 4 4 4 4 5 5minus one standard deviation in 2007–08d
B5. Combination of B1–B4 using one-half standard 3 3 3 2 2 2 2deviation shocks
B6. One-time 30 percent nominal depreciation relative 3 4 4 4 4 4 4to the baseline in 2007e
Memorandum item:Grant element assumed on residual financing 43 43 43 43 43 43 43
(i.e., financing required above baseline)
Source: Staff projections and simulations.a. Variables include real GDP growth, growth of GDP deflator (in U.S. dollar terms), non-interest current account in percent of GDP, and non-debt creating flows.b. Assumes that fiscal adjustment measures expected in the baseline do not take place.c. Exports values are assumed to remain permanently at the lower level, but the current account as a share of GDP is assumed to return to its baseline level after the shock (implicitly assuming an offsetting adjustment in import levels).d. Includes official and private transfers and FDI.e. Depreciation is defined as percentage decline in dollar/local currency rate, such that it never exceeds 100 percent.
Table A.15 Sensitivity Analyses for Key Indicators of Public and Publicly Guaranteed External Debt in Yemen, 2006-25 (in percent) (Continued)
Projections
Item 2006 2007 2008 2009 2010 2011 2012
10414-10_AppA.qxd 4/17/08 11:24 AM Page 118
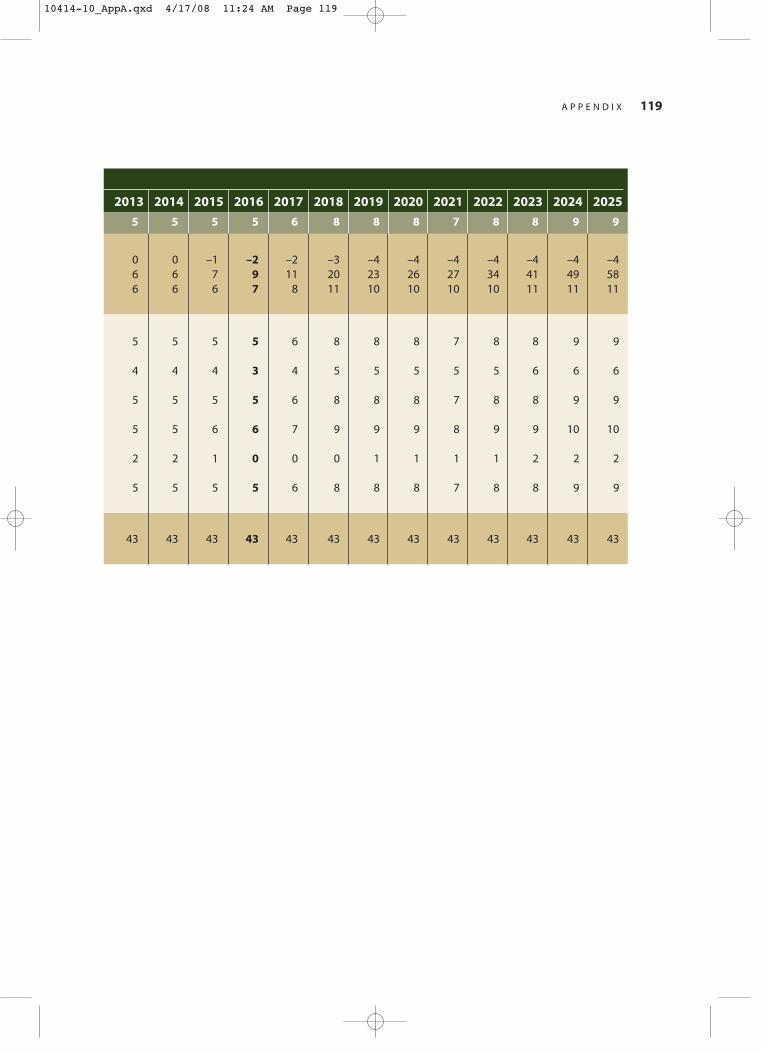
A P P E N D I X 119
5 5 5 5 6 8 8 8 7 8 8 9 9
0 0 –1 –2 –2 –3 –4 –4 –4 –4 –4 –4 –46 6 7 9 11 20 23 26 27 34 41 49 586 6 6 7 8 11 10 10 10 10 11 11 11
5 5 5 5 6 8 8 8 7 8 8 9 9
4 4 4 3 4 5 5 5 5 5 6 6 6
5 5 5 5 6 8 8 8 7 8 8 9 9
5 5 6 6 7 9 9 9 8 9 9 10 10
2 2 1 0 0 0 1 1 1 1 2 2 2
5 5 5 5 6 8 8 8 7 8 8 9 9
43 43 43 43 43 43 43 43 43 43 43 43 43
2013 2014 2015 2016 2017 2018 2019 2020 2021 2022 2023 2024 2025
10414-10_AppA.qxd 4/17/08 11:24 AM Page 119
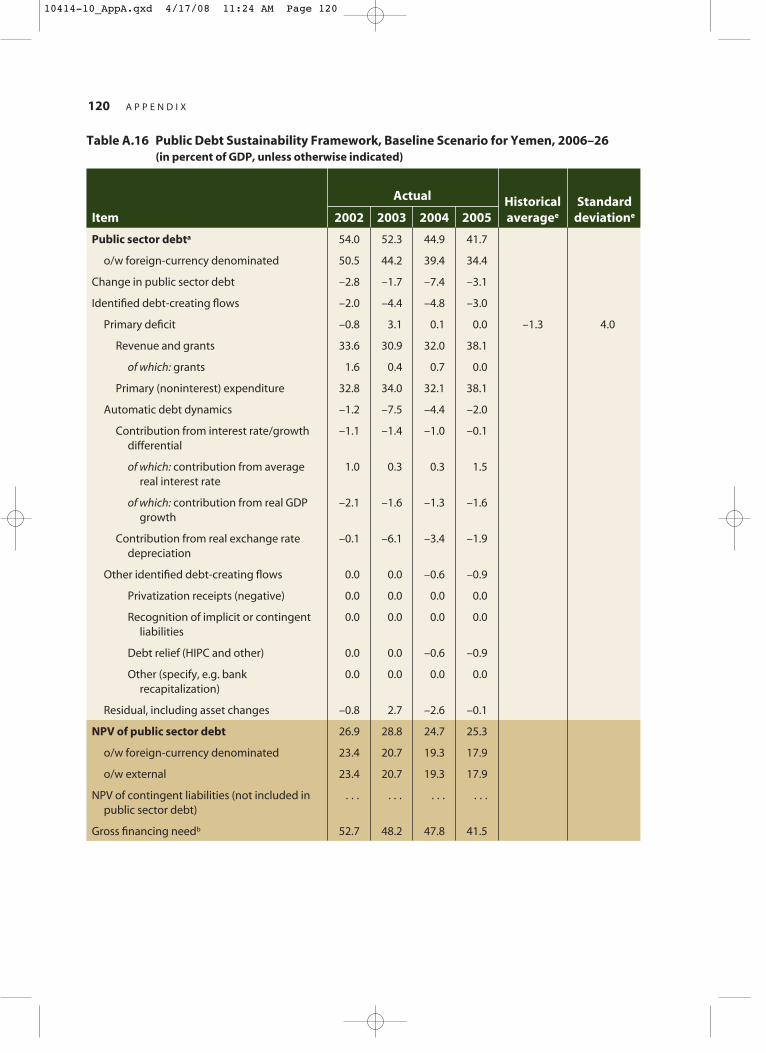
120 A P P E N D I X
Table A.16 Public Debt Sustainability Framework, Baseline Scenario for Yemen, 2006–26(in percent of GDP, unless otherwise indicated)
Actual Historical Standard Item 2002 2003 2004 2005 averagee deviatione
Public sector debta 54.0 52.3 44.9 41.7
o/w foreign-currency denominated 50.5 44.2 39.4 34.4
Change in public sector debt –2.8 –1.7 –7.4 –3.1
Identified debt-creating flows –2.0 –4.4 –4.8 –3.0
Primary deficit –0.8 3.1 0.1 0.0 –1.3 4.0
Revenue and grants 33.6 30.9 32.0 38.1
of which: grants 1.6 0.4 0.7 0.0
Primary (noninterest) expenditure 32.8 34.0 32.1 38.1
Automatic debt dynamics –1.2 –7.5 –4.4 –2.0
Contribution from interest rate/growth –1.1 –1.4 –1.0 –0.1differential
of which: contribution from average 1.0 0.3 0.3 1.5real interest rate
of which: contribution from real GDP –2.1 –1.6 –1.3 –1.6growth
Contribution from real exchange rate –0.1 –6.1 –3.4 –1.9depreciation
Other identified debt-creating flows 0.0 0.0 –0.6 –0.9
Privatization receipts (negative) 0.0 0.0 0.0 0.0
Recognition of implicit or contingent 0.0 0.0 0.0 0.0liabilities
Debt relief (HIPC and other) 0.0 0.0 –0.6 –0.9
Other (specify, e.g. bank 0.0 0.0 0.0 0.0recapitalization)
Residual, including asset changes –0.8 2.7 –2.6 –0.1
NPV of public sector debt 26.9 28.8 24.7 25.3
o/w foreign-currency denominated 23.4 20.7 19.3 17.9
o/w external 23.4 20.7 19.3 17.9
NPV of contingent liabilities (not included in . . . . . . . . . . . .public sector debt)
Gross financing needb 52.7 48.2 47.8 41.5
10414-10_AppA.qxd 4/17/08 11:24 AM Page 120
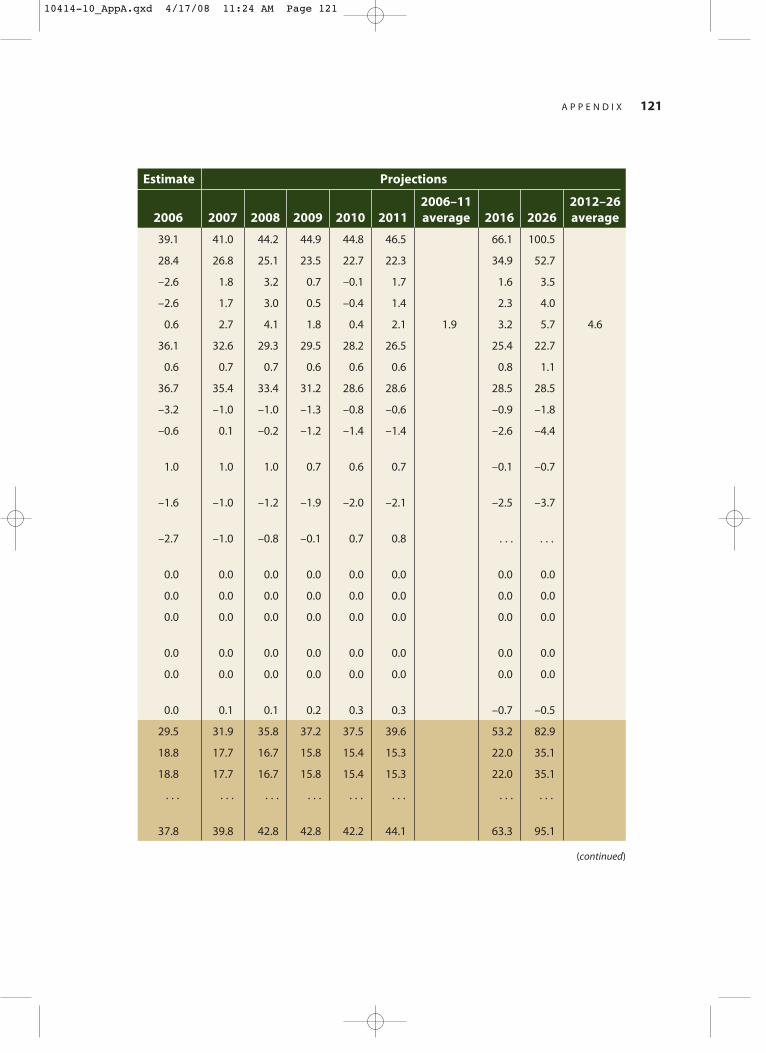
A P P E N D I X 121
Estimate Projections
2006–11 2012–262006 2007 2008 2009 2010 2011 average 2016 2026 average
39.1 41.0 44.2 44.9 44.8 46.5 66.1 100.5
28.4 26.8 25.1 23.5 22.7 22.3 34.9 52.7
–2.6 1.8 3.2 0.7 –0.1 1.7 1.6 3.5
–2.6 1.7 3.0 0.5 –0.4 1.4 2.3 4.0
0.6 2.7 4.1 1.8 0.4 2.1 1.9 3.2 5.7 4.6
36.1 32.6 29.3 29.5 28.2 26.5 25.4 22.7
0.6 0.7 0.7 0.6 0.6 0.6 0.8 1.1
36.7 35.4 33.4 31.2 28.6 28.6 28.5 28.5
–3.2 –1.0 –1.0 –1.3 –0.8 –0.6 –0.9 –1.8
–0.6 0.1 –0.2 –1.2 –1.4 –1.4 –2.6 –4.4
1.0 1.0 1.0 0.7 0.6 0.7 –0.1 –0.7
–1.6 –1.0 –1.2 –1.9 –2.0 –2.1 –2.5 –3.7
–2.7 –1.0 –0.8 –0.1 0.7 0.8 . . . . . .
0.0 0.0 0.0 0.0 0.0 0.0 0.0 0.0
0.0 0.0 0.0 0.0 0.0 0.0 0.0 0.0
0.0 0.0 0.0 0.0 0.0 0.0 0.0 0.0
0.0 0.0 0.0 0.0 0.0 0.0 0.0 0.0
0.0 0.0 0.0 0.0 0.0 0.0 0.0 0.0
0.0 0.1 0.1 0.2 0.3 0.3 –0.7 –0.5
29.5 31.9 35.8 37.2 37.5 39.6 53.2 82.9
18.8 17.7 16.7 15.8 15.4 15.3 22.0 35.1
18.8 17.7 16.7 15.8 15.4 15.3 22.0 35.1
. . . . . . . . . . . . . . . . . . . . . . . .
37.8 39.8 42.8 42.8 42.2 44.1 63.3 95.1
(continued)
10414-10_AppA.qxd 4/17/08 11:24 AM Page 121
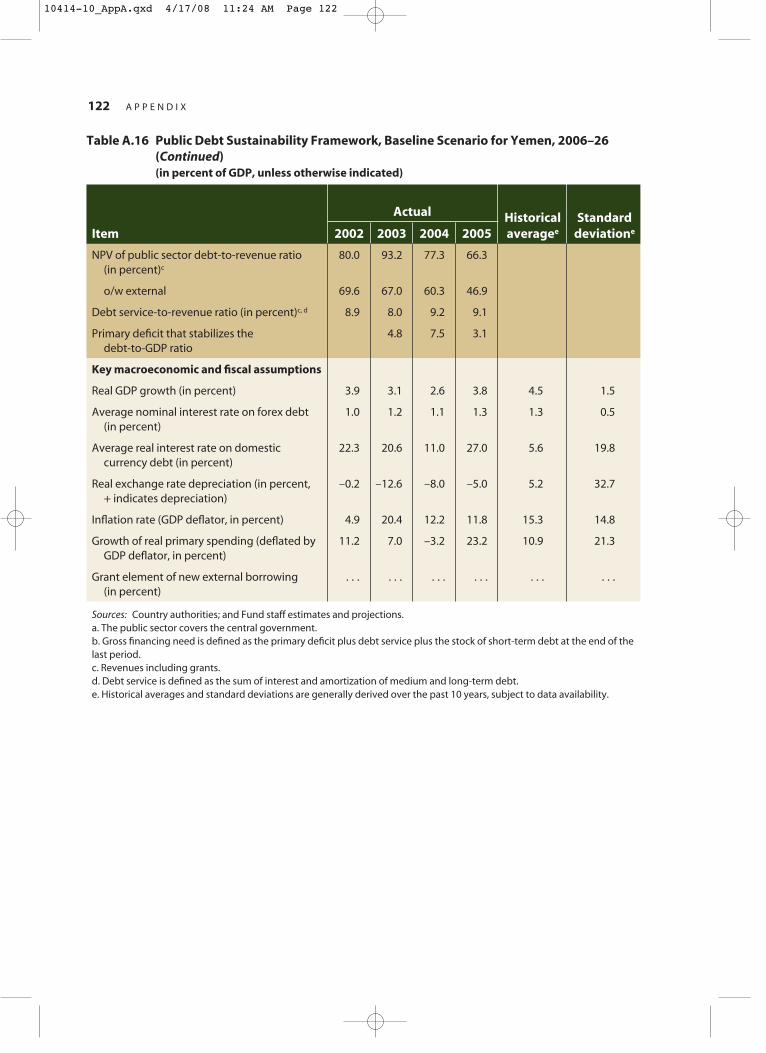
122 A P P E N D I X
NPV of public sector debt-to-revenue ratio 80.0 93.2 77.3 66.3(in percent)c
o/w external 69.6 67.0 60.3 46.9
Debt service-to-revenue ratio (in percent)c, d 8.9 8.0 9.2 9.1
Primary deficit that stabilizes the 4.8 7.5 3.1debt-to-GDP ratio
Key macroeconomic and fiscal assumptions
Real GDP growth (in percent) 3.9 3.1 2.6 3.8 4.5 1.5
Average nominal interest rate on forex debt 1.0 1.2 1.1 1.3 1.3 0.5(in percent)
Average real interest rate on domestic 22.3 20.6 11.0 27.0 5.6 19.8currency debt (in percent)
Real exchange rate depreciation (in percent, –0.2 –12.6 –8.0 –5.0 5.2 32.7+ indicates depreciation)
Inflation rate (GDP deflator, in percent) 4.9 20.4 12.2 11.8 15.3 14.8
Growth of real primary spending (deflated by 11.2 7.0 –3.2 23.2 10.9 21.3GDP deflator, in percent)
Grant element of new external borrowing . . . . . . . . . . . . . . . . . .(in percent)
Sources: Country authorities; and Fund staff estimates and projections.a. The public sector covers the central government.b. Gross financing need is defined as the primary deficit plus debt service plus the stock of short-term debt at the end of the last period.c. Revenues including grants.d. Debt service is defined as the sum of interest and amortization of medium and long-term debt.e. Historical averages and standard deviations are generally derived over the past 10 years, subject to data availability.
Table A.16 Public Debt Sustainability Framework, Baseline Scenario for Yemen, 2006–26 (Continued) (in percent of GDP, unless otherwise indicated)
Actual Historical Standard Item 2002 2003 2004 2005 averagee deviatione
10414-10_AppA.qxd 4/17/08 11:24 AM Page 122
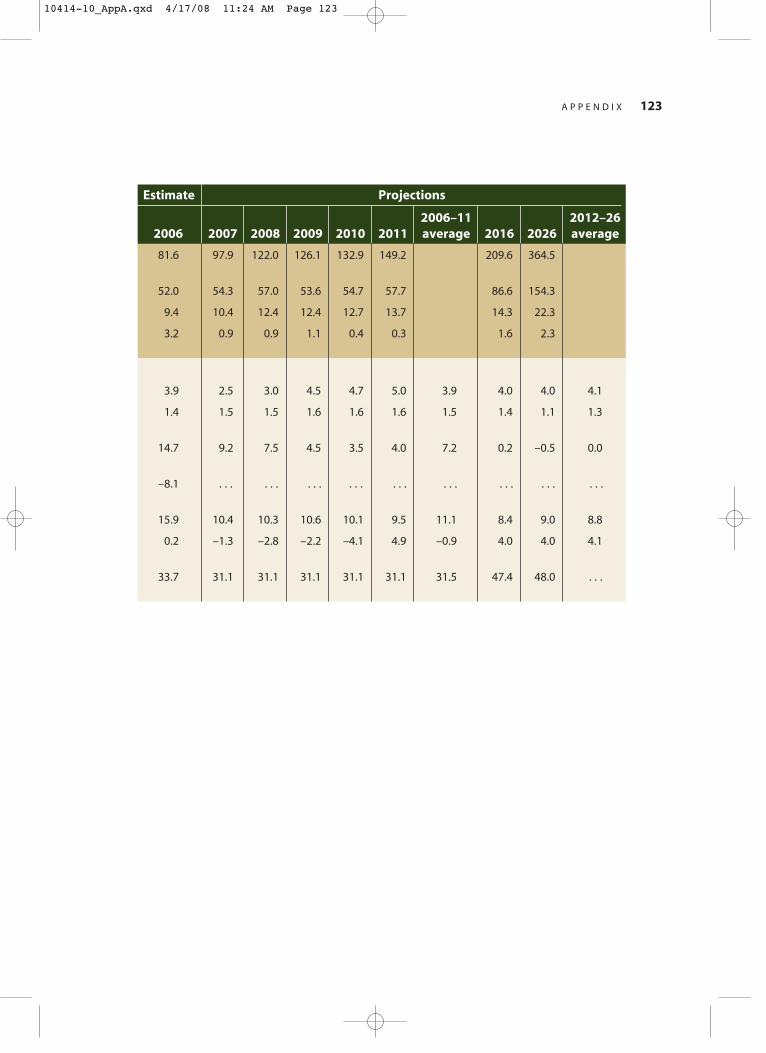
A P P E N D I X 123
81.6 97.9 122.0 126.1 132.9 149.2 209.6 364.5
52.0 54.3 57.0 53.6 54.7 57.7 86.6 154.3
9.4 10.4 12.4 12.4 12.7 13.7 14.3 22.3
3.2 0.9 0.9 1.1 0.4 0.3 1.6 2.3
3.9 2.5 3.0 4.5 4.7 5.0 3.9 4.0 4.0 4.1
1.4 1.5 1.5 1.6 1.6 1.6 1.5 1.4 1.1 1.3
14.7 9.2 7.5 4.5 3.5 4.0 7.2 0.2 –0.5 0.0
–8.1 . . . . . . . . . . . . . . . . . . . . . . . . . . .
15.9 10.4 10.3 10.6 10.1 9.5 11.1 8.4 9.0 8.8
0.2 –1.3 –2.8 –2.2 –4.1 4.9 –0.9 4.0 4.0 4.1
33.7 31.1 31.1 31.1 31.1 31.1 31.5 47.4 48.0 . . .
Estimate Projections
2006–11 2012–262006 2007 2008 2009 2010 2011 average 2016 2026 average
10414-10_AppA.qxd 4/17/08 11:24 AM Page 123

Projections
Item 2006 2007 2008 2009
Baseline—(NPV of debt-to-GDP ratio) 29 32 36 37
A. Alternative scenariosA1. Real GDP growth and primary balance are at historical averages 29 30 32 33A2. Primary balance is unchanged from 2006 29 31 33 34A3. Permanently lower GDP growtha 29 32 36 38A4. Permanently lower oil price from 2007 (20 percent decline) 29 36 37 39A5. No Adjustment Scenario 29 41 50 61
B. Bound testsB1. Real GDP growth is at historical average minus one standard deviations 29 32 35 37
in 2007–2008B2. Primary balance is at historical average minus one standard deviations 29 33 38 39
in 2007–2008B3. Combination of B1–B2 using one half standard deviation shocks 29 32 35 36B4. One-time 30 percent real depreciation in 2007 29 40 43 45B5. 10 percent of GDP increase in other debt-creating flows in 2007 29 38 41 42
Baseline—(NPV of debt-to-revenue ratiob) 82 98 122 126
A. Alternative scenariosA1. Real GDP growth and primary balance are at historical averages 82 93 109 113A2. Primary balance is unchanged from 2006 82 94 111 114A3. Permanently lower GDP growtha 82 98 123 128A4. Permanently lower oil price from 2007 (20 percent decline) 82 121 140 146A5. No Adjustment Scenario 82 138 200 261
B. Bound testsB1. Real GDP growth is at historical average minus one standard deviations 82 97 121 125
in 2007–2008B2. Primary balance is at historical average minus one standard deviations 82 102 128 132
in 2007–2008B3. Combination of B1–B2 using one half standard deviation shocks 82 97 118 123B4. One-time 30 percent real depreciation in 2007 82 123 148 151B5. 10 percent of GDP increase in other debt-creating flows in 2007 82 116 140 143
Baseline—(Debt service-to-revenue ratiob) 9 10 12 12
A. Alternative scenariosA1. Real GDP growth and primary balance are at historical averages 9 10 11 10A2. Primary balance is unchanged from 2006 9 10 11 10A3. Permanently lower GDP growtha 9 10 13 13A4. Permanently lower oil price from 2007 (20 percent decline) 9 11 13 13A5. No Adjustment Scenario 9 18 23 48
B. Bound testsB1. Real GDP growth is at historical average minus one standard deviations 9 10 12 12
in 2007–2008B2. Primary balance is at historical average minus one standard deviations 9 10 14 13
in 2007–2008B3. Combination of B1–B2 using one half standard deviation shocks 9 10 12 12B4. One-time 30 percent real depreciation in 2007 9 11 13 13B5. 10 percent of GDP increase in other debt-creating flows in 2007 9 10 19 14
Sources: Country authorities; and Fund staff estimates and projections.a. Assumes that real GDP growth is at baseline minus one standard deviation divided by the square root of 20 (i.e., the length of the projection period).b. Revenues are defined inclusive of grants.
Table A.17 Sensitivity Analysis for Key Indicators of Public Debt in Yemen, 2006–25
10414-10_AppA.qxd 4/17/08 11:24 AM Page 124
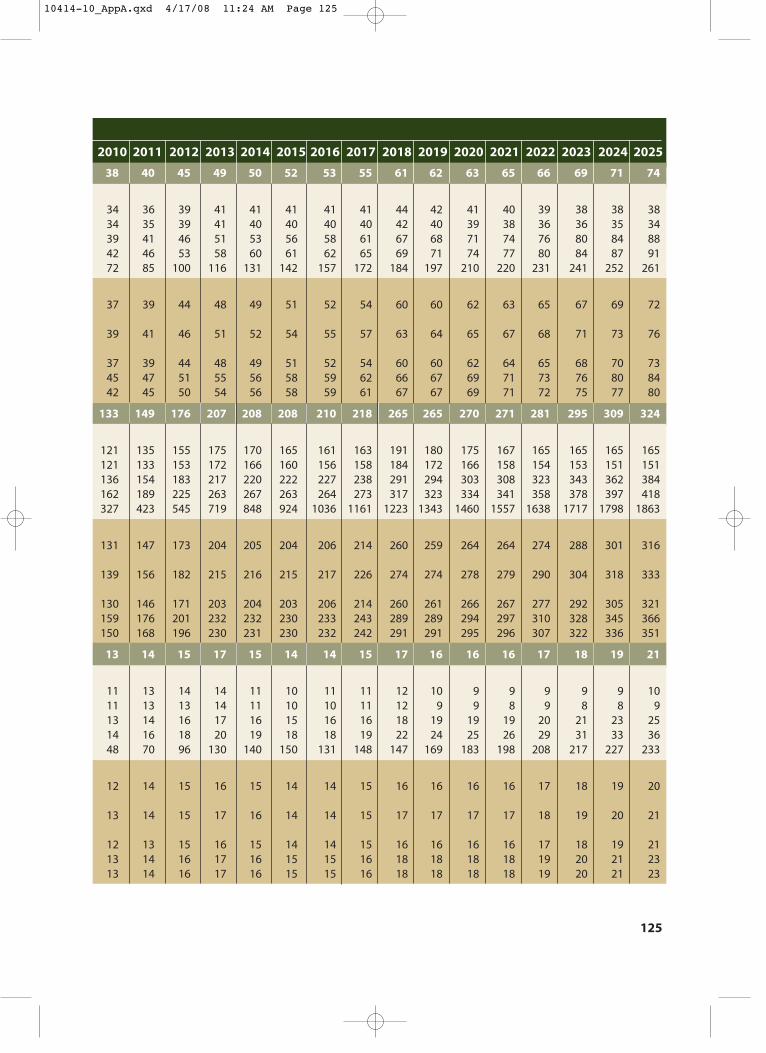
2010 2011 2012 2013 2014 2015 2016 2017 2018 2019 2020 2021 2022 2023 2024 2025
38 40 45 49 50 52 53 55 61 62 63 65 66 69 71 74
34 36 39 41 41 41 41 41 44 42 41 40 39 38 38 3834 35 39 41 40 40 40 40 42 40 39 38 36 36 35 3439 41 46 51 53 56 58 61 67 68 71 74 76 80 84 8842 46 53 58 60 61 62 65 69 71 74 77 80 84 87 9172 85 100 116 131 142 157 172 184 197 210 220 231 241 252 261
37 39 44 48 49 51 52 54 60 60 62 63 65 67 69 72
39 41 46 51 52 54 55 57 63 64 65 67 68 71 73 76
37 39 44 48 49 51 52 54 60 60 62 64 65 68 70 7345 47 51 55 56 58 59 62 66 67 69 71 73 76 80 8442 45 50 54 56 58 59 61 67 67 69 71 72 75 77 80
133 149 176 207 208 208 210 218 265 265 270 271 281 295 309 324
121 135 155 175 170 165 161 163 191 180 175 167 165 165 165 165121 133 153 172 166 160 156 158 184 172 166 158 154 153 151 151136 154 183 217 220 222 227 238 291 294 303 308 323 343 362 384162 189 225 263 267 263 264 273 317 323 334 341 358 378 397 418327 423 545 719 848 924 1036 1161 1223 1343 1460 1557 1638 1717 1798 1863
131 147 173 204 205 204 206 214 260 259 264 264 274 288 301 316
139 156 182 215 216 215 217 226 274 274 278 279 290 304 318 333
130 146 171 203 204 203 206 214 260 261 266 267 277 292 305 321159 176 201 232 232 230 233 243 289 289 294 297 310 328 345 366150 168 196 230 231 230 232 242 291 291 295 296 307 322 336 351
13 14 15 17 15 14 14 15 17 16 16 16 17 18 19 21
11 13 14 14 11 10 11 11 12 10 9 9 9 9 9 1011 13 13 14 11 10 10 11 12 9 9 8 9 8 8 913 14 16 17 16 15 16 16 18 19 19 19 20 21 23 2514 16 18 20 19 18 18 19 22 24 25 26 29 31 33 3648 70 96 130 140 150 131 148 147 169 183 198 208 217 227 233
12 14 15 16 15 14 14 15 16 16 16 16 17 18 19 20
13 14 15 17 16 14 14 15 17 17 17 17 18 19 20 21
12 13 15 16 15 14 14 15 16 16 16 16 17 18 19 2113 14 16 17 16 15 15 16 18 18 18 18 19 20 21 2313 14 16 17 16 15 15 16 18 18 18 18 19 20 21 23
125
10414-10_AppA.qxd 4/17/08 11:24 AM Page 125
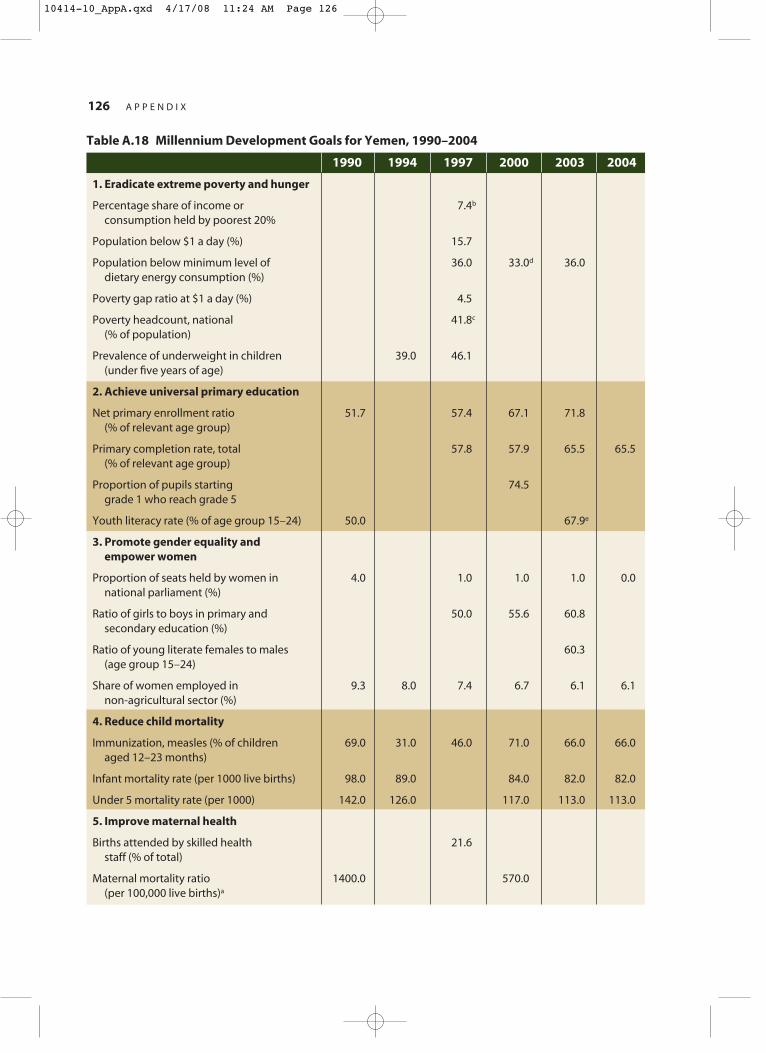
126 A P P E N D I X
Table A.18 Millennium Development Goals for Yemen, 1990–2004
1990 1994 1997 2000 2003 2004
1. Eradicate extreme poverty and hunger
Percentage share of income or 7.4b
consumption held by poorest 20%
Population below $1 a day (%) 15.7
Population below minimum level of 36.0 33.0d 36.0dietary energy consumption (%)
Poverty gap ratio at $1 a day (%) 4.5
Poverty headcount, national 41.8c
(% of population)
Prevalence of underweight in children 39.0 46.1(under five years of age)
2. Achieve universal primary education
Net primary enrollment ratio 51.7 57.4 67.1 71.8(% of relevant age group)
Primary completion rate, total 57.8 57.9 65.5 65.5(% of relevant age group)
Proportion of pupils starting 74.5grade 1 who reach grade 5
Youth literacy rate (% of age group 15–24) 50.0 67.9e
3. Promote gender equality and empower women
Proportion of seats held by women in 4.0 1.0 1.0 1.0 0.0national parliament (%)
Ratio of girls to boys in primary and 50.0 55.6 60.8secondary education (%)
Ratio of young literate females to males 60.3(age group 15–24)
Share of women employed in 9.3 8.0 7.4 6.7 6.1 6.1non-agricultural sector (%)
4. Reduce child mortality
Immunization, measles (% of children 69.0 31.0 46.0 71.0 66.0 66.0aged 12–23 months)
Infant mortality rate (per 1000 live births) 98.0 89.0 84.0 82.0 82.0
Under 5 mortality rate (per 1000) 142.0 126.0 117.0 113.0 113.0
5. Improve maternal health
Births attended by skilled health 21.6staff (% of total)
Maternal mortality ratio 1400.0 570.0(per 100,000 live births)a
10414-10_AppA.qxd 4/17/08 11:24 AM Page 126
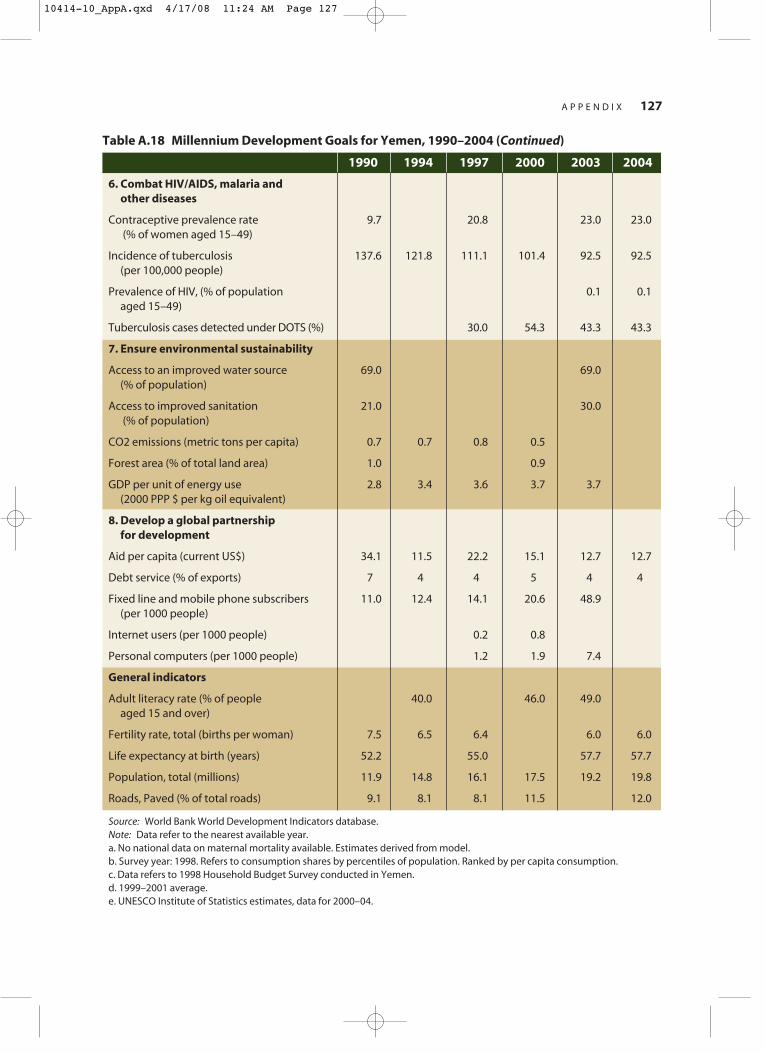
A P P E N D I X 127
Table A.18 Millennium Development Goals for Yemen, 1990–2004 (Continued)
1990 1994 1997 2000 2003 2004
6. Combat HIV/AIDS, malaria and other diseases
Contraceptive prevalence rate 9.7 20.8 23.0 23.0(% of women aged 15–49)
Incidence of tuberculosis 137.6 121.8 111.1 101.4 92.5 92.5(per 100,000 people)
Prevalence of HIV, (% of population 0.1 0.1aged 15–49)
Tuberculosis cases detected under DOTS (%) 30.0 54.3 43.3 43.3
7. Ensure environmental sustainability
Access to an improved water source 69.0 69.0(% of population)
Access to improved sanitation 21.0 30.0(% of population)
CO2 emissions (metric tons per capita) 0.7 0.7 0.8 0.5
Forest area (% of total land area) 1.0 0.9
GDP per unit of energy use 2.8 3.4 3.6 3.7 3.7(2000 PPP $ per kg oil equivalent)
8. Develop a global partnership for development
Aid per capita (current US$) 34.1 11.5 22.2 15.1 12.7 12.7
Debt service (% of exports) 7 4 4 5 4 4
Fixed line and mobile phone subscribers 11.0 12.4 14.1 20.6 48.9(per 1000 people)
Internet users (per 1000 people) 0.2 0.8
Personal computers (per 1000 people) 1.2 1.9 7.4
General indicators
Adult literacy rate (% of people 40.0 46.0 49.0aged 15 and over)
Fertility rate, total (births per woman) 7.5 6.5 6.4 6.0 6.0
Life expectancy at birth (years) 52.2 55.0 57.7 57.7
Population, total (millions) 11.9 14.8 16.1 17.5 19.2 19.8
Roads, Paved (% of total roads) 9.1 8.1 8.1 11.5 12.0
Source: World Bank World Development Indicators database.Note: Data refer to the nearest available year.a. No national data on maternal mortality available. Estimates derived from model.b. Survey year: 1998. Refers to consumption shares by percentiles of population. Ranked by per capita consumption.c. Data refers to 1998 Household Budget Survey conducted in Yemen.d. 1999–2001 average.e. UNESCO Institute of Statistics estimates, data for 2000–04.
10414-10_AppA.qxd 4/17/08 11:24 AM Page 127

128 A P P E N D I XTa
ble
A.1
9 P
rog
ress
un
der
th
e Fi
rst
Po
vert
y R
edu
ctio
n S
trat
egy
in Y
emen
, 20
03
–05
Pill
ars
Ach
ievi
ng
Eco
no
mic
gro
wth
Dev
elo
pin
gh
um
anre
sou
rces
Imp
rovi
ng
in
fras
tru
ctu
re
Ensu
rin
gso
cial
p
rote
ctio
n
Go
als
Imp
rove
men
t of r
eal G
DP
Red
uce
po
vert
y
Co
ntr
ol I
nfla
tio
nFi
scal
dis
cip
line
Incr
ease
bas
ic e
du
cati
on
en
rollm
ent
Imp
rove
hea
lth
Co
ntr
ol p
op
ula
tio
n g
row
thIm
pro
ve w
ater
an
d s
anit
atio
n s
ervi
ces
Incr
ease
co
vera
ge
of e
lect
rict
y se
rvic
es
Co
nn
ecti
ng
rura
l are
as to
mar
kets
an
dea
sy a
cces
s to
ser
vice
s th
rou
gh
exp
ansi
on
of r
oad
net
wo
rkRe
info
rce
role
of s
oci
al w
elfa
re
Exp
ansi
on
of p
ensi
on
co
vera
ge
Ind
icat
ors
GD
P g
row
thN
on
-oil
GD
P g
row
thPe
rcap
ita
GD
P g
row
thH
ead
co
un
t rat
io
Co
nsu
mer
pri
ce in
dex
Ove
rall
fisca
l bal
ance
Bas
ic e
du
cati
on
en
rollm
ent
Mat
ern
al m
ort
alit
y (p
er 1
00,0
00 b
irth
s)In
fan
t mo
rtal
ity
(per
100
0)U
nd
er-fi
ve m
ort
alit
y (p
er 1
000)
Fert
ility
Incr
ease
hea
lth
car
e co
vera
ge
Pop
ula
tio
n g
row
th ra
teC
ove
rag
e o
f pu
blic
wat
er n
etw
ork
s
Pop
ula
tio
n w
ith
po
wer
fro
m th
e n
atio
nal
gri
dEl
ectr
icit
y lo
sses
Asp
hal
ted
road
s (in
km
)Re
hab
ilita
ted
asp
hal
t ro
ads
(in k
m)
Road
s u
nd
erg
oin
g ro
uti
ne
mai
nte
nan
ce(in
km
)N
um
ber
of b
enefi
ciar
ies
(in th
ou
san
ds)
Nu
mb
er c
ove
red
(in
tho
usa
nd
s)
Nu
mb
er o
f pen
sio
ner
s (in
tho
usa
nd
s)
Tota
lU
rban
Rura
l
Tota
lM
ale
Fem
ale
Urb
anRu
ral
Tota
lU
rban
Rura
l
Pub
lic s
ecto
rPr
ivat
e se
cto
rPu
blic
sec
tor
Priv
ate
sect
or
Targ
et 4.7
6.3
1.5
38.0
26.1
41.6
10.0
–4.0
67.6
81.2
52.7
314.
061
.584
.1 5.3
63.8 3.1
68.0
32.0
38.5
28.0
96.9
22.0
2050
.023
3.0
2143
.057
0.0
450.
966
.056
.1 5.7
Act
ual
2.
84.
0–0
.338
.824
.443
.112
.0–2
.068
.982
.053
.336
5.0
84.3
99.8 5.8
63.0 3.0
62.4
34.0
37.0
25.8
88.0
21.0
1436
.025
6.0
7617
.065
0.0
474.
971
.159
.9 2.3
Stat
us
20
04
Not
es:
1. T
he
actu
al fi
gu
res
un
der
the
imp
rove
men
t of r
eal G
DP
ind
icat
ors
refe
r to
the
aver
age
gro
wth
rate
s o
ver t
he
per
iod
200
2-04
.2.
Po
vert
y n
um
ber
s fo
r 200
4 ar
e st
aff e
stim
ates
.3.
In th
e st
atu
s co
lum
n, r
ed re
fers
to ta
rget
no
t bei
ng
met
an
d g
rey
ind
icat
es ta
rget
bei
ng
met
or e
xcee
ded
.4.
Ove
rall
fisca
l bal
ance
is o
n c
om
mit
men
ts b
asis
an
d in
clu
des
gra
nts
.5.
Fig
ure
s in
per
cen
tag
es u
nle
ss o
ther
wis
e st
ated
.So
urce
:PR
SP A
nn
ual
Pro
gre
ss R
epo
rt, 2
003–
2004
an
d S
taff
est
imat
es.
10414-10_AppA.qxd 4/17/08 11:24 AM Page 128
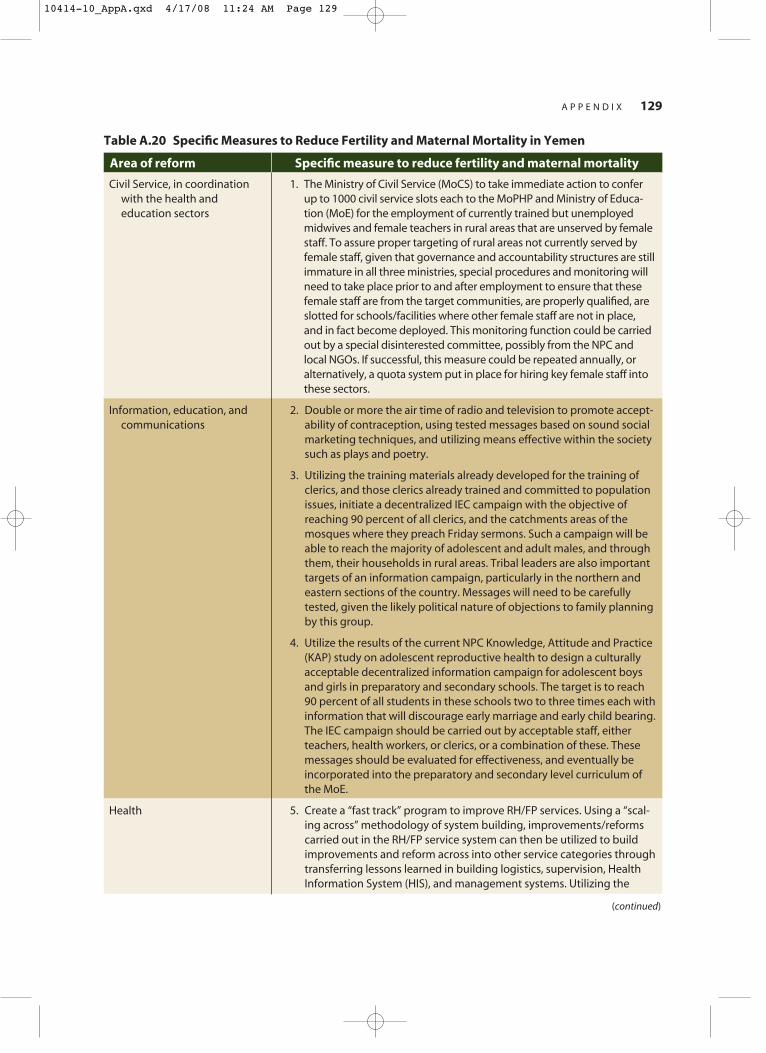
A P P E N D I X 129
Table A.20 Specific Measures to Reduce Fertility and Maternal Mortality in Yemen
Area of reform Specific measure to reduce fertility and maternal mortality
Civil Service, in coordination with the health and education sectors
Information, education, andcommunications
Health
1. The Ministry of Civil Service (MoCS) to take immediate action to conferup to 1000 civil service slots each to the MoPHP and Ministry of Educa-tion (MoE) for the employment of currently trained but unemployedmidwives and female teachers in rural areas that are unserved by femalestaff. To assure proper targeting of rural areas not currently served byfemale staff, given that governance and accountability structures are stillimmature in all three ministries, special procedures and monitoring willneed to take place prior to and after employment to ensure that thesefemale staff are from the target communities, are properly qualified, areslotted for schools/facilities where other female staff are not in place,and in fact become deployed. This monitoring function could be carriedout by a special disinterested committee, possibly from the NPC andlocal NGOs. If successful, this measure could be repeated annually, oralternatively, a quota system put in place for hiring key female staff intothese sectors.
2. Double or more the air time of radio and television to promote accept-ability of contraception, using tested messages based on sound socialmarketing techniques, and utilizing means effective within the societysuch as plays and poetry.
3. Utilizing the training materials already developed for the training ofclerics, and those clerics already trained and committed to populationissues, initiate a decentralized IEC campaign with the objective ofreaching 90 percent of all clerics, and the catchments areas of themosques where they preach Friday sermons. Such a campaign will beable to reach the majority of adolescent and adult males, and throughthem, their households in rural areas. Tribal leaders are also importanttargets of an information campaign, particularly in the northern andeastern sections of the country. Messages will need to be carefullytested, given the likely political nature of objections to family planningby this group.
4. Utilize the results of the current NPC Knowledge, Attitude and Practice(KAP) study on adolescent reproductive health to design a culturallyacceptable decentralized information campaign for adolescent boysand girls in preparatory and secondary schools. The target is to reach90 percent of all students in these schools two to three times each withinformation that will discourage early marriage and early child bearing.The IEC campaign should be carried out by acceptable staff, eitherteachers, health workers, or clerics, or a combination of these. Thesemessages should be evaluated for effectiveness, and eventually beincorporated into the preparatory and secondary level curriculum ofthe MoE.
5. Create a “fast track” program to improve RH/FP services. Using a “scal-ing across” methodology of system building, improvements/reformscarried out in the RH/FP service system can then be utilized to buildimprovements and reform across into other service categories throughtransferring lessons learned in building logistics, supervision, HealthInformation System (HIS), and management systems. Utilizing the
(continued)
10414-10_AppA.qxd 4/17/08 11:24 AM Page 129
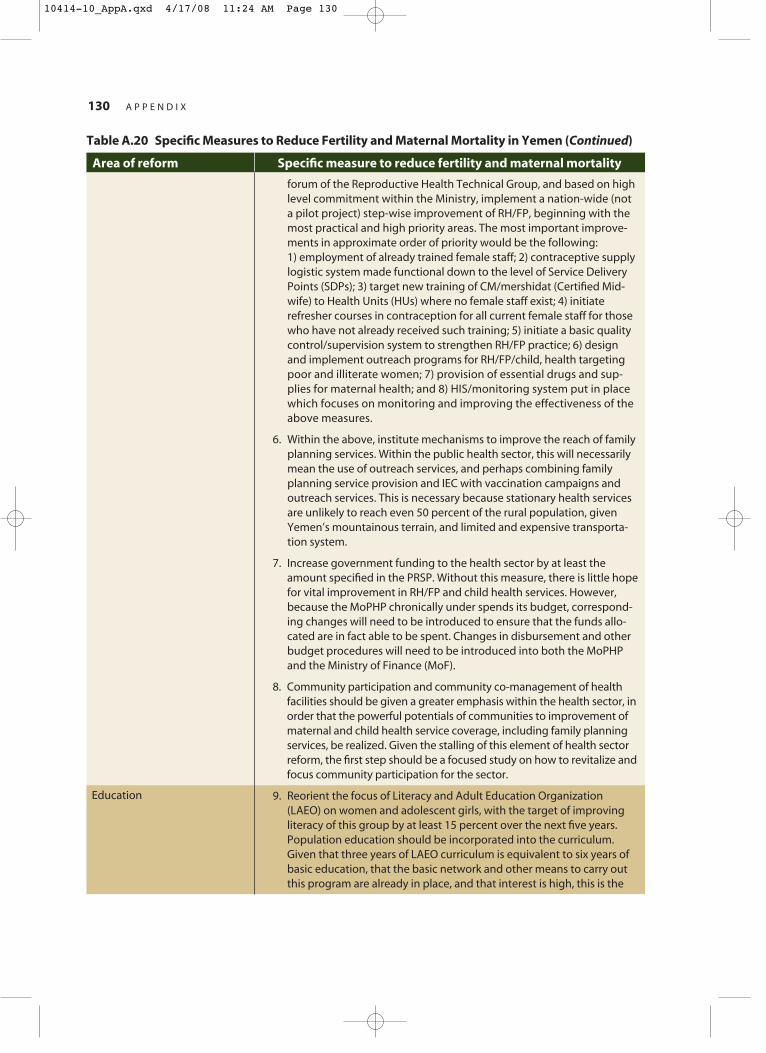
130 A P P E N D I X
Table A.20 Specific Measures to Reduce Fertility and Maternal Mortality in Yemen (Continued)Area
Area of reform Specific measure to reduce fertility and maternal mortality
Education
forum of the Reproductive Health Technical Group, and based on highlevel commitment within the Ministry, implement a nation-wide (nota pilot project) step-wise improvement of RH/FP, beginning with themost practical and high priority areas. The most important improve-ments in approximate order of priority would be the following: 1) employment of already trained female staff; 2) contraceptive supplylogistic system made functional down to the level of Service DeliveryPoints (SDPs); 3) target new training of CM/mershidat (Certified Mid-wife) to Health Units (HUs) where no female staff exist; 4) initiaterefresher courses in contraception for all current female staff for thosewho have not already received such training; 5) initiate a basic qualitycontrol/supervision system to strengthen RH/FP practice; 6) designand implement outreach programs for RH/FP/child, health targetingpoor and illiterate women; 7) provision of essential drugs and sup-plies for maternal health; and 8) HIS/monitoring system put in placewhich focuses on monitoring and improving the effectiveness of theabove measures.
6. Within the above, institute mechanisms to improve the reach of familyplanning services. Within the public health sector, this will necessarilymean the use of outreach services, and perhaps combining familyplanning service provision and IEC with vaccination campaigns andoutreach services. This is necessary because stationary health servicesare unlikely to reach even 50 percent of the rural population, givenYemen’s mountainous terrain, and limited and expensive transporta-tion system.
7. Increase government funding to the health sector by at least theamount specified in the PRSP. Without this measure, there is little hopefor vital improvement in RH/FP and child health services. However,because the MoPHP chronically under spends its budget, correspond-ing changes will need to be introduced to ensure that the funds allo-cated are in fact able to be spent. Changes in disbursement and otherbudget procedures will need to be introduced into both the MoPHPand the Ministry of Finance (MoF).
8. Community participation and community co-management of healthfacilities should be given a greater emphasis within the health sector, inorder that the powerful potentials of communities to improvement ofmaternal and child health service coverage, including family planningservices, be realized. Given the stalling of this element of health sectorreform, the first step should be a focused study on how to revitalize andfocus community participation for the sector.
9. Reorient the focus of Literacy and Adult Education Organization(LAEO) on women and adolescent girls, with the target of improvingliteracy of this group by at least 15 percent over the next five years.Population education should be incorporated into the curriculum.Given that three years of LAEO curriculum is equivalent to six years ofbasic education, that the basic network and other means to carry outthis program are already in place, and that interest is high, this is the
10414-10_AppA.qxd 4/17/08 11:24 AM Page 130
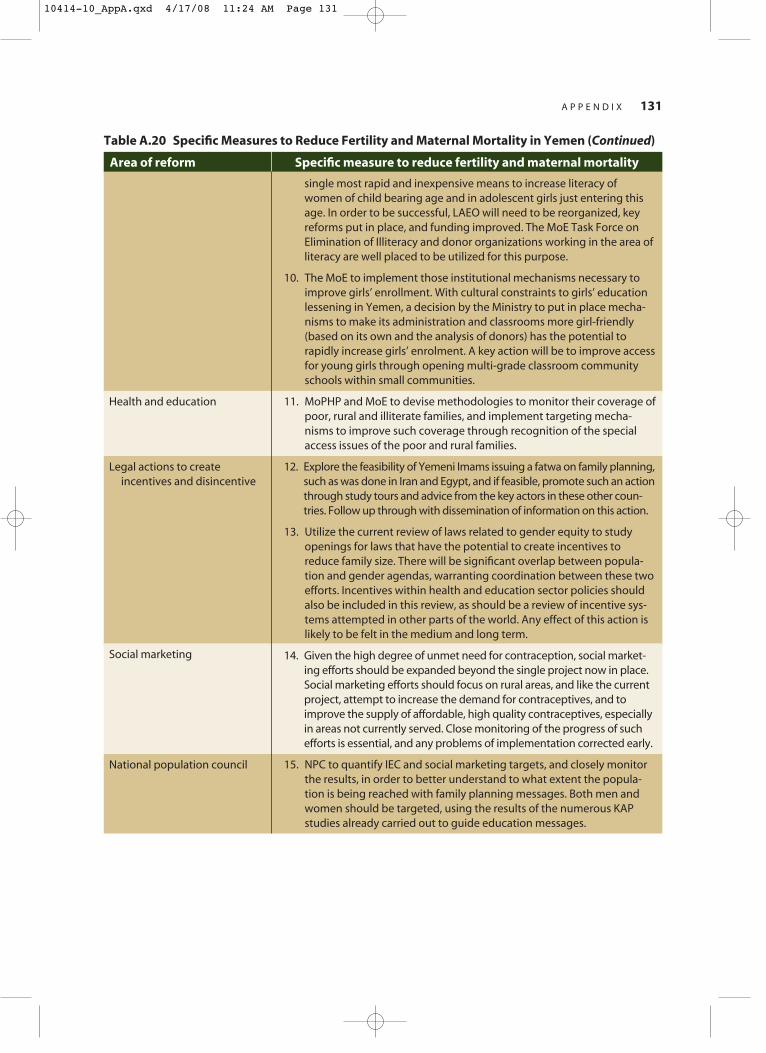
A P P E N D I X 131
Area of reform Specific measure to reduce fertility and maternal mortality
Health and education
Legal actions to create incentives and disincentive
Social marketing
National population council
single most rapid and inexpensive means to increase literacy ofwomen of child bearing age and in adolescent girls just entering thisage. In order to be successful, LAEO will need to be reorganized, keyreforms put in place, and funding improved. The MoE Task Force onElimination of Illiteracy and donor organizations working in the area ofliteracy are well placed to be utilized for this purpose.
10. The MoE to implement those institutional mechanisms necessary toimprove girls’ enrollment. With cultural constraints to girls’ educationlessening in Yemen, a decision by the Ministry to put in place mecha-nisms to make its administration and classrooms more girl-friendly(based on its own and the analysis of donors) has the potential torapidly increase girls’ enrolment. A key action will be to improve accessfor young girls through opening multi-grade classroom communityschools within small communities.
11. MoPHP and MoE to devise methodologies to monitor their coverage ofpoor, rural and illiterate families, and implement targeting mecha-nisms to improve such coverage through recognition of the specialaccess issues of the poor and rural families.
12. Explore the feasibility of Yemeni Imams issuing a fatwa on family planning,such as was done in Iran and Egypt, and if feasible, promote such an actionthrough study tours and advice from the key actors in these other coun-tries. Follow up through with dissemination of information on this action.
13. Utilize the current review of laws related to gender equity to studyopenings for laws that have the potential to create incentives toreduce family size. There will be significant overlap between popula-tion and gender agendas, warranting coordination between these twoefforts. Incentives within health and education sector policies shouldalso be included in this review, as should be a review of incentive sys-tems attempted in other parts of the world. Any effect of this action islikely to be felt in the medium and long term.
14. Given the high degree of unmet need for contraception, social market-ing efforts should be expanded beyond the single project now in place.Social marketing efforts should focus on rural areas, and like the currentproject, attempt to increase the demand for contraceptives, and toimprove the supply of affordable, high quality contraceptives, especiallyin areas not currently served. Close monitoring of the progress of suchefforts is essential, and any problems of implementation corrected early.
15. NPC to quantify IEC and social marketing targets, and closely monitorthe results, in order to better understand to what extent the popula-tion is being reached with family planning messages. Both men andwomen should be targeted, using the results of the numerous KAPstudies already carried out to guide education messages.
Table A.20 Specific Measures to Reduce Fertility and Maternal Mortality in Yemen (Continued)
10414-10_AppA.qxd 4/17/08 11:24 AM Page 131

10414-10_AppA.qxd 4/17/08 11:24 AM Page 132