yeșilköy/ayios andronikos aquifer groundwater … aquifer...yeșilköy/ayios andronikos aquifer...
TRANSCRIPT

Yeșilköy/Ayios Andronikos Aquifer Groundwater Model Technical Report
USAID Contract No. EPP -1-00-03-00013-00 Task Order No. 6 Date: November 19, 2007 Prepared by: Daene McKinney and Phil Brown
Yeșilköy Aquifer Groundwater Model Technical Report
Yeșilköy/Ayios Andronikos Aquifer Groundwater Model Technical Report
Supporting Activities that Value the Environment (SAVE) Project Tel: (+90) 392 228 1925 Tel: (+357) 227 707 57 Fax: (+90) 392 228 1756 www.save-irg.com [email protected]
International Resources Group 1211 Connecticut Avenue, NW, Suite 700 Washington, DC 20036 Ph: 202-289-0100; Fax: 202-289-7601 www.irgltd.com Cover Photo: Aerial View of the aquifer test location DISCLAIMER This report is made possible by the support of the American People through the United States Agency for International Development (USAID). The contents of this report are the sole responsibility of International Resources Group (IRG) and do not necessarily reflect the views of USAID or the United States Government. Like all USAID funded programs in Cyprus, SAVE is committed to strengthening conditions that foster a durable settlement. SAVE activities work to build capacity within the Turkish Cypriot community to better protect and manage the island’s natural and cultural resources within the overall framework of the USAID assistance goals. This document is intended to facilitate SAVE’s work. All references within it to Turkish Cypriot authorities or governing entities and/or place names are for reference purposes only and are meant to convey meaning. They should not be interpreted as implying or indicating any political recognition or change in longstanding USAID policy.

Yeșilköy Aquifer Groundwater Model Technical Report
Table of Contents 1 Executive Summary ..............................................................................................................1 2 Introduction ...........................................................................................................................1
2.1 Study Area...............................................................................................................1 2.2 Hydrogeology .........................................................................................................5 2.3 Water Quality ........................................................................................................8 2.4 Conceptual Hydrogeologic Model.................................................................. 11
3 Model Development ......................................................................................................... 16 3.1 The Model ............................................................................................................ 16 3.2 The Model Grid .................................................................................................. 18 3.3 Recharge Data ..................................................................................................... 22
4 Results .................................................................................................................................. 23 4.1 Initial Conditions................................................................................................. 23 4.2 Baseline Results................................................................................................... 24
Conclusion .............................................................................................................................. 28 References .............................................................................................................................. 29
Yeșilköy Aquifer Groundwater Model Technical Report
Acronyms cm centimeters EC European Commission EU European Union GCC Greek Cypriot Community GIS Geographic Information Systems GV Groundwater Vistas, aquifer modeling software IRG International Resources Group m meters SAVE USAID Project, “Supporting Activities that Value the Environment” TCC Turkish Cypriot Community
Yeșilköy Aquifer Groundwater Model Technical Report
Place Names1 Adaçay Melanarka Avtepe Ayios Symeon Bafra Voukolidha Boltașlı Lythrangomi Bostancı Zodhia Çamlıbel Myrtou Çayırova Ayios Seryios Dali Dhali Derince Vathylakas Değirmenlik Kythrea Esenköy Kilanemos Gelincik Vasili Gürpınar Ayia Marina Kaleburnu Galinoporni Kumyalı Koma tou Yialou Kuruova Korovia Mesarya Mesaoria Pamuklu Tavros Sipahi Ayia Trias Tașlıca Neta Tașpınar Angolemi Yeni Erenköy Yialousa Yeșilköy Ayios Andronikos Ziyamet Leonarisso
1 For ease of reference throughout the body of the report, place names will be referenced using both their Turkish and Greek names the first time they appear in the body of the report, and from that point forward only the Turkish name will be used. All respective place names are presented here to serve as a guide throughout the report.

Yeșilköy Aquifer Groundwater Model Technical Report
1
1 Executive Summary The Supporting Activities that Value the Environment (SAVE) Project works to build local capacity to better protect and manage Cyprus’ valuable natural and cultural resources. SAVE is part of the USAID/Cyprus assistance program undertaken to support economic growth in the Turkish Cypriot Community. It is one of the ways in which USAID/Cyprus implements its overall strategy to contribute to reunification and a political settlement by bridging the distance and addressing the gaps between the Turkish Cypriot Community (TCC) and the Greek Cypriot Community (GCC). The overall Mission strategic objective is: conditions to foster a durable settlement in Cyprus are strengthened. The SAVE Project is a vital component of the overall USAID/Cyprus program and specifically supports Intermediate Result 2: increased parity of economic opportunity. Background Water resources in Cyprus are composed of renewable sources that depend on annual precipitation and recharge of groundwater and non-renewable groundwater. For several decades, Cypriots have “mined” the groundwater reserve in order to satisfy demands that far exceed the sustainable supply of renewable water resources. The SAVE (Supporting Activities that Value the Environment) Project has supported capacity building efforts among local water, geology and mining experts in classroom and field-based training in groundwater management. SAVE has also designed an aquifer testing program and provided training in the use of pump tests to determine safe yields – the volume of groundwater that can be extracted on a sustainable basis. This report summarizes recent SAVE efforts to build capacity among TCC specialists in the use of groundwater modeling and GIS software to simulate and evaluate aquifer characteristics and behavior under alternative assumptions of precipitation, recharge, and withdrawals. The assistance was designed to help increase understanding of aquifer systems, facilitate long range planning and groundwater management, and improve understanding of the agricultural water situation. The full report provides a detailed description of the study area, Yeșilköy (Ayios Andronikos), the hydrogeology and water quality of the aquifer, the conceptual model, the development of the model for Yeșilköy Aquifer, and the results of the modeling effort. The results and a brief overview of the report are provided below.
Results A groundwater simulation model, using the software program MODFLOW, was developed for the aquifer by SAVE and participants in a series of side-by-side training sessions starting in May 2006. Data provided from the ENVIS database and the local authorities along with the results of a pumping test were used to parameterize the model. The model was “run” for a three-year period using climate data from 2003-2005. The team specified an aquifer recharge rate of 30%

Yeșilköy Aquifer Groundwater Model Technical Report
2
and made an assumption on the pumping rate of 3 million cubic meters per year (1 million m3/year for drinking water and 2 million m3/year for irrigation).
The model indicates that the level of the groundwater in the confined area of the aquifer (pumping depth) declines by about one meter per year under the set of assumptions used for the simulations. This result corroborates evidence of at least a 5 meter decline in groundwater levels since 1990 and anecdotal evidence that many irrigation wells are dry by early summer. These results are very preliminary. If the model is to be used for analysis and planning, it needs to be strengthened by improving the data through a detailed well survey, conducting additional pumping tests (only one pumping test was conducted for the exercise), and recalibrating the model. Study Area The 11 square kilometer Yeșilköy Aquifer was selected as the study area for the development of the groundwater model. The aquifer is situated above the village of Yeșilköy on the Karpaz peninsula in Cyprus. This aquifer is one of the seven major aquifers in the TCC. The topography of the area varies with an average elevation around 200 meters above sea level. The area has a Mediterranean climate with hot, dry summers and warm, rainy winters. Rainfall is quite variable from year to year and averages around 500 mm/year. The area’s vegetation includes cultivated crops, ornamental plants around residential dwellings, Mediterranean grasses and shrubs, and pine forests.
Water supply for the area, both domestic and agricultural, is provided from groundwater pumped from the underlying aquifer. The population of the region in 1996 was about 7,150 persons (personal communication with local waterworks authorities, 2006). Six regional water supply wells are operated by local staff, and provide about 1 million m3 of water per year to Yeșilköy and 17 smaller villages. Water quality data from 2002 indicates that the water is potable and suitable for domestic uses. Including the six regional wells, there are about 130 wells operating in the aquifer, about 90% of which are privately owned.
About 150 farmers are active in the area. Potatoes are the most common crop in the area. Potatoes are planted in January and harvested in May, and irrigation occurs from January to May (depending on rainfall). Irrigated farming, except for potatoes, has been decreasing in recent years due to various market forces. Farmers irrigate crops with sprinkler systems as opposed to drip irrigation. Aquifer Characteristics Based on annual rainfall of 500 mm, the surface area above the Yeșilköy Aquifer receives approximately 5.2 million m3 of water. Only about 30% (and likely less) of annual rainfall recharges the aquifer with the bulk of rainfall draining to the Mediterranean, evaporating at the surface, or taken up by plants and trees. Thus, annual recharge to the aquifer is around 1.6 million m3 per year. Pumping rates and duration as well as seasonality are dependent on precipitation, types of crops, and other factors. Pumping rates are not known with precision but are estimated to be 3 million cubic meters per year: 1 million m3/year for domestic water supply and 2 million m3/year for irrigation. Estimates of pumping rates substantially exceed

Yeșilköy Aquifer Groundwater Model Technical Report
3
recharge rates and indicate that extractions exceed safe yield levels. This conclusion is corroborated by the observed drop in water levels in the aquifer throughout the basin by an average of 5 meters since 1990. Model In order to develop a better understanding of the groundwater system in Yeșilköy, SAVE selected the computer software package MODFLOW to use in modeling the aquifer. MODFLOW is the most popular program for developing numerical groundwater simulation models (USGS, 1988). MODFLOW is a flexible modeling program that can simulate groundwater flows (vertical, horizontal, steady, and non-steady) under varying assumptions about the geology and hydraulic characteristics of the aquifer and external stresses such as extraction wells, recharge, evapotranspiration, drains, and river beds. Groundwater flow equations are used to develop system water balances, water level maps, and other important information including the impacts of pumping and changes in recharge to the system. For ease of use, Groundwater Vistas, which is a Windows-based graphical user interface for 3-D groundwater flow modeling, was used. Specification of the model for Yeșilköy Aquifer benefited from the availability of data in the ENVIS data base, other information on the aquifer, and a pumping test conducted in April 2007 as part of SAVE’s side-by-side training program. To represent the aquifer numerically, the area was divided into a 90m x 90m grid with three layers representing the geology of the site. The model grid was laid out on a 6km by 6km area surrounding and enclosing the aquifer. Three layers are used to represent the aquifer structure:
(1) an unconfined layer to model the area between the ground surface and the top of the confining layer;
(2) a layer for the confining formation; and (3) a (water-bearing) confined layer for the aquifer formation.
For the modeling effort, Groundwater Vistas allows the placement of wells at various locations throughout the aquifer. Because of limited information on pumping rates, model grids cells were used to represent composite pumping rates. Various scenarios were simulated. To match our understanding of the potentiometric surface2 of the aquifer, a steady-state simulation was made to match water levels during a period of limited pumping. To understand the effects of seasonal recharge and pumping, a transient model was developed. The shape of the aquifer is similar to a bowl and controlled by the topography. For the most part, except near pumping centers, the potentiometric surface is relatively flat sloping down the valley. Recharge is primarily from precipitation and infiltration of excess irrigation water. Water levels are believed to rise during the rainy season (mid-November to mid-March). Discharge mainly occurrs via wells. Spring and underflow occur down-valley and act as a drain to the system when water levels are high.
2 potentiometric surface: an imaginary surface formed by measuring the level to which water will rise in wells of a particular aquifer

Yeșilköy Aquifer Groundwater Model Technical Report
4
Water level, water quality, and aquifer test data indicate that groundwater flow is controlled by the topography of the basin with flow from the upper reaches of the basin to its outlet at the sea. The aquifer is under a semi-confined condition which means that there is a leaky confining clay or impermeable layer above the aquifer which effectively confines the system with the underlying marl3 aquitard4. At this time, water quality in the aquifer gives us some idea about the groundwater flow in the aquifer. The water in the southeast portions of the aquifer is dominated by sodium and chloride and the middle portion of the aquifer is dominated by calcium, chloride, and carbonate. This indicates that a fault on the southeast side of the aquifer may restrict flow, allowing more retention time up gradient from the fault, causing a buildup of salts in the water. Next Steps The SAVE Project has supported capacity building efforts in groundwater management, aquifer testing and pump testing to assist in determining sustainable yields of aquifers. Summarized here are recent SAVE efforts at capacity building in the use of aquifer modeling. Next steps in this effort include further assistance to increase understanding of modeling fundamentals, continued application of this knowledge in groundwater management and assistance to the agricultural community through the development of groundwater management plans. These ongoing capacity building efforts have the overall objective of enabling the TCC specialists to carry on this work strengthening the current model and developing their own good models for the other aquifers.
3 Marl: a granular or loosely consolidated, earthly material composed largely of calcium carbonate such as seashell fragments. It contains varying amounts of silt and organic matter 4 Aquitard: a confining bed and/or formation composed of rock or sediment that retards but does not prevent the flow of water to or from an adjacent aquifer

Yeșilköy Aquifer Groundwater Model Technical Report
1
2 Introduction The Supporting Activities that Value the Environment (SAVE) project has supported capacity building for groundwater management, aquifer evaluation and sustainability analysis in the TCC for the past two years. In this time, the project has provided various classroom instruction and side-by-side training in field monitoring and data collection, computer modeling, database usage, water quality sampling and analysis, and pumping test design and analysis. The development of a computer model for the Yeșilköy aquifer is described here. The model developed is intended to be used to promote the understanding of, and aid in the development of, efficient and sustainable water management options for the aquifer. In addition, it is intended to serve as a capacity building tool so that the relevant water management authorities can develop models for other larger and more critical aquifers. Another goal is to construct a screening tool that can be used to identify reasonable alternatives for sustainable water management. These, in turn, can be discussed, debated, modified, and studied in greater detail. 2.1 Study Area The study area for the model is the Yeșilköy aquifer (9km²) surrounding the village of Yeșilköy on the Karpaz peninsula in Cyprus (Figure 1) The Yeșilköy aquifer is one of the seven major aquifers in northern Cyprus. The area is very rural with a dense area of farms in the vicinity of the village. The topography of the area (Figure 1) varies with an average elevation around 200m above mean sea level (amsl) with the highest point being Koys Hill (242m). The area has a Mediterranean climate, with hot, dry summers and warm, rainy winters (Table 1). Rainfall is quite variable from year to year and averages around 500mm/yr. The area’s vegetation is exclusive to the Mediterranean climate including Mediterranean grasses and shrubs as well as pine forests.
Cyprus
Yesilkoy Area
Cyprus
Yesilkoy Area
Figure 1. Yeșilköy Aquifer Study Area

Yeșilköy Aquifer Groundwater Model Technical Report
2
Month Average Monthly
Rainfall (mm) Average Monthly
Temperature (o C) Average Monthly
Humidity (%) January 91 12 70 February 63 12 70 March 39 14 69 April 23 17 69 May 19 21 68 June 9 25 67 July 1 28 68 August 2 28 70 September 7 26 68 October 31 22 67 November 61 17 68 December 106 13 70 Average or Total
452 19 69
Table 1. Monthly Climate Variables – Ziyamet Station (35o 28' N; 34o 07' E; 140m amsl) near Yeșilköy. (Source: personal communication with local meteorologists, April 2007)
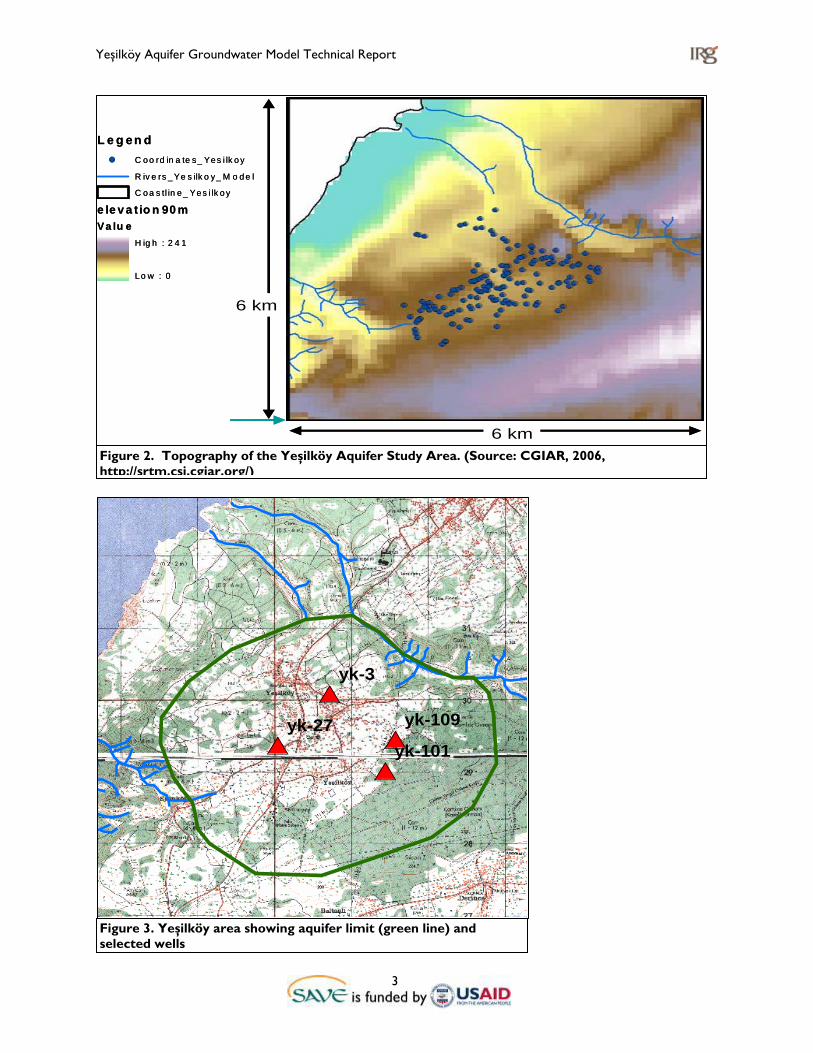
Water supply for the area, both domestic and agricultural, is entirely supplied from groundwater pumped from the underlying aquifer. The population of the region in 1996 was estimated to be 7,150 persons (personal communication with waterworks authorities, 2006). The aquifer serves 17 nearby small villages with an annual water use of about 1 million m3 per year (personal communication with waterworks authorities, June 2007). The villages that are supplied water from the Yeșilköy Aquifer are: Yeșilköy, Kaleburnu (Galinoporni), Boltașlı (Lythrangomi), Gelincik (Vasili), Derince (Vathylakas), Tașlıca (Neta), Avtepe (Ayios Symeon), Kuruova (Korovia), Çayırova (Ayios Seryios), Ziyamet (Leonarisso), Esenköy (Kilanemos), Kumyalı (Koma tou Yialou), Pamuklu (Tavros), Bafra (Voukolidha), Yeni Erenköy (Yialousa), Adaçay (Melanarka), and Sipahi (Ayias Trias). About 170 wells have been developed in the area, of which around 130 are operational (Figure 2) and about 90% of those are privately owned. Six regional water supply wells are operated by local staff, and supply villages in the area. The capacity of wells is about 20-25m3/hr and the average depth of the wells is 78-100m. The wells are all located within the area enclosed by the area indictaed with the green line in Figure 3. In the northern, lowland part of the aquifer, the static water levels in the wells range between 6m and 10m below ground surface (bgs); in the southern, upland part, water levels are between 40m and 70m bgs.
Yeșilköy Aquifer Groundwater Model Technical Report
3
6 km
6 km
L e g en d!( C o o rd in a te s_ Yes i lk o y
R iv e rs _ Ye s ilk o y_ M o d e l
C o a s tl in e_ Yes i lk o y
e le v a t io n 90 mVa lu e
H ig h : 2 4 1
Lo w : 0
6 km
6 km
L e g en d!( C o o rd in a te s_ Yes i lk o y
R iv e rs _ Ye s ilk o y_ M o d e l
C o a s tl in e_ Yes i lk o y
e le v a t io n 90 mVa lu e
H ig h : 2 4 1
Lo w : 0
Figure 2. Topography of the Yeșilköy Aquifer Study Area. (Source: CGIAR, 2006, http://srtm.csi.cgiar.org/)
#*
#*
#*#*
yk-3
yk-27yk-101
yk-109
Figure 3. Yeșilköy area showing aquifer limit (green line) and selected wells

Yeșilköy Aquifer Groundwater Model Technical Report
4
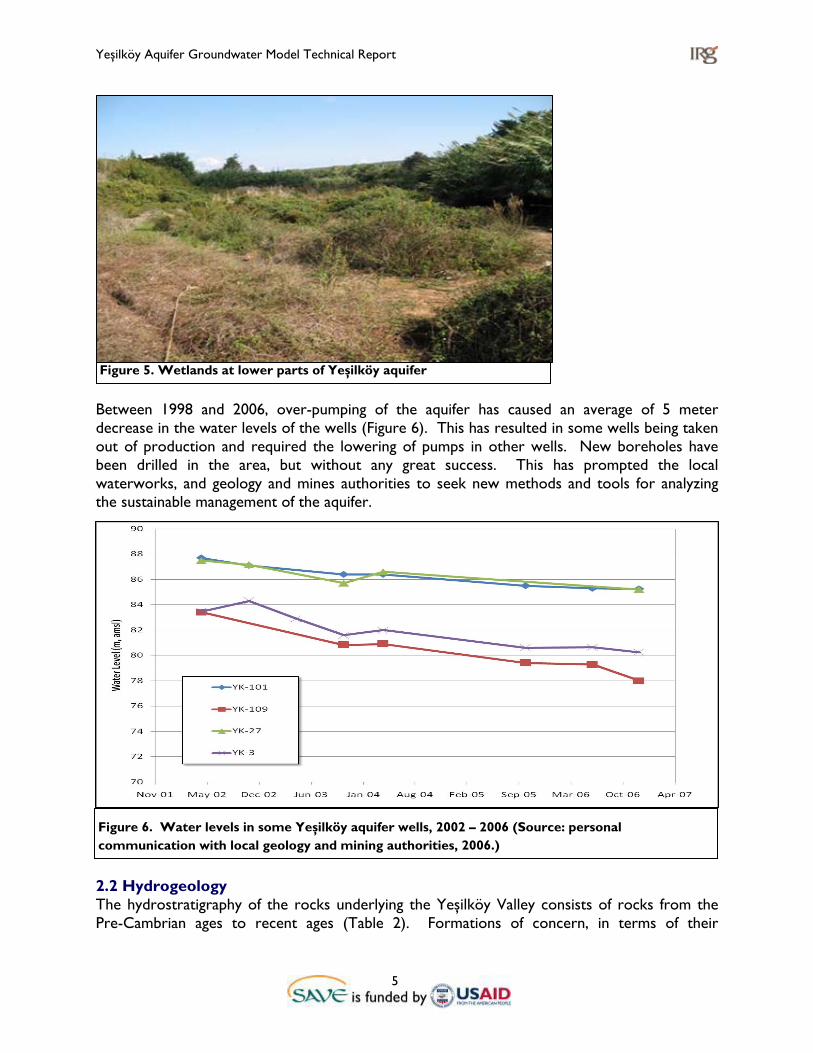
About 150 farmers are active in the area. Potatoes are the most common crop in the area, with 840 out of 1050 dunams5 planted in 2005 according to the statistics from the agriculture authorities. Potatoes are planted in January and harvested in May, and irrigation occurs from January to May (depending on rainfall). According to these statistics, irrigated farming, except for potatoes, has been decreasing in recent years due to various market forces. Most irrigation in the Yeșilköy area is by small sprinklers (Figure 4). Potatoes are irrigated once a week when there is no rain. The irrigation rate is 1 hour per dunam and pumps produce about 20 m3 per hour, so the irrigation rate is 20 m3/dunam (personal communication, Director, Yeșilköy Farmers Cooperative Association, June 2007). There are two surface water streams in the area, the Göz and the Değirmen (Figure 4), both of which are ephemeral and only flow intermittently in response to rainfall and the discharge of small springs. It is assumed that these ephemeral streams mainly flow to the sea without recharging the aquifer. In fact, in times of high aquifer water levels, the Göz Stream is fed by a spring discharging from the aquifer into a wetland area (Figure 5).
5 1 dunam (northern Cyprus) = 1337.8 m2
Figure 4. Potato field with sprinkler, Yeșilköy.
Yeșilköy Aquifer Groundwater Model Technical Report
5
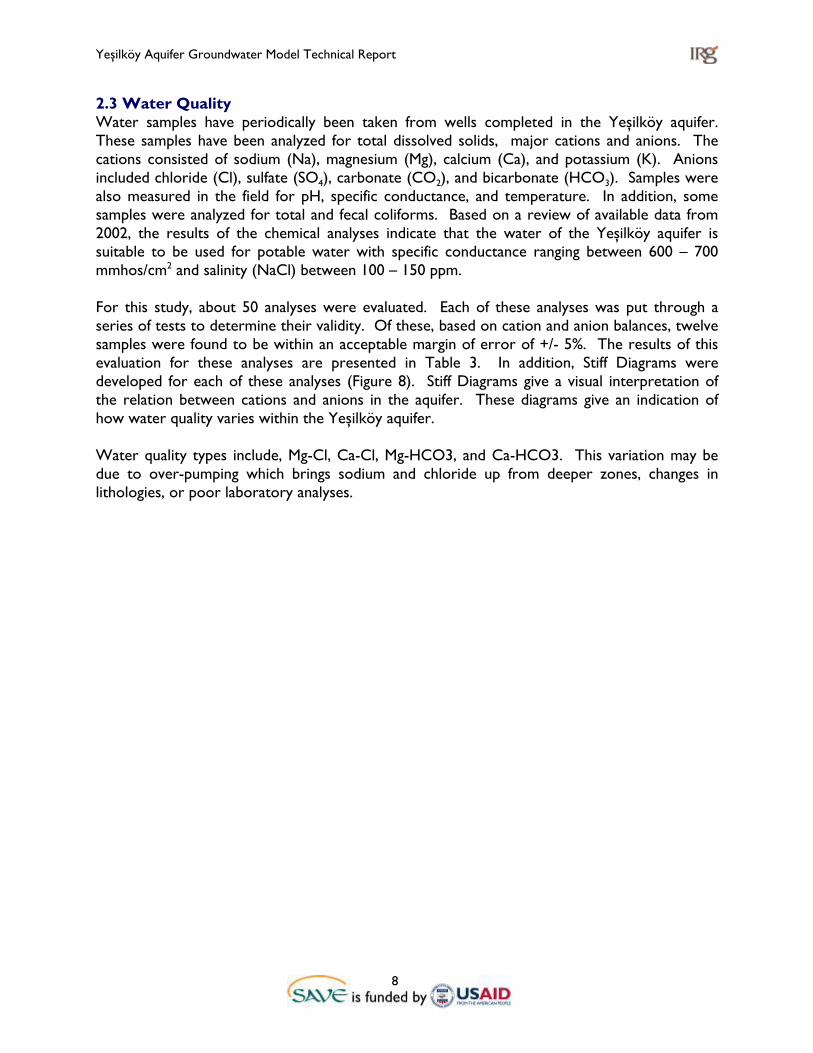
Between 1998 and 2006, over-pumping of the aquifer has caused an average of 5 meter decrease in the water levels of the wells (Figure 6). This has resulted in some wells being taken out of production and required the lowering of pumps in other wells. New boreholes have been drilled in the area, but without any great success. This has prompted the local waterworks, and geology and mines authorities to seek new methods and tools for analyzing the sustainable management of the aquifer.
2.2 Hydrogeology The hydrostratigraphy of the rocks underlying the Yeșilköy Valley consists of rocks from the Pre-Cambrian ages to recent ages (Table 2). Formations of concern, in terms of their
Figure 5. Wetlands at lower parts of Yeșilköy aquifer
Figure 6. Water levels in some Yeșilköy aquifer wells, 2002 – 2006 (Source: personal communication with local geology and mining authorities, 2006.)

Yeșilköy Aquifer Groundwater Model Technical Report
6
hydrogeologic characteristics from oldest to youngest, belong to the Değirmenlik (Khytrea) and Mesarya (Mesaoria) Groups as well as sediments of recent age. The Değirmenlik Group, which is roughly equivalent to the Dali (Dhali) Group, consists of sedimentary rocks of Oligocene to Miocene sedimentary rocks. These rocks consist of channel fill sandstones, marble fragments, and reef limestone with claystone, mudstone and gypsum. This group is seperated into several different formations as defined by rock type. The principal formation underlying the study area is the Beylerbeyi which is later Oligocene in age. This formation consists of sandstone and shale with a middle layer of claystone and mudstone. The sandstone is light to dark brown and can be yellow to khaki in color. It is course to fine grained with lenses of microcoglomerate. The origin of the rock is from erosion of volcanic and carbonate sedimentary rocks. Claystones and mud stones are generally light brown, grey in color. This formation also contains marble fragments. These marbles are generally round and include volcanic marble, ophiolite origin marble, limestone marble, metamorphic marble, and churt marble. Stratigraphic
Age Geological Unit Lithology Thickness Water-bearing Properties
Recent Alluvium of coastal plain and river valleys
Sand, silt, gravel, and marl Up to 15 m
Pleistocene Fanglomerate Series Clay, marl, sand, gravel 0 – 30 m Athalassa Formation
Calcarenite, marl, sandstone Pliocene
Nicosia Formation
Marl, sand, gravel Approximately 200 m
Principal aquifer with alternative aquitards
Mesaoria
Myrtou Marl
Marl 800 m Aquiclude
Gypsum alternating with marl
Upper Miocene Gypsum
Koronia Limestone Reef limestone
6 – 120 m Karst aquifer, in some areas
Middle Miocene
Değirmenlik (Khytrea) (Dhali) Group Pakhna
Formation
Marl, chalky, marl, calcareous sandstone, calcarenite
12 – 300 m Aquiclude, aquiferous section is certain areas
Upper Massive and flaggy chalk, marl, marly chalk - Aquiclude
Flaggy chalk, marl Aquiclude, locally aquiferous Aquiferous in fractures and fissures
Massive chalk, marly chalk Middle
Chalk, chert, marl Aquiclude, locally aquiferous
Lefkara Chalk Formation
Lower Marl, chal, chert
Up to > 300 m
Aquiclude
Lower Miocene to
Maastrichtian
Moni Formation Clay, exotic blocks - Aquiclude
Campanian Perapedhi Formation Shale, clay, radilarite, umber Up to 10 m Aquiclude
Pre-Campanian
Volcanic Complex
Upper Pillow Lavas
Pillow and massive basalt lavas ??
Aquiclude, locally aquiferous in fractured and

Yeșilköy Aquifer Groundwater Model Technical Report
7
Stratigraphic Age Geological Unit Lithology Thickness Water-bearing
Properties Lower Pillow Lavas
Pillow basalt flows with dykes and sills
weathered zones
Basal Group
Metabasalts dykes
Sheeted Intusive Complex Diabase, basltic and ultramafic dykes
Gabbro Grabbro, plagiogranite Plutonic complex Ultra-
mafics
Pyroxenite, wehrlite, dunite, harzburgite, serpentinite
Aquiferous, in fractured and weathered
Table 2. Hydrogeologic section of the Yeșilköy aquifer. (Source: Heft, J.R.C., 1990) The Değirmenlik Group is stratigraphically below the Mesarya Group which is of Pliocene to early Pleistocene age. This group includes Çamlıbel (Mirti), Nicosia, Tașpınar(Angolem), Gürpınar (Aymarina) and Bostancı(Zodya) Formations. Of primary conern in the Yeșilköy area is the Gürpınar (Aymarina) Formation. In the Karpaz region this unit contains small to medium sized, rounded, cemented marble fragments underlained by continuous calceranitic sandstone which has a yellowish grey color (Figure 7). Above the Mesarya Group is the Kantara Formation which is part of a fanglomerate series. In consists of a course grained to pebble sized marble conglomerate in a sandstone matrix. The sandstone is gray to grayish green in color. Grains of marble range between angular to rounded in shape.
Figure 7. Calcarenite in the Yeșilköy aquifer
Yeșilköy Aquifer Groundwater Model Technical Report
8
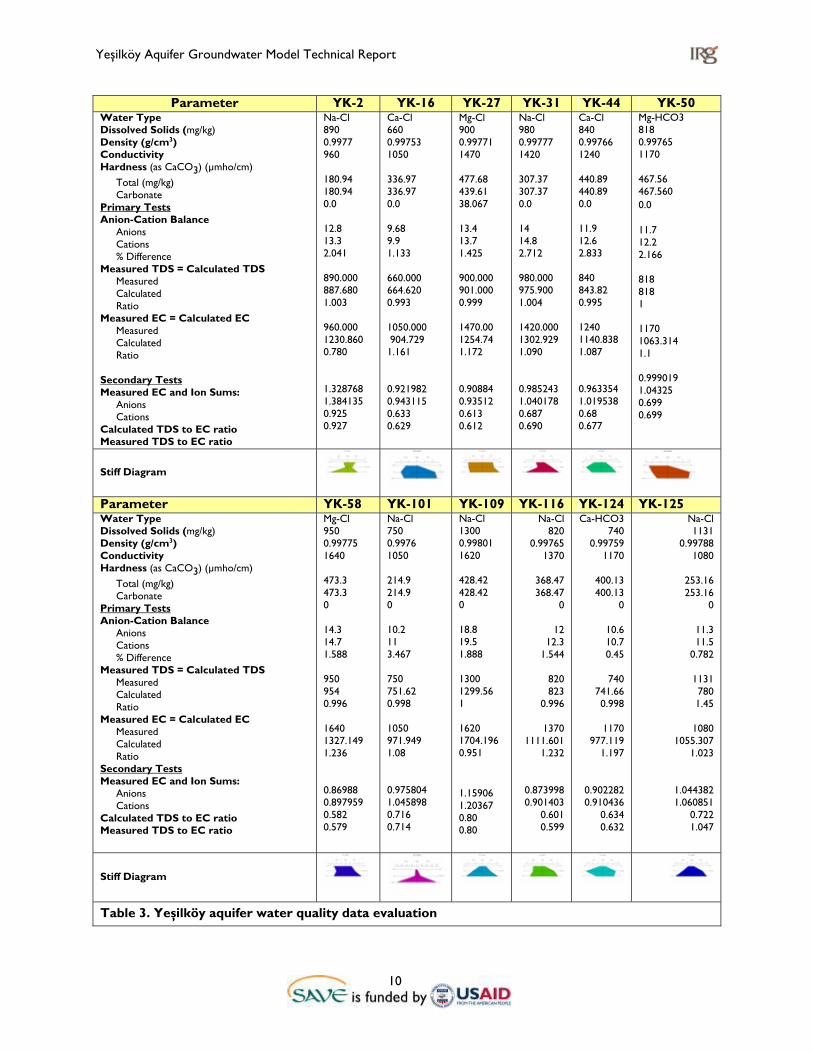
2.3 Water Quality Water samples have periodically been taken from wells completed in the Yeșilköy aquifer. These samples have been analyzed for total dissolved solids, major cations and anions. The cations consisted of sodium (Na), magnesium (Mg), calcium (Ca), and potassium (K). Anions included chloride (Cl), sulfate (SO4), carbonate (CO2), and bicarbonate (HCO3). Samples were also measured in the field for pH, specific conductance, and temperature. In addition, some samples were analyzed for total and fecal coliforms. Based on a review of available data from 2002, the results of the chemical analyses indicate that the water of the Yeșilköy aquifer is suitable to be used for potable water with specific conductance ranging between 600 – 700 mmhos/cm2 and salinity (NaCl) between 100 – 150 ppm. For this study, about 50 analyses were evaluated. Each of these analyses was put through a series of tests to determine their validity. Of these, based on cation and anion balances, twelve samples were found to be within an acceptable margin of error of +/- 5%. The results of this evaluation for these analyses are presented in Table 3. In addition, Stiff Diagrams were developed for each of these analyses (Figure 8). Stiff Diagrams give a visual interpretation of the relation between cations and anions in the aquifer. These diagrams give an indication of how water quality varies within the Yeșilköy aquifer. Water quality types include, Mg-Cl, Ca-Cl, Mg-HCO3, and Ca-HCO3. This variation may be due to over-pumping which brings sodium and chloride up from deeper zones, changes in lithologies, or poor laboratory analyses.

Yeșilköy Aquifer Groundwater Model Technical Report
9
!(!(
!(
!(
yk-31
yk-16
yk-27
yk-101
Figure 8. Spatial distribution of water quality data in the Yeșilköy aquifer
Yeșilköy Aquifer Groundwater Model Technical Report
10
Parameter YK-2 YK-16 YK-27 YK-31 YK-44 YK-50 Water Type Dissolved Solids (mg/kg) Density (g/cm3) Conductivity Hardness (as CaCO3) (µmho/cm) Total (mg/kg) Carbonate Primary Tests Anion-Cation Balance Anions Cations % Difference Measured TDS = Calculated TDS Measured Calculated Ratio Measured EC = Calculated EC Measured Calculated Ratio Secondary Tests Measured EC and Ion Sums: Anions Cations Calculated TDS to EC ratio Measured TDS to EC ratio
Na-Cl 890 0.9977
960 180.94 180.94 0.0 12.8 13.3 2.041 890.000 887.680 1.003 960.000 1230.860 0.780 1.328768 1.384135 0.925 0.927
Ca-Cl 660 0.99753 1050 336.97 336.97 0.0 9.68 9.9 1.133 660.000 664.620 0.993 1050.000 904.729 1.161 0.921982 0.943115 0.633 0.629
Mg-Cl 900 0.99771 1470 477.68 439.61 38.067 13.4 13.7 1.425 900.000 901.000 0.999 1470.00 1254.74 1.172 0.90884 0.93512 0.613 0.612
Na-Cl 980 0.99777 1420 307.37 307.37 0.0 14 14.8 2.712 980.000 975.900 1.004 1420.000 1302.929 1.090 0.985243 1.040178 0.687 0.690
Ca-Cl 840 0.99766 1240 440.89 440.89 0.0 11.9 12.6 2.833 840 843.82 0.995 1240 1140.838 1.087 0.963354 1.019538 0.68 0.677
Mg-HCO3 818 0.99765 1170 467.56 467.560 0.0 11.7 12.2 2.166 818 818 1 1170 1063.314 1.1 0.999019 1.04325 0.699 0.699
Stiff Diagram
Parameter YK-58 YK-101 YK-109 YK-116 YK-124 YK-125 Water Type Dissolved Solids (mg/kg) Density (g/cm3) Conductivity Hardness (as CaCO3) (µmho/cm) Total (mg/kg) Carbonate Primary Tests Anion-Cation Balance Anions Cations % Difference Measured TDS = Calculated TDS Measured Calculated Ratio Measured EC = Calculated EC Measured Calculated Ratio Secondary Tests Measured EC and Ion Sums: Anions Cations Calculated TDS to EC ratio Measured TDS to EC ratio
Mg-Cl 950 0.99775 1640 473.3 473.3 0 14.3 14.7 1.588 950 954 0.996 1640 1327.149 1.236 0.86988 0.897959 0.582 0.579
Na-Cl 750 0.9976 1050 214.9 214.9 0 10.2 11 3.467 750 751.62 0.998 1050 971.949 1.08 0.975804 1.045898 0.716 0.714
Na-Cl 1300 0.99801 1620 428.42 428.42 0 18.8 19.5 1.888 1300 1299.56 1 1620 1704.196 0.951 1.15906 1.20367 0.80 0.80
Na-Cl 820
0.99765 1370
368.47 368.47
0
12 12.3
1.544
820 823
0.996
1370 1111.601
1.232
0.873998 0.901403
0.601 0.599
Ca-HCO3 740
0.99759 1170
400.13 400.13
0
10.6 10.7 0.45
740
741.66 0.998
1170
977.119 1.197
0.902282 0.910436
0.634 0.632
Na-Cl 1131
0.99788 1080
253.16 253.16
0
11.3 11.5
0.782
1131 780 1.45
1080
1055.307 1.023
1.044382 1.060851
0.722 1.047
Stiff Diagram
Table 3. Yeșilköy aquifer water quality data evaluation

Yeșilköy Aquifer Groundwater Model Technical Report
11
2.4 Conceptual Hydrogeologic Model Considerable work has been completed by local geology and mines authorities on monitoring the water levels and quality in the wells of the Yeșilköy aquifer. Water levels and water quality samples are taken twice per year from a majority of the 170 wells in the area. These wells are completed in the Yeșilköy aquifer, which mainly consists of the Quaternary calcarinite and forms a permeable aquifer above a relative impermeable marl which acts as an aquitard. The shape of the aquifer is similar to a bowl and controlled by the topography. It has an area of about 11.2 km2. For the most part, except near pumping centers, the potentiometric surface is relatively flat sloping down the valley. Recharge is primarily from precipitation and infiltration of excess irrigation water. Water levels are believed to rise during the rainy season (mid-November to mid-March). Discharge mainly occurrs via wells which are pumped between 1.5 million and 3.0 million cubic meters per year. Spring and underflow occur down-valley and act as a drain to the system when water levels are high. Prior to this study, the hydraulic characteristics of the aquifer were relatively unknown. Hydraulic conductivities for carcarinite aquifers generally range from 10-6 cm/sec for unfractured massive rock to over 10 cm/sec where there are solution cavities (Figure 9). Initially, the Yeșilköy aquifer was assumed to be unconfined, and the horizontal hydraulic conductivity was estimated to be approximately 10-2 cm/sec (8.6 m/day) with vertical hydraulic conductivity an order of magnitude lower. Also, the porosity was estimated to be approximately 35% with a specific yield of 0.30. The base of the aquifer is shaped by the Değirmenlik group in the area and these conglomerates are relatively impermeable and act as a lower barrier to flow.
Figure 9. Hydraulic conductivity of Calcarenite (Source: Freeze and Cherry, 1979)

Yeșilköy Aquifer Groundwater Model Technical Report
12
To verify these hydraulic characteristics, an aquifer pumping test was conducted in April, 2007 as part of a training exercise with the local geology and mining, and waterworks authorities. Water supply well YK-38 was used for the pumping well and YK-109 (103 meters south) was used as an observation well (Figure 10). Both wells were 250 mm in diameter and fully penetrate the calcarenite aquifer to a depth approximately 120 meters below ground surface (bgs). The water level of YK-109 at the time of the test was 68.73 meters bgs giving a saturated thickness of around 33 meters.
Because YK-38 and other wells (YK-39 and YK-40) in the close vicinity of YK-109 were being continuously pumped using submersible pumps to supply water to villages, it was difficult to perform a constant rate pumping test without having the other wells affect the outcome. To determine if it was possible to see response in YK-109 if YK-38 was used as a pumping well, YK-38 was shut down for a short period of time and water levels were measured in YK-109. Over a 45 minutes period, the water levels in YK-38 recovered approximately 8 cm. This indicated that a successful aquifer test could be performed. However, prior to the pumping test, wells YK-38 and YK-40 were shut down for 24 hours. YK-39 could not be turned off since it was the sole source of water to a village which does not have a holding tank. During the pumping test, water levels were recorded in the observation well YK-109 throughout a 100 minute pumping period and a 100 minute recovery period. These levels were measured in two ways using a pressure transducer (Solinst “Diver”) placed four meters below the water table and by local staff using a water level meter (Figure 11). Flow measurements were made at the totalizing flow meter and at a storage tank receiving flow from well YK-38 (with bucket and stopwatch). Data from the hand measurements in well YK-109 indicated a drop in water level of 17 cm (Figure 12). The transducer in well YK-109 indicated a drop of about 16 cm
Figure 10. Aerial view of the aquifer test location
Figure 11. Local water managers recording water levels

Yeșilköy Aquifer Groundwater Model Technical Report
13
Figure 13. Transducer Data for Drawdown and Recovery of YK-109
(Figure 13). The average flow rate of well YK-38 during the pumping test was 0.0073 m3/sec based on the totalizing flow meter which is more accurate than the bucket and stopwatch method.
-16.00
-14.00
-12.00
-10.00
-8.00
-6.00
-4.00
-2.00
0.00
0 2000 4000 6000 8000 10000 12000
Time (sec)
Chan
ge in
Wat
er L
evel
(cm
)
The results of the test were analyzed using spreadsheets and a pump test computer software program (AquiferTest). Methodologies used included Theis and Cooper-Jacobs. Theis (1935) developed the following formula to describe transient radial flow in a confined aquifer:
)(4
),( uWT
Qtrsπ
= , where:
s(r,t) = drawdown at time (t, sec) and distance (r, m) Q = pumping rate (m3/sec) T = transmissivity (m2/sec) W(u) = well function where u = r2S/4Tt (dimensionless) S = storativity (dimensionless)
For small values of u (e.g., at large times or close to the well, Cooper and Jacob (1946) developed the following approximation transient radial flow
-18-16-14-12-10
-8-6-4-20
0 50 100 150 200
Time (min)
Dra
wdo
wn
(cm
)
Figure 12. Measured Drawdown and Recovery for YK-109

Yeșilköy Aquifer Groundwater Model Technical Report
14
T = 0.183 * Q / Δs = 0.183*0.4359 m3/min/0.18 m = 0.44 m2/min = 633.6 m2/day S = 2.25 * T*to/r2 = 2.25*675.76 m2/day*0.007 day/103^2 m^2 = 0.001 k = T/s = 675.76 m2/day/30 = 22.5 m/day = 0.0003 m/sec
Figure 14. YK-109 Drawdown Analysis using Theis Method in AquiferTest
)425.2ln(
4),(
uTQtrsπ
=
It was found that the transmissivity of the aquifer at YK-109 is about 511m2/day and the storativity is on the order of 0.001 (Figures 14 and 15).
Groundwater flow in the Yeșilköy aquifer is basically controlled by the topography, hydrogeology, and withdrawal from the aquifer for agricultural and water supply wells. Groundwater flows from the upper reaches of the basin to its outlet at the sea (Figure 16). Aquifer test data indicate that the aquifer is semi-confined with a leaky confining layer above the saturated zone. At this time, water quality in the aquifer gives us some idea about the
Figure 15. YK-109 Drawdown Analysis using Jacob’s method

Yeșilköy Aquifer Groundwater Model Technical Report
15
groundwater flow in the aquifer. The water in the southeast portions of the aquifer appears to be dominated by sodium and chloride and the middle portion of the aquifer is dominated by calcium, chloride, and carbonate. This indicates that the fault on the southeast side of the aquifer may restrict flow allowing more retention time up gradient from the fault, causing a buildup of salts in the water.
The aerial extent of the aquifer is about 11.5 million m2 which receives about 500 mm of rainfall (5.2 million m3) in an average year. For extremely dry years, rainfall is considerably less, on the order of 2.8 million m3. Recharge to the aquifer is from rainfall and for an average year this is estimated to be around 1.6 million m3 per year (30% of precipitation). This value is poorly estimated and the actual recharge rate may be as low as 10% of precipitation. Current pumping rates are poorly known and they appear to be quite variable throughout the aquifer. Pumping rates and duration as well as seasonality are dependent on precipitation, types of crops, and other factors. Pumping is estimated to be 3 million m3/year; 1 million for village water supply and 2 million for agriculture (which occurs during April – June only). Extraction at this time is greater than recharge causing the water levels to drop. As illustrated in Figure 6, which shows hydrographs of four wells in the aquifer, water levels in the aquifer appear to be steadily falling. This is due to over-pumping of the aquifer, causing water levels to drop throughout the basin at an average of 5 meters since 1990.
A
A
K
h ( r )
ground surface
bedrock
aquitard
confinedaquifer
initial head
Well
s ( r )
r
Flow, Q
Q
h0
Extraction Wells
(3 million m3 per year)
N
Figure 16. Conceptual model of Yeșilköy aquifer for an Average Year

Yeșilköy Aquifer Groundwater Model Technical Report
16
3 Model Development 3.1 The Model In order to develop a better understanding of the groundwater system in Yeșilköy, a finite difference groundwater model which allows for the mathematical simulation of flow in the aquifer was developed. The model selected was MODFLOW which is currently the most used numerical model in the U.S. Geological Survey for groundwater flow problems (USGS, 1988). MODFLOW simulates steady and transient flow in an irregularly shaped flow system in which aquifer layers can be confined, unconfined, or a combination of confined and unconfined. Flow from external stresses, such as flow to wells, areal recharge, evapotranspiration, flow to drains, and flow through river beds, can be simulated. MODFLOW requires the development of a three dimensional grid with inputs such as the geology, hydraulic characteristics of the aquifer, recharge, pumping rates, and other factors. Groundwater flow equations are used to develop system water balances, water level maps, and other important information including the impacts of pumping and changes in recharge to the system. For ease of use, Groundwater Vistas (GV) which is a Windows graphical user interface for 3-D groundwater flow modeling was used. For additional information on this modeling system please see ESI (2004). The area and topography (on 90m x 90m grid cells) of the Yeșilköy aquifer are illustrated in Figure 17. The aquifer sits in a groundwater basin with topographic highs on three sides, to the north-west (a slight rise before dropping off to the coast), south-east (the highest point is 241
m) and south-west (another small rise). These ridges serve as barriers to flow in those directions. To the north-east there is an ephemeral stream in a steep canyon whose walls act as a barrier to flow. The green line designates a no-flow boundary for the aquifer and also surrounds all of the local pumping wells. The smaller of the two creeks (on the west)
originates in the aquifer. For the aquifer model, the point where the stream cuts through the north-west ridge is designated as a spring where water flows out of the spring when the aquifer head at that location reaches the ground surface elevation. The upper boundary of the system is taken to be the ground surface. The model consists of three layers (Figure 18):
Figure 17. Aquifer area showing topography, inner boundary, and wells. (Source of elevation data: SRTM data, http://srtm.csi.cgiar.org/)

Yeșilköy Aquifer Groundwater Model Technical Report
17
(1) from the ground surface to the top of the confining layer; (2) the confining layer; and (3) from the bottom of the confining layer to the top of the bedrock.
There are several layers of various materials in the aquifer, but an aggregate material with property values in the median range of calcarinite is used for the aquifer model (horizontal hydraulic conductivity equal to 8.6 m/day and vertical conductivity of 0.86 m/day). Similarly, the porosity of the aquifer is estimated as 35% and the specific yield as 30%. The bottom of the aquifer is taken to be the bottom of the lowest layer of calcarinite in the aquifer, or the top of the lowest marl formation in the aquifer.
(a)
(b) The data for the ground surface elevation and the bottom of the calcarinite were derived from Geographic Information System (GIS) data sets in the ENVIS database and exported to the groundwater modeling software for use in the model. There are 18 boreholes with logs that were used to determine the elevation of the base of the aquifer (the red triangles in Figure 19). These point values were used interpolated to determine the layer thicknesses and the average values.
Figure 18. Grid structure illustrating average heights of layers for the model, (a) conceptual (b) cross-sectional

Yeșilköy Aquifer Groundwater Model Technical Report
18
3.2 The Model Grid As previously mentioned, three layers are used to represent the aquifer structure:
(1) an unconfined layer to model the area between the ground surface and the top of the confining layer;
(2) a layer for the confining formation; and (3) a (water-bearing) confined layer for the aquifer formation.
The model grid (Figure 20) was laid out on a 6km by 6km square area surrounding and enclosing the aquifer. The grid consists of 1 layer with 67 rows and 66 columns each 90 m by 90 m (to be compatible with the spatial resolution of the surface topography from the GIS. The pumping test helped determine the horizontal hydraulic conductivity of the aquifer to be Kx = Ky = 8.6 m/day (10-2 cm/s), the vertical conductivity is Kz = 0.86 m/day, and the storativity to be S = 0.001. The geographic coordinates of the grid origin (lower left-hand corner of the grid) are X = 602,461m and Y = 3,926,702m.
Figure 19. Aquifer area showing boreholes with logs and approximate thickness of the

Yeșilköy Aquifer Groundwater Model Technical Report
19
All of the cells outside of the aquifer area (green line in Figure 4) are assumed to be “no-flow” cells that do not allow the movement of water out of the aquifer area except through the spring located at the source of the small creek emanating from the north-west side of the aquifer (Figure 21). The spring is represented as a drain in the model.
Figure 20. Model grid showing top of the aquifer layer (ground surface)

Yeșilköy Aquifer Groundwater Model Technical Report
20
The 90mx90m grid results in several cells having multiple wells. The MODLFOW groundwater software only allows a single well in each cell, so multiple wells were aggregated into a single well in each cell (Figures 22, 23 and 24).
Cell with 3 wells
Cell with 3 wells
Figure 22. Model grid showing boundary condition cells
Figure 21. Model grid showing boundary condition cells

Yeșilköy Aquifer Groundwater Model Technical Report
21
82 wells remaining
Figure 23. Model grid showing boundary condition cells
Figure 24. Cells with single wells in model (multiple wells were aggregated)

Yeșilköy Aquifer Groundwater Model Technical Report
22
3.3 Recharge Data Analyzing the precipitation record for the region allowed us to characterize the climate of certain years as very dry, dry, normal, wet, and very wet (Figure 25 and Table 4). Table 5 shows the precipitation and type of climate year for the Ziyamet station over the recent three years (2003 – 2005). These data indicate that the climate has been relatively wet with precipitation ranging from Normal to Very Wet.
Year Precip. (mm) Prob. Type
year 2003 528.6 0.82 Wet
2004 396.8 0.36 Normal
2005 425.4 0.50 Normal Table 5. Annual Precipitation for 2001-2005 at Ziyamet (Source: Data from personal communication, with local meteorologists, 2007)
Condition Probability Example year Very Dry (critical) < 15% 1982, 231 mm Dry (drought) 15 - 30% 1980, 353 mm Normal condition 30 - 70% 1986, 424 mm Wet condition 70 - 85% 1984, 505 mm Very Wet > 85% 1981, 631 mm
Table 4. Precipitation Conditions for Precipitation at Ziyamet
Figure 25. Duration curve for precipitation at Ziyamet (Source: Data from personal communication with local meteorologists, 2007)

Yeșilköy Aquifer Groundwater Model Technical Report
23
4 Results 4.1 Initial Conditions Initial conditions for the model were developed by solving a steady state model of the aquifer. (Figures 26, 27, 28) Note that the purple colored cells are ones that have no water in them (dry) due to draining in the down gradient direction toward the drain.
Figure 26. Heads: Layer 1, Time step 1 Figure 27. Heads: Layer 2, Time step 1
Figure 28. Heads: Layer 3, Time step 1
Yeșilköy Aquifer Groundwater Model Technical Report
24
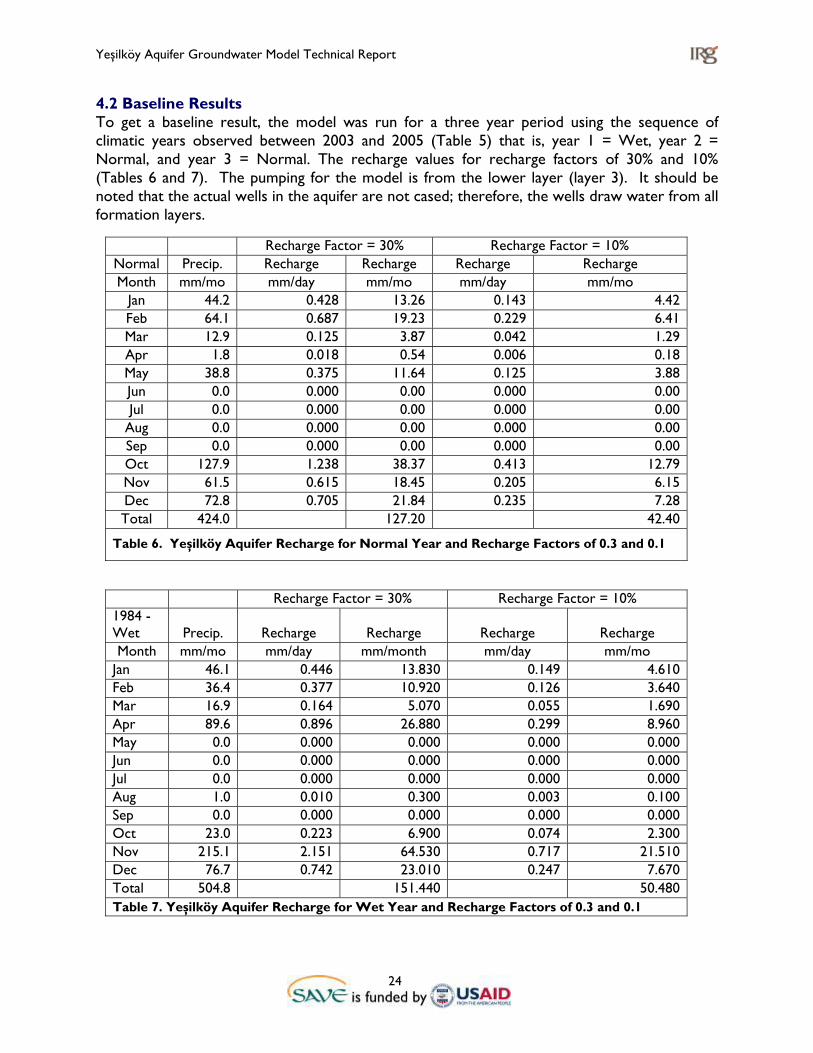
4.2 Baseline Results To get a baseline result, the model was run for a three year period using the sequence of climatic years observed between 2003 and 2005 (Table 5) that is, year 1 = Wet, year 2 = Normal, and year 3 = Normal. The recharge values for recharge factors of 30% and 10% (Tables 6 and 7). The pumping for the model is from the lower layer (layer 3). It should be noted that the actual wells in the aquifer are not cased; therefore, the wells draw water from all formation layers.
Recharge Factor = 30% Recharge Factor = 10% Normal Precip. Recharge Recharge Recharge Recharge Month mm/mo mm/day mm/mo mm/day mm/mo
Jan 44.2 0.428 13.26 0.143 4.42 Feb 64.1 0.687 19.23 0.229 6.41 Mar 12.9 0.125 3.87 0.042 1.29 Apr 1.8 0.018 0.54 0.006 0.18 May 38.8 0.375 11.64 0.125 3.88 Jun 0.0 0.000 0.00 0.000 0.00 Jul 0.0 0.000 0.00 0.000 0.00
Aug 0.0 0.000 0.00 0.000 0.00 Sep 0.0 0.000 0.00 0.000 0.00 Oct 127.9 1.238 38.37 0.413 12.79 Nov 61.5 0.615 18.45 0.205 6.15 Dec 72.8 0.705 21.84 0.235 7.28 Total 424.0 127.20 42.40
Table 6. Yeșilköy Aquifer Recharge for Normal Year and Recharge Factors of 0.3 and 0.1
Recharge Factor = 30% Recharge Factor = 10% 1984 - Wet Precip. Recharge Recharge Recharge Recharge Month mm/mo mm/day mm/month mm/day mm/mo
Jan 46.1 0.446 13.830 0.149 4.610 Feb 36.4 0.377 10.920 0.126 3.640 Mar 16.9 0.164 5.070 0.055 1.690 Apr 89.6 0.896 26.880 0.299 8.960 May 0.0 0.000 0.000 0.000 0.000 Jun 0.0 0.000 0.000 0.000 0.000 Jul 0.0 0.000 0.000 0.000 0.000 Aug 1.0 0.010 0.300 0.003 0.100 Sep 0.0 0.000 0.000 0.000 0.000 Oct 23.0 0.223 6.900 0.074 2.300 Nov 215.1 2.151 64.530 0.717 21.510 Dec 76.7 0.742 23.010 0.247 7.670 Total 504.8 151.440 50.480 Table 7. Yeșilköy Aquifer Recharge for Wet Year and Recharge Factors of 0.3 and 0.1
Yeșilköy Aquifer Groundwater Model Technical Report
25
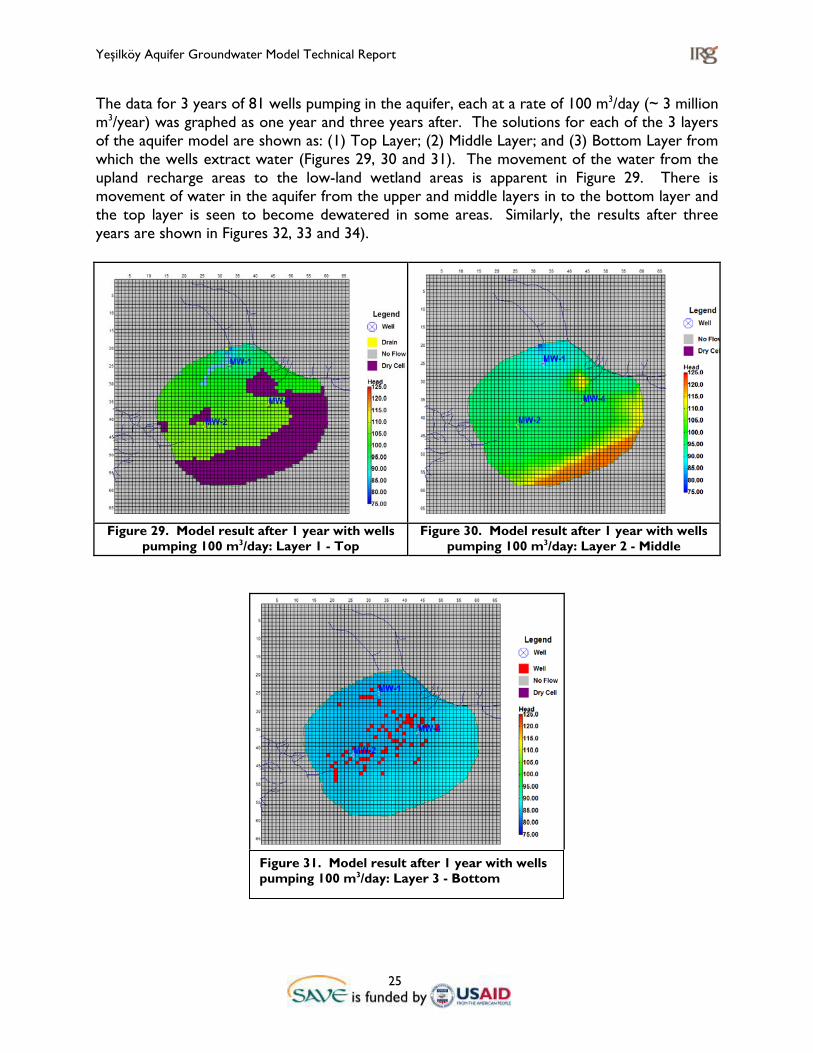
The data for 3 years of 81 wells pumping in the aquifer, each at a rate of 100 m3/day (~ 3 million m3/year) was graphed as one year and three years after. The solutions for each of the 3 layers of the aquifer model are shown as: (1) Top Layer; (2) Middle Layer; and (3) Bottom Layer from which the wells extract water (Figures 29, 30 and 31). The movement of the water from the upland recharge areas to the low-land wetland areas is apparent in Figure 29. There is movement of water in the aquifer from the upper and middle layers in to the bottom layer and the top layer is seen to become dewatered in some areas. Similarly, the results after three years are shown in Figures 32, 33 and 34).
Figure 29. Model result after 1 year with wells pumping 100 m3/day: Layer 1 - Top
Figure 30. Model result after 1 year with wells pumping 100 m3/day: Layer 2 - Middle
Figure 31. Model result after 1 year with wells
pumping 100 m3/day: Layer 3 - Bottom

Yeșilköy Aquifer Groundwater Model Technical Report
26
Figure 32. Result after 3 years with wells pumping 100 m3/day: Layer 1 - Top
Figure 33. Result after 3 years with wells pumping 100 m3/day: Layer 2 - Middle
Several monitoring wells were placed in the system as shown in Figure 34. The heads in these wells are displayed in Figure 35. The first year shows a quick readjustment of the aquifer levels from the initial conditions to a more long-term hydraulic condition. From this figure it can be seen that the aquifer is being slowly depleted with a drop in head in the confined layer (layer 3) of about 1m per year – consistent with the observed level decline in the aquifer over the past few years.
Figure 34. Result after 3 years with wells pumping 100 m3/day: Layer 3 - Bottom

Yeșilköy Aquifer Groundwater Model Technical Report
27
MW-1 MW-2
MW-4
Figure 35. Monitoring well results with wells pumping 100 m3/day.
Yeșilköy Aquifer Groundwater Model Technical Report
28
Conclusion In this report, the development of a model for the Yeșilköy aquifer in the Karpaz peninsula region was described. This model was created in stages as a training exercise for local water, geology and mining experts. Several training sessions were held during 2006 and 2007 on concepts of hydrogeology and how to develop a conceptual model of an aquifer using typically available data for aquifers in Cyprus. Then this conceptual model was transferred into the groundwater modeling software representation of the aquifer using the Groundwater Vistas software. This was done in several stages starting with a single layer, steady-state, single well model and progressing to a three layer transient, multi well model. Detailed, step-by-step instructions were provided for each stage of the training in both Turkish and English language versions. In addition, several field training exercises were conducted, including water quality sampling, water level measurement, and aquifer pump testing. The final model results are documented above. The next stage is to transform these efforts from a strictly training model to an accurate analytical tool which will be useful to the local water resources managers for years to come. The following activities need to be undertaken if this model is to develop and be thus transformed into a tool for day-to-day analysis and management of the aquifer:
• Carrying out a detailed well survey of the Yeșilköy area. • Performing several additional pumping tests at different locations in the aquifer. • Extensive model calibration, perhaps using the automatic calibration and sensitivity tools
in the Groundwater Vistas software. Finally, additional field and classroom training on groundwater modeling will remain important in order to continue to transfer the knowledge and experience with these groundwater management tools. This training should include both the specifics of the Groundwater Vistas and MODFLOW computer applications, but also ongoing field work in correctly gathering, recording and utilizing the requisite data on which the model is developed.

Yeșilköy Aquifer Groundwater Model Technical Report
29
References Heft, J.R.C., Hydrogeologic Section in the Nicosia- Larnaca-Limassoal region, 1990 Schlumberger Water Services, AquiferTest, Users Manual and Software, 2007 Freeze, R.A. and J.A. Cherry, (1979), Groundwater, Prentice Hall, Englewood Cliffs, NJ. Theis, C. V. (1935). “The relation between lowering of the piezometric surface and rate and duration of discharge of a well using groundwater storage.” Transactions of the American Geophysical Union, 16, 519-524. Cooper, H.H. and C.E. Jacob, 1946. A generalized graphical method for evaluating formation constants and summarizing well field history, Am. Geophys. Union Trans., vol. 27, pp. 526-534. USGS, McDonald, M.G., and Harbaugh, A.W., 1988, A modular three-dimensional finite-difference ground-water flow model: U.S. Geological Survey Techniques of Water-Resources Investigations, book 6, chap. A1, 586 p. ESI, Guide to Using Groundwater Vista, Environmental Simulations, Inc., Reinholds, PA, 2004, http://www.groundwatermodels.com