year ended march 31, 2011
TRANSCRIPT

Year ended March 31, 2011Annual Report 2011
HITA
CH
I Annual R
epo
rt 2011
Printed in Japan

2 Powering Global Expansion with Our Smart City Business 4 To Our Shareholders 14 Powering Global Expansion with Our Social Innovation Business 20 Financial Highlights 22 Segment Information 24 Review of Operations 24 Information & Telecommunication Systems 25 Power Systems 26 Social Infrastructure & Industrial Systems 27 Electronic Systems & Equipment 28 Construction Machinery 29 High Functional Materials & Components 30 Automotive Systems 31 Components & Devices 32 Digital Media & Consumer Products 33 Financial Services 34 Others 36 Research and Development 37 Intellectual Property 38 CSR Management 40 Corporate Governance 42 Board of Directors 43 Executive Officers 44 Financial Section 44 Five-Year Summary 45 Operating and Financial Review 50 Consolidated Balance Sheets 52 Consolidated Statements of Operations 53 Consolidated Statements of Equity 56 Consolidated Statements of Cash Flows 57 Notes to Consolidated Financial Statements 131 Management’s Report on Internal Control Over
Financial Reporting 132 Report of Independent Registered Public Accounting Firm134 Corporate Data
Cautionary StatementCertain statements found in this document may constitute “forward-looking statements” as defined in the U.S. Private Securities Litigation Reform Act of 1995. Such “forward-looking statements” reflect manage-ment’s current views with respect to certain future events and financial performance and include any state-ment that does not directly relate to any historical or current fact. Words such as “anticipate,” “believe,” “expect,” “estimate,” “forecast,” “intend,” “plan,” “project” and similar expressions which indicate future events and trends may identify “forward-looking statements.” Such statements are based on currently available information and are subject to various risks and uncertainties that could cause actual results to differ materially from those projected or implied in the “forward-looking statements” and from historical trends. Certain “forward-looking statements” are based upon current assumptions of future events which may not prove to be accurate. Undue reliance should not be placed on “forward-looking statements,” as such statements speak only as of the date of this document.
Factors that could cause actual results to differ materially from those projected or implied in any “forward-looking statement” and from historical trends include, but are not limited to:• economic conditions, including consumer spending and plant and equipment investment in Hitachi’s
major markets, particularly Japan, Asia, the United States and Europe, as well as levels of demand in the major industrial sectors Hitachi serves, including, without limitation, the information, electronics, automo-tive, construction and financial sectors;
• exchange rate fluctuations of the yen against other currencies in which Hitachi makes significant sales or in which Hitachi’s assets and liabilities are denominated, particularly against the U.S. dollar and the euro;
• uncertainty as to Hitachi’s ability to access, or access on favorable terms, liquidity or long-term financing;• uncertainty as to general market price levels for equity securities in Japan, declines in which may require
Hitachi to write down equity securities that it holds;• the potential for significant losses on Hitachi’s investments in equity method affiliates;• increased commoditization of information technology products and digital media-related products and
intensifying price competition for such products, particularly in the Components & Devices and the Digital Media & Consumer Products segments;
• uncertainty as to Hitachi’s ability to continue to develop and market products that incorporate new tech-nologies on a timely and cost-effective basis and to achieve market acceptance for such products;
• rapid technological innovation;• the possibility of cost fluctuations during the lifetime of, or cancellation of, long-term contracts for which
Hitachi uses the percentage-of-completion method to recognize revenue from sales;• fluctuations in the price of raw materials including, without limitation, petroleum and other materials, such
as copper, steel, aluminum, synthetic resins, rare metals and rare-earth minerals, or shortages of materi-als, parts and components;
• fluctuations in product demand and industry capacity;• uncertainty as to Hitachi’s ability to implement measures to reduce the potential negative impact of fluc-
tuations in product demand, exchange rates and/or price of raw materials or shortages of materials, parts and components;
• uncertainty as to Hitachi’s ability to achieve the anticipated benefits of its strategy to strengthen its Social Innovation Business;
• uncertainty as to the success of restructuring efforts to improve management efficiency by divesting or otherwise exiting underperforming businesses and to strengthen competitiveness and other cost reduc-tion measures;
• general socioeconomic and political conditions and the regulatory and trade environment of countries where Hitachi conducts business, particularly Japan, Asia, the United States and Europe, including, with-out limitation, direct or indirect restrictions by other nations on imports and differences in commercial and business customs including, without limitation, contract terms and conditions and labor relations;
• uncertainty as to the success of alliances upon which Hitachi depends, some of which Hitachi may not control, with other corporations in the design and development of certain key products;
• uncertainty as to Hitachi’s access to, or ability to protect, certain intellectual property rights, particularly those related to electronics and data processing technologies;
• uncertainty as to the outcome of litigation, regulatory investigations and other legal proceedings of which the Company, its subsidiaries or its equity method affiliates have become or may become parties;
• the possibility of incurring expenses resulting from any defects in products or services of Hitachi;• the possibility of disruption of Hitachi’s operations in Japan by earthquakes, tsunamis or other natural
disasters, including the possibility of continuing adverse effects on Hitachi’s operations as a result of the earthquake and tsunami that struck northeastern Japan on March 11, 2011;
• uncertainty as to Hitachi’s ability to maintain the integrity of its information systems, as well as Hitachi’s ability to protect its confidential information or that of its customers;
• uncertainty as to the accuracy of key assumptions Hitachi uses to evaluate its significant employee ben-efit-related costs; and
• uncertainty as to Hitachi’s ability to attract and retain skilled personnel.
The factors listed above are not all-inclusive and are in addition to other factors contained in Hitachi’s peri-odic filings with the U.S. Securities and Exchange Commission and in other materials published by Hitachi.
Contents
PoweringContributing to society

Hitachi, Ltd. Annual Report 2011 1
Staying true to the corporate credo carried on since its foundation,
Hitachi will continue to promote its Social Innovation Business,
which supplies advanced social infrastructure linked by information
technology (IT). Through the vigorous global expansion of this
Social Innovation Business, the Company will help create both
social and economic value while contributing to a sustainable society.
Global Expansion with...through the development of superior, original technology and products
2 Hitachi, Ltd. Annual Report 2011
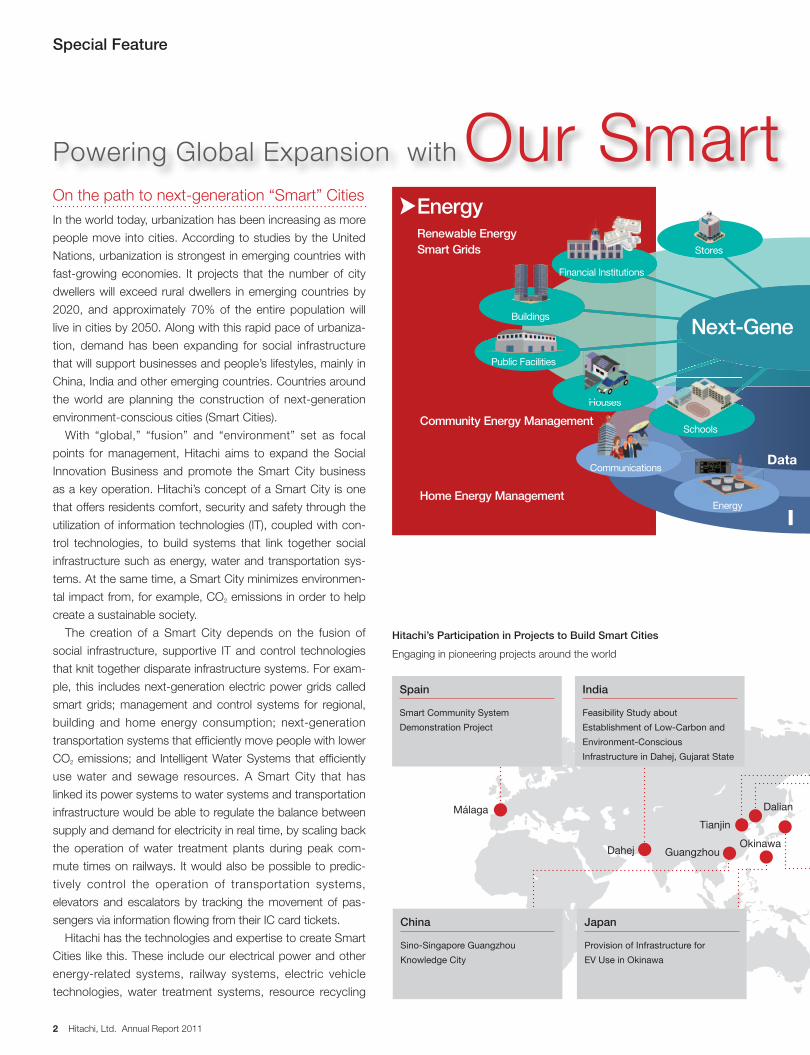
On the path to next-generation “Smart” CitiesIn the world today, urbanization has been increasing as more
people move into cities. According to studies by the United
Nations, urbanization is strongest in emerging countries with
fast-growing economies. It projects that the number of city
dwellers will exceed rural dwellers in emerging countries by
2020, and approximately 70% of the entire population will
live in cities by 2050. Along with this rapid pace of urbaniza-
tion, demand has been expanding for social infrastructure
that will support businesses and people’s lifestyles, mainly in
China, India and other emerging countries. Countries around
the world are planning the construction of next-generation
environment-conscious cities (Smart Cities).
With “global,” “fusion” and “environment” set as focal
points for management, Hitachi aims to expand the Social
Innovation Business and promote the Smart City business
as a key operation. Hitachi’s concept of a Smart City is one
that offers residents comfort, security and safety through the
utilization of information technologies (IT), coupled with con-
trol technologies, to build systems that link together social
infrastructure such as energy, water and transportation sys-
tems. At the same time, a Smart City minimizes environmen-
tal impact from, for example, CO2 emissions in order to help
create a sustainable society.
The creation of a Smart City depends on the fusion of
social infrastructure, supportive IT and control technologies
that knit together disparate infrastructure systems. For exam-
ple, this includes next-generation electric power grids called
smart grids; management and control systems for regional,
building and home energy consumption; next-generation
transportation systems that efficiently move people with lower
CO2 emissions; and Intelligent Water Systems that efficiently
use water and sewage resources. A Smart City that has
linked its power systems to water systems and transportation
infrastructure would be able to regulate the balance between
supply and demand for electricity in real time, by scaling back
the operation of water treatment plants during peak com-
mute times on railways. It would also be possible to predic-
tively control the operation of transportation systems,
elevators and escalators by tracking the movement of pas-
sengers via information flowing from their IC card tickets.
Hitachi has the technologies and expertise to create Smart
Cities like this. These include our electrical power and other
energy-related systems, railway systems, electric vehicle
technologies, water treatment systems, resource recycling
EnergyRenewable EnergySmart Grids
MobilitySmart NavigationSmart Mobility
Community Energy Management
I T
Recycling Facilities
Factories
Stations
Hotels
Water
Transportation
Hospitals
Data Centers
Schools
Energy
Communications
Houses
Public Facilities
Buildings
Financial Institutions
Energy Stations
Stores
Water, RecyclingReclaimed Water Management
Intelligent Water Systems
Next-Gene ration Cities
s
Houses
Statio
Home Energy Management
Hitachi’s Participation in Projects to Build Smart Cities
Engaging in pioneering projects around the world
Powering Global Expansion with Our Smart City Business
Spain
Smart Community System
Demonstration Project
India
Feasibility Study about
Establishment of Low-Carbon and
Environment-Conscious
Infrastructure in Dahej, Gujarat State
Málaga
GuangzhouDahejOkinawa
Tianjin
Special Feature
Dalian
China
Sino-Singapore Guangzhou
Knowledge City
Japan
Provision of Infrastructure for
EV Use in Okinawa

Hitachi, Ltd. Annual Report 2011 3
technologies, IT, identity verification technologies, security
technologies, and sophisticated control technologies
designed to seamlessly orchestrate industrial plants, electri-
cal power, railways and other social infrastructure. Hitachi
has both social infrastructure and IT capabilities, in that
sense, Hitachi is one of the few companies in the world.
Fusing together our excellent products and technologies, we
are working toward the debut of Smart Cities with less
impact on the environment on the global stage.
Smart Cities are attracting attention around the worldA number of projects to build Smart Cities are getting under-
way around the world. In China, 100 of its 600 or so cities are
said to be designated as Eco-City projects by the govern-
ment, with 13 selected to be model Smart Cities.
Construction has already begun on these cities. Hitachi has
built close business relationships with the Chinese central
government and local governments, and is proactively
involved in the Sino-Singapore Tianjin Eco-City and
Guangzhou Knowledge City, while also collaborating with
Dalian City. In the Sino-Singapore Tianjin Eco-City, Hitachi is
responsible for providing rechargeable batteries and systems
(home energy management systems) that utilize IT to improve
the efficient operation of energy-consuming equipment in the
household. In the Guangzhou Knowledge City, Hitachi aims
to participate at the upstream stage of proposing ideas for
urban planning, and aims to develop business across a
broad range of fields including energy management and IT
platforms. In addition to accumulating experience and know-
how in China, Hitachi is also engaged in various other proj-
ects around the world, including smart grid experiments in
Hawaii and New Mexico in the United States, a smart com-
munity system demonstration project in Spain, and feasibility
studies in the Dahej infrastructure project in Gujarat State,
India. In Japan as well, the Company participates in a resi-
dential smart grid project in Rokkasho, Aomori Prefecture
that uses the world’s first large-scale combined rechargeable
battery and wind power generation facility.
Hitachi will aggressively develop and expand its Smart City
business, from the three-way perspective of “global,”
“fusion” and “environment,” focusing on emerging countries
in Asia, including China and India, where strong market
growth is expected, while building partnerships with
advanced companies in Japan and abroad.
EnergyRenewable EnergySmart Grids
MobilitySmart NavigationSmart Mobility
Community Energy Management
I T
Recycling Facilities
Factories
Stations
Hotels
Water
Transportation
Hospitals
Data Centers
Schools
Energy
Communications
Houses
Public Facilities
Buildings
Financial Institutions
Energy Stations
Stores
Water, RecyclingReclaimed Water Management
Intelligent Water Systems
Next-Gene ration Cities
s
Houses
Statio
Home Energy Management
Hitachi’s Participation in Projects to Build Smart Cities
Engaging in pioneering projects around the world
Powering Global Expansion with Our Smart City Business
China
Sino-Singapore Tianjin Eco-City
China
Collaboration with Dalian City,
in Areas of Recycling Resources
and Low-Carbon Economy
U.S.
Smart Grid Demonstration
Project in New MexicoOkinawaHawaii
AomoriLos Alamos
Dalian
Japan
Smart Grid Demonstration
Project in Rokkasho Village
U.S.
Smart Grid Project in Hawaii

4 Hitachi, Ltd. Annual Report 2011
To Our Shareholders
The Great East Japan Earthquake
On behalf of Hitachi, Ltd., I would first like to express my heartfelt condolences to all those
who have suffered as a result of the Great East Japan Earthquake.
As a company, Hitachi has its roots in eastern Japan. Over the years, our customers and
the communities in the Tohoku and Kita-Kanto regions have been supportive of Hitachi and
have contributed to its overall growth and development. Now, we sincerely seek to help these
regions by drawing on the comprehensive capabilities and knowledge of the Hitachi Group.
We will take concrete action to assist in the recovery efforts. Hitachi will work closely with
these communities to build a renewed social platform for the future.
Since the disaster, we have been active participants in many aspects of the recovery effort
in the devastated areas. In addition to monetary contributions, we have provided daily com-
modities and relief supplies, construction machinery and other equipment. We have also dis-
patched employees from Hitachi workplaces across Japan to provide support in the
restoration of public infrastructure including electric power, communications, water, and sew-
age facilities. By organizing the resources and expertise of the Hitachi Group, we hope to par-
ticipate in the construction of new communities that best reflect the attributes and character
of each region.
In response to the accident at the Fukushima Daiichi Nuclear Power Station, owned and
operated by Tokyo Electric Power Company, Hitachi is dedicating its expertise and technical
skills to help bring about appropriate action and safe resolution to the situation.
The earthquake also had a direct impact on the Hitachi Group; significant damage was
done to some buildings, structures and manufacturing equipment. We received support and

Hitachi, Ltd. Annual Report 2011 5
encouragement from customers and partners from around the world, and our employees
worked around the clock to restore operations. Thanks to their tireless efforts, we were able
to resume production more quickly than expected. Moving forward, we will use this experi-
ence to strengthen our Business Continuity Plan (BCP) and build a robust business base that
is more resilient to risk.
Fiscal 2010 Results
In fiscal 2010, the year ended March 31, 2011, demand in the electronics- and automotive-
related fields recovered globally. However, the Great East Japan Earthquake that struck the
nation on March 11, 2011, caused catastrophic damage over a wide area of Eastern Japan
impacting an array of business activities from production to sales. Hitachi was no exception.
After experiencing damage to buildings, production facilities and in-process products, we
were forced to make production adjustments.
While impacted by the earthquake, Hitachi’s results in fiscal 2010 were generally sound.
Consolidated revenues amounted to ¥9,315.8 billion, up 4% compared with the previous fis-
cal year. Hitachi recorded profits across all business segments, benefiting from increased rev-
enues, business structure reform and successful efforts to reduce procurement costs and
fixed expenses, as well as to strengthen project management. Operating income for the fiscal
year was ¥444.5 billion, a year-on-year increase of ¥242.3 billion, representing an operating
income ratio of 4.8%. Net income attributable to Hitachi, Ltd. soared to a record high of
¥238.8 billion, a positive turnaround of ¥345.8 billion compared with the previous fiscal year.
In terms of financial position, Hitachi reported a debt-to-equity ratio* (D/E Ratio) of 1.03, an
improvement of 0.35 of a point. The Company’s stockholders’ equity ratio as of March 31,
2011 was 15.7%, 1.4 percentage points higher than the end of the previous fiscal year.
Recognizing our improved performance, we decided to pay an annual cash dividend of ¥8
per share, which includes a commemorative dividend of ¥2 per share in recognition of our
centenary.
*Interest-bearing debt ÷ (Noncontrolling interests + Total Hitachi, Ltd. stockholders’ equity)
FY2009 Results, FY2010 Results and FY2012 Targets
FY2009 Results FY2010 Results FY2012 Targets*1
Revenues ¥8,968.5 billion ¥9,315.8 billion ¥10 trillion
Operating income ¥202.1 billion ¥444.5 billion Operating income ratio*2: Over 5%
Net income (loss) attributable to Hitachi, Ltd. ¥(106.9) billion ¥238.8 billionConsistently generate at least
¥200 billion
D/E ratio*3 1.38 times 1.03 times 0.8 times or below
Total Hitachi, Ltd. stockholders’ equity ratio*4 14.3% 15.7% 20%
*1 FY2012 Targets previously announced in May 2010 have been revised reflecting HDD business transfer.*2 Operating income ÷ Revenues*3 Including noncontrolling interests and non-recourse borrowings of consolidated securitization entities in the consolidated balance sheets*4 Total Hitachi, Ltd. stockolders’ equity ÷ Total assets

6 Hitachi, Ltd. Annual Report 2011
Fiscal 2012 Mid-term Management Plan
In 2010, Hitachi celebrated its 100th anniversary, and we also developed the Fiscal 2012 Mid-
term Management Plan. This plan outlines how Hitachi will move forward. We will shift from a
“defensive” posture, based on improving Hitachi’s business structure, to an “offensive” pos-
ture that targets global growth in the Social Innovation Business.
The plan focuses on achieving two key initiatives: “Growth Driven by the Social Innovation
Business” and a “Solid Financial Base.” Our approach is guided by three strategies:
• We will leverage Hitachi’s strengths to promote a global growth strategy.
• We will focus business resources on the Social Innovation Business.
• We will strengthen the business structure to stabilize profitability.
In fiscal 2010, the first year of the plan, we vigorously advanced these management strate-
gies. Despite the impact of the recent earthquake, Hitachi posted record high net income for
the period.
Even after factoring in the impact of the earthquake on our performance in fiscal 2011, our
management targets for fiscal 2012 remain unchanged from those figures disclosed during
2010, with the exception of adjustments for business portfolio reorganization. As a result, we
Fiscal 2012 Mid-term Management Plan
Leverage Hitachi’s
strengths to promote
a global growth
strategy
Focus
business resources
on the Social
Innovation
Business
Strengthen
the business
structure to stabilize
profitability
Global Fusion Environment
Growth Driven by Social Innovation Business
Solid Financial BaseInitiatives
Focus
Strategies

Hitachi, Ltd. Annual Report 2011 7
are targeting consolidated revenues of ¥10 trillion, an operating income ratio of over 5%, net
income attributable to Hitachi, Ltd. consistently above ¥200 billion, a D/E Ratio of 0.8 times or
below and a total Hitachi, Ltd. stockholders’ equity ratio of 20%. Accounting for the planned
sale of the hard disk drive business, our consolidated revenues target has been reduced by
¥500 billion compared with the figure identified in the announcement of the plan in 2010. By
achieving the targeted figures indicated in the Fiscal 2012 Mid-term Management Plan, we
will tie this performance into future growth.
Creating Value with Hitachi’s Social Innovation Business
Every facet of Hitachi’s business is underscored by the corporate credo of contributing to
society through the development of superior, original technology and products; this credo has
always been part of Hitachi’s mission and has been passed down since the company’s found-
ing. Looking ahead, we are positioning the Social Innovation Business as central to fulfilling
this mission. Harnessing our unique strengths, we will provide safe and secure advanced
social infrastructure linked by information technology (IT) through our Social Innovation
Business.
The Social Innovation Business is comprised of the Information and Telecommunication
Systems; Power Systems; and Industrial, Transportation and Urban Development Systems
fields together with the Materials and Key Devices field, which supports the first three. By
quickly understanding societal needs and changes, we will continue to advance the skills nec-
essary to address these changes with a strong determination and sense of mission. By pro-
moting the Social Innovation Business, we will contribute to the sustainable development of
society and achieve the following core values.
The first is value created and shared with customers and partners. The second is value that
lasts for the next generation, a period of more than a decade. And, the third is value that epit-
omizes our role and mission as a manufacturer. In more specific terms, shared value is gener-
ated by collaborating with customers in the creation of products and services that are truly
needed by the market and regional communities. This value is lasting, and represents the mis-
sion and sense of fulfillment that Hitachi has held as a manufacturer since its founding. We will
maintain Hitachi’s position as a trusted brand, synonymous with confidence and reliability, by
pursuing new challenges that maximize our technological and manufacturing capabilities.
When Japan was struck by the recent earthquake, residents throughout many areas were
suddenly deprived of the most basic social infrastructure. Electric power, water, gas and pub-
lic transportation failed, disrupting the very essence of everyday life and fundamental econom-
ic activity. We were reminded once again of the precious value of a safe and secure lifestyle.
This recent disaster has also reaffirmed the ongoing importance of our mission to and for
the next generation. We will continue to create the sustainable social infrastructure necessary
to support safe and secure lifestyles. Every Hitachi employee embraces this mission and
upholds it with immense pride and dedication. We will accelerate our Social Innovation
Business strategies by focusing particularly on the three key concepts of Global, Fusion and
the Environment. Looking ahead, we will continue to implement our policies with an unshake-
able resolve. By powering global expansion, we will help build a society in which people can
live with an increased sense of safety and security.

8 Hitachi, Ltd. Annual Report 2011
Leverage Hitachi’s Strengths to Promote a Global Growth Strategy
In a global economy in which growth is being driven by emerging markets, the ties between
economic and societal concerns are becoming increasingly connected. This is also reflected
in international cooperation as countries address such environmental issues as global warm-
ing and biodiversity. Amid the trend toward a single integrated global market, we are working
to quickly uncover business opportunities in each country and region and to provide compre-
hensive solutions that meet their needs while taking environmental concerns into consider-
ation. Building on a record-high overseas revenue ratio, which stood at 43% in fiscal 2010,
we are continuing to increase Hitachi’s presence and standing outside of Japan. Our goal is
to increase this ratio to above 50% in fiscal 2012. By expanding business overseas, Hitachi’s
goal is to evolve into a truly global company.
In working to realize globalization, our first strategy is to promote and expand global local-
ization. Consistent with this focus, we formulated the New Globalization Promotion Plan to
promote rapid, locally led rollout of businesses. Steps have been taken to designate 11 key
regions including the Asian Belt, which has continued to demonstrate remarkable economic
growth, as well as South America and Central/Eastern Europe. Across these 11 regions,
Hitachi plans to increase revenues from ¥1.9 trillion in fiscal 2010 to ¥2.5 trillion in fiscal 2012.
We will establish a structure through which Hitachi entities in each region can take the initia-
tive in pursuing business opportunities and deliver a comprehensive lineup of products and
services that meet their customers’ needs. Professionals in areas such as sales engineering,
external relations and finance with a deep understanding of local conditions will roll out busi-
ness in each region as “One Hitachi.” By looking beyond domestic boundaries to encompass
the six key management areas of Americas, Europe, India, Southeast Asia, China as well as
Japan, Hitachi will be better positioned to engage in global management.
At the same time, we are looking to strengthen local management control functions across
our numerous businesses. We will promote further localization in our elevator and escalator
business in order to expand activities in the Asian Belt. In addition to deepening collaboration
with development bases in Japan, China and Singapore to ensure that product development
accurately reflects market needs, we will strengthen the functions of regional supervising
companies for China and the rest of Asia. In this manner, we will accelerate locally-led busi-
ness operations and decision-making processes.
In the thermal power generation systems business, we will strengthen high efficiency coal
fired thermal power business activities focusing mainly on Asia. We have established joint ven-
ture companies for both boilers and turbines with BGR Energy Systems in India and will
expand the production capacity of the Dalian factory in China. Moving forward, we will contin-
ue to augment production bases in the future, as part of our ongoing growth strategies.
In March 2011, Hitachi resumed formal contract negotiations for a British high-speed rail-
way project in an effort to boost its railway systems business. We will start up a new manu-
facturing base within the UK and expand local procurement. At the same time, we will work to
extend our business by pursuing similar activities in other regions.
Leading the charge toward globalization, we will bolster our construction machinery busi-
ness by extending operations not only in China and India, but also in Russia and Africa.
We are convinced that building open, transparent relationships is vital to global business
expansion. As a second and equally important strategy, we are therefore pursuing growth
opportunities in collaboration with partners.
In the smart city business, working closely with central and municipal governments and
other partners in China, Hitachi participates in the Sino-Singapore Tianjin Eco-City, the Sino-
Singapore Guangzhou Knowledge City and various works with Dalian City. Specifically, Hitachi

Hitachi, Ltd. Annual Report 2011 9
received orders for products such as home energy management systems (HEMS) and
rechargeable batteries for the Tianjin Eco-City. We also are planning to participate in projects
in the Guangzhou Knowledge City, from urban planning proposals to the delivery of products
and services across a wide spectrum including energy management and IT platforms.
Building on this accumulated experience and expertise in China, we will expand into smart
city-related businesses in regions around the world. We will also leverage technologies and
knowledge gained through demonstration experiments in Hawaii and other locations. We are
Leverage Hitachi’s Strengths to Promote a Global Growth Strategy
Revenues by Region
FY2012Overseas
Revenue Ratio:
46%*
FY2010Overseas
Revenue Ratio:
43%
Japan57%
North America
8%
Europe8%
China13%
Asia, etc.14%
Emerging Markets
Over 50%
Japan54%
North America
8%
Europe9%
China13%
Asia, etc.16%
Emerging Markets
Achieving an overseas revenues ratio of more than 50% in FY2012
New Globalization Plan
P Designate 11 key regions and strengthen local management control functions
11 key regions:
Revenues from 11 key regions
FY2010 FY2012
¥1.9 trillion ¥2.5 trillion
• Indonesia• Vietnam• China• India• Saudi Arabia• Brazil
• Turkey• Central and Eastern Europe• Russia• South Africa• Egypt
P Develop the global framework comprised of 6 regions including Japan (Americas, Europe, India, Southeast Asia, China, Japan)
* FY2012 Targets previously announced in May 2010 have been revised reflecting HDD business transfer.
1. Promote and Expand Globalization
2. Expand Business Opportunities in Collaboration with Partners
3. Expand New Businesses Leveraging Hitachi’s Strengths

10 Hitachi, Ltd. Annual Report 2011
confident that the experience and advanced knowledge accumulated through these activities
will prove extremely useful in the creation of new cities in Japan.
In the hydroelectric power generation systems business, we will establish a joint-venture
company with Mitsubishi Electric Corporation and Mitsubishi Heavy Industries, Ltd. in October
2011 with the goal of securing a leading position in the field of variable speed pumped hydro
power. In the industrial systems business, we will focus on providing life cycle support includ-
ing the sale and maintenance of compressors in Brazil and China.
A third strategy entails expanding new businesses leveraging Hitachi’s strengths. In the
Information and Telecommunication Systems business, we will focus more strongly on the
storage solutions and consulting businesses with the goal of further expanding business over-
seas. At the same time, we will utilize highly reliable cloud computing services in corporate- as
well as public-sector backbone systems in order to contribute to the creation of safe, secure
and comfortable social infrastructure. We will place considerable weight on powering global
expansion by accelerating Hitachi’s participation in smart city businesses that entail the fusion
of IT and control technologies.
In the water environment solutions business, we will pursue participation in water and sew-
age infrastructure system projects in the Middle East. We will also introduce Intelligent Water
Systems in the Republic of Maldives to enable optimum management and control of water
flows including the treatment of clean water, sewage and industrial wastewater through the
fusion of water treatment plant, IT and control technologies. We are steadily witnessing mea-
sureable results and will continue to aggressively promote global–scale initiatives.
Hitachi received an order for the basic design of a LNG plant in Australia and is building a
solid, successful track record in its industrial systems business. Looking ahead, we will expand
our business with LNG plants by utilizing our compact, quiet, electric drive technologies.
We are also positioning healthcare as a core business, and every effort is being made to
strengthen Hitachi’s products and services in this sector. In the diagnostics field, Hitachi
Medical Corporation acquired Aloka Co., Ltd. in January 2011, a strategic acquisition aimed
at increasing global competitiveness. In the treatment field, we will continue to contribute to
advanced medical treatment harnessing our superior technological capabilities. As one exam-
ple, we will expand our particle beam therapy system business that helps in the treatment of
cancer while also helping patients maintain their quality of life. In June 2011, we also estab-
lished the Corporate Healthcare Group to play a central role in strengthening the services
business and growing new businesses. Moving forward, we will strive to achieve increased
growth by providing products and services that are unique to Hitachi, combining technologies
and expertise that range from diagnostics to treatment, information, services and new drug
discovery.
Focus Business Resources on the Social Innovation Business
In recent years, our efforts have focused largely on strengthening the Social Innovation
Business and overhauling Hitachi’s business structure. Among a host of fiscal 2010 initiatives
aimed at re-examining our business portfolio, we reinforced IT consulting by acquiring U.S.-
based Sierra Atlantic, Inc. We also transferred management rights for IPS Alpha Technology
Ltd. and reached an agreement to transfer our hard disk drive business to Western Digital
Corporation. As the business climate dictates, we will continue to implement reforms that
strengthen individual businesses and improve management efficiency.

Hitachi, Ltd. Annual Report 2011 11
In order to further drive growth in the Social Innovation Business, we will allocate capital and
strategic investment focused on upgrading and expanding overseas bases, bolstering the BCP
and continuing reconstruction support. Over the three-year period from fiscal 2010 to fiscal
2012, we will invest an aggregate total of ¥1.6 trillion. Approximately 70%, or ¥1.1 trillion, of
this amount will be directed toward the Social Innovation Business. We are committed to
ensuring the steady growth of this business through proactive M&A and aggressive investment.
At the same time, we will invest a total of ¥1.2 trillion in research and development over the
three-year period with approximately 60%, or ¥670 billion allocated to the Social Innovation
Business. We will continue to promote research in IT, railways, smart grids and other aspects
of green technology. We will also invest in research in materials, electronics and activities
aimed at strengthening R&D bases with close ties to the global market. Research and devel-
opment has been and will continue to be the source of Hitachi’s competitive strength.
Accordingly, we will continue to channel both capital and human resources to this area to
boost our R&D capabilities on a global scale.
Accounting for each of the aforementioned, we will channel capital, strategic and R&D
investment totaling ¥1,770 billion to the Social Innovation Business over the three-year period
from fiscal 2010 to fiscal 2012. This represents more than 60% of Hitachi’s total investment
over this period and an increase of ¥170 billion compared with plans established during the
previous year. These increased capital, strategic and R&D investments will help us further our
strategic growth. These efforts will accelerate the global rollout of the Social Innovation
Business and promote continued future growth. Through these endeavors, we will differenti-
ate ourselves from competitors in each of our business fields.
Capital Expenditures and Strategic Investments:
¥1.1 trillion (FY2010-FY2012)
FY2010 FY2012
Investment on the Social Innovation Business: Over ¥1.7 trillion
Information & Telecommunication Systems
Power Systems
Social Infrastructure & Industrial Systems
Construction Machinery
High Function Materials & Components
R&D Investment:
¥670 billion (FY2010-FY2012)
FY2010
120% ¥240 billion
¥200 billion
FY2012
Platforms
Information & Telecommunication Systems
Power Systems
Social Infrastructure & Industrial Systems
Construction Machinery
High Function Materials & Components
218%
¥480 billion
¥220 billion
Focus Business Resources on the Social Innovation Business
Investment on the Social Innovation Business: Over ¥1.7 trillion

12 Hitachi, Ltd. Annual Report 2011
Strengthen the Business Structure to Stabilize Profitability
Strengthen Business Structure to Stabilize Profitability
In our efforts to strengthen our business structure, we are directing our energies in two areas.
We are bolstering the competitiveness of individual businesses including Information and
Telecommunication Systems, Power Systems and Industrial Systems. Simultaneously, we are
strongly reinforcing Group-wide measures to lower our cost structure. For example, we
launched the Hitachi Smart Transformation Project in April 2011 to achieve the cost competi-
tiveness required to succeed in the global arena. We are adhering strictly to such cost struc-
ture reforms as optimizing and consolidating production bases, expanding global sourcing
and reorganizing back-office functions.
Furthermore, we will focus on reinforcing Hitachi’s financial position. In addition to stead-
fastly strengthening stockholders’ equity through the accumulation of earnings, we will pro-
mote the efficiency of assets, reduce interest-bearing debt and secure stable free cash flow.
A New Resolve
The Hitachi Group includes many outstanding individuals who work well as a team and also
excel individually. I am convinced this is the key to generating maximum value. Hitachi is fortu-
nate to attract outstanding human capital from all around the world. In order to prevail amid
increasingly intense global competition, it is vital that we both promptly and optimally position
human capital across the globe. Toward this end, we are working to create a comprehensive
profile of the quality, skills and expertise of personnel in each region worldwide. Group-wide,
we are implementing large-scale reforms to our human capital system in an effort to build
P Transform cost structure to be cost competitive globally
Launched “Hitachi Smart Transformation Project”
P Optimally locate and consolidate production bases, re-evaluate in-house vs. external production
P Expand pool purchase and global sourcing, replace materials in order to reduce the cost of materials
FY2009 Results FY2010 Results FY2012 Targets
Pool purchase ratio 23% 28% 35%
Global sourcing ratio 28% 36% 50%
P Improve operational efficiency, reduce indirect material costs and IT standardization
1. Cost Structure Reform
2. Improve Profitability
3. Reinforce Global Human Capital Management

Hitachi, Ltd. Annual Report 2011 13
a unified personnel platform that encompasses recruitment, compensation, assignment and
education. Utilizing this system to its maximum advantage, we will work to strategically assign
human capital to areas in which we intend to adopt an “offensive” posture. Harnessing our
workforce and technologies, we will adhere strictly to a policy of global management.
Today, the global community and the environment confront such wide-ranging issues as cli-
mate change, threats to the integrity of ecosystems, energy depletion and issues regarding
human rights. On the domestic front, Japan is faced with the critical need to rebuild after the
recent earthquake and to implement a variety of measures to ensure future growth. I am con-
vinced that Hitachi’s mission is to help resolve these fundamental issues that threaten the pros-
perity and well-being of the global and regional community. At the same time, it is vital that we,
together with our business partners, generate new value that can be passed on to the next
generation. By simultaneously creating social and economic value while practicing manage-
ment synonymous with CSR, we will contribute to the realization of a sustainable society. In
this way, we seek to realize our corporate credo that has served as our compass since
Hitachi’s founding. Moving forward, I am committed to achieving our business targets for fiscal
2012 and to fulfilling shareholder expectations by enhancing Hitachi’s corporate value.
As we work toward achieving our established goals, we kindly request the continued sup-
port and understanding of all shareholders.
Hiroaki Nakanishi
President

14 Hitachi, Ltd. Annual Report 2011
Special Feature
Powering Global Expansion with
Our Social Innovation BusinessHitachi is selectively channeling its business resources into the Social Innovation Business, which supplies
advanced social infrastructure linked by information technology (IT).
In this special feature, we introduce several core activities within the Social Innovation Business including
Information and Telecommunication Systems, Power Systems, Railway Systems and Water Environment
Solutions, as well as the supporting Materials and Key Devices.
The Social Innovation Business
Industrial, Transportation and Urban Development Systems
• Energy (thermal, nuclear, renewable)
• Cloud computing
• Consulting
• Data centers
• Storage
Information and Telecommunication
SystemsPower Systems
Materials and Key Devices
+
• Water treatment
• Elevators and escalators
• Green mobility
• Healthcare
• Eco-city
• Construction machinery
• Smart grids

Hitachi, Ltd. Annual Report 2011 15
Powering Global Expansion with
Our Information & Telecommunication Systems Business
In its Information & Telecommunication Systems Business, Hitachi provides highly reliable products and services. In the solutions field, Hitachi offers system integration, consulting, cloud computing and related services. At the same time, Hitachi delivers storage systems, servers, software and other IT platform products.
Hitachi installed its storage system at Klinikum Wels-Grieskirchen, a leading hospital in Austria in 2010. This stor-age system enables the hospital to manage large volumes of patient and operational information through the efficient backup and storage of data. Targeting the corporate and facility sectors, Hitachi’s stor-age system offers such advanced virtualization functions as flexibly connecting multiple and diverse types of storage into what is effectively a single, scalable, universal system. This enables the efficient management and application of stored data. In addition to automatically eliminating duplicate infor-mation, this system also compresses stored data. Among a host of benefits, this advanced storage system helps opti-mize the management of customer data while reducing the operating burden on IT systems administrators.
Harnessing its system solutions capabilities that have been nurtured over many years of experience in large-scale systems development, Hitachi is steadily expanding its busi-ness in Japan by building information systems for compa-nies and government agencies and providing new services such as cloud computing that exhibit outstanding safety and security. Overseas, Hitachi is working to promote global growth across three core businesses. In addition to its plat-form solutions business, which boasts a world-class share of the high-end storage products, Hitachi is working diligently to expand the global network of its consulting business while making plans to launch an integrated IT service business. Looking ahead, Hitachi will further strengthen its opera-tions in Japan and promote growth in its global activities. Through these means, we are expecting to generate consoli-dated revenues in the Information & Telecommunication Systems Business of ¥2,300 billion in fiscal 2015, up from ¥1,652.0 billion in fiscal 2010.
In this instance, a storage system was designed to accommodate the complex and siloed processes of the hospital. This includes a consolidated search function encompassing every facet of the hospital’s operations from electronic health records (EHRs), such image data as X-rays and computerized tomography (CT) scans, through survey and research data used to develop cutting-edge treatment methods to hospital management including finance and accounting. Irrespective of the metadata repository, compre-hensive information can now be seamlessly obtained for specific illnesses. This system has allowed Klinikum Wels-Grieskirchen to efficiently manage the growing volume of high resolution image and other medical data, and to curtail costs, without extra upfront investment.
Hitachi’s high-end storage platform maintains world-class market share.
C a s e S t u d y
Hitachi Storage System Installed at Klinikum Wels-Grieskirchen, One of the Largest Hospitals in Austria

16 Hitachi, Ltd. Annual Report 2011
Hitachi contributes to the power supply of the world through its thermal power generation systems, nuclear power generation systems, renewable energy and power distribution businesses. In the thermal power generation systems business, Hitachi supplies all of the key equipment for coal-fired power plants, such as boilers, turbines, generators and environmental equipment. This comprehensive scope enables the building of optimized power plants. We aim to expand business in emerging countries, where we expect construction of thermal power plants will increase. In the nuclear power generation
Hitachi is active in the global development of coal-fired power generation systems and has participated in the con-struction of more than 20 high efficiency coal-fired power plants mainly in industrialized countries. Recognizing the crit-ical need to respond swiftly to the unique needs of each location, Hitachi’s local bases in each region assume overall responsibility for all major functions including project plan-ning, construction and risk management. On this basis, Hitachi Power Europe GmbH, in Germany, and Hitachi Power Systems America, Ltd., take the lead for projects in Europe and Africa as well as North America, respectively.
systems business in Japan, Hitachi is focusing on measures to enhance safety at existing nuclear power plants, while doing everything it can to help bring about the swift imple-mentation of appropriate action for the accident at the Fukushima Daiichi Nuclear Power Station. Overseas, Hitachi has partnered with General Electric Company to achieve higher involvement in countries that are advancing toward the construction of new nuclear power plants. In the renewable energy business, we aim to expand sales of wind and solar power systems, and we will strengthen the hydroelectric power business through a business tie-up with the Mitsubishi Group. In the power distribution business, Hitachi aims to boost its operations overseas as a systems integrator. Hitachi is accelerating globalization, especially in its ther-mal and nuclear power generation systems businesses, and is expanding services such as maintenance. Through these efforts, we aim to achieve revenues of ¥1,100 billion in the power systems segment by fiscal 2015, from ¥813.2 billion in fiscal 2010.
Compared with previous technologies, the supercritical pres-sure technology that Hitachi is expanding to coal-fired power plants helps enhance economic efficiency while reducing envi-ronmental impact. By continuously generating a high tempera-ture steam in order to increase the steam temperature injected to the turbine, the amount of coal consumption is significantly reduced improving the operating efficiency of power plants. In the future, Hitachi is planning to utilize its supercritical pressure technology in combination with carbon dioxide capture and storage (CCS) technologies in an effort to secure further reduc-tion in environmental impact.
Powering Global Expansion with
Our Power Systems Business
C a s e S t u d y
Step Up the Global Development of High Efficiency Coal-Fired Power Generation Systems
Since 1933 when it made the first steam turbine in Japan, Hitachi has supplied reliable high efficiency tur-bines worldwide.

Hitachi, Ltd. Annual Report 2011 17
Hitachi supplies rolling stock, electrical components, signal-ing / train control systems, traffic management systems, seat reservation systems and other products for railway net-works. Hitachi operates on a global basis as a total systems integrator for railways. Hitachi has an edge on highly efficient rolling stock sys-tems with less environmental footprint, through utilizing light-weight aluminum rolling stock technology which reduces
Hitachi’s moving showcase, the Class 395 high-speed train, runs in the United Kingdom, the birthplace of rail, on the High Speed 1 connecting passengers between London and Dover. The Class 395 started operation in December 2009, and its top speed is 225 kilometers per hour. It takes advan-tage of the lightweight and high-speed technologies devel-oped in Japan and was modified to fit railway specifications in the United Kingdom. It was the first time Hitachi won the maintenance contract for the roll ing stock as well. Maintenance work is done at the newly built base in Ashford.
energy consumption during operation, and hybrid technolo-gies* that combine diesel engines and lithium-ion batteries. Our traffic management systems, in which we hold the top share within the Japanese market, and our signaling / train control systems help ensure the safe and secure operation of railways on tight schedules. In China, we have increased sales in electrical compo-nents and signaling / train control systems while expanding local production of electrical components. In the United Kingdom, we plan to establish a production base for rolling stock. Hitachi is accelerating the global deployment of the tech-nologies cultivated in Japan by strengthening its operations in the United Kingdom, China and emerging countries. Accordingly, we aim to increase revenues in the railway sys-tems business to ¥320 billion by fiscal 2015, from ¥133.1 billion in fiscal 2010.
* Jointly developed with East Japan Railway Company
Hitachi’s railway systems is taking a further leap in the United Kingdom. The Intercity Express Programme (IEP), an initiative led by the Department for Transport (DfT) to upgrade intercity high-speed trains, calls for the purchase of about 500 modern train cars and 30-year maintenance con-tracts. As of July 2011, Hitachi is negotiating with the DfT on the details of the contracts.
Powering Global Expansion with
Our Railway Systems Business
C a s e S t u d y
Hitachi’s High-Speed Train in the United Kingdom
In February 2010, the Class 395 won the Rolling Stock Excellence Award at the Eversholt Rail Business Awards 2009.

18 Hitachi, Ltd. Annual Report 2011
Hitachi is helping to resolve many of the world’s challenges related to water resources, and to improve water environ-ments through the supply of pumps and associated equip-ment, as well as the construction of water treatment plants. Boasting comprehensive strength, Hitachi’s Water Environment Solutions Business activities encompass wide-ranging fields from water and sewage treatment systems through industrial water and wastewater treatment water cir-culation systems to information control systems that help monitor, manage and distribute water, as well as information
Hitachi’s first major foray into the operation and manage-ment of a water and sewage business was taken in the Republic of Maldives. In March 2010, Hitachi took a 20% stake in the Maldivian water and sewage company Male’ Water and Sewerage Company Pvt. Ltd. (“MWSC”) which mainly services the island of Male’, home to approximately one-third of the nation’s population. In addition to streamlin-ing MWSC’s operation and promoting increased energy effi-ciency through the introduction of Hitachi’s energy conservation, IT and environmental technologies, this equity participation will enable Hitachi to acquire further expertise in
systems that offer such peripheral services as fee collection. Overseas, Hitachi has actively participated in projects across approximately 40 countries worldwide since 1975. Building on its strengths, Hitachi has established an impressive track record in the water environment solutions field. Looking ahead, Hitachi will place emphasis on developing Intelligent Water Systems that raise the potential for signifi-cant improvements in efficiency and energy conservation by combining water treatment plant, IT and control technologies. Hitachi is actively participating in water and sewage infra-structure projects mainly throughout the Asian Belt. By extending the scope of its operations to encompass business management, Hitachi is working steadfastly to achieve its established revenue goal of ¥200 billion in fiscal 2015, approximately doubling the results of fiscal 2010. Working in close collaboration with government institutions and local companies, Hitachi is providing optimal solutions that accu-rately incorporate the unique attributes of each region. Moving forward, the Water Environment Solutions Business is taking significant strides to secure a leading position in the field.
drinking water and sewage operations and management. Moreover, steps are being taken to promote the introduction of Intelligent Water Systems that incorporate water pipeline infrastructure management employing mapping system, and the collection of fees. The knowledge and results gained through participation in the operation and management of a water and sewage company in the Maldives will function as a catalyst for new business and proactive participation in water and sewage infrastructure projects in such emerging countries as China.
Powering Global Expansion with
Our Water Environment Solution Business
C a s e S t u d y
Promoting the Introduction of Intelligent Water Systems in the Republic of Maldives
The island of Male’ in the Indian Ocean stretches 2.5 kilometers from east to west and 1.5 kilometers from north to south. One-third of the population lives in the crowded capital of the Maldives.

Hitachi, Ltd. Annual Report 2011 19
Hitachi strives for differentiation in electric power systems, rail-way systems and other major businesses that power our Social Innovation Business. Materials and key devices, includ-ing motors, inverters and lithium-ion batteries, are core ele-ments of its competitiveness and differentiation, and they are also a driving force behind our Social Innovation Business. Our motors and inverters are used widely in elevators, escalators, rolling stock and industrial machinery, and they are key components for improving energy efficiency in products and systems. Demand is emerging for motors and inverters that are more compact and offer higher-performance. In line with advances in electric vehicles and other electric power applications, our market scope has been expanding. Lithium-ion batteries are compact and lightweight, making them ideal for mobile phones and other consumer electronics.
We also engage a broader market for lithium-ion battery applications, such as hybrid and electric vehicles, uninter-ruptible power supplies (UPS) at data centers, and industrial storage for wind and solar power systems, as well as smart grids. Hitachi’s lithium-ion batteries are already widely used in hybrid vehicles, trucks, railways, construction machinery and other applications. In the future, we aim to apply our lith-ium-ion battery technology for the greater benefit of society. Materials are the foundation of our products and systems in the Social Innovation Business. For example, Hitachi Metals, Ltd. produces amorphous metals used in transform-ers on electric power grids and magnets used in motors for automotive, information technology and industrial applica-tions. Hitachi Cable, Ltd. makes wire for power plants and cable for rolling stock. Hitachi Chemical Co., Ltd. handles negative electrodes for lithium-ion batteries used in hybrid and electric vehicles, and also parts for optical and wireless telecommunications equipment, including antennas for radar systems in cars. Hitachi’s materials improve the efficiency and performance of various products and systems. Along with group companies, Hitachi aims to further grow the materials and key devices business as a key part of the Social Innovation Business. Through the development of cutting-edge, superior materials and key devices, we will bolster our competitiveness.
Powering Global Expansion with
Our Materials and Key Devices
Amorphous Metal Materials Magnet Wires for Large-Capacity Transformers
Cable Products for Railways Carbon Anode Materials for Lithium-Ion Batteries
Neodymium-Based Sintered Magnets
Motors Inverters Batteries Power Devices
Materials and Key Devices: Supporting the Social Innovation Business
Materials and Key Devices
Industrial, Transportation and Urban Development Systems
Power SystemsInformation and Telecommunication
Systems

20 Hitachi, Ltd. Annual Report 2011
Financial HighlightsHitachi, Ltd. and Subsidiaries
Years ended March 31, 2011, 2010 and 2009
Millions of yen
Millions of U.S. dollars
2011 2010 2009 2011
For the year: Revenues . . . . . . . . . . . . . . . . . . . . . . . . . . . . . . . . . . . . . ¥9,315,807 ¥8,968,546 ¥10,000,369 $112,239 Operating income . . . . . . . . . . . . . . . . . . . . . . . . . . . . . . . 444,508 202,159 127,146 5,356 Net income (loss) attributable to Hitachi, Ltd. . . . . . . . . . . 238,869 (106,961) (787,337) 2,878 Cash dividends declared . . . . . . . . . . . . . . . . . . . . . . . . . . 36,133 — 9,971 435 Capital investment (Property, plant and equipment) . . . . . . 556,873 546,326 788,466 6,709 Depreciation (Property, plant and equipment) . . . . . . . . . . 382,732 441,697 478,759 4,611 R&D expenditures . . . . . . . . . . . . . . . . . . . . . . . . . . . . . . . 395,180 372,470 416,517 4,761
At year-end: Total assets . . . . . . . . . . . . . . . . . . . . . . . . . . . . . . . . . . . . 9,185,629 8,964,464 9,403,709 110,670 Total Hitachi, Ltd. stockholders’ equity . . . . . . . . . . . . . . . 1,439,865 1,284,658 1,049,951 17,348 D/E ratio (including noncontrolling interests)*1 (times) . . . . . 1.03 — — — D/E ratio (including noncontrolling interests)*2 (times) . . . . . 0.86 1.04 1.29 — Total Hitachi, Ltd. stockholders’ equity ratio (%) . . . . . . . . 15.7 14.3 11.2 —
Number of employees . . . . . . . . . . . . . . . . . . . . . . . . . . . . 361,745 359,746 361,796 —
Yen U.S. dollars
Per share data: Net income (loss) attributable to Hitachi, Ltd. stockholders: Basic . . . . . . . . . . . . . . . . . . . . . . . . . . . . . . . . . . . . . . . ¥ 52.89 ¥ (29.20) ¥(236.86) $0.64 Diluted . . . . . . . . . . . . . . . . . . . . . . . . . . . . . . . . . . . . . . 49.38 (29.20) (236.87) 0.59 Net income (loss) attributable to Hitachi, Ltd.
stockholders per ADS (representing 10 shares): Basic . . . . . . . . . . . . . . . . . . . . . . . . . . . . . . . . . . . . . . . 529 (292) (2,369) 6.37 Diluted . . . . . . . . . . . . . . . . . . . . . . . . . . . . . . . . . . . . . . 494 (292) (2,369) 5.95 Cash dividends declared . . . . . . . . . . . . . . . . . . . . . . . . . . 8.0 — 3.0 0.10 Cash dividends declared per ADS (representing 10 shares) . . 80 — 30 0.96 Total Hitachi, Ltd. stockholders’ equity . . . . . . . . . . . . . . . 318.73 287.13 315.86 3.84
*1 Including non-recourse borrowings of consolidated securitization entities in the consolidated balance sheets*2 Excluding non-recourse borrowings of consolidated securitization entities in the consolidated balance sheets
0
2,000
4,000
10,000
8,000
6,000
12,000(Billions of yen)
0
100
200
400
300
500(Billions of yen)
-800
-400
0
400(Billions of yen)
0
200
400
600
800(Billions of yen)
0
100
400
300
200
500(Billions of yen)
(FY) (FY) (FY)
(FY) (FY)
08 1009
08 1009 08 1009
08 1009 08 1009
Revenues
Capital investment/ Depreciation
� Capital investment � Depreciation
R&D expenditures
Operating income Net income (loss) attributable to Hitachi, Ltd.

Hitachi, Ltd. Annual Report 2011 21
Millions of yen
Millions of U.S. dollars
2011 2010 2009 2011
Japan Revenues . . . . . . . . . . . . . . . . . . . . . . . . . . ¥5,269,259 ¥5,313,790 ¥ 5,861,448 $ 63,485
Percentage of total revenues (%) . . . . . . . . . 57 59 59
Outside Japan
Asia . . . . . . . . . . . . . . . . . . . . . . . . . . . . . . . 2,073,756 1,699,071 1,911,290 24,985
Percentage of total revenues (%) . . . . . . . . . 22 19 19
North America . . . . . . . . . . . . . . . . . . . . . . . 781,139 729,698 899,550 9,411
Percentage of total revenues (%) . . . . . . . . . 8 8 9
Europe . . . . . . . . . . . . . . . . . . . . . . . . . . . . . 760,011 824,697 904,425 9,157
Percentage of total revenues (%) . . . . . . . . . 8 9 9
Other Areas . . . . . . . . . . . . . . . . . . . . . . . . . 431,642 401,290 423,656 5,201
Percentage of total revenues (%) . . . . . . . . . 5 5 4
Subtotal . . . . . . . . . . . . . . . . . . . . . . . . . . . . 4,046,548 3,654,756 4,138,921 48,754
Percentage of total revenues (%) . . . . . . . . . 43 41 41
Total . . . . . . . . . . . . . . . . . . . . . . . . . . . . . . . ¥9,315,807 ¥8,968,546 ¥10,000,369 $112,239
Revenues by Geographic Area
FY2008
¥10,000.3billion
Japan59%
NorthAmerica9%
OutsideJapan
43%
OutsideJapan
41%
OutsideJapan
41%Europe9%
Other Areas4%
Asia19%
FY2009
¥8,968.5billion
Japan59%
North America8%
Europe9%
Other Areas5%
Asia19%
FY2010
¥9,315.8billion
Japan57%
North America8%
Europe8%
Other Areas5%
Asia22%
Notes: 1. The consolidated figures in this annual report are expressed in yen and, solely for the convenience of the reader, have been translated into United States dollars at the rate of ¥83=U.S.$1, the approximate exchange rate prevailing on the Tokyo Foreign Market as of March 31, 2011. See note 3 of the accompanying notes to the consolidated financial statements.
2. In order to be consistent with financial reporting principles and practices generally accepted in Japan, operating income is presented as total revenues less costs of sales and sell-ing, general and administrative expenses. The Company believes that this is useful to investors in comparing the Company’s financial results with those of other Japanese compa-nies. Under accounting principles generally accepted in the United States of America, restructuring charges, net gain or loss on sales and disposal of rental assets and other property and impairment losses for long-lived assets are included as part of operating income. See the consolidated statements of operations and notes 19, 20 and 21 to the con-solidated financial statements.
3. Revenues, segment profit, capital investment, depreciation and assets include “Eliminations and Corporate items.” R&D expenditures includes Corporate items. Number of employ-ees includes Corporate items.
4. The Company has changed the number of employees to exclude temporary employees starting from the year ended March 31, 2010. The figure for the prior year has been restated to reflect the current year presentation.

22 Hitachi, Ltd. Annual Report 2011
• Engine Management Systems
• Electric Powertrain Systems
• Drive Control Systems
• Car Information Systems
• HDDs
• LCDs
• Information Storage Media
• Batteries
• Wires and Cables
• Copper Products
• Semiconductor and Display-Related
Materials
• Circuit Boards and Materials
• Specialty Steels
• Magnetic Materials and Components
• High Grade Casting Components
and Materials
• Systems Integration
• Outsourcing Services
• Software
• Disk Array Subsystems
• Servers
• Mainframes
• Telecommunications Equipment
• ATMs
• Thermal Power Generation Systems
• Nuclear Power Generation Systems
• Hydroelectric Power Generation
Systems
• Wind Power Generation Systems
Revenues by SegmentYear ended March 31, 2011
¥9,315.8 billion
16%
8%
11%
10%
7%
13%
7%
8%
9%
4%
7%
P Information & Telecommunication Systems
¥1,652.0 billion
P Power Systems ¥813.2 billion
P Social Infrastructure & Industrial Systems
¥1,156.9 billion
P Electronic Systems & Equipment ¥1,079.3 billion
P Construction Machinery ¥751.3 billion
P High Functional Materials & Components
¥1,408.1 billion
P Automotive Systems ¥737.9 billion
P Components & Devices ¥809.8 billion
P Digital Media & Consumer Products ¥951.5 billion
P Financial Services ¥372.9 billion
P Others ¥767.4 billion
Eliminations and Corporate Items¥(1,185.0) billion
Power SystemsInformation & Telecommunication Systems
High Functional Materials & Components
Components & DevicesAutomotive Systems
Enterprise Storage Platform
Data Center (Unification Control Center)
Supercritical Pressure Coal-Fired Thermal Power Plant
H-25 Gas Turbines
Hitachi Chemical’s Carbon Anode Materials for Lithium-Ion Batteries
Hitachi Automotive Systems’ Stereo Cameras
2.5-inch Hard Disk Drives by Hitachi Global Storage Technologies
Segment Information

Hitachi, Ltd. Annual Report 2011 23
• Optical Disk Drives
• Flat-Panel Television Sets
• LCD Projectors
• Room Air Conditioners
• Refrigerators
• Washing Machines
• Air-Conditioning Equipment
• Leasing
• Loan Guarantees
• Logistics
• Property Management
• Industrial Machinery and Plants
• Elevators
• Escalators
• Railway Vehicles and Systems
• Semiconductor and LCD
Manufacturing Equipment
• Test and Measurement Equipment
• Medical Electronics Equipment
• Power Tools
• Electronic Parts Manufacturing Systems
• Hydraulic Excavators
• Wheel Loaders
• Mining Dump Trucks
Construction MachineryElectronic Systems & Equipment
Social Infrastructure & Industrial Systems
OthersFinancial ServicesDigital Media & Consumer Products
Hitachi Consumer Electronics’ Ultra-short Throw LCD Projectors
Hitachi Appliances’ Room Air Conditioners
Hitachi Capital’s Corporate CardsHitachi Transport System’s Keihin Distribution Center
Sewage Treatment Plant in Malaysia built by Hitachi Plant Technologies
VX Series EscalatorsHitachi Medical’s Digital Diagnostic Ultrasound Systems
Hitachi High-Technologies’ Device Characterization Systems
Hitachi Construction Machinery’s Hydraulic Excavators

24 Hitachi, Ltd. Annual Report 2011
Millions of yen
Millions of U.S. dollars
FY2010 FY2009 FY2008 FY2010
Revenues . . . . . . . . . . . . . . . . . . . . . . ¥1,652,040 ¥1,705,587 ¥1,945,351 $19,904
Segment profit . . . . . . . . . . . . . . . . . . 98,641 94,592 138,452 1,188
Capital investment (Property, plant and equipment) . . . . 29,646 24,258 30,167 357
Depreciation (Property, plant and equipment) . . . . 35,535 37,724 40,253 428
R&D expenditures . . . . . . . . . . . . . . . . 79,531 82,264 94,049 958
Assets . . . . . . . . . . . . . . . . . . . . . . . . 1,289,099 1,261,016 1,468,481 15,531
Number of employees . . . . . . . . . . . . 70,853 68,409 67,828 —
Share of Revenues
17% 16% FY2009 FY2010
Overseas Revenue Ratio
22% 24% FY2009 FY2010
P Software and Services
Software and services sales were lower year on year. In specific terms, software increased year on year due mainly to higher sales of middleware and storage management software. Services, on the other hand, decreased year on year as a result of systems integration decline reflecting cutbacks in domestic IT-related investment. In overall terms, earnings improved compared with the previous fiscal year. The principal factor was higher year-on-year earnings from services on the back of successful efforts to bolster project management and reduce costs, which more than covered the decline in software earnings due largely to the drop in profits from platform software for mainframes and falling prices.
P Hardware
Hardware sales were down compared with the previous fiscal year. This was mainly attributable to the drop in IT-related investment in Japan, which placed considerable downward pressure on storage-, server-, telecommunications network- and other-related products. From a profit perspective, earnings from storage products were up year on year due to cost cutting and other measures. Buffeted by the drop in revenues and a temporary suspension of operations as a result of the earthquake, earnings from servers, PCs, telecommuni-cations equipment and other products were down. Accounting for each of the aforementioned factors, overall hardware earnings decreased compared with the previous fiscal year.
Segment revenues declined 3% year on year to ¥1,652.0 billion (U.S.$19,904 million) reflect-ing lower software and services as well as hardware sales. Robust storage solutions busi-ness growth in overseas markets arose from sound performance in disk array subsystems as well as related software and services on the back of a recovery in overseas IT-related investment. Persistent cutbacks in IT investment in Japan and the impact of the earthquake accounted for the year-on-year downturn. Segment profit improved 4% to ¥98.6 billion (U.S.$1,188 million) as ongoing initiatives aimed at bolstering project management and successful efforts to curtail costs more than offset the negative impacts of the drop in sales and the damage brought about by the earth-quake.
M Fiscal 2010 Topics
P In order to expand the consulting business overseas, steps were taken to acquire Sierra Atlantic, Inc. in the United States in December 2010, and Aptivo Consulting, S.A. in Spain in January 2011. Earlier in June and August of the previous year, new consulting companies were established in China and India, respectively.
P Hitachi entered into partnership agreements with Telehouse International Corporation of Europe Ltd. of the U.K. and Eco2dc Initiative of the Netherlands in March 2010 and April 2010, respectively, regarding environment-conscious data centers. These moves were aimed at expanding the Group’s data center business overseas.
400
800
1,200
1,600
2,000
0
30
120
150
0
2
60 4
8
90 6
10
0
(Billions of yen)
(FY) 08 1009
Revenues
(Billions of yen) (%)
(FY) 08 1009
Segment profit/Percentage of revenues
� Segment profit � Percentage of revenues
7.1
5.56.0
Information & Telecommunication Systems
Review of Operations

Hitachi, Ltd. Annual Report 2011 25
Millions of yen
Millions of U.S. dollars
FY2010 FY2009 FY2008 FY2010
Revenues . . . . . . . . . . . . . . . . . . . . . . ¥813,207 ¥ 882,135 ¥ 862,389 $ 9,798
Segment profit . . . . . . . . . . . . . . . . . . 22,022 22,075 3,485 265
Capital investment (Property, plant and equipment) . . . . 10,570 31,149 28,959 127
Depreciation (Property, plant and equipment) . . . . 17,848 22,096 20,708 215
R&D expenditures . . . . . . . . . . . . . . . . 16,401 17,629 15,318 198
Assets . . . . . . . . . . . . . . . . . . . . . . . . 919,676 1,067,072 1,026,637 11,080
Number of employees . . . . . . . . . . . . 16,852 15,977 15,611 —
Share of Revenues
9% 8% FY2009 FY2010
Overseas Revenue Ratio
40% 39% FY2009 FY2010
P Thermal Power Generation Systems
Sales were down compared with the previous fiscal year due mainly to delays in the progress of certain coal-fired power generation system projects in overseas markets. This drop in sales was also caused by restrictions in the shipment of products as well as delays in product receipt and inspections by customers as a result of the earthquake. Earnings were down compared with the previous fiscal year. Despite the positive effects of wide-ranging measures including efforts to bolster project management, this downturn in earnings was largely attributable to the year-on-year decrease in revenues and the impact of the earthquake including temporary suspensions in factory operations.P Nuclear Power Generation Systems
Sales decreased year on year. In the fiscal year under review, new plant construction was firm in Japan. This positive environment was unable to offset the substantial drop in preventative maintenance projects and delays in product shipments as well as product quality inspections by customers as a result of the earthquake. Reflecting the downturn in revenues, temporary suspensions in factory operations following the earthquake and other factors, earn-ings declined compared with the previous fiscal year.
P Others
Delays in product shipment and other negative impacts attributable to the earthquake, were offset by solid results in such industrial-use electric devices as power semiconductors. As a result, sales were unchanged from the previous fiscal year. From a profit perspective, concerted efforts to cut costs more than made up for the negative impact of temporary suspensions in factory operations following the earthquake. Taking the aforementioned into consideration, earnings grew substantially year on year.
Segment revenues decreased 8% year on year to ¥813.2 billion (U.S.$9,798 million). This decrease mainly reflected lower year on year sales from thermal power generation systems due to certain projects being pushed back in overseas markets and lower sales recorded for preventative maintenance services for nuclear power generation systems. The Great East Japan Earthquake also affected the figures. Segment profit was essentially unchanged from the previous fiscal year at ¥22.0 billion (U.S.$265 million). During the fiscal year under review, improvements in project manage-ment, progress with cost reductions and other factors offset the impacts of lower revenues and the earthquake.
M Fiscal 2010 Topics
P The Company, Mitsubishi Electric Corporation and Mitsubishi Heavy Industries, Ltd. reached a basic agree-ment in March 2011 to consolidate their hydroelectric power generation system operations in an effort to strengthen and expand business activities in this area.
P Hitachi established two joint-venture companies in India with BGR Energy Systems Limited, a leading EPC company for power plants. The two joint-venture companies set up in August and September 2010 will design, manufacture, sell and service boilers and steam turbines/generators for super critical thermal power generation.
250
500
750
1,000
0
30
0
10 1
20 2
3
0
08 1009
08 1009
0.4
2.5
2.7
(Billions of yen)
Revenues
(Billions of yen) (%)
(FY)
Segment profit/Percentage of revenues
� Segment profit � Percentage of revenues
Power Systems

26 Hitachi, Ltd. Annual Report 2011
P Social Infrastructure and Industrial Systems
Sales of the Industrial & Social Infrastructure Systems Company con-tracted compared with the previous fiscal year. This largely reflected the drop in overseas railway systems business projects and delays in product shipment as well as receipt and inspections by customers as a result of the earthquake. Sales recorded by Hitachi Plant Technologies, Ltd. were also affected by delays in product shipment as well as receipt and inspections by customers as a result of the earthquake. Due to these and other factors, revenues fell below levels recorded in the previous fiscal year. While impacted by delays in product shipment as well as receipt and inspections by customers as a result of the earthquake, Hitachi Industrial Equipment Systems Co., Ltd. reported higher year-on-year revenues. This was largely attributable to the recovery in capital expenditure.
Both the Industrial & Social Infrastructure Systems Company and Hitachi Plant Technologies, Ltd. incurred a year-on-year drop in earn-ings owing mainly to the drop in revenues, the impact of temporary suspensions in factory operations in the aftermath of the earthquake and losses on the disposal of inventories. In contrast, Hitachi Industrial Equipment Systems Co., Ltd. experi-enced year-on-year earnings growth. Despite the impact of tempo-rary suspensions in factory operations as a result of the earthquake, losses on the disposal of inventories and other negative factors, this was largely thanks to the upswing in revenues and successful cost-cutting measures.P Urban Planning and Development Systems
Buoyed by robust sales of elevators and escalators in China, reve-nues in the Urban Planning and Development business increased year on year. Earnings were also higher year on year due mainly to higher sales and successful efforts to reduce costs. This was achieved despite the incidence of fixed asset-related expenses in the aftermath of the earthquake.
Segment revenue decreased 7% year on year to ¥1,156.9 billion (U.S.$13,939 million). While sales of elevators and escalators witnessed robust growth in China, and industrial equip-ment recovered to surpass levels recorded in the previous fiscal year on the back of recov-ery in capital expenditures, the overall decline was mainly due to the impact of the Great East Japan Earthquake, in addition to lower overseas sales of rolling stocks and systems and a drop in revenues resulting from a transactional change in the method in which certain products were manufactured. Segment profit decreased 5% year on year to ¥39.9 billion (U.S.$481 million). Despite an increase in overseas earnings from such items as elevators and escalators, this decrease was attributable to a number of factors including the downturn in revenues and the impact of the earthquake.
M Fiscal 2010 Topics
P In the fiscal year under review, Hitachi put in place a variety of measures aimed at expanding its overseas intra-city railway systems business. In June 2010, the Company and Mitsubishi Heavy Industries, Ltd. entered into a basic agreement to work cooperatively in the field of intra-city railway systems for overseas markets. In October of the same year, Hitachi executed an agreement on strategic alliance in electrical components for rolling stock in overseas markets with Toyo Denki Seizo K.K. More recently in December 2010, the Company decided to establish a new plant for the manufacture of electrical components for rolling stock in China.
P In November 2010, Hitachi entered into an agreement with Chengdu Xingrong Group Co. Ltd., a major con-glomerate in China, to cooperate in the field of water environment solutions. This and other initiatives are aimed at expanding the Group’s overseas water environment solutions business.
P In order to boost elevator and escalator business activities in the Asian Belt, Hitachi launched a regional head-quarters for its elevator and escalator business in Singapore covering Southeast Asia, India and the Middle East in October 2010.
500
1,000
1,500
0
50
0
10 1
20 2
30 3
40 4
5
0
08 1009
08 1009
2.6
3.4 3.5
(Billions of yen)
Revenues
(Billions of yen) (%)
(FY)
(FY)
Segment profit/Percentage of revenues
� Segment profit � Percentage of revenues
Social Infrastructure & Industrial Systems
Share of Revenues
12% 11% FY2009 FY2010
Overseas Revenue Ratio
23% 23% FY2009 FY2010
Millions of yen
Millions of U.S. dollars
FY2010 FY2009 FY2008 FY2010
Revenues . . . . . . . . . . . . . . . . . . . . . . ¥1,156,936 ¥1,250,225 ¥1,334,246 $13,939
Segment profit . . . . . . . . . . . . . . . . . . 39,952 42,086 34,406 481
Capital investment (Property, plant and equipment) . . . . 17,980 25,388 40,326 217
Depreciation (Property, plant and equipment) . . . . 21,067 25,345 26,204 254
R&D expenditures . . . . . . . . . . . . . . . . 21,508 19,999 22,834 259
Assets . . . . . . . . . . . . . . . . . . . . . . . . 1,033,110 971,743 1,098,712 12,447
Number of employees . . . . . . . . . . . . 39,240 42,980 42,086 —

Hitachi, Ltd. Annual Report 2011 27
P Hitachi High-Technologies Corporation
Sales increased year on year due to a number of factors. Despite delays in product shipments and other issues encountered as a result of the earthquake as well as a drop in science and medical systems results, Hitachi High-Technologies Corporation experienced robust sales of a wide range of its products including semiconductor manufacturing equipment mainly for dry etch systems and scanning electron micro-scopes (SEMs), such back-end assembly equipment as chip mounters and die bonders as well as LCD-related manufacturing equipment. Earnings from science and medical systems declined year on year owing mainly to the impacts of fluctuations in foreign currency exchange rates, temporary suspensions in factory operations as a result of the earthquake and other factors. In overall terms, however, Hitachi High-Technologies Corporation enjoyed a return to profitabili-ty. This improvement in earnings largely reflected increased revenues from semiconductor and LCD-related manufacturing equipment.P Hitachi Medical Corporation
Despite such factors as delays in product shipment as well as receipt and inspections by customers as a result of the earthquake, sales increased compared with the previous fiscal year. In addition to firm sales of ultrasound systems for medical diagnosis, this upswing was attributable to the acquisition of Aloka Co., Ltd. Earnings were also up year on year owing mainly to the increase in sales, successful efforts to reduce costs and the acquisition of Aloka Co., Ltd. which more than offset the negative impact of such factors
as temporary suspensions in factory operations in the aftermath of the earthquake.P Hitachi Kokusai Electric Inc.
Sales surpassed levels recorded in the previous fiscal year. While shipments of certain communications and information systems-relat-ed products were delayed as a result of the earthquake, this favor-able performance reflected robust sales of semiconductor manufacturing systems-related products. The company saw a return to the black in the fiscal year under review despite temporary suspensions in factory operations due to the earthquake and other factors. This positive turnaround was the result of higher sales of semiconductor manufacturing systems-relat-ed products and the cutting of costs.P Hitachi Koki Co., Ltd.
Sales increased year on year on the back of growth mainly in emerg-ing markets including Russia, India and China. This was in turn attributable to successful efforts to strengthen sales channels and to cultivate new customers and despite the negative impact of fluctua-tions in foreign currency exchange rates. Earnings were essentially unchanged from the previous fiscal year. Fluctuations in foreign currency exchange rates, delays in product shipments due to the earthquake and other factors were offset by cut-backs in costs due to the shift of production to plants in China and the promotion of a variety of measures including reduction in inventories.
Segment revenues increased 8% year on year to ¥1,079.3 billion (U.S.$13,004 million). Despite the impact of the Great East Japan Earthquake, the increase in revenues mainly reflected higher sales of semiconductor and LCD manufacturing equipment, electronic component processing and other equipment in line with the pickup in capital expenditures in electronic fields including semiconductors. While affected by the earthquake, segment profit turned around ¥42.5 billion compared with the previous fiscal year, returning to the black at ¥37.2 billion (U.S.$449 million). This was largely attributable to higher sales of semiconductor and LCD manufacturing equip-ment, electronic component processing equipment and other products.
M Fiscal 2010 Topics
P In order to bolster its medical electronics equipment business including ultrasound systems for medical use, Hitachi Medical Corporation made Aloka Co., Ltd. (currently Hitachi-Aloka Medical, Ltd.), which is a manufacturer of medical equipment, a consolidated subsidiary in January 2011.
300
600
900
1,200
0
40
-10
0 0
10 1
20 2
30 3
4
-1
08 1009
08 1009
2.6
-0.5
3.5
(Billions of yen)
Revenues
(Billions of yen) (%)
(FY)
(FY)
Segment profit (loss)/Percentage of revenues
� Segment profit � Percentage of revenues
Electronic Systems & Equipment
Share of Revenues
10% 10% FY2009 FY2010
Overseas Revenue Ratio
48% 53% FY2009 FY2010
Millions of yen
Millions of U.S. dollars
FY2010 FY2009 FY2008 FY2010
Revenues . . . . . . . . . . . . . . . . . . . . . . ¥1,079,355 ¥998,632 ¥983,821 $13,004
Segment profit (loss) . . . . . . . . . . . . . . 37,284 (5,218) 25,755 449
Capital investment (Property, plant and equipment) . . . . 13,332 10,342 12,034 161
Depreciation (Property, plant and equipment) . . . . 13,267 16,146 12,405 160
R&D expenditures . . . . . . . . . . . . . . . . 45,137 44,115 30,866 544
Assets . . . . . . . . . . . . . . . . . . . . . . . . 867,741 820,700 829,126 10,455
Number of employees . . . . . . . . . . . . 25,597 24,576 25,051 —

28 Hitachi, Ltd. Annual Report 2011
P Hitachi Construction Machinery Co., Ltd.
In the fiscal year under review, the company’s performance was affected by such factors as the temporary suspension of factory operations as a result of the earthquake. Robust demand for con-struction machinery, particularly hydraulic excavators, was under-pinned by brisk activity in emerging markets including China and Southeast Asia mainly for the development of social infrastructure. Resource development in countries such as Australia also fed demand. Coupled with the conversion of Telco Construction Equipment Co., Ltd. into a consolidated subsidiary in the India, reve-nues surpassed levels recorded in the previous fiscal year.
While buffeted by such factors as losses relating to a portion of the company’s production equipment and inventories in the after-math of the earthquake, earnings increased substantially year on year due mainly to the upswing in revenues from construction machinery, particularly hydraulic excavators.
Segment revenues increased 29% year on year to ¥751.3 billion (U.S.$9,053 million). Despite the impact of the earthquake, results were buoyed by strong sales of hydraulic excavators and other machinery in such emerging markets as China and Southeast Asia as well as Australia. In March 2010, Hitachi Construction Machinery Co., Ltd. raised its equity interest in Telco Construction Equipment Co., Ltd. to make it a consolidated subsidiary, which also boosted segment revenues. Segment profit surged 179% year on year to ¥49.1 billion (U.S.$593 million). Despite the negative impact of the earthquake, this was largely attributable to the increase in revenues.
M Fiscal 2010 Topics
P In November 2010, Hitachi Construction Machinery Co., Ltd. reached an agreement to construct a factory to manufacture hydraulic excavators with Tver Oblast authorities in Russia.
200
400
600
800
0
60
0
20 3
40 6
9
0
08 1009
08 1009
7.1
3.0
6.5
(Billions of yen)
Revenues
(Billions of yen) (%)
(FY)
(FY)
Segment profit/Percentage of revenues
� Segment profit � Percentage of revenues
Construction Machinery
Share of Revenues
6% 7% FY2009 FY2010
Overseas Revenue Ratio
71% 78% FY2009 FY2010
Millions of yen
Millions of U.S. dollars
FY2010 FY2009 FY2008 FY2010
Revenues . . . . . . . . . . . . . . . . . . . . . . ¥ 751,387 ¥583,636 ¥724,689 $ 9,053
Segment profit . . . . . . . . . . . . . . . . . . 49,192 17,649 51,337 593
Capital investment (Property, plant and equipment) . . . . 36,557 32,851 66,748 440
Depreciation (Property, plant and equipment) . . . . 35,236 39,152 35,978 425
R&D expenditures . . . . . . . . . . . . . . . . 15,888 15,451 15,141 191
Assets . . . . . . . . . . . . . . . . . . . . . . . . 1,000,793 927,482 840,693 12,058
Number of employees . . . . . . . . . . . . 19,218 19,063 16,890 —

Hitachi, Ltd. Annual Report 2011 29
P Hitachi Metals, Ltd.
Sales increased significantly compared with the previous fiscal year. This largely reflected favorable performances in high-grade metal products and materials including materials for molds and tool steel for automobiles, amorphous metal and other soft magnetic materi-als, electronic and IT devices including magnets for household appli-ance and automotive use and such high-grade functional components and equipment as casting components. Earnings grew substantially year on year. Despite sharp rises in material costs and the drop in capacity utilization due to rolling blackouts, this dramatic improvement in earnings was attributable mainly to higher sales and cost reductions.P Hitachi Cable, Ltd.
Sales improved year on year. While Hitachi Cable, Ltd. was confronted by difficulties with respect to a portion of its production activities in the aftermath of the earthquake, this improvement in sales was mainly the result of the recovery in demand for electronics- and automotive-relat-ed products as well as an upswing in product prices reflecting the high cost of copper throughout the fiscal year under review. Against this backdrop, sales of magnet wires, electronic wires, wiring devices and metallic materials including copper products were firm. From a profit perspective, earnings were impacted by such factors as fluctuations in foreign currency exchange rates, the sharp rise in
material costs, fixed asset-related expenditure due to the earthquake and suspension in operations of certain production bases. This was, however, more than offset by the increase in revenues and cost-cut-ting measures. As a result, the company recorded a return to profit-ability compared with the previous fiscal year.P Hitachi Chemical Co., Ltd.
Sales increased year on year despite the impact of the earthquake on a portion of the company’s production activities. In addition to robust results in advanced components and systems including molded prod-ucts and lead-acid batteries for automobiles, this favorable perfor-mance was largely attributable to increased sales of such semiconductor-related materials as epoxy molding compounds and slurry for chemical mechanical planarization and advanced perfor-mance products including carbon anode materials for lithium-ion bat-teries. Earnings improved compared with the previous fiscal year. The steady upswing in revenues and successful efforts to reduce costs more than outweighed the negative impacts of foreign currency exchange rate movements, the sharp rise in material costs, stoppag-es in production activity at certain bases as a result of the earth-quake and other factors.
Segment revenues increased 13% year on year to ¥1,408.1 billion (U.S.$16,966 million). This result reflects the recovery in demand in each of the automotive-related components and elec-tronics fields, which led to solid sales of automotive-, semiconductor and LCD-related products. Segment profit jumped 90% year on year to ¥84.5 billion (U.S.$1,018 million). Despite the neg-ative impact of the earthquake, this outstanding performance was the result of higher sales.
M Fiscal 2010 Topics
P Hitachi Metals, Ltd. established a joint venture (Japan Aeroforge, Ltd.) in March 2011 to manufacture large forgings for use in aircrafts and power plants together with Kobe Steel, Ltd., IHI Corporation and Kawasaki Heavy Industries, Ltd.
P Hitachi Cable, Ltd. decided in January 2011 to establish a production base for the manufacture of wires for rolling stock as well as heat-resistant wires in Suzhou, China.
P Hitachi Chemical Co., Ltd. decided in September 2010 to establish a production base for the manufacture of powder metal products in Indonesia and decided in October 2010 to establish a production base for the man-ufacture of advanced performance resins and chemical materials in Jiangsu Province, China.
400
800
1,200
1,600
0
100
0
20 2
40 4
80 8
60 6
10
0
08 1009
08 1009
1.6
3.6
6.0
(Billions of yen)
Revenues
(Billions of yen) (%)
(FY)
(FY)
Segment profit/Percentage of revenues
� Segment profit � Percentage of revenues
High Functional Materials & Components
Share of Revenues
12% 13% FY2009 FY2010
Overseas Revenue Ratio
37% 38% FY2009 FY2010
Millions of yen
Millions of U.S. dollars
FY2010 FY2009 FY2008 FY2010
Revenues . . . . . . . . . . . . . . . . . . . . . . ¥1,408,153 ¥1,249,327 ¥1,561,045 $16,966
Segment profit . . . . . . . . . . . . . . . . . . 84,506 44,412 25,257 1,018
Capital investment (Property, plant and equipment) . . . . 60,727 49,728 104,319 732
Depreciation (Property, plant and equipment) . . . . 68,817 78,542 81,884 829
R&D expenditures . . . . . . . . . . . . . . . . 46,736 44,843 50,973 563
Assets . . . . . . . . . . . . . . . . . . . . . . . . 1,267,001 1,264,372 1,232,271 15,265
Number of employees . . . . . . . . . . . . 48,745 47,342 49,408 —

30 Hitachi, Ltd. Annual Report 2011
During the fiscal year under review, operating conditions in the auto-motive systems segment were impacted by such factors as delays in the shipment of products as a result of the earthquake. Despite this difficult environment, sales increased year on year on account of robust sales across all business divisions including engine manage-ment systems. The segment benefited from the recovery in global-scale automobile production on the back of increased new vehicle sales mainly in the United States and emerging countries.
Earnings improved substantially returning to the black in the fiscal year under review. Despite such factors as the temporary suspen-sions in factory operations and fixed asset-related expenditure as a result of the earthquake, the segment enjoyed the benefits of busi-ness structure reforms that it had continued to put in place for a considerable amount of time. The dramatic turnaround in profits was also the result of improvements in capacity utilization.
Segment revenues increased 16% year on year to ¥737.9 billion (U.S.$8,890 million) despite the negative impact of the Great East Japan Earthquake. This increase reflected healthy growth in demand for automotive equipment, which mirrored the increase of automobile manufacturers’ production in response to automobile sales growth, particularly in the United States and emerging countries. From a segment loss in the previous fiscal year, earnings improved ¥29.2 billion for a return to segment profit of ¥23.7 billion (U.S.$287 million). While feeling the effects of the earthquake, this positive about-face reflected the fruits of past business structure reform measures and improvements in capacity utilization in line with the recovery in automotive equipment demand.
M Fiscal 2010 Topics
P Three automotive equipment subsidiaries in the United States were consolidated to form a regional headquar-ters in January 2011 in order to promote a locally led framework that would ensure a swift decision-making process across each of the sale, marketing and product development functions of the automotive equipment business.
200
400
600
800
0
50
-100
-50 -10
0 0
10
-20
08 1009
08 1009
-8.9-0.9
3.2
(Billions of yen)
Revenues
(Billions of yen) (%)
Segment profit (loss)/Percentage of revenues
� Segment profit � Percentage of revenues
(FY)
(FY)
Automotive Systems
Share of Revenues
6% 7% FY2009 FY2010
Overseas Revenue Ratio
42% 42% FY2009 FY2010
Millions of yen
Millions of U.S. dollars
FY2010 FY2009 FY2008 FY2010
Revenues . . . . . . . . . . . . . . . . . . . . . . ¥737,901 ¥638,828 ¥681,750 $8,890
Segment profit (loss) . . . . . . . . . . . . . . 23,791 (5,486) (60,507) 287
Capital investment (Property, plant and equipment) . . . . 17,341 15,215 39,635 209
Depreciation (Property, plant and equipment) . . . . 27,438 35,916 38,754 331
R&D expenditures . . . . . . . . . . . . . . . . 45,350 38,410 63,136 546
Assets . . . . . . . . . . . . . . . . . . . . . . . . 451,382 459,183 450,966 5,438
Number of employees . . . . . . . . . . . . 25,599 24,602 26,839 —

Hitachi, Ltd. Annual Report 2011 31
P Hard Disk Drives (Hitachi Global Storage Technologies (Hitachi GST))
Sales surged substantially year on year. In the fiscal year under review, shipments of HDDs and particularly mainstay 2.5-inch prod-ucts increased. This was largely attributable to firm demand for PC use and particularly notebook PCs, as well as servers. Buoyed by the release of new products and the subsequent upswing in sales, coupled with successful efforts to reduce costs, earnings were higher than the previous fiscal year.
Note: Hitachi GST has a December 31 fiscal year-end. As a result, fiscal 2010 for this company was the period from January 2010 to December 2010.
P Battery Systems Company (Hitachi Maxell, Ltd. and Hitachi Vehicle Energy, Ltd.)
Sales declined year on year. Despite firm sales of batteries including prismatic lithium-ion rechargeable and micro batteries at Hitachi Maxell, Ltd., this downturn in sales reflected the drop in such prod-ucts as optical disks and computer tapes. While cost-cutting measures helped improve profits from computer tapes at Hitachi Maxell, Ltd., returns from the company’s prismatic lithi-um-ion rechargeable batteries and other products deteriorated due to such factors as fluctuations in foreign currency exchange rates. In addi-tion to the aforementioned, the company was confronted by difficul-ties in component procurement owing to the earthquake. As a result the loss in the battery systems company increased year on year.
P Liquid Crystal Displays (Hitachi Displays, Ltd.)
Sales decreased year on year on account of such factors as delays in the shipment of products as a result of the earthquake and lower sales of small and medium-sized displays for overseas mobile phones and game consoles. This was also despite the commencement of shipments of medium-sized displays for tablet PCs and robust results in high-resolution products for domestic mobile phones. Despite temporary suspensions in factory operations in the after-math of the earthquake and losses on the disposal of inventories and other factors, the loss for the period was reduced by the benefits of business structure reform and improvements in the product mix.
Segment revenues increased 7% year on year to ¥809.8 billion (U.S.$9,757 million) reflecting robust sales on the back of solid demand for hard disk drives (HDDs) for use in PCs and servers. Segment profit was up ¥42.5 billion to ¥43.6 billion (U.S.$526 million) with the increase in HDD sales, the release of new products and efforts to reduce costs more than offsetting the impact on operations of the earthquake.
M Fiscal 2010 Topics
P Hitachi decided in March 2011 to transfer its HDD business to Western Digital Corporation.P Hitachi Displays, Ltd. granted its IPS LCD technology to Taiwanese LCD manufacturer Chimei Innolux
Corporation; contracted production of medium-sized IPS liquid crystal panels for use in tablet PCs commenced.
200
400
600
800
1,000
0
50
0
10 2
20 4
30 6
40 8
10
0
08 1009
08 1009
0.6 0.2
5.4
(Billions of yen)
Revenues
(Billions of yen) (%)
Segment profit/Percentage of revenues
� Segment profit � Percentage of revenues
(FY)
(FY)
Components & Devices
Share of Revenues
7% 8% FY2009 FY2010
Overseas Revenue Ratio
70% 74% FY2009 FY2010
Millions of yen
Millions of U.S. dollars
FY2010 FY2009 FY2008 FY2010
Revenues . . . . . . . . . . . . . . . . . . . . . . ¥809,852 ¥754,889 ¥978,297 $9,757
Segment profit . . . . . . . . . . . . . . . . . . 43,652 1,149 5,799 526
Capital investment (Property, plant and equipment) . . . . 56,632 39,038 62,698 682
Depreciation (Property, plant and equipment) . . . . 53,165 62,935 77,244 641
R&D expenditures . . . . . . . . . . . . . . . . 74,069 69,160 78,968 892
Assets . . . . . . . . . . . . . . . . . . . . . . . . 592,992 585,999 640,824 7,144
Number of employees . . . . . . . . . . . . 55,474 51,304 50,085 —

32 Hitachi, Ltd. Annual Report 2011
P Digital Media
Sales fell year on year. With respect to flat-panel TVs, Japan’s eco-points program provided considerable support ensuring perfor-mance on a par with the previous fiscal year, despite earthquake caused delays in shipments. The slump in demand and drop in pric-es of optical disk drives led to the decline in overall sales. The loss in Digital Media significantly narrowed from the previous fiscal year. In addition to the decline in sales and falling prices of opti-cal disk drive-related products, lower shipments of flat-panel TVs had negative impact on earnings. The substantial improvement, on the other hand, reflected the success of past business structure reforms in flat-panel TV operations.
P Comprehensive Air Conditioning and Home Appliances
Sales increased compared with the previous fiscal year. In Japan, air conditioning equipment performed well on the back of a recovery in capital expenditures. At the same time, sales of room air condition-ers and home appliances were robust due mainly to the extreme heat during summer and the positive flow-on effects of the eco-points program. Overseas, home appliances and air conditioners also performed strongly. Earnings rose substantially year on year. This was despite the impact of delays in product shipments and the incidence of fixed asset-related expenses as a result of the earthquake. In Japan, prof-its increased owing to improved earnings in air conditioning equip-ment and room air conditioners. Overseas, home appliance and room air conditioner profits declined due mainly to fluctuations in for-eign currency exchange rates and the sharp rise in material prices. This was more than offset by increased earnings in air conditioning equipment, which led to an upswing in overseas earnings year on year.
Segment revenue increased 2% year on year to ¥951.5 billion (U.S.$11,465 million). While sales of optical disk drive-related products declined due mainly to a sluggish demand and falling prices, this modest increase was largely attributable to an upswing in domestic sales of such products as room air conditioners and refrigerators reflecting the positive flow-on effects of Japan’s eco-points program and the recovery in capital expenditures for air-con-ditioning equipment both in and outside Japan. From a profit perspective, the segment returned to the black. Segment profit totaled ¥14.9 billion (U.S.$180 million), a turnaround of ¥22.1 billion compared with the previous fiscal year. Despite the effects of the earthquake, this improvement reflected the fruits of past business structure reforms in flat-panel TV operations as well as higher sales of air condi-tioning equipment and room air conditioners.
M Fiscal 2010 Topics
P Hitachi Appliances, Inc. merged with Hitachi Lighting, Ltd., the lighting business company, in October 2010.
300
600
900
1,200
0
60
-120
-60 -10
0 0
10
-20
08 1009
08 1009
-10.0-0.8
1.6
(Billions of yen)
Revenues
(Billions of yen) (%)
Segment profit (loss)/Percentage of revenues
� Segment profit � Percentage of revenues(FY)
(FY)
Digital Media & Consumer Products
Share of Revenues
9% 9% FY2009 FY2010
Overseas Revenue Ratio
48% 46% FY2009 FY2010
Millions of yen
Millions of U.S. dollars
FY2010 FY2009 FY2008 FY2010
Revenues . . . . . . . . . . . . . . . . . . . . . . ¥951,596 ¥929,258 ¥1,103,860 $11,465
Segment profit (loss) . . . . . . . . . . . . . . 14,949 (7,206) (110,548) 180
Capital investment (Property, plant and equipment) . . . . 14,729 14,728 27,990 177
Depreciation (Property, plant and equipment) . . . . 20,373 23,803 36,886 245
R&D expenditures . . . . . . . . . . . . . . . . 23,807 18,775 22,939 287
Assets . . . . . . . . . . . . . . . . . . . . . . . . 434,397 521,591 570,935 5,234
Number of employees . . . . . . . . . . . . 26,253 26,491 29,649 —

Hitachi, Ltd. Annual Report 2011 33
P Hitachi Capital Corporation
Commission income businesses including outsourcing services per-formed well. Taking into consideration the absence of large cancella-tion receipts on leasing operations recorded to sales in the previous fiscal year, revenues declined year on year.
While buffeted by the impact of non-recoverable assets and other factors as a result of the earthquake, earnings rose substantially compared with the previous fiscal year. This largely reflected successful efforts to strengthen credit exposure management and reduce financing costs in the U.S. and Europe, and the recording of earnings related to receivables that were recorded as gains on sales up through to March 31, 2010 in line with the consolidation of secu-ritization entities based on new U.S. GAAP accounting standards.
Segment revenue decreased 11% year on year to ¥372.9 billion (U.S.$4,494 million). Despite healthy growth in outsourcing and other businesses that generate revenues from commis-sion services, this downturn was largely attributable to the recording to sales of large can-cellation penalty receipts on leasing operations in the previous fiscal year. Notwithstanding the impact of the earthquake, segment profit improved 67% to ¥14.2 bil-lion (U.S.$172 million). This was due to successful efforts to strengthen credit exposure management and reduce financing costs in the U.S. and Europe as well as the consolidation of securitization entities based on new accounting standards.
M Fiscal 2010 Topics
P Hitachi Capital Corporation signed a basic agreement to commence talks on a business and capital alliance with Sumitomo Mitsui Auto Service Company, Limited in March 2011 with the aim of forming a strategic joint partnership in the auto leasing business.
100
200
300
400
500
0
15
0
5 2
10 4
6
0
08 1009
08 1009
1.72.0
3.8
(Billions of yen)
Revenues
(Billions of yen) (%)
Segment profit/Percentage of revenues
� Segment profit � Percentage of revenues(FY)
(FY)
Financial Services
Share of Revenues
4% 4% FY2009 FY2010
Overseas Revenue Ratio
12% 13% FY2009 FY2010
Millions of yen
Millions of U.S. dollars
FY2010 FY2009 FY2008 FY2010
Revenues . . . . . . . . . . . . . . . . . . . . . . ¥ 372,981 ¥ 419,650 ¥ 401,317 $ 4,494
Segment profit . . . . . . . . . . . . . . . . . . 14,255 8,518 6,660 172
Capital investment (Property, plant and equipment) . . . . 282,503 295,611 361,444 3,404
Depreciation (Property, plant and equipment) . . . . 58,842 65,224 69,594 709
R&D expenditures . . . . . . . . . . . . . . . . 212 128 295 3
Assets . . . . . . . . . . . . . . . . . . . . . . . . 1,937,643 1,789,409 1,914,863 23,345
Number of employees . . . . . . . . . . . . 3,220 3,429 3,539 —

34 Hitachi, Ltd. Annual Report 2011
P Hitachi Transport System, Ltd.
Sales increased year on year. In the domestic logistics business, the company experienced strong growth in new contracts for third-party logistics in such fields as retailing and lifestyle-related areas. Moreover, revenues were up compared with the previous fiscal year due to the inclusion of distribution subsidiaries of DIC Corporation and Homac Corp., a company engaged in home center activities and a consolidated subsidiary of DCM Holdings Co., Ltd., in the company’s scope of consolidation. In the global logistics business, the company witnessed an increase in its global third-party logistics solutions operations which encompass contract services of procurement through to sales both in and outside Japan. Results were also buoyed by acquisitions in North America, Europe, China and Asia aimed at expanding the company’s global network.
Earnings rose substantially compared with the previous fiscal year. Despite a drop in transportation volumes due to the earthquake, this favorable result reflected the increase in revenues, improved trans-port and operating efficiencies, and other factors including reduced costs.
Segment revenues were essentially unchanged from the previous fiscal year amounting to ¥767.4 billion (U.S.$9,247 million) as higher revenues at Hitachi Transport System, Ltd. on healthy growth in third-party logistics solutions were mainly offset by the impact of the transfer in June 2010 of the Hitachi Group’s internal food service business. Despite the impact of the earthquake, segment profit improved 49% year on year to ¥28.9 billion (U.S.$349 million). This was largely due to higher earnings in line with increased reve-nues at Hitachi Transport System, Ltd.
M Fiscal 2010 Topics
P The Hitachi Group transferred its food services business to Nissin Healthcare Food Service Co., Ltd. in June 2010.
P In order to bolster its logistics business, Hitachi Transport System made Flyjac Logistics Pvt. Ltd. a consolidat-ed subsidiary in April 2010, and subsequently consolidated the Chinese company Dahang International Transportation Co., Ltd., a previous equity-method affiliate, in December 2010. The Company also included distribution subsidiaries of DIC Corporation and Homac Corp., a company engaged in home center activities and a consolidated subsidiary of DCM Holdings Co., Ltd., in the company’s scope of consolidation in January 2011 and February 2011, respectively. Furthermore, the Company decided to make Vantec Corporation, which is a logistics company for automotive parts, a consolidated subsidiary from April 2011.
200
400
600
800
1,000
0
30
0
10 2
20 4
6
0
08 1009
08 1009
3.02.5
3.8
(Billions of yen)
Revenues
(Billions of yen) (%)
Segment profit/Percentage of revenues
� Segment profit � Percentage of revenues(FY)
(FY)
Others
Share of Revenues
8% 7% FY2009 FY2010
Overseas Revenue Ratio
11% 13% FY2009 FY2010
Millions of yen
Millions of U.S. dollars
FY2010 FY2009 FY2008 FY2010
Revenues . . . . . . . . . . . . . . . . . . . . . . ¥ 767,463 ¥ 763,665 ¥ 830,834 $ 9,247
Segment profit . . . . . . . . . . . . . . . . . . 28,930 19,423 24,515 349
Capital investment (Property, plant and equipment) . . . . 33,926 25,202 37,794 409
Depreciation (Property, plant and equipment) . . . . 27,158 32,840 36,653 327
R&D expenditures . . . . . . . . . . . . . . . . 4,912 4,692 4,508 59
Assets . . . . . . . . . . . . . . . . . . . . . . . . 1,344,356 1,374,882 1,612,556 16,197
Number of employees . . . . . . . . . . . . 27,448 32,538 31,629 —

Hitachi, Ltd. Annual Report 2011 35

36 Hitachi, Ltd. Annual Report 2011
Research and Development
Hitachi’s R&D is undertaken by the Research & Development Group, a corporate R&D organization, and the product development divisions of in-house companies and Hitachi Group companies (some of which have independent research organizations). In addition to selectively channeling R&D investment toward the Social Innovation Business in an
effort to spur global growth, Hitachi initiated steps to estab-lish a new R&D framework in April 2011. Under this frame-work, Hitachi has plans to open an R&D base in India in 2011, and to put in place a structure centered on the four business bases of China, Europe, the U.S. and Asia thereby expanding the role of locally-led research overseas.
A New R&D Framework to Spur Global Growth in the Social Innovation Business
Strengthening Overseas Research BasesHitachi engages in R&D activities across four overseas bases located in China, Europe, the U.S. and Asia. Hitachi plans to newly establish an R&D center in India during 2011, double the number of R&D personnel across its four overseas bases from 150 to 300 by fiscal 2012 and to increase the pace of locally-led R&D. Specifically, the personnel increase will target a local talent ratio at overseas R&D bases of over 90%, with local PhD-level personnel at over 30%. Furthermore, the underlying themes for R&D will be focused on promoting the Social Innovation Business in each region.
Reorganization of the Domestic R&D FrameworkIn order to further strengthen activities in basic research and the fusion field, Hitachi reorganized its six corporate research laboratories and two division laboratories into three corpo-rate laboratories in April 2011. The newly formed Central Research Laboratory conducts seamless integrated research at all levels from basic through to application; the Hitachi
Research Laboratory undertakes research across a wide range of fields that underpin the Social Innovation Business; and, the Yokohama Research Laboratory engages in R&D in information platforms and manufacturing technologies. In addition to three newly formed research laboratories, the Technology Strategy Office has been established to formu-late medium- to long-term technology and development plans linked to business strategies, and to propose strategic R&D projects that involve cooperation across the Group.
R&D Investment and Investment EfficiencyR&D expenditure fiscal 2010 was ¥395.1 billion, 6% higher than the previous fiscal year, and represented 4.2% of fiscal 2010 consolidated revenues. Moving forward, Hitachi will continue to channel approximately 4% of its consolidated revenues each year toward R&D. In order to closely evaluate the efficiency of its R&D, Hitachi will monitor the ratio of operating income to R&D expenditure as a key indicator, with the aim of maintaining a ratio of one or higher.
0
100
300
500
3.0
3.5
200 4.0
4.5
400 5.0
5.5(Billions of yen) (%)
(FY) 06 08 100907� R&D Expenditure� R&D Expenditure as a Percentage of Consolidated Revenues
412.5
4.0
428.1
3.8
416.5
4.2
372.4
4.2
395.1
4.2
R&D Expenditure and R&D Expenditure as a Percentage of Consolidated Revenues
0
100
300
500
0
0.5
200 1.0
1.5
400 2.0
2.5(Billions of yen)
(FY) 06 08 100907� Operating Income� R&D Investment Efficiency (Operating Income/ R&D Expenditure)
182.5
0.4
345.5
0.8
127.1
0.3
202.1
0.5
444.5
1.1
Operating Income and R&D Investment Efficiency
Concentrate R&D Investment on the Social Innovation Business
R&D is a key factor underpinning growth in the Social Innovation Business. In order to accelerate its R&D activities in this busi-ness domain, Hitachi is selectively allocating ¥670 billion, or approximately 60%, of the total ¥1,200 billion earmarked for R&D between fiscal 2010 and fiscal 2012.
Examples of Main R&D Activities
Global Locally-led R&D for Social Innovation Business• North America: Storage Systems • China: Smart Grids, Medical Imaging
Fusion Information platforms for social infrastructure• Large capacity/Real-time/High reliability/
Knowledge extraction
Environment New electronics research• Green Mobility (Railways, Electric Drive Systems)• Energy conservation
(Environment-Conscious Data Centers)
Core and Platform Efficient design based on analysis technology • Enhance supercomputing & analysis technology

Hitachi, Ltd. Annual Report 2011 37
Intellectual Property
To maximize the contribution of intellectual property (IP), Hitachi forges ahead with IP activities in line with its business strategies that focus on the “global,” “fusion” and “environ-ment” themes. The contribution of IP to business comes in
several forms. In this regard, Hitachi places the utmost emphasis on differentiation and effectively protecting our competitive advantage, thus securing business freedom and patent licensing income.
Globalization of IP Activity
In its pursuit of IP activity globalization, Hitachi is targeting a ratio of overseas patent applications to total applications of 55% in fiscal 2012, up from 51% in fiscal 2010. Hitachi will pay particular attention to activities in such emerging mar-kets as China and other Asian countries, major targets under its growth strategy. Plans are in place to lift the ratio of over-seas patent applications to total applications in this region from approximately 30% in fiscal 2010 to approximately 35% in fiscal 2012. Hitachi intends to file applications in emerging
markets through the Patent Cooperation Treaty (PCT), which ensures that a single patent application has legal effect in Treaty member countries. According to internal data, Hitachi placed fifth and elev-enth in terms of the number of patent applications published in the U.S. and China, respectively, in 2010, and those num-bers surpass most competitors in the Social Innovation Business area.
Building a Strategic Patent Portfolio
In order to provide support from an IP perspective to Hitachi’s global-, fusion- and environment-oriented business strategies, Hitachi is directing its R&D activities to each of these fields while taking steps to build a patent portfolio. Through these means, Hitachi is endeavoring to prevent other companies from using its technologies without its autho-rization and to better differentiate its products and services. At the same time, Hitachi is pursuing cross-licensing agreements with other companies to ensure business freedom. Moreover, Hitachi obtains patent licensing income from other companies and invests it in new research and development.
Examples of Focused Themes of IP Activities
Field Key Themes
GlobalStorage Systems
Smart Grids
FusionInformation Platform for Social Infrastructure
Environment
New Power Devices
Inverters
Lithium-ion Batteries
Green Mobility
Strengthening International Standardization Activities
Hitachi is aggressively promoting international standardization activities in an effort to expand Hitachi’s strong businesses. For example, Hitachi has standardized interfaces for IT and air-conditioning control equipment at environment-conscious
data centers. Hitachi has key leaders from inside the compa-ny working within global standardization organizations, nota-bly through the vice-presidency and other positions on the International Electrotechnical Commission.
0
200
400
800
1,200
600
1,000
(FY) 08
(16)
1009
(12)
(14)
Hitachi’s Overseas Patent Application Ratio and Geographic Data
FY 2009 (Actual) 2010 (Actual) 2011 (Target) 2012 (Target)
Overseas Applications 47% 51% 52% 55%
51%
FY2010Japan
U.S.
Europe
China
(PCT) Emerging Markets
(PCT)Emerging Markets
55%
Japan
U.S.
Europe
ChinaFY2012
The Number of Hitachi PCT Published Applications
Hitachi’s ranking worldwide is shown in parenthesis.

38 Hitachi, Ltd. Annual Report 2011
CSR Management
CSR Policy of the Hitachi Group
1. Commitment to Corporate Social Responsibility (CSR)
2. Contribution to Society through Our Business
3. Disclosure of Information and Stakeholder Engagement
4. Corporate Ethics and Human Rights
5. Environmental Conservation
6. Corporate Citizenship Activities
7. Working Environment
8. Responsible Partnership with Business Partners
(Adopted March 2005)
Hitachi believes that corporate social responsibility (CSR) is an inseparable component of management. Through our products and services, we are committed to creating both
Integrating CSR into Management
Based on our Corporate Credo to contribute to society through the development of superior, original technology and products, Hitachi intends to become a truly global entity that shares its value with society by integrating CSR into management. Hitachi recognizes the paramount importance of working in partnership with stakeholders to create a permanent lega-cy of value that helps resolve issues fundamental to the global community including the environment. In this context, efforts that create both social and economic value are posi-tioned at the heart of CSR management. In order to better realize CSR management, we formulated the CSR Policy of the Hitachi Group as a common policy platform. In addition, we use the CSR Self-Assessment Tools developed in collaboration with Group companies to clarify important CSR issues as they relate to business activities as a global company. These tools also play a significant role in boosting Group-wide activity. At the same time, we promote dialog with global stakeholders to gain an understanding of the diverse values held by external parties. By feeding back and incorporating into our business activities details of the needs
uncovered through discussions with stakeholders, Hitachi strives to realize a sustainable society and management.
Promoting Activities under the Five-Year CSR Roadmap
Guided by its Five-Year CSR Roadmap, a medium-term CSR plan formulated in fiscal 2010, Hitachi aims to take a leader-ship role in resolving several global social issues. To this end, we are further strengthening our Group-wide management platform, undertaking a quantitative assessment of its CSR activities and enhancing transparency of its business activities. In fiscal 2010, we put in place the Hitachi Group Codes of Conduct encompassing the activities and behavior of all Group employees. Closely aligned to international principles, criteria, rules and standards including ISO 26000, we are working diligently to ensure that all Group companies adhere strictly to these Codes as a part of efforts to strengthen our management platform.
For a second consecutive year, we were selected as a component of the Dow Jones Sustainability World Index (DJSI World), a leading global socially responsible investment fund index, and we were awarded with SAM Silver Class status in the Sustainability Yearbook 2011, which is pub-lished by Sustainable Asset Management (SAM) and PricewaterhouseCoopers, providing a certain degree of external recognition for our past activities.
social and economic value and to contributing to the cre-ation of a sustainable society.
Five-Year CSR Roadmap
April 2010 April 2011 April 2012 April 2013 April 2014
Becoming a truly
global corporation,
realizing
“One Hitachi”Integrate management strategies with CSR and instill CSR principles in operations
Reinforce Group governance and globalize operations and activities
Collaborate with key stakeholders to resolve global social issues
Demonstrate leadership as a social innovation enterprise

Hitachi, Ltd. Annual Report 2011 39
Long-Term Plan Environmental Vision 2025
Hitachi has set forth its Environmental Vision 2025 as a long-term plan for business activities in order to contribute to the prevention of global warming. With fiscal 2005 as the base year, Hitachi has set the goal of helping reduce annual CO2
emissions by 100 million tones by 2025 through its products and services. To this end, we are pursuing greater environ-mental efficiency in products and aiming to make all Hitachi Group products Eco-Products*1. In fiscal 2010, Hitachi achieved its CO2 reduction target of 14.00 million tonnes. In specific terms, products and servic-es contributed to the reduction of 15.51 million tonnes of CO2 in the fiscal year under review. A wide range of products
including highly efficient gas turbines and hard disk drives as well as energy saving products used in auto parts and other materials helped in the control of emissions. In addition, the cumulative number of Hitachi Eco-Products in fiscal 2010 was 9,456 models, a year-on-year increase of 1,069 models. Representing 60% of the Hitachi Group’s total revenues, this surpassed the established target of 55%.
*1 Eco-Products are internally qualified products evaluated against eight crite-ria, including resource reduction, resource recycling, energy efficiency and environmental protection, stipulated in Hitachi’s unique Assessment of Design for Environment system.
30
40
50
55*3
60(%)
(FY) 06 08 100907
32
38
47
53
60
0
20
60
100
40
80
(Millions of tonnes/year)
(FY) 09 15 252010(estimate)
Transportation, commercial & residential 10%
Industry 20%
Power generation 70%
11.7715.51
35.00
63.00
100 million tonnes/year
Expanding Eco-Product SalesContributions to CO2 Emission*2 Reduction (Base: FY2005)
Reducing Environmental Burden in Business Activities
In order to bring its Environmental Vision to fruition, Hitachi formulates an Environmental Action Plan on a five-year basis that outlines specific environmental activity categories and targets. We internally certify as Super-Eco Factories & offices that achieve industry-leading reductions in environmental burden through high level consideration for the environment in busi-ness activities, including more efficient energy use, using recycled resources and reducing emissions of hazardous substances. A cumulative total of 35 facilities, 23 in Japan
and 12 overseas, have been certified through to fiscal 2010. Furthermore, examples of the pioneering steps undertaken and environmental technologies employed at these facilities are shared with Hitachi Group companies, underpinning more vigorous environmental activities. Hitachi has further reinforced the initiatives of its 2nd Environmental Action Plan in its 3rd Environmental Action Plan that covers the five-year period from fiscal 2011 to fiscal 2015. With even higher targets for environmental burden reduction across all activities, we are ramping up efforts in all areas.
Promoting Environment Management
Hitachi is promoting environmental management with the aim of helping realize a sustainable society by addressing increasingly serious global environmental problems such as climate change, resource depletion and ecosystem degrada-tion. The key pillars of Hitachi’s Environmental Vision are the prevention of global warming, the conservation of resources, and the preservation of the ecosystem. Based on this vision, we are providing products and services that contribute to environmental protection and conducting business activities globally to reduce environmental burden.
*2 CO2 emission coefficients used in the calculation of the Hitachi’s contribu-tions to CO2 emission reduction are based on 2008 figures presented in the International Energy Agency’s CO2 Emissions from Fuel Combustion Highlights (2010 Edition). CO2 emission coefficients are unit values used to calculate CO2 emissions from energy consumption.
*3 Target for fiscal 2010

40 Hitachi, Ltd. Annual Report 2011
Corporate Governance
Hitachi, Ltd. (the “Company”) and its 9 listed subsidiaries have adopted the Committee System under the Companies Act of Japan (the “Companies Act”). By demarcating responsibilities for management oversight and those for the execution of business operations, Hitachi is working to cre-ate a framework for quick business operation, while making management highly transparent by having outside directors on the Board of Directors.
Some of Hitachi’s directors and executive officers serve con-currently as directors and committee members at group companies. In addition, Hitachi is strengthening integrated management of the group, improving management oversight of group companies and executing business strategies for-mulated to enable the Hitachi Group to demonstrate its col-lective strengths. The goal is higher corporate value.
Board of Directors
The Board of Directors determines basic management poli-cies and supervises executive officers in the performance of their duties while entrusting to executive officers considerable authority to make decisions with respect to Hitachi’s business affairs. As of June 24, 2011, the Board of Directors was made up of 13 directors, four of whom are from outside Hitachi Group. Two directors concurrently serve as executive officers. The Chairman of the Board does not concurrently serve as an executive officer. Four outside directors are expected to rein-force the functional aspects of the Board of Directors by supervising the execution of duties by Executive Officers and others from an independent perspective based on their rich experience and insight. Within the Board of Directors, there are three statutory committees—the Nominating Committee, Audit Committee and Compensation Committee—with outside directors accounting for the majority of members of each committee. The Board of Directors met on 11 separate occasions during the fiscal year ended March 31, 2011, and the attendance rate of directors at those meetings was 95%. Full-time staff, who do not take orders from executive officers, have been assigned to assist the activities of the Board of Directors and these committees.
(1) Nominating CommitteeThe Nominating Committee has the authority to decide on the particulars of proposals submitted to the General
Meeting of Shareholders for the election and dismissal of directors. The Nominating Committee consists of four direc-tors, three of whom are outside directors. The Nominating Committee met five times during the fiscal year ended March 31, 2011.
(2) Audit CommitteeThe Audit Committee audits the performance of directors and executive officers and has the authority to decide on proposals submitted to the General Meeting of Shareholders for the election and dismissal of accounting auditors. The Audit Committee consists of three directors: two outside directors and another director who are full-time Audit Committee members. A full-time director, who does not serve as an executive officer, is assigned to assist the activi-ties of the Audit Committee. The Audit Committee met 12 times during the fiscal year ended March 31, 2011.
(3) Compensation CommitteeThe Compensation Committee has the authority to deter-mine remuneration policies for directors and executive offi-cers and remuneration for individuals based on them. The Compensation Committee consists of four directors, three of whom are outside directors. The Compensation Committee met five times during the fiscal year ended March 31, 2011.
Executive Officers
Executive officers decide on matters delegated to them by the Board of Directors and execute Hitachi’s business affairs within
the scope of assignments determined by the Board of Directors. As of June 24, 2011, Hitachi has 30 executive officers.
Director and Executive Officer Compensation
The compensation is commensurate with the ability required of, and the responsibilities to be borne by directors and executive officers, taking into consideration compensation packages at other companies. The compensation for direc-tors consists of a monthly salary and a year-end allowance. The monthly salary is decided by making adjustments to basic salary that reflect full-time or part-time status, commit-tee membership and position. The year-end allowance is a pre-determined amount equivalent to about 20% of the director’s annual income based on the monthly salary, although this amount may be reduced depending on the Company’s performance. Directors concurrently serving as executive officers are not paid compensation as directors.
The compensation for executive officers consists of a monthly salary and a performance-linked bonus. The month-ly salary is decided by adjusting a basic amount set in accor-dance with the relevant position to reflect the results of an assessment. The performance-linked bonus is set within a range equivalent to about 30% of the executive officer’s annual income, adjusted based on Company and individual performance. The compensation structure for directors and executive officers was re-examined starting with the compensation for the fiscal year ended March 31, 2009 and the retirement allowance was abolished. Please refer to page 41 for compensation for directors and executive officers for the year ended March 31, 2011.
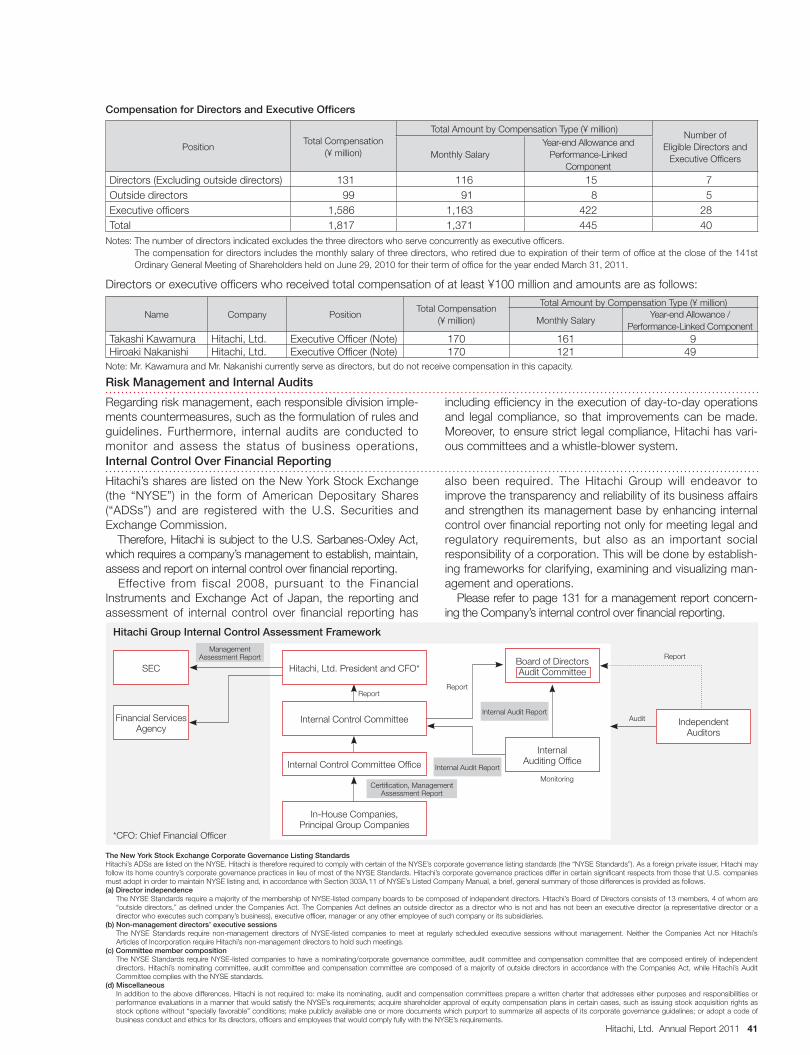
Hitachi, Ltd. Annual Report 2011 41
Risk Management and Internal Audits
Regarding risk management, each responsible division imple-ments countermeasures, such as the formulation of rules and guidelines. Furthermore, internal audits are conducted to monitor and assess the status of business operations,
including efficiency in the execution of day-to-day operations and legal compliance, so that improvements can be made. Moreover, to ensure strict legal compliance, Hitachi has vari-ous committees and a whistle-blower system.
Internal Control Over Financial Reporting
Hitachi’s shares are listed on the New York Stock Exchange (the “NYSE”) in the form of American Depositary Shares (“ADSs”) and are registered with the U.S. Securities and Exchange Commission. Therefore, Hitachi is subject to the U.S. Sarbanes-Oxley Act, which requires a company’s management to establish, maintain, assess and report on internal control over financial reporting. Effective from fiscal 2008, pursuant to the Financial Instruments and Exchange Act of Japan, the reporting and assessment of internal control over financial reporting has
also been required. The Hitachi Group will endeavor to improve the transparency and reliability of its business affairs and strengthen its management base by enhancing internal control over financial reporting not only for meeting legal and regulatory requirements, but also as an important social responsibility of a corporation. This will be done by establish-ing frameworks for clarifying, examining and visualizing man-agement and operations. Please refer to page 131 for a management report concern-ing the Company’s internal control over financial reporting.
Compensation for Directors and Executive Officers
PositionTotal Compensation
(¥ million)
Total Amount by Compensation Type (¥ million)Number of
Eligible Directors and Executive OfficersMonthly Salary
Year-end Allowance and Performance-Linked
Component
Directors (Excluding outside directors) 131 116 15 7Outside directors 99 91 8 5Executive officers 1,586 1,163 422 28Total 1,817 1,371 445 40
Notes: The number of directors indicated excludes the three directors who serve concurrently as executive officers. The compensation for directors includes the monthly salary of three directors, who retired due to expiration of their term of office at the close of the 141st Ordinary General Meeting of Shareholders held on June 29, 2010 for their term of office for the year ended March 31, 2011.
Directors or executive officers who received total compensation of at least ¥100 million and amounts are as follows:
Name Company PositionTotal Compensation
(¥ million)
Total Amount by Compensation Type (¥ million)
Monthly SalaryYear-end Allowance /
Performance-Linked ComponentTakashi Kawamura Hitachi, Ltd. Executive Officer (Note) 170 161 9Hiroaki Nakanishi Hitachi, Ltd. Executive Officer (Note) 170 121 49
Note: Mr. Kawamura and Mr. Nakanishi currently serve as directors, but do not receive compensation in this capacity.
The New York Stock Exchange Corporate Governance Listing StandardsHitachi’s ADSs are listed on the NYSE. Hitachi is therefore required to comply with certain of the NYSE’s corporate governance listing standards (the “NYSE Standards”). As a foreign private issuer, Hitachi may follow its home country’s corporate governance practices in lieu of most of the NYSE Standards. Hitachi’s corporate governance practices differ in certain significant respects from those that U.S. companies must adopt in order to maintain NYSE listing and, in accordance with Section 303A.11 of NYSE’s Listed Company Manual, a brief, general summary of those differences is provided as follows.(a) Director independence The NYSE Standards require a majority of the membership of NYSE-listed company boards to be composed of independent directors. Hitachi’s Board of Directors consists of 13 members, 4 of whom are
“outside directors,” as defined under the Companies Act. The Companies Act defines an outside director as a director who is not and has not been an executive director (a representative director or a director who executes such company’s business), executive officer, manager or any other employee of such company or its subsidiaries.
(b) Non-management directors’ executive sessions The NYSE Standards require non-management directors of NYSE-listed companies to meet at regularly scheduled executive sessions without management. Neither the Companies Act nor Hitachi’s
Articles of Incorporation require Hitachi’s non-management directors to hold such meetings.(c) Committee member composition The NYSE Standards require NYSE-listed companies to have a nominating/corporate governance committee, audit committee and compensation committee that are composed entirely of independent
directors. Hitachi’s nominating committee, audit committee and compensation committee are composed of a majority of outside directors in accordance with the Companies Act, while Hitachi’s Audit Committee complies with the NYSE standards.
(d) Miscellaneous In addition to the above differences, Hitachi is not required to: make its nominating, audit and compensation committees prepare a written charter that addresses either purposes and responsibilities or
performance evaluations in a manner that would satisfy the NYSE’s requirements; acquire shareholder approval of equity compensation plans in certain cases, such as issuing stock acquisition rights as stock options without “specially favorable” conditions; make publicly available one or more documents which purport to summarize all aspects of its corporate governance guidelines; or adopt a code of business conduct and ethics for its directors, officers and employees that would comply fully with the NYSE’s requirements.
SECBoard of DirectorsAudit Committee
Financial Services Agency
*CFO: Chief Financial Officer
Management Assessment Report
Internal Audit Report
Certification, Management Assessment Report
Report
ReportReport
Monitoring
Audit Independent Auditors
Internal Control Committee
Internal Control Committee Office
In-House Companies, Principal Group Companies
Internal Audit Report
Internal Auditing Office
Hitachi, Ltd. President and CFO*
Hitachi Group Internal Control Assessment Framework

42 Hitachi, Ltd. Annual Report 2011
Board of Directors(As of June 24, 2011)
Chairman of the Board
Takashi Kawamura
Directors
Yoshie Ota Outside Director
Mitsuo Ohashi Outside Director, Advisor, Showa Denko K.K.
Nobuo Katsumata Outside Director, Chairman, Member of the Board, Marubeni Corporation
Tohru Motobayashi Outside Director, Attorney at law, Partner, Ihara and Motobayashi
Isao Ono Chairman of the Board, Hitachi Solutions, Ltd.
Stephen Gomersall Chairman of the Board, Hitachi Europe Ltd.
Tadamichi Sakiyama
Masaharu Sumikawa Chairman of the Board, Hitachi Plant Technologies, Ltd.
Hiroaki Nakanishi* Representative Executive Officer and President
Michiharu Nakamura
Takashi Hatchoji Chairman of the Board, Hitachi America, Ltd.
Takashi Miyoshi* Representative Executive Officer, Executive Vice President and Executive Officer
* Denotes directors who serve concurrently as executive officers.
Each committee is composed of the following members (Chair underlined)
Nominating Committee: Takashi Kawamura, Yoshie Ota, Mitsuo Ohashi, Tohru Motobayashi
Audit Committee: Tadamichi Sakiyama, Yoshie Ota, Tohru Motobayashi
Compensation Committee: Hiroaki Nakanishi, Mitsuo Ohashi, Nobuo Katsumata, Tohru Motobayashi
Takashi Kawamura Yoshie Ota Mitsuo Ohashi Nobuo Katsumata Tohru Motobayashi
Isao Ono Stephen Gomersall Tadamichi Sakiyama Masaharu Sumikawa Hiroaki Nakanishi
Michiharu Nakamura Takashi Hatchoji Takashi Miyoshi

Hitachi, Ltd. Annual Report 2011 43
Executive Officers(As of June 24, 2011)
Representative Executive Officer, Senior Vice President and Executive OfficerToyoaki Nakamura Finance and corporate pension system
Vice Presidents and Executive OfficersToshio Ikemura Urban planning and development systems business
Hitoshi Isa Power systems business (thermal power systems business promotion)
Tatsuro Ishizuka Power systems business
Osamu Ohno Information technology
Nobuyuki Ohno Hitachi group global business (China)
Yoshifumi Kanda Power systems business (sales operations)
Masahiro Kitano Environmental strategies, quality assurance and production engineering
Ryuichi Kitayama Sales operations
Kazuhiro Kurihara Sales operations (Chubu Area)
Yutaka Saito Information & control systems business
Kaichiro Sakuma Information & telecommunication systems business (platform systems business)
Yasuo Tanabe Government & external relations
Masahide Tanigaki Sales operations, Hitachi group global business and corporate export regulation
Toshikazu Nishino Management strategies
Masaharu Hanyu Power systems business (nuclear power systems business promotion)
Toshiaki Higashihara Social infrastructure & industrial systems business
Naoki Mitarai Human capital
Yoshihiko Mogami Information & telecommunication systems business (system solutions business)
Representative Executive Officer and PresidentHiroaki Nakanishi Overall management
Representative Executive Officers, Executive Vice Presidents and Executive OfficersKoji Tanaka Power systems business, transportation systems business,
social infrastructure & industrial systems business, urban planning and development systems business and defense systems business
Junzo Nakajima Information & control systems business, information & telecommunication systems business and information technology
Takashi Miyoshi Management strategies, finance and corporate pension system
Nobuo Mochida High functional materials & components, quality assurance, production engineering, battery systems business and automotive systems business
Kazuhiro Mori Sales operations, Hitachi group global business, corporate export regulation, medical systems business and business incubation
Senior Vice Presidents and Executive OfficersShigeru Azuhata Research & development, environmental strategies and
medical systems business
Shinjiro Iwata Information & telecommunication systems business
Makoto Ebata Procurement and consumer business
Toshiaki Kuzuoka Human capital, legal and corporate communications, government & external relations, corporate brand and corporate auditing
Yoshito Tsunoda Battery systems business
Hiroaki Nakanishi Koji Tanaka Junzo Nakajima Takashi Miyoshi Nobuo Mochida
Kazuhiro Mori Shigeru Azuhata Shinjiro Iwata Makoto Ebata Toshiaki Kuzuoka
Yoshito Tsunoda Toyoaki Nakamura

44 Hitachi, Ltd. Annual Report 2011
Financial Section
Five-Year SummaryHitachi, Ltd. and Subsidiaries
Millions of yen
2011 2010 2009 2008 2007
For the year:
Revenues . . . . . . . . . . . . . . . . . . . . . . . . . ¥9,315,807 ¥8,968,546 ¥10,000,369 ¥11,226,735 ¥10,247,903
Operating income (note) . . . . . . . . . . . . . . 444,508 202,159 127,146 345,516 182,512
Net income (loss) attributable to Hitachi, Ltd. . . . . . . . . . . . . . . . . . . . . . . 238,869 (106,961) (787,337) (58,125) (32,799)
Cash dividends declared . . . . . . . . . . . . . . 36,133 — 9,971 19,947 19,974
Capital investment (Property, plant and equipment) . . . . . . . .
556,873
546,326
788,466
969,087
1,048,572
Depreciation (Property, plant and equipment) . . . . . . . .
382,732
441,697
478,759
541,470
472,175
R&D expenditures . . . . . . . . . . . . . . . . . . . 395,180 372,470 416,517 428,171 412,534
At year-end:
Total assets . . . . . . . . . . . . . . . . . . . . . . . . 9,185,629 8,964,464 9,403,709 10,530,847 10,644,259
Net property, plant and equipment . . . . . . 2,111,270 2,219,804 2,393,946 2,653,918 2,688,977
Total Hitachi, Ltd. stockholders’ equity . . . 1,439,865 1,284,658 1,049,951 2,170,612 2,442,797
Yen
Per share information:
Net income (loss) attributable to Hitachi, Ltd. stockholders:
Basic . . . . . . . . . . . . . . . . . . . . . . . . . . . ¥ 52.89 ¥ (29.20) ¥(236.86) ¥ (17.48) ¥ (9.84)
Diluted . . . . . . . . . . . . . . . . . . . . . . . . . . 49.38 (29.20) (236.87) (17.77) (9.87)
Net income (loss) attributable to Hitachi, Ltd. stockholders per ADS (representing 10 shares):
Basic . . . . . . . . . . . . . . . . . . . . . . . . . . . 529 (292) (2,369) (175) (98)
Diluted . . . . . . . . . . . . . . . . . . . . . . . . . . 494 (292) (2,369) (178) (99)
Cash dividends declared . . . . . . . . . . . . . . 8.0 — 3.0 6.0 6.0
Cash dividends declared per ADS (representing 10 shares) . . . . . . . . . . . . .
80
—
30
60
60
Total Hitachi, Ltd. stockholders’ equity . . . 318.73 287.13 315.86 652.95 734.66
Number of employees . . . . . . . . . . . . . . . . . 361,745 359,746 361,796 347,810 349,996
Note: In order to consistent with financial reporting principles and practices generally accepted in Japan, operating income is presented as total revenues less cost of sales and selling, general administrative expenses. The Company believes that this is useful to investors in comparing the Company’s financial results with those of other Japanese companies. Under accounting principles generally accepted in the United States of America, restructuring charges, net gain or loss on sales and disposal of rental assets and other property and impairment losses for long-lived assets are included as part of operating income. See the consolidated statements of operations and notes 19, 20 and 21 to the consolidated financial statements.
The restructuring charges mainly represent special termination benefits incurred with the reorganization of our business structures, and as the results of the Company and its subsid-iaries reviewing and reshaping the business portfolio. Restructuring charges, net gain or loss on sales and disposal of rental assets and other property and impairment losses for long-lived assets for the years ended March 31, 2008 and 2007 totaled net loss of ¥113,905 million and ¥38,512 million respectively.
The Company has changed the number of employees to exclude temporary employees starting from the year ended March 31, 2010. Figures for prior years have been restated to reflect the current year presentation.

Hitachi, Ltd. Annual Report 2011 45
Operating and Financial Review
Operating Results
The Year Ended March 31, 2011 Compared with the Year
Ended March 31, 2010
Summary Millions of yen
Years ended March 31,
2011
2010
Percent change
Total revenues . . . . . . . ¥9,315,807 ¥8,968,546 +4%
Income before income taxes . . . . . . . 432,201 63,580 +580%
Net income (loss) . . . . . 303,126 (84,391) —
Net income (loss) attributable to Hitachi, Ltd. . . . . . . . . 238,869 (106,961) —
Our total revenues in the year ended March 31, 2011
increased compared with the year ended March 31, 2010.
Our income before income taxes for the year ended
March 31, 2011 significantly increased compared with the
year ended March 31, 2010. This increase was due in partic-
ular to an increase in profits in our Components & Devices,
Electronic Systems & Equipment and High Functional
Materials & Components segments, a decline in equity in net
loss of affiliated companies, a decline in restructuring charg-
es and the recording of a net gain on securities. As a result
of the foregoing, we recorded net income attributable to
Hitachi, Ltd. for the year ended March 31, 2011 as com-
pared to a net loss attributable to Hitachi, Ltd. for the year
ended March 31, 2010.
Analysis of Statement of Operations
Our total revenues in the year ended March 31, 2011 were
¥9,315.8 billion, an increase of 4% compared with the year
ended March 31, 2010. This increase was due primarily to
increases in revenues in the Construction Machinery, High
Functional Materials & Components, Automotive Systems
and Electronic Systems & Equipment segments. Such reve-
nue increases were mainly the result of strong demand for
construction machinery in emerging countries and recovery
of demand in the electronics and automotive industries. This
increase was partially offset by the effects of the March 2011
earthquake and collateral events, such as delays in our deliv-
ery of and our customers’ acceptance of our products. Our
overseas revenues rose to ¥4,046.5 billion in the year ended
March 31, 2011, an increase of 11% compared with the
year ended March 31, 2010. This increase was due primarily
to increased global demand in the electronics and automo-
tive industries.
Our cost of sales in the year ended March 31, 2011 was
¥6,967.4 billion, an increase of 2% compared with the year
ended March 31, 2010. The ratio of cost of sales to total
revenues was 75%, a 1% decrease compared with the year
ended March 31, 2010. This decrease was due primarily to
our ongoing efforts to reduce costs, such as fixed costs and
material purchasing costs.
Our selling, general and administrative expenses in the
year ended March 31, 2011 were ¥1,903.8 billion, a
decrease of 1% compared with the year ended March 31,
2010. The ratio of selling, general and administrative expens-
es to total revenues was 20%, a decrease of 1% compared
with the year ended March 31, 2010. This decrease in sell-
ing, general and administrative expenses was due primarily
to our ongoing efforts to reduce fixed costs.
Impairment losses for long-lived assets increased ¥9.9 bil-
lion to a total of ¥35.1 billion in the year ended March 31,
2011, as compared with the year ended March 31, 2010.
The Components & Devices segment recorded an impair-
ment loss of ¥16.5 billion in the year ended March 31, 2011.
This impairment loss includes impairment of production facil-
ities relating to batteries for electronic products. We have
recognized losses for consecutive periods and have revised
downward expected future income from this business area
due to expectations of reduced production. The impairment
loss also includes impairment of LCD component production
facilities. This impairment was due to our projection of lower
production based on reduced demand for a specific type of
LCD component. The High Functional Materials &
Components segment also recorded an impairment loss of
¥10.9 billion. This impairment loss includes impairment of
production facilities relating to certain automotive materials
due to a deterioration of profitability as the March 2011
earthquake and collateral events made the production facili-
ties inoperable. The above impairment losses were deter-
mined on the basis of fair value estimates based primarily on
discounted projected future cash flows. We expect portions
of the investments in the aforementioned businesses to be
irrecoverable.
Restructuring charges in the year ended March 31, 2011
decreased ¥19.3 billion to ¥5.7 billion, as compared with the
year ended March 31, 2010. This decrease was due primarily to
a decrease in special and one-time termination benefits.

46 Hitachi, Ltd. Annual Report 2011
Interest income increased ¥1.2 billion to ¥13.2 billion in
the year ended March 31, 2011, as compared with the year
ended March 31, 2010.
Dividend income decreased ¥1.5 billion to ¥4.2 billion in
the year ended March 31, 2011, as compared with the year
ended March 31, 2010.
Other income in the year ended March 31, 2011 increased
¥69.5 billion to ¥69.7 billion, as compared with the year
ended March 31, 2010. This increase was due primarily to
the recording of a net gain on securities. We recorded net
gain on securities of ¥61.0 billion in the year ended
March 31, 2011, as compared with a net loss on securities
of ¥1.2 billion in the year ended March 31, 2010. This
increase consisted mainly of a gain from the sale of a sub-
stantial portion of our shares of IPS Alpha Technology. Other
income in the year ended March 31, 2011 also includes a
gain of ¥8.6 billion on a bargain purchase related to the
acquisition of Aloka Co., Ltd., currently Hitachi Aloka
Medical, Ltd., by our subsidiary, Hitachi Medical Corporation.
Interest charges decreased ¥1.3 billion to ¥24.8 billion in
the year ended March 31, 2011, as compared with the year
ended March 31, 2010.
Other deductions, including a foreign exchange loss and a
net loss on the sale and disposal of rental assets and other
property, decreased ¥8.3 billion to ¥13.5 billion in the year
ended March 31, 2011, as compared with the year ended
March 31, 2010. We recognized a foreign exchange loss of
¥9.5 billion in the year ended March 31, 2011, as compared
with foreign exchange gain in the year ended March 31,
2010. This foreign exchange loss was due primarily to the
strengthening of the yen against the U.S. dollar and the euro.
Net loss on the sale and disposal of rental assets and other
property in the year ended March 31, 2011 was ¥3.1 billion,
as compared with a net loss of ¥20.2 billion in the year
ended March 31, 2010.
Equity in net loss of affiliated companies decreased ¥38.0
billion to ¥20.1 billion in the year ended March 31, 2011, as
compared with the year ended March 31, 2010. This was
due primarily to a decrease in the loss resulting from our
interest in Renesas Electronics Corporation, our equity meth-
od affiliate in the semiconductor industry.
As a result of the foregoing, we recorded income before
income taxes of ¥432.2 billion in the year ended March 31,
2011, as compared with income before income taxes of
¥63.5 billion in the year ended March 31, 2010.
Income taxes decreased ¥18.8 billion to ¥129.0 billion in
the year ended March 31, 2011, as compared with the year
ended March 31, 2010. This decrease was due primarily to
losses relating to valuation of deferred tax assets in the year
ended March 31, 2010 arising from the consolidation of five
of our then listed subsidiaries which were not recorded in the
year ended March 31, 2011. In the year ended March 31,
2011, while our statutory income tax rate was 40.6%, owing
to favorable differences in tax rates in Japan and overseas
jurisdictions where our subsidiaries operate, our effective
income tax rate was 29.9%. This difference was due primari-
ly to a certain Singaporean subsidiary recording a large profit
for the year ended March 31, 2011.
As a result, we recorded net income of ¥303.1 billion in
the year ended March 31, 2011, as compared with a net
loss of ¥84.3 billion in the year ended March 31, 2010.
In the year ended March 31, 2011, net income attributable
to noncontrolling interests was ¥64.2 billion, as compared
with net income of ¥22.5 billion for the year ended March 31,
2010. This increase was due primarily to an improvement in
the business results of our listed subsidiaries.
As a result of the foregoing, we recorded net income
attributable to Hitachi, Ltd. of ¥238.8 billion in the year
ended March 31, 2011, compared with a net loss attribut-
able to Hitachi, Ltd. of ¥106.9 billion in the year ended
March 31, 2010.
For details of performance by segment, please see
“Review of Operations” on pages 24 to 34.
Revenues by Geographic Area Millions of yen
Years ended March 31,
2011
2010
Percent change
Japan . . . . . . . . . . . . . . ¥5,269,259 ¥5,313,790 -1%
Outside Japan
Asia . . . . . . . . . . . . . 2,073,756 1,699,071 +22%
North America . . . . . . 781,139 729,698 +7%
Europe . . . . . . . . . . . 760,011 824,697 -8%
Other Areas . . . . . . . 431,642 401,290 +8%
Subtotal . . . . . . . . . . 4,046,548 3,654,756 +11%
Total . . . . . . . . . . . ¥9,315,807 ¥8,968,546 +4 %
Japan
Revenues in Japan in the year ended March 31, 2011 were
¥5,269.2 billion, a 1% decrease compared with the year
ended March 31, 2010. Revenues from sales of materials

Hitachi, Ltd. Annual Report 2011 47
and components for semiconductors and LCDs, automotive
equipment and automotive-related materials increased due
to a recovery of demand in the electronics and automotive
industries. However, the increase was offset by decreased
revenues in our information and telecommunication systems
business, due to reduced levels of IT investment by our cus-
tomers as well as the effect of the March 2011 earthquake
and collateral events, such as delays in product shipment
and delivery.
Asia
Revenues in Asia in the year ended March 31, 2011 were
¥2,073.7 billion, a 22% increase compared with the year
ended March 31, 2010. This increase was due primarily to
an increase in revenues from sales of semiconductor manu-
facturing equipment owing to strong demand from semicon-
ductor manufacturers. Increased revenues from sales of
construction machinery in China also contributed to the
increase.
North America
Revenues in North America in the year ended March 31,
2011 were ¥781.1 billion, a 7% increase compared with the
year ended March 31, 2010. This increase was primarily
attributable to an increase in revenues from sales of con-
struction machinery, reflecting an increase in capital expendi-
tures by our customers in the United States. The increased
revenues from our storage solutions and HDD business also
contributed to the increase, as our customers increased
IT-related investments.
Europe
Revenues in Europe in the year ended March 31, 2011 were
¥760.0 billion, an 8% decrease compared with the year
ended March 31, 2010. The decrease was due primarily to a
decrease in revenues from sales of coal-fired power sys-
tems. Decreased revenues from sales of railway vehicles and
systems in the United Kingdom also contributed to the
decrease.
Other Areas
Revenues in other areas increased 8% to ¥431.6 billion due
primarily to an increase in revenues from sales of construc-
tion machinery in South Africa and Australia.
Restructuring
For the year ended March 31, 2011, we recorded restructur-
ing charges of ¥5.7 billion. The restructuring charges includ-
ed special termination benefits of ¥5.6 billion for 1,380
employees, which arose primarily from our efforts to reduce
costs and improve profitability in the Components & Devices
segment. We made payments of ¥10.3 billion in the year ended
March 31, 2011, and we accrued special termination benefits of
¥3.3 billion as of March 31, 2011. We expect the accrued
amount to be paid in the year ending March 31, 2012.
Liquidity and Capital Resources
Our management considers maintaining an appropriate level
of liquidity and securing adequate funds for current and
future business operations to be important financial objec-
tives. Through efficient management of working capital and
selective investment in new plants and equipment, we are
working to optimize the efficiency of capital utilization
throughout our business operations. We endeavor to improve
our group cash management by centralizing such manage-
ment among us and our overseas financial subsidiaries. Our
internal sources of funds include cash flows generated by
operating activities and cash on hand. Our management
also considers short-term investments to be an immediately
available source of funds. In addition, we raise funds both
from the capital markets and from Japanese and internation-
al commercial banks in response to our capital requirements.
Our management’s policy is to finance capital expenditures
primarily by internally generated funds and to a lesser extent
by funds raised through the issuance of debt and equity
securities in domestic and foreign capital markets.
We rely for our liquidity principally on cash and other work-
ing capital as well as the issue of debentures, medium-term
notes and commercial paper, bank loans and other uncom-
mitted sources of financing. As of March 31, 2011, we main-
tained commitment line agreements with a number of
domestic banks under which we may borrow in order to
ensure efficient access to necessary funds. These commit-
ment line agreements generally provide for a one-year term,
renewable upon mutual agreement between us and each of
the lending banks, although we also maintained another
commitment line agreement that will end in May 2013. Our
unused commitment lines totaled ¥300.0 billion as of
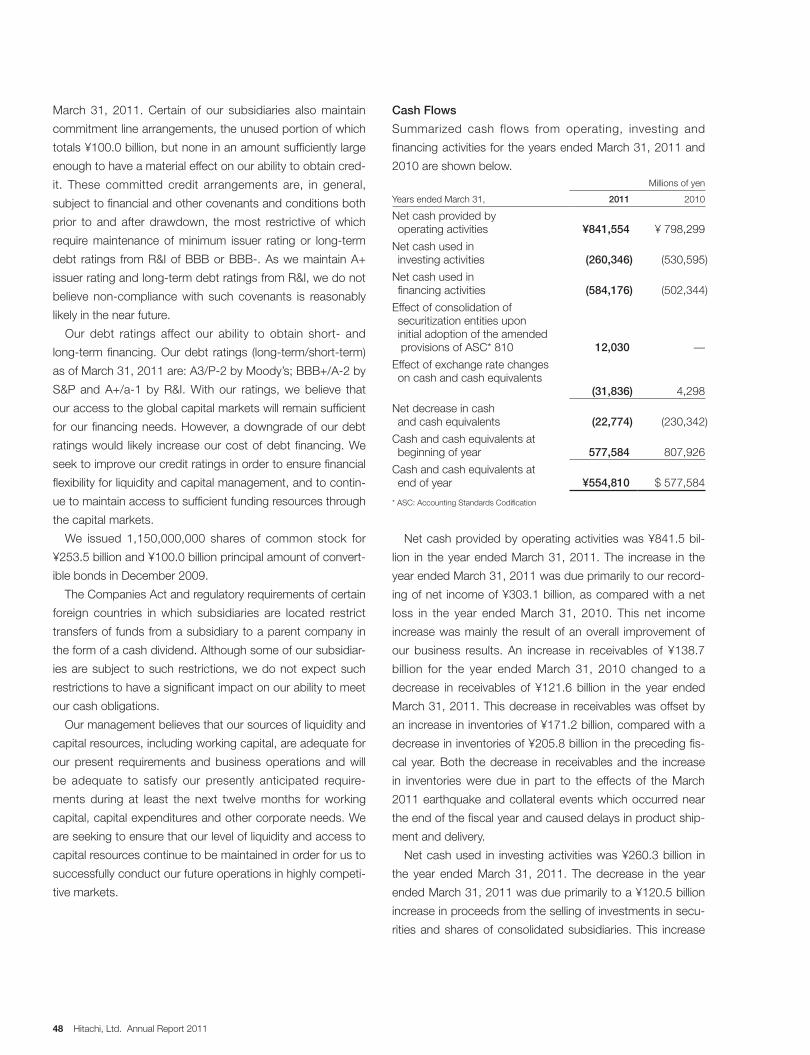
48 Hitachi, Ltd. Annual Report 2011
March 31, 2011. Certain of our subsidiaries also maintain
commitment line arrangements, the unused portion of which
totals ¥100.0 billion, but none in an amount sufficiently large
enough to have a material effect on our ability to obtain cred-
it. These committed credit arrangements are, in general,
subject to financial and other covenants and conditions both
prior to and after drawdown, the most restrictive of which
require maintenance of minimum issuer rating or long-term
debt ratings from R&I of BBB or BBB-. As we maintain A+
issuer rating and long-term debt ratings from R&I, we do not
believe non-compliance with such covenants is reasonably
likely in the near future.
Our debt ratings affect our ability to obtain short- and
long-term financing. Our debt ratings (long-term/short-term)
as of March 31, 2011 are: A3/P-2 by Moody’s; BBB+/A-2 by
S&P and A+/a-1 by R&I. With our ratings, we believe that
our access to the global capital markets will remain sufficient
for our financing needs. However, a downgrade of our debt
ratings would likely increase our cost of debt financing. We
seek to improve our credit ratings in order to ensure financial
flexibility for liquidity and capital management, and to contin-
ue to maintain access to sufficient funding resources through
the capital markets.
We issued 1,150,000,000 shares of common stock for
¥253.5 billion and ¥100.0 billion principal amount of convert-
ible bonds in December 2009.
The Companies Act and regulatory requirements of certain
foreign countries in which subsidiaries are located restrict
transfers of funds from a subsidiary to a parent company in
the form of a cash dividend. Although some of our subsidiar-
ies are subject to such restrictions, we do not expect such
restrictions to have a significant impact on our ability to meet
our cash obligations.
Our management believes that our sources of liquidity and
capital resources, including working capital, are adequate for
our present requirements and business operations and will
be adequate to satisfy our presently anticipated require-
ments during at least the next twelve months for working
capital, capital expenditures and other corporate needs. We
are seeking to ensure that our level of liquidity and access to
capital resources continue to be maintained in order for us to
successfully conduct our future operations in highly competi-
tive markets.
Cash Flows
Summarized cash flows from operating, investing and
financing activities for the years ended March 31, 2011 and
2010 are shown below. Millions of yen
Years ended March 31, 2011 2010
Net cash provided by operating activities ¥841,554 ¥ 798,299
Net cash used in investing activities (260,346) (530,595)
Net cash used in financing activities (584,176) (502,344)
Effect of consolidation of securitization entities upon initial adoption of the amended provisions of ASC* 810 12,030 —
Effect of exchange rate changes on cash and cash equivalents
(31,836) 4,298
Net decrease in cash and cash equivalents (22,774) (230,342)
Cash and cash equivalents at beginning of year 577,584 807,926
Cash and cash equivalents at end of year ¥554,810 $ 577,584
* ASC: Accounting Standards Codification
Net cash provided by operating activities was ¥841.5 bil-
lion in the year ended March 31, 2011. The increase in the
year ended March 31, 2011 was due primarily to our record-
ing of net income of ¥303.1 billion, as compared with a net
loss in the year ended March 31, 2010. This net income
increase was mainly the result of an overall improvement of
our business results. An increase in receivables of ¥138.7
billion for the year ended March 31, 2010 changed to a
decrease in receivables of ¥121.6 billion in the year ended
March 31, 2011. This decrease in receivables was offset by
an increase in inventories of ¥171.2 billion, compared with a
decrease in inventories of ¥205.8 billion in the preceding fis-
cal year. Both the decrease in receivables and the increase
in inventories were due in part to the effects of the March
2011 earthquake and collateral events which occurred near
the end of the fiscal year and caused delays in product ship-
ment and delivery.
Net cash used in investing activities was ¥260.3 billion in
the year ended March 31, 2011. The decrease in the year
ended March 31, 2011 was due primarily to a ¥120.5 billion
increase in proceeds from the selling of investments in secu-
rities and shares of consolidated subsidiaries. This increase
Hitachi, Ltd. Annual Report 2011 49
was mainly the result of selling a substantial portion of our
shares in IPS Alpha Technology, formerly an equity method
affiliate. In addition, capital expenditures decreased ¥31.7
billion to ¥254.4 billion in the year ended March 31, 2011, as
compared with the year ended March 31, 2010. This
decrease reflects our commitment to maintaining a selective
attitude toward capital expenditures. As of March 31, 2011,
our capital commitments for the purchase of property, plant
and equipment amounted to ¥38.8 billion, which is expected
to be funded primarily through internal sources of financing.
Net cash used in financing activities was ¥584.1 billion in
the year ended March 31, 2011, due primarily to our efforts
to reduce interest-bearing debt, including increased repay-
ment of outstanding long-term debt. This increased repay-
ment was partially offset by an increase in short-term debt
due in part to our issuance of commercial paper.
In the year ended March 31, 2011, the above activities
decreased cash and cash equivalents by ¥22.7 billion from
the year ended March 31, 2010. Cash and cash equivalents
as of March 31, 2011 amounted to ¥554.8 billion, primarily
held in Japanese yen, with a substantial portion of the
remaining amount held in U.S. dollars.
We consider short-term investments, the change of which
we classify as investing activities, an immediately available
source of funds. Short-term investments as of March 31,
2011 amounted to ¥16.5 billion, a decrease of ¥36.9 billion
from March 31, 2010 due primarily to a decrease in avail-
able-for-sale securities. As a result of the foregoing, the total
of cash and cash equivalents and short-term investments as
of March 31, 2011 was ¥571.4 billion, a decrease of ¥59.7
billion from March 31, 2010.
Assets, Liabilities and Equity
As of March 31, 2011, our total assets amounted to
¥9,185.6 billion, an increase of ¥221.1 billion from March 31,
2010, despite a decrease in property, plant and equipment
as a result of our continuing selective attitude toward capital
investment. The increase was mainly due to the recording of
financial assets transferred to consolidated securitization
entities on the consolidated balance sheet in accordance
with the amendments to provisions of ASC 860 (“Transfers
and Servicing”) and ASC 810 (“Consolidation”). Our total
cash and cash equivalents and short-term investments as of
March 31, 2011 amounted to ¥571.4 billion, a decrease of
¥59.7 billion from the level as of March 31, 2010.
As of March 31, 2011, our total interest-bearing debt,
which represents the sum of short-term debt, long-term
debt and non-recourse borrowings of consolidated securiti-
zation entities, amounted to ¥2,521.5 billion, an increase of
¥154.4 billion from March 31, 2010. This increase was due
primarily to the recording of liabilities associated with the
consolidation of securitization entities as a result of the
changes in accounting standards mentioned above. As of
March 31, 2011, short-term debt, consisting mainly of bor-
rowings from banks and commercial paper, amounted to
¥472.5 billion, an increase of ¥21.1 billion from March 31,
2010. As of March 31, 2011, long-term debt (excluding cur-
rent portion), consisting mainly of debentures, debentures
with stock acquisition rights, medium-term notes and loans
principally from banks and insurance companies, amounted
to ¥1,300.3 billion, a decrease of ¥311.6 billion from
March 31, 2010, due primarily to our repayment of long-term
debt. As of March 31, 2011, the current portion of long-term
debt amounted to ¥338.2 billion, an increase of ¥34.4 billion
from March 31, 2010. A significant portion of our long-term
debt bears a fixed rate of interest. Seasonal factors do not
significantly affect our debt. In general, there are no material
restrictions on our use of borrowings. For further details
including the maturity and interest rates, see note 10 to our
consolidated financial statements.
As of March 31, 2011, noncontrolling interests amounted
to ¥1,001.5 billion, an increase of ¥18.3 billion from
March 31, 2010, due primarily to the improvement of busi-
ness results at our listed subsidiaries.
As of March 31, 2011, our total stockholders’ equity
amounted to ¥1,439.8 billion, an increase of ¥155.2 billion
from March 31, 2010. The increase primarily reflects the
posting of net income attributable to Hitachi, Ltd. As a result,
our ratio of total stockholders’ equity to total assets as of
March 31, 2011 was 15.7%, compared with 14.3% as of
March 31, 2010. Our ratio of interest-bearing debt to total
equity (the sum of total stockholders’ equity and noncontrol-
ling interests) decreased to 1.03, compared with 1.04 as of
March 31, 2010.
We and our subsidiaries assess foreign currency
exchange rate risk and interest rate risk by continually moni-
toring changes in our exposure to these risks and by evalu-
ating hedging opportunities. We use certain derivative
financial instruments in order to reduce such risks. We gen-
erally do not enter into derivative financial instruments for
speculation purposes.

50 Hitachi, Ltd. Annual Report 2011
Millions of yenThousands of
U.S. dollars (note 3)
Assets 2011 2010 2011
Current assets:
Cash and cash equivalents (note 7) . . . . . . . . . . . . . . . . . . . . . . . . . . ¥ 554,810 ¥ 577,584 $ 6,684,458
Short-term investments (note 4) . . . . . . . . . . . . . . . . . . . . . . . . . . . . 16,598 53,575 199,976
Trade receivables:
Notes (notes 7, 18 and 29) . . . . . . . . . . . . . . . . . . . . . . . . . . . . . . 101,524 105,605 1,223,181
Accounts (notes 7 and 29) . . . . . . . . . . . . . . . . . . . . . . . . . . . . . . 2,026,158 2,180,357 24,411,542
Allowance for doubtful receivables (note 29) . . . . . . . . . . . . . . . . . (36,763) (43,470) (442,928 )
Net trade receivables . . . . . . . . . . . . . . . . . . . . . . . . . . . . . . . . . 2,090,919 2,242,492 25,191,795
Investments in leases (notes 6, 7 and 29) . . . . . . . . . . . . . . . . . . . . . 228,346 194,108 2,751,157
Current portion of financial assets transferred to consolidated securitization entities (notes 7 and 29) . . . . . . . . . . . . . . . . . . . . . . . 183,559 — 2,211,554
Inventories (note 5) . . . . . . . . . . . . . . . . . . . . . . . . . . . . . . . . . . . . . . 1,341,768 1,222,077 16,165,880
Prepaid expenses and other current assets (notes 7 and 9) . . . . . . . 484,029 485,361 5,831,674
Total current assets . . . . . . . . . . . . . . . . . . . . . . . . . . . . . . . . . . 4,900,029 4,775,197 59,036,494
Investments and advances, including affiliated companies (notes 4 and 7) . . . . . . . . . . . . . . . . . . . . . . . . . . . . . . . . . . . . . . . . . . 614,145 712,993 7,399,337
Property, plant and equipment (note 6):
Land . . . . . . . . . . . . . . . . . . . . . . . . . . . . . . . . . . . . . . . . . . . . . . . . . 471,155 471,123 5,676,566
Buildings . . . . . . . . . . . . . . . . . . . . . . . . . . . . . . . . . . . . . . . . . . . . . 1,909,825 1,931,104 23,009,940
Machinery and equipment . . . . . . . . . . . . . . . . . . . . . . . . . . . . . . . . 5,528,889 5,554,953 66,613,121
Construction in progress . . . . . . . . . . . . . . . . . . . . . . . . . . . . . . . . . . 53,558 62,717 645,277
7,963,427 8,019,897 95,944,904
Less accumulated depreciation . . . . . . . . . . . . . . . . . . . . . . . . . . . . 5,852,157 5,800,093 70,507,916
Net property, plant and equipment . . . . . . . . . . . . . . . . . . . . . . 2,111,270 2,219,804 25,436,988
Intangible assets (note 8):
Goodwill . . . . . . . . . . . . . . . . . . . . . . . . . . . . . . . . . . . . . . . . . . . . . . 171,500 165,586 2,066,265
Other intangible assets . . . . . . . . . . . . . . . . . . . . . . . . . . . . . . . . . . . 356,518 352,464 4,295,398
Total intangible assets . . . . . . . . . . . . . . . . . . . . . . . . . . . . . . . . 528,018 518,050 6,361,663
Financial assets transferred to consolidated securitization entities (notes 7 and 29) . . . . . . . . . . . . . . . . . . . . . . . . . . . . . . . . . . . . . . . . . 304,160
— 3,664,578
Other assets (notes 6, 7, 9, 11 and 29) . . . . . . . . . . . . . . . . . . . . . . . . . 728,007 738,420 8,771,169
Total assets . . . . . . . . . . . . . . . . . . . . . . . . . . . . . . . . . . . . . . . . ¥9,185,629 ¥8,964,464 $110,670,229
See accompanying notes to consolidated financial statements.
Consolidated Balance SheetsHitachi, Ltd. and Subsidiaries
March 31, 2011 and 2010

Hitachi, Ltd. Annual Report 2011 51
Millions of yenThousands of
U.S. dollars (note 3)
Liabilities and Equity 2011 2010 2011
Current liabilities:
Short-term debt (note 10) . . . . . . . . . . . . . . . . . . . . . . . . . . . . . . . . . . ¥ 472,588 ¥ 451,451 $ 5,693,831
Current portion of long-term debt (notes 6, 7 and 10) . . . . . . . . . . . . . 338,218 303,730 4,074,916
Current portion of non-recourse borrowings of consolidated securitization entities (note 7) . . . . . . . . . . . . . . . . . . . . . . . . . . . . . . 190,868 — 2,299,614
Trade payables:
Notes . . . . . . . . . . . . . . . . . . . . . . . . . . . . . . . . . . . . . . . . . . . . . . . 20,430 25,737 246,145
Accounts . . . . . . . . . . . . . . . . . . . . . . . . . . . . . . . . . . . . . . . . . . . . 1,236,758 1,229,546 14,900,699
Accrued expenses (notes 11 and 18) . . . . . . . . . . . . . . . . . . . . . . . . . 933,918 919,849 11,252,024
Income taxes (note 9) . . . . . . . . . . . . . . . . . . . . . . . . . . . . . . . . . . . . . 73,514 50,446 885,711
Advances received . . . . . . . . . . . . . . . . . . . . . . . . . . . . . . . . . . . . . . . 395,605 385,199 4,766,325
Other current liabilities (notes 7 and 9) . . . . . . . . . . . . . . . . . . . . . . . . . 426,925 565,245 5,143,675
Total current liabilities . . . . . . . . . . . . . . . . . . . . . . . . . . . . . . . . . . 4,088,824 3,931,203 49,262,940
Long-term debt (notes 6, 7 and 10) . . . . . . . . . . . . . . . . . . . . . . . . . . . . 1,300,311 1,611,962 15,666,398
Non-recourse borrowings of consolidated securitization entities (note 7) . . . . . . . . . . . . . . . . . . . . . . . . . . . . . . . . . . . . . . . . . . . . . . . . . 219,566
— 2,645,373
Retirement and severance benefits (note 11) . . . . . . . . . . . . . . . . . . . . . 891,815 905,183 10,744,759
Other liabilities (note 9) . . . . . . . . . . . . . . . . . . . . . . . . . . . . . . . . . . . . . . 243,724 248,271 2,936,434
Total liabilities . . . . . . . . . . . . . . . . . . . . . . . . . . . . . . . . . . . . . . . . 6,744,240 6,696,619 81,255,904
Commitments and contingencies (note 18)
Equity:
Common stock
4,520,144,964 and 4,518,132,365 shares issued as of March 31, 2011 and 2010, respectively (notes 10 and 12). . . . . . . 409,129 408,810 4,929,265
Capital surplus (notes 12 and 13) . . . . . . . . . . . . . . . . . . . . . . . . . . . . 603,133 620,577 7,266,663
Legal reserve and retained earnings (notes 7 and 14) . . . . . . . . . . . . . 922,036 713,479 11,108,867
Accumulated other comprehensive loss (notes 7 and 16) . . . . . . . . . . (493,062) (432,057) (5,940,506)
Treasury stock, at cost (note 15) . . . . . . . . . . . . . . . . . . . . . . . . . . . . . (1,371) (26,151) (16,518)
Total Hitachi, Ltd. stockholders’ equity . . . . . . . . . . . . . . . . . . . . . 1,439,865 1,284,658 17,347,771
Noncontrolling interests . . . . . . . . . . . . . . . . . . . . . . . . . . . . . . . . 1,001,524 983,187 12,066,554
Total equity . . . . . . . . . . . . . . . . . . . . . . . . . . . . . . . . . . . . . . . . . 2,441,389 2,267,845 29,414,325
Total liabilities and equity . . . . . . . . . . . . . . . . . . . . . . . . . . . . . . . ¥9,185,629 ¥8,964,464 $110,670,229
See accompanying notes to consolidated financial statements.

52 Hitachi, Ltd. Annual Report 2011
Millions of yenThousands of
U.S. dollars (note 3)
2011 2010 2009 2011
Revenues:
Product sales . . . . . . . . . . . . . . . . . . . . . . . . . . . . . . . . . . . . . . . . ¥ 8,376,287 ¥ 8,044,971 ¥ 9,076,913 $100,919,121
Financial and other services . . . . . . . . . . . . . . . . . . . . . . . . . . . . . 939,520 923,575 923,456 11,319,518
Total revenues . . . . . . . . . . . . . . . . . . . . . . . . . . . . . . . . . . . . . 9,315,807 8,968,546 10,000,369 112,238,639
Cost of sales:
Product sales . . . . . . . . . . . . . . . . . . . . . . . . . . . . . . . . . . . . . . . . (6,292,555) (6,185,937) (7,153,228) (75,813,916)
Financial and other services . . . . . . . . . . . . . . . . . . . . . . . . . . . . . (674,878) (663,318) (662,952) (8,131,060)
Total cost of sales . . . . . . . . . . . . . . . . . . . . . . . . . . . . . . . . . . . (6,967,433) (6,849,255) (7,816,180) (83,944,976)
Selling, general and administrative expenses . . . . . . . . . . . . . . . . . . (1,903,866) (1,917,132) (2,057,043) (22,938,145)
Impairment losses for long-lived assets (note 19) . . . . . . . . . . . . . . . (35,170) (25,196) (128,400 ) (423,735)
Restructuring charges (note 20) . . . . . . . . . . . . . . . . . . . . . . . . . . . . (5,757) (25,154 ) (22,927 ) (69,361)
Interest income . . . . . . . . . . . . . . . . . . . . . . . . . . . . . . . . . . . . . . . . 13,267 12,017 19,177 159,843
Dividend income . . . . . . . . . . . . . . . . . . . . . . . . . . . . . . . . . . . . . . . 4,240 5,799 8,544 51,084
Gains on sales of stock by subsidiaries or affiliated companies . . . . . — 183 360 —
Other income (note 21) . . . . . . . . . . . . . . . . . . . . . . . . . . . . . . . . . . . 69,730 186 5,203 840,121
Interest charges . . . . . . . . . . . . . . . . . . . . . . . . . . . . . . . . . . . . . . . . (24,878) (26,252) (33,809 ) (299,735)
Other deductions (note 21) . . . . . . . . . . . . . . . . . . . . . . . . . . . . . . . . (13,597) (21,976) (102,960 ) (163,819)
Equity in net loss of affiliated companies . . . . . . . . . . . . . . . . . . . . . . (20,142) (58,186) (162,205) (242,675)
Income (loss) before income taxes . . . . . . . . . . . . . . . . . . . . . . . . 432,201 63,580 (289,871) 5,207,241
Income taxes (note 9) . . . . . . . . . . . . . . . . . . . . . . . . . . . . . . . . . . . . (129,075) (147,971) (505,249) (1,555,120)
Net income (loss) . . . . . . . . . . . . . . . . . . . . . . . . . . . . . . . . . . . . . 303,126 (84,391) (795,120) 3,652,121
Less net income (loss) attributable to noncontrolling interests . . . . . . 64,257 22,570 (7,783) 774,181
Net income (loss) attributable to Hitachi, Ltd. . . . . . . . . . . . . . . . . ¥ 238,869 ¥ (106,961) ¥ (787,337) $ 2,877,940
Net income (loss) attributable to Hitachi, Ltd. stockholders per share
(note 22): Yen U.S. dollars (note 3)
Basic . . . . . . . . . . . . . . . . . . . . . . . . . . . . . . . . . . . . . . . . . . . . . . ¥52.89 ¥(29.20) ¥(236.86) $0.64
Diluted . . . . . . . . . . . . . . . . . . . . . . . . . . . . . . . . . . . . . . . . . . . . . 49.38 (29.20) (236.87) 0.59
See accompanying notes to consolidated financial statements.
Consolidated Statements of OperationsHitachi, Ltd. and Subsidiaries
Years ended March 31, 2011, 2010 and 2009

Hitachi, Ltd. Annual Report 2011 53
Millions of yenThousands of
U.S. dollars (note 3)
2011 2010 2009 2011
Common stock (notes 10 and 12):
Balance at beginning of year . . . . . . . . . . . . . . . . . . . . . . . . . . . . . ¥ 408,810 ¥ 282,033 ¥ 282,033 $ 4,925,422
Change in common stock:
Issuance of common stock . . . . . . . . . . . . . . . . . . . . . . . . . . . . — 126,776 — —
Conversion of convertible bonds . . . . . . . . . . . . . . . . . . . . . . . . 319 1 — 3,843
Total change in common stock . . . . . . . . . . . . . . . . . . . . . . . 319 126,777 — 3,843
Balance at end of year . . . . . . . . . . . . . . . . . . . . . . . . . . . . . . . . . ¥ 409,129 ¥ 408,810 ¥ 282,033 $ 4,929,265
Capital surplus (notes 10, 12 and 13):
Balance at beginning of year . . . . . . . . . . . . . . . . . . . . . . . . . . . . . ¥ 620,577 ¥ 560,066 ¥ 555,410 $ 7,476,831
Change in capital surplus:
Issuance of common stock . . . . . . . . . . . . . . . . . . . . . . . . . . . . — 125,644 — —
Conversion of convertible bonds . . . . . . . . . . . . . . . . . . . . . . . . 319 1 — 3,843
Equity transactions and other . . . . . . . . . . . . . . . . . . . . . . . . . . (8,229) (64,998) 4,843 (99,144)
Sales of treasury stock . . . . . . . . . . . . . . . . . . . . . . . . . . . . . . . (9,534) (136) (187) (114,867)
Total change in capital surplus . . . . . . . . . . . . . . . . . . . . . . . . (17,444) 60,511 4,656 (210,168)
Balance at end of year . . . . . . . . . . . . . . . . . . . . . . . . . . . . . . . . . ¥ 603,133 ¥ 620,577 ¥ 560,066 $ 7,266,663
Legal reserve and retained earnings (notes 7 and 14):
Balance at beginning of year . . . . . . . . . . . . . . . . . . . . . . . . . . . . . ¥ 713,479 ¥ 820,440 ¥1,626,497 $ 8,596,132
Change in legal reserve and retained earnings: Effect on retained earnings due to consolidation of securitization entities upon initial adoption of the amended provisions of ASC 810 . . . . . . . . . . . . . . . . . . . . . . . . . . . . . . . . . . . . . . . (7,732) — — (93,157) Equity transactions and other . . . . . . . . . . . . . . . . . . . . . . . . . . — — 1,224 —
Net income (loss) . . . . . . . . . . . . . . . . . . . . . . . . . . . . . . . . . . . . 238,869 (106,961) (787,337) 2,877,940
Dividends to Hitachi, Ltd. stockholders . . . . . . . . . . . . . . . . . . . (22,580) — (19,944) (272,048)
Total change in legal reserve and retained earnings . . . . . . . . 208,557 (106,961) (806,057) 2,512,735
Balance at end of year . . . . . . . . . . . . . . . . . . . . . . . . . . . . . . . . . ¥ 922,036 ¥ 713,479 ¥ 820,440 $11,108,867
Accumulated other comprehensive loss (notes 7 and 16):
Balance at beginning of year . . . . . . . . . . . . . . . . . . . . . . . . . . . . . ¥ (432,057) ¥(586,351) ¥ (267,198) $ (5,205,506)
Change in accumulated other comprehensive loss: Effect on accumulated other comprehensive loss due to consolidation of securitization entities upon initial adoption of the amended provisions of ASC 810 . . . . . . . . . . . . . . . . . . (2,977) — — (35,867) Equity transactions and other . . . . . . . . . . . . . . . . . . . . . . . . . . (191) (14,132) 785 (2,301)
Other comprehensive income (loss), net of reclassification adjustments . . . . . . . . . . . . . . . . . . . . . . (57,837) 168,426 (319,938) (696,832)
Total change in accumulated other comprehensive loss . . . . . (61,005) 154,294 (319,153) (735,000)
Balance at end of year . . . . . . . . . . . . . . . . . . . . . . . . . . . . . . . . . ¥ (493,062) ¥(432,057) ¥ (586,351) $ (5,940,506)
Treasury stock, at cost (note 15):
Balance at beginning of year . . . . . . . . . . . . . . . . . . . . . . . . . . . . . ¥ (26,151) ¥ (26,237) ¥ (26,130) $ (315,072)
Change in treasury stock, at cost:
Acquisition of treasury stock . . . . . . . . . . . . . . . . . . . . . . . . . . . (183) (115) (858) (2,205)
Sales of treasury stock . . . . . . . . . . . . . . . . . . . . . . . . . . . . . . . 24,963 201 751 300,759
Total change in treasury stock, at cost . . . . . . . . . . . . . . . . . . 24,780 86 (107) 298,554
Balance at end of year . . . . . . . . . . . . . . . . . . . . . . . . . . . . . . . . . ¥ (1,371) ¥ (26,151) ¥ (26,237) $ (16,518)
(Continued on following page.)
Consolidated Statements of EquityHitachi, Ltd. and Subsidiaries
Years ended March 31, 2011, 2010 and 2009

54 Hitachi, Ltd. Annual Report 2011
Millions of yenThousands of
U.S. dollars (note 3)
2011 2010 2009 2011
Total Hitachi, Ltd. stockholders’ equity:
Balance at beginning of year . . . . . . . . . . . . . . . . . . . . . . . . . . . . . ¥1,284,658 ¥1,049,951 ¥ 2,170,612 $15,477,807
Change in total Hitachi, Ltd. stockholders’ equity:
Effect on retained earnings due to consolidation of securitization entities upon initial adoption of the amended provisions of ASC 810 . . (7,732) — — (93,157) Effect on accumulated other comprehensive loss due to consolidation of securitization entities upon initial adoption of the amended provisions of ASC 810 . . . . . . . . . . . . . . . . . . . . (2,977) — — (35,867) Issuance of common stock . . . . . . . . . . . . . . . . . . . . . . . . . . . . — 252,420 — —
Conversion of convertible bonds . . . . . . . . . . . . . . . . . . . . . . . 638 2 — 7,686
Equity transactions and other . . . . . . . . . . . . . . . . . . . . . . . . . . (8,420) (79,130) 6,852 (101,445)
Net income (loss) . . . . . . . . . . . . . . . . . . . . . . . . . . . . . . . . . . . . 238,869 (106,961) (787,337) 2,877,940
Other comprehensive income (loss), net of reclassification adjustments . . (57,837) 168,426 (319,938) (696,832)
Dividends to Hitachi, Ltd. stockholders . . . . . . . . . . . . . . . . . . . (22,580) — (19,944) (272,048)
Acquisition of treasury stock . . . . . . . . . . . . . . . . . . . . . . . . . . . (183) (115) (858) (2,205)
Sales of treasury stock . . . . . . . . . . . . . . . . . . . . . . . . . . . . . . . 15,429 65 564 185,892
Total change in total Hitachi, Ltd. stockholders’ equity . . . . . . 155,207 234,707 (1,120,661) 1,869,964
Balance at end of year ¥1,439,865 ¥1,284,658 ¥ 1,049,951 $17,347,771
Noncontrolling interests (notes 7 and 13):
Balance at beginning of year . . . . . . . . . . . . . . . . . . . . . . . . . . . . . ¥ 983,187 ¥1,129,401 ¥ 1,142,508 $11,845,626
Change in noncontrolling interests:
Effect on retained earnings due to consolidation of securitization entities upon initial adoption of the amended provisions of ASC 810 . . (5,225) — — (62,952) Effect on accumulated other comprehensive loss due to consolidation of securitization entities upon initial adoption of the amended provisions of ASC 810 . . . . . . . . . . . . . . . . . . . . (1,985) — — (23,915) Equity transactions and other . . . . . . . . . . . . . . . . . . . . . . . . . . (1,696) (174,675) 90,750 (20,434)
Net income (loss) . . . . . . . . . . . . . . . . . . . . . . . . . . . . . . . . . . . . 64,257 22,570 (7,783) 774,181
Other comprehensive income (loss), net of reclassification adjustments . . (16,830) 30,509 (67,668) (202,771)
Dividends to noncontrolling interests . . . . . . . . . . . . . . . . . . . . . (20,184) (24,618) (28,406) (243,181)
Total change in noncontrolling interests . . . . . . . . . . . . . . . . . 18,337 (146,214) (13,107) 220,928
Balance at end of year . . . . . . . . . . . . . . . . . . . . . . . . . . . . . . . . . ¥1,001,524 ¥ 983,187 ¥ 1,129,401 $12,066,554
Total equity:
Balance at beginning of year . . . . . . . . . . . . . . . . . . . . . . . . . . . . . ¥2,267,845 ¥2,179,352 ¥ 3,313,120 $27,323,433
Change in total equity:
Effect on retained earnings due to consolidation of securitization entities upon initial adoption of the amended provisions of ASC 810 . . (12,957) — — (156,109) Effect on accumulated other comprehensive loss due to consolidation of securitization entities upon initial adoption of the amended provisions of ASC 810 . . . . . . . . . . . . . . . . . . (4,962) — — (59,782) Issuance of common stock . . . . . . . . . . . . . . . . . . . . . . . . . . . . — 252,420 — —
Conversion of convertible bonds . . . . . . . . . . . . . . . . . . . . . . . . 638 2 — 7,686
Equity transactions and other . . . . . . . . . . . . . . . . . . . . . . . . . . (10,116) (253,805) 97,602 (121,879)
Net income (loss) . . . . . . . . . . . . . . . . . . . . . . . . . . . . . . . . . . . . 303,126 (84,391) (795,120) 3,652,121
Other comprehensive income (loss), net of reclassification adjustments . . (74,667) 198,935 (387,606) (899,603)
Dividends to Hitachi, Ltd. stockholders . . . . . . . . . . . . . . . . . . . (22,580) — (19,944) (272,048)
Dividends to noncontrolling interests . . . . . . . . . . . . . . . . . . . . . (20,184) (24,618) (28,406) (243,181)
Acquisition of treasury stock . . . . . . . . . . . . . . . . . . . . . . . . . . . (183) (115) (858) (2,205)
Sales of treasury stock . . . . . . . . . . . . . . . . . . . . . . . . . . . . . . . 15,429 65 564 185,892
Total change in total equity . . . . . . . . . . . . . . . . . . . . . . . . . . . 173,544 88,493 (1,133,768) 2,090,892
Balance at end of year . . . . . . . . . . . . . . . . . . . . . . . . . . . . . . . . . ¥2,441,389 ¥2,267,845 ¥ 2,179,352 $29,414,325
(Continued on following page.)

Hitachi, Ltd. Annual Report 2011 55
Millions of yenThousands of
U.S. dollars (note 3)
2011 2010 2009 2011
Comprehensive income (loss) attributable to Hitachi, Ltd. (note 16):
Net income (loss) attributable to Hitachi, Ltd. . . . . . . . . . . . . . . . . ¥238,869 ¥(106,961) ¥ (787,337) $ 2,877,940
Other comprehensive income (loss) attributable to Hitachi, Ltd. arising during the year:
Foreign currency translation adjustments . . . . . . . . . . . . . . . . . . (69,194) 4,289 (110,899) (833,663)
Pension liability adjustments . . . . . . . . . . . . . . . . . . . . . . . . . . . 15,852 141,761 (184,153) 190,988
Net unrealized holding gain (loss) on available-for-sale securities . . (5,728) 23,209 (22,855 ) (69,012)
Cash flow hedges . . . . . . . . . . . . . . . . . . . . . . . . . . . . . . . . . . . 1,233 (833) (2,031) 14,855
Total other comprehensive income (loss) attributable to Hitachi, Ltd. arising during the year . . . . . . . . . . . . . . . . . . . (57,837) 168,426 (319,938) (696,832)
Comprehensive income (loss) attributable to Hitachi, Ltd. . . . . . . . ¥181,032 ¥ 61,465 ¥(1,107,275) $ 2,181,108
Comprehensive income (loss) attributable to noncontrolling interests (note 16):
Net income (loss) attributable to noncontrolling interests . . . . . . . . ¥ 64,257 ¥ 22,570 ¥ (7,783) $ 774,181
Other comprehensive income (loss) attributable to noncontrolling interests arising during the year:
Foreign currency translation adjustments . . . . . . . . . . . . . . . . . . (18,185) 2,618 (33,671) (219,096)
Pension liability adjustments . . . . . . . . . . . . . . . . . . . . . . . . . . . 224 22,262 (28,942) 2,699
Net unrealized holding gain (loss) on available-for-sale securities . . 376 5,467 (3,502 ) 4,530
Cash flow hedges . . . . . . . . . . . . . . . . . . . . . . . . . . . . . . . . . . . 755 162 (1,553) 9,096
Total other comprehensive income (loss) attributable to noncontrolling interests arising during the year . . . . . . . . . . .
(16,830) 30,509 (67,668) (202,771)
Comprehensive income (loss) attributable to noncontrolling interests . . ¥ 47,427 ¥ 53,079 ¥ (75,451) $ 571,410
Total comprehensive income (loss) (note 16):
Net income (loss) . . . . . . . . . . . . . . . . . . . . . . . . . . . . . . . . . . . . . ¥303,126 ¥ (84,391) ¥ (795,120) $ 3,652,121
Other comprehensive income (loss) arising during the year:
Foreign currency translation adjustments . . . . . . . . . . . . . . . . . . (87,379) 6,907 (144,570) (1,052,759)
Pension liability adjustments . . . . . . . . . . . . . . . . . . . . . . . . . . . 16,076 164,023 (213,095) 193,687
Net unrealized holding gain (loss) on available-for-sale securities (5,352) 28,676 (26,357) (64,482)
Cash flow hedges . . . . . . . . . . . . . . . . . . . . . . . . . . . . . . . . . . . 1,988 (671) (3,584) 23,951
Total other comprehensive income (loss) arising during the year . . (74,667) 198,935 (387,606) (899,603)
Total comprehensive income (loss) . . . . . . . . . . . . . . . . . . . . . . . . ¥228,459 ¥ 114,544 ¥(1,182,726) $ 2,752,518
See accompanying notes to consolidated financial statements.

56 Hitachi, Ltd. Annual Report 2011
Millions of yenThousands of
U.S. dollars (note 3)
2011 2010 2009 2011
Cash flows from operating activities (note 24): Net income (loss) . . . . . . . . . . . . . . . . . . . . . . . . . . . . . . . . . . . . . ¥ 303,126 ¥ (84,391) ¥(795,120) $ 3,652,121 Adjustments to reconcile net income (loss) to net cash provided by operating activities: Depreciation . . . . . . . . . . . . . . . . . . . . . . . . . . . . . . . . . . . . . . . 382,732 441,697 478,759 4,611,229 Amortization . . . . . . . . . . . . . . . . . . . . . . . . . . . . . . . . . . . . . . . 115,037 116,065 178,164 1,385,988 Impairment losses for long-lived assets . . . . . . . . . . . . . . . . . . . 35,170 25,196 128,400 423,735 Deferred income taxes . . . . . . . . . . . . . . . . . . . . . . . . . . . . . . . 3,952 60,440 403,968 47,614 Equity in net loss of affiliated companies . . . . . . . . . . . . . . . . . . 20,142 58,186 162,205 242,675 Gain on sale of investments in securities and other . . . . . . . . . . (72,987) (6,061) (1,353) (879,361) Impairment of investments in securities . . . . . . . . . . . . . . . . . . . 11,407 9,585 45,016 137,434 Loss on disposal of rental assets and other property . . . . . . . . . 4,387 22,670 24,483 52,855 (Increase) decrease in receivables . . . . . . . . . . . . . . . . . . . . . . . 121,606 (138,785) 342,008 1,465,132 (Increase) decrease in inventories . . . . . . . . . . . . . . . . . . . . . . . (171,275 ) 205,848 (57,206 ) (2,063,554) Decrease in prepaid expenses and other current assets . . . . . . 1,964 8,687 12,772 23,662 Increase (decrease) in payables . . . . . . . . . . . . . . . . . . . . . . . . . 47,512 62,295 (359,230) 572,434 Increase (decrease) in accrued expenses and retirement and severance benefits . . . . . . . . . . . . . . . . . . . . . . . . . . . . . . . . . 22,871 69,724 (27,050) 275,554 Increase (decrease) in accrued income taxes . . . . . . . . . . . . . . . 3,066 17,249 (76,343) 36,940 Increase (decrease) in other liabilities . . . . . . . . . . . . . . . . . . . . . (26,118) (83,519) 39,711 (314,675) Net change in inventory-related receivables from financial services . . 19,523 (17,935) 2,117 235,217 Other . . . . . . . . . . . . . . . . . . . . . . . . . . . . . . . . . . . . . . . . . . . . . 19,439 31,348 57,646 234,205 Net cash provided by operating activities . . . . . . . . . . . . . . . . 841,554 798,299 558,947 10,139,205
Cash flows from investing activities (note 24): Capital expenditures . . . . . . . . . . . . . . . . . . . . . . . . . . . . . . . . . . . (254,460) (286,259) (422,109) (3,065,783) Purchase of intangible assets . . . . . . . . . . . . . . . . . . . . . . . . . . . . (95,500) (85,092) (107,949) (1,150,603) Purchase of tangible assets and software to be leased . . . . . . . . . (268,446) (271,341) (357,079 ) (3,234,289) Proceeds from disposal of property, plant and equipment . . . . . . . 27,427 20,821 13,110 330,446 Proceeds from disposal of tangible assets and software to be leased . . . . . . . . . . . . . . . . . . . . . . . . . . . . . . . . . . . . . . . . . . 19,866 22,672 33,401 239,349 Collection of investments in leases . . . . . . . . . . . . . . . . . . . . . . . . 286,356 172,327 234,984 3,450,072 Purchase of investments in securities and shares of newly consolidated subsidiaries . . . . . . . . . . . . . . . . . . . . . . . . . (122,555) (156,989) (60,337) (1,476,566) Proceeds from sale of investments in securities and shares of consolidated subsidiaries resulting in deconsolidation . . . . . . . . . 147,941 27,410 112,771 1,782,422 Refund of deposit received for sale of investment in affiliated company . . (43,550) — — (524,699) Other . . . . . . . . . . . . . . . . . . . . . . . . . . . . . . . . . . . . . . . . . . . . . . 42,575 25,856 3,200 512,952 Net cash used in investing activities . . . . . . . . . . . . . . . . . . . . (260,346) (530,595) (550,008) (3,136,699)
Cash flows from financing activities (note 24): Increase (decrease) in short-term debt, net . . . . . . . . . . . . . . . . . . 75,535 (551,044) 314,899 910,060 Proceeds from long-term debt . . . . . . . . . . . . . . . . . . . . . . . . . . . 179,324 656,768 467,341 2,160,530 Payments on long-term debt . . . . . . . . . . . . . . . . . . . . . . . . . . . . . (790,328) (565,212) (441,550) (9,522,024) Proceeds from issuance of common stock . . . . . . . . . . . . . . . . . . — 252,420 — — Proceeds from sale of common stock by subsidiaries . . . . . . . . . . 415 504 900 5,000 Dividends paid to Hitachi, Ltd. stockholders . . . . . . . . . . . . . . . . . (22,466) (134) (19,826) (270,675) Dividends paid to noncontrolling interests . . . . . . . . . . . . . . . . . . . (19,575) (24,852) (28,406) (235,843) Acquisition of common stock for treasury . . . . . . . . . . . . . . . . . . . (183) (115 ) (841 ) (2,205) Proceeds from sales of treasury stock . . . . . . . . . . . . . . . . . . . . . . 52 65 564 627 Purchase of shares of consolidated subsidiaries from noncontrolling interest holders . . . . . . . . . . . . . . . . . . . . . . . . . . . (3,043) (261,113) — (36,663) Proceeds from sale of shares of consolidated subsidiaries to noncontrolling interest holders . . . . . . . . . . . . . . . . . . . . . . . . . . . 229 1,886 — 2,759 Other . . . . . . . . . . . . . . . . . . . . . . . . . . . . . . . . . . . . . . . . . . . . . . (4,136 ) (11,517 ) (8,693 ) (49,831) Net cash provided by (used in) financing activities . . . . . . . . . (584,176) (502,344) 284,388 (7,038,265)
Effect of consolidation of securitization entities upon initial adoption of the amended provisions of ASC 810 (note 7) . . . . . . . . . . . . . . . 12,030 — — 144,940 Effect of exchange rate changes on cash and cash equivalents . . . . (31,836) 4,298 (46,361) (383,566)Net increase (decrease) in cash and cash equivalents . . . . . . . . . . . . (22,774) (230,342) 246,966 (274,385)Cash and cash equivalents at beginning of year . . . . . . . . . . . . . . . . 577,584 807,926 560,960 6,958,843 Cash and cash equivalents at end of year . . . . . . . . . . . . . . . . . . . . . ¥ 554,810 ¥ 577,584 ¥ 807,926 $ 6,684,458
See accompanying notes to consolidated financial statements.
Consolidated Statements of Cash FlowsHitachi, Ltd. and Subsidiaries
Years ended March 31, 2011, 2010 and 2009

Hitachi, Ltd. Annual Report 2011 57
Notes to Consolidated Financial StatementsHitachi, Ltd. and Subsidiaries
1. NATURE OF OPERATIONS
Hitachi, Ltd. (the Company) is a Japanese corporation, whose principal office is located in Japan. The Company’s and
its subsidiaries’ businesses are diverse, and include information and telecommunication systems, power systems,
social infrastructure and industrial systems, electronic systems and equipment, construction machinery, high functional
materials and components, automotive systems, components and devices, digital media and consumer products,
financial services, and others including logistics services.
2. BASIS OF PRESENTATION AND SUMMARY OF SIGNIFICANT ACCOUNTING POLICIES
(a) Basis of Presentation
The Company and its domestic subsidiaries keep their books of account in accordance with the financial accounting
standards of Japan, and its foreign subsidiaries in accordance with those of the countries of their domicile.
The consolidated financial statements presented herein have been prepared to reflect the adjustments which are
necessary to conform them with accounting principles generally accepted in the United States of America.
Management of the Company has made a number of estimates and assumptions relating to the reporting of assets
and liabilities and the disclosure of contingent assets and liabilities to prepare these financial statements. Actual results
could differ from those estimates.
(b) Principles of Consolidation
The consolidated financial statements include the accounts of the Company, its majority-owned subsidiaries and all
variable interest entities (VIEs) for which the Company or any of its consolidated entities is the primary beneficiary. The
definition of a VIE is included in Accounting Standards Codification (ASC) 810, “Consolidation.” This guidance
addresses how a business enterprise should evaluate whether it has a controlling financial interest in an entity through
means other than voting rights and accordingly should consolidate the entity. The consolidated financial statements
include accounts of certain subsidiaries whose closing dates differ from March 31 by 93 days or less to either comply
with local statutory requirements or facilitate timely reporting. There have been no significant transactions, which would
materially affect the Company’s financial position and results of operations, with such subsidiaries during the period
from their closing dates to March 31. Intercompany accounts and significant intercompany transactions have been
eliminated in consolidation.
Investments in corporate joint ventures and affiliated companies, where the Company has the ability to exercise
significant influence over operational and financial policies generally by holding 20 - 50% ownership, are accounted for
under the equity method. Investments where the Company does not have significant influence are accounted for under
the cost method.
(c) Cash Equivalents
The Company considers all highly liquid investments with insignificant risk of changes in value which have original
maturities of three months or less when purchased to be cash equivalents.
(d) Allowance for Doubtful Receivables
Allowance for doubtful receivables, including both trade receivables as well as investments in leases, is the Company’s
and subsidiaries’ best estimate of the amount of our incurred losses (that is those amounts with regards to which
collection is not probable based on current information). Assessing the ultimate realization of these receivables, based
on historical experience and analyses, including the current creditworthiness of each customer, requires a considerable
amount of judgment. Each company in our consolidated group considers factors which are relevant to its business and
circumstances, including business practices that are unique to the respective country or region in which it operates
within the context of our group policy. Such factors which have been present on a historical basis and have

58 Hitachi, Ltd. Annual Report 2011
contributed to losses at our subsidiaries in the past include: historical credit loss experience; existence of overdue
payments; extended payment terms; negative evaluation by third-party credit rating agencies; excessive debt; and
evaluation of deteriorating financial position and operating results. Account balances are generally written off against
the allowance only after all means of collection have been exhausted and the potential for recovery is considered
remote. Write-offs generally occur only when a debtor enters bankruptcy or liquidation because at that time collection
efforts will have been exhausted. This policy results in potentially long collection cycles.
(e) Foreign Currency Translation
Foreign currency financial statements have been translated in accordance with ASC 830, “Foreign Currency Matters.”
Under this guidance, the assets and liabilities of the Company’s subsidiaries located outside Japan are translated into
Japanese yen at the rates of exchange in effect at the balance sheet date. Income and expense items are translated at
the average exchange rates prevailing during the year. Gains and losses resulting from foreign currency transactions
are included in other income (deductions), and those resulting from translation of financial statements are excluded
from the consolidated statements of operations and included in accumulated other comprehensive loss.
(f) Investments in Securities and Affiliated Companies
Equity securities that do not have readily determinable fair values, except for equity-method investments, are
accounted for under the cost method. The Company classifies investments in equity securities that have readily
determinable fair values and all investments in debt securities in three categories: held-to-maturity securities, trading
securities and available-for-sale securities.
Held-to-maturity securities are debt securities that the Company has the positive intent and ability to hold to maturity.
Trading securities are debt and equity securities that are bought and held principally for the purpose of selling them in
the near term. Available-for-sale securities are debt and equity securities not classified as either held-to-maturity
securities or trading securities.
Held-to-maturity securities are reported at amortized cost. Trading securities are reported at fair value, with unrealized
gains and losses included in earnings. Available-for-sale securities are reported at fair value, with unrealized gains and
losses excluded from earnings and reported in accumulated other comprehensive loss.
On a periodic basis, but no less frequently than at the end of each quarter period, the Company evaluates available-
for-sale securities, held-to-maturity securities and cost-method investments for possible impairment. If the fair value of
any available-for-sale security, held-to-maturity security or cost-method investment is less than the cost basis or the
amortized cost basis, the Company assesses whether the impairment is temporary or other-than-temporary. Fair value
is determined based on quoted market prices, projected discounted cash flows or other valuation techniques as
appropriate. For certain cost-method investments for which it is not practicable to estimate the fair value, if an event or
change in circumstances has occurred that may have a significant adverse effect on the fair value of the investment,
the Company estimates the fair value of such investments.
Factors considered in determining whether an impairment of an equity security classified as available-for-sale or a cost-
method investment is temporary or other-than-temporary include: the length of time and extent to which the fair value
of the investment has been less than cost, the financial condition and near-term prospects of the issuer, and the intent
and ability to retain the investment in the issuer for a period of time sufficient to allow for any anticipated recovery in fair
value. A decline in fair value of an equity security classified as an available-for-sale security or cost-method investment
below its cost basis that is deemed to be other-than-temporary results in a write-down of the cost basis to fair value as
a new cost basis and the amount of the write-down is included in earnings. The new cost basis of the investment is
not adjusted for subsequent recoveries in fair value.
Factors considered in assessing whether an impairment of a debt security classified as either available-for-sale or held-
to-maturity is temporary or other-than-temporary include: whether there is intent to sell the impaired debt security, it is

Hitachi, Ltd. Annual Report 2011 59
more likely than not that the impaired debt security will be required to be sold before recovery, or the holder is not
expected to recover the entire amortized cost basis of the security for any other reason. If the best estimate of the
present value of cash flows expected to be collected is less than the amortized cost basis of the security, such a
difference represents the credit loss component of the impairment. If an other-than-temporary impairment has
occurred, the amount of the other-than-temporary impairment recognized in earnings depends on whether the
Company intends to sell the security or it is more likely than not that the Company will be required to sell the security
before recovery of its amortized cost basis less any current-period credit loss. If the Company does not intend to sell
the security and it is not more likely than not that the Company will be required to sell the security before recovery of its
amortized cost basis less any current-period loss, the component of the other-than-temporary impairment related to
the credit loss is recognized in earnings and the component of the other-than-temporary impairment related to other
factors is recognized in accumulated other comprehensive loss. The previous amortized cost basis less the other-than-
temporary impairment recognized in earnings becomes the new amortized cost basis of the investment. That new
amortized cost basis is not adjusted for subsequent recoveries in fair value. However, the new amortized cost basis is
adjusted for accretion and amortization as if the debt security had been purchased on the date of the other-than
temporary impairment at an amortized cost basis equal to the previous amortized cost basis less the other-than-
temporary impairment recognized in earnings.
On a periodic basis, but no less frequently than at the end of each quarter period, the Company evaluates the carrying
amount of its ownership interests in equity-method investees for possible impairment. Factors considered in assessing
whether an indication of other-than-temporary impairment exists include the achievement of business plan objectives
and milestones including cash flow projections and the results of planned financing activities, the financial condition
and prospects of each investee company, the fair value of the ownership interest relative to the carrying amount of the
investment, the period of time during which the fair value of the ownership interest has been below the carrying
amount of the investment and other relevant factors. Impairment to be recognized is measured based on the amount
by which the carrying amount of the investment exceeds the fair value of the investment. Fair value is determined
based on quoted market prices, projected discounted cash flows or other valuation techniques as appropriate.
The cost of a security sold or the amount reclassified out of accumulated other comprehensive loss into earnings is
determined by the average cost method.
(g) Securitizations
The Company and certain subsidiaries have a number of securitization programs. Under those programs, certain
financial assets such as lease receivables, trade receivables and others are sold to Special Purpose Entities (SPEs)
which are mainly funded through the issuance of asset-backed securities to investors. When a transfer of financial
assets is eligible to be accounted for as a sale under ASC 860, “Transfers and Servicing,” the transferred financial
assets are derecognized. The Company and its subsidiaries recognize a gain or loss for the difference between the fair
value of assets obtained and liabilities incurred in the sale and the carrying amount of the transferred financial assets
when the transaction is consummated. Initially recorded at fair value in the period of securitizations, the amount of
retained interests that can contractually be prepaid or otherwise settled in such a way that the holder would not
recover all of its recorded interests is subsequently remeasured at fair value as of the balance sheet date in the same
manner as available-for-sale securities.
Fair values are based on the present value of estimated future cash flows which take into consideration various factors
such as expected credit loss and others.
(h) Inventories
Inventories are stated at the lower of cost or market. Cost is determined by the specific identification method for job
order inventories and generally by the average cost method for raw materials and other inventories.

60 Hitachi, Ltd. Annual Report 2011
(i) Property, Plant and Equipment
Property, plant and equipment are stated at cost. Property, plant and equipment are principally depreciated using the
declining-balance method, except for some assets which are depreciated using the straight-line method, mainly over
the following estimated useful lives:
Buildings
Buildings and building equipment .............................................................................. 3 to 50 years
Structures .................................................................................................................. 7 to 60 years
Machinery and equipment
Machinery .................................................................................................................. 4 to 15 years
Vehicles ..................................................................................................................... 4 to 7 years
Tools, furniture and fixtures ........................................................................................ 2 to 20 years
(j) Goodwill and Other Intangible Assets
The Company tests goodwill and indefinite-lived intangible assets for impairment at least annually. The Company
performs its annual impairment test mainly during the fourth quarter after the annual forecasting process is completed.
Furthermore, goodwill is reviewed for impairment whenever events or changes in circumstances indicate that the
carrying value may not be recoverable. The impairment test consists of two steps. In the first step, the Company
compares the fair value of each reporting unit to its carrying value. The Company has certain operating segments and,
in identifying the reporting unit for the purpose of testing goodwill for impairment, considers disaggregating those
operating segments into economically dissimilar components based on specific facts and circumstances, especially
the level at which performance of the operating segments are reviewed, how many businesses are included in the
operating segments, and the economic similarity of those businesses. In assigning goodwill to reporting units, the
Company considers which reporting units are expected to benefit from the synergies of the combination in a manner
similar to how the amount of goodwill is recognized in a business combination. The Company determines the fair value
of its reporting units mainly using an income approach (i.e., present value technique). When determining such fair
value, the Company may, however, also use the fair value of that unit based on a comparison of comparable publicly
traded companies or based on that unit’s stand-alone market capitalization. If the carrying value of the net assets
assigned to the reporting unit exceeds the fair value of the reporting unit, then the Company performs the second step
of the impairment test in order to determine the implied fair value of the reporting unit’s goodwill. If the carrying value of
a reporting unit’s goodwill exceeds its implied fair value, the Company records an impairment loss equal to the
difference. Intangible assets with finite useful lives are amortized over their respective estimated useful lives on either a
straight-line basis or the method that reflects the pattern in which the economic benefits of the intangible assets are
consumed or otherwise used up. The principal estimated useful lives are as follows:
Software .................................................................................................................... 1 to 10 years
Software for internal use ............................................................................................ 3 to 10 years
Patents ...................................................................................................................... 4 to 8 years
Other ......................................................................................................................... 2 to 25 years
(k) Capitalized Software Costs
Costs incurred for computer software developed or obtained for internal use are capitalized and amortized on a
straight-line basis over their estimated useful lives in accordance with ASC 350, “Intangibles – Goodwill and Other.” In
addition, the Company and its subsidiaries develop certain computer software to be sold where related costs are
capitalized after establishment of technological feasibility in accordance with ASC 985, “Software.” The annual
amortization of such capitalized costs is the greater of the amount computed using the ratio of each software’s current
year gross revenues to the total of current and anticipated future gross revenues or the straight-line method over the
remaining estimated economic life of each software product.

Hitachi, Ltd. Annual Report 2011 61
(l) Impairment of Long-lived Assets
The Company reviews the carrying value of long-lived assets or a related group of assets to be held and used,
including intangible assets with finite useful lives, for impairment whenever events or circumstances occur that indicate
that the carrying value of the assets may not be recoverable. The assets are considered to be impaired when
estimated undiscounted cash flows expected to result from the use of the assets and their eventual disposition is less
than their carrying values. The impairment losses are measured as the amount by which the carrying value of the asset
or asset group exceeds the fair value. In determining the fair value, the Company uses available quoted market prices
and present value techniques, if appropriate, based on the estimated future cash flows expected to result from the use
of the assets and their eventual disposition.
(m) Retirement and Severance Benefits
The Company accounts for retirement and severance benefits in accordance with ASC 715, “Compensation –
Retirement Benefits.” Actuarial gains and losses and prior service benefit and cost included in accumulated other
comprehensive loss are amortized using the straight-line method over the average remaining service period of active
employees.
(n) Environmental Liabilities
The cost for environmental remediation liabilities is accrued when it is probable that the Company will incur
environmental assessments or cleanup costs and the amounts can be reasonably estimated. The cost for liabilities is
estimated based on the circumstances, the available information and current law, and the liabilities are not discounted
to their present values.
(o) Derivative Financial Instruments
The Company accounts for derivative financial instruments in accordance with ASC 815, “Derivatives and Hedging.”
This guidance requires that all derivative financial instruments, such as forward exchange and interest rate swap
contracts, be recognized in the financial statements as either assets or liabilities and measured at fair value regardless
of the purpose or intent for holding them.
The Company designates and accounts for hedging derivatives as follows:
• “Fair value” hedge: a hedge of the fair value of a recognized asset or liability or of an unrecognized firm commitment.
The changes in fair value of the recognized assets or liabilities or unrecognized firm commitments and the related
derivatives are both recorded in earnings if the hedge is considered highly effective.
• “Cash flow” hedge: a hedge of a forecasted transaction or of the variability of cash flows to be received or paid
related to a recognized asset or liability. The changes in the fair value of the derivatives designated as cash flow
hedges are recorded as other comprehensive income (loss) if the hedge is considered highly effective. This treatment
is continued until earnings are affected by the variability in cash flows or the unrecognized firm commitment of the
designated hedged item, at which point changes in fair value of the derivative are recognized in income (loss).
• “Foreign currency” hedge: a hedge of foreign-currency fair value or cash flow. The changes in fair value of the
recognized assets or liabilities or unrecognized firm commitments and the derivatives are recorded as either earnings
or other comprehensive income (loss) if the hedge is considered highly effective. Recognition as earnings or other
comprehensive income (loss) is dependent on the treatment of foreign currency hedges as either fair value or cash
flow hedges.
62 Hitachi, Ltd. Annual Report 2011
The Company follows the documentation requirements as prescribed by the guidance, which includes risk
management objective and strategy for undertaking various hedge transactions. In addition, a formal assessment is
made at the hedge’s inception and periodically on an ongoing basis, as to whether the derivative used in hedging
activities is highly effective in offsetting changes in fair values or cash flows of hedged items. Hedge accounting is
discontinued for ineffective hedges, if any. Subsequent changes in the fair value of derivatives related to discontinued
hedges are recognized in earnings immediately.
The Company classifies cash flows from derivatives as cash flows from operating activities in the consolidated
statements of cash flows.
(p) Revenue Recognition
The Company recognizes revenue when persuasive evidence of an arrangement exists, delivery has occurred or
services have been rendered, the sales price is fixed or determinable, and collectibility is reasonably assured.
The Company offers multiple solutions to meet its customers’ needs. Those solutions may involve the delivery or
performance of multiple elements, such as products, services, or rights to use assets, and performance may occur at
different points in time or over different periods of time. When one element is delivered prior to the other in an
arrangement, revenue is deferred until the delivery of the last element, unless transactions are such that the delivered
item has value to the customer on a standalone basis, there is objective and reliable evidence of the fair value of the
undelivered item, and delivery or performance of the undelivered item is considered probable and substantially in the
control of the Company if the arrangement includes a general right of return relative to the delivered item. If all
conditions described above are met, each element in an arrangement is considered a separate unit of accounting, and
the arrangement consideration is allocated to the separate units of accounting based on the relative fair values
provided that there is objective and reliable evidence of the fair values of all units of accounting in the arrangement. The
Company allocates revenue for software arrangements involving multiple elements to each element based on its
relative fair value, as evidenced by vendor specific objective evidence (VSOE), or in the absence of VSOE of the
delivered elements, the residual method. VSOE is the price charged by the Company to an external customer for the
same element when such an element is sold separately.
Product Sales:
Revenue from sales of products is recognized when title and risk of loss have been transferred to the customer
depending upon the terms of the contract or arrangement with the customer. The Company’s policy is not to accept
product returns unless the products are defective. The conditions of delivery are governed by the terms of the contract
or customer arrangement and those not meeting the predetermined specification are not recorded as revenue. When
the final payment is subject to customer acceptance, a portion of revenue for the amount of the final payment is
deferred until an enforceable claim has become effective. Product warranties are offered on the Company’s and certain
subsidiaries’ products and a warranty accrual is established when sales are recognized based on estimated future
costs of repair and replacement principally using historical experience of warranty claims. Revenue from separately
priced extended warranty and product maintenance contracts is deferred and recognized in income on a straight-line
basis over the contract period except in those circumstances in which sufficient historical evidence indicates that the
costs of performing services under the contract are incurred on other than a straight-line basis.
Price protection is provided to retailers of the Company’s consumer products business and others to compensate the
customer retailers for a decline in the product’s value due mainly to competition. Price protection granted to the
customers is classified as a reduction of revenue in the consolidated statements of operations. In addition, it is the
Company’s policy to accrue reasonably and reliably estimated price adjustments at the later of the date at which the
related sales are recognized, or the date at which price protection is offered. The estimate is made based primarily
upon historical experience or agreement on the adjustment rate and the number of units that are subject to such
adjustment (e.g., units in distribution channels).

Hitachi, Ltd. Annual Report 2011 63
Product revenues which are recognized upon delivery, installation or acceptance by the customer include information
technology system products, construction equipment, displays, disk drives, televisions, air conditioners, batteries,
magnetic tapes, high functional materials, cable products, automotive equipment, semiconductor manufacturing
equipment, test and measurement equipment, railway vehicles, medical electronic devices, industrial machinery and
equipment, elevators and escalators.
Revenue from sales of tangible products under long-term construction type arrangements, in connection with the
construction of nuclear, thermal and hydroelectric power plants, are recognized under the percentage-of-completion
method. Under the percentage-of-completion method, revenue is recognized as a percentage of estimated total
revenue that incurred costs to date bear to estimated total costs after giving effect to estimates of costs to complete
based upon the most recent information. Any anticipated losses on fixed price contracts are charged to operations
when such losses can be estimated. Provisions are made for contingencies in the period in which they become known
pursuant to specific contract terms and conditions and are estimable. When reasonably dependable estimates of
contract revenues and costs and the extent of progress toward completion do not exist, the completed-contract
method of accounting is applied. A contract is complete when either acceptance by the customer is given or
compliance with performance specifications is achieved, whichever is appropriate under the relevant contractual terms.
The Company recognizes software revenue in accordance with the provisions of ASC 985, “Software.” Revenue from
software consists primarily of software licensing, customized software development and post contract customer
support. Revenues from software license arrangements are recognized upon delivery of the software if evidence of the
arrangement exists, pricing is fixed or determinable and collectibility is reasonably assured. Revenue from a software
arrangement that requires significant production, modification or customization of software is recognized using the
percentage-of-completion method provided that reasonably dependable estimates related to contract revenue, cost
and the extent of progress toward completion exist. Otherwise, the completed-contract method is applied.
Customization of software is considered substantially completed when an acceptance by the customer occurs.
Revenue from post contract customer support is amortized over the period of the post contract customer support.
Consulting and training services revenues are recognized when the services are rendered.
Service Revenues:
Service revenues from maintenance and distribution services are recognized upon completion of service delivery.
Revenue from time-based service contracts is recognized as services are rendered. Revenue from long-term fixed
price service contracts such as support or maintenance contracts is recognized ratably over the contractual period. If
historical data shows that the accrual of service cost is not fixed and the service is rendered in proportion to the
accrual of the cost for the service, revenue is recognized based on the pattern of the cost accrual. Finance lease
income is recognized at level rates of return over the term of the leases. Operating lease income is recognized on a
straight-line basis over the term of the lease.
(q) Shipping and Handling Costs
Shipping and handling costs are expensed as incurred and included in selling, general and administrative expenses.
(r) Advertising
Advertising costs are expensed as incurred.
(s) Research and Development Costs
Research and development costs are expensed as incurred. Costs incurred in connection with the development of
software products for sale or lease to others are accounted for in accordance with ASC 985, “Software.” Development
costs incurred in the research and development of new software products and enhancements to existing products are
expensed as incurred until technological feasibility has been established.

64 Hitachi, Ltd. Annual Report 2011
(t) Income Taxes
Deferred income taxes are accounted for under the asset and liability method in accordance with ASC 740, “Income
Taxes.” Deferred tax assets and liabilities are recognized for the future tax consequences attributable to differences
between the financial statement carrying amounts of existing assets and liabilities and their respective tax bases and
operating losses and tax credit carryforwards. Under this method, deferred tax assets and liabilities are measured
using enacted tax rates expected to apply to taxable income in the years in which those temporary differences are
expected to be recovered or settled. Under ASC 740, the effect on deferred tax assets and liabilities of a change in tax
rates is recognized in income in the period that includes the enactment date. Valuation allowances are established to
reduce deferred tax assets to their net realizable value if it is more likely than not that some portion or all of the deferred
tax assets will not be realized.
Tax positions that are more likely than not to be sustained upon examination by tax authorities are recognized in the
financial statements in accordance with the provisions of ASC 740. Tax positions that meet the more-likely-than-not
recognition threshold are measured as the largest amount of tax benefit that is greater than 50 percent likely of being
realized upon ultimate settlement with tax authorities. Interest accrued related to unrecognized tax benefits and
penalties are included in income taxes in the consolidated statements of operations.
(u) Sales of Stock by Subsidiaries
Prior to the adoption of the provisions regarding noncontrolling interests in a subsidiary of ASC 810, the Company
elected to recognize the change in its proportionate share of a subsidiary’s equity resulting from issuance of stock by
the subsidiary in the consolidated statements of operations.
(v) Consumption Tax
Consumption tax collected and remitted to taxing authorities is excluded from revenues, cost of sales and expenses in
the consolidated statements of operations.
(w) Net Income Attributable to Hitachi, Ltd. Stockholders Per Share
Net income attributable to Hitachi, Ltd. stockholders per share is computed in accordance with ASC 260, “Earnings
Per Share.” This guidance requires a dual presentation of basic and diluted net income attributable to Hitachi, Ltd.
stockholders per share amounts on the face of the statements of operations. Under this guidance, basic net income
attributable to Hitachi, Ltd. stockholders per share is computed based upon the weighted average number of shares of
common stock outstanding during each year. Diluted net income attributable to Hitachi, Ltd. stockholders per share
reflects the potential dilution that could occur if securities or other contracts to issue common stock were exercised or
converted into common stock or resulted in the issuance of common stock that then shared in the earnings of the
Company.
(x) Guarantees
The Company recognizes, at the inception of the guarantee, a liability for the fair value of the obligation undertaken in
issuing the guarantee in accordance with ASC 460, “Guarantees.”

Hitachi, Ltd. Annual Report 2011 65
(y) Accounting Changes
The Company adopted the provisions of ASC 805, “Business Combinations,” and the provisions of ASC 810 regarding
noncontrolling interests in a subsidiary on April 1, 2009. These provisions improve and simplify the accounting for
business combinations and the reporting of noncontrolling interests in consolidated financial statements. The
provisions of ASC 805 require an acquiring entity in a business combination to recognize all the assets acquired,
liabilities assumed and any noncontrolling interest in an acquiree at the full amount of their fair values as of the
acquisition date. Also, the related provisions of ASC 810 clarify that a noncontrolling interest in a subsidiary should be
reported as equity in the consolidated financial statements and all the transactions resulting in changes in a parent’s
ownership interest in a subsidiary that do not result in deconsolidation are equity transactions. The adoption of the
provisions of ASC 805 did not have a material effect on the Company’s consolidated financial statements upon
adoption, however, the additional required disclosures are presented in note 30. The changes in equity resulting from
accounting treatment in accordance with the provisions of ASC 810 are presented in note 13.
The Company adopted the provisions of ASC 860, “Transfers and Servicing” amended by Accounting Standards
Update (ASU) 2009-16, “Accounting for Transfers of Financial Assets” on April 1, 2010. These provisions remove the
concept of a qualifying special-purpose entity and remove the exception from the application of variable interest
accounting to qualifying special-purpose entities. These provisions modify the financial-components approach used to
account for transfers of financial assets, limit the circumstances in which a transferor derecognizes a portion or
component of a financial asset when the transferor has not transferred the original financial asset to an entity and/or
when the transferor has continuing involvement with the financial asset, and establishes the “participating interests”
conditions for reporting a transfer. The provisions also require enhanced disclosures to provide financial statement
users with greater transparency about transfers of financial assets and a transferor’s continuing involvement.
The Company adopted the provisions of ASC 810, “Consolidation” amended by ASU 2009-17, “Improvements to
Financial Reporting by Enterprises Involved with Variable Interest Entities” on April 1, 2010. These provisions establish
how a company determines when an entity that is insufficiently capitalized or is not controlled through voting or similar
rights should be consolidated. The determination of whether a company is required to consolidate an entity is based
on qualitative information such as an entity’s purpose and design and a company’s ability to direct the activities of the
entity that most significantly impact the entity’s economic performance. The provisions also require enhanced
disclosures that will provide users of financial statements with more transparent information about an enterprise’s
involvement in a variable interest entity.
The effect of the adoption of the provisions amended by ASU 2009-16 and ASU 2009-17 is presented in note 7.
(z) Revision to the Consolidated Balance Sheet
The amounts of goodwill, other intangible assets and other liabilities in the consolidated balance sheet as of March 31,
2010 were revised to adjust the provisional amounts in accordance with the provisions of ASC 805, “Business
Combinations.” The evaluation of the fair values of the assets and liabilities related to the business combination
achieved in March 2010 was completed during the year ended March 31, 2011. Consequently, total assets and total
liabilities and equity in the consolidated balance sheet as of March 31, 2010 are also revised. The effects on the
consolidated balance sheet as of March 31, 2010 are presented in note 30.

66 Hitachi, Ltd. Annual Report 2011
3. BASIS OF FINANCIAL STATEMENT TRANSLATION
The accompanying consolidated financial statements are expressed in yen and, solely for the convenience of the
reader, have been translated into United States dollars at the rate of ¥83=U.S.$1, the approximate exchange rate
prevailing on the Tokyo Foreign Exchange Market as of March 31, 2011. This translation should not be construed as a
representation that all amounts shown could be converted into U.S. dollars.
4. INVESTMENTS IN SECURITIES AND AFFILIATED COMPANIES
Short-term investments as of March 31, 2011 and 2010 are as follows:
Millions of yenThousands of
U.S. dollars
2011 2010 2011
Investments in securities: Available-for-sale securities Government debt securities . . . . . . . . . . . . . . . . . . ¥ 2,907 ¥43,840 $ 35,024 Corporate debt securities . . . . . . . . . . . . . . . . . . . 11,041 6,074 133,024 Other securities . . . . . . . . . . . . . . . . . . . . . . . . . . . 2,610 3,621 31,446 Held-to-maturity securities . . . . . . . . . . . . . . . . . . . . 40 40 482
¥16,598 ¥53,575 $199,976
Investments and advances, including affiliated companies as of March 31, 2011 and 2010 are as follows:
Millions of yenThousands of
U.S. dollars
2011 2010 2011
Investments in securities: Available-for-sale securities Equity securities . . . . . . . . . . . . . . . . . . . . . . . . . . ¥145,816 ¥159,850 $1,756,819 Government debt securities . . . . . . . . . . . . . . . . . . 325 316 3,916 Corporate debt securities . . . . . . . . . . . . . . . . . . . 27,039 29,285 325,771 Other securities . . . . . . . . . . . . . . . . . . . . . . . . . . . 6,697 10,639 80,687 Held-to-maturity securities . . . . . . . . . . . . . . . . . . . . 355 236 4,277 Cost-method investments . . . . . . . . . . . . . . . . . . . . . 48,144 48,222 580,048 Investments in affiliated companies . . . . . . . . . . . . . . . . 316,443 300,956 3,812,566 Advances and other . . . . . . . . . . . . . . . . . . . . . . . . . . . 69,326 163,489 835,253
¥614,145 ¥712,993 $7,399,337

Hitachi, Ltd. Annual Report 2011 67
The following is a summary of the amortized cost basis, gross unrealized holding gains, gross unrealized holding losses
and aggregate fair value of available-for-sale securities by the consolidated balance sheet classifications as of March
31, 2011 and 2010.
Millions of yen
Amortizedcost basis
Grossgains
Grosslosses
Aggregatefair value
Amortizedcost basis
Grossgains
Grosslosses
Aggregatefair value
2011 2010
Short-term investments: Government debt securities . . . . . . . . . . ¥ 2,907 ¥ — ¥ — ¥ 2,907 ¥ 43,839 ¥ 1 ¥ — ¥ 43,840
Corporate debt securities . . . . . . . . . . 10,798 252 9 11,041 6,071 8 5 6,074 Other securities . . . . . . . 2,608 2 — 2,610 3,619 2 — 3,621
16,313 254 9 16,558 53,529 11 5 53,535Investments and advances: Equity securities . . . . . . 84,856 63,390 2,430 145,816 90,339 70,998 1,487 159,850 Government debt securities . . . . . . . . . . 311 14 — 325 305 11 — 316 Corporate debt securities . . . . . . . . . . 25,818 1,640 419 27,039 26,419 3,032 166 29,285 Other securities . . . . . . . 6,684 99 86 6,697 10,314 392 67 10,639
117,669 65,143 2,935 179,877 127,377 74,433 1,720 200,090¥133,982 ¥65,397 ¥2,944 ¥196,435 ¥180,906 ¥74,444 ¥1,725 ¥253,625
Thousands of U.S. dollars
Amortizedcost basis
Grossgains
Grosslosses
Aggregatefair value
2011
Short-term investments: Government debt securities . . . . . . . . . . $ 35,024 $ — $ — $ 35,024
Corporate debt securities . . . . . . . . . . 130,096 3,036 108 133,024 Other securities . . . . . . . 31,422 24 — 31,446
196,542 3,060 108 199,494 Investments and advances: Equity securities . . . . . . 1,022,361 763,735 29,277 1,756,819 Government debt securities . . . . . . . . . . 3,747 169 — 3,916 Corporate debt securities . . . . . . . . . . 311,060 19,759 5,048 325,771
Other securities . . . . . . . 80,531 1,193 1,037 80,687 1,417,699 784,856 35,362 2,167,193
$1,614,241 $787,916 $35,470 $2,366,687

68 Hitachi, Ltd. Annual Report 2011
The following is a summary of gross unrealized holding losses on available-for-sale securities and the fair value of the
related securities, aggregated by investment category and length of time that individual securities have been in a
continuous unrealized loss position, as of March 31, 2011 and 2010.
Millions of yen
Less than 12 months 12 months or longer Less than 12 months 12 months or longer
Aggregatefair value
Grosslosses
Aggregatefair value
Grosslosses
Aggregatefair value
Grosslosses
Aggregatefair value
Grosslosses
2011 2010
Short-term investments: Corporate debt securities . . . . . . . . . . ¥ 5,691 ¥ 9 ¥ — ¥ — ¥1,498 ¥ 2
¥ 697 ¥ 3
Investments and advances: Equity securities . . . . . . 9,378 1,183 4,381 1,247 3,491 532 4,718 955 Corporate debt securities . . . . . . . . . . 8,355 306 4,933 113 2,646 44 5,669 122 Other securities . . . . . . . 100 40 215 46 — — 327 67
17,833 1,529 9,529 1,406 6,137 576 10,714 1,144¥23,524 ¥1,538 ¥9,529 ¥1,406 ¥7,635 ¥578 ¥11,411 ¥1,147
Thousands of U.S. dollars
Less than 12 months 12 months or longer
Aggregatefair value
Grosslosses
Aggregatefair value
Grosslosses
2011
Short-term investments: Corporate debt securities . . . . . . . . . . $ 68,566 $ 108 $ — $ —
Investments and advances: Equity securities . . . . . . 112,988 14,253 52,783 15,024 Corporate debt securities . . . . . . . . . . 100,663 3,687 59,434 1,361 Other securities . . . . . . . 1,205 482 2,590 555
214,856 18,422 114,807 16,940$283,422 $18,530 $114,807 $16,940
Equity securities consist primarily of stocks issued by Japanese listed companies. Government debt securities consist
primarily of Japan treasury bonds. Corporate debt securities consist primarily of structured bonds. Other securities
consist primarily of investments funds.
The purchases of available-for-sale securities for the years ended March 31, 2011, 2010 and 2009 were ¥26,490
million ($319,157 thousand), ¥59,038 million and ¥24,729 million, respectively. The proceeds from the sale of available-
for-sale securities for the years ended March 31, 2011, 2010 and 2009 were ¥11,646 million ($140,313 thousand),
¥5,890 million and ¥60,063 million, respectively. The gross realized gains on the sale of those securities for the years
ended March 31, 2011, 2010 and 2009 were ¥3,556 million ($42,843 thousand), ¥1,124 million and ¥2,017 million,
respectively, while the gross realized losses on the sale of those securities for the years ended March 31, 2011, 2010
and 2009 were ¥385 million ($4,639 thousand), ¥56 million and ¥1,029 million, respectively.

Hitachi, Ltd. Annual Report 2011 69
The contractual maturities of debt securities and other securities classified as investments and advances in the
consolidated balance sheet as of March 31, 2011 are as follows:
Millions of yen Thousands of U.S. dollars
Held-to-maturity
Available-for-sale Total
Held-to-maturity
Available-for-sale Total
2011 2011
Due within five years . . . . . . . . . . . . . . . . ¥355 ¥13,711 ¥14,066 $4,277 $165,193 $169,470 Due after five years through ten years . . . . . . . . . . . . . . . . . . . . . . . — 5,979 5,979 — 72,036 72,036 Due after ten years . . . . . . . . . . . . . . . . . — 14,371 14,371 — 173,145 173,145
¥355 ¥34,061 ¥34,416 $4,277 $410,374 $414,651
Expected redemptions may differ from contractual maturities because some of these securities are redeemable at the
option of the issuers.
The aggregate carrying amounts of cost-method investments which were not evaluated for impairment as of March 31,
2011 and 2010 were ¥43,797 million ($527,675 thousand) and ¥47,900 million, respectively, mainly because it is not
practicable to estimate the fair value of the investments due to lack of a market price and difficulty in estimating fair
value without incurring excessive cost and the Company did not identify any events or changes in circumstances that
might have had a significant adverse effect on their fair value.
The aggregate fair values of investments in affiliated companies, for which a quoted market price was available, as of
March 31, 2011 and 2010, were ¥104,427 million ($1,258,157 thousand) and ¥17,388 million, respectively. The
aggregate carrying amounts of such investments as of March 31, 2011 and 2010 were ¥99,299 million ($1,196,373
thousand) and ¥13,962 million, respectively.
As of March 31, 2011 and 2010, cumulative recognition of other-than-temporary declines in values of investments in
certain affiliated companies resulted in the difference of ¥17,837 million ($214,904 thousand) and ¥32,621 million,
respectively, between the carrying amount of the investment and the amount of underlying equity in net assets. In
addition, as of March 31, 2011 and 2010, the carrying value of the investments in affiliated companies exceeded the
Company’s equity in the underlying net assets of such affiliated companies by ¥111,917 million ($1,348,398 thousand)
and ¥105,278 million, respectively. The excess is attributed first to certain fair value adjustments on a net-of-tax basis
at the time of the initial and subsequent investments in those companies with the remaining portion considered as
equity-method goodwill.
For the year ended March 31, 2011, there were no affiliated companies accounted for by the equity method which
were material to be disclosed separately. Summarized combined financial information relating to affiliated companies
accounted for by the equity method as of and for the year ended March 31, 2011 is as follows:
Millions of yenThousands of
U.S. dollars
2011 2011
Current assets . . . . . . . . . . . . . . . . . . . . . . . . . . . . . . . . . . . . . . . . . . . . . . . ¥1,305,406 $15,727,783 Non-current assets . . . . . . . . . . . . . . . . . . . . . . . . . . . . . . . . . . . . . . . . . . . . 835,964 10,071,856 Total assets . . . . . . . . . . . . . . . . . . . . . . . . . . . . . . . . . . . . . . . . . . . . . . . . 2,141,370 25,799,639 Current liabilities . . . . . . . . . . . . . . . . . . . . . . . . . . . . . . . . . . . . . . . . . . . . . . 1,145,724 13,803,903 Non-current liabilities . . . . . . . . . . . . . . . . . . . . . . . . . . . . . . . . . . . . . . . . . . 334,298 4,027,687 Total liabilities . . . . . . . . . . . . . . . . . . . . . . . . . . . . . . . . . . . . . . . . . . . . . . ¥1,480,022 $17,831,590
Millions of yenThousands of
U.S. dollars
2011 2011
Revenues . . . . . . . . . . . . . . . . . . . . . . . . . . . . . . . . . . . . . . . . . . . . . . . . . . . ¥2,208,543 $26,608,952 Gross profit . . . . . . . . . . . . . . . . . . . . . . . . . . . . . . . . . . . . . . . . . . . . . . . . . . 588,095 7,085,482 Net loss attributable to affiliated companies . . . . . . . . . . . . . . . . . . . . . . . . . (69,878) (841,904)

70 Hitachi, Ltd. Annual Report 2011
Summarized financial information relating to Renesas Technology Corp. (Renesas), Casio Hitachi Mobile
Communications Co., Ltd. (CHMC) and other affiliated companies accounted for by the equity method as of March 31,
2010 and for the years ended March 31, 2010 and 2009 is as follows:
Millions of yen
Renesas CHMC Others Total
2010
Current assets . . . . . . . . . . . . . . . . . . . . . . . . . . . . ¥327,687 ¥50,535 ¥ 645,257 ¥1,023,479Non-current assets . . . . . . . . . . . . . . . . . . . . . . . . . 294,192 9,521 465,209 768,922 Total assets . . . . . . . . . . . . . . . . . . . . . . . . . . . . . 621,879 60,056 1,110,466 1,792,401Current liabilities . . . . . . . . . . . . . . . . . . . . . . . . . . . 342,680 41,546 617,825 1,002,051Non-current liabilities . . . . . . . . . . . . . . . . . . . . . . . 135,603 1,014 100,779 237,396 Total liabilities . . . . . . . . . . . . . . . . . . . . . . . . . . . 478,283 42,560 718,604 1,239,447 Equity . . . . . . . . . . . . . . . . . . . . . . . . . . . . . . . . . 143,596 17,496 391,862 552,954 Stockholders’ equity . . . . . . . . . . . . . . . . . . . . . . 141,567 17,496 Percentage of ownership in equity investees . . . . 55.0% 49.0%
Equity investment and undistributed earnings of affiliated companies, before consolidating and reconciling adjustments. . . . . . . . . . . . . . . . . . . 77,862 8,573
Consolidation and reconciling adjustments: Impairment loss . . . . . . . . . . . . . . . . . . . . . . . . (10,881) (4,232) Other . . . . . . . . . . . . . . . . . . . . . . . . . . . . . . . . 2 (141) Investments in affiliated companies . . . . . . . . . . . ¥ 66,983 ¥ 4,200 ¥ 229,773 ¥ 300,956
Millions of yen
Renesas CHMC Others Total
2010
Revenues . . . . . . . . . . . . . . . . . . . . . . . . . . . . . . . . ¥ 599,791 ¥ 99,623 ¥ 1,170,893 ¥ 1,870,307Cost of sales . . . . . . . . . . . . . . . . . . . . . . . . . . . . . (555,990) (110,381) (1,007,203) (1,673,574) Gross profit (loss) . . . . . . . . . . . . . . . . . . . . . . . . 43,801 (10,758) 163,690 196,733Selling, general and administrative expenses . . . . . (108,003) (14,448) (176,368) (298,819)Impairment losses for long-lived assets. . . . . . . . . . (4,551) —Restructuring charges . . . . . . . . . . . . . . . . . . . . . . (202) —Other deductions (net) . . . . . . . . . . . . . . . . . . . . . . (12,603) (12) Loss before income taxes . . . . . . . . . . . . . . . . . . (81,558) (25,218) Income taxes . . . . . . . . . . . . . . . . . . . . . . . . . . . . . (4,991) (4,150) Net loss . . . . . . . . . . . . . . . . . . . . . . . . . . . . . . . (86,549) (29,368) Less net loss attributable to noncontrolling interests (183) — Net loss attributable to affiliated companies . . . . (86,366) (29,368) (51,729) (167,463) Percentage of ownership in equity investees . . . . 55.0% 49.0% Equity in net loss of affiliated companies, before consolidating and reconciling adjustments . . . . (47,501) (14,390) Consolidation and reconciling adjustments . . . . . (96) (1) Equity in net earnings (loss) of affiliated companies . . . . . . . . . . . . . . . . . . . . . . . . . . . . ¥ (47,597) ¥ (14,391) ¥ 3,802 ¥ (58,186)

Hitachi, Ltd. Annual Report 2011 71
Millions of yen
Renesas CHMC Others Total
2009
Revenues . . . . . . . . . . . . . . . . . . . . . . . . . . . . . . . . ¥ 702,739 ¥ 156,750 ¥ 1,583,498 ¥ 2,442,987Cost of sales . . . . . . . . . . . . . . . . . . . . . . . . . . . . . (662,626) (156,645) (1,420,373) (2,239,644) Gross profit . . . . . . . . . . . . . . . . . . . . . . . . . . . . . 40,113 105 163,125 203,343Selling, general and administrative expenses . . . . . (134,302)) (10,363) (187,693) (332,358)Impairment losses for long-lived assets. . . . . . . . . . (9,627) —Restructuring charges . . . . . . . . . . . . . . . . . . . . . . (16,872) —Other deductions (net) . . . . . . . . . . . . . . . . . . . . . . (16,494) (686) Loss before income taxes . . . . . . . . . . . . . . . . . . (137,182) (10,944) Income taxes . . . . . . . . . . . . . . . . . . . . . . . . . . . . . (82,666) (1,517) Net loss . . . . . . . . . . . . . . . . . . . . . . . . . . . . . . . (219,848) (12,461) Less net loss attributable to noncontrolling interests . . . . . . . . . . . . . . . . . . . . . . . . . . . . . . . . (1,318) — Net loss attributable to affiliated companies . . . . (218,530) (12,461) (164,437) (395,428) Percentage of ownership in equity investees . . . . 55.0% 49.0% Equity in net loss of affiliated companies, before consolidating and reconciling adjustments . . . . (120,192) (6,106) Consolidation and reconciling adjustments . . . . . (196) 141 Equity in net loss of affiliated companies . . . . . . . ¥(120,388) ¥ (5,965) ¥ (35,852) ¥ (162,205)
On April 1, 2003, Renesas, which focused on system LSI (Large Scale Integration) operations, was incorporated
through a corporate split procedure, where the semiconductor and integrated circuits operations of the Company and
Mitsubishi Electric Corporation were spun-off and contributed to a new company. Although the Company had owned
55.0% of the voting stock of Renesas since its foundation, the Company accounted for the investment under the
equity method of accounting as Mitsubishi Electric Corp. had substantive participating rights under the joint venture
agreement. Renesas increased its capital by ¥54,000 million and ¥71,700 million during the years ended March 31,
2009 and 2010, respectively. Renesas Electronics Corporation was established on April 1, 2010 when Renesas was
combined with NEC Electronics Corporation. As a result, the Company received a 30.6% interest in Renesas
Electronics Corporation and accounts for the investment under the equity method of accounting.
On April 1, 2004, CHMC, which focused on mobile phone design, production and sales, was incorporated. The
Company had owned 49.0% of the voting stock of CHMC since its foundation and accounted for the investment
under the equity method of accounting. CHMC increased its capital by ¥44,000 million during the year ended March
31, 2010. On June 1, 2010, CHMC was merged into NEC CASIO Mobile Communications, Ltd. Consequently, the
Company received a 16.7% interest in NEC CASIO Mobile Communications, Ltd. and accounts for the investment
under the cost method of accounting. NEC CASIO Mobile Communications, Ltd. increased its capital by allocating
new shares to shareholders other than the Company in June 2010, and as a result, the Company’s interest in NEC
CASIO Mobile Communications, Ltd. decreased to 9.3%.
The balances and transactions with affiliated companies accounted for by the equity method are as follows:
Millions of yenThousands of
U.S. dollars
2011 2010 2011
Trade receivables . . . . . . . . . . . . . . . . . . . . . . . . . . . . . . ¥77,484 ¥100,793 $933,542 Investments in leases . . . . . . . . . . . . . . . . . . . . . . . . . . . 12,158 16,595 146,482 Trade payables . . . . . . . . . . . . . . . . . . . . . . . . . . . . . . . . 21,543 43,248 259,554

72 Hitachi, Ltd. Annual Report 2011
Millions of yenThousands of
U.S. dollars
2011 2010 2009 2011
Revenues . . . . . . . . . . . . . . . . . . . . . ¥315,533 ¥373,889 ¥469,629 $3,801,602 Purchases . . . . . . . . . . . . . . . . . . . . 131,686 226,012 356,400 1,586,578
5. INVENTORIES
Inventories as of March 31, 2011 and 2010 are summarized as follows:
Millions of yenThousands of
U.S. dollars
2011 2010 2011
Finished goods . . . . . . . . . . . . . . . . . . . . . . . . . . . . . . . ¥ 533,724 ¥ 505,918 $ 6,430,410 Work in process . . . . . . . . . . . . . . . . . . . . . . . . . . . . . . 566,127 513,556 6,820,807 Raw materials . . . . . . . . . . . . . . . . . . . . . . . . . . . . . . . . 241,917 202,603 2,914,663
¥1,341,768 ¥1,222,077 $16,165,880
6. LEASES
The Company and certain subsidiaries are lessors of certain assets such as manufacturing machinery and equipment
under financing and operating lease arrangements with terms ranging from 3 to 6 years, some of which are transacted
with affiliated companies.
The amount of leased assets at cost under operating leases and accumulated depreciation as of March 31, 2011
amounted to ¥1,999,056 million ($24,085,012 thousand) and ¥1,729,655 million ($20,839,217 thousand), respectively.
The leased assets are depreciated using the straight-line method over their estimated useful lives.
The following table shows the future minimum lease receivables of financing and non-cancelable operating leases as of
March 31, 2011 and the future minimum lease receivables of financing leases as of March 31, 2010:
Millions of yen Thousands of U.S. dollars
Financing leases
Operating leases
Financingleases
Operating leases
Years ending March 31 2011 2011
2012. . . . . . . . . . . . . . . . . . . . . . . . . . . . . . . . . . . . . . . . . . . . . ¥367,446 ¥36,949 $ 4,427,060 $445,169 2013. . . . . . . . . . . . . . . . . . . . . . . . . . . . . . . . . . . . . . . . . . . . . 250,130 22,256 3,013,615 268,145 2014. . . . . . . . . . . . . . . . . . . . . . . . . . . . . . . . . . . . . . . . . . . . . 144,958 12,392 1,746,482 149,301 2015. . . . . . . . . . . . . . . . . . . . . . . . . . . . . . . . . . . . . . . . . . . . . 66,795 6,391 804,759 77,000 2016. . . . . . . . . . . . . . . . . . . . . . . . . . . . . . . . . . . . . . . . . . . . . 31,674 2,603 381,614 31,361 Thereafter . . . . . . . . . . . . . . . . . . . . . . . . . . . . . . . . . . . . . . . . . 95,125 1,813 1,146,084 21,843 Total minimum payments to be received . . . . . . . . . . . . . . . . . . 956,128 ¥82,404 11,519,614 $992,819 Unguaranteed residual values . . . . . . . . . . . . . . . . . . . . . . . . . . 52,036 626,940 Amount representing executory costs . . . . . . . . . . . . . . . . . . . . (67,396) (812,000) Unearned income . . . . . . . . . . . . . . . . . . . . . . . . . . . . . . . . . . . (67,631) (814,831) Allowance for doubtful receivables . . . . . . . . . . . . . . . . . . . . . . (6,136) (73,928) Net investment in financing leases . . . . . . . . . . . . . . . . . . . . . . 867,001 10,445,795 Less current portion of net investment in financing leases, included in investments in leases and current portion of financial assets transferred to consolidated securitization entities . . . . . . . . . . . . . . . . . . . . . . . . . . . . . . . . . . . . . . . . . . 337,935 4,071,506 Long-term net investment in financing leases, included in other assets and financial assets transferred to consolidated securitization entities . . . . . . . . . . . . . . . . . . . . . . . . . . . . . . . . ¥529,066 $ 6,374,289

Hitachi, Ltd. Annual Report 2011 73
Millions of yen
Financing leases
2010
Total minimum payments to be received . . . . . . . . . . . . . . . . . . ¥642,701Unguaranteed residual values . . . . . . . . . . . . . . . . . . . . . . . . . . 66,289Amount representing executory costs . . . . . . . . . . . . . . . . . . . . (46,522) Unearned income . . . . . . . . . . . . . . . . . . . . . . . . . . . . . . . . . . . (44,877) Allowance for doubtful receivables . . . . . . . . . . . . . . . . . . . . . . (4,825) Net investment in financing leases . . . . . . . . . . . . . . . . . . . . . . 612,766Less current portion of net investment in financing leases, included in investments in leases . . . . . . . . . . . . . . . . . . . . . . 194,108
Long-term net investment in financing leases, included in other assets . . . . . . . . . . . . . . . . . . . . . . . . . . . . . . . . . . . . . . ¥418,658
The Company and certain subsidiaries lease certain buildings, manufacturing machinery and equipment used in their
operations. The amount of leased assets at cost under capital leases as of March 31, 2011 and 2010 amounted to
¥40,952 million ($493,398 thousand) and ¥39,398 million, respectively, and accumulated depreciation as of March 31,
2011 and 2010 amounted to ¥18,225 million ($219,578 thousand) and ¥19,440 million, respectively. Amortization of
assets under capital leases is included in depreciation expense.
The following table shows the future minimum lease payments of capital and non-cancelable operating leases as of
March 31, 2011:
Millions of yen Thousands of U.S. dollars
Capital leases
Operating leases
Capital leases
Operatingleases
Years ending March 31 2011 2011
2012. . . . . . . . . . . . . . . . . . . . . . . . . . . . . . . . . . . . . . . . . . . . . . . . ¥11,799 ¥18,799 $142,157 $ 226,494 2013. . . . . . . . . . . . . . . . . . . . . . . . . . . . . . . . . . . . . . . . . . . . . . . . 9,474 14,771 114,144 177,964 2014. . . . . . . . . . . . . . . . . . . . . . . . . . . . . . . . . . . . . . . . . . . . . . . . 5,769 11,710 69,506 141,084 2015. . . . . . . . . . . . . . . . . . . . . . . . . . . . . . . . . . . . . . . . . . . . . . . . 3,923 9,769 47,265 117,699 2016. . . . . . . . . . . . . . . . . . . . . . . . . . . . . . . . . . . . . . . . . . . . . . . . 2,260 7,008 27,229 84,434 Thereafter . . . . . . . . . . . . . . . . . . . . . . . . . . . . . . . . . . . . . . . . . . . . 5,747 26,817 69,241 323,096 Total minimum lease payments . . . . . . . . . . . . . . . . . . . . . . . . . . . . 38,972 ¥88,874 469,542 $1,070,771 Amount representing executory costs . . . . . . . . . . . . . . . . . . . . . . . (210) (2,530) Amount representing interest . . . . . . . . . . . . . . . . . . . . . . . . . . . . . (2,444) (29,446) Present value of net minimum lease payments . . . . . . . . . . . . . . . . 36,318 437,566 Less current portion of capital lease obligations . . . . . . . . . . . . . . . 11,082 133,518 Long-term capital lease obligations . . . . . . . . . . . . . . . . . . . . . . . . . ¥25,236 $304,048
7. SECURITIZATIONS
The Company and certain subsidiaries securitize certain financial assets, such as lease, trade and mortgage loans
receivable, and arrange other forms of asset-backed financing for the purpose of providing diversified and stable fund
raising as part of their ongoing securitization activities. Historically, they have used Hitachi-supported and third-party
Special Purpose Entities (SPEs) to execute securitization transactions funded with commercial paper and other
borrowings. These securitization transactions are similar to those used by many financial institutions.
Investors in these entities only have recourse to the assets owned by the entity and not to their general credit, unless
noted below. The Company and certain subsidiaries do not provide non-contractual support to SPEs and do not have
implicit support arrangements with any SPEs. The majority of their involvement with SPEs related to the securitization
activities are assisting in the formation and financing of an entity, providing limited credit enhancements, servicing the
assets and receiving fees for services provided.

74 Hitachi, Ltd. Annual Report 2011
A portion of these lease, trade and mortgage loans receivable is transferred to SPEs sponsored by financial institutions,
which operate those SPEs as a part of their businesses. Accordingly, the amount of assets transferred by the
Company and its subsidiaries is considerably small compared to the total assets of the SPEs sponsored by these
financial institutions that purchase a large amount of assets from entities other than the Company and its subsidiaries.
In certain transactions, investors have recourse with a scope that is considerably limited.
The transferred assets have similar risks and characteristics to the Company’s and certain subsidiaries’ receivables
recorded on the consolidated balance sheets. Accordingly, the performance, such as collections or expected credit
loss, of these transferred assets has been similar to the receivables recorded on the consolidated balance sheets for
the Company and certain subsidiaries; however, the blended performance of the pools of transferred assets reflects
the eligibility screening requirements that the Company and certain subsidiaries apply to determine which receivables
are selected for transfer. Therefore, the blended performance may differ from receivables recorded on the consolidated
balance sheets.
Most of the transactions transferring lease and mortgage loans receivable utilize securitization trusts. In those
transactions, certain subsidiaries initially transfer the receivables to trusts that had satisfied the conditions of Qualifying
SPEs (QSPEs), which under guidance in effect through March 31, 2010 were excluded from the scope of consolidation
provisions, and receive the beneficial interests in trusts originated from the transferred assets. Subsequently, the
subsidiaries transfer the interests to and receive cash as consideration from SPEs that are not former QSPEs, as a part
of securitization arrangements.
The remaining financial assets, consisting mainly of trade receivables, were transferred to former QSPEs established by
certain of the Company’s subsidiaries in the Cayman Islands. In those transactions, the Company and certain
subsidiaries received cash as consideration from the former QSPEs that were funded through the issuance of asset-
backed securities or other borrowings from investors that were secured by the transferred assets. The Company and
certain subsidiaries retained subordinated interests in the transferred assets relating to these transactions, or otherwise
investors had recourse with considerably limited scope. Furthermore, the Company and certain subsidiaries retained
servicing responsibility, and certain of the Company’s subsidiaries provided credit facilities to the former QSPEs in
accordance with the service agency business contracts from which temporary payments on behalf of the former
QSPEs were made. As of March 31, 2010, the Company and its subsidiaries had three QSPEs with outstanding
balances of transferred receivables and the total amount of their assets was ¥117,159 million. Since the Company and
its subsidiaries terminated the transactions with the former QSPEs by March 31, 2011, there are no outstanding
balances of transferred receivables to the former QSPEs as of March 31, 2011. The Company and its subsidiaries did
not hold any of the voting shares issued by those former QSPEs, and none of the directors of those former QSPEs
were executives or employees of the Company or its subsidiaries. Additionally, the former QSPEs also purchased
receivables from third-party customers.
In accordance with the new consolidation provisions effective April 1, 2010, the Company and certain subsidiaries are
deemed to have a controlling financial interest and are the primary beneficiary of an SPE if it has both the power to
direct the activities of the SPE that most significantly impact the SPE’s economic performance and the obligation to
absorb losses or the right to receive benefits that could potentially be significant to the SPE. As a result of adoption of
these provisions, the Company consolidated former QSPEs that were unconsolidated prior to April 1, 2010 using the
carrying amounts of the SPEs’ assets and liabilities as of April 1, 2010.
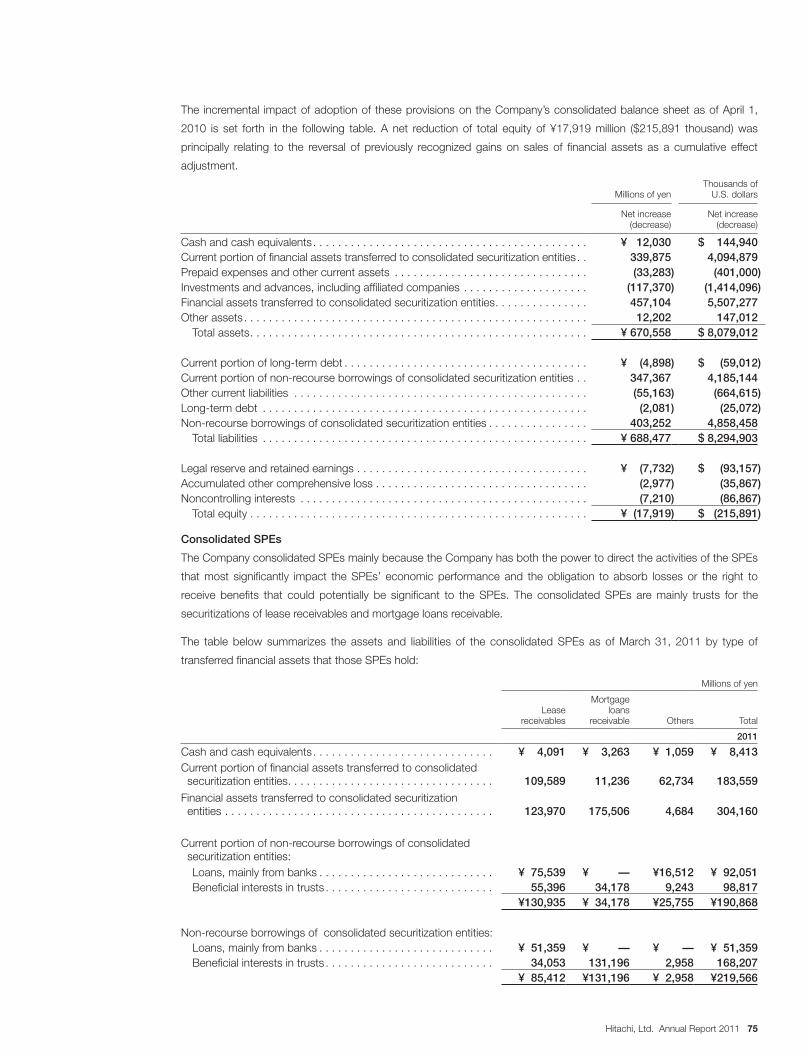
Hitachi, Ltd. Annual Report 2011 75
The incremental impact of adoption of these provisions on the Company’s consolidated balance sheet as of April 1,
2010 is set forth in the following table. A net reduction of total equity of ¥17,919 million ($215,891 thousand) was
principally relating to the reversal of previously recognized gains on sales of financial assets as a cumulative effect
adjustment.
Millions of yenThousands of
U.S. dollars
Net increase (decrease)
Net increase (decrease)
Cash and cash equivalents . . . . . . . . . . . . . . . . . . . . . . . . . . . . . . . . . . . . . . . . . . . . ¥ 12,030 $ 144,940 Current portion of financial assets transferred to consolidated securitization entities . . 339,875 4,094,879 Prepaid expenses and other current assets . . . . . . . . . . . . . . . . . . . . . . . . . . . . . . . (33,283) (401,000)Investments and advances, including affiliated companies . . . . . . . . . . . . . . . . . . . . (117,370) (1,414,096)Financial assets transferred to consolidated securitization entities . . . . . . . . . . . . . . . 457,104 5,507,277 Other assets . . . . . . . . . . . . . . . . . . . . . . . . . . . . . . . . . . . . . . . . . . . . . . . . . . . . . . . 12,202 147,012 Total assets . . . . . . . . . . . . . . . . . . . . . . . . . . . . . . . . . . . . . . . . . . . . . . . . . . . . . . ¥ 670,558 $ 8,079,012
Current portion of long-term debt . . . . . . . . . . . . . . . . . . . . . . . . . . . . . . . . . . . . . . . ¥ (4,898) $ (59,012)Current portion of non-recourse borrowings of consolidated securitization entities . . 347,367 4,185,144 Other current liabilities . . . . . . . . . . . . . . . . . . . . . . . . . . . . . . . . . . . . . . . . . . . . . . . (55,163) (664,615)Long-term debt . . . . . . . . . . . . . . . . . . . . . . . . . . . . . . . . . . . . . . . . . . . . . . . . . . . . (2,081) (25,072)Non-recourse borrowings of consolidated securitization entities . . . . . . . . . . . . . . . . 403,252 4,858,458 Total liabilities . . . . . . . . . . . . . . . . . . . . . . . . . . . . . . . . . . . . . . . . . . . . . . . . . . . . ¥ 688,477 $ 8,294,903
Legal reserve and retained earnings . . . . . . . . . . . . . . . . . . . . . . . . . . . . . . . . . . . . . ¥ (7,732) $ (93,157)Accumulated other comprehensive loss . . . . . . . . . . . . . . . . . . . . . . . . . . . . . . . . . . (2,977) (35,867)Noncontrolling interests . . . . . . . . . . . . . . . . . . . . . . . . . . . . . . . . . . . . . . . . . . . . . . (7,210) (86,867) Total equity . . . . . . . . . . . . . . . . . . . . . . . . . . . . . . . . . . . . . . . . . . . . . . . . . . . . . . ¥ (17,919) $ (215,891)
Consolidated SPEs
The Company consolidated SPEs mainly because the Company has both the power to direct the activities of the SPEs
that most significantly impact the SPEs’ economic performance and the obligation to absorb losses or the right to
receive benefits that could potentially be significant to the SPEs. The consolidated SPEs are mainly trusts for the
securitizations of lease receivables and mortgage loans receivable.
The table below summarizes the assets and liabilities of the consolidated SPEs as of March 31, 2011 by type of
transferred financial assets that those SPEs hold:
Millions of yen
Leasereceivables
Mortgageloans
receivable Others Total
2011
Cash and cash equivalents . . . . . . . . . . . . . . . . . . . . . . . . . . . . . ¥ 4,091 ¥ 3,263 ¥ 1,059 ¥ 8,413Current portion of financial assets transferred to consolidated securitization entities . . . . . . . . . . . . . . . . . . . . . . . . . . . . . . . . . 109,589 11,236 62,734 183,559
Financial assets transferred to consolidated securitization entities . . . . . . . . . . . . . . . . . . . . . . . . . . . . . . . . . . . . . . . . . . . 123,970 175,506 4,684 304,160
Current portion of non-recourse borrowings of consolidated securitization entities: Loans, mainly from banks . . . . . . . . . . . . . . . . . . . . . . . . . . . . ¥ 75,539 ¥ — ¥16,512 ¥ 92,051 Beneficial interests in trusts . . . . . . . . . . . . . . . . . . . . . . . . . . . 55,396 34,178 9,243 98,817
¥130,935 ¥ 34,178 ¥25,755 ¥190,868
Non-recourse borrowings of consolidated securitization entities: Loans, mainly from banks . . . . . . . . . . . . . . . . . . . . . . . . . . . . ¥ 51,359 ¥ — ¥ — ¥ 51,359 Beneficial interests in trusts . . . . . . . . . . . . . . . . . . . . . . . . . . . 34,053 131,196 2,958 168,207
¥ 85,412 ¥131,196 ¥ 2,958 ¥219,566

76 Hitachi, Ltd. Annual Report 2011
Thousands of U.S. dollars
Leasereceivables
Mortgageloans
receivable Others Total
2011
Cash and cash equivalents . . . . . . . . . . . . . . . . . . . . . . . . . . . . . $ 49,289 $ 39,313 $ 12,759 $ 101,361Current portion of financial assets transferred to consolidated securitization entities . . . . . . . . . . . . . . . . . . . . . . . . . . . . . . . . . 1,320,349 135,374 755,831 2,211,554
Financial assets transferred to consolidated securitization entities . . . . . . . . . . . . . . . . . . . . . . . . . . . . . . . . . . . . . . . . . . . 1,493,614 2,114,530 56,434 3,664,578
Current portion of non-recourse borrowings of consolidated securitization entities: Loans, mainly from banks . . . . . . . . . . . . . . . . . . . . . . . . . . . . $ 910,108 $ — $198,940 $1,109,048 Beneficial interests in trusts . . . . . . . . . . . . . . . . . . . . . . . . . . . 667,422 411,783 111,361 1,190,566
$1,577,530 $ 411,783 $310,301 $2,299,614
Non-recourse borrowings of consolidated securitization entities: Loans, mainly from banks . . . . . . . . . . . . . . . . . . . . . . . . . . . . $ 618,783 $ — $ — $ 618,783 Beneficial interests in trusts . . . . . . . . . . . . . . . . . . . . . . . . . . . 410,277 1,580,675 35,638 2,026,590
$1,029,060 $1,580,675 $ 35,638 $2,645,373
The aggregate annual maturities of non-recourse borrowings of consolidated securitization entities after March 31,
2012 are as follows:
Years ending March 31 Millions of yenThousands of
U.S. dollars
2013. . . . . . . . . . . . . . . . . . . . . . . . . . . . . . . . . . . . . . . . . . . . . . . . . . . . . . . . . . . . ¥ 96,379 $1,161,1932014. . . . . . . . . . . . . . . . . . . . . . . . . . . . . . . . . . . . . . . . . . . . . . . . . . . . . . . . . . . . 22,753 274,1322015. . . . . . . . . . . . . . . . . . . . . . . . . . . . . . . . . . . . . . . . . . . . . . . . . . . . . . . . . . . . 14,724 177,3982016. . . . . . . . . . . . . . . . . . . . . . . . . . . . . . . . . . . . . . . . . . . . . . . . . . . . . . . . . . . . 12,213 147,144Thereafter . . . . . . . . . . . . . . . . . . . . . . . . . . . . . . . . . . . . . . . . . . . . . . . . . . . . . . . . 73,497 885,506
¥219,566 $2,645,373
The assets and liabilities of the consolidated SPEs on the table above exclude intercompany balances that are
eliminated in consolidation. Substantially, all of the assets of the consolidated SPEs can only be used to settle
obligations of those SPEs.
Transfers to unconsolidated entities
The following information is related to financial assets transferred to unconsolidated entities and accounted for as
sales. Those financial assets are transferred mainly to SPEs sponsored by financial institutions.
Securitizations of lease receivables:
Hitachi Capital Corporation and certain other financing subsidiaries sold lease receivables to unconsolidated SPEs and
other entities. Net gains recognized on the sale of these lease receivables for the years ended March 31, 2011, 2010
and 2009 were ¥8,500 million ($102,410 thousand), ¥10,017 million and ¥13,975 million, respectively. The subsidiaries
retained servicing responsibilities, but did not record a servicing asset or liability because the cost to service the
receivables approximated the servicing income.

Hitachi, Ltd. Annual Report 2011 77
The table below summarizes cash flows received from and paid to the SPEs and other entities during the years ended
March 31, 2011, 2010 and 2009:
Millions of yenThousands of
U.S. dollars
2011 2010 2009 2011
Proceeds from transfer of lease receivables . . ¥120,197 ¥167,483 ¥254,211 $1,448,157Servicing fees received . . . . . . . . . . . . . . . . . . — 72 78 —Purchases of delinquent or ineligible assets . . — (60,983) (46,760) —
The amount of initial fair value of subordinated interests for the year ended March 31, 2011 was ¥18,403 million
($221,723 thousand). The subordinated interests relating to securitizations of lease receivables are initially classified as
Level 3 assets within the fair value hierarchy. The initial fair value of the subordinated interests is determined based on
economic assumptions including weighted-average life, expected credit risks, and discount rates.
Key economic assumptions used in measuring the initial fair value of the subordinated interests resulting from
securitizations of lease receivables completed during the year ended March 31, 2011 are as follows:
2011
Weighted average life (in years) . . . . . . . . . . . . . . . . . . . . . . . . . . . . . . . . . . . . . . . . . . . . . . . . . . . . . . 4.2Expected credit loss . . . . . . . . . . . . . . . . . . . . . . . . . . . . . . . . . . . . . . . . . . . . . . . . . . . . . . . . . . . . . . 0.03–0.05%Discount rate . . . . . . . . . . . . . . . . . . . . . . . . . . . . . . . . . . . . . . . . . . . . . . . . . . . . . . . . . . . . . . . . . . . 0.38–0.80%
Quantitative information about delinquencies, net credit losses, and components of lease receivables subject to
transfer and other assets managed together as of and for the years ended March 31, 2011 and 2010 is as follows:
Millions of yen Thousands of U.S. dollars
Total principal amount of
receivables
Principal amount of
receivables 90 days or more
past dueNet credit
loss
Total principal amount of
receivables
Principal amount of
receivables 90 days or more
past dueNet credit
loss
2011 2011
Total assets managed or transferred: Lease receivables . . . . . . . . . . . . . ¥1,025,462 ¥140 ¥1,128 $12,354,964 $1,687 $13,590 Assets transferred . . . . . . . . . . . . . (158,461) (1,909,169) Assets held in portfolio . . . . . . . . . . . ¥ 867,001 $10,445,795
Millions of yen
Total principal amount of
receivables
Principal amount of
receivables 90 days or more
past dueNet credit
loss
2010
Total assets managed or transferred: Lease receivables . . . . . . . . . . . . . ¥1,103,804 ¥243 ¥1,943 Assets transferred . . . . . . . . . . . . . (491,038) Assets held in portfolio . . . . . . . . . . . ¥ 612,766
As of March 31, 2011, the amount of the maximum exposure to loss was ¥32,194 million ($387,880 thousand). It
mainly consists of the subordinated interests and the obligations to purchase assets with a scope that is considerably
limited relating to these securitizations of lease receivables. As of March 31, 2011 and 2010, the amounts of the
subordinated interests measured at fair value relating to these securitizations of lease receivables were ¥18,941 million
($228,205 thousand) and ¥77,756 million, respectively.

78 Hitachi, Ltd. Annual Report 2011
Key economic assumptions used in measuring the fair value of the subordinated interests relating to securitizations of
lease receivables as of March 31, 2011 and 2010 are as follows:
2011 2010
Weighted average life (in years) . . . . . . . . . . . . . . . . . . . . . . . . . . . . . . . . . . . . . . 3.5 2.9Expected credit loss . . . . . . . . . . . . . . . . . . . . . . . . . . . . . . . . . . . . . . . . . . . . . . 0.03% 0.01–0.05%Discount rate . . . . . . . . . . . . . . . . . . . . . . . . . . . . . . . . . . . . . . . . . . . . . . . . . . . 0.70–0.80% 0.31–0.69%
The sensitivity of the current fair value of the Company’s interests to an immediate 10 and 20 percent adverse change
in the assumptions as of March 31, 2011 and 2010 is as follows:
Millions of yenThousands of
U.S. dollars
2011 2010 2011
Expected credit loss: Impact on fair value of 10% adverse change . . . . . . . . ¥ (60) ¥(282) $ (723) Impact on fair value of 20% adverse change . . . . . . . . (121) (563) (1,458)Discount rate: Impact on fair value of 10% adverse change . . . . . . . . (47) (103) (566) Impact on fair value of 20% adverse change . . . . . . . . (94) (204) (1,133)
These securitizations were designed to transfer the lease receivables through trusts that satisfied the conditions of
former QSPEs. These trusts were not consolidated for the year ended March 31, 2010. Since almost all of those trusts
were consolidated upon the adoption of the new consolidation provisions, the lease receivables transferred to the
consolidated trusts were recognized on the Company’s consolidated balance sheet and classified as financial assets
transferred to consolidated securitization entities on April 1, 2010.
Securitizations of trade receivables excluding mortgage loans receivable:
The Company and certain subsidiaries sold trade receivables excluding mortgage loans receivable mainly to
unconsolidated SPEs and other entities. During the years ended March 31, 2011, 2010 and 2009, proceeds from the
transfer of trade receivables excluding mortgage loans receivable were ¥521,335 million ($6,281,145 thousand),
¥737,820 million and ¥884,953 million, respectively, and net gains and losses recognized on those transfers were a net
gain of ¥140 million ($1,687 thousand) and net losses of ¥1,853 million and ¥4,245 million, respectively. The Company
and certain subsidiaries retained servicing responsibilities, but did not record a servicing asset or liability because the
cost to service the receivables approximated the servicing income.
Quantitative information about delinquencies, net credit loss, and components of trade receivables excluding mortgage
loans receivable subject to transfer and other assets managed together as of and for the years ended March 31, 2011
and 2010 is as follows:
Millions of yen Thousands of U.S. dollars
Total principal amount of
receivables
Principal amount of
receivables 90 days or more
past dueNet credit
loss
Total principal amount of
receivables
Principal amount of
receivables 90 days or more
past dueNet credit
loss
2011 2011
Total assets managed or transferred: Trade receivables excluding mortgage loans receivable . . . . . ¥ 733,090 ¥2,698 ¥1,025 $ 8,832,410 $32,506 $12,349 Assets transferred . . . . . . . . . . . . . (232,374) (2,799,687) Assets held in portfolio . . . . . . . . . . . ¥ 500,716 $ 6,032,723

Hitachi, Ltd. Annual Report 2011 79
Millions of yen
Total principal amount of
receivables
Principal amount of
receivables 90 days or more
past dueNet credit
loss
2010
Total assets managed or transferred: Trade receivables excluding mortgage loans receivable . . . . . ¥ 979,148 ¥5,414 ¥2,809 Assets transferred . . . . . . . . . . . . . (279,245) Assets held in portfolio . . . . . . . . . . . ¥ 699,903
As of March 31, 2011, the amount of the maximum exposure to loss was ¥36,067 million ($434,542 thousand). It
mainly consists of the subordinated interests and obligations to purchase assets with a scope that is considerably
limited relating to these securitizations of trade receivables excluding mortgage loans receivable. As of March 31, 2011
and 2010, the amounts of the subordinated interests relating to these securitizations of trade receivables excluding
mortgage loans receivable were ¥16,337 million ($196,831 thousand) and ¥45,249 million, respectively.
A portion of these trade receivables excluding mortgage loans receivable was transferred to former QSPEs, which
were established by certain of the Company’s subsidiaries, through March 31, 2011. During the year ended March 31,
2011, proceeds from the transfer of trade receivables excluding mortgage loans receivable to the former QSPEs and
net losses recognized on those transfers were immaterial and there is no outstanding balance of transferred
receivables in these former QSPEs as of March 31, 2011. During the years ended March 31, 2010 and 2009,
proceeds from the transfer of trade receivables excluding mortgage loans receivable to the former QSPEs were
¥362,147 million and ¥490,647 million, respectively, and net losses recognized on those transfers were ¥616 million
and ¥993 million, respectively. As of March 31, 2010, the outstanding balance of transferred receivables in these
former QSPEs was ¥75,654 million.
Securitizations of mortgage loans receivable:
Hitachi Capital Corporation sold mortgage loans receivable to unconsolidated SPEs. For the years ended March 31,
2010 and 2009, no proceeds from the transfer of mortgage loans receivable were recorded. The subsidiary retained
servicing responsibilities but did not record a servicing asset or liability because the cost to service the receivables
approximated the servicing income.
Quantitative information about delinquencies, net credit loss, and components of mortgage loans receivable subject to
transfer and other assets managed together as of and for the year ended March 31, 2010 is as follows:
Millions of yen
Total principal amount of
receivables
Principal amount of
receivables 90 days or more
past dueNet credit
loss
2010
Total assets managed or transferred: Mortgage loans receivable . . . . . . ¥ 224,449 ¥— ¥12 Assets transferred . . . . . . . . . . . . . (210,834) Assets held in portfolio . . . . . . . . . . . ¥ 13,615
As of March 31, 2010, the amount of the subordinated interests measured at fair value relating to securitizations of
mortgage loans receivable was ¥37,661 million.

80 Hitachi, Ltd. Annual Report 2011
These securitizations were designed to transfer the mortgage loans receivable through trusts that satisfied the
conditions of former QSPEs. These trusts were not consolidated for the year ended March 31, 2010. Since all of the
trusts were consolidated upon the adoption of the new consolidation provisions, the mortgage loans receivable
transferred to the consolidated trusts was recognized on the Company’s consolidated balance sheet and classified as
financial assets transferred to consolidated securitization entities on April 1, 2010.
Key economic assumptions used in measuring the fair value of the subordinated interests relating to securitizations of
mortgage loans receivable as of March 31, 2010 are as follows:
2010
Weighted average life (in years) . . . . . . . . . . . . . . . . . . . . . . . . . . . . . . . . . . . . . . . . . . . . . . . . . . . . 10.4Expected credit loss . . . . . . . . . . . . . . . . . . . . . . . . . . . . . . . . . . . . . . . . . . . . . . . . . . . . . . . . . . . . 0.02%Discount rate . . . . . . . . . . . . . . . . . . . . . . . . . . . . . . . . . . . . . . . . . . . . . . . . . . . . . . . . . . . . . . . . . 1.89–3.41%Prepayment rate . . . . . . . . . . . . . . . . . . . . . . . . . . . . . . . . . . . . . . . . . . . . . . . . . . . . . . . . . . . . . . . 0.33%
The sensitivity of the current fair value of the subordinated interests to an immediate 10 and 20 percent adverse
change in the assumptions as of March 31, 2010 is as follows:
Millions of yen
2010
Expected credit loss: Impact on fair value of 10% adverse change . . . . . . . . . . . . . . . . . . . . . . . . . . . . . . . . . . . . . . . . ¥ (162) Impact on fair value of 20% adverse change . . . . . . . . . . . . . . . . . . . . . . . . . . . . . . . . . . . . . . . . (323)Discount rate: Impact on fair value of 10% adverse change . . . . . . . . . . . . . . . . . . . . . . . . . . . . . . . . . . . . . . . . (940) Impact on fair value of 20% adverse change . . . . . . . . . . . . . . . . . . . . . . . . . . . . . . . . . . . . . . . . (1,847)Prepayment rate: Impact on fair value of 10% adverse change . . . . . . . . . . . . . . . . . . . . . . . . . . . . . . . . . . . . . . . . (318) Impact on fair value of 20% adverse change . . . . . . . . . . . . . . . . . . . . . . . . . . . . . . . . . . . . . . . . (625)
The sensitivities presented in this note are hypothetical and should be used with caution. As the figures indicate,
changes in fair value based on a 10 percent variation in assumptions generally cannot be extrapolated because the
relationship of the change in assumption to the change in fair value may not be linear. Also, in the above tables, the
effect of a variation in a particular assumption of the fair value of the interest is calculated without changing any other
assumption; in reality, changes in one factor may result in changes in another, which might magnify or counteract the
sensitivities.
8. GOODWILL AND OTHER INTANGIBLE ASSETS
Intangible assets other than goodwill acquired during the years ended March 31, 2011, 2010 and 2009 amounted to
¥143,156 million ($1,724,771 thousand), ¥177,585 million and ¥168,911 million, respectively, and related amortization
expense during the years ended March 31, 2011, 2010 and 2009 amounted to ¥115,037 million ($1,385,988
thousand), ¥116,065 million and ¥178,164 million, respectively.
The main component of intangible assets subject to amortization was capitalized software. Amortization of capitalized
costs for software to be sold, leased or otherwise marketed is charged to cost of sales. The amounts charged during
the years ended March 31, 2011, 2010 and 2009 were ¥38,899 million ($468,663 thousand), ¥40,128 million and
¥85,841 million, respectively.

Hitachi, Ltd. Annual Report 2011 81
Intangible assets other than goodwill as of March 31, 2011 and 2010 are as follows:
Millions of yen
Gross carrying amount
Accumulated amortization
Net carrying amount
Gross carrying amount
Accumulated amortization
Net carrying amount
2011 2010
Amortized intangible assets: Software . . . . . . . . . . . . . . . . . ¥ 727,016 ¥ 612,361 ¥114,655 ¥ 691,856 ¥ 580,138 ¥111,718 Software for internal use . . . . . 512,515 377,550 134,965 473,621 343,733 129,888 Patents . . . . . . . . . . . . . . . . . . 100,080 84,459 15,621 106,815 87,526 19,289 Other . . . . . . . . . . . . . . . . . . . 181,362 106,422 74,940 173,823 99,952 73,871
¥1,520,973 ¥1,180,792 ¥340,181 ¥1,446,115 ¥1,111,349 ¥334,766Indefinite-lived intangible assets . . . . . . . . . . . . . . . . . . . . ¥ 16,337 ¥ — ¥ 16,337 ¥ 17,698 ¥ — ¥ 17,698
Thousands of U.S. dollars
Gross carrying amount
Accumulated amortization
Net carrying amount
2011
Amortized intangible assets: Software . . . . . . . . . . . . . . . . . $ 8,759,229 $ 7,377,844 $1,381,385 Software for internal use . . . . . 6,174,879 4,548,795 1,626,084 Patents . . . . . . . . . . . . . . . . . . 1,205,783 1,017,578 188,205 Other . . . . . . . . . . . . . . . . . . . 2,185,085 1,282,193 902,892
$18,324,976 $14,226,410 $4,098,566 Indefinite-lived intangible assets . . . . . . . . . . . . . . . . . . . . $ 196,831 $ — $ 196,831
The following table shows the estimated aggregate amortization expense of intangible assets for the next five years.
Years ending March 31 Millions of yenThousands of
U.S. dollars
2012. . . . . . . . . . . . . . . . . . . . . . . . . . . . . . . . . . . . . . . . . . . . . . . . . . . . . . . . . ¥82,896 $998,7472013. . . . . . . . . . . . . . . . . . . . . . . . . . . . . . . . . . . . . . . . . . . . . . . . . . . . . . . . . 64,009 771,1932014. . . . . . . . . . . . . . . . . . . . . . . . . . . . . . . . . . . . . . . . . . . . . . . . . . . . . . . . . 45,010 542,2892015. . . . . . . . . . . . . . . . . . . . . . . . . . . . . . . . . . . . . . . . . . . . . . . . . . . . . . . . . 24,852 299,4222016. . . . . . . . . . . . . . . . . . . . . . . . . . . . . . . . . . . . . . . . . . . . . . . . . . . . . . . . . 13,427 161,771
The changes in the carrying amount of goodwill by reportable segment for the years ended March 31, 2011 and 2010
are as follows:
Millions of yen
Information & Tele-
communica-tion Systems
Construction Machinery
High Functional
Materials & Components
Components& Devices
Other ReportableSegments Total
2011
Balance at beginning of year . . . . . . . ¥37,443 ¥37,967 ¥56,675 ¥10,294 ¥23,207 ¥165,586 Acquisition . . . . . . . . . . . . . . . . . . 9,211 — 1,849 — 9,931 20,991 Impairment loss . . . . . . . . . . . . . . — — — — (4,833) (4,833) Translation adjustment and other . . (4,236) (3,820) (4) (1,195) (989) (10,244)Balance at end of year . . . . . . . . . . . ¥42,418 ¥34,147 ¥58,520 ¥ 9,099 ¥27,316 ¥171,500

82 Hitachi, Ltd. Annual Report 2011
Thousands of U.S. dollars
Information & Tele-
communica-tion Systems
Construction Machinery
High Functional
Materials & Components
Components& Devices
Other ReportableSegments Total
2011
Balance at beginning of year . . . . . . . $451,121 $457,434 $682,831 $124,024 $279,602 $1,995,012 Acquisition . . . . . . . . . . . . . . . . . . 110,976 — 22,277 — 119,651 252,904 Impairment loss . . . . . . . . . . . . . . — — — — (58,229) (58,229) Translation adjustment and other . . (51,037) (46,024) (48) (14,397) (11,916) (123,422)Balance at end of year . . . . . . . . . . . $511,060 $411,410 $705,060 $109,627 $329,108 $2,066,265
Millions of yen
Information & Tele-
communica-tion Systems
Construction Machinery
High Functional
Materials & Components
Components& Devices
Other ReportableSegments Total
2010
Balance at beginning of year . . . . . . . ¥35,708 ¥ 4,987 ¥56,675 ¥ 9,995 ¥27,065 ¥134,430 Acquisition . . . . . . . . . . . . . . . . . . 2,938 32,981 — 182 6,210 42,311 Impairment loss . . . . . . . . . . . . . . — — — — (7,285) (7,285) Translation adjustment and other . . (1,203) (1) — 117 (2,783) (3,870)Balance at end of year . . . . . . . . . . . ¥37,443 ¥37,967 ¥56,675 ¥10,294 ¥23,207 ¥165,586
The Company does not have any accumulated impairment losses related to the goodwill balances as of March 31,
2011 and 2010 as the Company considers goodwill that has been fully impaired to be written-off.
The main component of goodwill acquired during the year ended March 31, 2010 was related to the additional
acquisition of the ownership interests in a former affiliated company, Telco Construction Equipment Co., Ltd. to make it
a subsidiary.
9. INCOME TAXES
Components of income (loss) before income taxes and income taxes attributable to continuing operations are as follows:
Millions of yen
Domestic Foreign Total
2011
Income before income taxes . . . . . . . . . . . . . . . . . . . . . . . . ¥270,001 ¥162,200 ¥432,201Income taxes: Current tax expense . . . . . . . . . . . . . . . . . . . . . . . . . . . . 75,979 49,144 125,123 Deferred tax expense (benefit) . . . . . . . . . . . . . . . . . . . . . 14,511 (10,559) 3,952
¥ 90,490 ¥ 38,585 ¥129,075
Thousands of U.S. dollars
Domestic Foreign Total
2011
Income before income taxes . . . . . . . . . . . . . . . . . . . . . . . . $3,253,024 $1,954,217 $5,207,241 Income taxes: Current tax expense . . . . . . . . . . . . . . . . . . . . . . . . . . . . 915,410 592,096 1,507,506 Deferred tax expense (benefit) . . . . . . . . . . . . . . . . . . . . . 174,831 (127,217) 47,614
$1,090,241 $ 464,879 $1,555,120

Hitachi, Ltd. Annual Report 2011 83
Millions of yen
Domestic Foreign Total
2010
Income (loss) before income taxes . . . . . . . . . . . . . . . . . . . ¥ (16,083) ¥79,663 ¥ 63,580Income taxes: Current tax expense . . . . . . . . . . . . . . . . . . . . . . . . . . . . 60,428 27,103 87,531 Deferred tax expense (benefit) . . . . . . . . . . . . . . . . . . . . . 63,493 (3,053) 60,440
¥123,921 ¥24,050 ¥147,971
Millions of yen
Domestic Foreign Total
2009
Income (loss) before income taxes . . . . . . . . . . . . . . . . . . . ¥(315,032) ¥25,161 ¥(289,871)Income taxes: Current tax expense . . . . . . . . . . . . . . . . . . . . . . . . . . . . 75,612 25,669 101,281 Deferred tax expense . . . . . . . . . . . . . . . . . . . . . . . . . . . 401,928 2,040 403,968
¥ 477,540 ¥27,709 ¥505,249
Significant components of income tax expense (benefit) attributable to continuing operations and other comprehensive
income (loss), net of reclassification adjustments, for the years ended March 31, 2011, 2010 and 2009 are as follows:
Millions of yenThousands of
U.S. dollars
2011 2010 2009 2011
Continuing operations:Current tax expense . . . . . . . . . . . . . . . . . . . . . . . ¥125,123 ¥87,531 ¥ 101,281 $1,507,506 Deferred tax expense (benefit) (exclusive of the effects of other components listed below) . . . . . (4,653) (19,350) (187,751) (56,060)Change in valuation allowance . . . . . . . . . . . . . . . 8,605 79,790 591,719 103,674
129,075 147,971 505,249 1,555,120 Other comprehensive income (loss), net of reclassification adjustments:Pension liability adjustments . . . . . . . . . . . . . . . . . 16,119 25,738 (53,171) 194,205 Net unrealized holding gain on available-for-sale securities . . . . . . . . . . . . . . . . (4,740) 11,692 (14,915) (57,108)Cash flow hedges . . . . . . . . . . . . . . . . . . . . . . . . . 647 720 (2,323) 7,795
12,026 38,150 (70,409) 144,892 ¥141,101 ¥186,121 ¥ 434,840 $1,700,012
The Company and its domestic subsidiaries are subject to a national corporate tax of 30%, an inhabitant tax of
between 17.3% and 20.7% of the national corporate tax and a combined deductible business tax and special local
corporation tax between 3.8% and 10.1%, which in the aggregate resulted in a combined statutory income tax rate of
approximately 40.6% for the years ended March 31, 2011 and 2010.
The Company and its domestic subsidiaries were subject to a national corporate tax of 30%, an inhabitant tax of
between 17.3% and 20.7% of the national corporate tax and a deductible business tax between 3.8% and 10.1%,
which in the aggregate resulted in a combined statutory income tax rate of approximately 40.6% for the year ended
March 31, 2009.
The Company and certain subsidiaries have adopted the consolidated taxation systems. Under the consolidated
taxation system in Japan, the Company and certain Japanese subsidiaries consolidated, for Japanese tax purpose, all
wholly owned domestic subsidiaries.
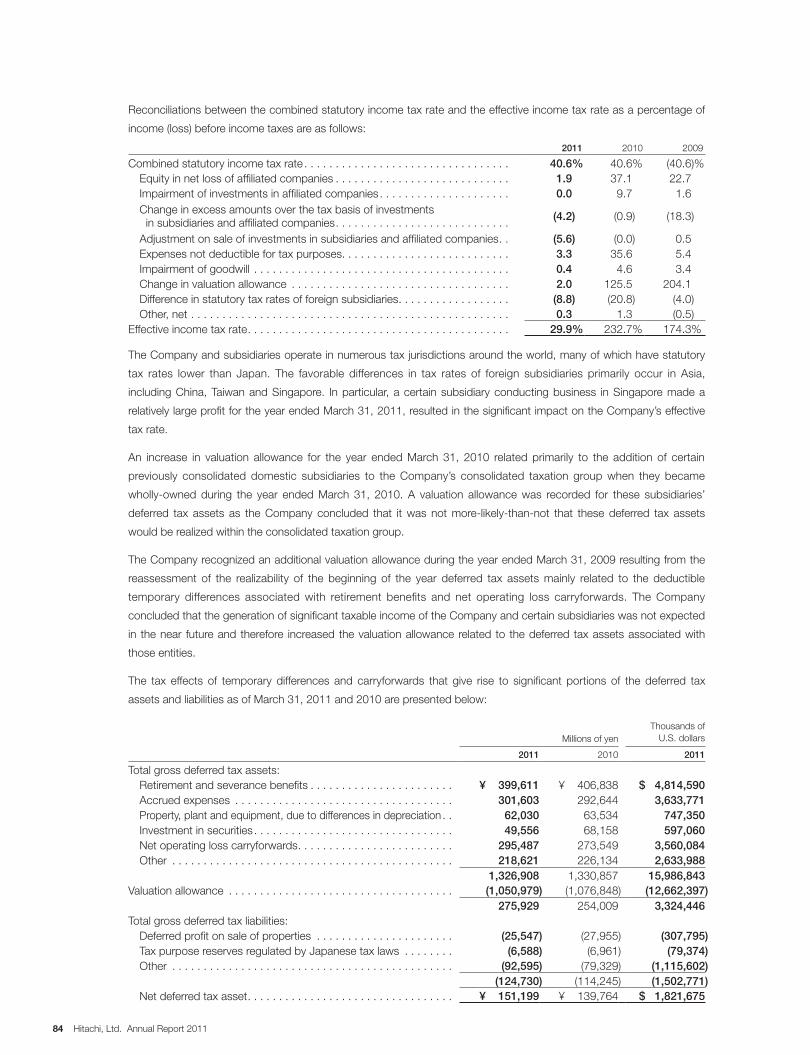
84 Hitachi, Ltd. Annual Report 2011
Reconciliations between the combined statutory income tax rate and the effective income tax rate as a percentage of
income (loss) before income taxes are as follows:
2011 2010 2009
Combined statutory income tax rate . . . . . . . . . . . . . . . . . . . . . . . . . . . . . . . . . 40.6% 40.6% (40.6)% Equity in net loss of affiliated companies . . . . . . . . . . . . . . . . . . . . . . . . . . . . 1.9 37.1 22.7 Impairment of investments in affiliated companies . . . . . . . . . . . . . . . . . . . . . 0.0 9.7 1.6 Change in excess amounts over the tax basis of investments in subsidiaries and affiliated companies . . . . . . . . . . . . . . . . . . . . . . . . . . . . (4.2) (0.9) (18.3)
Adjustment on sale of investments in subsidiaries and affiliated companies . . (5.6) (0.0) 0.5 Expenses not deductible for tax purposes. . . . . . . . . . . . . . . . . . . . . . . . . . . 3.3 35.6 5.4 Impairment of goodwill . . . . . . . . . . . . . . . . . . . . . . . . . . . . . . . . . . . . . . . . . 0.4 4.6 3.4 Change in valuation allowance . . . . . . . . . . . . . . . . . . . . . . . . . . . . . . . . . . . 2.0 125.5 204.1 Difference in statutory tax rates of foreign subsidiaries . . . . . . . . . . . . . . . . . . (8.8) (20.8) (4.0) Other, net . . . . . . . . . . . . . . . . . . . . . . . . . . . . . . . . . . . . . . . . . . . . . . . . . . . 0.3 1.3 (0.5)Effective income tax rate . . . . . . . . . . . . . . . . . . . . . . . . . . . . . . . . . . . . . . . . . . 29.9% 232.7% 174.3%
The Company and subsidiaries operate in numerous tax jurisdictions around the world, many of which have statutory
tax rates lower than Japan. The favorable differences in tax rates of foreign subsidiaries primarily occur in Asia,
including China, Taiwan and Singapore. In particular, a certain subsidiary conducting business in Singapore made a
relatively large profit for the year ended March 31, 2011, resulted in the significant impact on the Company’s effective
tax rate.
An increase in valuation allowance for the year ended March 31, 2010 related primarily to the addition of certain
previously consolidated domestic subsidiaries to the Company’s consolidated taxation group when they became
wholly-owned during the year ended March 31, 2010. A valuation allowance was recorded for these subsidiaries’
deferred tax assets as the Company concluded that it was not more-likely-than-not that these deferred tax assets
would be realized within the consolidated taxation group.
The Company recognized an additional valuation allowance during the year ended March 31, 2009 resulting from the
reassessment of the realizability of the beginning of the year deferred tax assets mainly related to the deductible
temporary differences associated with retirement benefits and net operating loss carryforwards. The Company
concluded that the generation of significant taxable income of the Company and certain subsidiaries was not expected
in the near future and therefore increased the valuation allowance related to the deferred tax assets associated with
those entities.
The tax effects of temporary differences and carryforwards that give rise to significant portions of the deferred tax
assets and liabilities as of March 31, 2011 and 2010 are presented below:
Millions of yenThousands of
U.S. dollars
2011 2010 2011
Total gross deferred tax assets: Retirement and severance benefits . . . . . . . . . . . . . . . . . . . . . . . ¥ 399,611 ¥ 406,838 $ 4,814,590 Accrued expenses . . . . . . . . . . . . . . . . . . . . . . . . . . . . . . . . . . . 301,603 292,644 3,633,771 Property, plant and equipment, due to differences in depreciation . . 62,030 63,534 747,350 Investment in securities . . . . . . . . . . . . . . . . . . . . . . . . . . . . . . . . 49,556 68,158 597,060 Net operating loss carryforwards . . . . . . . . . . . . . . . . . . . . . . . . . 295,487 273,549 3,560,084 Other . . . . . . . . . . . . . . . . . . . . . . . . . . . . . . . . . . . . . . . . . . . . . 218,621 226,134 2,633,988
1,326,908 1,330,857 15,986,843 Valuation allowance . . . . . . . . . . . . . . . . . . . . . . . . . . . . . . . . . . . . (1,050,979) (1,076,848) (12,662,397)
275,929 254,009 3,324,446 Total gross deferred tax liabilities: Deferred profit on sale of properties . . . . . . . . . . . . . . . . . . . . . . (25,547) (27,955) (307,795) Tax purpose reserves regulated by Japanese tax laws . . . . . . . . (6,588) (6,961) (79,374) Other . . . . . . . . . . . . . . . . . . . . . . . . . . . . . . . . . . . . . . . . . . . . . (92,595) (79,329) (1,115,602)
(124,730) (114,245) (1,502,771) Net deferred tax asset . . . . . . . . . . . . . . . . . . . . . . . . . . . . . . . . . ¥ 151,199 ¥ 139,764 $ 1,821,675
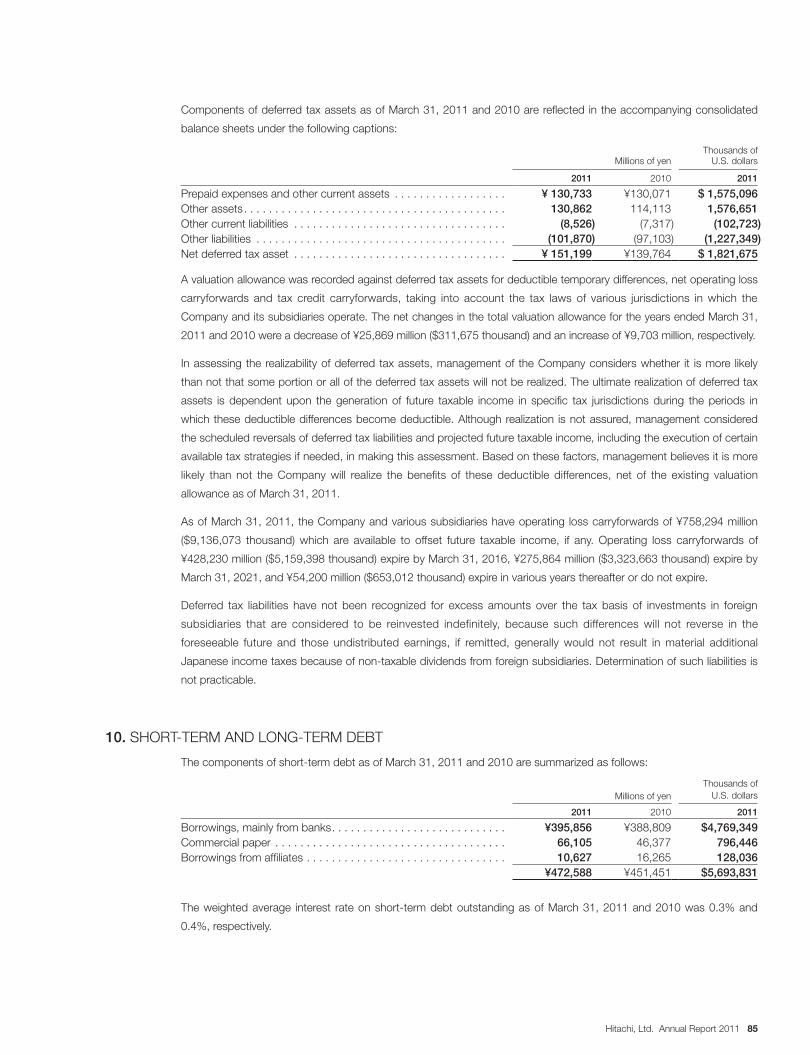
Hitachi, Ltd. Annual Report 2011 85
Components of deferred tax assets as of March 31, 2011 and 2010 are reflected in the accompanying consolidated
balance sheets under the following captions:
Millions of yenThousands of
U.S. dollars
2011 2010 2011
Prepaid expenses and other current assets . . . . . . . . . . . . . . . . . . ¥ 130,733 ¥130,071 $ 1,575,096 Other assets . . . . . . . . . . . . . . . . . . . . . . . . . . . . . . . . . . . . . . . . . . 130,862 114,113 1,576,651 Other current liabilities . . . . . . . . . . . . . . . . . . . . . . . . . . . . . . . . . . (8,526) (7,317) (102,723)Other liabilities . . . . . . . . . . . . . . . . . . . . . . . . . . . . . . . . . . . . . . . . (101,870) (97,103) (1,227,349)Net deferred tax asset . . . . . . . . . . . . . . . . . . . . . . . . . . . . . . . . . . ¥ 151,199 ¥139,764 $ 1,821,675
A valuation allowance was recorded against deferred tax assets for deductible temporary differences, net operating loss
carryforwards and tax credit carryforwards, taking into account the tax laws of various jurisdictions in which the
Company and its subsidiaries operate. The net changes in the total valuation allowance for the years ended March 31,
2011 and 2010 were a decrease of ¥25,869 million ($311,675 thousand) and an increase of ¥9,703 million, respectively.
In assessing the realizability of deferred tax assets, management of the Company considers whether it is more likely
than not that some portion or all of the deferred tax assets will not be realized. The ultimate realization of deferred tax
assets is dependent upon the generation of future taxable income in specific tax jurisdictions during the periods in
which these deductible differences become deductible. Although realization is not assured, management considered
the scheduled reversals of deferred tax liabilities and projected future taxable income, including the execution of certain
available tax strategies if needed, in making this assessment. Based on these factors, management believes it is more
likely than not the Company will realize the benefits of these deductible differences, net of the existing valuation
allowance as of March 31, 2011.
As of March 31, 2011, the Company and various subsidiaries have operating loss carryforwards of ¥758,294 million
($9,136,073 thousand) which are available to offset future taxable income, if any. Operating loss carryforwards of
¥428,230 million ($5,159,398 thousand) expire by March 31, 2016, ¥275,864 million ($3,323,663 thousand) expire by
March 31, 2021, and ¥54,200 million ($653,012 thousand) expire in various years thereafter or do not expire.
Deferred tax liabilities have not been recognized for excess amounts over the tax basis of investments in foreign
subsidiaries that are considered to be reinvested indefinitely, because such differences will not reverse in the
foreseeable future and those undistributed earnings, if remitted, generally would not result in material additional
Japanese income taxes because of non-taxable dividends from foreign subsidiaries. Determination of such liabilities is
not practicable.
10. SHORT-TERM AND LONG-TERM DEBT
The components of short-term debt as of March 31, 2011 and 2010 are summarized as follows:
Millions of yenThousands of
U.S. dollars
2011 2010 2011
Borrowings, mainly from banks . . . . . . . . . . . . . . . . . . . . . . . . . . . . ¥395,856 ¥388,809 $4,769,349 Commercial paper . . . . . . . . . . . . . . . . . . . . . . . . . . . . . . . . . . . . . 66,105 46,377 796,446 Borrowings from affiliates . . . . . . . . . . . . . . . . . . . . . . . . . . . . . . . . 10,627 16,265 128,036
¥472,588 ¥451,451 $5,693,831
The weighted average interest rate on short-term debt outstanding as of March 31, 2011 and 2010 was 0.3% and
0.4%, respectively.

86 Hitachi, Ltd. Annual Report 2011
The components of long-term debt as of March 31, 2011 and 2010 are summarized as follows:
Millions of yenThousands of
U.S. dollars
2011 2010 2011
Unsecured notes and debentures: Due 2013, interest 0.72% debenture . . . . . . . . . . . . . . . . . . . . . ¥ 80,000 ¥ 80,000 $ 963,855 Due 2010, interest 0.7% debenture . . . . . . . . . . . . . . . . . . . . . . — 49,898 — Due 2015, interest 1.56% debenture . . . . . . . . . . . . . . . . . . . . . 49,989 49,987 602,277 Due 2010, interest 0.74% debenture . . . . . . . . . . . . . . . . . . . . . — 5,000 — Due 2011–2017, interest 0.55–2.17%, issued by subsidiaries . . . 363,233 457,726 4,376,301 Unsecured convertible debentures: Due 2014, interest 0.1% debenture . . . . . . . . . . . . . . . . . . . . . . 99,360 99,998 1,197,109 Due 2016 and 2019, zero coupon, issued by a subsidiary . . . . . 20,105 40,000 242,229 Loans, principally from banks and insurance companies: Secured by various assets and mortgages on property, plant and equipment, maturing 2011–2015, interest 1.89–5.4% . . . . . . . . . . . . . . . . . . . . . . . . . . . . . . . . . . 19,041 68,841 229,410 Unsecured, maturing 2011–2026, interest 0.25–6.97%. . . . . . . . 970,483 1,030,323 11,692,567 Capital lease obligations . . . . . . . . . . . . . . . . . . . . . . . . . . . . . . . . . 36,318 33,919 437,566
1,638,529 1,915,692 19,741,314 Less current portion . . . . . . . . . . . . . . . . . . . . . . . . . . . . . . . . . . . . 338,218 303,730 4,074,916
¥1,300,311 ¥1,611,962 $15,666,398
The aggregate annual maturities of long-term debt after March 31, 2012 are as follows:
Millions of yenThousands of
U.S. dollars
2013. . . . . . . . . . . . . . . . . . . . . . . . . . . . . . . . . . . . . . . . . . . . . . . . . . . . . . . . . ¥ 365,195 $ 4,399,940 2014. . . . . . . . . . . . . . . . . . . . . . . . . . . . . . . . . . . . . . . . . . . . . . . . . . . . . . . . . 261,268 3,147,807 2015. . . . . . . . . . . . . . . . . . . . . . . . . . . . . . . . . . . . . . . . . . . . . . . . . . . . . . . . . 381,389 4,595,048 2016. . . . . . . . . . . . . . . . . . . . . . . . . . . . . . . . . . . . . . . . . . . . . . . . . . . . . . . . . 97,180 1,170,843 Thereafter . . . . . . . . . . . . . . . . . . . . . . . . . . . . . . . . . . . . . . . . . . . . . . . . . . . . . 195,279 2,352,758
¥1,300,311 $15,666,398
Short-term and long-term debt above include secured borrowings resulting mainly from the transfers of trade
receivables that do not meet the criteria for a sale pursuant to ASC 860 and are accounted for as secured borrowings
with pledge of collateral. The transferred assets are restricted solely to satisfy the obligation, and the pledged assets
approximate the amount of such borrowings. Short-term debt above as of March 31, 2011 and 2010 includes such
borrowings of ¥2,390 million ($28,795 thousand) and ¥2,449 million, respectively, and long-term debt above as of
March 31, 2010 includes such borrowings of ¥52,650 million.
As is customary in Japan, both short-term and long-term bank loans are made under general agreements that provide
that securities and guarantees for present and future indebtedness will be given upon request of the bank, and that the
bank shall have the right, as the obligations become due, or in the event of their default, to offset cash deposits against
such obligations.
Generally, the mortgage debenture trust agreements and certain secured and unsecured loan agreements provide,
among other things, that the lenders or trustees shall have the right to have any distribution of earnings, including the
payment of dividends and the issuance of additional capital stock, submitted to them for prior approval and also grant
them the right to request additional securities or mortgages on property, plant and equipment.

Hitachi, Ltd. Annual Report 2011 87
In December 2009, the Company issued ¥100,000 million convertible bonds due 2014. The bondholders are entitled
to stock acquisition rights effective from January 4, 2010 to December 10, 2014. The initial conversion price is ¥317
per share. Aside from the standard antidilution provisions, the conversion price shall be reduced for a certain period
before the early redemption triggered upon the occurrence of a corporate event or delisting event. The reduction of the
conversion price will be based on the premium which is based on the Company’s common stock price and the
effective date of the reduction. The reduced price will range from ¥238 to ¥317. When each of the closing prices of the
shares of the Company’s common stock at the Tokyo Stock Exchange on 20 continuous trading days are 130% or
more of the conversion price of the bonds applicable on those trading days, the Company has the option to redeem all
the remaining bonds on a specified redemption date after January 3, 2013 at a rate of ¥100 per ¥100 of each bond.
The Company was not required to bifurcate any of the embedded features contained in these bonds for accounting
purposes.
In September 2007, Hitachi Metals Ltd. (the issuer), a subsidiary of the Company, issued ¥20,000 million Euroyen zero
coupon convertible bonds due 2016 (the 2016 bonds) and ¥20,000 million Euroyen zero coupon convertible bonds
due 2019 (the 2019 bonds) (together, “the Bonds”). In the case of the 2016 bonds, the bondholders are entitled to
stock acquisition rights effective from September 27, 2007 to August 30, 2016 and the initial conversion price is
¥2,056 per share. In the case of the 2019 bonds, the bondholders are entitled to stock acquisition rights effective from
September 27, 2007 to August 30, 2019 and the initial conversion price is ¥2,042 per share. The closing price of the
shares on August 28, 2007, as reported by Tokyo Stock Exchange, was ¥1,344 per share. The stock acquisition rights
may be exercised by the holder of the bonds during any particular calendar quarter only if the closing price of the
shares for any 20 trading days in a period of 30 consecutive trading days ending on the last trading day of the
immediately preceding calendar quarter is more than 120% of the conversion price. The Bonds also contain other
embedded features, none of which were required to be bifurcated, such as the issuer’s call option, the issuer’s cash-
settlement option, and the investors’ put option. By giving notice to the bondholders on or after September 13, 2012
(in the case of the 2016 bonds), or on or after September 13, 2014 (in the case of the 2019 bonds), the issuer may
acquire from all bondholders all of the relevant bonds under the cash-settlement option, and upon reacquiring the
Bonds, the issuer is required to pay the bondholders cash equal to 100% of the principal amount and deliver common
shares of the issuer with a fair value equivalent to the fair value of the stock acquisition rights. As for the put option, the
bondholders are entitled, at their option, to require the issuer to redeem the Bonds at a redemption price of 100% of
the principal amount on September 13, 2010 and September 13, 2013 (with respect to the 2016 bonds) and on
September 13, 2011 and September 11, 2015 (with respect to the 2019 bonds).
11. RETIREMENT AND SEVERANCE BENEFITS
(a) Defined benefit plans
The Company and its subsidiaries have a number of contributory funded defined benefit pension plans and unfunded
lump-sum payment plans to provide retirement and severance benefits to substantially all employees. The Company
and certain subsidiaries adopted cash balance plans, and certain subsidiaries amended certain of their defined benefit
plans to cash balance plans during the years ended March 31, 2011, 2010 and 2009.
Under the cash balance plans, each employee has a notional account which represents pension benefits. The balance
in the notional account is based on principal credits, which are accumulated as employees render services, and
interest credits, which are determined based on the market interest rates.
Under unfunded lump-sum payment plans, employees are entitled to lump-sum payments based on their earnings and
the length of service at retirement or termination of employment for reasons other than dismissal for cause.

88 Hitachi, Ltd. Annual Report 2011
Net periodic benefit cost for the funded benefit pension plans and the unfunded lump-sum payment plans for the years
ended March 31, 2011, 2010 and 2009 consists of the following components:
Millions of yenThousands of
U.S. dollars
2011 2010 2009 2011
Service cost . . . . . . . . . . . . . . . . . . . . . . . . . . . ¥ 71,881 ¥ 71,777 ¥ 72,064 $ 866,036 Interest cost . . . . . . . . . . . . . . . . . . . . . . . . . . . 54,036 55,352 54,701 651,036 Expected return on plan assets for the period . . (35,741) (33,564) (45,804) (430,614)Amortization of prior service benefit . . . . . . . . . (23,614) (22,005) (21,103) (284,506)Amortization of actuarial loss . . . . . . . . . . . . . . 89,549 96,399 71,857 1,078,904 Transfer to defined contribution pension plan . . 1,806 39 (1,289) 21,759 Curtailments (gain) loss . . . . . . . . . . . . . . . . . . . 1,082 (227) — 13,036 Settlements loss . . . . . . . . . . . . . . . . . . . . . . . . — 603 — —Employees’ contributions . . . . . . . . . . . . . . . . . (162) (164) (489) (1,952)Net periodic benefit cost . . . . . . . . . . . . . . . . . . ¥158,837 ¥168,210 ¥129,937 $1,913,699
The estimated prior service cost and actuarial loss for the defined benefit pension plans that will be amortized from
accumulated other comprehensive income (loss) into net periodic benefit cost during the year ending March 31, 2012
are as follows:
Millions of yenThousands of
U.S. dollars
Prior service benefit . . . . . . . . . . . . . . . . . . . . . . . . . . . . . . . . . . . . . . . . . . . . . . . ¥(22,964) $ (276,675)Actuarial loss . . . . . . . . . . . . . . . . . . . . . . . . . . . . . . . . . . . . . . . . . . . . . . . . . . . . 94,364 1,136,916
Reconciliations of beginning and ending balances of the benefit obligation and the fair value of plan assets of the
contributory funded defined benefit pension plans and the benefit obligation of unfunded lump-sum payment plans are
as follows:
Millions of yenThousands of
U.S. dollars
2011 2010 2011
Change in benefit obligation: Benefit obligation at beginning of year . . . . . . . . . . . . . . . . . . . ¥2,193,449 ¥2,205,459 $ 26,427,096 Service cost . . . . . . . . . . . . . . . . . . . . . . . . . . . . . . . . . . . . . . 71,881 71,777 866,036 Interest cost . . . . . . . . . . . . . . . . . . . . . . . . . . . . . . . . . . . . . . 54,036 55,352 651,036 Plan amendments . . . . . . . . . . . . . . . . . . . . . . . . . . . . . . . . . . 993 275 11,964 Actuarial loss . . . . . . . . . . . . . . . . . . . . . . . . . . . . . . . . . . . . . 24,422 26,734 294,241 Benefits paid . . . . . . . . . . . . . . . . . . . . . . . . . . . . . . . . . . . . . . (144,528) (160,046) (1,741,301) Acquisitions and divestitures . . . . . . . . . . . . . . . . . . . . . . . . . . 3,329 396 40,108 Transfer to defined contribution pension plan . . . . . . . . . . . . . (9,355) (996) (112,711) Curtailments . . . . . . . . . . . . . . . . . . . . . . . . . . . . . . . . . . . . . . 644 129 7,759 Settlements . . . . . . . . . . . . . . . . . . . . . . . . . . . . . . . . . . . . . . . — (3,956) — Foreign currency exchange rate changes . . . . . . . . . . . . . . . . (6,386) (1,675) (76,939) Benefit obligation at end of year . . . . . . . . . . . . . . . . . . . . . . . 2,188,485 2,193,449 26,367,289
Change in plan assets: Fair value of plan assets at beginning of year . . . . . . . . . . . . . 1,269,133 1,123,646 15,290,759 Actual return on plan assets . . . . . . . . . . . . . . . . . . . . . . . . . . 3,539 169,004 42,639 Employers’ contributions . . . . . . . . . . . . . . . . . . . . . . . . . . . . . 110,439 100,299 1,330,590 Employees’ cash contributions . . . . . . . . . . . . . . . . . . . . . . . . 162 164 1,952 Benefits paid . . . . . . . . . . . . . . . . . . . . . . . . . . . . . . . . . . . . . . (106,084) (117,835) (1,278,120) Acquisitions and divestitures . . . . . . . . . . . . . . . . . . . . . . . . . . 4,944 270 59,566 Transfer to defined contribution pension plan . . . . . . . . . . . . . (1,547) (954) (18,639) Settlements . . . . . . . . . . . . . . . . . . . . . . . . . . . . . . . . . . . . . . . — (3,956) — Foreign currency exchange rate changes . . . . . . . . . . . . . . . . (4,861) (1,505) (58,566) Fair value of plan assets at end of year . . . . . . . . . . . . . . . . . . 1,275,725 1,269,133 15,370,181
Funded status . . . . . . . . . . . . . . . . . . . . . . . . . . . . . . . . . . . . . . ¥ (912,760) ¥ (924,316) $(10,997,108)

Hitachi, Ltd. Annual Report 2011 89
Amounts recognized in the consolidated balance sheets as of March 31, 2011 and 2010 are as follows:
Millions of yenThousands of
U.S. dollars
2011 2010 2011
Other assets . . . . . . . . . . . . . . . . . . . . . . . . . . . . . . . . . . . . . . . . ¥ 9,785 ¥ 11,409 $ 117,892 Accrued expenses . . . . . . . . . . . . . . . . . . . . . . . . . . . . . . . . . . . (30,730) (30,542) (370,241)Retirement and severance benefits . . . . . . . . . . . . . . . . . . . . . . . (891,815) (905,183) (10,744,759)
¥(912,760) ¥(924,316) $(10,997,108)
Amounts recognized in accumulated other comprehensive loss as of March 31, 2011 and 2010 consist of:
Millions of yenThousands of
U.S. dollars
2011 2010 2011
Prior service benefit . . . . . . . . . . . . . . . . . . . . . . . . . . . . . . . . . . ¥(129,918) ¥(153,502) $(1,565,277)Actuarial loss . . . . . . . . . . . . . . . . . . . . . . . . . . . . . . . . . . . . . . . 618,905 655,669 7,456,687
¥ 488,987 ¥ 502,167 $ 5,891,410
The Company and all subsidiaries use their year-end as a measurement date. Weighted-average assumptions used to
determine the year-end benefit obligations are as follows:
2011 2010
Discount rate . . . . . . . . . . . . . . . . . . . . . . . . . . . . . . . . . . . . . . . . . . . . . . . . . . . . . . . . . . 2.4% 2.5%Rate of compensation increase . . . . . . . . . . . . . . . . . . . . . . . . . . . . . . . . . . . . . . . . . . . . . 2.6% 2.6%
Weighted-average assumptions used to determine the net periodic pension cost for the years ended March 31, 2011,
2010 and 2009 are as follows:
2011 2010 2009
Discount rate . . . . . . . . . . . . . . . . . . . . . . . . . . . . . . . . . . . . . . . . . . . . . . . 2.5% 2.6% 2.5%Expected long-term return on plan assets . . . . . . . . . . . . . . . . . . . . . . . . . 2.9% 3.0% 3.4%Rate of compensation increase . . . . . . . . . . . . . . . . . . . . . . . . . . . . . . . . . . 2.6% 2.7% 2.7%
The expected long-term rate of return on plan assets is developed for each asset class, and is determined primarily on
historical returns on the plan assets and other factors.
The accumulated benefit obligation was ¥2,102,801 million ($25,334,952 thousand) as of March 31, 2011 and
¥2,107,093 million as of March 31, 2010.
Information for pension plans with accumulated benefit obligations in excess of plan assets and pension plans with
projected benefit obligations in excess of plan assets is as follows:
Millions of yenThousands of
U.S. dollars
2011 2010 2011
Plans with accumulated benefit obligations in excess of plan assets: Accumulated benefit obligations . . . . . . . . . . . . . . . . . . . . . . . . . ¥1,874,847 ¥1,917,053 $22,588,518 Plan assets . . . . . . . . . . . . . . . . . . . . . . . . . . . . . . . . . . . . . . . . . 1,028,469 1,058,941 12,391,193
Plans with projected benefit obligations in excess of plan assets: Projected benefit obligations . . . . . . . . . . . . . . . . . . . . . . . . . . . . ¥2,004,552 ¥2,061,648 $24,151,229 Plan assets . . . . . . . . . . . . . . . . . . . . . . . . . . . . . . . . . . . . . . . . . 1,082,007 1,125,923 13,036,229

90 Hitachi, Ltd. Annual Report 2011
The objective of the Company’s investment policy is to ensure a stable return from the plans’ investments over the long
term, which allows the Company’s and certain subsidiaries’ pension funds to meet their future obligations, and the
Company and certain subsidiaries attempt to maintain the pension funds in sound condition. In order to achieve the
above objective, a target rate of return is established, taking into consideration the composition of participants, level of
funded status, the Company’s and certain subsidiaries’ capacity to absorb risks and the current economic
environment. Also, a target asset allocation is established to achieve a target rate of return, based on the expected
rate of return by each asset class, the standard deviation of the rate of return and the correlation coefficient among the
assets. The investments are diversified. Under the current target asset allocation, approximately 30 percent of plan
assets are invested in equity securities and approximately 45 percent are invested in domestic and foreign government
bonds and corporate bonds. The remaining 25 percent are invested in other assets, such as hedge funds, private
equity funds and life insurance company general accounts. The Company and certain subsidiaries reduced the ratio of
equity securities during the year ended March 31, 2011 in order to reduce the risks resulting from volatility in the equity
markets. Rebalancing will occur if markets fluctuate in excess of certain levels. The Company and certain subsidiaries
periodically review actual returns on assets, economic environments and their capacity to absorb risk and realign the
target asset allocation if necessary.
The Company and certain subsidiaries prioritize the use of observable inputs in markets over the use of unobservable
inputs when measuring fair value as follows:
Level 1
Quoted prices for identical assets in active markets.
Level 2
Quoted prices for similar assets in active markets; quoted prices associated with transactions that are not distressed
for identical or similar assets in markets that are not active; or, valuations whose significant inputs are derived from or
corroborated by observable market data.
Level 3
Valuations using inputs that are not observable.
The following table presents the plan assets that are measured at fair value as of March 31, 2011 and 2010.
Millions of yen
Fair Value Measurements
Total Level 1 Level 2 Level 3
2011
Equity securities (a) . . . . . . . . . . . . . . . . . . . . . . . ¥ 112,808 ¥108,888 ¥ 3,920 ¥ —Government and municipal debt securities (b) . . 118,165 113,182 4,983 —Corporate and other debt securities (c) . . . . . . . . 62,148 — 31,048 31,100Hedge funds (d) . . . . . . . . . . . . . . . . . . . . . . . . . 55,359 — 13,014 42,345Securitization products (e) . . . . . . . . . . . . . . . . . 34,087 — — 34,087Cash and cash equivalents . . . . . . . . . . . . . . . . . 25,457 25,457 — —Life insurance company general accounts (f) . . . . 116,558 — 116,558 —Commingled funds (g) . . . . . . . . . . . . . . . . . . . . 703,279 — 666,127 37,152Other . . . . . . . . . . . . . . . . . . . . . . . . . . . . . . . . . 47,864 37,240 6,974 3,650
¥1,275,725 ¥284,767 ¥842,624 ¥148,334

Hitachi, Ltd. Annual Report 2011 91
Thousands of U.S. dollars
Fair Value Measurements
Total Level 1 Level 2 Level 3
2011
Equity securities (a) . . . . . . . . . . . . . . . . . . . . . . . $ 1,359,133 $1,311,904 $ 47,229 $ —Government and municipal debt securities (b) . . 1,423,675 1,363,639 60,036 —Corporate and other debt securities (c) . . . . . . . . 748,771 — 374,072 374,699 Hedge funds (d) . . . . . . . . . . . . . . . . . . . . . . . . . 666,976 — 156,795 510,181 Securitization products (e) . . . . . . . . . . . . . . . . . 410,687 — — 410,687 Cash and cash equivalents . . . . . . . . . . . . . . . . . 306,710 306,710 — —Life insurance company general accounts (f) . . . . 1,404,313 — 1,404,313 —Commingled funds (g) . . . . . . . . . . . . . . . . . . . . 8,473,241 — 8,025,627 447,614 Other . . . . . . . . . . . . . . . . . . . . . . . . . . . . . . . . . 576,675 448,675 84,024 43,976
$15,370,181 $3,430,928 $10,152,096 $1,787,157
Millions of yen
Fair Value Measurements
Total Level 1 Level 2 Level 3
2010
Equity securities (a) . . . . . . . . . . . . . . . . . . . . . . . ¥ 132,255 ¥131,264 ¥ 991 ¥ —Government and municipal debt securities (b) . . 190,906 183,077 7,829 —Corporate and other debt securities (c) . . . . . . . . 50,770 — 31,277 19,493Hedge funds (d) . . . . . . . . . . . . . . . . . . . . . . . . . 57,642 — 8,256 49,386Securitization products (e) . . . . . . . . . . . . . . . . . 29,262 — — 29,262Cash and cash equivalents . . . . . . . . . . . . . . . . . 20,038 20,038 — —Life insurance company general accounts (f) . . . . 85,298 — 85,298 —Commingled funds (g) . . . . . . . . . . . . . . . . . . . . 661,672 — 624,190 37,482Other . . . . . . . . . . . . . . . . . . . . . . . . . . . . . . . . . 41,290 26,857 9,511 4,922
¥1,269,133 ¥361,236 ¥767,352 ¥140,545
(a) Approximately 75 percent and 85 percent of equity securities are invested in Japan-listed stocks as of March 31,
2011 and 2010, respectively. Approximately 25 percent and 15 percent of equity securities are invested in stocks
listed overseas as of March 31, 2011 and 2010, respectively. Equity securities are primarily valued at quoted
market prices.
(b) Approximately 80 percent of government and municipal debt securities are invested in bonds issued in Japan and
primarily consist of Japanese government bonds as of March 31, 2011 and 2010. Approximately 20 percent of
government and municipal debt securities are invested in bonds issued in overseas markets and primarily consist
of foreign government bonds as of March 31, 2011 and 2010. Government and municipal debt securities are
primarily valued at prices provided by the securities industry, the industrial associations in each country, or prices
which are calculated on the basis of market interest rates.
(c) Approximately 25 percent and 30 percent of corporate and other debt securities are invested in bonds issued in
Japan as of March 31, 2011 and 2010, respectively. Approximately 75 percent and 70 percent of corporate and
other debt securities are invested in bonds issued in overseas markets as of March 31, 2011 and 2010,
respectively. Corporate and other debt securities are mainly valued at prices provided by the securities industry, the
industrial associations in each country, or prices which are calculated on the basis of market interest rates. If these
values are not available, corporate and other debt securities are valued at theoretical prices, taking into
consideration the interest rates of government bonds of the related countries, swap interest rates and credit risks.
(d) Hedge funds are invested primarily in relative value strategy funds, event driven funds, equity long/short funds, and
macroeconomic and Commodity Trading Advisor (CTA) funds. Hedge funds are valued using the Net Asset Value
(NAV) provided by the administrator of the fund. The NAV is based on the value of the underlying assets owned by
the fund, minus its liabilities, and then divided by the number of units outstanding.

92 Hitachi, Ltd. Annual Report 2011
(e) Securitization products are invested primarily in collateralized loan obligations. These investments are valued at
prices provided by financial institutions. The Company corroborates the prices, taking into consideration primarily
the market values of the underlying loans, the market values of similar debt securities, and the future expected
default rates and recovery rates of the collateralized loans.
(f) Life insurance company general accounts are valued at conversion value at the end of the period.
(g) Commingled funds represent pooled institutional investments. Approximately 35 percent of commingled funds are
invested in listed stocks as of March 31, 2011 and 2010, 40 percent and 35 percent in government and municipal
debt securities as of March 31, 2011 and 2010, respectively, 10 percent in corporate and other debt securities as
of March 31, 2011 and 2010, and 15 percent and 20 percent in other assets as of March 31, 2011 and 2010,
respectively. Commingled funds are valued at their NAV provided by the administrators of the funds, which are
based on the value of the underlying assets owned by the funds, divided by the number of units outstanding.
The following table presents the reconciliation of the beginning and ending balances of Level 3 assets for the years
ended March 31, 2011 and 2010.
Millions of yen
Beginning balance at March 31,
2010
Actual return on plan assets
still heldat the report-
ing date
Realized gain or loss on
plan assetssold during the period
Purchases, sales, and
settlements, net
Transfers in and/or
out ofLevel 3
Foreigncurrency
exchange
Ending balance at March 31,
2011
2011
Corporate and other debt securities . . ¥ 19,493 ¥ 197 ¥ 12 ¥11,434 ¥133 ¥(169) ¥ 31,100Hedge funds . . . . . . . . . . . . . . . . . . 49,386 2,082 (370) (8,723) — (30) 42,345Securitization products . . . . . . . . . . 29,262 7,283 1,090 (3,452) (71) (25) 34,087Commingled funds . . . . . . . . . . . . . 37,482 (3,485) (375) 3,660 32 (162) 37,152Other . . . . . . . . . . . . . . . . . . . . . . . 4,922 (463) 537 (1,339) — (7) 3,650
¥140,545 ¥ 5,614 ¥ 894 ¥ 1,580 ¥ 94 ¥(393) ¥148,334
Thousands of U.S. dollars
Beginning balance at March 31,
2010
Actual return on plan assets
still heldat the report-
ing date
Realized gain or loss on
plan assetssold during the period
Purchases, sales, and
settlements, net
Transfers in and/or
out ofLevel 3
Foreigncurrency
exchange
Ending balance at March 31,
2011
2011
Corporate and other debt securities . . $ 234,855 $ 2,374 $ 145 $137,759 $1,602 $(2,036) $ 374,699 Hedge funds . . . . . . . . . . . . . . . . . . 595,012 25,084 (4,458) (105,096) — (361) 510,181 Securitization products . . . . . . . . . . 352,554 87,747 13,133 (41,590) (855) (302) 410,687 Commingled funds . . . . . . . . . . . . . 451,590 (41,988) (4,518) 44,096 386 (1,952) 447,614 Other . . . . . . . . . . . . . . . . . . . . . . . 59,302 (5,578) 6,469 (16,133) — (84) 43,976
$1,693,313 $ 67,639 $10,771 $ 19,036 $1,133 $(4,735) $1,787,157
Millions of yen
Beginning balance at March 31,
2009
Actual return on plan assets
still heldat the report-
ing date
Realized gain or loss on
plan assetssold during the period
Purchases, sales, and
settlements, net
Transfers in and/or
out ofLevel 3
Foreigncurrency
exchange
Ending balance at March 31,
2010
2010
Corporate and other debt securities . . ¥ 5,952 ¥ 123 ¥ 87 ¥ 13,446 ¥— ¥(115) ¥ 19,493Hedge funds . . . . . . . . . . . . . . . . . . 82,161 8,574 227 (41,583) — 7 49,386Securitization products . . . . . . . . . . 16,097 14,496 342 (1,677) — 4 29,262Commingled funds . . . . . . . . . . . . . 44,063 (6,193) (1,056) 665 — 3 37,482Other . . . . . . . . . . . . . . . . . . . . . . . 5,987 (529) (91) (447) — 2 4,922
¥154,260 ¥16,471 ¥ (491) ¥(29,596) ¥— ¥ (99) ¥140,545

Hitachi, Ltd. Annual Report 2011 93
The Company and its subsidiaries expect to contribute ¥116,985 million ($1,409,458 thousand) to their defined benefit
plans for the year ending March 31, 2012.
The following benefit payments, which reflect expected future service, as appropriate, are expected to be paid.
Years ending March 31 Millions of yenThousands of
U.S. dollars
2012. . . . . . . . . . . . . . . . . . . . . . . . . . . . . . . . . . . . . . . . . . . . . . . . . . . . . . . . . ¥138,777 $1,672,012 2013. . . . . . . . . . . . . . . . . . . . . . . . . . . . . . . . . . . . . . . . . . . . . . . . . . . . . . . . . 133,341 1,606,518 2014. . . . . . . . . . . . . . . . . . . . . . . . . . . . . . . . . . . . . . . . . . . . . . . . . . . . . . . . . 119,437 1,439,000 2015. . . . . . . . . . . . . . . . . . . . . . . . . . . . . . . . . . . . . . . . . . . . . . . . . . . . . . . . . 124,694 1,502,337 2016. . . . . . . . . . . . . . . . . . . . . . . . . . . . . . . . . . . . . . . . . . . . . . . . . . . . . . . . . 124,962 1,505,566 2017–2021 . . . . . . . . . . . . . . . . . . . . . . . . . . . . . . . . . . . . . . . . . . . . . . . . . . . . 620,220 7,472,530
(b) Defined contribution plans
The Company and certain subsidiaries have a number of defined contribution plans. The amount of cost recognized for
the Company’s and certain subsidiaries’ contributions to the plans for the years ended March 31, 2011, 2010 and
2009 were ¥18,593 million ($224,012 thousand), ¥18,758 million and ¥18,059 million, respectively.
12. COMMON STOCK
The Company has authorized issuance of 10 billion shares of common stock.
The number of issued shares and the amount of common stock for the years ended March 31, 2011, 2010 and 2009
are as follows:
Millions of yenThousands of
U.S. dollars
Issued shares Amount Amount
Balance as of March 31, 2009 and 2008 . . . . . 3,368,126,056 ¥282,033 Issuance of common stock . . . . . . . . . . . . . . 1,150,000,000 126,776 Conversion of convertible bonds . . . . . . . . . . 6,309 1Balance as of March 31, 2010 . . . . . . . . . . . . . 4,518,132,365 408,810 $4,925,422 Conversion of convertible bonds . . . . . . . . . . 2,012,599 319 3,843 Balance as of March 31, 2011 . . . . . . . . . . . . . 4,520,144,964 ¥409,129 $4,929,265
The issuance of common stock for the year ended March 31, 2010 and the conversion of convertible bonds into
common stock for the years ended March 31, 2011 and 2010 were accounted for in accordance with the provisions of
the Japanese Company Law by crediting one-half of the issue price or the conversion price to each of the common
stock accounts and the capital surplus accounts.

94 Hitachi, Ltd. Annual Report 2011
13. CAPITAL SURPLUS
The changes in capital surplus include the effect of changes in the Company’s ownership interest in its consolidated
subsidiaries. The net income (loss) attributable to Hitachi, Ltd. and transfers from (to) noncontrolling interests for the
years ended March 31, 2011 and 2010 are as follows:
Millions of yenThousands of
U.S. dollars
2011 2010 2011
Net income (loss) attributable to Hitachi, Ltd. . . . . . . . . . . . . . . . . . . . . . ¥238,869 ¥(106,961) $2,877,940 Transfers from (to) the noncontrolling interests
Decrease in capital surplus for purchase of five listed subsidiaries’ ownership interests to convert them into wholly owned subsidiaries . . . . . . . . . . . . . . . . . . . . . . . . . . . . . . . . . . . . . . . . . . (6,713) (58,175) (80,879)
Other . . . . . . . . . . . . . . . . . . . . . . . . . . . . . . . . . . . . . . . . . . . . . . . . (1,516) (6,823) (18,265) Net transfers from (to) noncontrolling interests . . . . . . . . . . . . . . . . . . . (8,229) (64,998) (99,144)Change from net income (loss) attributable to Hitachi, Ltd. and transfers from (to) noncontrolling interests . . . . . . . . . . . . . . . . . . . . . . . . . . . . . . ¥230,640 ¥(171,959) $2,778,796
The purchase of five listed subsidiaries’ ownership interests is related to the purchase of the noncontrolling interests of
Hitachi Information Systems, Ltd., Hitachi Software Engineering Co., Ltd., Hitachi Systems & Services, Ltd., Hitachi
Plant Technologies, Ltd. and Hitachi Maxell, Ltd. for the purpose of converting them into wholly owned subsidiaries. As
a result, Hitachi Information Systems, Ltd., Hitachi Software Engineering Co., Ltd. and Hitachi Systems & Services,
Ltd. had been converted into wholly owned subsidiaries during the year ended March 31, 2010, and Hitachi Plant
Technologies, Ltd. and Hitachi Maxell, Ltd. had been converted into wholly owned subsidiaries during the year ended
March 31, 2011. On October 1, 2010 when Hitachi Systems & Services, Ltd., was merged into Hitachi Software
Engineering Co., Ltd., Hitachi Solutions, Ltd. was established. The total decreases in noncontrolling interests during
the years ended March 31, 2011 and 2010 resulting from these equity transactions were ¥8,667 million ($104,422
thousand) and ¥193,880 million, respectively.
14. LEGAL RESERVE AND RETAINED EARNINGS, AND DIVIDENDS
The Japanese Company Law (JCL) provides that earnings in an amount equal to 10 percent of appropriations of
retained earnings to be paid as dividends should be appropriated as a capital surplus or a legal reserve until the total of
capital surplus and legal reserve equals 25 percent of stated common stock. In addition to transfer from capital surplus
to stated common stock, either capital surplus or legal reserve may be available for dividends by resolution of the
shareholders’ meeting.
Dividends during the years ended March 31, 2011 and 2009 represent dividends declared during those years. For the
year ended March 31, 2010, the Company did not pay any dividends. On May 11, 2011, the Board of Directors
approved a cash dividend for the second half of the year ended March 31, 2011 of ¥3.0 ($0.04) per share, aggregating
¥13,553 million ($163,289 thousand). No provision has been made in the accompanying consolidated financial
statements for this cash dividend.
Cash dividends per share for the years ended March 31, 2011 and 2009 were ¥8.0 ($0.10) and ¥3.0, respectively,
based on dividends declared with respect to earnings for the periods.

Hitachi, Ltd. Annual Report 2011 95
15. TREASURY STOCK
The JCL allows a company to acquire treasury stock upon shareholders’ approval to the extent that suff icient
distributable funds are available. If the Board of Directors’ authority is stated in the articles of incorporation, a company
is allowed to acquire treasury stock not upon shareholders’ approval but Board of Directors’ approval. Acquisition of
treasury stock is allowed under the Company’s articles of incorporation.
Pursuant to the provisions of the JCL, shareholders may request the company to acquire their shares representing less
than a minimum trading lot as shares less than a minimum trading lot cannot be publicly traded and such a
shareholder holding less than a minimum trading lot cannot exercise a voting right and other shareholder’s rights
except as provided in the JCL or the articles of incorporation. The JCL also states that a shareholder holding shares
less than a minimum trading lot may request the company to sell its treasury stock, if any, to the shareholder up to a
minimum trading lot if entitled under the articles of incorporation. Sale of treasury stock is allowed under the
Company’s articles of incorporation.
The changes in treasury stock for the years ended March 31, 2011, 2010 and 2009 are summarized as follows:
Millions of yenThousands of
U.S. dollars
Shares Amount Amount
Balance as of March 31, 2008 . . . . . . . . . . . . . 43,727,729 ¥ 26,130 Acquisition for treasury . . . . . . . . . . . . . . . . . 1,500,226 858 Sales of treasury stock . . . . . . . . . . . . . . . . . (1,253,991) (751)Balance as of March 31, 2009 . . . . . . . . . . . . . 43,973,964 26,237 Acquisition for treasury . . . . . . . . . . . . . . . . . 376,025 115 Sales of treasury stock . . . . . . . . . . . . . . . . . (335,738) (201)Balance as of March 31, 2010 . . . . . . . . . . . . . 44,014,251 26,151 $ 315,072 Acquisition for treasury . . . . . . . . . . . . . . . . . 456,705 183 2,205 Sales of treasury stock . . . . . . . . . . . . . . . . . (41,926,879) (24,963) (300,759)Balance as of March 31, 2011 . . . . . . . . . . . . . 2,544,077 ¥ 1,371 $ 16,518
Sales of treasury stock for the year ended March 31, 2011 includes exchange of treasury stock to noncontrolling
interest holders in order to convert Hitachi Plant Technologies, Ltd. and Hitachi Maxell, Ltd. to wholly owned
subsidiaries.

96 Hitachi, Ltd. Annual Report 2011
16. ACCUMULATED OTHER COMPREHENSIVE LOSS
Accumulated other comprehensive loss, net of related tax effects, displayed in the consolidated statements of equity is
classified as follows:
Millions of yenThousands of
U.S. dollars
2011 2010 2009 2011
Foreign currency translation adjustments: Balance at beginning of year . . . . . . . . . . . . . . . . . . . . ¥(182,783) ¥(179,737) ¥ (69,222) $(2,202,205) Other comprehensive income (loss), net of reclassification adjustments . . . . . . . . . . . . . . . (69,194) 4,289 (110,899) (833,663) Net transfer from (to) noncontrolling interests . . . . . . . (229) (7,335) 384 (2,759) Balance at end of year . . . . . . . . . . . . . . . . . . . . . . . . ¥(252,206) ¥(182,783) ¥(179,737) $(3,038,627)Pension liability adjustments: Balance at beginning of year . . . . . . . . . . . . . . . . . . . . ¥(272,410) ¥(405,082) ¥(221,007) $(3,282,048) Other comprehensive income (loss), net of reclassification adjustments . . . . . . . . . . . . . . . 15,852 141,761 (184,153) 190,988 Net transfer from (to) noncontrolling interests . . . . . . . (8) (9,089) 78 (96) Balance at end of year . . . . . . . . . . . . . . . . . . . . . . . . ¥(256,566) ¥(272,410) ¥(405,082) $(3,091,156)Net unrealized holding gain on available-for-sale securities: Balance at beginning of year . . . . . . . . . . . . . . . . . . . . ¥ 25,564 ¥ 12 ¥ 22,581 $ 308,000 Effect of consolidation of securitization entities upon initial adoption of the amended provisions of ASC 810 . . . . . . . . . . . . . . . . . . . . . . . . . . . . . . . . (2,977
) —
— (35,867) Other comprehensive income (loss), net of reclassification adjustments . . . . . . . . . . . . . . . (5,728) 23,209 (22,855) (69,012) Net transfer from (to) noncontrolling interests . . . . . . . 46 2,343 286 554 Balance at end of year . . . . . . . . . . . . . . . . . . . . . . . . ¥ 16,905 ¥ 25,564 ¥ 12 $ 203,675 Cash flow hedges: Balance at beginning of year . . . . . . . . . . . . . . . . . . . . ¥ (2,428) ¥ (1,544) ¥ 450 $ (29,253) Other comprehensive income (loss), net of reclassification adjustments . . . . . . . . . . . . . . . 1,233 (833) (2,031) 14,855 Net transfer from (to) noncontrolling interests . . . . . . . — (51) 37 — Balance at end of year . . . . . . . . . . . . . . . . . . . . . . . . ¥ (1,195) ¥ (2,428) ¥ (1,544) $ (14,398)Total accumulated other comprehensive loss: Balance at beginning of year . . . . . . . . . . . . . . . . . . . . ¥(432,057) ¥(586,351) ¥(267,198) $(5,205,506)
Effect of consolidation of securitization entities upon initial adoption of the amended provisions of ASC 810 . . . . . . . . . . . . . . . . . . . . . . . . . . . . . . . . (2,977) — — (35,867)
Other comprehensive income (loss), net of reclassification adjustments . . . . . . . . . . . . . . . (57,837) 168,426 (319,938) (696,832) Net transfer from (to) noncontrolling interests . . . . . . . (191) (14,132) 785 (2,301) Balance at end of year . . . . . . . . . . . . . . . . . . . . . . . . ¥(493,062) ¥(432,057) ¥(586,351) $(5,940,506)

Hitachi, Ltd. Annual Report 2011 97
The following is a summary of reclassification adjustments by each classification of other comprehensive income (loss)
arising during the years ended March 31, 2011, 2010 and 2009 and the amounts of income tax expense or benefit
allocated to each component of other comprehensive income (loss), including reclassification adjustments. The
amounts include amounts attributable to noncontrolling interests.
Millions of yen
2011
Before-taxamount
Tax benefit(expense)
Net-of-taxamount
Other comprehensive loss arising during the year: Foreign currency translation adjustments . . . . . . . . . . . . . . . . . . . ¥ (90,643) ¥ — ¥ (90,643) Pension liability adjustments . . . . . . . . . . . . . . . . . . . . . . . . . . . . . (55,048) 26,580 (28,468) Net unrealized holding gain on available-for-sale securities . . . . . . (10,045) 4,833 (5,212) Cash flow hedges . . . . . . . . . . . . . . . . . . . . . . . . . . . . . . . . . . . . . 74 (177) (103)
(155,662) 31,236 (124,426)Reclassification adjustments for realized net loss included in net income: Foreign currency translation adjustments . . . . . . . . . . . . . . . . . . . 3,264 — 3,264 Pension liability adjustments . . . . . . . . . . . . . . . . . . . . . . . . . . . . . 78,505 (33,961) 44,544 Net unrealized holding gain on available-for-sale securities . . . . . . (244) 104 (140) Cash flow hedges . . . . . . . . . . . . . . . . . . . . . . . . . . . . . . . . . . . . . 2,550 (459) 2,091
84,075 (34,316) 49,759Other comprehensive loss, net of reclassification adjustments: Foreign currency translation adjustments . . . . . . . . . . . . . . . . . . . (87,379) — (87,379) Pension liability adjustments . . . . . . . . . . . . . . . . . . . . . . . . . . . . . 23,457 (7,381) 16,076 Net unrealized holding gain on available-for-sale securities . . . . . . (10,289) 4,937 (5,352) Cash flow hedges . . . . . . . . . . . . . . . . . . . . . . . . . . . . . . . . . . . . . 2,624 (636) 1,988
¥ (71,587) ¥ (3,080) ¥ (74,667)
Thousands of U.S. dollars
2011
Before-taxamount
Tax benefit(expense)
Net-of-taxamount
Other comprehensive loss arising during the year: Foreign currency translation adjustments . . . . . . . . . . . . . . . . . . . $(1,092,084) $ — $(1,092,084) Pension liability adjustments . . . . . . . . . . . . . . . . . . . . . . . . . . . . . (663,229) 320,241 (342,988) Net unrealized holding gain on available-for-sale securities . . . . . . (121,024) 58,229 (62,795) Cash flow hedges . . . . . . . . . . . . . . . . . . . . . . . . . . . . . . . . . . . . . 892 (2,134) (1,242)
(1,875,445) 376,336 (1,499,109)Reclassification adjustments for realized net loss included in net income: Foreign currency translation adjustments . . . . . . . . . . . . . . . . . . . 39,325 — 39,325 Pension liability adjustments . . . . . . . . . . . . . . . . . . . . . . . . . . . . . 945,843 (409,168) 536,675 Net unrealized holding gain on available-for-sale securities . . . . . . (2,940) 1,253 (1,687) Cash flow hedges . . . . . . . . . . . . . . . . . . . . . . . . . . . . . . . . . . . . . 30,723 (5,530) 25,193
1,012,951 (413,445) 599,506 Other comprehensive loss, net of reclassification adjustments: Foreign currency translation adjustments . . . . . . . . . . . . . . . . . . . (1,052,759) — (1,052,759) Pension liability adjustments . . . . . . . . . . . . . . . . . . . . . . . . . . . . . 282,614 (88,927) 193,687 Net unrealized holding gain on available-for-sale securities . . . . . . (123,964) 59,482 (64,482) Cash flow hedges . . . . . . . . . . . . . . . . . . . . . . . . . . . . . . . . . . . . . 31,615 (7,664) 23,951
$ (862,494) $ (37,109) $ (899,603)

98 Hitachi, Ltd. Annual Report 2011
Millions of yen
Before-taxamount
Tax benefit(expense)
Net-of-taxamount
2010
Other comprehensive income arising during the year: Foreign currency translation adjustments . . . . . . . . . . . . . . . . . . . ¥ 8,487 ¥ — ¥ 8,487 Pension liability adjustments . . . . . . . . . . . . . . . . . . . . . . . . . . . . . 116,184 3,979 120,163 Net unrealized holding gain on available-for-sale securities . . . . . . 40,295 (11,758) 28,537 Cash flow hedges . . . . . . . . . . . . . . . . . . . . . . . . . . . . . . . . . . . . . (308) (1,173) (1,481)
164,658 (8,952) 155,706Reclassification adjustments for realized net loss included in net loss: Foreign currency translation adjustments . . . . . . . . . . . . . . . . . . . (1,580) — (1,580) Pension liability adjustments . . . . . . . . . . . . . . . . . . . . . . . . . . . . . 73,776 (29,916) 43,860 Net unrealized holding gain on available-for-sale securities . . . . . . 236 (97) 139 Cash flow hedges . . . . . . . . . . . . . . . . . . . . . . . . . . . . . . . . . . . . . 258 552 810
72,690 (29,461) 43,229Other comprehensive income, net of reclassification adjustments: Foreign currency translation adjustments . . . . . . . . . . . . . . . . . . . 6,907 — 6,907 Pension liability adjustments . . . . . . . . . . . . . . . . . . . . . . . . . . . . . 189,960 (25,937) 164,023 Net unrealized holding gain on available-for-sale securities . . . . . . 40,531 (11,855) 28,676 Cash flow hedges . . . . . . . . . . . . . . . . . . . . . . . . . . . . . . . . . . . . . (50) (621) (671)
¥237,348 ¥(38,413) ¥198,935
Millions of yen
Before-taxamount
Tax benefit(expense)
Net-of-taxamount
2009
Other comprehensive loss arising during the year: Foreign currency translation adjustments . . . . . . . . . . . . . . . . . . . ¥(144,317) ¥ — ¥(144,317) Pension liability adjustments . . . . . . . . . . . . . . . . . . . . . . . . . . . . . (318,557) 73,589 (244,968) Net unrealized holding gain on available-for-sale securities . . . . . . (68,652) 26,158 (42,494) Cash flow hedges . . . . . . . . . . . . . . . . . . . . . . . . . . . . . . . . . . . . . (6,854) 2,446 (4,408)
(538,380) 102,193 (436,187) Reclassification adjustments for realized net loss included in net loss: Foreign currency translation adjustments . . . . . . . . . . . . . . . . . . . (253) — (253) Pension liability adjustments . . . . . . . . . . . . . . . . . . . . . . . . . . . . . 53,186 (21,313) 31,873 Net unrealized holding gain on available-for-sale securities . . . . . . 27,134 (10,997) 16,137 Cash flow hedges . . . . . . . . . . . . . . . . . . . . . . . . . . . . . . . . . . . . . 900 (76) 824
80,967 (32,386) 48,581Other comprehensive loss, net of reclassification adjustments: Foreign currency translation adjustments . . . . . . . . . . . . . . . . . . . (144,570) — (144,570) Pension liability adjustments . . . . . . . . . . . . . . . . . . . . . . . . . . . . . (265,371) 52,276 (213,095) Net unrealized holding gain on available-for-sale securities . . . . . . (41,518) 15,161 (26,357) Cash flow hedges . . . . . . . . . . . . . . . . . . . . . . . . . . . . . . . . . . . . . (5,954) 2,370 (3,584)
¥(457,413) ¥ 69,807 ¥(387,606)
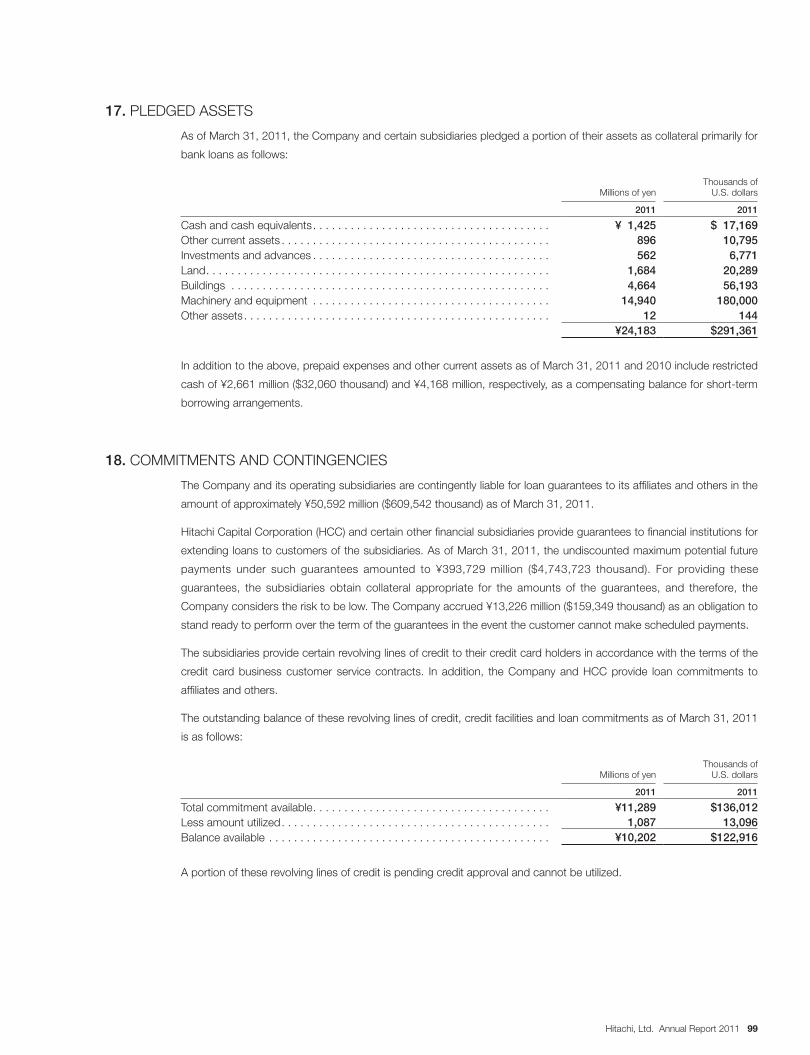
Hitachi, Ltd. Annual Report 2011 99
17. PLEDGED ASSETS
As of March 31, 2011, the Company and certain subsidiaries pledged a portion of their assets as collateral primarily for
bank loans as follows:
Millions of yenThousands of
U.S. dollars
2011 2011
Cash and cash equivalents . . . . . . . . . . . . . . . . . . . . . . . . . . . . . . . . . . . . . . ¥ 1,425 $ 17,169 Other current assets . . . . . . . . . . . . . . . . . . . . . . . . . . . . . . . . . . . . . . . . . . . 896 10,795 Investments and advances . . . . . . . . . . . . . . . . . . . . . . . . . . . . . . . . . . . . . . 562 6,771 Land . . . . . . . . . . . . . . . . . . . . . . . . . . . . . . . . . . . . . . . . . . . . . . . . . . . . . . . 1,684 20,289 Buildings . . . . . . . . . . . . . . . . . . . . . . . . . . . . . . . . . . . . . . . . . . . . . . . . . . . 4,664 56,193 Machinery and equipment . . . . . . . . . . . . . . . . . . . . . . . . . . . . . . . . . . . . . . 14,940 180,000 Other assets . . . . . . . . . . . . . . . . . . . . . . . . . . . . . . . . . . . . . . . . . . . . . . . . . 12 144
¥24,183 $291,361
In addition to the above, prepaid expenses and other current assets as of March 31, 2011 and 2010 include restricted
cash of ¥2,661 million ($32,060 thousand) and ¥4,168 million, respectively, as a compensating balance for short-term
borrowing arrangements.
18. COMMITMENTS AND CONTINGENCIES
The Company and its operating subsidiaries are contingently liable for loan guarantees to its affiliates and others in the
amount of approximately ¥50,592 million ($609,542 thousand) as of March 31, 2011.
Hitachi Capital Corporation (HCC) and certain other financial subsidiaries provide guarantees to financial institutions for
extending loans to customers of the subsidiaries. As of March 31, 2011, the undiscounted maximum potential future
payments under such guarantees amounted to ¥393,729 million ($4,743,723 thousand). For providing these
guarantees, the subsidiaries obtain collateral appropriate for the amounts of the guarantees, and therefore, the
Company considers the risk to be low. The Company accrued ¥13,226 million ($159,349 thousand) as an obligation to
stand ready to perform over the term of the guarantees in the event the customer cannot make scheduled payments.
The subsidiaries provide certain revolving lines of credit to their credit card holders in accordance with the terms of the
credit card business customer service contracts. In addition, the Company and HCC provide loan commitments to
affiliates and others.
The outstanding balance of these revolving lines of credit, credit facilities and loan commitments as of March 31, 2011
is as follows:
Millions of yenThousands of
U.S. dollars
2011 2011
Total commitment available . . . . . . . . . . . . . . . . . . . . . . . . . . . . . . . . . . . . . . ¥11,289 $136,012 Less amount utilized . . . . . . . . . . . . . . . . . . . . . . . . . . . . . . . . . . . . . . . . . . . 1,087 13,096 Balance available . . . . . . . . . . . . . . . . . . . . . . . . . . . . . . . . . . . . . . . . . . . . . ¥10,202 $122,916
A portion of these revolving lines of credit is pending credit approval and cannot be utilized.

100 Hitachi, Ltd. Annual Report 2011
The Company and certain subsidiaries have line of credit arrangements with banks in order to secure a financing
source for business operations. The unused lines of credit as of March 31, 2011 amounted to ¥400,078 million
($4,820,217 thousand), primarily related to unused lines of credit belonging to the Company. The Company maintains
commitment line agreements with a number of banks and pays commissions as consideration. These commitment
agreements generally provide a one-year term, and are subject to renewal at the end of the term. The unused
availability under these agreements as of March 31, 2011 amounted to ¥200,000 million ($2,409,639 thousand). The
Company also maintains another commitment line agreement, whose three years and two months term ends in May
2013, with financing companies. The unused availability under this agreement as of March 31, 2011 amounted to
¥100,000 million ($1,204,819 thousand).
As of March 31, 2011, outstanding commitments for the purchase of property, plant and equipment were
approximately ¥38,819 million ($467,699 thousand).
It is a common practice in Japan for companies, in the ordinary course of business, to receive promissory notes in the
settlement of trade accounts receivable and to subsequently discount such notes to banks or to transfer them by
endorsement to suppliers in the settlement of accounts payable. As of March 31, 2011 and 2010, the Company and
subsidiaries were contingently liable for trade notes discounted and endorsed in the following amounts:
Millions of yenThousands of
U.S. dollars
2011 2010 2011
Notes discounted . . . . . . . . . . . . . . . . . . . . . . . . . . . . . . . . . . . . . . ¥3,593 ¥3,497 $43,289 Notes endorsed . . . . . . . . . . . . . . . . . . . . . . . . . . . . . . . . . . . . . . . 1,851 2,538 22,301
¥5,444 ¥6,035 $65,590
A certain subsidiary is contingently liable for the transfer of export receivables with recourse. As of March 31, 2011, the
amount of transfer of export receivables with recourse was ¥7,382 million ($88,940 thousand).
The Company and its subsidiaries provide warranties for certain of their products. The accrued product warranty costs
are based primarily on historical experience of actual warranty claims. The changes in accrued product warranty costs
for the years ended March 31, 2011, 2010 and 2009 are summarized as follows:
Millions of yenThousands of
U.S. dollars
2011 2010 2009 2011
Balance at beginning of year . . . . . . . . . . . . . . . . . . . . . . ¥ 56,957 ¥ 60,449 ¥ 73,715 $ 686,229Expense recognized upon issuance of warranties . . . . . . 20,755 20,806 34,990 250,060 Usage . . . . . . . . . . . . . . . . . . . . . . . . . . . . . . . . . . . . . . . (19,219) (21,696) (43,369) (231,554) Other, including effect of foreign currency translation . . . (3,164) (2,602) (4,887) (38,121) Balance at end of year . . . . . . . . . . . . . . . . . . . . . . . . . . ¥ 55,329 ¥ 56,957 ¥ 60,449 $ 666,614
On June 15, 2006, Hamaoka Nuclear Power Station No. 5 of Chubu Electric Power Co., Inc. shut down due to turbine
damage. As a precautionary measure, on July 5, 2006, Shika Nuclear Power Station No. 2 of Hokuriku Electric Power
Company, which uses the same type of turbines, was shut down for an examination of the turbines and the
examination revealed damage to the turbine vanes. The Company accrued a provision for the repair costs.
In September 2008, Chubu Electric Power Co., Inc. filed a lawsuit against the Company. Chubu Electric Power Co.,
Inc. seeks compensation for consequential losses of ¥41,800 million mostly composed of the additional costs to
switch to thermal power arising from the shutdown at Hamaoka Nuclear Power Station No. 5. In May 2009, Hokuriku
Electric Power Company filed a lawsuit against the Company. Hokuriku Electric Power Company seeks compensation
for consequential losses of ¥33,701 million mostly composed of the additional costs to switch to thermal power arising
from the shutdown at Shika Nuclear Power Station No. 2. The Company is vigorously defending itself in these lawsuits.
The Company has not accrued for consequential losses related to these lawsuits. However, there can be no assurance
that the Company will not be liable for any amount claimed.

Hitachi, Ltd. Annual Report 2011 101
In January 2007, the European Commission ordered the Company and one of its affiliated companies to pay a fine for
infringement of EC antitrust rules regarding alleged antitrust violations for the gas insulated switchgear equipment used
at substations. In April 2007, the Company lodged an appeal with the Court of First Instance of the European
Communities requesting the court to annul the decision of the European Commission. The determination has not been
rendered at present, but the Company accrued the reasonably estimated amount for the fine.
In December 2006, the Company and a subsidiary in Europe received requests for information from the European
Commission, and a subsidiary in Japan received a grand jury subpoena in connection with the investigation conducted
by the Antitrust Division of the U.S. Department of Justice, all in respect of alleged antitrust violations relating to liquid
crystal displays. The Japanese subsidiary paid the fine in relation to the investigation by the Antitrust Division of the
U.S. Department of Justice in June 2009.
In June 2007, the Company received requests for information from the European Commission in respect of alleged
antitrust violations relating to dynamic random access memories. In May 2010, the European Commission ordered the
Company to pay a fine for infringement of EC antitrust rules. The Company paid that fine in August 2010.
In November 2007, a subsidiary of the Company in the U.S. received a grand jury subpoena in connection with the
investigation conducted by the Antitrust Division of the U.S. Department of Justice in respect of alleged antitrust
violations relating to cathode ray tubes. In addition, in November 2007, two subsidiaries in Asia and in Europe received
requests for information from the European Commission. Furthermore, in November 2007, a subsidiary in Canada
received requests for information from the Canadian Competition Bureau.
In June 2009, a subsidiary of the Company in Japan received a grand jury subpoena in connection with the
investigation conducted by the Antitrust Division of the U.S. Department of Justice and received requests for
information from the European Commission, and a subsidiary of the Company in Korea was investigated in Singapore
by the Competition Commission of Singapore, all in respect of alleged antitrust violations relating to optical disk drives.
Those subsidiaries accrued the reasonably estimated amount for the loss in relation to the investigation.
The Company and these companies have cooperated with the competent authorities in connection with the above
matters. Depending upon the outcome of these matters, fines or surcharge payments, the amount of which is
uncertain, may be imposed on them. In addition, subsequent to these actions by the competent authorities, civil
disputes, including class action lawsuits, involving the Company and some of these companies have arisen in a
number of countries, including in the U.S. and Canada. A reasonably estimated amount was accrued for the potential
losses in relation to certain of these civil lawsuits.
Depending upon the outcome of the above legal proceedings, there may be an adverse effect on the consolidated
financial position or results of operations. Currently the Company is unable to estimate the adverse effect, if any, of
many of these proceedings. Accordingly, except as otherwise stated, no accrual for potential loss has been made. The
actual amount of fines, surcharge payments or any other payments resulting from these legal proceedings may be
different from the accrued amounts.
In addition to the above, the Company and certain subsidiaries are subject to several legal proceedings and claims
which have arisen in the ordinary course of business and have not been finally adjudicated. These actions when
ultimately concluded and determined will not, in the opinion of management, have a material adverse effect on the
consolidated financial position or results of operations of the Company and subsidiaries.

102 Hitachi, Ltd. Annual Report 2011
19. IMPAIRMENT LOSSES FOR LONG-LIVED ASSETS
For the year ended March 31, 2011, the majority of the impairment losses were recorded on long-lived property, plant
and equipment located in Japan. The Components & Devices segment recognized a loss of ¥16,561 million ($199,530
thousand), primarily due to its business manufacturing batteries for electronic products for which the Company has
recognized losses for consecutive periods and projected lower-than-expected future income because of a reduction of
production, and its liquid crystal display components business which was projected to have lower production because
of smaller demand in the market. The High Functional Materials & Components segment recognized a loss of ¥10,956
million ($132,000 thousand) primarily due to its automotive related materials businesses whose profitabilities
deteriorated because of the Great East Japan Earthquake on March 11, 2011. The fair value estimates used to
determine these losses were based primarily on discounted future cash flows.
For the year ended March 31, 2010, the majority of the impairment losses were recorded on long-lived property, plant
and equipment located in Japan. The Components & Devices segment recognized a loss of ¥18,611 million, primarily
due to 1) its battery business for which the Company has recognized losses for consecutive periods and lower-than-
expected future income because of a reduction of production, 2) its liquid crystal display panel business which was
projected to have lower production because of smaller demand in the market, and 3) a part of its record media
products business whose profitability has deteriorated because of severe market conditions accompanied by falling
prices. The fair value estimates used to determine these losses were based primarily on discounted future cash flows.
For the year ended March 31, 2009, the majority of the impairment losses were recorded on long-lived property, plant
and equipment located in Japan. The Digital Media & Consumer Products segment recognized a loss of ¥51,695
million primarily in its plasma TV business due to the decision to reorganize sourcing for glass panel components from
in-house manufacturing to an outside supplier and patents with lower-than-expected future license income. The
Automotive Systems segment recognized a loss of ¥29,240 million primarily in its automotive products businesses
whose profitability deteriorated because of a significant deterioration of the automotive market. The Information &
Telecommunication Systems segment recognized a loss of ¥15,752 million primarily due to its semiconductor and
financial institution-related businesses whose profitability deteriorated because of smaller demand in the markets. The
High Functional Materials & Components segment recognized a loss of ¥12,888 million primarily in its semiconductor-
related and automotive-related products businesses whose profitabilities deteriorated because of a significant
deterioration in these markets. The Components & Devices segment recognized a loss of ¥12,022 million primarily due
to a specific type of electronic parts that were projected to have lower production because of smaller demand in the
market and a decline in the expected selling price of certain assets held for sale caused by a deterioration of the real
estate market. The fair value estimates used to determine these losses were based primarily on discounted future cash
flows.

Hitachi, Ltd. Annual Report 2011 103
20. RESTRUCTURING CHARGES
Certain losses incurred in the reorganization of the Company’s operations are considered restructuring charges.
Components and related amounts of the restructuring charges, before the related tax effects, for the years ended
March 31, 2011, 2010 and 2009 are as follows:
Millions of yenThousands of
U.S. dollars
2011 2010 2009 2011
Special and one-time termination benefits ¥5,653 ¥24,191 ¥21,517 $68,108 Loss on fixed assets 104 963 1,410 1,253
¥5,757 ¥25,154 ¥22,927 $69,361
The Company and certain subsidiaries provided special termination benefits to those employees voluntarily leaving the
companies, and certain subsidiaries provided one-time termination benefits due to the subsidiaries’ liquidations. The
accrued special termination benefits were recognized at the time voluntary termination was offered and benefits were
accepted by the employees. The accrued one-time termination benefits were recognized at the time the subsidiaries
communicated the plan to their employees. An analysis of the accrued special and one-time termination benefits for
the years ended March 31, 2011, 2010 and 2009 is as follows:
Millions of yenThousands of
U.S. dollars
2011 2010 2009 2011
Balance at beginning of the year . . . . . . . . . . . . . . . . . . . ¥ 8,170 ¥ 7,543 ¥ 8,952 $ 98,434 New charges . . . . . . . . . . . . . . . . . . . . . . . . . . . . . . . . . 5,653 24,191 21,517 68,108 Cash payments . . . . . . . . . . . . . . . . . . . . . . . . . . . . . . . (10,374) (23,548) (22,449) (124,988)Foreign currency exchange rate changes . . . . . . . . . . . . (91) (16) (477) (1,096)Balance at end of the year . . . . . . . . . . . . . . . . . . . . . . . ¥ 3,358 ¥ 8,170 ¥ 7,543 $ 40,458
The restructuring charges for the year ended March 31, 2011 mainly consist of special termination benefits for the
early-terminated employees of subsidiaries for the purpose of reducing costs and improving profitability in the
Components & Devices segment.
The following represents the significant restructuring activities for the year ended March 31, 2010 by reportable
segment:
1. The Automotive Systems segment restructured in order to reorganize the automotive products business, which
encountered severe deterioration in the market. The accrued special termination benefits expensed and paid during
the year ended March 31, 2010 amounted to ¥7,731 million. Total restructuring charges during the year ended
March 31, 2010 consisted only of special termination benefits.
2. The High Functional Materials & Components segment restructured in order to reorganize its high-grade metal
products and materials business to reduce costs and improve profitability. The accrued special termination benefits
expensed during the year ended March 31, 2010 amounted to ¥4,010 million. The liabilities for special termination
benefits amounting to ¥787 million as of March 31, 2010 were paid by March 31, 2011. Total restructuring charges
during the year ended March 31, 2010 amounted to ¥4,426 million.
3. The Components & Devices segment restructured in order to reorganize the liquid crystal display business, which
included several subsidiaries’ liquidations. The accrued special and one-time termination benefits expensed during
the year ended March 31, 2010 amounted to ¥4,144 million. The liabilities for special and one-time termination
benefits amounting to ¥3,054 million as of March 31, 2010 were paid by March 31, 2011. Total restructuring
charges during the year ended March 31, 2010 amounted to ¥4,182 million.

104 Hitachi, Ltd. Annual Report 2011
The following represents the significant restructuring activities for the year ended March 31, 2009 by reportable
segment:
1. The Automotive Systems segment restructured in order to reorganize the automotive products business, which
encountered severe deterioration in the market. The accrued special termination benefits expensed during the year
ended March 31, 2009 amounted to ¥5,717 million. The liabilities for special termination benefits amounting to
¥3,164 million as of March 31, 2009 were paid by March 31, 2010. Total restructuring charges during the year
ended March 31, 2009 consisted only of special termination benefits.
2. The High Functional Materials & Components segment restructured in order to reorganize its high-grade metal
products and materials business to reduce costs and improve profitability. The accrued special termination benefits
expensed during the year ended March 31, 2009 amounted to ¥4,069 million. The liabilities for special termination
benefits amounting to ¥1,050 million as of March 31, 2009 were paid by March 31, 2010. Total restructuring
charges during the year ended March 31, 2009 amounted to ¥4,252 million.
3. The Components & Devices segment restructured mainly in order to strengthen its storage business on a global
basis. The accrued special termination benefits expensed during the year ended March 31, 2009 amounted to
¥2,230 million. The liabilities for special termination benefits amounting to ¥937 million as of March 31, 2009 were
paid by March 31, 2010. Total restructuring charges during the year ended March 31, 2009 amounted to ¥3,286
million.
21. OTHER INCOME AND OTHER DEDUCTIONS
The following items are included in other income or other deductions for the years ended March 31, 2011, 2010 and
2009.
Millions of yenThousands of
U.S. dollars
2011 2010 2009 2011
Net gain (loss) on securities . . . . . . . . . . . . . . . . . . . . . . ¥61,046 ¥ (1,220) ¥(44,077) $ 735,494 Net loss on sale and disposal of rental assets and other property . . . . . . . . . . . . . . . . . . . . . . . . . . . . (3,161) (20,202) (21,292) (38,084)Exchange gain (loss) . . . . . . . . . . . . . . . . . . . . . . . . . . . . (9,508) 186 (37,259) (114,554)
The major component of net gain on securities for the year ended March 31, 2011 was related to a sale of shares of
IPS Alpha Technology, Ltd., a former affiliated company accounted for by the equity method.
Other income for the year ended March 31, 2011 includes a gain of ¥8,684 million ($104,627 thousand) on a bargain
purchase related to the acquisition of Aloka Co., Ltd. (Aloka), subsequently renamed Hitachi Aloka Medical, Ltd. Refer
to note 30 for the nature and financial effect of the acquisition of Aloka.
Other income for the year ended March 31, 2009 represents a gain of ¥5,203 million on the sale of a subsidiary’s
mobile communication business.

Hitachi, Ltd. Annual Report 2011 105
22. NET INCOME PER SHARE INFORMATION
The reconciliations of the numbers and the amounts used in the basic and diluted net income (loss) attributable to
Hitachi, Ltd. stockholders per share computations are as follows:
Number of shares
2011 2010 2009
Weighted average number of shares on which basic net income (loss) per share is calculated . . . . . . . . . . . . . . . . . 4,515,932,415 3,662,578,076 3,323,996,973
Effect of dilutive securities: Unsecured convertible bonds (due 2014) . . . . . . . . . . . . 315,249,850 — —Number of shares on which diluted net income (loss) per share is calculated . . . . . . . . . . . . . . . . . . . . . . . . . . . 4,831,182,265 3,662,578,076 3,323,996,973
Millions of yenThousands of
U.S. dollars
2011 2010 2009 2011
Net income (loss) attributable to Hitachi, Ltd. stockholders . . . . . . . . . . . . . . . . . . . . . . . . . . . . . . . . . ¥238,869 ¥(106,961) ¥(787,337) $2,877,940 Effect of dilutive securities: Unsecured convertible bonds (due 2014) . . . . . . . . . . 72 — — 867 Other . . . . . . . . . . . . . . . . . . . . . . . . . . . . . . . . . . . . . (368) (0) (8) (4,434)
Net income (loss) attributable to Hitachi, Ltd. stockholders on which diluted net income (loss) per share is calculated . . . . . . . . . . . . . . . . . . . . . . . . . ¥238,573 ¥(106,961) ¥(787,345) $2,874,373
Yen U.S. dollars
Net income (loss) attributable to Hitachi, Ltd. stockholders per share: Basic . . . . . . . . . . . . . . . . . . . . . . . . . . . . . . . . . . . . . ¥52.89 ¥(29.20) ¥(236.86) $0.64 Diluted . . . . . . . . . . . . . . . . . . . . . . . . . . . . . . . . . . . . 49.38 (29.20) (236.87) 0.59
The net loss attributable to Hitachi, Ltd. stockholders per share computations for the years ended March 31, 2010 and
2009 exclude all convertible bonds because their effect would have been antidilutive.
23. SUPPLEMENTARY INCOME AND EXPENSE INFORMATION
Millions of yenThousands of
U.S. dollars
2011 2010 2009 2011
Shipping and handling costs . . . . . . . . . . . . . . . . . . . . . . ¥140,240 ¥124,019 ¥148,145 $1,689,639Advertising expense . . . . . . . . . . . . . . . . . . . . . . . . . . . . 31,170 28,877 38,598 375,542Maintenance and repairs . . . . . . . . . . . . . . . . . . . . . . . . 80,878 72,065 78,242 974,434Rent . . . . . . . . . . . . . . . . . . . . . . . . . . . . . . . . . . . . . . . . 131,533 142,077 148,401 1,584,735Research and development expense . . . . . . . . . . . . . . . 395,180 372,470 416,517 4,761,205
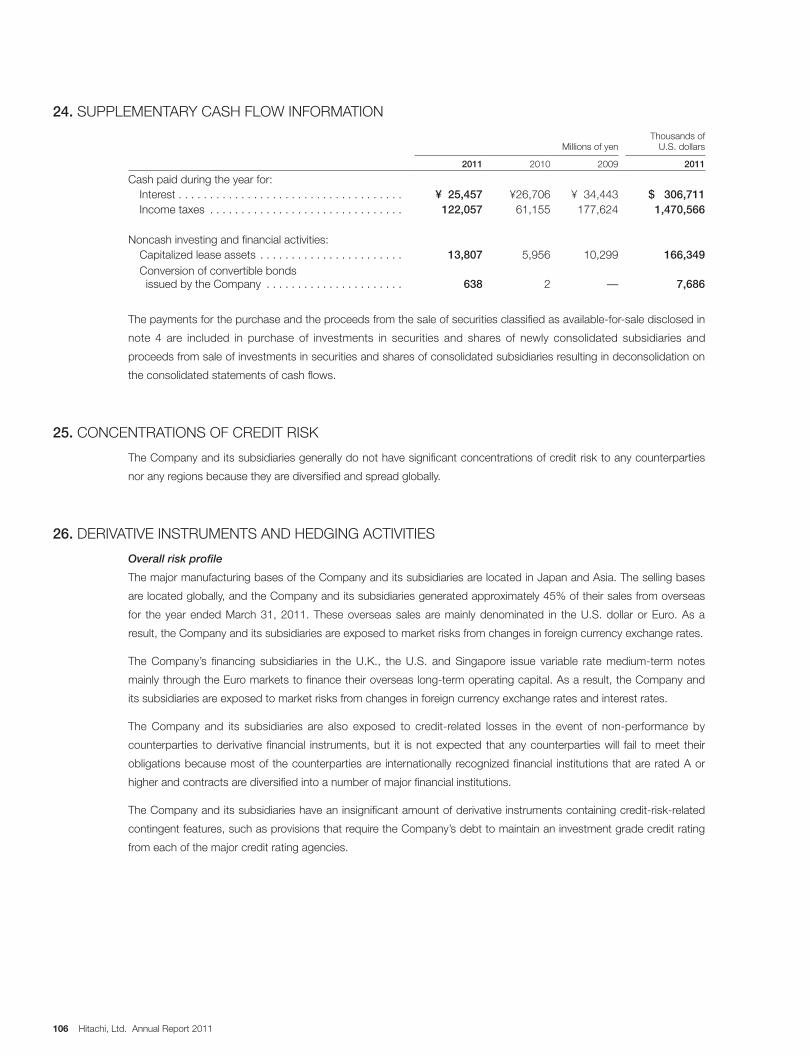
106 Hitachi, Ltd. Annual Report 2011
24. SUPPLEMENTARY CASH FLOW INFORMATION
Millions of yenThousands of
U.S. dollars
2011 2010 2009 2011
Cash paid during the year for: Interest . . . . . . . . . . . . . . . . . . . . . . . . . . . . . . . . . . . . ¥ 25,457 ¥26,706 ¥ 34,443 $ 306,711 Income taxes . . . . . . . . . . . . . . . . . . . . . . . . . . . . . . . 122,057 61,155 177,624 1,470,566
Noncash investing and financial activities: Capitalized lease assets . . . . . . . . . . . . . . . . . . . . . . . 13,807 5,956 10,299 166,349 Conversion of convertible bonds issued by the Company . . . . . . . . . . . . . . . . . . . . . . 638 2 — 7,686
The payments for the purchase and the proceeds from the sale of securities classified as available-for-sale disclosed in
note 4 are included in purchase of investments in securities and shares of newly consolidated subsidiaries and
proceeds from sale of investments in securities and shares of consolidated subsidiaries resulting in deconsolidation on
the consolidated statements of cash flows.
25. CONCENTRATIONS OF CREDIT RISK
The Company and its subsidiaries generally do not have significant concentrations of credit risk to any counterparties
nor any regions because they are diversified and spread globally.
26. DERIVATIVE INSTRUMENTS AND HEDGING ACTIVITIES
Overall risk profile
The major manufacturing bases of the Company and its subsidiaries are located in Japan and Asia. The selling bases
are located globally, and the Company and its subsidiaries generated approximately 45% of their sales from overseas
for the year ended March 31, 2011. These overseas sales are mainly denominated in the U.S. dollar or Euro. As a
result, the Company and its subsidiaries are exposed to market risks from changes in foreign currency exchange rates.
The Company’s financing subsidiaries in the U.K., the U.S. and Singapore issue variable rate medium-term notes
mainly through the Euro markets to finance their overseas long-term operating capital. As a result, the Company and
its subsidiaries are exposed to market risks from changes in foreign currency exchange rates and interest rates.
The Company and its subsidiaries are also exposed to credit-related losses in the event of non-performance by
counterparties to derivative financial instruments, but it is not expected that any counterparties will fail to meet their
obligations because most of the counterparties are internationally recognized financial institutions that are rated A or
higher and contracts are diversified into a number of major financial institutions.
The Company and its subsidiaries have an insignificant amount of derivative instruments containing credit-risk-related
contingent features, such as provisions that require the Company’s debt to maintain an investment grade credit rating
from each of the major credit rating agencies.

Hitachi, Ltd. Annual Report 2011 107
Risk management policy
The Company and its subsidiaries assess foreign currency exchange rate risk and interest rate risk by continually
monitoring changes in these exposures and by evaluating hedging opportunities. It is the Company’s principal policy
that the Company and its subsidiaries do not enter into derivative financial instruments for speculation purposes.
Foreign currency exchange rate risk management
The Company and its subsidiaries have assets and liabilities which are exposed to foreign currency exchange rate risk
and, as a result, they enter into forward exchange contracts and cross currency swap agreements for the purpose of
hedging these risk exposures.
In order to fix the future net cash flows principally from trade receivables and payables recognized, which are
denominated in foreign currencies, the Company and its subsidiaries on a monthly basis measure the volume and due
date of future net cash flows by currency. In accordance with the Company’s policy, a certain portion of measured net
cash flows is covered using forward exchange contracts, which principally mature within one year.
The Company and its subsidiaries enter into cross currency swap agreements with the same maturities as underlying
debt to fix cash flows from long-term debt denominated in foreign currencies. The hedging relationship between the
derivative financial instrument and its hedged item is highly effective in achieving offsetting changes in foreign currency
exchange rates.
Interest rate risk management
The Company’s and certain subsidiaries’ exposure to interest rate risk is related principally to long-term debt
obligations. Management believes it is prudent to minimize the variability caused by interest rate risk.
To meet this objective, the Company and certain subsidiaries principally enter into interest rate swaps to manage
fluctuations in cash flows. The interest rate swaps entered into are receive-variable, pay-fixed interest rate swaps.
Under the interest rate swaps, the Company and certain subsidiaries receive variable interest rate payments on long-
term debt associated with medium-term notes and make fixed interest rate payments, thereby creating fixed interest
rate long-term debt.
Certain financing subsidiaries mainly finance a portion of their operations using long-term debt with a fixed interest rate
and lend funds at variable interest rates. Therefore, such companies are exposed to interest rate risk. Management
believes it is prudent to minimize the variability caused by interest rate risk. To meet this objective, certain financing
subsidiaries principally enter into interest rate swaps converting the fixed rate to a variable rate to manage fluctuations
in fair value resulting from interest rate risk. Under the interest rate swaps, certain financing subsidiaries receive fixed
interest rate payments associated with long-term debt, including medium-term notes, and make variable interest rate
payments, thereby creating variable-rate long-term debt.
The hedging relationship between the interest rate swaps and its hedged item is highly effective in achieving offsetting
changes in cash flows and fair value resulting from interest rate risk.

108 Hitachi, Ltd. Annual Report 2011
Fair value hedge
Changes in the fair value of both recognized assets and liabilities, and derivative financial instruments designated as fair
value hedges of these assets and liabilities are recognized in other income (deductions). Derivative financial instruments
designated as fair value hedges include forward exchange contracts associated with operating transactions, cross
currency swap agreements and interest rate swaps associated with financing transactions.
Exchange loss for the year ended March 31, 2009 includes net gains of ¥169 million, which represent the component
of hedging instruments excluded from the assessment of hedge effectiveness. Net gain or loss related to the ineffective
portion of hedging instruments is not material for the year ended March 31, 2009.
Interest charges for the year ended March 31, 2009 include net losses of ¥466 million, which represent the component
of hedging instruments excluded from the assessment of hedge effectiveness. Net gain or loss related to the ineffective
portion of hedging instruments is not material for the year ended March 31, 2009.
Cash flow hedge
Foreign currency exposure:
Changes in the fair value of forward exchange contracts designated and qualifying as cash flow hedges of forecasted
transactions are reported in accumulated other comprehensive income (AOCI). These amounts are reclassified into
earnings in the same period as the hedged items affect earnings.
Exchange gain for the year ended March 31, 2009 includes net gains of ¥2,229 million, which represent the
component of hedging instruments excluded from the assessment of hedge effectiveness. Net gain or loss related to
the ineffective portion of hedging instruments is not material for the year ended March 31, 2009.
It is expected that a net gain of approximately ¥3,675 million ($44,277 thousand) recorded in AOCI relating to existing
forward exchange contracts will be reclassified into other income or other deductions during the year ending March 31,
2012.
As of March 31, 2011, the maximum length of time over which the Company and its subsidiaries are hedging their
exposure to the variability in future cash flows associated with foreign currency forecasted transactions is
approximately 44 months.
Interest rate exposure:
Changes in fair values of interest rate swaps designated as hedging instruments for the variability of cash flows
associated with long-term debt obligations are reported in AOCI. These amounts subsequently are reclassified into
interest charges as a yield adjustment in the same period in which the hedged debt obligations affect earnings.
Interest charges for the year ended March 31, 2009 include net losses of ¥347 million, which represent the component
of hedging instruments excluded from the assessment of hedge effectiveness. Interest charges for the year ended
March 31, 2009 include a net gain of ¥553 million, which represents the component of hedge ineffectiveness.
It is expected that a net loss of approximately ¥101 million ($1,217 thousand) recorded in AOCI related to interest rate
swaps will be reclassified into interest charges as a yield adjustment of the hedged debt obligations during the year
ending March 31, 2012.

Hitachi, Ltd. Annual Report 2011 109
The contract or notional amounts of derivative financial instruments held as of March 31, 2011 and 2010 are
summarized as follows:
Millions of yenThousands of
U.S. dollars
2011 2010 2011
Forward exchange contracts: To sell foreign currencies . . . . . . . . . . . . . . . . . . . . . . . . . . . . . . ¥228,088 ¥204,084 $2,748,048 To buy foreign currencies . . . . . . . . . . . . . . . . . . . . . . . . . . . . . 122,653 93,659 1,477,747 Cross currency swap agreements: To sell foreign currencies . . . . . . . . . . . . . . . . . . . . . . . . . . . . . . 96,712 78,381 1,165,205 To buy foreign currencies . . . . . . . . . . . . . . . . . . . . . . . . . . . . . 100,586 107,778 1,211,880 Interest rate swaps . . . . . . . . . . . . . . . . . . . . . . . . . . . . . . . . . . . . 280,951 354,492 3,384,952 Option contracts . . . . . . . . . . . . . . . . . . . . . . . . . . . . . . . . . . . . . . 7,221 935 87,000
The following tables, “Effective portion of derivatives designated as hedging instruments and related hedged items”
and “Ineffective portion and amount excluded from effectiveness test,” show the effects of derivative instruments for
fair value hedges on the consolidated statement of operations for the year ended March 31, 2011:
Effective portion of derivatives designated as hedging instruments and related hedged items
Hedging instruments Related hedged items
Derivatives Location Millions of yenThousands of
U.S. dollars Items Location Millions of yenThousands of
U.S. dollars
2011
Forward exchange contracts
Other income . . . ¥ 8,955 $107,891
Accounts receivable and accounts payable
Other income . . . ¥ (8,576) $(103,325)
Cross currency swap agreements
Interest charges . . 2,693 32,446
Long-term debt
Interest charges . . (3,010) (36,265)
¥11,648 $140,337 ¥(11,586) $(139,590)
Ineffective portion and amount excluded from effectiveness test
Derivatives Location Millions of yenThousands of U.S.
dollars
2011
Forward exchange contracts Other income . . . . . . . . . . . . . . . . . . . ¥ (682) $(8,217)Cross currency swap agreements Other income . . . . . . . . . . . . . . . . . . . 1,412 17,012Interest rate swaps Interest charges . . . . . . . . . . . . . . . . . 54 651
¥ 784 $ 9,446

110 Hitachi, Ltd. Annual Report 2011
The following tables, “Effective portion of derivatives designated as hedging instruments and related hedged items”
and “Ineffective portion and amount excluded from effectiveness test,” show the effects of derivative instruments for
fair value hedges on the consolidated statement of operations for the year ended March 31, 2010:
Effective portion of derivatives designated as hedging instruments and related hedged items
Hedging instruments Related hedged items
Derivatives Location Millions of yen Items Location Millions of yen
2010
Forward exchange contracts
Other income . . . . ¥ 5,871 Accounts receivable and
accounts payable
Other income . . . . ¥(5,877)
Cross currency swap agreements
Interest charges . . . (6,368)
Long-term debt
Interest charges . . . 6,514
¥ (497) ¥ 637
Ineffective portion and amount excluded from effectiveness test
Derivatives Location Millions of yen
2010
Forward exchange contracts Other income . . . . . . . . . . . . . . . . . . . . . . . . . . . ¥ (175)Cross currency swap agreements Other income . . . . . . . . . . . . . . . . . . . . . . . . . . . 3,206Interest rate swaps Interest charges . . . . . . . . . . . . . . . . . . . . . . . . . 580
¥3,611
The following tables, “Effective portion of derivatives designated as hedging instruments and related hedged items”
and “Ineffective portion and amount excluded from effectiveness test,” show the effects of derivative instruments for
fair value hedges on the consolidated statement of operations for the quarter ended March 31, 2009:
Effective portion of derivatives designated as hedging instruments and related hedged items
Hedging instruments Related hedged items
Derivatives Location Millions of yen Items Location Millions of yen
2009
Forward exchange contracts
Other deductions . . ¥ (6,814) Accounts receivable and accounts payable
Other deductions . . ¥ 5,832
Other deductions . . (590) Short-term investments and short-term debt
Other deductions . . 614
Cross currency swap agreements
Other deductions . . (3,036) Investments and advances
Other deductions . . 3,053
Interest charges . . . (3,115) Long-term debt Interest charges . . . 2,900
¥(13,555) ¥12,399
Ineffective portion and amount excluded from effectiveness test
Derivatives Location Millions of yen
2009
Forward exchange contracts Other deductions . . . . . . . . . . . . . . . . . . . . . . . . ¥ 227Cross currency swap agreements Other deductions . . . . . . . . . . . . . . . . . . . . . . . . (2,065) Interest rate swaps Interest charges . . . . . . . . . . . . . . . . . . . . . . . . . (58)
¥(1,896)

Hitachi, Ltd. Annual Report 2011 111
The following tables, “Gain (loss) recognized in OCI, Effective portion of derivatives designated as hedging
instruments,” “Gain (loss) reclassified from AOCI into consolidated statement of operations, Effective portion of
derivatives designated as hedging instruments” and “Gain on derivatives designated as cash flow hedging instruments,
Ineffective portion and amount excluded from effectiveness test” show the effect of derivative instruments for cash flow
hedges on the consolidated statement of operations for the year ended March 31, 2011:
Gain (loss) recognized in OCI
Effective portion of derivatives designated as hedging instruments
Derivatives Millions of yenThousands of
U.S. dollars
2011
Forward exchange contracts . . . . . . . . . . . . . . . . . . . . . . . . . . . . . . . . . . . . . . . . . . ¥ (220) $ (2,651) Cross currency swap agreements . . . . . . . . . . . . . . . . . . . . . . . . . . . . . . . . . . . . . . . (153) (1,843) Interest rate swaps . . . . . . . . . . . . . . . . . . . . . . . . . . . . . . . . . . . . . . . . . . . . . . . . . . 1,879 22,639 Option contracts . . . . . . . . . . . . . . . . . . . . . . . . . . . . . . . . . . . . . . . . . . . . . . . . . . . . 781 9,409
¥2,287 $27,554
Gain (loss) reclassified from AOCI into consolidated statement of operations
Effective portion of derivatives designated as hedging instruments
Derivatives Location Millions of yenThousands of
U.S. dollars
2011
Forward exchange contracts Other income . . . . . . . . . . . . . . . . ¥ 166 $ 2,000 Cross currency swap agreements Other income . . . . . . . . . . . . . . . . (4,174) (50,289) Interest rate swaps Interest charges . . . . . . . . . . . . . . (173) (2,084) Option contracts Other income . . . . . . . . . . . . . . . . (701) (8,446)
¥(4,882) $(58,819)
Gain on derivatives designated as cash flow hedging instruments
Ineffective portion and amount excluded from effectiveness test
Derivatives Location Millions of yenThousands of
U.S. dollars
2011
Forward exchange contracts Other income . . . . . . . . . . . . . . . . ¥269 $3,241 Cross currency swap agreements Other income . . . . . . . . . . . . . . . . 66 795 Interest rate swaps Interest charges . . . . . . . . . . . . . . 67 807
¥402 $4,843
The following tables, “Gain (loss) recognized in OCI, Effective portion of derivatives designated as hedging
instruments,” “Gain (loss) reclassified from AOCI into consolidated statement of operations, Effective portion of
derivatives designated as hedging instruments” and “Gain (loss) on derivatives designated as cash flow hedging
instruments, Ineffective portion and amount excluded from effectiveness test” show the effect of derivative instruments
for cash flow hedges on the consolidated statement of operations for the year ended March 31, 2010:
Gain (loss) recognized in OCI
Effective portion of derivatives designated as hedging instruments
Derivatives Millions of yen
Forward exchange contracts . . . . . . . . . . . . . . . . . . . . . . . . . . . . . . . . . . . . . . . . . . . . . . . . . . . . . . . . ¥1,323Cross currency swap agreements . . . . . . . . . . . . . . . . . . . . . . . . . . . . . . . . . . . . . . . . . . . . . . . . . . . . . 2,435Interest rate swaps . . . . . . . . . . . . . . . . . . . . . . . . . . . . . . . . . . . . . . . . . . . . . . . . . . . . . . . . . . . . . . . . (2,469) Option contracts . . . . . . . . . . . . . . . . . . . . . . . . . . . . . . . . . . . . . . . . . . . . . . . . . . . . . . . . . . . . . . . . . . 639
¥1,928

112 Hitachi, Ltd. Annual Report 2011
Gain (loss) reclassified from AOCI into consolidated statement of operations
Effective portion of derivatives designated as hedging instruments
Derivatives Location Millions of yen
Forward exchange contracts Other income . . . . . . . . . . . . . . . . . . . . . . ¥(1,007)Cross currency swap agreements Other income . . . . . . . . . . . . . . . . . . . . . . (7,536)Interest rate swaps Interest charges . . . . . . . . . . . . . . . . . . . . 1,756Option contracts Other income . . . . . . . . . . . . . . . . . . . . . . (634)
¥(7,421)
Gain (loss) on derivatives designated as cash flow hedging instruments
Ineffective portion and amount excluded from effectiveness test
Derivatives Location Millions of yen
Forward exchange contracts Other income . . . . . . . . . . . . . . . . . . . . . . ¥ 245Cross currency swap agreements Other income . . . . . . . . . . . . . . . . . . . . . . (3,378)Interest rate swaps Interest charges . . . . . . . . . . . . . . . . . . . . 589
¥(2,544)
The following tables, “Gain (loss) recognized in OCI, Effective portion of derivatives designated as hedging
instruments,” “Gain (loss) reclassified from AOCI into consolidated statement of operations, Effective portion of
derivatives designated as hedging instruments” and “Gain (loss) on derivatives designated as cash flow hedging
instruments, Ineffective portion and amount excluded from effectiveness test” show the effect of derivative instruments
for cash flow hedges on the consolidated statement of operations for the quarter ended March 31, 2009:
Gain (loss) recognized in OCI
Effective portion of derivatives designated as hedging instruments
Derivatives Millions of yen
Forward exchange contracts . . . . . . . . . . . . . . . . . . . . . . . . . . . . . . . . . . . . . . . . . . . . . . . . . . . . . . . . ¥ 638Cross currency swap agreements . . . . . . . . . . . . . . . . . . . . . . . . . . . . . . . . . . . . . . . . . . . . . . . . . . . . . (1,685)Interest rate swaps . . . . . . . . . . . . . . . . . . . . . . . . . . . . . . . . . . . . . . . . . . . . . . . . . . . . . . . . . . . . . . . . (1,025)Option contracts . . . . . . . . . . . . . . . . . . . . . . . . . . . . . . . . . . . . . . . . . . . . . . . . . . . . . . . . . . . . . . . . . . 8
¥(2,064)
Gain (loss) reclassified from AOCI into consolidated statement of operations
Effective portion of derivatives designated as hedging instruments
Derivatives Location Millions of yen
Forward exchange contracts Other deductions . . . . . . . . . . . . . . . . . . . ¥(1,623)Cross currency swap agreements Other deductions . . . . . . . . . . . . . . . . . . . (1,080)Interest rate swaps Interest income . . . . . . . . . . . . . . . . . . . . . 830Option contracts Other deductions . . . . . . . . . . . . . . . . . . . (1,492)
¥(3,365)
Gain (loss) on derivatives designated as cash flow hedging instruments
Ineffective portion and amount excluded from effectiveness test
Derivatives Location Millions of yen
Forward exchange contracts Other deductions . . . . . . . . . . . . . . . . . . . ¥(1,598)Cross currency swap agreements Other deductions . . . . . . . . . . . . . . . . . . . (358)Interest rate swaps Interest income . . . . . . . . . . . . . . . . . . . . . 120
¥(1,836)

Hitachi, Ltd. Annual Report 2011 113
27. FAIR VALUE OF FINANCIAL INSTRUMENTS
The following methods and assumptions are used to estimate the fair values of financial instruments:
Long-term debt and non-recourse borrowings of consolidated securitization entities
The fair value of long-term debt and non-recourse borrowings of consolidated securitization entities are estimated
based on quoted market prices or the present value of future cash flows using the Company’s and its subsidiaries’
market interest rates for the same contractual terms.
Cash and cash equivalents, trade receivables, short-term debt and trade payables
The carrying amount approximates the fair value because of the short maturity of these instruments.
Financial assets transferred to consolidated securitization entities
For the portion related to transferred mortgage loans receivable, the fair value is estimated based on the present value
of future cash flows.
Investments in securities, subordinated interests resulting from securitization and derivatives
Refer to note 28 for the methods and assumptions used to estimate the fair values.
The carrying amounts and estimated fair values of the financial instruments as of March 31, 2011 and 2010 are as
follows:
Millions of yen Thousands of U.S. dollars
2011 2010 2011
Carryingamounts
Estimatedfair values
Carryingamounts
Estimatedfair values
Carryingamounts
Estimatedfair values
Investments in securities: Short-term investments . . . . . . . . . . . . . ¥ 16,598 ¥ 16,598 ¥ 53,575 ¥ 53,575 $ 199,976 $ 199,976 Investments and advances . . . . . . . . . . 180,232 180,232 200,326 200,326 2,171,470 2,171,470 Financial assets transferred to consolidated securitization entities: . . . . . 186,742 196,543 — — 2,249,904 2,367,988
Derivatives (Effective Portion in Other Current Assets): Forward exchange contracts . . . . . . . . . 1,508 1,508 2,624 2,624 18,169 18,169 Cross currency swap agreements . . . . . 10,363 10,363 5,357 5,357 124,855 124,855 Interest rate swaps . . . . . . . . . . . . . . . . — — 3 3 — — Option contracts . . . . . . . . . . . . . . . . . . 28 28 1 1 337 337 Derivatives (Ineffective Portion in Other Current Assets): Forward exchange contracts . . . . . . . . . 563 563 407 407 6,783 6,783 Cross currency swap agreements . . . . . 1,084 1,084 3,268 3,268 13,060 13,060 Interest rate swaps . . . . . . . . . . . . . . . . — — — — — — Option contracts . . . . . . . . . . . . . . . . . . — — — — — —Derivatives (Effective Portion in Other Assets): Forward exchange contracts . . . . . . . . . 111 111 27 27 1,337 1,337 Cross currency swap agreements . . . . . 5,805 5,805 12,070 12,070 69,940 69,940 Interest rate swaps . . . . . . . . . . . . . . . . 1,092 1,092 999 999 13,157 13,157 Option contracts . . . . . . . . . . . . . . . . . . 66 66 — — 795 795 Derivatives (Ineffective Portion in Other Assets): Forward exchange contracts . . . . . . . . . — — 22 22 — — Cross currency swap agreements . . . . . 1,437 1,437 2,091 2,091 17,313 17,313 Interest rate swaps . . . . . . . . . . . . . . . . — — 11 11 — — Option contracts . . . . . . . . . . . . . . . . . . — — — — — —Subordinated interests resulting from securitization: Other current assets . . . . . . . . . . . . . . . 255 255 4,114 4,114 3,072 3,072 Advances and other . . . . . . . . . . . . . . . 33,811 33,811 111,303 111,303 407,361 407,361

114 Hitachi, Ltd. Annual Report 2011
Millions of yen Thousands of U.S. dollars
2011 2010 2011
Carryingamounts
Estimatedfair values
Carryingamounts
Estimatedfair values
Carryingamounts
Estimatedfair values
Long-term debt . . . . . . . . . . . . . . ¥(1,638,529 ) ¥(1,696,722) ¥(1,915,692) ¥(1,954,713) $(19,741,313) $(20,442,434)Non-recourse borrowings of consoli- dated securitization entities . . . . . (410,434) (413,519) — — (4,944,988) (4,982,157)
Derivatives (Effective Portion in Other Current Liabilities): Forward exchange contracts . . . (3,813 ) (3,813 ) (3,480 ) (3,480 ) (45,940) (45,940) Cross currency swap agreements . . . . . . . . . . . . . . . (268 ) (268 ) (488) (488) (3,229) (3,229) Interest rate swaps . . . . . . . . . . (323 ) (323 ) (701 ) (701 ) (3,892) (3,892) Option contracts . . . . . . . . . . . . (5) (5) (6) (6) (60) (60)Derivatives (Ineffective Portion in Other Current Liabilities): Forward exchange contracts . . . (547 ) (547 ) (721) (721) (6,590) (6,590) Cross currency swap agreements . . . . . . . . . . . . . . . (8 ) (8 ) — — (96) (96) Interest rate swaps . . . . . . . . . . (13 ) (13 ) (142 ) (142 ) (157) (157) Option contracts . . . . . . . . . . . . — — — — — —Derivatives (Effective Portion in Other Liabilities): Forward exchange contracts . . . (86 ) (86 ) (103 ) (103) (1,036) (1,036) Cross currency swap agreements . . . . . . . . . . . . . . . (305 ) (305 ) (228) (228 ) (3,675) (3,675) Interest rate swaps . . . . . . . . . . (2,915 ) (2,915 ) (4,076) (4,076) (35,120) (35,120) Option contracts . . . . . . . . . . . . — — — — — —Derivatives (Ineffective Portion in Other Liabilities): Forward exchange contracts . . . — — — — — — Cross currency swap agreements . . . . . . . . . . . . . . . (2,625 ) (2,625 ) (5,148) (5,148 ) (31,627) (31,627) Interest rate swaps . . . . . . . . . . (80 ) (80 ) (42) (42 ) (964) (964) Option contracts . . . . . . . . . . . . — — — — — —
It is not practicable to estimate the fair value of investments in unlisted stock because of the lack of a market price and
difficulty in estimating fair value without incurring excessive cost. The carrying amounts of these investments as of
March 31, 2011 and 2010 totaled ¥48,144 million ($580,048 thousand) and ¥48,222 million, respectively.
28. FAIR VALUE
ASC 820 establishes a fair value hierarchy that prioritizes the use of observable inputs in markets over the use of
unobservable inputs when measuring fair value as follows:
Level 1
Quoted prices for identical assets or liabilities in active markets.
Level 2
Quoted prices for similar assets or liabilities in active markets; quoted prices associated with transactions that are not
distressed for identical or similar assets or liabilities in markets that are not active; or valuations whose significant inputs
are derived from or corroborated by observable market data.

Hitachi, Ltd. Annual Report 2011 115
Level 3
Valuations using inputs that are not observable.
Investments in debt and equity securities
Investment securities of which quoted market prices are available to determine their fair value are included in Level 1.
Level 1 securities include available-for-sale securities such as listed stocks on exchange markets, debt securities such
as Japan treasury bonds and U.S. treasury bonds and exchange traded funds.
In the absence of an active market for investment securities, quoted prices for similar investment securities, quoted
prices associated with transactions that are not distressed for identical or similar investment securities or other relevant
information including market interest rate curves, referenced credit spreads or default rates, are used to determine fair
value. These investments are included in Level 2. Level 2 securities include short-term investments and available-for-
sale securities such as listed stocks traded over-the-counter, investment funds and debt securities traded over-the-
counter.
In infrequent circumstances, the significant inputs of fair value for investment securities are unobservable and the
Company mainly uses an income or market approach to corroborate relevant information provided by financial
institutions. These investments are included in Level 3. Level 3 securities include available-for-sale securities such as
subordinated debentures and structured bonds with little market activity.
Derivatives
Closing prices are used for derivatives included in Level 1, which are traded on active markets. The majority of
derivatives are traded on over-the-counter markets, which the Company does not deem to represent active markets.
Derivative assets and liabilities for which fair value is based on quoted prices associated with transactions that are not
distressed, in markets that are not active, or based on models using interest rate curves and forward and spot prices
for currencies and commodities are included in Level 2. Derivatives included in Level 2 primarily consist of interest rate
swaps, cross-currency swaps and foreign currency and commodity forward and option contracts. In infrequent
circumstances, the significant inputs of fair value are unobservable and the Company mainly uses an income or market
approach to corroborate relevant information provided by financial institutions. These derivatives are included in Level 3.
Subordinated interests resulting from securitization
When fair value is determined using observable inputs, including prices of recent transactions in markets that are not
distressed, subordinated interests are included in Level 2. When significant inputs are not observable, fair value is
determined based on economic assumptions used in measuring the fair value of the subordinated interests, including
weighted-average life, expected credit risks, and discount rates, and the subordinated interests are included in Level 3.

116 Hitachi, Ltd. Annual Report 2011
The following tables present the assets and liabilities that are measured at fair value on a recurring basis and the fair
value hierarchy classification as of March 31, 2011 and 2010. The carrying value on the consolidated balance sheets
are recorded by the fair value of these assets and liabilities.
Millions of yen
Fair value hierarchy classification
Total Balance Level 1 Level 2 Level 3
2011
Assets: Investments in securities Equity securities . . . . . . . . . . . . . . . . . . . . . . . . . . ¥145,816 ¥145,069 ¥ 747 ¥ — Government debt securities . . . . . . . . . . . . . . . . . . 3,232 3,219 13 — Corporate debt securities . . . . . . . . . . . . . . . . . . . 38,080 — 5,154 32,926 Other . . . . . . . . . . . . . . . . . . . . . . . . . . . . . . . . . . . 9,307 6,434 2,873 — Derivatives . . . . . . . . . . . . . . . . . . . . . . . . . . . . . . . . 22,057 — 22,057 — Subordinated interests resulting from securitization . . 34,066 — — 34,066
¥252,558 ¥154,722 ¥ 30,844 ¥ 66,992Liabilities: Derivatives . . . . . . . . . . . . . . . . . . . . . . . . . . . . . . . . ¥ (10,988) ¥ — ¥(10,988) ¥ —
Thousands of U.S. dollars
Fair value hierarchy classification
Total Balance Level 1 Level 2 Level 3
2011
Assets: Investments in securities Equity securities . . . . . . . . . . . . . . . . . . . . . . . . . . $1,756,819 $1,747,819 $ 9,000 $ — Government debt securities . . . . . . . . . . . . . . . . . . 38,940 38,783 157 — Corporate debt securities . . . . . . . . . . . . . . . . . . . 458,795 — 62,096 396,699 Other . . . . . . . . . . . . . . . . . . . . . . . . . . . . . . . . . . . 112,132 77,518 34,614 — Derivatives . . . . . . . . . . . . . . . . . . . . . . . . . . . . . . . . 265,747 — 265,747 — Subordinated interests resulting from securitization . . 410,434 — — 410,434
$3,042,867 $1,864,120 $ 371,614 $807,133 Liabilities: Derivatives . . . . . . . . . . . . . . . . . . . . . . . . . . . . . . . . $ (132,386) $ — $(132,386) $ —
Millions of yen
Fair value hierarchy classification
Total Balance Level 1 Level 2 Level 3
2010
Assets: Investments in securities Equity securities . . . . . . . . . . . . . . . . . . . . . . . . . . ¥159,850 ¥156,879 ¥ 2,971 ¥ — Government debt securities . . . . . . . . . . . . . . . . . . 44,156 43,989 167 — Corporate debt securities . . . . . . . . . . . . . . . . . . . 35,359 — 6,426 28,933 Other . . . . . . . . . . . . . . . . . . . . . . . . . . . . . . . . . . . 14,260 5,903 8,357 — Derivatives . . . . . . . . . . . . . . . . . . . . . . . . . . . . . . . . 26,880 — 26,880 — Subordinated interests resulting from securitization . . 115,417 — — 115,417
¥395,922 ¥206,771 ¥ 44,801 ¥144,350Liabilities: Derivatives . . . . . . . . . . . . . . . . . . . . . . . . . . . . . . . . ¥ (15,135) ¥ — ¥(15,135) ¥ —

Hitachi, Ltd. Annual Report 2011 117
The following table presents the changes in Level 3 instruments measured on a recurring basis for the year ended
March 31, 2011.
Millions of yen Thousands of U.S. dollars
Corporate debt
securities
Subordinatedinterestsresulting
fromsecuritization Total
Corporate debt
securities
Subordinatedinterestsresulting
fromsecuritization Total
2011 2011
Balance at beginning of year . . . . . . . . . . ¥28,933 ¥ 115,417 ¥ 144,350 $348,590 $ 1,390,567 $ 1,739,157
Effect of consolidation of securitization entities upon initial adoption of the amended provisions of ASC 810 (a) . . . — (113,651
) (113,651)
— (1,369,289) (1,369,289)
Purchases, sales, issuances and settlements, net . . . . . . . . . . . . . . . . . . 2,046 32,300 34,346 24,651 389,156 413,807 Total gains or losses (realized/unrealized) Included in earnings (b) . . . . . . . . . . . . 546 — 546 6,578 — 6,578 Included in other comprehensive loss . 1,401 — 1,401 16,880 — 16,880 Balance at end of year . . . . . . . . . . . . . . ¥32,926 ¥ 34,066 ¥ 66,992 $396,699 $ 410,434 $ 807,133 The amount of total gains or losses for the period included in earnings attributable to the change in unrealized gains or losses relating to assets still held at the reporting date . . . . . . . . . . . ¥ — ¥ — ¥ — $ — $ — $ —
(a) A portion of subordinated interests resulting from securitization was eliminated because of the consolidation of
securitization entities.
(b) Level 3 gains and losses (realized and unrealized) included in earnings for the year ended March 31, 2011 are
reported in other income (deductions) for corporate debt securities and are reported in revenue for subordinated
interests resulting from securitization.
The following table presents the changes in Level 3 instruments measured on a recurring basis for the year ended
March 31, 2010.
Millions of yen
Corporate debt
securities
Subordinatedinterestsresulting
fromsecuritization Total
2010
Balance at beginning of year . . . . . . . . . ¥26,532 ¥123,465 ¥149,997Purchases, sales, issuances and settlements, net . . . . . . . . . . . . . . (271) (11,275) (11,546)Total gains or losses (realized/unrealized) Included in earnings (a) . . . . . . . . . . . (15) 3,588 3,573 Included in other comprehensive loss . . . . . . . . . . . . . . . . . . . . . . . . . 2,687 (361) 2,326Balance at end of year . . . . . . . . . . . . . ¥28,933 ¥115,417 ¥144,350The amount of total gains or losses for the period included in earnings attributable to the change in unrealized gains or losses relating to assets still held at the reporting date . . . . . . . . . . ¥ (14) ¥ 3,534 ¥ 3,520

118 Hitachi, Ltd. Annual Report 2011
(a) Level 3 gains and losses (realized and unrealized) included in earnings for the year ended March 31, 2010 are
reported in other income (deductions) for corporate debt securities and are reported in revenue for subordinated
interests resulting from securitization.
Assets that are measured at fair value during the period on a non-recurring basis because they are deemed to be
impaired are not included in the above tables.
The Company has written down the carrying amount of certain equity-method and cost-method investments on the
consolidated balance sheets because the Company deems the decline of fair value to be other-than-temporary. The
fair value of the equity-method investments which are listed on an active market is included in Level 1. The fair value of
equity-method investments determined using an income approach, based on discounted cash flows using
unobservable inputs are included in Level 3. Also, a weighted-average fair value determined using both a market
approach and an income approach, which incorporate both observable inputs, such as quoted market prices of
comparable companies, and discounted cash flow using unobservable inputs, is included in Level 3. The Company
has calculated discounted cash flows of these equity-method investments based on business forecasts, market
trends, and assumptions of projected business plans. The Company uses both a market approach and an income
approach to determine the fair value of the cost-method investments. The fair value based on observable inputs such
as quoted market prices of similar investments is included in Level 2. The fair value primarily based on discounted cash
flows using unobservable inputs based on business forecasts, market trends, and assumptions of projected business
plans is included in Level 3.
The Company has also written down the carrying amount of long-lived assets on the consolidated balance sheets
mainly because the Company deems the carrying amount of certain long-lived assets is not recoverable and exceeds
its fair value. The Company mainly uses an income approach or a market approach to calculate the fair value of long-
lived assets. These measurements are included in Level 3 since they are based primarily on discounted cash flows
using unobservable inputs based on business forecasts, market trends, and assumptions of projected business plans.
The following table presents the assets measured at fair value on a non-recurring basis and the gains or losses
recognized for the year ended March 31, 2011.
Millions of yen
Fair value hierarchy classification Total gains(losses)Level 1 Level 2 Level 3
2011
Equity-method investments (a) . . . . . . . . . . . . . . . . . ¥1,712 ¥— ¥ — ¥ (4,741) Cost-method investments . . . . . . . . . . . . . . . . . . . . — — 8,066 (3,180)Long-lived assets (b) High Functional Materials & Components segment . . — — 7,755 (10,956) Components & Devices segment . . . . . . . . . . . . . — — 18,046 (16,561) Other . . . . . . . . . . . . . . . . . . . . . . . . . . . . . . . . . . — — 1,716 (7,653)Total . . . . . . . . . . . . . . . . . . . . . . . . . . . . . . . . . . . . . ¥1,712 ¥— ¥35,583 ¥(43,091)
Thousands of U.S. dollars
Fair value hierarchy classification Total gains(losses)Level 1 Level 2 Level 3
2011
Equity-method investments (a) . . . . . . . . . . . . . . . . . $20,627 $— $ — $ (57,120)Cost-method investments . . . . . . . . . . . . . . . . . . . . — — 97,181 (38,313)Long-lived assets (b) High Functional Materials & Components segment . . — — 93,434 (132,000) Components & Devices segment . . . . . . . . . . . . . — — 217,422 (199,530) Other . . . . . . . . . . . . . . . . . . . . . . . . . . . . . . . . . . — — 20,674 (92,206)Total . . . . . . . . . . . . . . . . . . . . . . . . . . . . . . . . . . . . . $20,627 $— $428,711 $(519,169)

Hitachi, Ltd. Annual Report 2011 119
(a) The carrying value as of March 31, 2011 is not equal to the fair value at the time of impairment because of equity
method adjustments subsequent to impairment.
(b) The carrying value as of March 31, 2011 is not equal to the fair value at the time of impairment because of
depreciation expense subsequent to impairment.
The following table presents the financial assets measured at fair value on a non-recurring basis and the gains or
losses recognized for the year ended March 31, 2010.
Millions of yen
Fair value hierarchy classification Total gains(losses)Level 1 Level 2 Level 3
2010
Equity-method investments (a) . . . . . . . . . . . . . . . . . ¥511 ¥— ¥ 86,100 ¥(15,169)Cost-method investments . . . . . . . . . . . . . . . . . . . . — — 1,273 (1,005)Long-lived assets (b) Components & Devices segment . . . . . . . . . . . . . — — 47,976 (18,611) Other . . . . . . . . . . . . . . . . . . . . . . . . . . . . . . . . . . — — 5,856 (6,585)Total . . . . . . . . . . . . . . . . . . . . . . . . . . . . . . . . . . . . . ¥511 ¥— ¥141,205 ¥(41,370)
(a) The carrying value as of March 31, 2010 is not equal to the fair value at the time of impairment because of equity
method adjustments subsequent to impairment.
(b) The carrying value as of March 31, 2010 is not equal to the fair value at the time of impairment because of
depreciation expense subsequent to impairment.
29. FINANCING RECEIVABLES AND ALLOWANCE FOR DOUBTFUL RECEIVABLES
Financing receivables from equipment leases, installment arrangements, mortgage loans, and other receivables with a
contractual maturity of one year or more are subject to disclosure as reported in this note. Trade receivables from sale
of products or services that have a contractual maturity of one year or less are excluded from financing receivables.
Finance lease receivables are recorded based on the total minimum payments to be received and unguaranteed
residual values less executory costs and unearned income. Installment loans, mortgage loans and other long-term
receivables are reported on the amortized cost basis.
The Company classifies financing receivables aggregated and categorized as finance leases, installment loans,
mortgage loans, and other, based on the nature of risks and characteristics as described below.
Finance leases are receivables from lease arrangements, including products manufactured by the Company and
certain of its subsidiaries, such as information technology equipment, manufacturing machinery and equipment and
construction machinery, typically secured by underlying assets. The primary locations of finance leases are Japan,
United States, United Kingdom and China mainland. The lease term ranges from three to six years. The non-specific
allowance for doubtful receivables is collectively determined on the basis of past collection experience, consideration of
current economic conditions and changes in our customer collection trends as well as other factors that may affect the
customers’ ability to pay.
Installment loans represent receivables from arrangements with customers and dealers to provide financing primarily
for products manufactured by the Company and certain of its subsidiaries, such as manufacturing machinery.
Installment loans are typically secured by underlying assets. The primary locations of installment loans are Japan,
United States and United Kingdom. The loan term is generally less than three years. The non-specific allowance is
collectively determined on the basis of past collection experience, consideration of current economic conditions and
changes in our customer collection trends as well as other factors that may affect the customers’ ability to pay.

120 Hitachi, Ltd. Annual Report 2011
Mortgage loans are financing receivables from residential loan arrangements for individuals. Mortgage loans are usually
arranged with collateral. The primary location of mortgage loans is Japan; more than fifty percent of mortgage loans
are arranged for employees of the Company and its domestic subsidiaries. The term of mortgage loans is usually less
than 30 years. The non-specific allowance is collectively determined on the basis of past collection experience,
consideration of current economic conditions and changes in our customer collection trends as well as other factors
that may affect the customers’ ability to pay.
The subsidiaries in the financial services segment also provide services such as factoring, loan servicing, and other
forms of commercial financing. Financing receivables resulting from those services are classified into “other” category.
The contractual maturities associated with those services generally range over one to three years. The non-specific
allowance is collectively determined on the basis of past collection experience, consideration of current economic
conditions and changes in our customer collection trends as well as other factors that may affect the customers’ ability
to pay.
Also, common to all financing receivables, the Company and its subsidiaries individually evaluate collectability of
financing receivables either by discounted cash flow analyses when they determine principal and interest of a financing
receivable cannot be collected or by estimating the fair value of related collateral when applicable and further
estimating the allowance for doubtful receivables. The Company and its subsidiaries have proprietary credit quality
indicators appropriate to the unique characteristics of their operations and the nature of their financing receivable
portfolios. Based on such indicators as the duration of overdue payments, the unpaid amounts, the existence of
extended payment terms, evaluation by third-party credit agencies, and the degree of debtors’ excessive debt, the
Company and its subsidiaries classify and monitor their financial receivables into two categories: the individually
evaluated receivables, and the collectively evaluated receivables.
Interest income for long-term financing receivables is recognized on the accrual basis.
As of March 31, 2011, financing receivables include past due receivables in the amount of ¥9,714 million ($117,036
thousand). Of this amount, financing receivables past due 90 days or more and still accruing interest amounted to
¥2,846 million ($34,289 thousand).
The following table presents allowance for doubtful receivables and recorded investment in financing receivables as of
March 31, 2011, and changes in the allowance for the three months ended March 31, 2011.
Millions of yen
Finance leases Installment loans Mortgage loans Other Total
Allowance for doubtful receivablesBalance, January 1, 2011 . . . . . . . . . . . . . . ¥ 5,156 ¥ 2,426 ¥ 176 ¥ 5,940 ¥ 13,698 Provision . . . . . . . . . . . . . . . . . . . . . . . . . 1,531 293 102 3,709 5,635 Recovery and other . . . . . . . . . . . . . . . . . (340) (70) (47) (1,073) (1,530) Write off . . . . . . . . . . . . . . . . . . . . . . . . . (211) (229) — (734) (1,174)Balance, March 31, 2011 . . . . . . . . . . . . . . ¥ 6,136 ¥ 2,420 ¥ 231 ¥ 7,842 ¥ 16,629 Applicable to amounts; Individually evaluated for impairment . . . 1,620 906 88 5,082 7,696
Applicable to amounts; Collectively evaluated for impairment . . . 4,516 1,514 143 2,760 8,933
Financing receivablesBalance, March 31, 2011 . . . . . . . . . . . . . . ¥873,137 ¥126,957 ¥218,222 ¥217,515 ¥1,435,831 Applicable to amounts; Individually evaluated for impairment . . . 4,515 1,252 1,113 9,718 16,598
Applicable to amounts; Collectively evaluated for impairment . . . 868,622 125,705 217,109 207,797 1,419,233

Hitachi, Ltd. Annual Report 2011 121
Thousands of U.S. dollars
Finance leases Installment loans Mortgage loans Other Total
Allowance for doubtful receivablesBalance, January 1, 2011 . . . . . . . . . . . . . . $ 62,120 $ 29,229 $ 2,120 $ 71,567 $ 165,036 Provision . . . . . . . . . . . . . . . . . . . . . . . . . 18,446 3,530 1,229 44,687 67,892 Recovery and other . . . . . . . . . . . . . . . . . (4,096) (843) (566) (12,929) (18,434) Write off . . . . . . . . . . . . . . . . . . . . . . . . . (2,542) (2,759) — (8,844) (14,145) Balance, March 31, 2011 . . . . . . . . . . . . . . $ 73,928 $ 29,157 $ 2,783 $ 94,481 $ 200,349 Applicable to amounts; Individually evaluated for impairment . . . 19,518 10,916 1,060 61,229 92,723
Applicable to amounts; Collectively evaluated for impairment . . . 54,410 18,241 1,723 33,252 107,626
Financing receivablesBalance, March 31, 2011 . . . . . . . . . . . . . . $10,519,723 $1,529,602 $2,629,181 $2,620,663 $17,299,169 Applicable to amounts; Individually evaluated for impairment . . . 54,398 15,084 13,410 117,084 199,976
Applicable to amounts; Collectively evaluated for impairment . . . 10,465,325 1,514,518 2,615,771 2,503,579 17,099,193
In addition, as of March 31, 2011, the amount of impaired loans relating to receivables which arose from sales of
product or services and have contractual maturity of one year or less is ¥43,628 million ($525,639 thousand).
30. ACQUISITIONS AND DIVESTITURES
On March 9, 2011, Hitachi Transport System, Ltd. (Hitachi Transport System), a subsidiary of the Company included in
the Others category of segment information, announced its decision to purchase shares of Vantec Corporation
(Vantec), through a tender offer to make Vantec its subsidiary. The tender offer price was ¥233,500 ($2,813) per share,
which was determined by comprehensively taking into consideration the market price of Vantec’s common stock,
Vantec’s financial condition, future earnings prospects and a valuation of Vantec stock conducted by a third party
appraiser. The price included a premium of approximately 93% over the average share price of Vantec’s common
stock traded on the First Section of the Tokyo Stock Exchange for the three month period ended March 8, 2011. As a
result, Hitachi Transport System purchased 209,550 shares in the tender offer, for ¥48,930 million ($589,518 thousand)
in the period from March 10, 2011 through April 19, 2011, resulting in an acquisition of 90.12% of the voting rights.
Accordingly, Hitachi Transport System obtained control of Vantec and it became a consolidated subsidiary effective
April 26, 2011, the settlement date of the tender offer (the acquisition date).
Vantec operates warehousing and transportation related business. Hitachi Transport System made the acquisition to
realize synergy in the system logistics and global business and improve the enterprise value of Hitachi Transport
System and Vantec.

122 Hitachi, Ltd. Annual Report 2011
The following table presents the consideration paid for Vantec and the fair value as of the acquisition date of the
noncontrolling interest in Vantec. Due to the limited period of time since the acquisition date, the initial accounting for
the business combination is incomplete at this time. As a result, the Company is unable to provide the disclosures
related to the amounts recognized as of the acquisition date for each major class of assets acquired and liabilities
assumed, and the amount of goodwill.
Millions of yenThousands of
U.S. dollars
Cash paid for acquisition . . . . . . . . . . . . . . . . . . . . . . . . . . . . . . . . . . . . . . . . . ¥48,930 $589,518 Fair value of noncontrolling interests . . . . . . . . . . . . . . . . . . . . . . . . . . . . . . . . . 3,622 43,639
¥52,552 $633,157
The fair value of the noncontrolling interest in Vantec, a listed entity, is determined by quoted market price and included
in Level 1.
On a pro forma basis, the effect on revenue, net income and the per share information of the Company for the year
ended March 31, 2011 with assumed acquisition dates for Vantec of April 1, 2010 would not be material.
On November 8, 2010, Hitachi Medical Corporation (Hitachi Medical), a subsidiary of the Company in the Electronic
Systems & Equipment segment, announced its decision to purchase additional shares of Aloka Co., Ltd. (Aloka),
through a tender offer to make Aloka its subsidiary. The tender offer price was ¥1,075 ($13) per share, which was
determined by comprehensively taking into consideration the market price of Aloka’s common stock, Aloka’s financial
condition, future earnings prospects and a valuation of Aloka stock conducted by a third party appraiser.
As a result, Hitachi Medical purchased 23,157,518 shares in the tender offer, for ¥24,894 million ($299,928 thousand)
in the period from November 9, 2010 through December 27, 2010, resulting in a 84.65% increase of Hitachi Medical’s
ownership from 12.79% to 97.45%. Accordingly, Hitachi Medical obtained control of Aloka and it became a
consolidated subsidiary effective January 5, 2011, the settlement date of the tender offer (the acquisition date). Further,
Hitachi Medical converted Aloka into its wholly owned subsidiary through a share exchange effective March 3, 2011,
and Aloka was subsequently renamed Hitachi Aloka Medical, Ltd. effective April 1, 2011.
Aloka manufactures and sells medical instruments, general-purpose analysis devices and medical analysis devices.
Hitachi Medical made the acquisition to strengthen its diagnostic ultrasound device businesses and increase its
corporate value.
This business combination was accounted for as a bargain purchase because the consideration paid for was less than
the fair value of Aloka’s net assets.
The following table summarizes the consideration paid for Aloka, the assets acquired and liabilities assumed and
recognized as of the acquisition, as well as the fair value as of the acquisition date of the noncontrolling interest in
Aloka.
Millions of yenThousands of
U.S. dollars
Current assets . . . . . . . . . . . . . . . . . . . . . . . . . . . . . . . . . . . . . . . . . . . . . . . . . ¥ 43,346 $ 522,241 Non-current assets (excluding intangible assets) . . . . . . . . . . . . . . . . . . . . . . . . 9,585 115,482 Intangible assets . . . . . . . . . . . . . . . . . . . . . . . . . . . . . . . . . . . . . . . . . . . . . . . . 1,811 21,819
54,742 659,542 Current liabilities . . . . . . . . . . . . . . . . . . . . . . . . . . . . . . . . . . . . . . . . . . . . . . . . (13,740) (165,542)Non-current liabilities . . . . . . . . . . . . . . . . . . . . . . . . . . . . . . . . . . . . . . . . . . . . (2,987) (35,988)
(16,727) (201,530)Gain on the bargain purchase . . . . . . . . . . . . . . . . . . . . . . . . . . . . . . . . . . . . . . (8,684) (104,627)Previously acquired equity interest measured at fair value . . . . . . . . . . . . . . . . . (3,699) (44,566)Cash paid for acquisition . . . . . . . . . . . . . . . . . . . . . . . . . . . . . . . . . . . . . . . . . (24,894) (299,928)Fair value of noncontrolling interests . . . . . . . . . . . . . . . . . . . . . . . . . . . . . . . . . (738) (8,891)
¥(29,331) $(353,385)

Hitachi, Ltd. Annual Report 2011 123
The acquired intangible assets include patents and brands.
The Company recognized a gain of ¥1,224 million ($14,747 thousand) as a result of remeasuring its equity interest in
Aloka held before the business combination at the acquisition date fair value. The gain is included in other income in
the Company’s consolidated statement of operations for the year ended March 31, 2011.
The fair value of both the equity interest held in Aloka before the business combination and the fair value of the
noncontrolling interest in Aloka, a listed entity, are determined by quoted market price and included in Level 1.
The results of operations of Aloka for the period from the acquisition date to March 31, 2011 were not material.
On a pro forma basis, revenue, net income (loss) and the per share information of the Company with assumed
acquisition dates for Aloka of April 1, 2010 and 2009 would not differ materially from the amounts reported in the
accompanying consolidated financial statements as of and for the years ended March 31, 2011 and 2010.
On March 7, 2011, the Company announced that it had entered into a definitive agreement to transfer its Hard Disc
Drive business, in the Components & Devices segment, to Western Digital Corporation (WD). The Company will sell all
shares of Hitachi Global Storage Technologies’ holding company, Viviti Technologies Ltd. to WD in a cash and stock
transaction valued at approximately US$4.3 billion. Under the terms, the Company will own approximately 10 percent
of WD shares and hold two seats on WD’s board of directors. The transaction is expected to close during the year
ending March 31, 2012. The closing of the transaction is dependent upon progress of various multi jurisdictional
regulatory reviews over this business combination.
On March 30, 2010, Hitachi Construction Machinery Co., Ltd. (Hitachi Construction Machinery), a subsidiary of the
Company in the Construction Machinery segment, agreed with Tata Motors Limited to purchase an additional 20%
interest in Telco Construction Equipment Co., Ltd. (Telcon). As a result, Hitachi Construction Machinery purchased a
total of 20,000,000 shares for ¥23,704 million on March 30, 2010, resulting in the percentage of Hitachi Construction
Machinery’s ownership interests in Telcon increasing from 40.0% to 60.0%. Accordingly, Hitachi Construction
Machinery obtained control over Telcon and it became a consolidated subsidiary effective March 30, 2010 (the
acquisition date).
Telcon manufactures and sells major construction machinery including hydraulic excavators, backhoe loaders and
wheel loaders. Hitachi Construction Machinery decided to purchase an additional 20% interest to obtain a strong lead
in the India market, which is expected to grow significantly.
The following table summarizes the consideration paid for Telcon, the assets acquired and liabilities assumed and
recognized as of the acquisition, as well as the fair value as of the acquisition date of the noncontrolling interest in
Telcon.
Millions of yen
Current assets . . . . . . . . . . . . . . . . . . . . . . . . . . . . . . . . . . . . . . . . . . . . . . . . . . . . . . . . . . . . . . . . ¥ 29,741Non-current assets (excluding intangible assets) . . . . . . . . . . . . . . . . . . . . . . . . . . . . . . . . . . . . . . . 16,912Intangible assets (excluding goodwill) . . . . . . . . . . . . . . . . . . . . . . . . . . . . . . . . . . . . . . . . . . . . . . . 37,370Goodwill (not deductible for tax purposes) . . . . . . . . . . . . . . . . . . . . . . . . . . . . . . . . . . . . . . . . . . . 32,981
117,004Current liabilities . . . . . . . . . . . . . . . . . . . . . . . . . . . . . . . . . . . . . . . . . . . . . . . . . . . . . . . . . . . . . . (35,105)Non-current liabilities . . . . . . . . . . . . . . . . . . . . . . . . . . . . . . . . . . . . . . . . . . . . . . . . . . . . . . . . . . . (14,095)
(49,200)Previously acquired equity interest measured at fair value . . . . . . . . . . . . . . . . . . . . . . . . . . . . . . . . (22,050)Cash paid for acquisition . . . . . . . . . . . . . . . . . . . . . . . . . . . . . . . . . . . . . . . . . . . . . . . . . . . . . . . . (23,704)Fair value of noncontrolling interests . . . . . . . . . . . . . . . . . . . . . . . . . . . . . . . . . . . . . . . . . . . . . . . . (22,050)
¥ (67,804)

124 Hitachi, Ltd. Annual Report 2011
The following table shows the acquired intangible assets subject to amortization and not subject to amortization.
Millions of yen
Weighted average amortizationPeriod (year)
The acquired intangible assets subject to amortization Customer contracts and relationships . . . . . . . . . . . . . . . . . . . . . . . . . . . . . . ¥19,509 25 Dealer network . . . . . . . . . . . . . . . . . . . . . . . . . . . . . . . . . . . . . . . . . . . . . . . 4,339 15 Technical know-how . . . . . . . . . . . . . . . . . . . . . . . . . . . . . . . . . . . . . . . . . . . 3,056 6 Favorable lease agreements . . . . . . . . . . . . . . . . . . . . . . . . . . . . . . . . . . . . . 1,027 5
27,931The acquired intangible assets not subject to amortization Brands . . . . . . . . . . . . . . . . . . . . . . . . . . . . . . . . . . . . . . . . . . . . . . . . . . . . . 9,439 —
¥37,370
Since the evaluation of the fair values of the assets and liabilities was completed during the year ended March 31,
2011, the Company retrospectively adjusted the provisional amounts as of the acquisition date. As a result, the
amounts of other intangible assets and related deferred tax liability, which is included in other liabilities, increased by
¥37,370 million and ¥12,702 million, respectively, whereas goodwill decreased by ¥24,668 million in the consolidated
balance sheet as of March 31, 2010.
The Company recognized a gain of ¥14,923 million as a result of remeasuring to fair value its 40% equity interest in
Telcon held before the business combination. The gain is included in other deductions in the Company’s consolidated
statement of operations for the year ended March 31, 2010.
The fair value of both the equity interest held before the business combination and the noncontrolling interest in Telcon,
a private entity, were estimated by applying the income approach. These fair value measurements are based on
significant inputs that are not observable in the market and thus represent Level 3 measurements. Key inputs include
business forecasts, market trends, assumptions of projected business plans and adjustments because of the lack of
control that market participants would consider when estimating the fair value of the noncontrolling interest in Telcon.
The results of operations of Telcon for the period from the acquisition date to March 31, 2010 were not material.
On a pro forma basis, revenue, net loss and the per share information of the Company with assumed acquisition dates
for Telcon of April 1, 2009 and 2008 would not differ materially from the amounts reported in the accompanying
consolidated financial statements as of and for the years ended March 31, 2010 and 2009.
On January 14, 2009, the Company announced its decision to purchase additional shares of Hitachi Kokusai Electric
Inc. (Hitachi Kokusai Electric), an equity method affiliate, through a tender offer to make Hitachi Kokusai Electric its
subsidiary for the purpose of establishing a stable equity-based relationship and strengthening the cooperative
relationship in the fields of communications and video, and broadcasting systems businesses. Hitachi Kokusai
Electric’s Board of Directors resolved to approve the tender offer at the meeting held on the same day. The price of the
tender offer was ¥780 per share, which was determined by comprehensively taking into consideration the market price
of Hitachi Kokusai Electric’s common stock, Hitachi Kokusai Electric’s financial condition, future earnings prospects
and a valuation of Hitachi Kokusai Electric stock conducted by a third party appraiser. The price included a premium of
approximately 77% over the average share price of Hitachi Kokusai Electric’s common stock traded on the First
Section of the Tokyo Stock Exchange for the three month period ended January 13, 2009. As a result, the Company
purchased 13,406,000 shares, the upper limit for the number of shares in the tender offer, for ¥10,456 million in the
period from January 26, 2009 through March 11, 2009, resulting in the Company’s ownership increasing from 38.8%
to 51.6%. Accordingly, the Company obtained control over Hitachi Kokusai Electric and it became a consolidated
subsidiary of the Company. Therefore, the Company has consolidated Hitachi Kokusai Electric as of March 31, 2009 in
the consolidated balance sheet. The results of operations of Hitachi Kokusai Electric for the period from the acquisition
date to March 31, 2009 were not material.

Hitachi, Ltd. Annual Report 2011 125
Accordingly, the results of operations of Hitachi Kokusai Electric have been consolidated since the year beginning April
1, 2009.
As a result of the purchase price allocation, the Company did not recognize any goodwill.
On a pro forma basis, revenue, net loss and the per share information of the Company with assumed acquisition date
for Hitachi Kokusai Electric of April 1, 2008 would not differ materially from the amounts reported in the accompanying
consolidated financial statements as of and for the year ended March 31, 2009.
On January 14, 2009, the Company also announced its decision to purchase additional shares of Hitachi Koki Co.,
Ltd. (Hitachi Koki), an equity method affiliate, through a tender offer to make Hitachi Koki its subsidiary for the purpose
of establishing a stable equity-based relationship and strengthening the cooperative relationship in business expansion
on a global scale and research and development into lithium-ion battery-operated products. Hitachi Koki’s Board of
Directors resolved to approve the tender offer at the meeting held on the same day. The price of the tender offer was
¥1,300 per share, which was determined by comprehensively taking into consideration the market price of Hitachi
Koki’s common stock, Hitachi Koki’s financial condition, future earnings prospects and a valuation of Hitachi Koki stock
conducted by a third party appraiser. The price included a premium of approximately 77% over the average share price
of Hitachi Koki’s common stock traded on the First Section of the Tokyo Stock Exchange for the three month period
ended January 13, 2009. As a result, the Company purchased 12,473,000 shares, the upper limit for the number of
shares in the tender offer, for ¥16,214 million in the period from January 26, 2009 through March 9, 2009, resulting in
the Company’s ownership increasing from 38.9% to 51.2%. Accordingly, the Company obtained control over Hitachi
Koki and it became a consolidated subsidiary of the Company. Therefore, the Company has consolidated Hitachi Koki
as of March 31, 2009 in the consolidated balance sheet. The results of operations of Hitachi Koki for the period from
the acquisition date to March 31, 2009 were not material. Accordingly, the results of operations of Hitachi Koki have
been consolidated since the year beginning April 1, 2009.
As a result of the purchase price allocation, the Company did not recognize any goodwill.
On a pro forma basis, revenue, net loss and the per share information of the Company with assumed acquisition date
for Hitachi Koki of April 1, 2008 would not differ materially from the amounts reported in the accompanying
consolidated financial statements as of and for the year ended March 31, 2009.
31. SEGMENT INFORMATION
Business Segments
The operating segments of the Company are the components for which separate financial information is available and
for which segment profit or loss amounts are evaluated regularly by the chief operating decision maker in deciding how
to allocate resources and in assessing performance. The Company has aggregated certain operating segments into
reportable segments for reporting purpose, since such aggregation helps financial statement users better understand
the Company’s performance.
The reportable segments correspond to categories of activities classified primarily by markets, products and services.
The Company discloses its business in eleven reportable segments: Information & Telecommunication Systems, Power
Systems, Social Infrastructure & Industrial Systems, Electronic Systems & Equipment, Construction Machinery, High
Functional Materials & Components, Automotive Systems, Components & Devices, Digital Media & Consumer
Products, Financial Services, and Others.

126 Hitachi, Ltd. Annual Report 2011
The primary products and services included in each segment are as follows:
Information & Telecommunication Systems:
Systems integration, Outsourcing services, Software, Disk array subsystems, Servers, Mainframes, Telecommunication
equipment and ATMs
Power Systems:
Thermal power generation systems, Nuclear power generation systems, Hydroelectric power generation systems and
Wind power generation systems
Social Infrastructure & Industrial Systems:
Industrial machinery and plants, Elevators, Escalators and Railway vehicles and systems
Electronic Systems & Equipment:
Semiconductor and LCDs manufacturing equipment, Test and measurement equipment, Medical electronics
equipment, Power tools and Electronic parts manufacturing system
Construction Machinery:
Hydraulic excavators, Wheel loaders and Mining dump trucks
High Functional Materials & Components:
Wires and cables, Copper products, Semiconductor and display related materials, Circuit boards and materials,
Specialty steels, Magnetic materials and components and High grade casting components and materials
Automotive Systems:
Engine management systems, Electric powertrain systems, Drive control systems and Car information systems
Components & Devices:
Hard disk drives, LCDs, Information storage media and Batteries
Digital Media & Consumer Products:
Optical disk drives, Flat-panel TVs, LCD projectors, Room air conditioners, Refrigerators, Washing machines and Air-
conditioning equipment
Financial Services:
Leasing and Loan guarantees
Others:
Logistics, Property management and others
The following tables show business segment information for the years ended March 31, 2011, 2010 and 2009, and as
of March 31, 2011, 2010 and 2009.

Hitachi, Ltd. Annual Report 2011 127
Revenues from Outside Customers
Millions of yenThousands of
U.S. dollars
2011 2010 2009 2011
Information & Telecommunication Systems . . . . . . ¥1,475,588 ¥1,522,457 ¥ 1,730,818 $ 17,778,169 Power Systems . . . . . . . . . . . . . . . . . . . . . . . . . . 737,560 805,007 777,833 8,886,265 Social Infrastructure & Industrial Systems . . . . . . . 932,299 1,044,208 1,077,548 11,232,518 Electronic Systems & Equipment . . . . . . . . . . . . . 942,305 868,449 830,080 11,353,072 Construction Machinery . . . . . . . . . . . . . . . . . . . . 746,166 578,129 717,251 8,989,952 High Functional Materials & Components . . . . . . . 1,329,234 1,176,292 1,467,934 16,014,868 Automotive Systems . . . . . . . . . . . . . . . . . . . . . . . 733,910 633,399 667,094 8,842,289 Components & Devices . . . . . . . . . . . . . . . . . . . . 743,980 690,062 904,944 8,963,614 Digital Media & Consumer Products . . . . . . . . . . . 882,834 863,091 1,006,017 10,636,554 Financial Services . . . . . . . . . . . . . . . . . . . . . . . . . 325,341 327,072 324,540 3,919,771 Others . . . . . . . . . . . . . . . . . . . . . . . . . . . . . . . . . 465,871 457,315 491,642 5,612,904 Subtotal . . . . . . . . . . . . . . . . . . . . . . . . . . . . . . 9,315,088 8,965,481 9,995,701 112,229,976 Corporate items . . . . . . . . . . . . . . . . . . . . . . . . . . 719 3,065 4,668 8,663 Total . . . . . . . . . . . . . . . . . . . . . . . . . . . . . . . . . ¥9,315,807 ¥8,968,546 ¥10,000,369 $112,238,639
Revenues from Intersegment Transactions
Millions of yenThousands of
U.S. dollars
2011 2010 2009 2011
Information & Telecommunication Systems . . . . . . ¥ 176,452 ¥ 183,130 ¥ 214,533 $ 2,125,927 Power Systems . . . . . . . . . . . . . . . . . . . . . . . . . . 75,647 77,128 84,556 911,410 Social Infrastructure & Industrial Systems . . . . . . . 224,637 206,017 256,698 2,706,470 Electronic Systems & Equipment . . . . . . . . . . . . . 137,050 130,183 153,741 1,651,205 Construction Machinery . . . . . . . . . . . . . . . . . . . . 5,221 5,507 7,438 62,904 High Functional Materials & Components . . . . . . . 78,919 73,035 93,111 950,831 Automotive Systems . . . . . . . . . . . . . . . . . . . . . . . 3,991 5,429 14,656 48,085 Components & Devices . . . . . . . . . . . . . . . . . . . . 65,872 64,827 73,353 793,639 Digital Media & Consumer Products . . . . . . . . . . . 68,762 66,167 97,843 828,458 Financial Services . . . . . . . . . . . . . . . . . . . . . . . . . 47,640 92,578 76,777 573,976 Others 301,592 306,350 339,192 3,633,638 Subtotal . . . . . . . . . . . . . . . . . . . . . . . . . . . . . . 1,185,783 1,210,351 1,411,898 14,286,543 Eliminations and Corporate items . . . . . . . . . . . . . (1,185,783) (1,210,351) (1,411,898) (14,286,543) Total . . . . . . . . . . . . . . . . . . . . . . . . . . . . . . . . . ¥ — ¥ — ¥ — $ —
Total Revenues
Millions of yenThousands of
U.S. dollars
2011 2010 2009 2011
Information & Telecommunication Systems . . . . . . ¥ 1,652,040 ¥ 1,705,587 ¥ 1,945,351 $ 19,904,096 Power Systems . . . . . . . . . . . . . . . . . . . . . . . . . . 813,207 882,135 862,389 9,797,675 Social Infrastructure & Industrial Systems . . . . . . . 1,156,936 1,250,225 1,334,246 13,938,988 Electronic Systems & Equipment . . . . . . . . . . . . . 1,079,355 998,632 983,821 13,004,277 Construction Machinery . . . . . . . . . . . . . . . . . . . . 751,387 583,636 724,689 9,052,856 High Functional Materials & Components . . . . . . . 1,408,153 1,249,327 1,561,045 16,965,699 Automotive Systems . . . . . . . . . . . . . . . . . . . . . . . 737,901 638,828 681,750 8,890,374 Components & Devices . . . . . . . . . . . . . . . . . . . . 809,852 754,889 978,297 9,757,253 Digital Media & Consumer Products . . . . . . . . . . . 951,596 929,258 1,103,860 11,465,012 Financial Services . . . . . . . . . . . . . . . . . . . . . . . . . 372,981 419,650 401,317 4,493,747 Others . . . . . . . . . . . . . . . . . . . . . . . . . . . . . . . . . 767,463 763,665 830,834 9,246,542 Subtotal . . . . . . . . . . . . . . . . . . . . . . . . . . . . . . 10,500,871 10,175,832 11,407,599 126,516,519 Eliminations and Corporate items . . . . . . . . . . . . . (1,185,064) (1,207,286) (1,407,230) (14,277,880) Total . . . . . . . . . . . . . . . . . . . . . . . . . . . . . . . . . ¥ 9,315,807 ¥ 8,968,546 ¥10,000,369 $112,238,639

128 Hitachi, Ltd. Annual Report 2011
Segment Profit (Loss)
Millions of yenThousands of
U.S. dollars
2011 2010 2009 2011
Information & Telecommunication Systems . . . . . . ¥ 98,641 ¥ 94,592 ¥ 138,452 $1,188,446 Power Systems . . . . . . . . . . . . . . . . . . . . . . . . . . 22,022 22,075 3,485 265,325 Social Infrastructure & Industrial Systems . . . . . . . 39,952 42,086 34,406 481,349 Electronic Systems & Equipment . . . . . . . . . . . . . 37,284 (5,218) 25,755 449,205 Construction Machinery . . . . . . . . . . . . . . . . . . . . 49,192 17,649 51,337 592,675 High Functional Materials & Components . . . . . . . 84,506 44,412 25,257 1,018,145 Automotive Systems . . . . . . . . . . . . . . . . . . . . . . . 23,791 (5,486) (60,507) 286,638 Components & Devices . . . . . . . . . . . . . . . . . . . . 43,652 1,149 5,799 525,928 Digital Media & Consumer Products . . . . . . . . . . . 14,949 (7,206) (110,548) 180,108 Financial Services . . . . . . . . . . . . . . . . . . . . . . . . . 14,255 8,518 6,660 171,747 Others . . . . . . . . . . . . . . . . . . . . . . . . . . . . . . . . . 28,930 19,423 24,515 348,554 Subtotal . . . . . . . . . . . . . . . . . . . . . . . . . . . . . . 457,174 231,994 144,611 5,508,120 Eliminations and Corporate items . . . . . . . . . . . . . (12,666) (29,835) (17,465) (152,602) Total Segment profit . . . . . . . . . . . . . . . . . . . . . 444,508 202,159 127,146 5,355,518
Impairment losses for long-lived assets. . . . . . . . . (35,170) (25,196) (128,400) (423,735)Restructuring charges . . . . . . . . . . . . . . . . . . . . . (5,757) (25,154) (22,927) (69,361)Interest income . . . . . . . . . . . . . . . . . . . . . . . . . . . 13,267 12,017 19,177 159,843 Dividends income . . . . . . . . . . . . . . . . . . . . . . . . . 4,240 5,799 8,544 51,084 Gains on sales of stock by subsidiaries or affiliated companies . . . . . . . . . . . . . . . . . . . . . . — 183 360 —Other income . . . . . . . . . . . . . . . . . . . . . . . . . . . . 69,730 186 5,203 840,121 Interest charges . . . . . . . . . . . . . . . . . . . . . . . . . . (24,878) (26,252) (33,809) (299,735)Other deductions . . . . . . . . . . . . . . . . . . . . . . . . . (13,597) (21,976) (102,960) (163,819)Equity in net loss of affiliated companies . . . . . . . . (20,142) (58,186) (162,205) (242,675)Income (loss) before income taxes . . . . . . . . . . . . ¥432,201 ¥ 63,580 ¥(289,871) $5,207,241
Intersegment transactions are recorded at the same prices used in transactions with third parties. Corporate items
include unallocated corporate expenses, such as leading edge R&D expenditures, and others.
Total Assets
Millions of yenThousands of
U.S. dollars
2011 2010 2009 2011
Information & Telecommunication Systems . . . . . . ¥ 1,289,099 ¥ 1,261,016 ¥ 1,468,481 $ 15,531,313 Power Systems . . . . . . . . . . . . . . . . . . . . . . . . . . 919,676 1,067,072 1,026,637 11,080,434 Social Infrastructure & Industrial Systems . . . . . . . 1,033,110 971,743 1,098,712 12,447,109 Electronic Systems & Equipment . . . . . . . . . . . . . 867,741 820,700 829,126 10,454,711 Construction Machinery . . . . . . . . . . . . . . . . . . . . 1,000,793 927,482 840,693 12,057,747 High Functional Materials & Components . . . . . . . 1,267,001 1,264,372 1,232,271 15,265,072 Automotive Systems . . . . . . . . . . . . . . . . . . . . . . . 451,382 459,183 450,966 5,438,337 Components & Devices . . . . . . . . . . . . . . . . . . . . 592,992 585,999 640,824 7,144,482 Digital Media & Consumer Products . . . . . . . . . . . 434,397 521,591 570,935 5,233,699 Financial Services . . . . . . . . . . . . . . . . . . . . . . . . . 1,937,643 1,789,409 1,914,863 23,345,096 Others . . . . . . . . . . . . . . . . . . . . . . . . . . . . . . . . . 1,344,356 1,374,882 1,612,556 16,197,060 Subtotal . . . . . . . . . . . . . . . . . . . . . . . . . . . . . . 11,138,190 11,043,449 11,686,064 134,195,060 Eliminations and Corporate assets . . . . . . . . . . . . (1,952,561) (2,078,985) (2,282,355) (23,524,831) Total . . . . . . . . . . . . . . . . . . . . . . . . . . . . . . . . . ¥ 9,185,629 ¥ 8,964,464 ¥ 9,403,709 $110,670,229
Corporate assets consist of cash and cash equivalents and investments and advances.

Hitachi, Ltd. Annual Report 2011 129
Depreciation & Amortization
Millions of yenThousands of
U.S. dollars
2011 2010 2009 2011
Information & Telecommunication Systems . . . . . . ¥ 76,082 ¥ 80,589 ¥113,780 $ 916,651 Power Systems . . . . . . . . . . . . . . . . . . . . . . . . . . 20,239 24,386 23,032 243,843 Social Infrastructure & Industrial Systems . . . . . . . 27,941 32,383 31,806 336,639 Electronic Systems & Equipment . . . . . . . . . . . . . 19,154 21,598 15,827 230,771 Construction Machinery . . . . . . . . . . . . . . . . . . . . 42,606 41,807 38,534 513,325 High Functional Materials & Components . . . . . . . 75,371 85,092 88,280 908,084 Automotive Systems . . . . . . . . . . . . . . . . . . . . . . . 32,768 41,137 43,853 394,795 Components & Devices . . . . . . . . . . . . . . . . . . . . 55,984 65,730 85,760 674,506 Digital Media & Consumer Products . . . . . . . . . . . 27,149 34,567 45,632 327,097 Financial Services . . . . . . . . . . . . . . . . . . . . . . . . . 75,076 81,049 118,642 904,530 Others . . . . . . . . . . . . . . . . . . . . . . . . . . . . . . . . . 37,590 42,954 45,012 452,892 Subtotal . . . . . . . . . . . . . . . . . . . . . . . . . . . . . . 489,960 551,292 650,158 5,903,133 Eliminations and Corporate items . . . . . . . . . . . . . 7,809 6,470 6,765 94,084 Total . . . . . . . . . . . . . . . . . . . . . . . . . . . . . . . . . ¥497,769 ¥557,762 ¥656,923 $5,997,217
Impairment Losses for Long-Lived Assets
Millions of yenThousands of
U.S. dollars
2011 2010 2009 2011
Information & Telecommunication Systems . . . . . . ¥ 473 ¥ 353 ¥ 15,752 $ 5,699 Power Systems . . . . . . . . . . . . . . . . . . . . . . . . . . — 136 82 —Social Infrastructure & Industrial Systems . . . . . . . 767 715 3,609 9,241 Electronic Systems & Equipment . . . . . . . . . . . . . 4,605 624 961 55,482 Construction Machinery . . . . . . . . . . . . . . . . . . . . 3 119 — 36 High Functional Materials & Components . . . . . . . 10,956 2,117 12,888 132,000 Automotive Systems . . . . . . . . . . . . . . . . . . . . . . . 191 175 29,240 2,301 Components & Devices . . . . . . . . . . . . . . . . . . . . 16,561 18,611 12,022 199,530 Digital Media & Consumer Products . . . . . . . . . . . 951 845 51,695 11,458 Financial Services . . . . . . . . . . . . . . . . . . . . . . . . . 368 — 1,499 4,434 Others . . . . . . . . . . . . . . . . . . . . . . . . . . . . . . . . . 295 1,501 652 3,554 Subtotal . . . . . . . . . . . . . . . . . . . . . . . . . . . . . . 35,170 25,196 128,400 423,735 Eliminations and Corporate items . . . . . . . . . . . . . — — — — Total . . . . . . . . . . . . . . . . . . . . . . . . . . . . . . . . . ¥35,170 ¥25,196 ¥128,400 $423,735
Capital Investment for Long-Lived Assets
Millions of yenThousands of
U.S. dollars
2011 2010 2009 2011
Information & Telecommunication Systems . . . . . . ¥ 79,907 ¥ 65,976 ¥ 91,665 $ 962,735 Power Systems . . . . . . . . . . . . . . . . . . . . . . . . . . 12,163 34,704 31,155 146,542 Social Infrastructure & Industrial Systems . . . . . . . 24,729 32,005 46,716 297,940 Electronic Systems & Equipment . . . . . . . . . . . . . 20,874 15,728 17,894 251,494 Construction Machinery . . . . . . . . . . . . . . . . . . . . 40,689 73,874 76,651 490,229 High Functional Materials & Components . . . . . . . 66,795 55,038 112,595 804,759 Automotive Systems . . . . . . . . . . . . . . . . . . . . . . . 21,612 19,261 47,442 260,385 Components & Devices . . . . . . . . . . . . . . . . . . . . 60,150 41,240 63,582 724,699 Digital Media & Consumer Products . . . . . . . . . . . 19,487 20,399 31,446 234,783 Financial Services . . . . . . . . . . . . . . . . . . . . . . . . . 330,292 351,298 422,805 3,979,422 Others . . . . . . . . . . . . . . . . . . . . . . . . . . . . . . . . . 43,952 34,768 46,027 529,542 Subtotal . . . . . . . . . . . . . . . . . . . . . . . . . . . . . . 720,650 744,291 987,978 8,682,530 Eliminations and Corporate items . . . . . . . . . . . . . (20,621) (20,380) (23,557) (248,446) Total . . . . . . . . . . . . . . . . . . . . . . . . . . . . . . . . . ¥700,029 ¥723,911 ¥964,421 $8,434,084

130 Hitachi, Ltd. Annual Report 2011
Capital investment represents the additions to property, plant and equipment and other intangible assets including
tangible assets and software to be leased on an accrual basis.
Geographic Information
Revenues
The following table shows revenues which are attributed to geographic areas based on the location of the customers
for the years ended March 31, 2011, 2010 and 2009.
Millions of yenThousands of
U.S. dollars
2011 2010 2009 2011
Japan . . . . . . . . . . . . . . . . . . . . . . . . . . . . . . . . . . ¥5,269,259 ¥5,313,790 ¥ 5,861,448 $ 63,485,048 Outside Japan Asia . . . . . . . . . . . . . . . . . . . . . . . . . . . . . . . . . 2,073,756 1,699,071 1,911,290 24,985,012 North America . . . . . . . . . . . . . . . . . . . . . . . . . . 781,139 729,698 899,550 9,411,314 Europe . . . . . . . . . . . . . . . . . . . . . . . . . . . . . . . 760,011 824,697 904,425 9,156,759 Other Areas . . . . . . . . . . . . . . . . . . . . . . . . . . . 431,642 401,290 423,656 5,200,506 Subtotal . . . . . . . . . . . . . . . . . . . . . . . . . . . . 4,046,548 3,654,756 4,138,921 48,753,591 Total . . . . . . . . . . . . . . . . . . . . . . . . . . . . . . . ¥9,315,807 ¥8,968,546 ¥10,000,369 $112,238,639
Other than in Japan and China mainland, the Company does not conduct business in any individual country and
region in which its revenues in that country exceed 10% of the consolidated total revenues. Revenues in China
mainland for the years ended March 31, 2011, 2010 and 2009 were ¥1,188,555 million ($14,319,940 thousand),
¥991,653 million and ¥1,078,582 million, respectively.
Long-lived Assets including Goodwill
The following table shows long-lived assets such as property, plant and equipment and intangible assets including
goodwill for each geographic area as of March 31, 2011, 2010 and 2009.
Millions of yenThousands of
U.S. dollars
2011 2010 2009 2011
Japan . . . . . . . . . . . . . . . . . . . . . . . . . . . . . . . . . . ¥1,979,405 ¥2,088,846 ¥2,271,389 $23,848,253 Asia . . . . . . . . . . . . . . . . . . . . . . . . . . . . . . . . . . . 341,884 343,493 267,628 4,119,084 North America . . . . . . . . . . . . . . . . . . . . . . . . . . . 158,684 157,113 163,630 1,911,855 Europe . . . . . . . . . . . . . . . . . . . . . . . . . . . . . . . . . 112,350 111,105 107,478 1,353,615 Other Areas . . . . . . . . . . . . . . . . . . . . . . . . . . . . . 16,651 15,717 12,280 200,615 Subtotal . . . . . . . . . . . . . . . . . . . . . . . . . . . . . . 2,608,974 2,716,274 2,822,405 31,433,422 Eliminations and Corporate items . . . . . . . . . . . . . 30,314 21,580 26,636 365,229 Total . . . . . . . . . . . . . . . . . . . . . . . . . . . . . . . . . ¥2,639,288 ¥2,737,854 ¥2,849,041 $31,798,651
Other than in Japan, the Company does not conduct business in any individual country and region in which its long-
lived assets in that country exceed 10% of the consolidated balance of long-lived assets.
There are no revenues to a single major outside customer for the years ended March 31, 2011, 2010 and 2009.

Hitachi, Ltd. Annual Report 2011 131
Management’s Report on Internal Control Over Financial Reporting
Our management is responsible for establishing and maintaining adequate internal control over financial reporting. Internal con-
trol over financial reporting is defined in Rule 13a-15(f) or 15d-15(f) promulgated under the Securities Exchange Act of 1934 as
a process designed by, or under the supervision of, our principal executive and principal financial officers and effected by our
Board of Directors, management and other personnel, to provide reasonable assurance regarding the reliability of financial
reporting and the preparation of financial statements for external purposes in accordance with generally accepted accounting
principles and includes those policies and procedures that:
• pertain to the maintenance of records that, in reasonable detail, accurately and fairly reflect the transaction and dispo-
sitions of our assets;
• provide reasonable assurance that transactions are recorded as necessary to permit preparation of financial state-
ments in accordance with generally accepted accounting principles, and that our receipts and expenditures are being
made only in accordance with authorizations of our management and directors; and
• provide reasonable assurance regarding prevention or timely detection of unauthorized acquisition, use or disposition
of our assets that could have a material effect on the financial statements.
Because of its inherent limitations, internal control over financial reporting may not prevent or detect misstatements. Projections
of any evaluation of effectiveness to future periods are subject to the risk that controls may become inadequate because of
changes in conditions, or that the degree of compliance with the policies or procedures may deteriorate.
Our management assessed the effectiveness of our internal control over financial reporting as of March 31, 2011. In making
this assessment, our management used the criteria set forth by the Committee of Sponsoring Organizations of the Treadway
Commission (COSO) in Internal Control-Integrated Framework.
Based on its assessment, our management concluded that, as of March 31, 2011, our internal control over financial reporting
was effective based on those criteria.
Our independent registered public accounting firm has issued an audit report on the effectiveness of our internal control over
financial reporting. This report appears on page 133.

132 Hitachi, Ltd. Annual Report 2011
Report of Independent Registered Public Accounting Firm
To the Stockholders and Board of Directors ofHitachi, Ltd.:
We have audited the accompanying consolidated balance sheets of Hitachi, Ltd. and subsidiaries (the “Company”) as of March 31, 2011 and 2010, and the related consolidated statements of operations, equity, and cash flows for each of the three years in the period ended March 31, 2011, all expressed in Japanese yen. These financial statements are the responsibility of the Company’s management. Our responsibility is to express an opinion on these financial statements based on our audits.
We conducted our audits in accordance with the standards of the Public Company Accounting Oversight Board (United States). Those standards require that we plan and perform the audit to obtain reasonable assurance about whether the finan-cial statements are free of material misstatement. An audit includes examining, on a test basis, evidence supporting the amounts and disclosures in the financial statements. An audit also includes assessing the accounting principles used and sig-nificant estimates made by management, as well as evaluating the overall financial statement presentation. We believe that our audits provide a reasonable basis for our opinion.
In our opinion, the financial statements referred to above present fairly, in all material respects, the consolidated financial posi-tion of Hitachi, Ltd. and subsidiaries at March 31, 2011 and 2010, and the consolidated results of their operations and their cash flows for each of the three years in the period ended March 31, 2011, in conformity with U.S. generally accepted accounting principles.
As discussed in Note 2 (y), the Company changed its method of accounting for transfers of financial assets and consolidation of variable interest entities as a result of the adoption of the amendments to the Accounting Standards Codification resulting from Accounting Standards Update (ASU) 2009-16, “Accounting for Transfers of Financial Assets” and ASU 2009-17, “Improvements to Financial Reporting by Enterprises Involved with Variable Interest Entities” effective April 1, 2010, and changed its method of accounting for noncontrolling interests in subsidiaries effective April 1, 2009.
We also have audited, in accordance with the standards of the Public Company Accounting Oversight Board (United States), Hitachi, Ltd. and subsidiaries’ internal control over financial reporting as of March 31, 2011, based on criteria established in Internal Control-Integrated Framework issued by the Committee of Sponsoring Organizations of the Treadway Commission and our report dated June 24, 2011 expressed an unqualified opinion thereon.
We also have recomputed the translation of the consolidated financial statements as of and for the year ended March 31, 2011 into United States dollars. In our opinion, the consolidated financial statements expressed in Japanese yen have been translat-ed into United States dollars on the basis described in Note 3.
Tokyo, JapanJune 24, 2011

Hitachi, Ltd. Annual Report 2011 133
Report of Independent Registered Public Accounting Firm
To the Stockholders and Board of Directors ofHitachi, Ltd.:
We have audited Hitachi, Ltd. and subsidiaries’ internal control over financial reporting as of March 31, 2011, based on criteria established in Internal Control-Integrated Framework issued by the Committee of Sponsoring Organizations of the Treadway Commission (the COSO criteria). Hitachi, Ltd. and subsidiaries’ management is responsible for maintaining effective internal control over financial reporting, and for its assessment of the effectiveness of internal control over financial reporting included in the accompanying Management’s Report on Internal Control Over Financial Reporting. Our responsibility is to express an opin-ion on the company’s internal control over financial reporting based on our audit.
We conducted our audit in accordance with the standards of the Public Company Accounting Oversight Board (United States). Those standards require that we plan and perform the audit to obtain reasonable assurance about whether effective internal control over financial reporting was maintained in all material respects. Our audit included obtaining an understanding of inter-nal control over financial reporting, assessing the risk that a material weakness exists, testing and evaluating the design and operating effectiveness of internal control based on the assessed risk, and performing such other procedures as we consid-ered necessary in the circumstances. We believe that our audit provides a reasonable basis for our opinion.
A company’s internal control over financial reporting is a process designed to provide reasonable assurance regarding the reli-ability of financial reporting and the preparation of financial statements for external purposes in accordance with generally accepted accounting principles. A company’s internal control over financial reporting includes those policies and procedures that (1) pertain to the maintenance of records that, in reasonable detail, accurately and fairly reflect the transactions and dispo-sitions of the assets of the company; (2) provide reasonable assurance that transactions are recorded as necessary to permit preparation of financial statements in accordance with generally accepted accounting principles, and that receipts and expen-ditures of the company are being made only in accordance with authorizations of management and directors of the company; and (3) provide reasonable assurance regarding prevention or timely detection of unauthorized acquisition, use, or disposition of the company’s assets that could have a material effect on the financial statements.
Because of its inherent limitations, internal control over financial reporting may not prevent or detect misstatements. Also, pro-jections of any evaluation of effectiveness to future periods are subject to the risk that controls may become inadequate because of changes in conditions, or that the degree of compliance with the policies or procedures may deteriorate.
In our opinion, Hitachi, Ltd. and subsidiaries maintained, in all material respects, effective internal control over financial report-ing as of March 31, 2011, based on the COSO criteria.
We also have audited, in accordance with the standards of the Public Company Accounting Oversight Board (United States), the accompanying consolidated balance sheets of Hitachi, Ltd. and subsidiaries as of March 31, 2011 and 2010, and the relat-ed consolidated statements of operations, equity, and cash flows for each of the three years in the period ended March 31, 2011, all expressed in Japanese yen, and our report dated June 24, 2011 expressed an unqualified opinion thereon.
Tokyo, JapanJune 24, 2011

134 Hitachi, Ltd. Annual Report 2011
Corporate Data(As of March 31, 2011)
Corporate NameHitachi, Ltd. (Kabushiki Kaisha Hitachi Seisakusho)
URLhttp://www.hitachi.com/
Principal Office6-6, Marunouchi 1-chome, Chiyoda-ku, Tokyo, 100-8280, Japan
Founded1910 (Incorporated in 1920)
Number of Employees361,745
Number of Shares IssuedCommon Stock: 4,520,144,964 shares
Number of Shareholders445,329
Administrator of Shareholders’ RegisterTokyo Securities Transfer Agent Co., Ltd.6-2, Otemachi 2-chome, Chiyoda-ku, Tokyo, 100-0004, Japan
Depositary and Registrar for American Depositary Receipts(New York Stock Exchange Listed Symbol—HIT)Citibank, N.A. Shareholder ServicesP.O. Box 43077 Providence, Rhode Island 02940-3077 USATEL: U.S.A. 1-877-CITI-ADR (248-4237) (toll-free)
International +1-781-575-4555E-mail: [email protected]: www.citi.com/dr
Overseas Stock Exchange ListingNew York
Japanese Stock Exchange ListingsTokyo, Osaka, Nagoya, Fukuoka and Sapporo
Independent Registered Public Accounting FirmErnst & Young ShinNihon LLC
Investor Relations ContactsJAPANHitachi, Ltd.6-6, Marunouchi 1-chome, Chiyoda-ku, Tokyo, 100-8280TEL: +81-3-3258-1111 E-mail: [email protected]
U.S.A.Hitachi America, Ltd.50 Prospect Avenue, Tarrytown, NY 10591TEL: +1-914-333-2987 E-mail: [email protected]
U.K.Hitachi Europe Ltd.Whitebrook Park, Lower Cookham Road, Maidenhead Berkshire SL6 8YATEL: +44-1628-585714
CHINAHitachi (China) Ltd.Beijing Fortune Bldg. 18F, 5 Dong San Huan Bei-Lu, Chao Yang District, Beijing 100004TEL: +86-10-6539-9139

Year ended March 31, 2011Annual Report 2011
HITA
CH
I Annual R
epo
rt 2011
Printed in Japan