year ended december 31, performance results 2020 2019 2018
TRANSCRIPT

Year Ended December 31, Performance Results 2020 2019 2018 2017 2016
Return on average equity 11.59% 11.55% 12.35% 10.56% 10.70%
Return on average assets 1.41% 1.49% 1.45% 1.23% 1.24%
Equity to assets 11.97% 12.44% 12.33% 11.90% 11.41%
Earnings per share - Basic $6.43 $5.70 $5.29 $4.49 $4.29
Dividends per share $3.40 $1.30 $2.70 $1.08 $0.98
Book value per share $60.09 $51.78 $45.54 $43.90 $40.50
Market value per share $52.61 $63.00 $54.01 $58.00 $47.25
Average earning assets to average total assets 94.75% 95.56% 95.72% 95.97% 96.85% Allowance for credit losses to total loans at December 31 1.44% 1.22% 1.16% 1.19%
1.28%
Efficiency ratio 51.71% 55.02% 53.45% 51.35% 50.75%
Yield and Cost of Funds Tax equivalent yield on investments 2.21% 2.94% 2.98% 2.91% 2.65%
Tax equivalent yield on loans 4.08% 4.25% 4.03% 4.05% 4.09%
Cost of funds
0.44% 0.54% 0.39% 0.35% 0.36%
Tax equivalent net interest margin 2.82% 3.27% 3.46% 3.27% 3.25%
Selected Items (in thousands) Total cash and cash equivalents
$135,725 $141,393 $55,231 $56,686 $125,444
Total investments
$856,327 $542,087 $439,952 $516,387 $415,682
Total loans
$950,970 $918,541 $976,619 $894,250 $872,054
Total assets
$1,994,288 $1,651,499 $1,520,773 $1,516,014 $1,454,239
Total deposits
$1,719,971 $1,423,347 $1,314,877 $1,314,302 $1,269,026
Total equity $238,678 $205,404 $187,503 $180,458 $165,879
Financial Highlights

To the shareholders and friends of Cashmere Valley Bank Needless to say, 2020 was an extraordinary year. As of this writing it was nearly one year ago that I gave an order I never thought possible: closing all branches to walk-in traffic. We then went into what I call “war mode”. We gathered as an executive team to begin prioritizing our actions to protect our customers and employees. We covered everything from sanitation processes to acquisition of Personal Protective Equipment (PPE). Supporting our employees became a primary focus. We provided leave for anything related to COVID-19 without the employee using any of their own accrued sick or vacation time. From sickness, exposure to the virus, positive test, or managing the needs of dependents, we supported our employees. We continue with this policy today. This pandemic was a reminder that human capital is of the utmost importance. You should be very proud of your bank and the way it treated its employees during this difficult time. For customers, we increased staff at our drive-ups (even car hopping at times) and provided access to the lobby for anyone who needed it. We participated in the Paycheck Protection Plan with some $70 million in loans to the communities we serve during the multiphase program. These loans only yield 1% initially which causes harm to our net interest margin. The future promised forgiveness that would pay us the fees needed to make up for the low yield was considered an elusive government promise. I am happy to report that forgiveness and the resulting fee recognition is working fairly well. In the face of all this, how did the bank do? I am happy to report surprisingly well. Asset growth and growth in deposits were just under 20%! We can’t claim credit for all of this as many banks had similar performance. However, luck brings more benefit to the prepared and we continue to have an attractive offering with unique service for the communities we serve. Earnings were also up over 9% and this is after funding $3.2 million to the loan loss reserve in anticipation of loan problems that so far have not materialized. We continue to have excellent credit quality even during this horrific pandemic. Our net interest margin has declined and continues to be a challenge in this rate environment. The bright light in our earnings came mostly from non-interest income (mortgage, insurance and wealth management). We hope you can join us for the telephonic annual meeting to be held on April 20th at 7:00 PM where you can hear more about “the little bank with the big circle of friends”. Sincerely,
Greg Oakes, President and CEO

Tel: 509-747-8095 Fax: 509-747-0415 www.bdo.com
601 West Riverside Ave Suite 900 Spokane, WA 99201
Independent Auditor’s Report Board of Directors and Shareholders Cashmere Valley Bank Cashmere, Washington Opinion We have audited the consolidated financial statements of Cashmere Valley Bank and its subsidiary (the Company), which comprise the consolidated balance sheets as of December 31, 2020 and 2019, and the related consolidated statements of income and comprehensive income, changes in shareholders’ equity, and cash flows for the years then ended, and the related notes to the consolidated financial statements. In our opinion, the accompanying consolidated financial statements present fairly, in all material respects, the financial position of the Company as of December 31, 2020 and 2019, and the results of its operations and its cash flows for the years then ended in accordance with accounting principles generally accepted in the United States of America. Basis for Opinion We conducted our audits in accordance with auditing standards generally accepted in the United States of America (GAAS). Our responsibilities under those standards are further described in the Auditor’s Responsibilities for the Audit of the Financial Statements section of our report. We are required to be independent of the Company and to meet our other ethical responsibilities, in accordance with the relevant ethical requirements relating to our audits. We believe that the audit evidence we have obtained is sufficient and appropriate to provide a basis for our audit opinion. Responsibilities of Management for the Financial Statements Management is responsible for the preparation and fair presentation of the consolidated financial statements in accordance with accounting principles generally accepted in the United States of America, and for the design, implementation, and maintenance of internal control relevant to the preparation and fair presentation of consolidated financial statements that are free from material misstatement, whether due to fraud or error. In preparing the consolidated financial statements, management is required to evaluate whether there are conditions or events, considered in the aggregate, that raise substantial doubt about the Company’s ability to continue as a going concern within one year after the date that the consolidated financial statements are issued or available to be issued.

Auditor’s Responsibilities for the Audit of the Financial Statements Our objectives are to obtain reasonable assurance about whether the consolidated financial statements as a whole are free from material misstatement, whether due to fraud or error, and to issue an auditor’s report that includes our opinion. Reasonable assurance is a high level of assurance but is not absolute assurance and therefore is not a guarantee that an audit conducted in accordance with GAAS will always detect a material misstatement when it exists. The risk of not detecting a material misstatement resulting from fraud is higher than for one resulting from error, as fraud may involve collusion, forgery, intentional omissions, misrepresentations, or the override of internal control. Misstatements are considered material if there is a substantial likelihood that, individually or in the aggregate, they would influence the judgment made by a reasonable user based on the consolidated financial statements. In performing an audit in accordance with GAAS, we:
Exercise professional judgment and maintain professional skepticism throughout the audit. Identify and assess the risks of material misstatement of the consolidated financial
statements, whether due to fraud or error, and design and perform audit procedures responsive to those risks. Such procedures include examining, on a test basis, evidence regarding the amounts and disclosures in the consolidated financial statements.
Obtain an understanding of internal control relevant to the audit in order to design audit procedures that are appropriate in the circumstances, but not for the purpose of expressing an opinion on the effectiveness of the Company’s internal control.
Evaluate the appropriateness of accounting policies used and the reasonableness of significant accounting estimates made by management, as well as evaluate the overall presentation of the consolidated financial statements.
Conclude whether, in our judgment, there are conditions or events, considered in the aggregate, that raise substantial doubt about the Company’s ability to continue as a going concern for a reasonable period of time.
We are required to communicate with those charged with governance regarding, among other matters, the planned scope and timing of the audit, significant audit findings, and certain internal control-related matters that we identified during the audit.
Spokane, Washington March 15, 2021

Cashmere Valley Bank and Subsidiary Consolidated Balance Sheets (Dollars in Thousands, Except Share Amounts) December 31,
The accompanying notes are an integral part of these financial statements.
2020 2019 Assets Cash and cash equivalents: Cash and due from banks $27,269 $29,644 Interest-bearing deposits at other financial institutions 97,466 107,456 Federal funds sold 10,990 4,293 Total cash and cash equivalents 135,725 141,393 Securities available for sale at fair value 856,327 542,087 Federal Home Loan Bank (FHLB) stock, at cost 1,982 1,825 Pacific Coast Banker’s Bancshares (PCBB) stock, at cost 238 238 Loans held for sale 1,470 1,804 Loans and leases 950,970 918,541 Allowance for credit losses (13,730) (11,188) Net loans and leases 937,240 907,353 Premises and equipment, net 16,381 16,772 Accrued interest receivable 7,829 5,625 Bank Owned Life Insurance (BOLI) 15,908 15,447 Goodwill Intangibles, net
7,182 1,564
7,162 1,907
Mortgage servicing rights 2,856 2,147 Other assets 9,586 7,739 Total assets $1,994,288 $1,651,499 Liabilities Deposits: Noninterest-bearing demand $365,645 $274,171 Savings and interest-bearing demand 1,121,111 889,417 Time 233,215 259,759 Total deposits 1,719,971 1,423,347 Accrued interest payable 612 765 Short-term borrowings 16,395 10,154 Other liabilities 18,632 11,829 Total liabilities 1,755,610 1,446,095 Commitments and contingencies (Note 13) Shareholders’ Equity Common stock (no par value); authorized 10,000,000 shares; Issued and outstanding: 2020 – 3,972,149; 2019 – 3,966,748 3,723
3,405
Treasury stock (9,908) (9,908) Retained earnings 217,487 205,473 Other comprehensive income 27,376 6,434 Total shareholders’ equity 238,678 205,404 Total liabilities and shareholders’ equity $1,994,288 $1,651,499

2020 Annual Report 7
Cashmere Valley Bank and Subsidiary Consolidated Statements of Income and Comprehensive Income
(Dollars in Thousands, Except Per Share Amounts) Year Ended December 31,
2020 2019 Interest Income: Loans and leases $38,119 $40,465 Federal funds sold and deposits at other financial institutions 412 1,587 Securities available for sale: Taxable 9,368 7,872 Tax-exempt 5,711 4,913 Total interest income 53,610 54,837 Interest Expense: Deposits 6,847 7,334 Short-term borrowings 38 36 Total interest expense 6,885 7,370 Net interest income 46,725 47,467 Provision for credit losses 3,174 709 Net interest income after provision for credit losses 43,551 46,758 Noninterest Income: Service charges on deposit accounts 1,247 1,914 Mortgage banking operations 7,621 3,390 Net gain on sales of securities available for sale 2,520 772 Brokerage commissions 1,002 882 Insurance commissions and fees 4,616 4,579 Net interchange income 2,246 1,549 Increase in surrender value of BOLI 461 437 Other 1,303 1,258 Total noninterest income 21,016 14,781 Noninterest Expense: Salaries and employee benefits 19,969 18,745 Occupancy and equipment 2,997 3,139 Audits and examinations 479 378 State and local business and occupation taxes 952 783 FDIC insurance & WA state assessments 472 293 Legal and professional fees 500 615 Check losses and charge-offs 413 702 Low income housing fund losses 688 694 Data processing 4,636 4,718 Product delivery 1,030 1,008 Other 2,891 3,174 Total noninterest expense 35,027 34,249 Income before income taxes 29,540 27,290 Income Taxes 4,019 3,894 Net income $25,521 $23,396 Change in the fair value of securities available for sale, net of tax 20,942 9,286 Comprehensive income, net of tax $46,463 $32,682 Earnings per common share – Basic $6.43 $5.70 Earnings per common share – Diluted $6.42 $5.69
The accompanying notes are an integral part of these financial statements.

8 Cashmere Valley Bank and Subsidiary
Cashmere Valley Bank and Subsidiary Consolidated Statements of Shareholders’ Equity (Dollars in Thousands, Except Share Information)
Shares of Common
Stock Common
Stock Treasury
Stock Retained Earnings
Other
Comprehensive Income (Loss)
Total Equity
Balance as of December 31, 2018 4,117,745 $2,921 $-- $187,434 $(2,852) $187,503 Net income -- -- -- 23,396 -- 23,396 Other comprehensive income (loss), net of tax -- -- -- -- 9,286 9,286 Cash dividends paid -- -- -- (5,357) -- (5,357) Stock based compensation expense -- 174 -- -- -- 174 Exercise of common stock options 8,658 310 -- -- -- 310 Restricted stock grants 200 -- -- -- -- -- Restricted stock forfeitures
(50) --
--
--
--
--
Shares repurchased (159,805) -- (9,908) -- -- (9,908) Balance as of December 31, 2019 3,966,748 3,405 (9,908) 205,473 6,434 205,404 Net income -- -- -- 25,521 -- 25,521 Other comprehensive income (loss), net of tax -- -- -- -- 20,942 20,942 Cash dividends paid -- -- -- (13,507) -- (13,507) Stock based compensation expense -- 154 -- -- -- 154 Exercise of common stock options 5,401 164 -- -- -- 164 Restricted stock grants -- -- -- -- -- -- Restricted stock forfeitures -- -- -- -- -- -- Shares repurchased -- -- -- -- -- -- Balance as of December 31, 2020 3,972,149 $3,723 $(9,908) $217,487 $27,376 $238,678
The accompanying notes are an integral part of these financial statements.

2020 Annual Report 9
Cashmere Valley Bank and Subsidiary Consolidated Statements of Cash Flows
(Dollars in Thousands) Year Ended December 31,
2020 2019 Cash Flows from Operating Activities Net income $25,521 $23,396 Adjustments to reconcile net income to net cash provided by operating activities:
Depreciation and amortization 3,395 2,830 Provision for credit losses 3,174 709 Investment amortization – net 6,562 4,588 Stock based compensation 154 174 Net gain on sale of securities and loans (9,476) (2,956) Increase in surrender value of BOLI (461) (437) Originations of loans held for sale (176,501) (83,816) Proceeds from sales of loans held for sale 183,071 84,789 Net change in: Accrued interest receivable (2,204) (229) Accrued interest payable (153) 256 Deferred income tax (469) 283 Federal income tax payable (209) 122 Deferred compensation 187 164 Increase in deferred interchange revenue contract 170 44 Other – net (1,175) 696 Net cash provided by operating activities 31,586 30,613 Cash Flows from Investing Activities Activity in securities available for sale: Sales proceeds 51,334 72,626 Maturities, prepayments, and calls 67,725 41,145 Purchases (410,833) (207,968) Purchase of FHLB stock (156) (6) Loans and leases originated less (greater) than principal collected (32,992) 57,308 Investment in low income housing fund (197) (66) Additions to premises and equipment (1,515) (1,329) Cash paid for acquisitions (164) -- Proceeds from sale of premises and equipment 22 -- Net cash used by investing activities (326,776) (38,290) Cash Flows from Financing Activities Net increase in deposits 296,624 108,470 Net increase in short-term borrowings 6,241 324 Cash dividends paid (13,507) (5,357) Exercise of stock options 164 310 Repurchase of common stock -- (9,908) Net cash provided by financing activities 289,522 93,839 Net change in cash and due from banks (5,668) 86,162 Cash and due from banks at beginning of year 141,393 55,231 Cash and due from banks at end of year $135,725 $141,393
The accompanying notes are an integral part of these financial statements.

10 Cashmere Valley Bank and Subsidiary
Note 1 – Summary of Significant Accounting Policies
Cashmere Valley Bank (the Company) is a Washington State chartered bank established in 1932 and operates 11 branches in North Central Washington. The Company’s lending and other banking activities are carried out in and around Chelan, Douglas, Kittitas, and Yakima counties and to a lesser degree, areas of Western Washington. The Company provides loan and deposit services to predominantly small and middle-market business and retail customers. The consolidated financial statements include the accounts of Cashmere Valley Bank and the Bank’s wholly owned subsidiary, Mitchell, Reed and Schmitten, Inc. (MRS), an insurance agency. Intercompany transactions and balances have been eliminated. MRS is based in Wenatchee, Washington and brokers personal and commercial lines of insurance, including property, casualty, life and health insurance.
Consolidated Financial Statement Presentation
The consolidated financial statements have been prepared in accordance with U.S. generally accepted accounting principles (GAAP) and practices within the financial services industry. GAAP defines a public company as one whose securities trade in a public market, including in over-the-counter markets. As the Company’s stock trades in certain over-the-counter markets, certain disclosures are required to meet public company requirements. The preparation of consolidated financial statements requires management to make estimates and assumptions that affect the reported amounts of assets and liabilities, and disclosure of contingent assets and liabilities, as of the date of the consolidated balance sheet, and the reported amounts of revenues and expenses during the reporting period. Actual results could differ significantly from those estimates. Material estimates that are particularly susceptible to significant change in the near term relate primarily to the determination of the allowance for credit losses and valuations of securities, goodwill, and mortgage servicing rights.
Cash and Cash Equivalents
The Company considers federal funds sold, cash and amounts due from banks, and interest-bearing deposits at other financial institutions to be cash and cash equivalents, and are reported as such on the consolidated balance sheets and statement of cash flows. Cash flows from loans, deposits, and short-term borrowings are reported net. Additional cash flow information was as follows (dollars in thousands): Year Ended December 31, 2020 2019 Cash paid for interest $7,038 $7,114 Cash paid for income taxes $4,698 $3,487 Significant non-cash transactions: Fair value adjustment of securities available for sale, net of tax $20,942 $9,286
Stock Based Compensation
The Company has stock based compensation plans which are more fully discussed in Note 15. Under the plans, certain key employees have been awarded restricted stock grants and options to purchase common stock. Under the accounting guidance for stock compensation, compensation expense recognized includes the cost of stock based awards associated with restricted stock grants and incentive stock options which are recognized as compensation expense over the vesting period on a straight-line basis. The Company recognized stock based compensation expense totaling $154,000 and $174,000 in 2020 and 2019, respectively.
Securities Available for Sale
Securities available for sale consist of debt securities that the Company intends to hold for an indefinite period, but not necessarily to maturity. Such securities may be sold to implement the Company’s asset/liability management strategies, interest rate risk strategies, and in response to changes in interest rates and similar factors. Securities available for sale are reported at fair value. Unrealized gains and losses, net of the related deferred tax effect, are reported as a net amount in a separate component of shareholders’ equity entitled “other comprehensive income.” Realized gains and losses on securities available for sale, determined using the specific identification method, are included in earnings. Generally, amortization of
Notes to Consolidated Financial Statements

2020 Annual Report 11
premiums and accretion of discounts are recognized in interest income over the contractual life of the security using the effective interest method. As principal repayments are received on securities, a proportionate amount of the related premium or discount is recognized so that the effective interest rate on the remaining portion of the security continues unchanged. The Company evaluates the portfolio for impairment each quarter. In estimating other-than-temporary losses, the Company considers the following factors: (1) the length of time and the extent to which the market value has been less than cost; (2) the financial condition and near-term prospect of the issuer; (3) the intent and ability of the Company to retain its investment in a security for a period of time sufficient to allow for any anticipated recovery in market value; (4) implicit or implied guarantees of the U.S. government; (5) whether it is more likely than not that the Company will be required to sell the securities before recovery; and (6) general market conditions which reflect prospects for the economy as a whole, including interest rates and sector credit spreads. If a loss is deemed to be other-than-temporary, the Company then calculates a credit loss charge against earnings by subtracting the estimated present value of estimated future cash flows on the security from its amortized cost. The other-than-temporary impairment less the credit loss charge against earnings is a component of other comprehensive income.
Federal Home Loan Bank Stock
The Company, as a member of the Federal Home Loan Bank (FHLB) system, is required to maintain an investment in capital stock of the FHLB based on the sum of the two following calculations (calculated at least annually as of the preceding December 31):
The Membership Stock Purchase Requirement: based on a percentage of assets as shown in table below: Current
Requirement Minimum
Investment Maximum
Investment Percent of Total Assets 0.12% 0.05% 0.25%
Membership Stock Cap $10 million $1 million $30 million
Membership Stock Floor $10,000 $10,000 $30,000
The Activity Based Stock Purchase Requirement: based on a percentage of the book value held and records of the transactions shown in the table below:
Transaction
Current Requirement
Minimum Requirement
Maximum Requirement
Outstanding Advances 4.00% 2.00% 5.00% Outstanding Acquired Member Assets 4.00% 0.00% 5.00% Standby Letters of Credit 0.10% 0.00% 0.18% Advance Commitments 0.00% 0.00% 0.35% Acquired Member Asset Commitments 0.00% 0.00% 0.60%
The recorded amount of FHLB stock equals its fair value because the shares can only be redeemed by the FHLB at the $100 per share par value. The Company views its investment in the FHLB stock as a long-term investment. Accordingly, when evaluating for impairment, the value is determined based on the ultimate recovery of the par value rather than recognizing temporary declines in value. The determination of whether a decline affects the ultimate recovery is influenced by criteria such as: (1) the significance of the decline in net assets of the FHLB as compared to the capital stock amount and length of time a decline has persisted; (2) impact of legislative and regulatory changes on the FHLB; and (3) the liquidity position of the FHLB. Management has determined there is no impairment on its FHLB stock as of December 31, 2020 and 2019.
Loans Held for Sale
Loans originated for sale in the secondary market, which is our principal market, or as whole loan sales are classified as loans held for sale. Management has elected the lower of cost or market option for all singly family loans held for sale, which are originated with the intent to be held for sale, and records these loans at the lower of cost or market. The fair value of loans held for sale is generally based on observable market prices from other loans in the secondary market that have

12 Cashmere Valley Bank and Subsidiary
similar collateral, credit, and interest rate characteristics. If quoted market prices are not readily available, the Company may consider other observable market data such as dealer quotes for similar loans or forward sale commitments. In certain cases, the fair value may be based on a discounted cash flow model. Gains and losses on loans held for sale are recognized in net gain on mortgage loan origination and sale activities within noninterest income. Direct loan origination costs and fees for single family loans originated as held for sale are recognized in earnings.
Loans Held for Investment
Loans held for investment are reported at the principal amount outstanding, net of cumulative charge-offs, interest applied to principal, for loans accounted for using the cost recovery method, unamortized net deferred loan origination fees and costs, and unamortized premiums or discounts on purchased loans. Deferred fees and costs and premiums and discounts are recognized over the contractual terms of the underlying loans using the constant effective yield, known as the interest method. Interest on loans is accrued and recognized as interest income at the contractual rate of interest. A determination is made as of the loan commitment date as to whether a loan will be held for sale or held for investment. This determination is based primarily on the type of loan or loan program and its related profitability characteristics. When a loan is designated as held for investment, the intent is to hold these loans until maturity or pay-off. If subsequent changes occur, the Company may change its intent to hold these loans. Once a determination has been made to sell such loans, they are immediately transferred to loans held for sale and carried at the lower of cost or fair value. Direct financing leases are carried at the aggregate of lease payments plus estimated residual value of the leased property less unearned income. Interest income from direct financing leases is recognized over the term of the lease to achieve a constant periodic rate of return on the outstanding investment. From time to time, the Company will originate loans to facilitate the sale of other real estate owned without a sufficient down payment from the borrower. Such loans are accounted for using the installment method and any gain on sale is deferred.
Nonaccrual Loans
Loans are placed on nonaccrual status when the full and timely collection of principal and interest is doubtful, generally when the loan becomes 90 days or more past due for principal or interest payment, or if part of the principal balance has been charged off. All payments received on nonaccrual loans are accounted for using the cost recovery method. Under the cost recovery method, all cash collected is applied to first reduce the principal balance. A loan may be returned to accrual status if all delinquent principal and interest payments are brought current and the collectability of the remaining principal and interest payments in accordance with the loan agreement is reasonably assured. Loans that are well-secured and in the process of collection are maintained on accrual status, even if they are 90 days or more past due.
Impaired Loans
A loan is considered impaired when it is probable that all contractual principal and interest payments due will not be collected in accordance with the terms of the loan agreement. Factors considered by management in determining whether a loan is impaired include payment status, collateral value, and the probability of collecting scheduled principal and interest payments when due.
Troubled Debt Restructurings
A loan is accounted for and reported as a troubled debt restructuring (TDR) when, for economic or legal reasons, we grant a concession to a borrower experiencing financial difficulty. A restructuring that results in only an insignificant delay in payment is not considered a concession. A delay may be considered insignificant if the payments subject to the delay are insignificant relative to the unpaid principal or collateral value and the contractual amount due, or the delay in timing of the restructured payment period is insignificant relative to the frequency of payments, the debt’s original contractual maturity, or original expected duration. TDR’s are designated as impaired because interest and principal payments will not be received in accordance with original contract terms. TDR’s that are performing and on accrual status as of the date of the modification remain on accrual status.

2020 Annual Report 13
TDR’s that are nonperforming as of the date of modification generally remain as nonaccrual until the prospect of future payments in accordance with the modified loan agreement is reasonably assured, generally demonstrated when the borrower maintains compliance with the restructured terms for a predetermined period, normally at least six months. TDR’s with temporary below-market concessions remain designated as a TDR and impaired regardless of the accrual or performance status until the loan is paid off. However, if the TDR loan has been modified in a subsequent restructure with market terms and the borrower is not currently experiencing financial difficulty, then the loan may have its TDR designation removed.
Allowance for Credit Losses
The allowance for credit losses is maintained at a level sufficient to provide for probable credit losses based on evaluating known and inherent risks in the loan and lease portfolio. The allowance is provided based upon management’s continuing analysis of the pertinent factors underlying the quality of the loan and lease portfolio. These factors include changes in the size and composition of the loan and lease portfolio, delinquency levels, actual loan loss experience, current economic conditions, and detailed analysis of individual loans for which full collectability may not be assured. The detailed analysis includes techniques to estimate the fair value of loan collateral and the existence of potential alternative sources of repayment. The allowance consists of specific, general, and unallocated components. For impaired loans, a specific allowance is established when the discounted cash flows, collateral value, or observable market price is lower than the carrying value of that loan. The general component covers non-impaired loans and is based on historical loss experience adjusted for qualitative factors. An unallocated component is maintained to cover the risk of loss due to general economic uncertainties that could affect the loan portfolio and management’s estimate of probable losses. The unallocated component of the allowance reflects the margin of imprecision inherent in the underlying assumptions used in the methodologies for estimating specific and general losses in the portfolio. The appropriateness of the allowance for credit losses is estimated based upon these factors and trends identified by management at the time consolidated financial statements are prepared. When available information confirms that specific loans or portions thereof are uncollectible, identified amounts are charged against the allowance for credit losses. The existence of some or all of the following criteria will generally confirm that a loss has been incurred: the loan is significantly delinquent and the borrower has not demonstrated the ability or intent to bring the loan current; the Company has no recourse to the borrower, or if it does, the borrower has insufficient assets to pay the debt; the estimated fair value of the loan collateral is significantly below the current loan balance, and there is little or no near-term prospect for improvement. A provision for credit losses is charged against income and added to the allowance for credit losses based on regular assessments of the loan and lease portfolio. The allowance for credit losses is allocated to certain loan and lease categories based on the relative risk characteristics, asset classifications and actual loss experience of the loan and lease portfolio. While management has allocated the allowance for credit losses to various loan and lease portfolio segments, the allowance is general in nature and is available for the loan and lease portfolio in its entirety.
The ultimate recovery of all loans and leases is susceptible to future market factors beyond the Company’s control. These factors may result in losses or recoveries differing significantly from those provided in the consolidated financial statements. In addition, regulatory agencies periodically review the Company’s allowance for credit losses as an integral part of their examination process. As a result, the Company may be required to make additions to the allowance based on the regulatory agency’s judgement about information available at the time of their examinations.
Premises and Equipment
Premises and equipment are stated at cost less accumulated depreciation, which is computed on the straight-line method over the estimated useful lives of the assets, which range from 35 to 40 years for buildings and 3 to 15 years for furniture, fixtures, and equipment. These assets are reviewed for impairment under Financial Accounting Standards Board (FASB) Accounting Standards Codification (ASC) 360, “Property, Plant, and Equipment” when events indicate that the carrying amount may not be recoverable. Gains or losses on dispositions are reflected in earnings.
Foreclosed Real Estate
Real estate properties acquired through, or in lieu of, foreclosure are to be sold and are initially recorded at the fair value of the properties, less estimated costs of disposal, which becomes the new cost basis. Any write-down to fair value at the time of transfer to foreclosed real estate is charged to the allowance for credit losses. Properties are evaluated regularly to ensure that the recorded amounts are supported by their current fair values. Any subsequent reductions in carrying values and revenue and expense from the operations of properties are recognized in the consolidated statement of income.

14 Cashmere Valley Bank and Subsidiary
Mortgage Servicing Rights
Mortgage servicing rights (MSR’s) are recognized as separate assets when rights are acquired through purchase or through sale of loans. Generally, purchased servicing rights are capitalized at the cost to acquire the rights. For sales of mortgage loans, a portion of the cost of originating the loan is allocated to the servicing right based on relative fair value. Capitalized servicing rights are amortized into noninterest income in proportion to, and over the period of, the estimated future net servicing income of the underlying financial assets. MSR’s are evaluated for impairment based upon the fair value of the rights as compared to amortized cost. Subsequent fair value measurements of single family MSR’s, which are not traded in an active market with readily observable market prices, are determined by considering the present value of estimated future net servicing cash flows. Changes in the fair value of single family MSR’s result from changes in (1) model inputs and assumptions and (2) modeled amortization, representing the collection and realization of expected cash flows and curtailments over time. The significant model inputs used to measure the fair value of single family MSR’s include assumptions regarding market interest rates, projected prepayment speeds, discount rates, estimated costs of servicing, and other income and additional expenses associated with the collection of delinquent loans. Impairment is recognized through a valuation allowance to the extent that fair value is less than the recorded value. If the Company later determines that all or a portion of the impairment no longer exists, a reduction of the allowance will be recorded as an increase to income. Servicing fee income is recorded for fees earned for servicing loans. The fees are based on a contractual percentage of the outstanding principal or a fixed amount per loan and are recorded as income when earned. The amortization of MSR’s is netted against loan servicing fee income.
Transfers of Financial Assets
Transfers of financial assets are accounted for as sales when control over the assets has been surrendered. Control over transferred assets is deemed to be surrendered when: (1) the assets have been isolated from the Company; (2) the transferee obtains the right (free of conditions that constrain it from taking advantage of that right) to pledge or exchange the transferred assets; and (3) the Company does not maintain effective control over the transferred assets through an agreement to repurchase them before their maturity.
Income Taxes
Deferred tax assets and liabilities result from differences between the consolidated financial statement carrying amounts and the tax basis of assets and liabilities, and are reflected at currently enacted income tax rates applicable to the period in which the deferred tax assets or liabilities are expected to be realized or settled. The deferred tax provision represents the difference between the net deferred tax asset or liability at the beginning and end of the year. As changes in tax laws or rates are enacted, deferred tax assets and liabilities are adjusted through the provision for income taxes. Deferred tax assets are reduced by a valuation allowance when, in the opinion of management, it is more likely than not that some portion or all of the deferred tax assets will not be realized. The determination of the realization of the deferred tax assets is highly subjective and dependent upon judgment concerning management’s evaluation of both positive and negative evidence. The calculation of the Company’s tax provision for federal income taxes is complex and requires the use of estimates and significant judgments in arriving at the amount of tax benefits to be recognized in the financial statements for a given tax position. It is possible that the tax benefits realized upon the ultimate resolution of a tax position may result in tax benefits that are significantly different from those estimated. Management has reviewed all tax positions taken on all its income tax returns and has determined there to be no uncertain positions. Any interest and penalties would be recorded in income tax expense. Therefore, no further disclosures are deemed necessary. The Bank is subject to routine audits by taxing jurisdictions; however, there are currently no audits in progress for any tax periods. Management believes it is no longer subject to income tax examinations for years prior to 2016.
Bank Owned Life Insurance (BOLI)
Bank owned life insurance policies are recorded at their cash surrender value or the amount that can be realized upon surrender of the policy. Income from BOLI is recognized when it is earned.

2020 Annual Report 15
Goodwill
Goodwill represents costs in excess of net assets acquired and is evaluated at least annually for impairment, in accordance with FASB ASC 350, “Intangibles – Goodwill and Other.” The Company tested goodwill for impairment as of December 31, 2020 using the Step 0 method to evaluate impairment and concluded that the fair value of the goodwill is greater than the carrying value, noting no impairment of recorded goodwill. No events have occurred since December 31, 2020 that would require re-evaluation.
Intangible Assets
Intangible assets include non-competition and licensing agreements, and customer contracts and lists. The non-competition and licensing agreements are amortized by the straight-line method over four to five years. The customer contracts and lists are amortized over a five year period, on either a straight-line method or performance basis. In 2020 and 2019, no circumstances existed that would indicate the intangible assets were potentially impaired. If such circumstances had existed, the assets would have been tested for impairment in accordance with FASB ASC 350, “Intangibles – Goodwill and Other.”
Insurance Revenue
Insurance revenue consists of commissions and fees from the sales of insurance policies and related insurance services. Insurance commission income is recognized as of the effective date of the insurance policy, net of adjustments. Such adjustments are recorded when the amount can be reasonably estimated, which is generally in the period in which they occur. Commission revenues related to installment billings are recognized on the latter of effective or invoiced date. Contingent commissions are estimated and accrued relative to the recognition of corresponding commissions. Management determines a policy cancellation reserve based upon historical cancellation experience adjusted for any known circumstances. Subsequent commission adjustments were recognized upon receipt of notification from insurance companies concerning such adjustments.
Advertising
Advertising costs are generally charged to expense during the year in which they are incurred. Advertising expense was $211,000 and $278,000 for the years ended December 31, 2020 and 2019, respectively.
Derivative Financial Instruments
The Company enters into interest rate swaps to convert fixed rate long-term loans to floating rate loans. Management individually evaluates and converts fixed rate loans to floating rate loans depending on the size, maturity, and planned amortization of each loan. The interest rate swap instruments are recognized as derivatives on the balance sheet at their fair value. On the date the Company enters into the derivative contract, the derivative is designated by the Company as a hedge of fair value of a recognized asset or liability. Changes in the fair value of a derivative that is highly effective, and that is designated and qualifies as a fair value hedge, along with the loss or gain on the hedged asset or liability that is attributable to the hedged risk, are recorded in current period earnings. The Company formally documents all relationships between hedging instruments and hedged items, as well as its risk management objective and strategy for undertaking various hedged transactions. This process includes linking all derivatives that are designated as fair value hedges to specific assets and liabilities on the balance sheet and statement of cash flows. The Company also formally assesses, both at the hedge’s inception and on an ongoing basis, whether the derivatives that are used in hedging transactions are highly effective in offsetting changes in fair values of hedged items. When it is determined that a derivative is not highly effective as a hedge or that it has ceased to be a highly effective hedge, the Company discontinues hedge accounting prospectively, as discussed below. The Company discontinues hedge accounting prospectively when: (1) it is determined that the derivative is no longer effective in offsetting changes in the fair value of a hedged item; (2) the derivative expires or is sold, terminated, or exercised; or (3) management determines that designation of the derivative as a hedge instrument is no longer appropriate. When hedge accounting is discontinued because it is determined that the derivative no longer qualifies as an effective fair value hedge, the derivative will continue to be carried on the balance sheet at its fair value with changes in its fair value recognized in current period earnings, and the hedged asset or liability will no longer be adjusted for changes in fair value.

16 Cashmere Valley Bank and Subsidiary
Fair Value
The Company measures or monitors many of its assets and liabilities on a fair value basis. Fair value is used on a recurring basis for certain assets and liabilities in which fair value is the primary basis of accounting. Examples of these include derivative instruments and available for sale securities. Additionally, fair value is used on a non-recurring basis to evaluate assets or liabilities for impairment or for disclosure purposes. Examples of these non-recurring uses of fair value include certain loans held for sale accounted for on a lower of cost or market basis, impaired loans, foreclosed real estate, mortgage servicing rights, goodwill and long-lived assets. Fair value is defined as the price that would be received to sell an asset or paid to transfer a liability, known as an exit price, in an orderly transaction between market participants at the measurement date. Fair value estimates are based on quoted market prices, if available. If quoted market prices are not available, fair value estimates are based on quoted market prices of similar assets or liabilities or the present value of expected future cash flows and other valuation techniques. These valuations are significantly affected by discount rates, cash flow assumptions, risk and other assumptions used. Therefore, fair value estimates may not be substantiated by comparison to independent markets and are not intended to reflect the proceeds that may be realizable in an immediate settlement of the instruments. Fair value is determined at one point in time and is not representative of future value. Fair value amounts also do not reflect the total value of a going concern organization. Management does not have the intention to dispose of a significant portion of its assets and liabilities and therefore, the unrealized gains or losses should not be interpreted as a forecast of future earnings and cash flows. In support of these representations, FASB ASC 820, “Fair Value Measurements and Disclosures,” establishes fair value hierarchy that prioritizes the information used to develop those assumptions. The fair value hierarchy is as follows:
Level 1 inputs are observable inputs, based upon the quoted prices for identical instruments in active markets that are accessible as of the measurement date, and are to be used whenever available. Level 2 inputs are other types of observable inputs, such as quoted prices for similar instruments in active markets; quoted prices for identical or similar instruments in markets that are inactive; or other inputs that are observable or can be derived from or supported by observable market data. Level 2 inputs are to be used whenever Level 1 inputs are not available. Level 3 inputs are significantly unobservable and are supported by little or no market activity. These Level 3 assets and liabilities include financial instruments whose value is determined using pricing models, discounted cash flow methodologies, or similar techniques, as well as instruments for which the determination of fair values requires significant management judgment or estimation. Level 3 inputs are to only be used when Level 1 and Level 2 inputs are unavailable.
When determining the fair value measurements for assets and liabilities, the Company considers the principal or most advantageous market in which it would transact, and considers assumptions that market participants would use when pricing the asset or liability. When possible, the Company looks to active and observable markets to price identical assets or liabilities. When identical assets or liabilities are not traded in active markets, the Company looks to market observable data for similar assets and liabilities.
Recent Accounting Pronouncements
ASU 2020-06, “Debt – Debt with Conversion and Other Options (Subtopic 470-20) and Derivatives and Hedging – Contracts in Entity’s Own Equity (Subtopic 815-40).” Issued in August 2020, Accounting Standards Update (ASU) No. 2020-06 addresses accounting complexities regarding convertible debt instruments and the derivatives scope exception for contracts in an entity’s own equity. The ASU reduces the number of available accounting models for convertible debt instruments in an attempt to reduce complexity and variation in practice. Additionally, the ASU improves the applicability of the derivatives scope exception for contracts in an entity’s own equity by clarifying settlement guidance and balance sheet classification. ASU 2020-06 is effective for the Company in fiscal years beginning after December 15, 2023. Management does not believe adoption of this ASU will have a material impact on the consolidated financial statements given that the Company does not currently hold any convertible debt instruments or any in-scope derivative contracts.

2020 Annual Report 17
ASU 2020-04, “Reference Rate Reform (Topic 848): Facilitation of the Effects of Reference Rate Reform on Financial Reporting.” Issued in March 2020, ASU No. 2020-04 provides optional expedients and exceptions for accounting related to contracts, hedging relationships and other transactions affected by reference rate reform if certain criteria are met. ASU 2020-04 applies only to contracts, hedging relationships and other transactions that reference LIBOR or another reference rate expected to be discontinued because of reference rate reform and do not apply to contract modifications made and hedging relationships entered into or evaluated after December 31, 2022. The adoption of ASU 2020-04 did not significantly impact the Company’s consolidated financial statements. ASU 2021-01, “Reference Rate Reform (Topic 848).” Issued in January 2021, ASU No. 2021-01 clarifies the scope of Topic 848 so that derivatives affected by the discounting transition are explicitly eligible for certain optional expedients and exceptions in Topic 848. The Update additionally clarified that a receive-variable-rate, pay-variable-rate cross-currency interest rate swap may be considered an eligible hedging instrument in a net investment hedge if both legs of the swap do not have the same repricing intervals and dates as a result of reference rate reform. ASU 2021-01 was effective upon issuance and generally can be applied through December 31, 2022. See the discussion regarding the adoption of ASU 2020-04 below. ASU 2019-12, “Income Taxes (Topic 740): Simplifying the Accounting for Income Taxes.” Issued in December 2019, ASU No. 2019-12 includes a number of provisions intended to simplify the accounting for income taxes. The update is effective for fiscal years after December 15, 2020. The Company is currently assessing the impact of this ASU on its accounting and disclosures. ASU No. 2016-13, “Financial Instruments-Credit Losses.” On June 16, 2017 the amendments in this ASU were issued to provide financial statement users with more decision-useful information about the current expected credit losses (CECL) on financial instruments that are not accounted for at fair value through net income, including loans held for investment, held-to-maturity debt securities, trade and other receivables, net investment in leases and other commitments to extend credit held by a reporting entity at each reporting date. The amendments in this ASU require a financial asset (or a group of financial assets) measured at amortized cost basis to be presented at the net amount expected to be collected. The allowance for credit losses is a valuation account that is deducted from the amortized cost basis of the financial asset(s) to present the net carrying value at the amount expected to be collected on the financial asset. The income statement will reflect the measurement of credit losses for newly recognized financial assets and for the expected increase or decrease of expected credit loss. The ASU also requires credit losses relating to available-for-sale debt securities to be recorded through an allowance for credit losses rather than as a write-down. The initial allowance for the credit losses, for purchased available-for-sale securities, is added to the purchase price rather than reported as a credit loss expense. Subsequent changes in the allowance are recorded as credit loss expense. Interest income should be recognized based on the effective interest rate, excluding the discount attributed to the assessment of credit loss at acquisition. The FASB issued ASU 2019-04, “Codification Improvements to Topic 326, Financial Instruments-Credit Losses, Topic 815, Derivatives and Hedging, and Topic 825, Financial Instruments.” Issued in April 2019, ASU No. 2019-04 clarifies a number of issues discussed at the June 2018 and November 2018 Credit Losses Transition Resource Group meetings. The clarifications address a variety of identified issues including but not limited to the treatment of accrued interest receivable as it relates to the allowance for credit losses, transfers between loan classifications and categories, recoveries, and using projections of future interest rate environments in expected cash flow calculations. Management is evaluating these clarifications concurrently with our assessment of ASU 2016-13. The FASB issued ASU 2019-10, “Financial Instruments-Credit Losses (Topic 326), Derivatives and Hedging (Topic 815), and Leases (Topic 842)” which provided certain clarifications to this update as well as extended the implementation date for non SEC Filer public business entities. The amendments are effective for annual reporting periods beginning after December 15, 2022. The Company is assessing the impact of this ASU on its accounting and disclosures. The FASB issued ASU 2019-11, “Financial Instruments-Credit Losses: Codification Improvements Topic 326.” Issued in November 2019, ASU No. 2019-11 clarifies and addresses specific issues about certain aspects of the amendments in ASU 2016-13. For the Company, the provisions of this ASU are effective for fiscal years beginning after December 15, 2022 including interim periods within those fiscal years.

18 Cashmere Valley Bank and Subsidiary
Note 2 – Restricted Assets
On March 15, 2020, the Federal Reserve reduced the reserve requirement ratios to zero percent effective March 26, 2020. This action eliminated reserve requirements for all depository institutions. The elimination of reserve requirements was maintained through December 31, 2020 and therefore, no balance was required to be on deposit with the Federal Reserve Bank for the year ended December 31, 2020. Prior to March 26, 2020, Federal Reserve Board regulations required that the Company maintain certain minimum reserve balances on hand or on deposit with the Federal Reserve Bank, based on a percentage of deposits. The required minimum reserve balances at December 31, 2019 was $2,657,000. Due to sufficient balances maintained on premises, no balance was required to be on deposit with the Federal Reserve Bank for the year ended December 31, 2019.
Note 3 – Securities
Securities have been classified according to management’s intent. The amortized cost of securities and their approximate fair value are as follows (dollars in thousands): Securities Available for Sale
Amortized Cost
Gross Unrealized
Gains
Gross Unrealized
Losses
Fair Value
December 31, 2020
SBA loans backed by U.S. government agency $33,177 $-- $(378) $32,799 State and municipal securities 394,850 31,405 (275) 425,980 Collateralized mortgage obligations 240,546 4,016 (1,190) 243,372 Mortgage-backed securities 101,637 2,116 (837) 102,916 Student loans backed by U.S. government agency 31,964 -- (266) 31,698 Corporate securities 19,500 92 (30) 19,562 Total $821,674 $37,629 $(2,976) $856,327 December 31, 2019 SBA loans backed by U.S. government agency $20,340 $-- $(110) $20,230 State and municipal securities 234,612 9,136 (1,627) 242,121 Collateralized mortgage obligations 205,918 1,903 (1,413) 206,408 Mortgage-backed securities 51,951 961 (73) 52,839 Student loans backed by U.S. government agency 21,121 -- (632) 20,489 Corporate securities -- -- -- -- Total $533,942 $12,000 $(3,855) $542,087
In determining that no securities were other-than-temporarily impaired, each security was individually evaluated for impairment by management. On a quarterly basis, the Company evaluates these securities for other-than-temporary impairment (OTTI). During 2020 and 2019, there was no OTTI recorded in earnings. The unrealized losses on securities are primarily due to elevated yield spreads at December 31, 2020 and 2019 as compared to yield relationships prevailing at the time specific securities were purchased.

2020 Annual Report 19
At December 31, 2020, there were 25 securities in a continuous unrealized loss position more than twelve months. The following shows the unrealized gross losses and fair value of securities in the available for sale portfolio at December 31, 2020 and 2019, by length of time that individual securities in each category have been in a continuous loss position (dollars in thousands):
Less Than 12 Months
More Than 12 Months
Total
Unrealized Gross Loss
Fair Value
Unrealized Gross Loss
Fair Value
Unrealized Gross Loss
Fair Value
December 31, 2020 SBA loans backed by U.S. government agency $(130) $14,380
$(248) $18,420
$(378) $32,800 State and municipal securities (275) 23,362 -- -- (275) 23,362 Collateralized mortgage obligations (823) 59,193 (367) 38,348 (1,190) 97,541 Mortgage-backed securities (837) 51,450 -- -- (837) 51,450 Student loans backed by U.S. government agency (58) 14,400 (208) 17,297 (266) 31,697 Corporate securities (30) 1,470 -- -- (30) 1,470 Total $(2,153) $164,255 $(823) $74,065 $(2,976) $238,320 Less Than
12 Months More Than
12 Months
Total Unrealized
Gross Loss Fair
Value Unrealized
Gross Loss Fair
Value Unrealized
Gross Loss Fair
Value December 31, 2019 SBA loans backed by U.S. government agency $(110) $20,230
$-- $--
$(110) $20,230
State and municipal securities (1,627) 68,809 -- -- (1,627) 68,809 Collateralized mortgage obligations (646) 67,019 (767) 54,463 (1,413) 121,482 Mortgage-backed securities (32) 7,544 (41) 5,866 (73) 13,410 Student loans backed by U.S. government agency -- -- (632) 17,980 (632) 17,980 Corporate securities -- -- -- -- -- -- Total $(2,415) $163,602 $(1,440) $78,309 $(3,855) $241,911
The contractual maturities of securities available for sale at December 31, 2020, are shown below (dollars in thousands): Available for Sale Amortized Fair Cost Value Due in one year or less $12,735 $12,755 Due from one year to five years 31,309 32,432 Due from five years to ten years 160,084 166,033 Due after ten years 617,546 645,107 Total $821,674 $856,327 Expected maturities may differ from contractual maturities because issuers may have the right to call or prepay obligations, with or without call or prepayment penalties. Securities carried at approximately $58.3 million and $60.4 million at December 31, 2020 and 2019, respectively, were pledged to secure public deposits, repurchase agreements, and other purposes required or permitted by law. Sales of securities available for sale were as follows (dollars in thousands): 2020 2019 Proceeds from sales $51,334 $72,626 Gross realized gains included in earnings $2,568 $932 Gross realized losses included in earnings $(48) $(160)

20 Cashmere Valley Bank and Subsidiary
Note 4 – Loans and Leases
Loans and leases at December 31 consist of the following (dollars in thousands):
2020 2019 Commercial and agricultural $125,503 $62,206 Real estate: Residential 1-4 family 117,929 152,301 Commercial 318,832 329,479 Construction 73,497 62,531 Farmland 8,657 10,682 Municipal 94,730 85,967 Consumer 18,749 18,151 Dealer contracts 187,152 189,612 Leases 1,748 2,526 Credit card 4,173 5,086 Total loans and leases $950,970 $918,541
The Paycheck Protection Program (PPP), established by the Coronavirus Aid, Relief, and Economic Security Act (CARES Act), was implemented by the Small Business Administration (SBA) in an effort to assist small businesses adversely affected by the economic impact of COVID-19. In 2020, the Bank originated 840 PPP loans totaling $69,975,000. At December 31, 2020, PPP loan balances totaled $54.2 million, and are included in the commercial and agricultural portfolio segment. The SBA paid lenders fees for processing PPP loans. In 2020, the Company recognized $426,000 in net fees. At December 31, 2020, net deferred fees remaining totaled $1.6 million. On December 27, 2020, the life of PPP was extended by the Consolidated Appropriations Act, 2021 (CAA, 2021). The CAA, 2021 effectively creates a second round of PPP loans for eligible business. The Bank is participating in the CAA’s second round of PPP lending, and began processing PPP loan applications in mid-January. The following tables detail activity in the allowance for loan and lease losses (ALLL) by portfolio segment for the years ended December 31, 2020 and 2019 (dollars in thousands). While the allowance is allocated to specific loan and lease categories, the allowance is general in nature and is available for the loan and lease portfolio in its entirety.
Real Estate
2020
Commercial and
Agricultural Residential 1-4 Family
Commercial, Construction,
and Farmland Municipal
Consumer and
Other Unallocated Total
ALLL Beginning balance $980 $1,043 $5,123 $96 $3,181 $765 $11,188 Provision for loan and lease losses 720 13 1,309 18 1,011 103 3,174 Charge-offs (301) (31) -- -- (910) -- (1,242) Recoveries 108 -- -- -- 502 -- 610 Ending balance $1,507 $1,025 $6,432 $114 $3,784 $868 $13,730 Period end amount allocated to: Loans and leases individually evaluated for impairment $-- $286 $17 $-- $1 $-- $304 Loans and leases collectively evaluated for impairment 1,507 739 6,415 114 3,783 868 13,426 Ending balance $1,507 $1,025 $6,432 $114 $3,784 $868 $13,730

2020 Annual Report 21
Real Estate
2019
Commercial and
Agricultural Residential 1-4 Family
Commercial, Construction,
and Farmland Municipal
Consumer and
Other Unallocated Total
ALLL Beginning balance $1,077 $1,136 $5,788 $128 $3,170 $-- $11,299 Provision for loan and lease losses 235 (93) (665) (32) 499 765 709 Charge-offs (553) -- -- -- (946) -- (1,499) Recoveries 221 -- -- -- 458 -- 679 Ending balance $980 $1,043 $5,123 $96 $3,181 $765 $11,188 Period end amount allocated to: Loans and leases individually evaluated for impairment $74 $187 $92 $-- $3 $-- $356 Loans and leases collectively evaluated for impairment 906 856 5,031 96 3,178 765 10,832 Ending balance $980 $1,043 $5,123 $96 $3,181 $765 $11,188 The reserve for unfunded commitments totaled $256,000 as of December 31, 2020 and 2019. The Company’s recorded investment in loans and leases as of December 31, 2020 and 2019 related to each balance in the allowance for loan and lease losses by portfolio segment, and disaggregated on the basis of the Company’s impairment methodology, was as follows (dollars in thousands): Real Estate Commercial
and Agricultural
Residential 1-4 Family
Commercial, Construction,
and Farmland Municipal
Consumer and
Other Total Loans and Leases
2020 Loans and leases individually evaluated for impairment $859 $4,695 $13,667 $-- $126 $19,347 Loans and leases collectively evaluated for impairment 124,644 113,234 387,319 94,730 211,696 931,623 Ending balance $125,503 $117,929 $400,986 $94,730 $211,822 $950,970 2019 Loans and leases individually evaluated for impairment $1,647 $4,716 $6,625 $-- $139 $13,127 Loans and leases collectively evaluated for impairment 60,559 147,585 396,067 85,967 215,236 905,414 Ending balance $62,206 $152,301 $402,692 $85,967 $215,375 $918,541

22 Cashmere Valley Bank and Subsidiary
A summary of loans and leases by age, segregated by class of loans and leases, as of December 31, 2020 and 2019, was as follows (dollars in thousands):
2020
Loans and Leases 30-89
Days Past Due
Loans and Leases 90 or
More Days Past Due
Total Past Due Loans and Leases
Current Loans and
Leases Total Loans and Leases
Accruing Loans 90 or More Days
Past Due Commercial and agricultural $175 $63 $238 $125,265 $125,503 $-- Residential 1-4 family real estate 884 237 1,121 116,808 117,929 -- Commercial, construction, and farmland real estate 588 381 969 400,017 400,986 -- Municipal -- -- -- 94,730 94,730 --
Consumer and other 647 24 671 211,151 211,822 4 Total $2,294 $705 $2,999 $947,971 $950,970 $4 2019 Commercial and agricultural $344 $100 $444 $61,762 $62,206 $-- Residential 1-4 family real estate 1,370 36 1,406 150,895 152,301 -- Commercial, construction, and farmland real estate 184 443 627 402,065 402,692
--
Municipal 75 -- 75 85,892 85,967 -- Consumer and other 587 187 774 214,601 215,375 2 Total $2,560 $766 $3,326 $915,215 $918,541 $2
The following table provides information with respect to nonaccrual loans as of the years ended December 31, 2020 and 2019 (dollars in thousands):
2020 2019 Commercial and agricultural $63 $100 Residential 1-4 family real estate 409 36 Commercial, construction, and farmland real estate 522 443 Municipal -- -- Consumer and other 149 185 Total $1,143 $764
The following table provides information with respect to impaired loans as of the years ended December 31, 2020 and 2019 (dollars in thousands):
Unpaid Contractual
Principal Balance
Recorded Investment
With No Allowance
Recorded Investment
With Allowance
Total Recorded
Investment Related
Allowance
Average Recorded
Investment
2020 Commercial and agricultural $895 $895 $-- $895 $-- $1,098 Residential 1-4 family real estate 4,706 1,805 2,901 4,706 286 4,742 Commercial, construction, and farmland real estate 13,693 13,406 287 13,693 17 7,538 Municipal -- -- -- -- -- -- Consumer and other 126 3 123 126 1 137 Total $19,420 $16,109 $3,311 $19,420 $304 $13,515 2019 Commercial and agricultural $1,647 $1,307 $340 $1,647 $36 $1,520 Residential 1-4 family real estate 4,716 3,064 1,652 4,716 187 4,889 Commercial, construction, and farmland real estate 6,625 5,690 935 6,625 38 5,564 Municipal -- -- -- -- -- -- Consumer and other 139 -- 139 139 3 146 Total $13,127 $10,061 $3,066 $13,127 $264 $12,119

2020 Annual Report 23
At December 31, 2020, there were no commitments to lend additional funds to borrowers whose loans have been impaired. Loans over 90 days past due still accruing interest totaled $4,000 at December 31, 2020 and $2,000 at December 31, 2019. No interest income was recognized on a cash basis for impaired loans for the years ended December 31, 2020 and December 31, 2019. Two impaired loans from one relationship were in nonaccrual status as of December 31, 2020. In 2020, the Company did not record interest income on these loans. As of December 31, 2020, no additional interest income was accruing, and based on the collateral evaluation, the Company expects to collect the remaining principal balance due, which was $506,000. The Company assigns risk rating classifications to its loans. These risk ratings are divided into the following groups:
Pass – asset is considered of sufficient quality to preclude a Special Mention or an adverse rating. Pass assets generally are well protected by the current net worth and paying capacity of the obligor, by the value of the asset, or the underlying collateral. Special Mention – asset has potential weaknesses that deserve management’s close attention. If left uncorrected, these potential weaknesses may result in deterioration of the repayment prospects for the asset or in the Company’s credit position at some future date. Special Mention assets are not adversely classified and do not expose an institution to sufficient risk to warrant adverse classification. Substandard – asset is inadequately protected by the current net worth and paying capacity of the obligor or by the collateral pledged, if any. Assets so classified have well-defined weaknesses. They are characterized by the distinct possibility that the Company will sustain some loss if the deficiencies are not corrected. Doubtful – asset has the weaknesses of those classified Substandard with the added characteristic that the weaknesses make collection or liquidation in full, on the basis of currently existing facts, conditions, and values, highly questionable and improbable.
Credit quality indicators for the Company’s loan portfolio as of December 31, 2020 and 2019 grouped according to internally assigned risk ratings and payment activity (dollars in thousands):
Real Estate Commercial
and Agricultural
Residential 1-4 Family
Commercial, Construction,
and Farmland Municipal Consumer and Other
Total Loans and Leases
2020 Pass $123,651 $112,178 $378,826 $94,730 $208,715 $918,100 Special Mention 631 3,179 16,095 -- 2,665 22,570 Substandard 1,221 2,572 6,065 -- 442 10,300 Doubtful -- -- -- -- -- --
Total loans and leases $125,503 $117,929 $400,986 $94,730 $211,822 $950,970
Restructured $-- $-- $-- $-- $-- $-- Nonaccrual 63 409 522 -- 149 1,143 Nonperforming 63 409 522 -- 149 1,143 Performing 125,440 117,520 400,464 94,730 211,673 949,827
Total loans and leases $125,503 $117,929 $400,986 $94,730 $211,822 $950,970

24 Cashmere Valley Bank and Subsidiary
Real Estate Commercial
and Agricultural
Residential 1-4 Family
Commercial, Construction,
and Farmland Municipal Consumer and Other
Total Loans and Leases
2019 Pass $60,078 $146,879 $392,885 $85,967 $212,030 $897,839 Special Mention 463 3,052 2,713 -- 2,804 9,032 Substandard 1,665 2,370 7,094 -- 539 11,668 Doubtful -- -- -- -- 2 2
Total loans and leases $62,206 $152,301 $402,692 $85,967 $215,375 $918,541
Restructured $-- $-- $-- $-- $-- $-- Nonaccrual 100 36 443 -- 185 764 Nonperforming 100 36 443 -- 185 764 Performing 62,106 152,265 402,249 85,967 215,190 917,777
Total loans and leases $62,206 $152,301 $402,692 $85,967 $215,375 $918,541
Restructured loans are defined as the period end outstanding balance of loans that previously underwent a troubled debt restructuring that are not performing in accordance with restructured terms. The following table presents by class troubled debt restructurings (TDR’s) recorded during the years ended December 31, 2020 and 2019 (dollars in thousands, except number of contracts):
Number of Contracts
Pre-Modification Recorded
Investment
Post-Modification Recorded
Investment 2020 Commercial and agricultural 1 $70 $70 Residential 1-4 family real estate 2 294 294 Commercial, construction, and farmland real estate 2 9,336 9,336 Municipal -- -- -- Consumer and other 2 6 6 Total* 7 $9,706 $9,706 *Amounts exclude specific loan loss reserves
Number of Contracts
Pre-Modification Recorded
Investment
Post-Modification Recorded
Investment 2019 Commercial and agricultural 4 $658 $658 Residential 1-4 family real estate 1 195 195 Commercial, construction, and farmland real estate 3 4,640 4,640 Municipal -- -- -- Consumer and other -- -- -- Total* 8 $5,493 $5,493 *Amounts exclude specific loan loss reserves
The majority of TDR’s are determined to be impaired prior to being restructured. As such, they are individually evaluated for impairment, unless they are considered homogeneous loans in which case they are collectively evaluated for impairment. As of December 31, 2020 the Company had $304,000 in specific reserves on TDR’s which were restructured during the year ended December 31, 2020. The primary type of concession granted in all TDR’s during the year ended December 31, 2020 was maturity extensions. There were no TDR’s that were restructured and subsequently defaulted during the year ended December 31, 2020. On March 13, 2020, the FDIC issued a statement titled Working with Customers Affected by the Coronavirus. On April 7, 2020 the FDIC issued further interagency guidance titled Interagency Statement on Loan Modifications and Reporting for

2020 Annual Report 25
Financial Institutions Working with Customers Affected by the Coronavirus (Revised). The Company worked with affected borrowers and offered payment deferments or interest only payments. During 2020, the Company accommodated 494 loans totaling $102.7 million. At December 31, 2020, there were 49 accommodated loans remaining totaling $2.7 million. Section 4013 of the CARES Act was implemented March 1, 2020, and provides that a qualified loan modification is exempt by law from classification as a TDR as defined by GAAP. Section 541 of the Consolidated Appropriations Act, 2021 extended Section 4013 relief until January 1, 2022.
Note 5 - Premises and Equipment
Components of premises and equipment at December 31 are as follows (dollars in thousands):
2020 2019 Land $5,133 $5,133 Buildings and improvements 18,816 18,436 Furniture 5,690 5,397 Equipment 4,624 4,900 Assets in process 377 5 Total cost 34,640 33,871 Less accumulated depreciation (18,259) (17,099) Total premises and equipment $16,381 $16,772
As of December 31, 2020 there were commitments to replace all ATM’s as well as replace the Company’s AS400. One half of the total ATM hardware and installation cost was paid in 2020 and the remaining ATM commitment was approximately $357,000. The amount committed to purchase the AS400 was approximately $186,000. Depreciation expense was $1,780,000 and $1,890,000 in 2020 and 2019, respectively.
Note 6 – Goodwill and Other Intangible Assets
The Company recorded approximately $20,000 of goodwill and $144,000 of amortizable intangible assets in connection with the APX Insurance, LLC merger that occurred on July 1, 2020. The amortization schedule of intangible assets in connection with acquisitions for future years ending December 31 is as follows (dollars in thousands):
2021 $1,023 2022 468 2023 29 2024 29 2025 15
$1,564
Note 7– Mortgage Servicing Rights
Mortgage servicing rights (MSR’s) are evaluated periodically for possible impairment based on the difference between the carrying amount and current fair value of the MSR’s by risk stratification. If a temporary impairment exists, a valuation allowance is established for any excess of amortized cost over the current fair value through a charge to income. A direct write-down is performed when the recoverability of a recorded valuation allowance is determined to be remote. Unlike a valuation allowance, a direct write-down permanently reduces the carrying value of the MSR and the valuation allowance, precluding subsequent reversals.

26 Cashmere Valley Bank and Subsidiary
Mortgage loans serviced for others are not included on the accompanying consolidated balance sheets. The unpaid principal balances of mortgage loans serviced for others were $444,039,000 and $405,107,000 at December 31, 2020 and 2019, respectively. Custodial escrow balances maintained in connection with the foregoing loan servicing were approximately $2,735,000 and $2,450,000 at December 31, 2020 and 2019, respectively. The weighted average amortization period of the Company’s servicing rights was 4.6 years and 5.9 years in 2020 and 2019, respectively. The following summarizes the activity in mortgage servicing rights for the years ended December 31 (dollars in thousands):
The estimated fair value of the Company’s MSR portfolio was $3,117,000 and $3,715,000 at December 31, 2020 and 2019, respectively. Fair value of mortgage servicing rights is based on market prices for comparable mortgage servicing contracts when available. In periods of market inactivity, fair value is determined using a discounted cash flow analysis, utilizing observable market data with unobservable adjustments. The analysis takes into consideration existing conditions in the secondary servicing markets, such as prices from recently executed servicing transactions and market discount rates. The adjustments made to observable data include adjustments for delinquency and loss rates.
Note 8 - Deposits
The composition of deposits is as follows (dollars in thousands): Deposits at December 31
Interest Expense for the Years Ended December 31
2020 2019 2020 2019 Noninterest bearing demand deposits $365,553 $274,269 $-- $-- NOW accounts 348,099 271,314 938 1,188 Money market and savings accounts 773,104 618,005 1,278 1,809 Time deposits greater than $250,000 47,892 56,972 1,171 846 Time deposits $250,000 or less 185,323 202,787 3,460 3,491 Total $1,719,971 $1,423,347 $6,847 $7,334
Time deposits at December 31, 2020 are scheduled to mature as follows (dollars in thousands):
Up to
$250,000
Greater than
$250,000
0 to 90 days $26,974 $5,828 91 to 365 days 63,118 14,081 1 year to 3 years 62,651 17,258 Over 3 years 32,580 10,725 Total $185,323 $47,892
Total demand deposit overdrafts that have been reclassified to loans were $235,000 and $257,000 at December 31, 2020 and 2019, respectively.
2020 2019 Balance as of beginning of year $2,147 $1,657 Originations 1,438 797 Amortization (729) (307) Adjustment valuation -- -- Balance as of end of year $2,856 $2,147

2020 Annual Report 27
The Company is a State of Washington Public Depository. All such public depositories are required to be members of Washington State’s Public Deposit Protection Commission (PDPC). As such, when there is a loss of public funds at a member institution, those funds are in most instances insured to some extent by the federal government. To the degree a public deposit is not insured by the federal government, the PDPC will assess a claim first against the institution responsible for the loss and then against the pool of collateral held by other PDPC member institutions. Each institution is then responsible to pay its portion of the cost in proportion to the share of public funds held by that institution. The Company held $52,339,000 and $48,940,000 of public deposits as of December 31, 2020 and 2019, respectively.
Note 9 - Short-Term Borrowings
Securities sold under agreements to repurchase and line of credit advances from the Federal Home Loan Bank Des Moines (FHLB) represent short-term borrowings. At December 31, 2020 and 2019 there were no outstanding balances for credit advances. The following is a summary of such short-term borrowings for the years ended December 31 (dollars in thousands):
2020
2019
Average balance during the year $16,349 $10,407 Average interest rate during the year 0.23% 0.34% Maximum month end balance during the year $20,885 $14,848
Securities sold under agreements to repurchase are secured by specific securities which, in all cases, the Company maintains control. The securities’ underlying agreements to repurchase entered into by the Company are for the same securities originally sold, with a one-day maturity.
Balance at December 31: 2020 2019 Securities under agreements to repurchase $16,395 $10,154 Weighted average interest rate at year end 0.17% 0.34% Carrying value of underlying securities $16,578 $18,229 Market value of underlying securities $18,058 $18,811
Note 10 - Long-Term Borrowings
There were no long-term borrowings at December 31, 2020 and 2019.
Note 11 - Income Taxes
Income taxes are comprised of the following for the years ended December 31 (dollars in thousands):
2020 2019 Current $4,411 $3,555 Deferred (469) 283 State income taxes 77 56 Total income taxes $4,019 $3,894

28 Cashmere Valley Bank and Subsidiary
The following is a reconciliation of the statutory income tax rate to the effective income tax rate for the years ended December 31 (dollars in thousands):
2020 2019
Amount
Percent of Pretax Income
Amount
Percent of Pretax Income
Income tax at statutory rates $6,203 21.0% $5,731 21.0% Increase resulting from: State income tax 61 0.2% 45 0.2% Decrease resulting from: Tax-exempt income (1,807) (6.1)% (1,781) (6.5)% Tax credits (551) (1.9)% (502) (1.8)% Prior year adjustment -- 0.0% 347 1.2% Other 113 0.4% 54 0.2% Total income tax expense $4,019 13.6% $3,894 14.3%
The tax effects of temporary differences that give rise to significant portions of deferred tax assets and liabilities at December 31 are as follows (dollars in thousands):
2020 2019 Deferred Tax Assets: Allowance for credit losses $2,883 $2,350 Deferred compensation 610 566 Other 573 416 Total deferred tax assets 4,066 3,332 Deferred Tax Liabilities: Accumulated depreciation and amortization $1,539 $1,598 Deferred loan costs 653 478 Unrealized gain on securities available for sale 7,277 1,711 Mortgage servicing rights 600 451 FHLB dividends 136 137 Total deferred tax liabilities 10,205 4,375 Net deferred tax (liabilities) $(6,139) $(1,043)
Note 12 – Related-Party Transactions
In the ordinary course of business the Company has transactions with related parties, including but not limited to: directors, principal officers, their immediate families, and affiliated companies in which they are principal shareholders. In the opinion of management, all related party transactions have been on the same terms as the terms for comparable transactions with outside parties. The following table details the loan activity with related parties at December 31 (dollars in thousands):
2020 2019 Beginning balance $18,195 $21,551 New loans or advances during period 15,898 11,131 Repayments during period (13,953) (14,487) Aggregate amount outstanding $20,140 $18,195
Loan commitments $23,804 $19,888 Related party deposits $8,760 $7,713

2020 Annual Report 29
Note 13 - Commitments and Contingencies
Credit
The Company is party to financial instruments with off-balance sheet risk in the normal course of business to meet the financing needs of its customers. These financial instruments include commitments to extend credit and standby letters of credit. These instruments involve, to varying degrees, elements of credit risk in excess of the amount recognized on the consolidated balance sheets. The Company’s exposure to credit loss in the event of nonperformance by the other party to the financial instrument for commitments to extend credit and standby letters of credit is represented by the contractual amount of those instruments. The Company uses the same credit policies in making commitments and conditional obligations as it does for balance sheet instruments. A summary of the Company’s commitments at December 31 is as follows (dollars in thousands):
2020 2019 Commitments to extend credit: Credit card lines $34,863 $33,517 Commercial real estate, construction and development 56,058 53,713 Home equity lines of credit 52,163 47,433 Other 76,486 71,882 Total commitments to extend credit $219,570 $206,545 Standby letters of credit $65 $80
Commitments to extend credit are agreements to lend to a customer as long as there is no violation of any condition established in the contract. Since many of the commitments are expected to expire without being drawn upon, the total commitment amounts do not necessarily represent future cash requirements. The Company’s experience has been that between approximately 10% and 25% of loan commitments are drawn upon by customers. The Company evaluates each customer’s creditworthiness on a case-by-case basis. The amount of collateral obtained, if deemed necessary by the Company upon extension of credit, is based on management’s credit evaluation of the customer. Associated with the unfunded commitment, the Company has established a loss reserve in the amount of $256,000 as of December 31, 2020 and 2019.
Standby Letters of Credit
Standby letters of credit are conditional commitments issued by the Company to guarantee the performance of a customer to a third-party. Those guarantees are primarily issued to support public and private borrowing arrangements. The credit risk involved in issuing letters of credit is essentially the same as that involved in extending loan facilities to customers. In certain circumstances collateral is deemed necessary to secure the commitment.
Legal
Because of the nature of its activities, the Company is subject to various pending and threatened legal actions which arise in the ordinary course of business. In the opinion of management, liabilities arising from these claims, if any, will not have a material effect on the financial position of the Company.
Borrowing Facilities
The Company has agreements with commercial banks for lines of credit totaling $74,000,000, none of which was used at December 31, 2020. The Company has a credit line with the Federal Home Loan Bank of Des Moines for 45% of assets. As of December 31, 2020 the credit line was approximately $897,429,000 none of which was used at December 31, 2020. This line is secured with a Blanket Pledge Agreement with the Federal Home Loan Bank (Note 9).

30 Cashmere Valley Bank and Subsidiary
Investments
The Company entered into a subscription agreement to purchase four units at $500,000 per unit for an interest in Homestead Equity Fund A Washington Limited Partnership (HEFA-WA) for which funding has been completed. HEFA-WA has been formed to invest in partnerships or limited liability companies, which will acquire, construct, rehabilitate, operate, and dispose of low income housing developments which are located in Washington State. The housing developments will be eligible for the federal low income housing tax credit and, in some cases, the historic rehabilitation tax credit available under the Internal Revenue Code of 1986, as amended. The Company accounts for the investment under the equity method in accordance with ASC 323, “Investments – Equity Method and Joint Ventures,” and a pass-through loss of $6,000 and $66,000 was recorded during 2020 and 2019, respectively. At December 31, 2020 and 2019, the Company’s partnership equity was $2,000 and $1,000, respectively, and is included in other assets. The Company entered into a subscription agreement to purchase one unit at $1,000,000 for an interest in Homestead Western Communities Fund Limited Partnership (HWCF) for which funding has been completed. HWCF has been formed to invest in partnerships or limited liability companies, which will acquire, construct, rehabilitate, operate, and dispose of low income housing developments which are located in the states of Oregon, Washington, Idaho, and California. The housing developments will be eligible for the federal low income housing tax credit and, in some cases, the historic rehabilitation tax credit available under the Internal Revenue Code of 1986, as amended. The Company accounts for the investment under the equity method in accordance with ASC 323, “Investments – Equity Method and Joint Ventures,” and a pass-through loss of $15,000 and $146,000 was recorded during 2020 and 2019, respectively. At December 31, 2020 and 2019, the Company’s partnership equity was $5,000 and $30,000, respectively. The Company entered into a subscription agreement to purchase five units at $1,000,000 per unit for an interest in Homestead Equity Fund X Limited Partnership (HEF-X). HEF-X has been formed to invest in partnerships or limited liability companies, which will acquire, construct, rehabilitate, operate, and dispose of low income housing developments primarily located in the states of Oregon, Washington, Idaho, and California. The housing developments will be eligible for the federal low income housing tax credit and, in some cases, the historic rehabilitation tax credit available under the Internal Revenue Code of 1986, as amended. The Company accounts for the investment under the equity method in accordance with ASC 323, “Investments – Equity Method and Joint Ventures,” and a pass-through loss of $611,000 and $608,000 was recorded during 2020 and 2019, respectively. At December 31, 2020 and 2019, the Company’s partnership equity was $2,255,000 and $2,753,000, respectively. The Company’s remaining contractual contribution for Homestead Equity Fund X (HEF-X) of $88,000 is expected to be paid in 2021. The Company entered into a subscription agreement to purchase one and a half units at $1,000,000 per unit for an interest in CREA Corporate Tax Credit Fund 72, LLC (CREA). CREA has been formed to invest in partnerships or limited liability companies, which will acquire, construct, rehabilitate, operate, and dispose of low income housing developments nationwide. The housing developments will be eligible for the federal low income housing tax credit and, in some cases, the historic rehabilitation tax credit available under the Internal Revenue Code of 1986, as amended. The Company accounts for the investment under the equity method in accordance with ASC 323, “Investments – Equity Method and Joint Ventures,” and a pass-through loss of $57,000 and $5,000 was recorded during 2020 and 2019, respectively. At December 31, 2020 and 2019, the Company’s partnership equity was $30,000 and $41,000, respectively. The Company’s remaining contractual contribution for CREA Corporate Tax Credit Fund 72, LLC (CREA) of $1,275,000 is expected to be paid as follows (dollars in thousands):
2021 $820 2022 386 2023 2 Thereafter 67 $1,275
Employment Agreements
The Company has entered into employment contracts with certain key employees, which provide for contingent payments subject to future events. These agreements are discussed in Note 15.

2020 Annual Report 31
Derivatives
For the years ended December 31, 2020 and 2019, the fair value of the hedged loans of $241,000 and $172,000, respectively, are recorded in loans held for investment and the related swap liability is recorded in other liabilities at $237,000 and $172,000, respectively. The Company pledged a certificate of deposit due from the counterparty of the hedging instruments as collateral for the swap liability. This certificate of deposit had a balance of $100,000 at December 31, 2020 and 2019, respectively. The notional amounts of the interest rate swaps were $1,671,000 and $2,025,000 at December 31, 2020 and 2019, respectively. The Company recognized no loss in 2020 and 2019 which represents the ineffective portion of all fair value hedges. All components of each derivative’s gain or loss are included in the assessment of hedge effectiveness, unless otherwise noted.
COVID-19
The Company anticipates that impacts of COVID-19 on Company operations as of December 31, 2020, will continue for the foreseeable future. Several industries may continue to be adversely impacted, and the Company’s customers may be unable to fulfill their contractual obligations to the Company. This could cause the Company to experience material adverse effects, which may include all or a combination of valuation impairments on the Company’s intangible assets, investments, loans, loan servicing rights, or deferred tax assets.
Note 14 – Significant Concentration of Credit Risk
Most of the Company’s business activity is with customers located in the state of Washington. Investments in state and municipal securities involve government entities primarily within the state. At December 31, 2020, 7.72% of total loans outstanding were for construction related projects. Of those, 1.24% of total loans outstanding were residential developed lot loans to consumers. Loans are generally limited, by state banking regulations, to 20% of the Company’s capital to any one borrower, excluding accumulated other comprehensive income. At December 31, 2020 the Company’s legal lending limit was $43,081,000. Standby letters of credit were granted primarily to commercial borrowers. The Company, as a matter of practice, generally does not extend credit to any single borrower or group of related borrowers in excess of $24,000,000. At December 31, 2020, no borrowing relationship was in excess of this limit.
Note 15 - Employee Compensation Plans
Stock Option Plan
The Company has a stock option plan under which certain key employees have been granted options to purchase shares of common stock. Under the plan, the Company may grant options of its common stock to certain key employees, of which 237,599 were available for grant at December 31, 2020. Options have an exercise price equal to the fair market value of the stock as of the date of grant. In 2018 the company adopted a vesting schedule with no vesting on grant date, and 20% vesting on each of the five subsequent anniversaries of the grant. Options have a maximum contractual term of ten years. The Black-Scholes model requires the use of assumptions noted in the following table. The dividend yield is based on the Company’s actual and expected dividends paid to shareholders. The Company uses historical data to estimate the expected life, which represents the period of time the options are expected to be outstanding. Expected stock price volatility is based on the Company’s historical stock price, adjusted for dividends. The risk-free interest rate is based on the U.S. Treasury yield curve rate in effect at grant date with average equivalent term. The fair value of each option was estimated on the date of grant based on the Black-Scholes option pricing model and used the following weighted average assumptions:
2020 2019 Dividend yield 2.20% 1.97% Expected life 6.5 years 6.6 years Risk-free interest rate 1.21% 2.20% Expected volatility 20.36% 19.03%
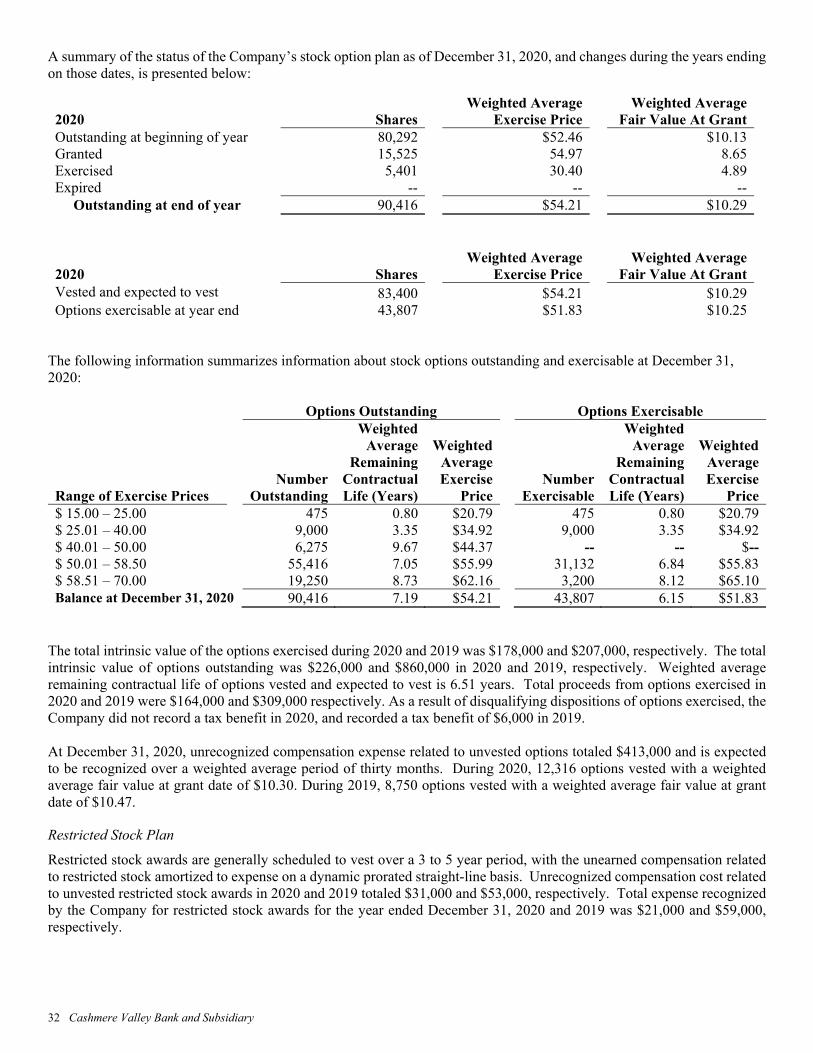
32 Cashmere Valley Bank and Subsidiary
A summary of the status of the Company’s stock option plan as of December 31, 2020, and changes during the years ending on those dates, is presented below:
2020 Shares Weighted Average
Exercise Price Weighted Average
Fair Value At Grant Outstanding at beginning of year 80,292 $52.46 $10.13 Granted 15,525 54.97 8.65 Exercised 5,401 30.40 4.89 Expired -- -- -- Outstanding at end of year 90,416 $54.21 $10.29
2020 Shares Weighted Average
Exercise Price Weighted Average
Fair Value At Grant Vested and expected to vest 83,400 $54.21 $10.29 Options exercisable at year end 43,807 $51.83 $10.25
The following information summarizes information about stock options outstanding and exercisable at December 31, 2020:
Options Outstanding
Options Exercisable
Number Outstanding
Weighted Average
Remaining Contractual Life (Years)
Weighted Average Exercise
Price
Number Exercisable
Weighted Average
Remaining Contractual Life (Years)
Weighted Average Exercise
Price
Range of Exercise Prices
$ 15.00 – 25.00 475 0.80 $20.79 475 0.80 $20.79 $ 25.01 – 40.00 9,000 3.35 $34.92 9,000 3.35 $34.92 $ 40.01 – 50.00 6,275 9.67 $44.37 -- -- $-- $ 50.01 – 58.50 55,416 7.05 $55.99 31,132 6.84 $55.83 $ 58.51 – 70.00 19,250 8.73 $62.16 3,200 8.12 $65.10 Balance at December 31, 2020 90,416 7.19 $54.21 43,807 6.15 $51.83
The total intrinsic value of the options exercised during 2020 and 2019 was $178,000 and $207,000, respectively. The total intrinsic value of options outstanding was $226,000 and $860,000 in 2020 and 2019, respectively. Weighted average remaining contractual life of options vested and expected to vest is 6.51 years. Total proceeds from options exercised in 2020 and 2019 were $164,000 and $309,000 respectively. As a result of disqualifying dispositions of options exercised, the Company did not record a tax benefit in 2020, and recorded a tax benefit of $6,000 in 2019. At December 31, 2020, unrecognized compensation expense related to unvested options totaled $413,000 and is expected to be recognized over a weighted average period of thirty months. During 2020, 12,316 options vested with a weighted average fair value at grant date of $10.30. During 2019, 8,750 options vested with a weighted average fair value at grant date of $10.47.
Restricted Stock Plan
Restricted stock awards are generally scheduled to vest over a 3 to 5 year period, with the unearned compensation related to restricted stock amortized to expense on a dynamic prorated straight-line basis. Unrecognized compensation cost related to unvested restricted stock awards in 2020 and 2019 totaled $31,000 and $53,000, respectively. Total expense recognized by the Company for restricted stock awards for the year ended December 31, 2020 and 2019 was $21,000 and $59,000, respectively.

2020 Annual Report 33
The following table summarizes the Company’s restricted stock awards activity:
Shares Weighted Average Fair
Value At Grant Outstanding at December 31, 2018 2,980 $51.41 Granted 200 59.45 Vested (1,580) 47.64 Forfeited (50) 58.50 Outstanding at December 31, 2019 1,550 $56.38 Granted -- $-- Vested (960) 52.95 Forfeited -- -- Outstanding at December 31, 2020 590 $61.95
Scheduled vesting for outstanding restricted stock awards as of December 31, 2020 is as follows: Year Ended 2021 2022 2023 2024 2025 Total Scheduled vesting – restricted stock awards 350 100 100 40 -- 590
Profit-Sharing Plans
The Company has a 401(k) employee benefit plan for those employees who meet eligibility requirements set forth in the plan. Eligible employees may contribute up to 100% of their compensation, subject to certain IRS limits. The Company provides a Safe Harbor match of 100% of the first 4% contributed by participants, subject to certain IRS limits. Additionally, matching contributions may be made by the Company pursuant to a prescribed formula based on the Company’s achievement of certain performance goals. The Company contributed $578,000 and $551,000 in 2020 and 2019, respectively. Incentive compensation is awarded to certain employees based on the financial performance of the Company. Cash bonuses were awarded pursuant to a formula targeted on the Company achieving certain performance goals for the years ended in 2020 and 2019, with the amounts awarded in 2021 and 2020. Amounts awarded under the plan for 2020 and 2019 were $893,000 and $752,000, respectively.
Deferred Compensation Plan
The Company entered into various deferred compensation arrangements with key employees. The agreements provide for either employee and Company matching contributions or employer only contributions. At December 31, 2020 and 2019, the Company had a recorded liability in the amount of $2,903,000 and $2,706,000 respectively. The Company contributed $172,000 and $161,000 in 2020 and 2019, which represented plan earnings or planned contributions subject to vesting criteria in accordance with the deferred compensation agreements.
Insurance
The Company provides certain health care, disability, and life insurance benefits for current employees. The cost of health care benefits for employees is recognized as expense when paid. Life insurance benefits for employees are provided through an insurance company whose premiums are based on the benefits paid during the year. The Company recognizes the cost of providing such benefits by expensing the monthly insurance premiums. For 2020 and 2019, the cost of providing health care, disability, and life insurance benefits was $1,616,000 and $1,724,000, respectively.

34 Cashmere Valley Bank and Subsidiary
Note 16 - Regulatory Matters
The Company is subject to various regulatory capital requirements administered by the federal banking agencies. Failure to meet minimum capital requirements can initiate certain mandatory and possibly additional discretionary actions by regulators that, if undertaken, could have a direct material effect on the Company’s consolidated financial statements. Under capital adequacy guidelines of the regulatory framework for prompt corrective action, the Company must meet specific capital adequacy guidelines that involve quantitative measures of the Company’s assets, liabilities, and certain off-balance sheet items, as calculated under regulatory accounting practices. The Company’s capital classification is also subject to qualitative judgments by the regulators about components, risk weightings, and other factors. Quantitative measures established by regulation to ensure capital adequacy require the Company maintain minimum amounts and ratios of Tier 1 capital to total average assets and minimum ratios of Tier 1 and total capital to risk-weighted assets. In July 2013, the Board of Governors of the Federal Reserve System and the Federal Deposit Insurance Corporation (FDIC) approved the final rules implementing the Basel Committee on Banking Supervision’s capital guidelines for U.S. banks (Basel III). Under the final rules, which became effective for the Company on January 1, 2015 and are subject to a phase-in period through January 1, 2019, minimum requirements increased for both the quantity and the quality of capital held by the Company. The rules include a new Common Equity Tier 1 capital to risk-weighted assets ratio (CET1 ratio) of 4.5% and a capital conservation buffer of 2.5% above the regulatory minimum risk-based capital requirements, which fully phased in, effectively results in a minimum CET1 ratio of 7.0%. Basel III also (i) raises the minimum ratio of Tier 1 capital to risk-weighted assets from 4.0% to 6.0% (which, with the capital conservation buffer, effectively results in a minimum Tier 1 capital to risk-weighted assets ratio of 8.5% when fully phased in); (ii) effectively results in a minimum total capital to risk-weighted assets ratio of 10.5% (with the capital conservation buffer fully phased in); and (iii) requires a minimum leverage ratio of 4.0%. Basel III also makes changes to risk weights for certain assets and off-balance sheet exposures. As of December 31, 2020, the most recent notification from the Company’s regulator categorized the Company as well capitalized under the regulatory framework for prompt corrective action. The federal banking agencies jointly issued the CBLR final rule effective January 1, 2020. The Company elected to use the community bank leverage ratio (CBLR) framework effective January 1, 2020, which allows qualifying community banking organizations to calculate a leverage ratio to measure capital adequacy. A CBLR bank will be deemed to have met the well-capitalized ratio requirements and be in compliance with the general applicable capital rule. A qualifying community banking organization is defined as having less than $10 billion in total consolidated assets, a leverage ratio greater than 9%, off-balance sheet exposures of 25% or less of total consolidated assets, and trading assets and liabilities of 5% or less of total consolidated assets. The Company meets all CBLR requirements as of December 31, 2020.
Restrictions on Retained Earnings
The Company is restricted from paying dividends in an amount that would decrease regulatory capital below the minimum amounts shown above.
Note 17 - Fair Value
The Company is required to disclose the estimated fair value of financial instruments, both assets and liabilities on and off the balance sheet, for which it is practicable to estimate fair value. These fair value estimates are made at December 31, 2020 based on relevant market information and information about the financial instruments. Fair value estimates are intended to represent the price at which an asset could be sold, or the price for which a liability could be settled. However, given there is no active market or observable market transactions for many of the Company’s financial instruments, the Company has made estimates of many of these fair values. Those estimates, which are subjective in nature, involve uncertainties and matters of significant judgment, and therefore cannot be determined with precision. Changes in assumptions could significantly affect the estimated values.

2020 Annual Report 35
Fair Value of Financial Instruments
The carrying amounts and estimated fair value of the Company’s financial instruments are as follows (dollars in thousands):
December 31, 2020 December 31, 2019 Carrying Fair Carrying
Amount Fair
Value Level Amount Value Financial Assets Cash and cash equivalents 1 $135,725 $135,725 $141,393 $141,393 Securities available for sale 2 856,327 856,327 542,087 542,087 FHLB and PCBB stock 2 2,220 2,220 2,063 2,063 Loans held for sale 2 1,470 1,470 1,804 1,804 Loans and leases, net 3 937,240 945,851 907,353 904,733 Mortgage servicing rights 3 2,856 3,117 2,147 3,715 Accrued interest receivable 2 7,829 7,829 5,625 5,625 Bank Owned Life Insurance 2 15,908 15,908 15,447 15,447 Financial Liabilities Deposits 3 $1,719,971 $1,593,292 $1,423,347 $1,264,069 Borrowings 3 16,395 16,395 10,154 10,143 Interest rate swaps 2 237 237 172 172 Accrued interest payable 2 612 612 765 765
The Company assumes interest rate risk as a result of its normal operations. As a result of interest rate level changes, fair values of the Company’s financial instruments may change in a direction that is either favorable or unfavorable to the Company. Management attempts to match maturities of assets and liabilities to the extent believed necessary to minimize interest rate risk. However, borrowers with fixed rate obligations are less likely to prepay in a rising rate environment and more likely to prepay in a falling rate environment. Conversely, depositors who are receiving fixed rates are more likely to withdraw funds before maturity in a rising rate environment and less likely to do so in a falling rate environment. Management monitors rates and maturities of assets and liabilities, and attempts to minimize interest rate risk by adjusting terms of new loans and deposits and by investing in securities with terms that mitigate the Company’s overall interest rate risk. The following methods and assumptions were used by the Company in estimating the fair value of financial instruments:
Securities Available for Sale
Securities totaling $856,327,000 are reported at fair value utilizing Level 2 inputs for available for sale securities. The fair values of securities utilizing Level 2 inputs are based on quoted market prices of similar instruments and dealer quotes or determined utilizing a present value income model that utilized observable market-based inputs, as described in Note 1. The fair values were obtained from an independent pricing service and internally validated. The fair value measurements consider observable data that may include dealer quotes, market spreads, cash flows, the U.S. Treasury yield curve, live trading levels, trade execution data, market consensus, prepayment speeds, credit information, and the bond’s terms and conditions, among other things.
Interest Rate Swap Derivatives
The fair values of interest rate swap derivatives are estimated by an independent third-party using a discounted cash flow method based on current incremental rates for similar types of arrangements. For purposes of potential valuation adjustments to its derivative positions, the Company evaluates the credit risk of its counterparties as well as that of the Company. Accordingly, the Company has considered factors such as the likelihood of default by the Company and its counterparties, its net exposures, and remaining contractual life, among other things, in determining if any fair value adjustments related to credit risk are required. Counterparty exposure is evaluated by considering the amounts of collateral securing the position. The Company reviews its counterparty exposure on a regular basis, and when necessary, appropriate business actions would be taken to adjust the exposures. The Company also uses this approach to estimate its own credit risk on derivative liability positions. To date, the Company has not realized any significant losses due to a counterparty’s
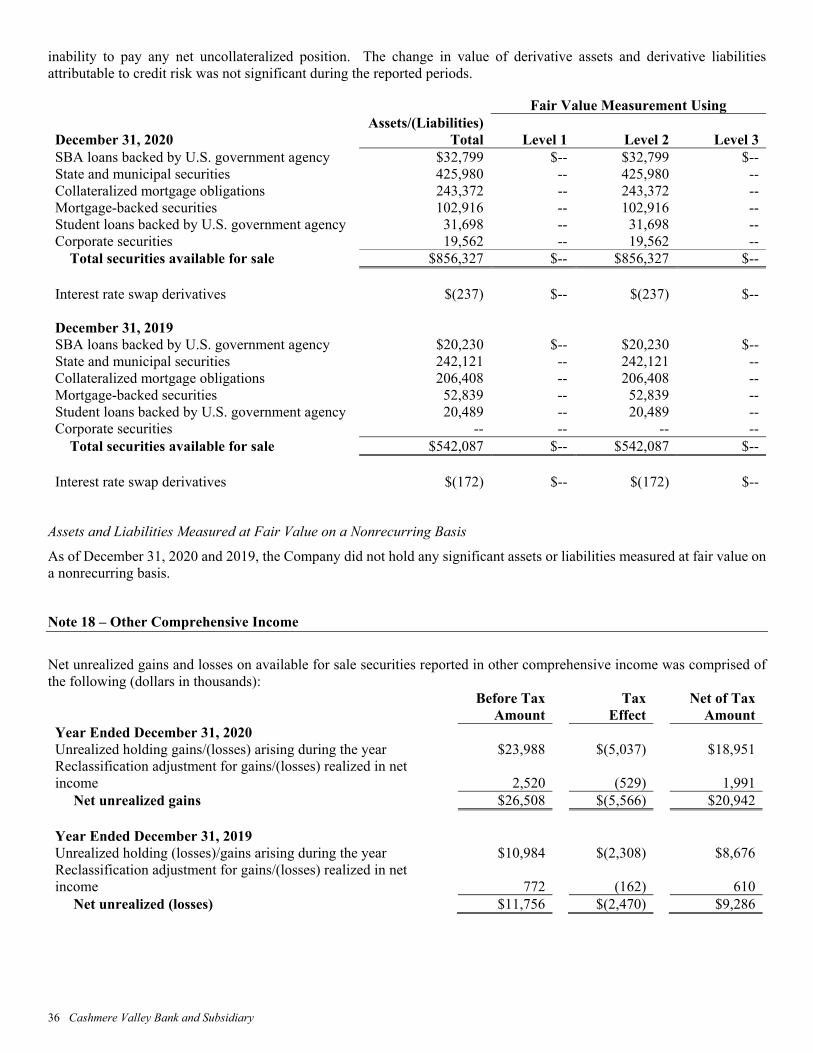
36 Cashmere Valley Bank and Subsidiary
inability to pay any net uncollateralized position. The change in value of derivative assets and derivative liabilities attributable to credit risk was not significant during the reported periods. Fair Value Measurement Using Assets/(Liabilities) December 31, 2020 Total Level 1 Level 2 Level 3 SBA loans backed by U.S. government agency $32,799 $-- $32,799 $-- State and municipal securities 425,980 -- 425,980 -- Collateralized mortgage obligations 243,372 -- 243,372 -- Mortgage-backed securities 102,916 -- 102,916 -- Student loans backed by U.S. government agency 31,698 -- 31,698 -- Corporate securities 19,562 -- 19,562 -- Total securities available for sale $856,327 $-- $856,327 $-- Interest rate swap derivatives $(237) $-- $(237) $-- December 31, 2019 SBA loans backed by U.S. government agency $20,230 $-- $20,230 $-- State and municipal securities 242,121 -- 242,121 -- Collateralized mortgage obligations 206,408 -- 206,408 -- Mortgage-backed securities 52,839 -- 52,839 -- Student loans backed by U.S. government agency 20,489 -- 20,489 -- Corporate securities -- -- -- -- Total securities available for sale $542,087 $-- $542,087 $-- Interest rate swap derivatives $(172) $-- $(172) $--
Assets and Liabilities Measured at Fair Value on a Nonrecurring Basis
As of December 31, 2020 and 2019, the Company did not hold any significant assets or liabilities measured at fair value on a nonrecurring basis.
Note 18 – Other Comprehensive Income
Net unrealized gains and losses on available for sale securities reported in other comprehensive income was comprised of the following (dollars in thousands):
Before Tax Amount
Tax Effect
Net of Tax Amount
Year Ended December 31, 2020 Unrealized holding gains/(losses) arising during the year $23,988 $(5,037) $18,951 Reclassification adjustment for gains/(losses) realized in net income 2,520 (529) 1,991 Net unrealized gains $26,508 $(5,566) $20,942 Year Ended December 31, 2019 Unrealized holding (losses)/gains arising during the year $10,984 $(2,308) $8,676 Reclassification adjustment for gains/(losses) realized in net income 772 (162) 610 Net unrealized (losses) $11,756 $(2,470) $9,286

2020 Annual Report 37
Note 19 – Shareholders’ Equity and Earnings per Common Share
Earnings per Common Share
The following table presents a reconciliation of the number of shares used in the calculation of basic and diluted earnings per common share (dollars in thousands, except share and per share amounts): 2020 2019 Distributed earnings allocated to common stock $13,506 $5,357 Undistributed earnings allocated to common stock 12,015 18,039 Net earnings allocated to common stock $25,521 $23,396 Weighted average common shares outstanding - Basic 3,971,788 4,102,266 Dilutive effect of options outstanding 2,986 9,860 Weighted average common shares outstanding - Diluted 3,974,774 4,112,126 Earnings per common share – Basic $6.43 $5.70 Earnings per common share – Diluted $6.42 $5.69 “Out of the money” stock options 74,666 2,000
Stock Repurchase Plans
From time to time, the Company’s board of directors has authorized stock repurchase plans. In general, stock repurchase plans allow the Company to proactively manage its capital position and return excess capital to shareholders. Shares purchased under such plans also provide the Company with shares of common stock necessary to satisfy obligations related to stock compensation awards. On October 1, 2019, the Company announced a share repurchase plan allowing the Company to repurchase up to 500,000 shares. Under the repurchase plan, the Company offered to purchase 500,000 shares via a tender offer at a price of $62.00 per share. The repurchase plan did not require the Company to repurchase a specific number of shares and the tender offer expired on November 15, 2019. No shares were repurchased in 2020. In 2019, the Company announced it had repurchased 159,805 shares at a cost of $9,908,000.
Note 20 – Revenue from Contracts with Customers
All of the Company's revenue from contracts with customers in the scope of ASC 606 is recognized in noninterest income. The following table presents the Company's sources of noninterest income for the years ended December 31, 2020 and 2019 (dollars in thousands). Items outside of the scope of ASC 606 are noted as such. 2020 2019 Noninterest income: Service charges on deposit accounts $1,247 $1,914 Mortgage banking operations (a) 7,621 3,390 Net (loss) on sales of securities available for sale (a) 2,520 772 Brokerage commissions 1,002 882 Insurance commissions and fees 4,616 4,579 Net interchange income 2,246 1,549 BOLI cash value (a) 461 437 Remaining other (a) 1,303 1,258 Total noninterest income $21,016 $14,781
(a) Not within scope of ASC 606

38 Cashmere Valley Bank and Subsidiary
Deposit Service Charges
The Company earns fees from its deposit customers for account maintenance, transaction-based and overdraft services. Account maintenance fees consist primarily of account fees and analyzed account fees charged on deposit accounts on a monthly basis. The performance obligation is satisfied and the fees are recognized on a monthly basis as the service period is completed. Transaction-based fees on deposit accounts are charged to deposit customers for specific services provided to the customer, such as non-sufficient funds fees, overdraft fees, and wire fees. The performance obligation is completed as the transaction occurs and the fees are recognized at the time each specific service is provided to the customer.
Debit and Credit Card Interchange Fee Income and Expenses
Debit and credit interchange income represent fees earned when a card issued by the Company is used. The Company earns interchange fees from debit cardholder transactions through the Visa payment network. Interchange fees from cardholder transactions represent a percentage of the underlying transaction value and are recognized daily, concurrently with the transaction processing services provided to the cardholder. The performance obligation is satisfied and the fees are earned when the cost of the transaction is charged to the cardholders' card. Certain expenses directly associated with the credit and debit card are recorded on a net basis with the interchange income.
Brokerage Revenue
Brokerage fees consist of fees earned from advisory asset management, trade execution and administrative fees from investments. Advisory asset management fees are variable, since they are based on the underlying portfolio value, which is subject to market conditions and asset flows. Advisory asset management fees are recognized quarterly and are based on the portfolio values at the end of each quarter. Brokerage accounts are charged commissions at the time of a transaction and the commission schedule is based upon the type of security and quantity. The amount of revenue earned is determined by the value and type of each instrument sold and is recognized at the time the policy or contract is written. In addition, revenues are earned from selling insurance and annuity policies.
Insurance Revenue
Insurance revenue consists of commissions and fees from the sales of insurance policies and related insurance services. Insurance commission income is recognized at the later of the effective date of the insurance policy or billing date, net of adjustments. Such adjustments are recorded when the amount can be reasonably estimated, which is generally in the period in which they occur. Commission revenues related to installment billings are recognized on the latter of effective or invoiced date. Contingent commissions are estimated and accrued relative to the recognition of corresponding commissions. Management determines a policy cancellation reserve based upon historical cancellation experience adjusted for any known circumstances. Subsequent commission adjustments were recognized upon receipt of notification from insurance companies concerning such adjustments.
Note 21 – Subsequent Events
The Company performed an evaluation of subsequent events through March 15, 2021, the date these financial statements were available to be issued. On January 19 , 2021, the Company’s Board of Directors approved a dividend of $0.75 per share, payable and paid on February 8, 2021, to shareholders of record as of January 29, 2021.

2020 Annual Report 39
This page intentionally left blank.

40 Cashmere Valley Bank and Subsidiary
Directors and Officers Board of Directors Lyman Boyd, Chairman Brian Nelson, Past Chairman Kris Loomis, CPA Greg Oakes John Doyle Keith Wiggins Mike Neff
Administrative Officers Greg Oakes, President & Chief Executive Officer Mike Lundstrom, CPA/CIA, EVP & Chief Financial Officer Jenny Pulver, EVP & Chief Retail Banking Officer Steve Vradenburg, EVP & Chief Lending Officer Sue Ozburn, EVP & Chief Information Officer
Mitchell, Reed & Schmitten Insurance Board of Directors Greg Oakes, Chairman Lori Reed Lyman Boyd Jim Gibbons Laura Mounter Brent Schmitten Marc Heminger
Finance Kelly Walsh, CPA, AVP & Senior Accountant
Credit Administration Ann Rankin, AVP & Credit Operations Supervisor Kyle Bruggman, AVP & Assistant Credit Administrator
Internal Audit Amanda Brown, AVP & Senior Internal Auditor Compliance Deidra Anderson, VP & Compliance Officer
Retail Operations and Personnel Jennifer West, VP & Human Resources Director Jeff Burton, VP & Retail Operations Officer Christy Tomlinson, AVP & HR Generalist
Contract Purchasing and Equipment Leasing Chris Ewer, SVP & Indirect Lending Jeff Miller, VP & Dealer Finance Manager Jessica Steinburg, Financial Services Supervisor Elliott McLeod, Loan Officer Thomas Christopherson, AVP & Loan Officer
Electronic Banking and Card Services Sharon Low, VP & Electronic Banking Manager Carrie Gerdes, AVP & Treasury Management Officer
Municipal Banking Thomas Brown, VP & Municipal Finance Manager Information Technology Terri Howard, AVP & Information Systems Operations Officer
Cashmere Valley Mortgage Shirley Reyes, SVP & Mortgage Servicing Manager Kyle Lewis, SVP & Mortgage Production Manager Mireya Sanchez, Mortgage Operations Officer
Mitchell Reed & Schmitten Insurance Brent Schmitten, President & Chief Operations Officer
Cashmere Valley Wealth Management Timothy Meyers, Division Director
Customer Support Center Sheryl Rivera, AVP & Customer Support Center Supervisor
Cashmere Branch Josh Price, AVP & Manager Jana Flores, Retail Operations Officer
Maple Street, Wenatchee Branch Steve Lee, SVP & Regional Manager Mike Kintner, VP & Commercial Lender Kelly Walker, Retail Operations Officer
Leavenworth Branch Darrin Rylaarsdam, SVP & Regional Manager Shawna Alexander, VP & Retail Operations Officer Gary Waunch, AVP & Loan Officer
East Wenatchee Branch Alex Cruz, VP & Manager Edith Amante, Retail Operations Officer
Chelan Street, Wenatchee Branch Tina Hampton, Retail Operations Officer
Easy Street, Wenatchee Branch Claudia De Robles, VP & Manager Elizabeth Mejia, Retail Operations Officer
Ellensburg Branch Pam Wilson, VP & Manager Miriam Nation, Retail Operations Officer
Cle Elum Branch Kimberly Bonjorni, VP & Manager Caren Reed, Retail Operations Officer
Lake Chelan Branch Russ Jones, VP & Manager Griselda Hernandez, Retail Operations Officer
Summitview Avenue, Yakima Branch Maria Fabara, Retail Operations Officer
Yakima Avenue, Yakima Branch Taylor Stormo, SVP & Regional Manager Brittanie Vaughn, Retail Operations Officer Darren Reid, AVP & Loan Officer

2020 Annual Report 41
Directory Website Address www.cashmerevalleybank.com Administrative Offices 117 Aplets Way, Cashmere 509-782-2624 Cashmere Branch 117 Aplets Way, Cashmere 509-782-1501 Maple Street, Wenatchee Branch 1100 Maple Street, Wenatchee 509-662-1644 Leavenworth Branch 980 Highway 2, Leavenworth 509-548-5231 East Wenatchee Branch 199 Valley Mall Parkway, East Wenatchee 509-884-0622 Chelan Street, Wenatchee Branch 124 South Chelan Avenue, Wenatchee 509-662-6633 Easy Street, Wenatchee Branch 127 Easy Street, Wenatchee 509-662-5071 Ellensburg Branch 101 West University Way, Ellensburg 509-925-3000 Cle Elum Branch 803 West 1st Street, Cle Elum 509-674-2033 Lake Chelan Branch 329 East Woodin Avenue, Chelan 509-682-7162 Summitview Avenue, Yakima Branch 5800 Summitview Avenue, Yakima 509-457-7895 Yakima Avenue, Yakima Branch 127 West Yakima Avenue, Yakima 509-902-1352 Cashmere Valley Wealth Management 124 East Penny Road, Suite 102, Wenatchee 509-664-7168 Cashmere Valley Mortgage 127 Easy Street, Wenatchee 509-662-7722
Electronic Banking 124 East Penny Road, Suite 103, Wenatchee 509-664-5454 Valley Contract Servicing 124 East Penny Road, Suite 205, Wenatchee 509-664-5452 Card Services 124 East Penny Road, Suite 106, Wenatchee Credit Cards 509-664-5455 ATM/Debit Cards 509-664-5453 Dealer Financing 124 East Penny Road, Suite 201, Wenatchee 509-664-3820 Equipment Finance Solutions 124 East Penny Road, Suite 202, Wenatchee 509-665-1088 Customer Support Center 124 East Penny Road, Wenatchee 509-665-1070 Municipal Banking 1400 112th Avenue SE, Suite 100, Bellevue 425-688-3935 Mitchell, Reed & Schmitten Insurance: Wenatchee Office 124 East Penny Road Suite 101, Wenatchee 509-665-0500 Gellatly Insurance Services 22 North Chelan Avenue, Wenatchee 509-662-2151 Cashmere Office 117 Aplets Way, Cashmere 509-782-2751 Ellensburg Office 101 West University Way, Ellensburg 509-962-0902 Yakima Office
5800 Summitview Avenue, Yakima 509-454-5156 Elliott Insurance Service 127 West Yakima Avenue, Suite 201, Yakima 509-248-7711 Leavenworth Office 980 Highway 2, Leavenworth 509-548-6050
Cle Elum Office 803 West 1st Street, Cle Elum 509-674-4433