year end variance reporting instructions - stanford … budget management year end variance...
TRANSCRIPT
Stanford Budget Management
Year End Variance Reporting
9/25/2017 Stanford University Job Aid – Page| 1 of 19
What Use this guide to complete year end variance reports for both the University Budget Office (UBO) and the Financial Analysis and Information Reporting group (FAIR). Final narratives (in a Word document) to satisfy both central unit requirements should be emailed to [email protected]. Review the “Basic Guidelines for Commentary” section starting on page 2 to understand how to write your narratives.
Who This role may be performed by Budget Officers, Budget Analysts, Unit Managers, or Unit Financial Analysts. You can confirm your Tidemark authority in the Authority Manager application at https://authority.stanford.edu in the Financial System area and the Budget Management function.
Why Similar to prior years, UBO and FAIR make a joint ask for year-end analysis. The information you provide helps both offices prepare their university-wide consolidated year end reports for university leadership, the Board of Trustees, auditors, and other external audiences.
When A joint communication goes out from UBO and FAIR in September with the formal request and deadlines. Both Actuals vs Actuals and Budget vs Actuals analysis are due in October. Please note: Your budget unit may have earlier deadlines to support internal review. Please coordinate with your Budget Officer.
Prerequisites: Step Action
1 You must have authority to complete this process (granted through Authority Manager by org, project/task or award). You must have one of the following roles assigned to complete this process:
Budget Officer/ Formula School Budget Officer Budget Analyst Unit Manager Unit Financial Analyst/SoM Unit Analyst SoM DFA
2 The process will be available when year end actuals have been loaded.

Stanford Budget Management
Year End Variance Reporting
9/25/2017 Stanford University Job Aid – Page| 2 of 19
Variance Analysis Guidelines Variance Definition: Calculated differences between:
1) FY16 Actuals and FY17 Actuals 2) FY17 Booked Budget and FY17 actuals
Variance Threshold: An explanation is required if a variance exceeds the greater of ±$500,000 or ±10%. When to Submit: Monday, October 16, 2017 Where to Submit: Email the Word files to [email protected], [email protected], and [email protected] Variance Reports to Use: A Year End Variance Reporting process is available in Tidemark, within which there are five reports that can be used to analyze variances. They are:
Variance by Object Code Variance by Org and PTA Variance by Award Type and Object Code Variance by Award Type and Org Actuals Trend NOTE: There are also 3 “Summary Variance . . .” panels available if users want to enter summary level
variance notes or review variance notes entered last year. Official write-ups, however, are submitted in Word, so the UBO will not be reviewing any information entered into these panels.
Narrative Structure: Two separate write-ups are required, one to explain the variances between FY16 and FY17 actuals and the other to explain the variances between FY17 Booked Budget and actuals. In each, start with a high-level summary of total variances in revenues and operating transfers, expenses, asset transfers, operating results, and year-end fund balances. Then comment on major variances in each of these categories. Basic Guidelines for Commentary Focus on variances at the consolidated budget level. Only drill down to variances in individual fund types if
they are important (e.g. different trends in federal and non-federal research) Prioritize variances that convey meaningful stories. For variances due to geographical moves (e.g. changed
from an expense item to a transfer), point them out briefly and move on. Explain WHY there is a variance. For instance, why did it cost more or less? Why was the revenue higher or
lower? Describe variances in the context of a program/department within your unit, so an outside audience can
learn what’s happening within your unit. Examples of Inadequate and Useful Commentaries: Poor: There were more gifts received than expected. Good: Expendable Gifts were $5 million higher than budget because of a one-time estate gift from A Foundation to support B program. Poor: Other Income was higher because income from facilities rental was greater than estimated.

Stanford Budget Management
Year End Variance Reporting
9/25/2017 Stanford University Job Aid – Page| 3 of 19
Good: Other Income was $1 million higher due to facilities rental fees earned on newly renovated building ABC, which was used to host summer conferences. Poor: Operating transfers were greater because of external funding for a new program in Unit A. Good: The level of transfers was greater than FY16 because an additional $1M was allotted to Unit A to co-fund the instructional services of its Program B. Poor: Lower compensation expenses were due to vacancies in FY17. Good: Compensation was lower by $500,000 than the budget because about 2% of budgeted positions were vacant this year. They are anticipated to be filled next year. Poor: Capital equipment expenses were greater than FY16 because of major equipment purchases in FY17. Good: Equipment purchases were $1 million higher than FY16 mainly because a grand piano for the faculty of the Music Department was purchased in FY17.
Stanford Budget Management
Year End Variance Reporting
9/25/2017 Stanford University Job Aid – Page| 4 of 19
Accessing the Year End Variance Reporting Process
You must have authority to access the system. Authority is granted through Authority Manager by org, project/task, or award.
Browser Requirements:
Google Chrome Internet Explorer 11+ Safari Mobile on IOS-4+
To access Tidemark:
Step Action
1 Access the Tidemark application from the following website: https://stanford.tidemark.net
2 Log into the application through WebAuth using your SUNet ID and password.
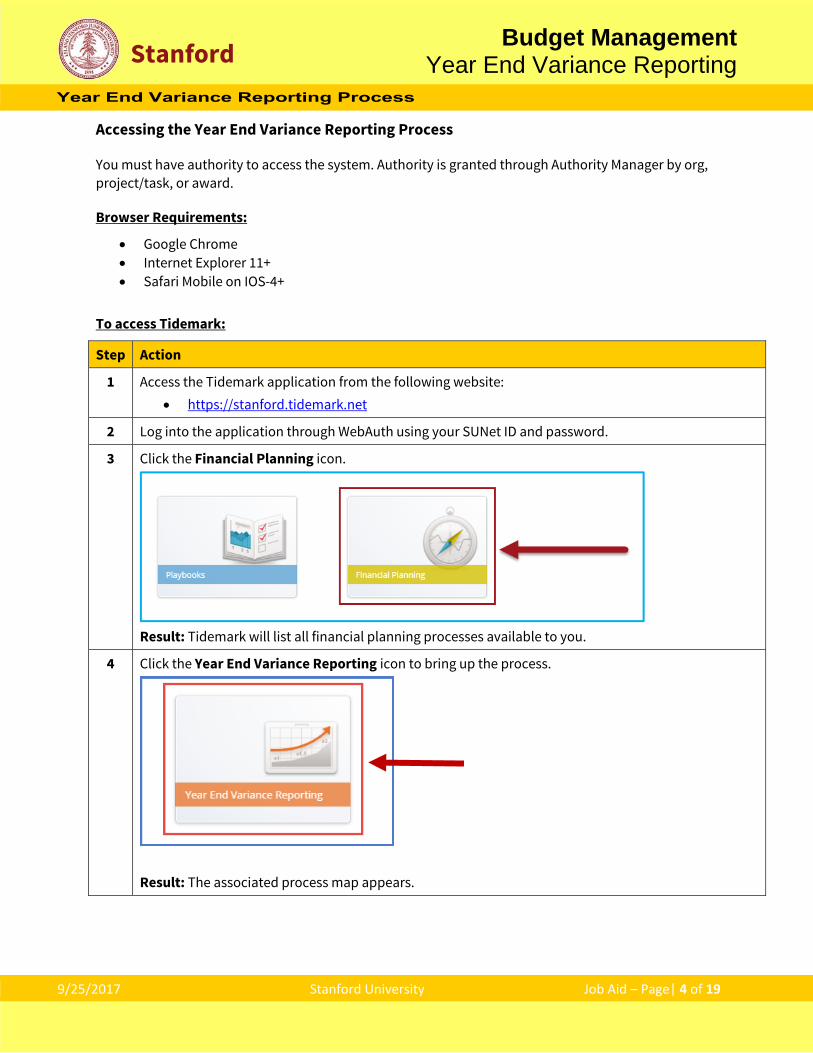
3 Click the Financial Planning icon.
Result: Tidemark will list all financial planning processes available to you.
4 Click the Year End Variance Reporting icon to bring up the process.
Result: The associated process map appears.

Stanford Budget Management
Year End Variance Reporting
9/25/2017 Stanford University Job Aid – Page| 5 of 19
The Year End Variance Reporting Process starts with 5 reports comparing budget and actual data. These reports will be used to help you write your ‘story’, which is done in Word and emailed to UBO & FAIR. Narratives may also be entered in the Summary Variance panel, but this is used for your use only. UBO and FAIR will review the email submissions only. There are two further reports which show the summary variance (stories) organized by org.
Additionally, line item comments may be written on any of the first 5 reports. While these will not be formally reviewed by the UBO & FAIR, they may be a helpful tool in coming up with your official Year End Variance narrative.
Note: The above process map shows incomplete panel names. In the system, you can hover over the blue title band to see the full name scroll across the panel icon.
Another way to see full names is to select “LIST” in the upper left area of the screen to see the below LIST view of the process map.
Year End Variance Reporting Process Overview

Stanford Budget Management
Year End Variance Reporting
9/25/2017 Stanford University Job Aid – Page| 6 of 19
Panel Descriptions Panel Name Description For detailed
instructions, see page:
Variance by Object Code
Review and comment entry panel listing object codes down rows and Actual vs Actual and Budget vs Actual amounts and variances across columns.
9
Variance by Org and PTA
Review and comment entry panel listing org hierarchy down rows (expandable to PTA level) and Actual vs Actual and Budget vs Actual amounts and variances across columns.
10
Variance by Award Type and Object Code
Review and comment entry panel listing object codes down rows and Actual vs Actual and Budget vs Actual amounts and variances across columns by Award Type.
11
Variance by Award Type and Org
Review and comment entry panel listing org hierarchy down rows (expandable to PTA level) and Actual vs Actual and Budget vs Actual amounts and variances across columns by Award Type.
12
Actuals Trend Review and comment entry panel for Actual vs Actual variances only. Object codes are listed down rows while across the columns, the panel lists Year End Actuals for a series of years along with the year over year % change and prior year vs current year $ variance.
13
Summary Variance by Org
Optional panel to enter or attach your variance narrative. 14
Summary Variance by Org Review
Review variance summaries entered at all lower (department) levels.
16
Summary Variance by Org and Children Review
Review variance summaries entered at a lower (department) level, drilling into more detail.
17
511 – PTA Detail and Object Code Detail by Month
Used to drill down to lowest level PTA and Object Code Detail. This report is located in the “6. Reporting” process
18

Stanford Budget Management
Year End Variance Reporting
9/25/2017 Stanford University Job Aid – Page| 7 of 19
Things to keep in mind:
Tidemark allows you to have multiple instances of your data open at the same time. That means you can open multiple browser windows with different panels in each so you can easily investigate variances at different levels without losing your place.
o For example, you can open a browser tab with the Variance by Object Code and a second with the Variance by Org and PTA and navigate between the two tabs.
Remember you can use the page edge filters to investigate variances and narrow in on specific information.
Comparisons involving very small amounts (cents) where the displayed value is zero can yield large percentage variances.
Variance calculations are embedded with financial awareness based on object codes. o When revenue decreases, it is displayed as an unfavorable variance (negative variance) and
vice versa o When an expenditure decreases, it is displayed as a favorable variance (positive variance) and
vice versa Explanation columns are free form fields that you can use for line item notations. Entries made in
these columns are tied to the specific intersection of data and will be available in other panels when viewing the same intersection.
Tidemark limits entries to 1,000 characters per cell. While the UBO and FAIR will be reviewing your variances at the budget unit level, you may use this
process to distribute variance analysis to your departments. Narratives entered by your departments can be reviewed in the final two panels of the process.

Stanford Budget Management
Year End Variance Reporting
9/25/2017 Stanford University Job Aid – Page| 8 of 19
If . . . Then . . .
You want to view variances for an org across all object codes
Go to the Variance by Object Code panel
You would like to see variances for an organization by award type (side by side) across all object codes.
Note: This panel is similar to the Variance by Object Code Panel, however, in this panel you can see variances by award type displayed side by side as opposed to one at a time.
Go to the Variance by Award Type and Object Code panel
You want to drill into a variance by looking at the breakdown by your Org Hierarchy, PTA, and/or specific Object Code
Go to the Variance by Org and PTA panel
You want to drill into a variance by looking at the breakdown across your Org Hierarchy, PTA, and/or specific Object Code AND also want to see the side by side comparison by award type
Note: This panel is similar to the Variance by Org and PTA, however, in this panel you can see variances by award type displayed side by side as opposed to one at a time.
Go to the Variance by Award Type and Org panel
You would like to see year end actual data over multiple years to help explain your Prior Year Actual vs Current Year Actual Variance
Go to the Actuals Trend panel
You have completed your review and analysis and are ready to enter the optional summary narrative for your org or you would like to attach documentation to support your narrative.
Go to the Summary Variance by Org panel
You would like to review all the summary narratives that have been entered for your schoo/department (all org levels)
Note: This is a review only panel, no changes/edits can be made here. If you would like to make a change, go back to the Summary Variance by Org panel.
Go to the Summary Variance by Org Review panel
You would like to review all the summary narratives that have been entered for your schoo/department (only immediate children of parent org selected)
Note: This is a review only panel, no changes/edits can be made here. If you would like to make a change, go back to the Summary Variance by Org panel.
Go to the Summary Variance by Org and Children Review panel
You would like to export monthly details of your budget or actuals data for use in your variance analysis
Go to 511 PTA Detail and Object Code Detail by Month panel (in “6. Reporting” process)
Stanford Budget Management
Year End Variance Reporting
9/25/2017 Stanford University Job Aid – Page| 9 of 19
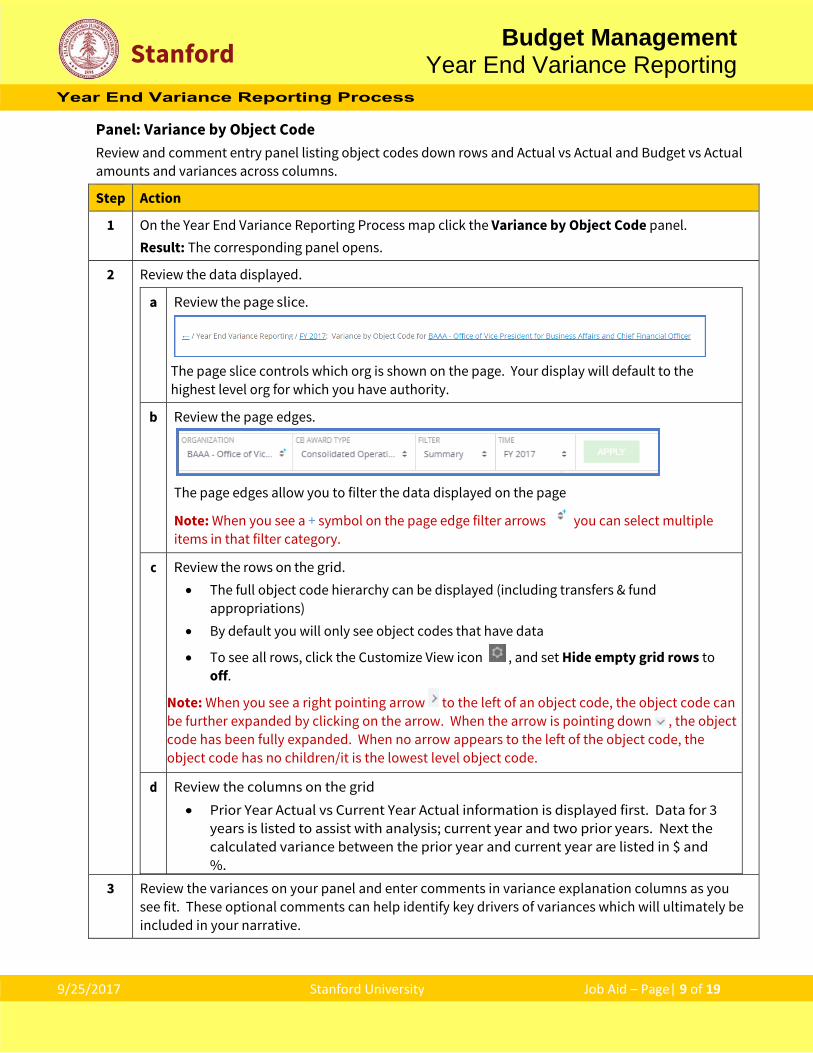
Panel: Variance by Object Code Review and comment entry panel listing object codes down rows and Actual vs Actual and Budget vs Actual amounts and variances across columns.
Step Action
1 On the Year End Variance Reporting Process map click the Variance by Object Code panel. Result: The corresponding panel opens.
2 Review the data displayed.
a Review the page slice.
The page slice controls which org is shown on the page. Your display will default to the highest level org for which you have authority.
b Review the page edges.
The page edges allow you to filter the data displayed on the page
Note: When you see a + symbol on the page edge filter arrows you can select multiple items in that filter category.
c Review the rows on the grid. The full object code hierarchy can be displayed (including transfers & fund
appropriations) By default you will only see object codes that have data
To see all rows, click the Customize View icon , and set Hide empty grid rows to off.
Note: When you see a right pointing arrow to the left of an object code, the object code can be further expanded by clicking on the arrow. When the arrow is pointing down , the object code has been fully expanded. When no arrow appears to the left of the object code, the object code has no children/it is the lowest level object code.
d Review the columns on the grid Prior Year Actual vs Current Year Actual information is displayed first. Data for 3
years is listed to assist with analysis; current year and two prior years. Next the calculated variance between the prior year and current year are listed in $ and %.
3 Review the variances on your panel and enter comments in variance explanation columns as you see fit. These optional comments can help identify key drivers of variances which will ultimately be included in your narrative.

Stanford Budget Management
Year End Variance Reporting
9/25/2017 Stanford University Job Aid – Page| 10 of 19
4 Click the Save button. Result: Your comments are saved, and will be available to view or edit from other reports at the same intersection.

Stanford Budget Management
Year End Variance Reporting
9/25/2017 Stanford University Job Aid – Page| 11 of 19
Panel: Variance by Org and PTA
Allows you review and enter variance explanations for both Actual vs Actual and Budget vs Actual at the org code hierarchy level (expandable to PTAs).
Step Action
1 On the Year End Variance Reporting Process map click the Variance by Org and PTA panel. Result: The corresponding panel opens.
2 Review the data displayed.
a Review the page slice. The page slice controls which org is shown on the page. Your display will default to the highest level org for which you have authority.
b Review the page edges.
c Review the rows on the grid. The full org code hierarchy will be displayed and expanded to include PTAs By default you will only see org codes that have data
To see all rows, click the Customize View icon , and set Hide empty grid rows to off.
Note: When you see a right pointing arrow to the left of an org code, the org can be further expanded by clicking on the arrow. When the arrow is pointing down , the org code has been fully expanded.
d Review the columns on the grid Prior Year Actual vs Current Year Actual information is displayed first. Data for 3
years is listed to assist with analysis; current year and two prior years. Next the calculated variance between the prior year and current year are listed in $ and %.
Budget vs Actual information is displayed second. Current Year Booked Budget followed by Current Year End Actuals and the calculated variance in $ and %.
The two final columns (with yellow cells) are variance explanation entry fields. One column is for the Prior Year Actual vs Current Year Actual variance Explanation and the other for the Budget vs Actual Variance Explanation.
3 Review the variances on your panel and enter comments in variance explanation columns as you see fit. These optional comments can help identify key drivers of variances which will ultimately be included in your narrative.
4 Click the Save button. Result: Your comments are saved, and will be available to view or edit from other reports at the same intersection. Note: Any time you see a red triangle on the top right corner of a cell , it indicates that the information in that cell has not been saved.
Stanford Budget Management
Year End Variance Reporting
9/25/2017 Stanford University Job Aid – Page| 12 of 19
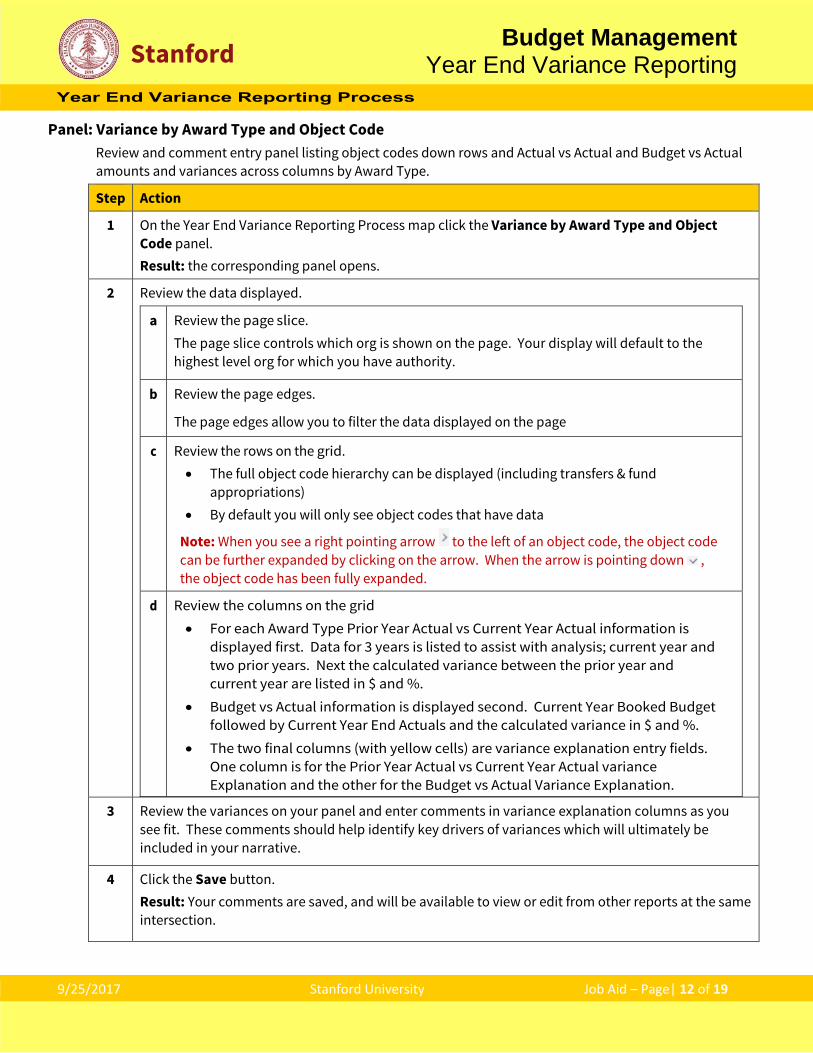
Panel: Variance by Award Type and Object Code Review and comment entry panel listing object codes down rows and Actual vs Actual and Budget vs Actual amounts and variances across columns by Award Type.
Step Action
1 On the Year End Variance Reporting Process map click the Variance by Award Type and Object Code panel. Result: the corresponding panel opens.
2 Review the data displayed.
a Review the page slice. The page slice controls which org is shown on the page. Your display will default to the highest level org for which you have authority.
b Review the page edges.
The page edges allow you to filter the data displayed on the page
c Review the rows on the grid. The full object code hierarchy can be displayed (including transfers & fund
appropriations) By default you will only see object codes that have data
Note: When you see a right pointing arrow to the left of an object code, the object code can be further expanded by clicking on the arrow. When the arrow is pointing down , the object code has been fully expanded.
d Review the columns on the grid For each Award Type Prior Year Actual vs Current Year Actual information is
displayed first. Data for 3 years is listed to assist with analysis; current year and two prior years. Next the calculated variance between the prior year and current year are listed in $ and %.
Budget vs Actual information is displayed second. Current Year Booked Budget followed by Current Year End Actuals and the calculated variance in $ and %.
The two final columns (with yellow cells) are variance explanation entry fields. One column is for the Prior Year Actual vs Current Year Actual variance Explanation and the other for the Budget vs Actual Variance Explanation.
3 Review the variances on your panel and enter comments in variance explanation columns as you see fit. These comments should help identify key drivers of variances which will ultimately be included in your narrative.
4 Click the Save button. Result: Your comments are saved, and will be available to view or edit from other reports at the same intersection.

Stanford Budget Management
Year End Variance Reporting
9/25/2017 Stanford University Job Aid – Page| 13 of 19
Panel: Variance by Award Type and Org Allows you review and enter variance explanations for both Actual vs Actual and Budget vs Actual by award type across columns and at the org code hierarchy level (expandable to PTAs) down rows.
Step Action
1 On the Year End Variance Reporting Process map click the Variance by Award Type and Org panel. Result: The corresponding panel opens.
2 Review the data displayed.
a Review the page slice. The page slice controls which org is shown on the page. Your display will default to the highest level org for which you have authority.
b Review the page edges.
The page edges allow you to filter the data displayed on the page
c Review the rows on the grid. The full org code hierarchy can be displayed and expanded to include PTAs By default you will only see org codes that have data
Note: When you see a right pointing arrow to the left of an org code, the org can be further expanded by clicking on the arrow. When the arrow is pointing down , the org code has been fully expanded.
d Review the columns on the grid For each award type, Prior Year Actual vs Current Year Actual information is
displayed first. Data for 3 years is listed to assist with analysis; current year and two prior years. Next the calculated variance between the prior year and current year are listed in $ and %.
Budget vs Actual information is displayed second. Current Year Booked Budget followed by Current Year End Actuals and the calculated variance in $ and %.
The two final columns (with yellow cells) are variance explanation entry fields. One column is for the Prior Year Actual vs Current Year Actual variance Explanation and the other for the Budget vs Actual Variance Explanation.
3 Review the variances on your panel and enter comments in variance explanation columns as you see fit. These comments should help identify key drivers of variances which will ultimately be included in your narrative.
4 Click the Save button. Result: Your comments are saved, and will be available to view or edit from other reports at the same intersection.

Stanford Budget Management
Year End Variance Reporting
9/25/2017 Stanford University Job Aid – Page| 14 of 19
Panel: Actuals Trend Allows you review and enter variance explanations for only Actual vs Actual variances, at the object code hierarchy level.
Step Action
1 On the Year End Variance Reporting Process map click the Actuals Trend panel. Result: The corresponding panel opens.
2 Review the data displayed.
a Review the page slice. The page slice controls which org is shown on the page. Your display will default to the highest level org for which you have authority.
b Review the page edges.
The page edges allow you to filter the data displayed on the page
c Review the rows on the grid. The full object code hierarchy can be displayed (including transfers & fund
appropriations) By default you will only see object codes that have data
To see all rows, click the Customize View icon , and set Hide empty grid rows to off.
Note: When you see a right pointing arrow to the left of an object code, the object code can be further expanded by clicking on the arrow. When the arrow is pointing down , the object code has been fully expanded. When no arrow appears to the left of the object code, the object code has no children/it is the lowest level object code.
d Review the columns on the grid Year End Actuals are listed for 5 years Next are the year over year variances as a %. The last numerical column lists the prior year vs current year variance amount in
$ The final column (with yellow cells) is the variance explanation entry field for
Prior Year Actual vs Current Year Actual variances.
3 Review the variances on your panel and enter comments in variance explanation columns as you see fit. These optimal comments can help identify key drivers of variances which will ultimately be included in your narrative.
4 Click the Save button. Result: Your comments are saved, and will be available to view or edit from other reports at the same intersection.

Stanford Budget Management
Year End Variance Reporting
9/25/2017 Stanford University Job Aid – Page| 15 of 19
Panel: Summary Variance by Org Optional panel to enter or attach your variance narrative.
Step Action
1 On the Year End Variance Reporting Process map click the Summary Variance by Org panel. Result: The corresponding panel opens.
2 Review the data displayed.
a Review the page slice. The page slice controls which org is shown on the page. Your display will default to the highest level org for which you have authority.
b Review the page edges.
The page edges allow you to filter the data displayed on the page
c Review the rows on the grid. Key categories for providing explanations are listed down the rows
o Prior Year Actual vs Current Year Actual listed first (Revenue, Transfers, Expenses and Summary)
o Budget vs Actual listed next (Revenue, Transfers, Expenses and Summary)
Note that there is a separate row for Transfer variance explanations (in prior years this was included in the Revenue explanation).
d Review the columns on the grid Selected Orgs will be displayed across columns with corresponding explanation
fields below (yellow cells).

Stanford Budget Management
Year End Variance Reporting
9/25/2017 Stanford University Job Aid – Page| 16 of 19
e Add Content (optional) Remember that your official narrative should be emailed to the UBO and FAIR groups (see page 2). Adding notes or content on this page is optional.
Scroll to the bottom of your screen until you see the Content section
Click on + ADD to open the content attachment section. Content can be added from multiple locations
o The “Tidemark” option allows you to attach any file accessible from your
computing device Click on the location name to open additional fields which will help associate
the desired content. Once the content has been properly identified, click on the ADD button on the
lower right section of your screen.
3 Click the Save button.
Stanford Budget Management
Year End Variance Reporting
9/25/2017 Stanford University Job Aid – Page| 17 of 19
Panel: Summary Variance by Org Review Review variance summaries entered at all lower (department) levels.
Step Action
1 On the Year End Variance Reporting Process map click the Summary Variance by Org Review panel. Result: The corresponding panel opens.
2 Review the data displayed.
a Review the page slice. The page slice controls which org is shown on the page. Your display will default to the highest level org for which you have authority.
b Review the page edges.
The page edges allow you to filter the data displayed on the page
Note: When you see a + symbol on the page edge filter arrows you can select multiple items in that filter category
c Review the rows on the grid. The entire org hierarchy for the selected Org will be displayed down rows
d Review the columns on the grid Key categories for where explanations were provided are listed across columns.
o Prior Year Actual vs Current Year Actual listed first (Revenue, Transfers, Expenses and Summary)
o Budget vs Actual listed next (Revenue, Transfers, Expenses and Summary)
Note that there is a separate column for Transfer variance explanations in each scenario. Since this is a change from prior years, ensure there is an explanation provided for that section if applicable.
3 This is a review only panel. If during your review you have questions or identify the need to change any of the narratives entered, please go back to the Summary Variance by Org panel to make those changes or refer back to any of the investigation panels to find answers to your questions.
Tidemark limits the length and width of each cell regardless of the length of text held within it. As a result it may be difficult to review the full narratives within the tidemark review panel. You may want to export the panel to excel for easier review:
If any content was added in via the Content section of the Summary Variance by Org
panel, it can only be retrieved from that panel.
Stanford Budget Management
Year End Variance Reporting
9/25/2017 Stanford University Job Aid – Page| 18 of 19
Panel: Summary Variance by Org and Children Review Review variance summaries entered at a lower (department) level, drilling into more detail.
Step Action
1 On the Year End Variance Reporting Process map click the Summary Variance by Org and Children Review panel. Result: The corresponding panel opens.
2 Review the data displayed.
a Review the page slice. The page slice controls which org is shown on the page. Your display will default to the highest level org for which you have authority.
b Review the page edges.
The page edges allow you to filter the data displayed on the page
Note: When you see a + symbol on the page edge filter arrows you can select multiple items in that filter category
c Review the rows on the grid. The immediate children of the selected Org will be displayed on the rows. They can be expanded for more detail.
d Review the columns on the grid Key categories for where explanations were provided are listed across columns.
o Prior Year Actual vs Current Year Actual listed first (Revenue, Transfers, Expenses and Summary)
o Budget vs Actual listed next (Revenue, Transfers, Expenses and Summary)
Note that there is a separate column for Transfer variance explanations in each scenario. Since this is a change from prior years, ensure there is an explanation provided for that section if applicable.
3 This is a review only panel. If during your review you have questions or identify the need to change any of the narratives entered, please go back to the Summary Variance by Org panel to make those changes or refer back to any of the investigation panels to find answers to your questions.
Tidemark limits the length and width of each cell regardless of the length of text held within it. As a result it may be difficult to review the full narratives within the tidemark review panel. You may want to export the panel to excel for easier review:
If any content was added in via the Content section of the Summary Variance by Org
panel, it can only be retrieved from that panel.

Stanford Budget Management
Year End Variance Reporting
9/25/2017 Stanford University Job Aid – Page| 19 of 19
Panel: 511 PTA Detail and Object Code Detail by Month Allows you review detailed budget and actuals information by month for an Org or PTA and Object Code
Step Action
1 On the 6. Reporting Process map click the 511 - PTA Detail and Object Code Detail by Month panel.
Result: The corresponding panel opens.
2 Review the data displayed.
a Review the page slice.
The page slice controls which org is shown on the page. You can select any org that you have access to (either as a child or parent member of the org hierarchy)
b Review the page edges.
The page edges allow you to filter the data displayed on the page. You can select either Actual or Budget data from the Scenario page edge.
Note: When you see a + symbol on the page edge filter arrows you can select multiple items in that filter category
c Review the rows on the grid. Rows are made up of two fields; PTA and Object Code. By default you will see all PTA & Object Code combinations with values for the
slice of data identified via the page slice and edges
d Review the columns on the grid The first column displays the full annual amount for the PTA & Object Code
combination. Subsequent columns represent each month of the fiscal year
e Review the data This report provides your financial information at a more granular level that is currently available in the Year End Variance panels, and can be used to assist with investigating variances at year end.