year-end results - barloworld-reports.co.za · year-end results managing for value. ... operating...
TRANSCRIPT

For the year ended 30 September 2017
YEAR-END RESULTS
Managingfor
VALUE
Dominic SewelaGroup chief executive
HIGHLIGHTS
Barloworld Limited Results for the year ended 30 September 2017 3
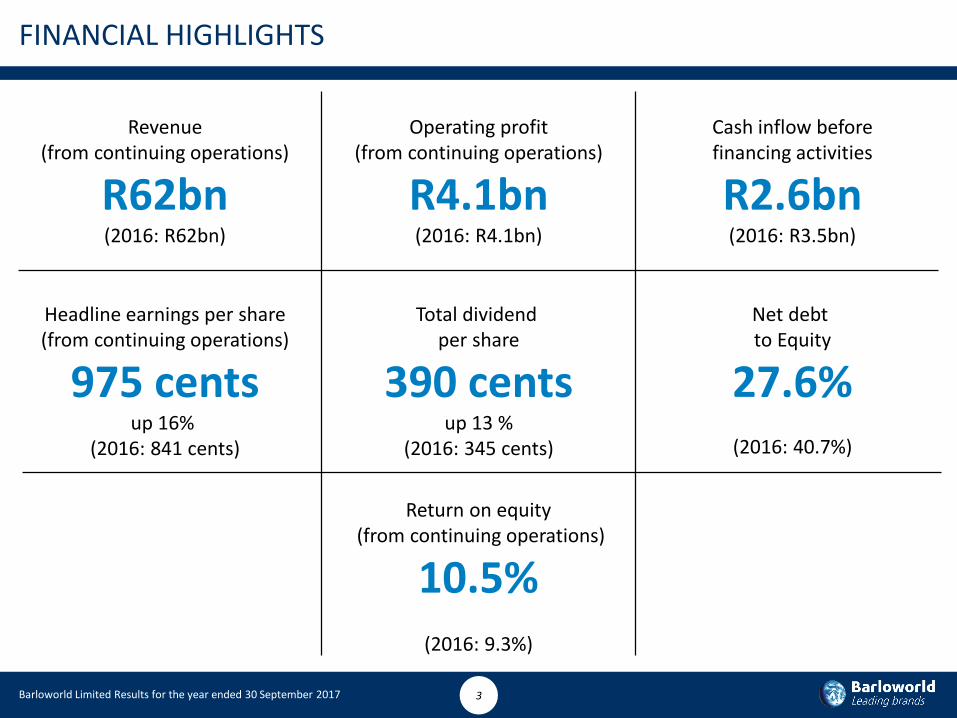
FINANCIAL HIGHLIGHTS
Revenue(from continuing operations)
R62bn(2016: R62bn)
Operating profit(from continuing operations)
R4.1bn(2016: R4.1bn)
Cash inflow beforefinancing activities
R2.6bn(2016: R3.5bn)
Total dividend per share
390 centsup 13 %
(2016: 345 cents)
Net debt to Equity
27.6%(2016: 40.7%)
Return on equity(from continuing operations)
10.5%(2016: 9.3%)
Headline earnings per share(from continuing operations)
975 centsup 16%
(2016: 841 cents)

Barloworld Limited Results for the year ended 30 September 2017 4
7.8%
18.1%
12.8%
6.0%
9.4%
12.8%
18.4%
13.1%
2.5%
10.3%
0%
2%
4%
6%
8%
10%
12%
14%
16%
18%
20%
ROIC SEGMENTAL
Equipment southern Africa
Equipment Russia
Automotive Logistics Group
Average invested capital
FY16 R11.5bn R2.8bn R9.8bn R2.6bn R29.4bn
FY17 R10.2bn R2.6bn R10.1bn R2.4bn R27.1bn
WACC 12.3%

Don WilsonFinance director
FINANCIAL OVERVIEW
Barloworld Limited Results for the year ended 30 September 2017 6
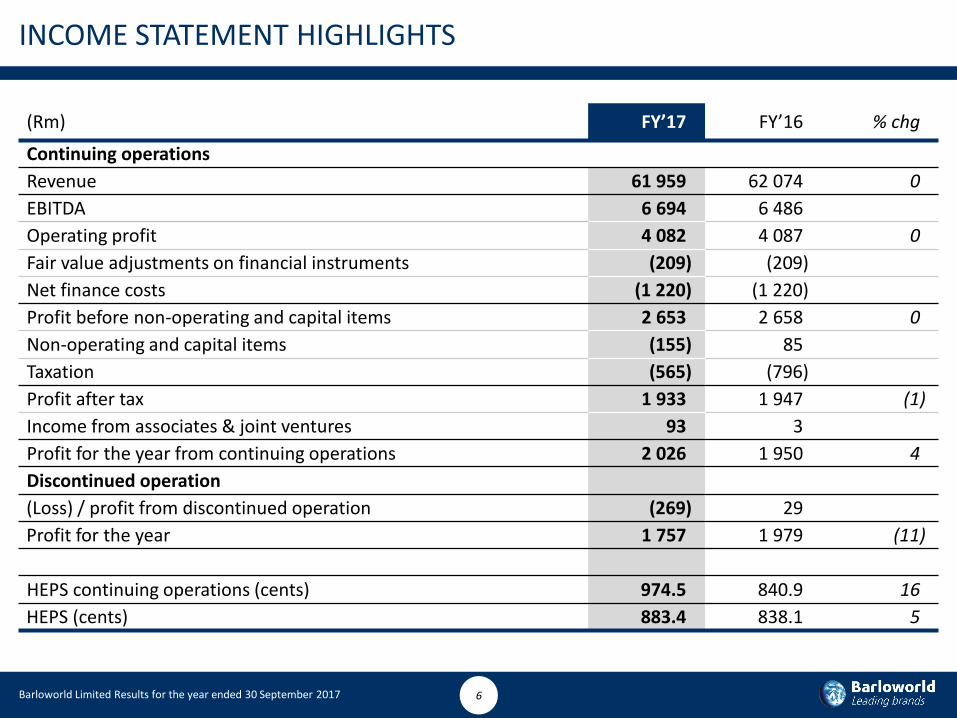
INCOME STATEMENT HIGHLIGHTS
(Rm) FY’17 FY’16 % chg
Continuing operations
Revenue 61 959 62 074 0
EBITDA 6 694 6 486
Operating profit 4 082 4 087 0
Fair value adjustments on financial instruments (209) (209)
Net finance costs (1 220) (1 220)
Profit before non-operating and capital items 2 653 2 658 0
Non-operating and capital items (155) 85
Taxation (565) (796)
Profit after tax 1 933 1 947 (1)
Income from associates & joint ventures 93 3
Profit for the year from continuing operations 2 026 1 950 4
Discontinued operation
(Loss) / profit from discontinued operation (269) 29
Profit for the year 1 757 1 979 (11)
HEPS continuing operations (cents) 974.5 840.9 16
HEPS (cents) 883.4 838.1 5

Barloworld Limited Results for the year ended 30 September 2017 7
INCOME STATEMENT HIGHLIGHTS – REVENUE
(Rm) FY’17 FY’16 % chg
Continuing operations
Revenue 61 959 62 074 0
Equipment 24 193 24 889 (3)
Southern Africa 18 287 18 547 (1)
Russia 5 141 4 838 6
Handling 765 1 505 (49)
Automotive and Logistics 37 764 37 183 2
Automotive 31 593 31 427 1
Logistics 6 171 5 756 7
Corporate 2 2
Average exchange rates (Rands) FY’17 FY’16 % chg
United States Dollar 13.39 14.75 9
Euro 14.83 16.32 9
British Sterling 17.03 20.99 19
Barloworld Limited Results for the year ended 30 September 2017 8
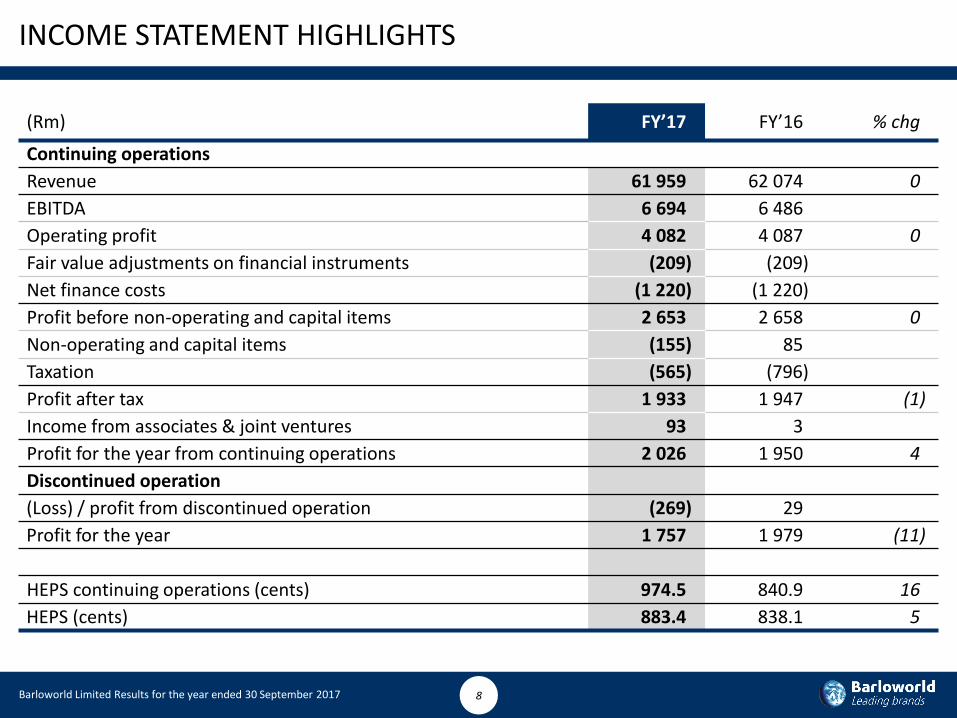
INCOME STATEMENT HIGHLIGHTS
(Rm) FY’17 FY’16 % chg
Continuing operations
Revenue 61 959 62 074 0
EBITDA 6 694 6 486
Operating profit 4 082 4 087 0
Fair value adjustments on financial instruments (209) (209)
Net finance costs (1 220) (1 220)
Profit before non-operating and capital items 2 653 2 658 0
Non-operating and capital items (155) 85
Taxation (565) (796)
Profit after tax 1 933 1 947 (1)
Income from associates & joint ventures 93 3
Profit for the year from continuing operations 2 026 1 950 4
Discontinued operation
(Loss) / profit from discontinued operation (269) 29
Profit for the year 1 757 1 979 (11)
HEPS continuing operations (cents) 974.5 840.9 16
HEPS (cents) 883.4 838.1 5
Barloworld Limited Results for the year ended 30 September 2017 9
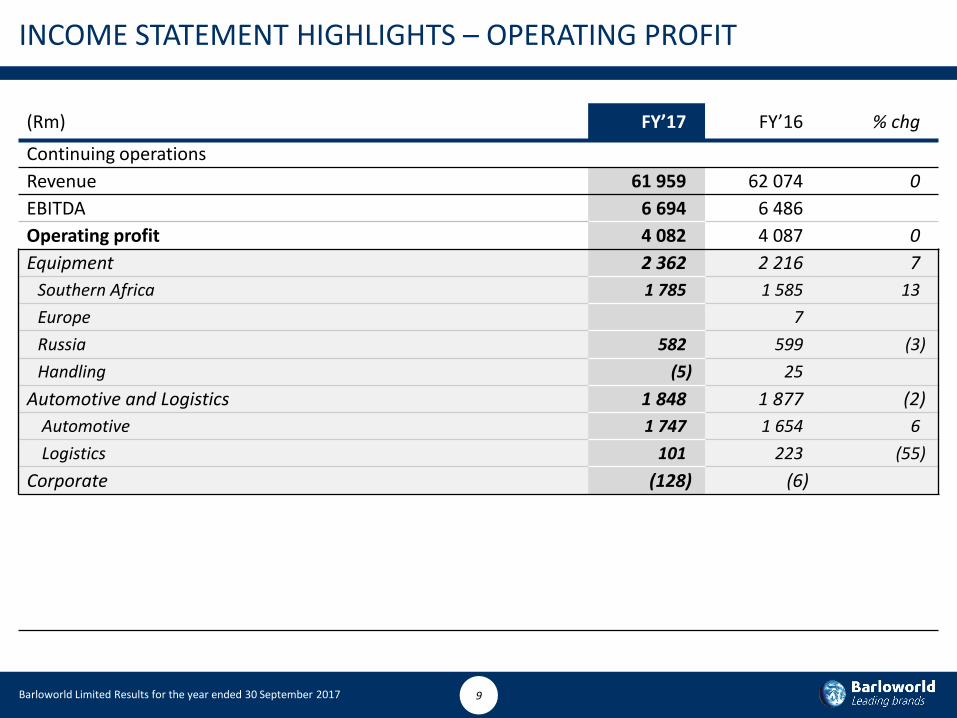
INCOME STATEMENT HIGHLIGHTS – OPERATING PROFIT
(Rm) FY’17 FY’16 % chg
Continuing operations
Revenue 61 959 62 074 0
EBITDA 6 694 6 486
Operating profit 4 082 4 087 0
Equipment 2 362 2 216 7
Southern Africa 1 785 1 585 13
Europe 7
Russia 582 599 (3)
Handling (5) 25
Automotive and Logistics 1 848 1 877 (2)
Automotive 1 747 1 654 6
Logistics 101 223 (55)
Corporate (128) (6)

Barloworld Limited Results for the year ended 30 September 2017 10
INCOME STATEMENT HIGHLIGHTS
(Rm) FY’17 FY’16 % chg
Continuing operations
Revenue 61 959 62 074 0
EBITDA 6 694 6 486
Operating profit 4 082 4 087 0
Fair value adjustments on financial instruments (209) (209)
Net finance costs (1 220) (1 220)
Profit before non-operating and capital items 2 653 2 658 0
Non-operating and capital items (155) 85
Taxation (565) (796)
Profit after tax 1 933 1 947 (1)
Income from associates & joint ventures 93 3
Profit for the year from continuing operations 2 026 1 950 4
Discontinued operation
(Loss) / profit from discontinued operation (269) 29
Profit for the year 1 757 1 979 (11)
HEPS continuing operations (cents) 974.5 840.9 16
HEPS (cents) 883.4 838.1 5
Barloworld Limited Results for the year ended 30 September 2017 11
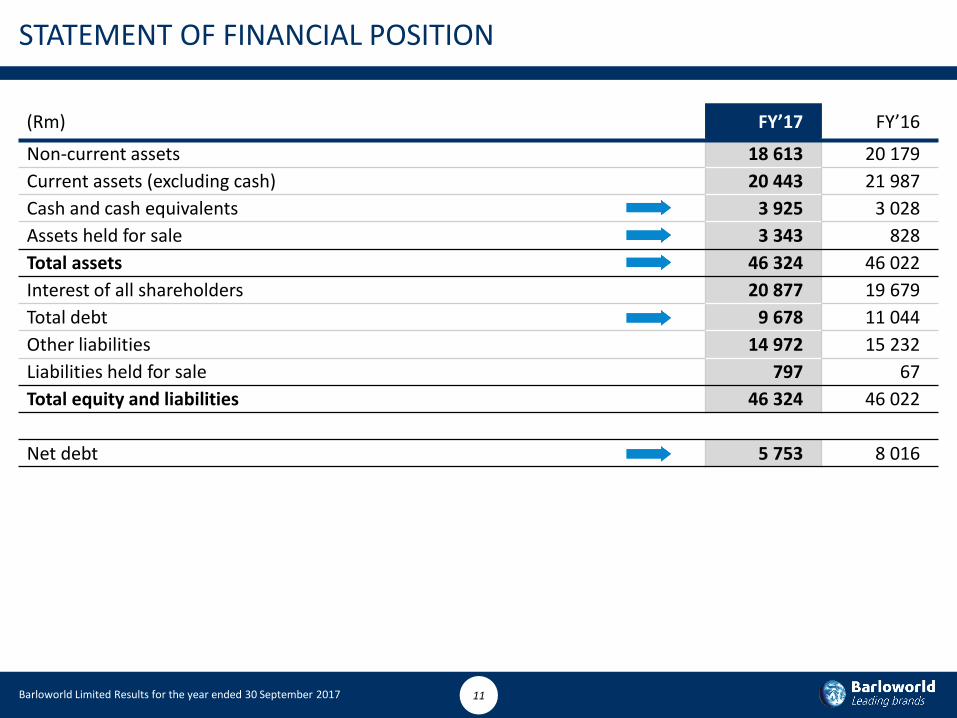
STATEMENT OF FINANCIAL POSITION
(Rm) FY’17 FY’16
Non-current assets 18 613 20 179
Current assets (excluding cash) 20 443 21 987
Cash and cash equivalents 3 925 3 028
Assets held for sale 3 343 828
Total assets 46 324 46 022
Interest of all shareholders 20 877 19 679
Total debt 9 678 11 044
Other liabilities 14 972 15 232
Liabilities held for sale 797 67
Total equity and liabilities 46 324 46 022
Net debt 5 753 8 016
Barloworld Limited Results for the year ended 30 September 2017 12
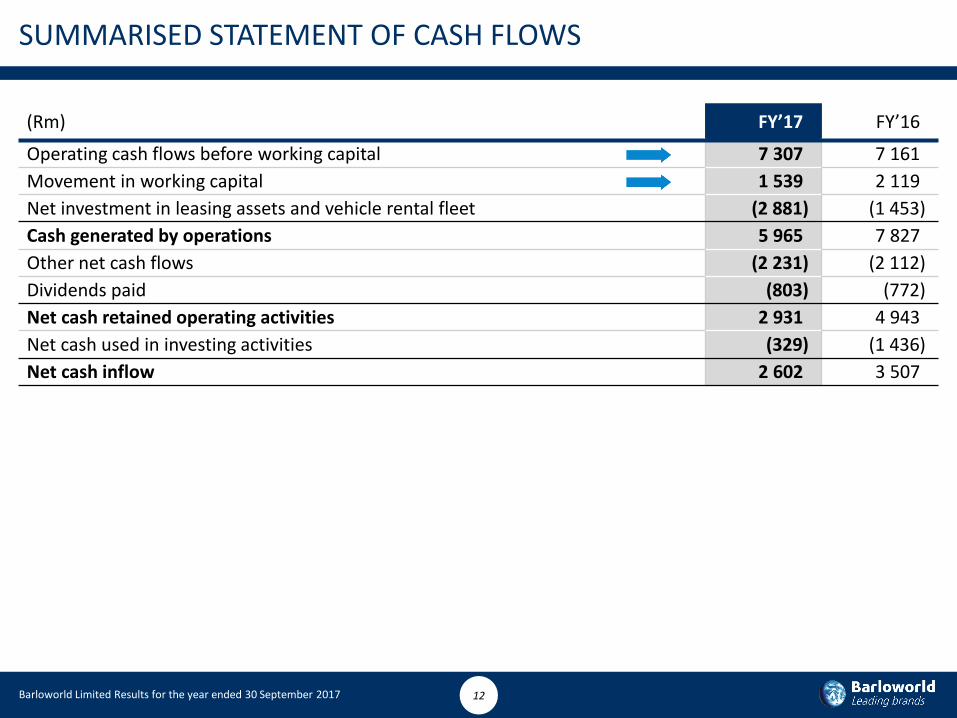
SUMMARISED STATEMENT OF CASH FLOWS
(Rm) FY’17 FY’16
Operating cash flows before working capital 7 307 7 161
Movement in working capital 1 539 2 119
Net investment in leasing assets and vehicle rental fleet (2 881) (1 453)
Cash generated by operations 5 965 7 827
Other net cash flows (2 231) (2 112)
Dividends paid (803) (772)
Net cash retained operating activities 2 931 4 943
Net cash used in investing activities (329) (1 436)
Net cash inflow 2 602 3 507
Barloworld Limited Results for the year ended 30 September 2017 13
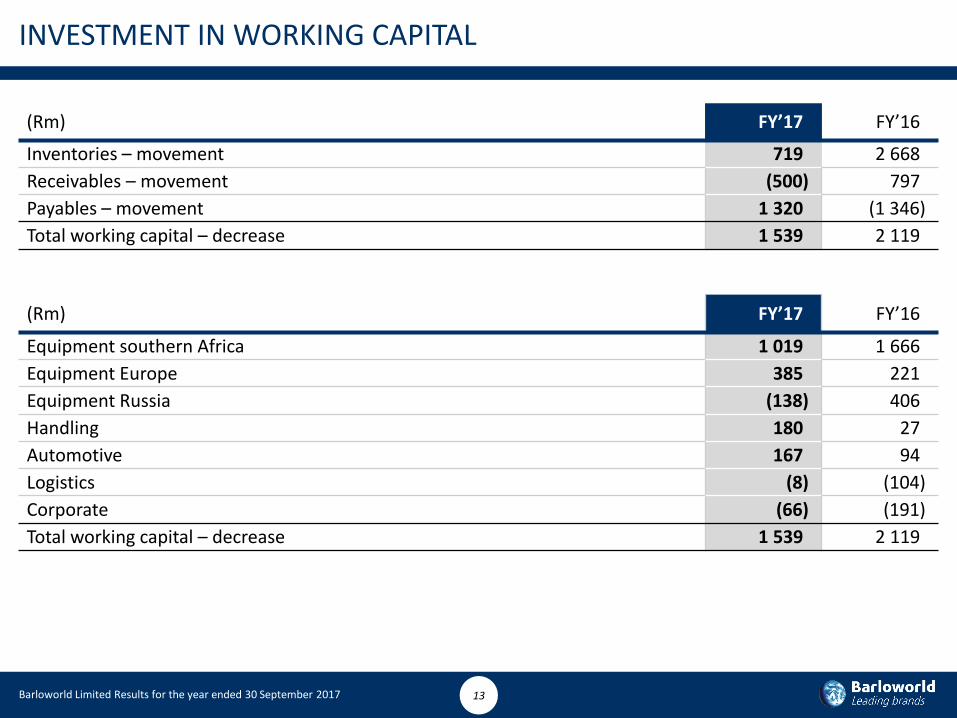
INVESTMENT IN WORKING CAPITAL
(Rm) FY’17 FY’16
Inventories – movement 719 2 668
Receivables – movement (500) 797
Payables – movement 1 320 (1 346)
Total working capital – decrease 1 539 2 119
(Rm) FY’17 FY’16
Equipment southern Africa 1 019 1 666
Equipment Europe 385 221
Equipment Russia (138) 406
Handling 180 27
Automotive 167 94
Logistics (8) (104)
Corporate (66) (191)
Total working capital – decrease 1 539 2 119
Barloworld Limited Results for the year ended 30 September 2017 14
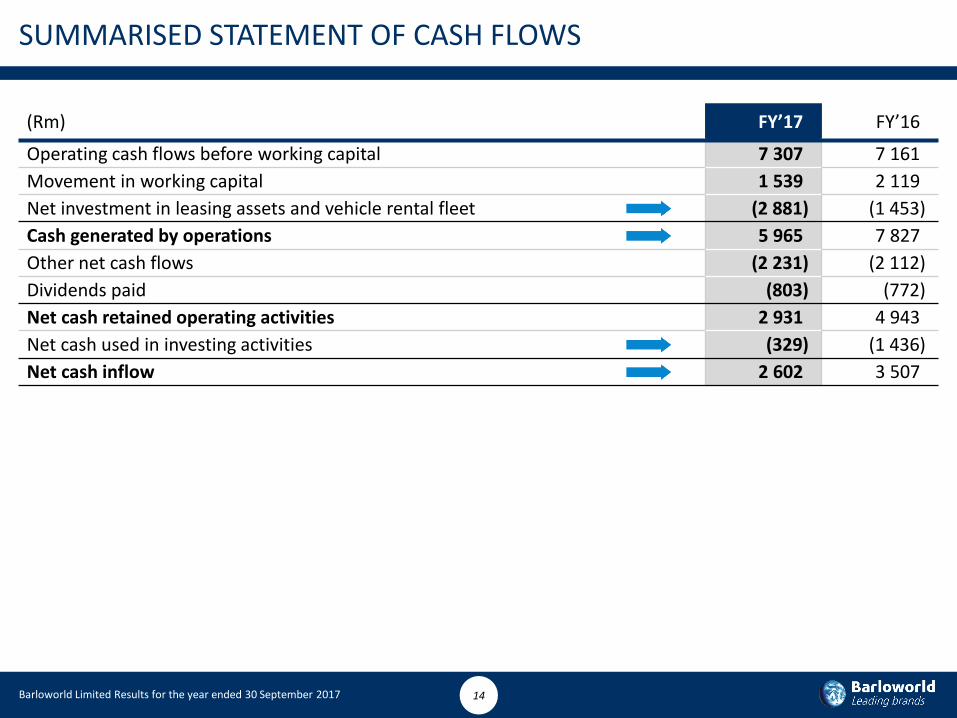
SUMMARISED STATEMENT OF CASH FLOWS
(Rm) FY’17 FY’16
Operating cash flows before working capital 7 307 7 161
Movement in working capital 1 539 2 119
Net investment in leasing assets and vehicle rental fleet (2 881) (1 453)
Cash generated by operations 5 965 7 827
Other net cash flows (2 231) (2 112)
Dividends paid (803) (772)
Net cash retained operating activities 2 931 4 943
Net cash used in investing activities (329) (1 436)
Net cash inflow 2 602 3 507
Barloworld Limited Results for the year ended 30 September 2017 15
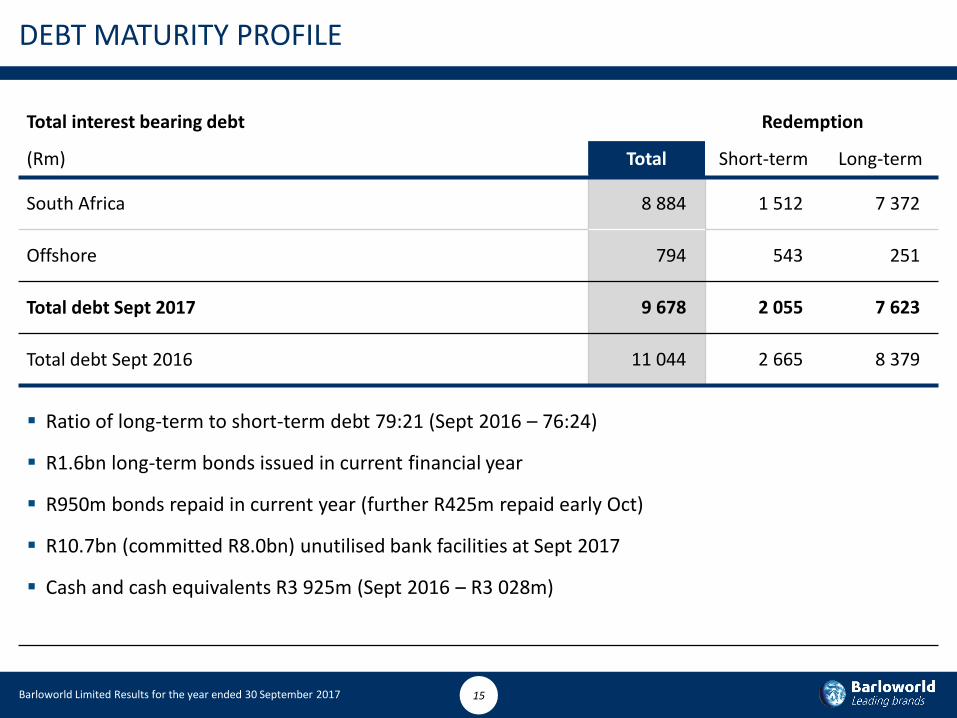
DEBT MATURITY PROFILE
Total interest bearing debt Redemption
(Rm) Total Short-term Long-term
South Africa 8 884 1 512 7 372
Offshore 794 543 251
Total debt Sept 2017 9 678 2 055 7 623
Total debt Sept 2016 11 044 2 665 8 379
Ratio of long-term to short-term debt 79:21 (Sept 2016 – 76:24)
R1.6bn long-term bonds issued in current financial year
R950m bonds repaid in current year (further R425m repaid early Oct)
R10.7bn (committed R8.0bn) unutilised bank facilities at Sept 2017
Cash and cash equivalents R3 925m (Sept 2016 – R3 028m)

Barloworld Limited Results for the year ended 30 September 2017 16
CAPITAL STRUCTURE REMAINS STRONG
Group segmental gearing ratios within target ranges:
Debt to equity (%) Trading Leasing Car Rental Total group
Target range 30 - 50 600 - 800 200 - 300 Gross Net
Ratio at 30 Sept 2017
21 560 203 46 28
Ratio at 30 Sept 2016
29 720 216 56 41
Net debt of R5 753m (2016: R8 016m)
Below target ranges due to strong cash inflows in second half
EBITDA interest cover 5.0 x (2016: 4.9 x)
Net debt to EBITDA 0.9 x (2016: 1.2 x)
Moody’s confirmed Global Scale Rating of Baa3 (negative outlook) and National Scale Rating of Aa3.za (stable outlook)
Peter Bulterman
DIVISIONAL OVERVIEW EQUIPMENT SOUTHERN AFRICA

Barloworld Limited Results for the year ended 30 September 2017 18
Revenue slightly down at R18.3bn
Operating profit up 13% to R1.8bn with significant improvement in operating margin
Strong net cash generation of R1.4bn
Recovery from the Bartrac JV in the DRC Katanga region driven by improved commodity prices
Return on equity up from 9.1% to 15.2%
OPERATIONAL REVIEW – EQUIPMENT SOUTHERN AFRICA
0 500 1 000 1 500 2 000
SouthernAfrica
Operating profit (Rm)
Sept 2017 Sept 2016
Margin
13%
Rest of Africa31%
Revenue by Territory
South Africa69%
9.8%
8.5%
Barloworld Limited Results for the year ended 30 September 2017 19
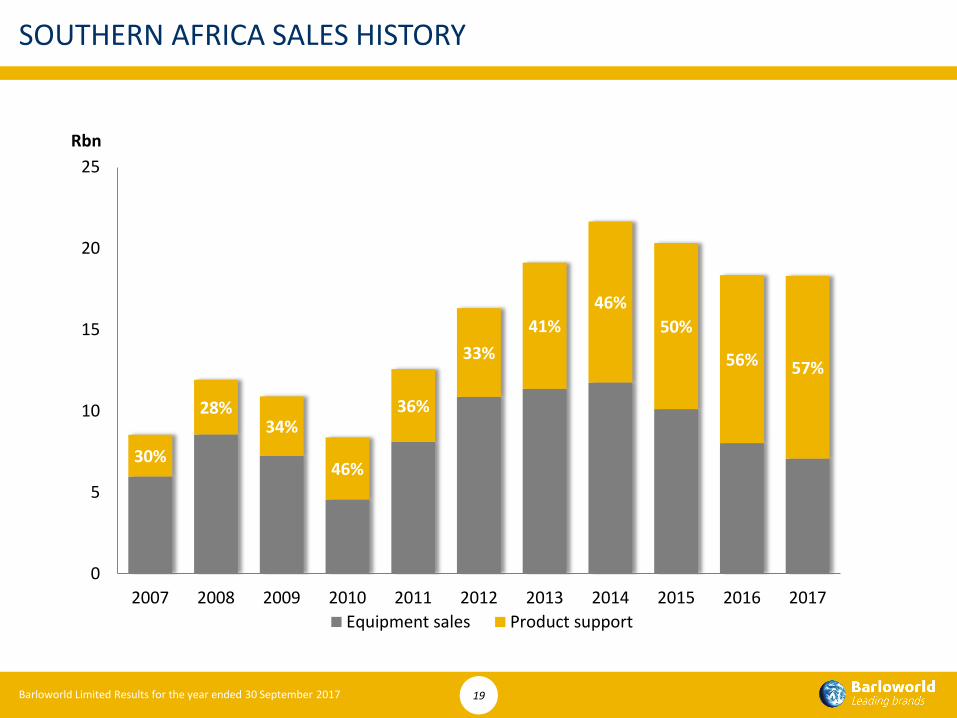
30%
28%34%
46%
36%
33%
41%
46%
50%
56% 57%
0
5
10
15
20
25
2007 2008 2009 2010 2011 2012 2013 2014 2015 2016 2017
Equipment sales Product support
SOUTHERN AFRICA SALES HISTORY
Rbn
Barloworld Limited Results for the year ended 30 September 2017 20
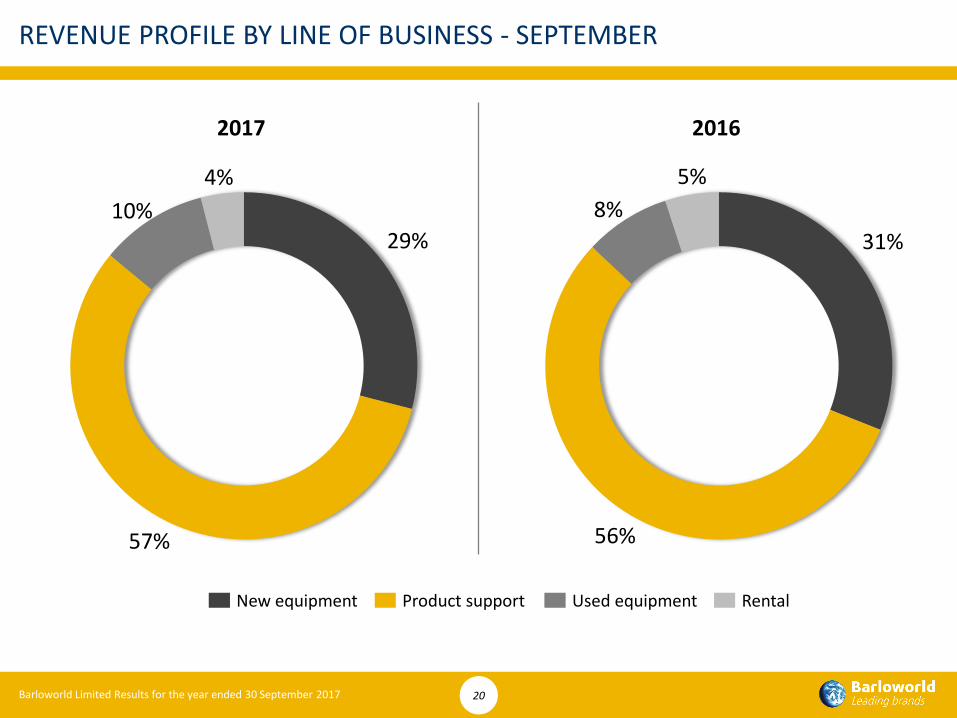
29%
57%
10%
4%
2017
31%
56%
8%
5%
2016
REVENUE PROFILE BY LINE OF BUSINESS - SEPTEMBER
New equipment Product support Used equipment Rental

Barloworld Limited Results for the year ended 30 September 2017 21
30%
40%
14%
16%
2017
29%
52%
15%
4%
2016
SOUTHERN AFRICA NEW EQUIPMENT SALES BY INDUSTRY - SEPTEMBER
Mining Construction Energy & Transportation Power Contract mining
Barloworld Limited Results for the year ended 30 September 2017 22
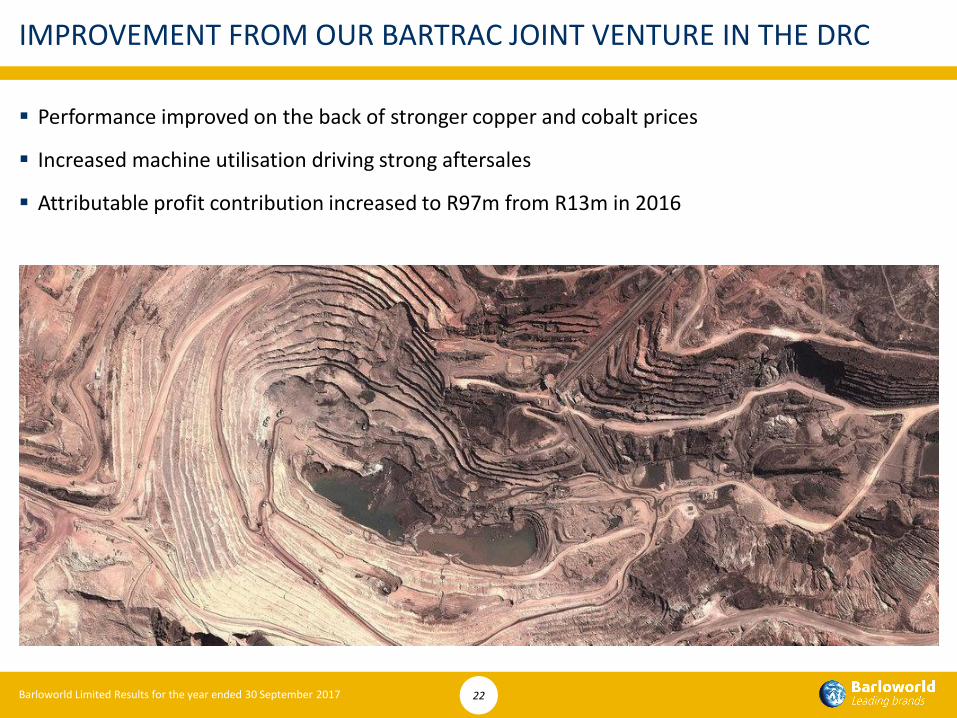
Performance improved on the back of stronger copper and cobalt prices
Increased machine utilisation driving strong aftersales
Attributable profit contribution increased to R97m from R13m in 2016
IMPROVEMENT FROM OUR BARTRAC JOINT VENTURE IN THE DRC

Barloworld Limited Results for the year ended 30 September 2017 23
ANGOLA
BOTSWANA
MALAWI
NAMIBIA
ZAMBIA
ZIMBABWE
LESOTHO
SWAZILAND
SOUTH AFRICA
ANGOLA
MINING OPPORTUNITIES
4 units R142m
ROSH PINAH
R8.5m R38m
47 units
R806m R3 032m
1 unit R52m
Benga
33 units R850m
Mota Engel
35 units R1 351m
2 units R28m
4 units R28m
22 units R85m
R156m R170m
Boikarabelo
24 units R1 598m
7 units R397m
Hwange
12 units R850m
Makhado
17 units R1 105m
Other
Greenfields/Major Proj.Firm orderDelivered
Coal
PGM/Zinc/ManganesePhosphate/PlatinumChrome
Gold
Diamonds
2 units 25 units
R37m R482m
3 units 13 units
R14m R 1 414m
Barloworld Limited Results for the year ended 30 September 2017 24
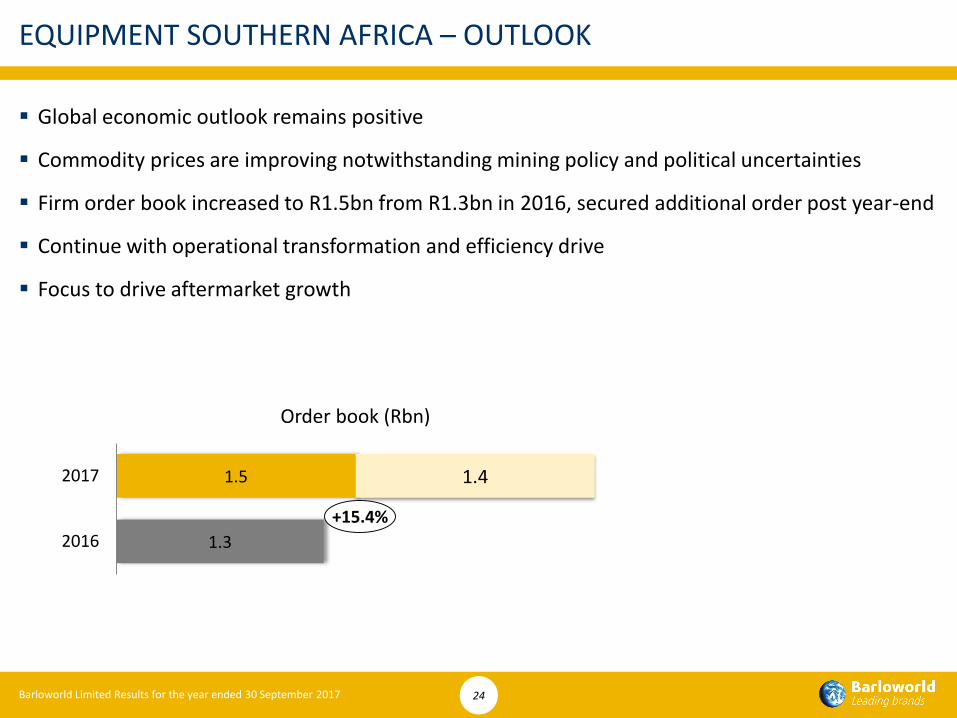
Global economic outlook remains positive
Commodity prices are improving notwithstanding mining policy and political uncertainties
Firm order book increased to R1.5bn from R1.3bn in 2016, secured additional order post year-end
Continue with operational transformation and efficiency drive
Focus to drive aftermarket growth
EQUIPMENT SOUTHERN AFRICA – OUTLOOK
1.3
1.5 1.4
2016
2017
Order book (Rbn)
+15.4%

Peter Bulterman
DIVISIONAL OVERVIEW EQUIPMENT RUSSIA

Barloworld Limited Results for the year ended 30 September 2017 26
Revenue of $385m, up 17% on the prior year
Operating profit of R582m (in US Dollar terms up by 7% to $43.7m from $40.9m)
Mining segment demonstrated solid performance on an improvement in the coal sector and strong machine deliveries into other commodities
Improved aftermarket growth driven by direct parts sales and component and machine rebuilds
Positive cash generation of $17.6m and return on equity of 20.1%
OPERATIONAL REVIEW – RUSSIA
0 250 500 750
Russia
Operating profit (Rm)
Sept 2017 Sept 2016
Margin
11.3%
12.4%
-3%

Barloworld Limited Results for the year ended 30 September 2017 27
24%
25%
29%36%
28%
27% 33%
46%
61%
51%
51%
0
100
200
300
400
500
600
2007 2008 2009 2010 2011 2012 2013 2014 2015 2016 2017
Equipment sales Product support
RUSSIA SALES HISTORY
$m
Barloworld Limited Results for the year ended 30 September 2017 28
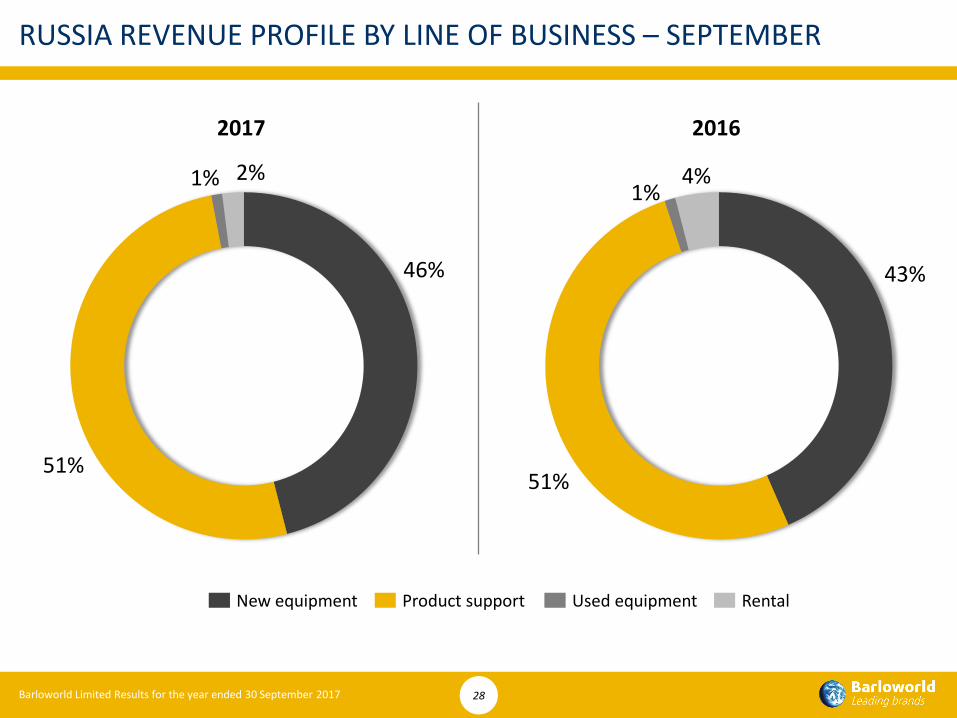
46%
51%
1% 2%
2017
43%
51%
1%4%
2016
RUSSIA REVENUE PROFILE BY LINE OF BUSINESS – SEPTEMBER
New equipment Product support Used equipment Rental

Barloworld Limited Results for the year ended 30 September 2017 29
77%
9%
7%1%
1% 5%
2017
68%
7%
8%
4%
9%4%
2016
RUSSIA NEW EQUIPMENT SALES BY INDUSTRY – SEPTEMBER
Mining Construction Energy & Transportation Oil & Gas Dealer Other including SEM

Barloworld Limited Results for the year ended 30 September 2017 30
Norilsk
Mirniy Yakutsk
Nerungry
Omsk
Barnaul
Novosibirsk
TomskAchinsk
KemerovoKrasnoyarsk
Chita
Ulan-UdeIrkutsk
Magadan
Anadyr
Petropavloysk-Kamchatskiy
KRU
11 units
$23m
IMM
1 unit 1 unit 9 units
$0.3m $0.3m $4.1m
MINING OPPORTUNITIES
Greenfields Firm order Delivered
Polyus
11 units 38 units 14 units
$20.4m $106.3m $9.2m
Norilsk Nickel
6 units 27 units
$11m $38.4m
KRU
11 units
$23m
Stroyservice
46 units
$43m
Zadubrovskiy Noviy
52 units 6 units 13 units
$47.8m $4.2m $11.2m
Alrosa
4 units 10 units 7 units
$2.4m $7.3m $6.6m
Mining Service
3 units 4 units 11 units
$3.5m $2.4m $5.7m
IMM
1 unit 1 unit 9 units
$0.3m $0.3m $4.1m
Service Integrator
27 units 7 units
$23.6m $4.2m
NordGold
10 units 21 units 8 units
$7.6m $38.5m $3.1m

Barloworld Limited Results for the year ended 30 September 2017 31
Positive GDP growth driven by stronger oil prices
Further commodity price improvement anticipated
Significant growth in order book driven by new greenfield projects
Growth based on improving market penetration and defending market share
Aftermarket revenues remain key to profitability
EQUIPMENT RUSSIA – OUTLOOK
21
202
2016
2017
Order book ($m)
+861.9%

Keith Rankin
DIVISIONAL OVERVIEW AUTOMOTIVE

Barloworld Limited Results for the year ended 30 September 2017 33
Revenue R31.6bn (2016: R31.4bn) – up 0.5%
Record operating profit for the division at R1.75bn (2016: R1.65bn) – up 5.6%
Improved operating margin achieved for the period at 5.5% (2016: 5.3%)
Continued strong used vehicle profit contribution
Achieved ROE and ROIC above Group hurdle rates
Strong positive cash flow generated
OPERATIONAL REVIEW – AUTOMOTIVE
0 500 1 000 1 500 2 000
BarloworldAutomotive
Operating profit (Rm)
FY 2017 FY 2016
Margin
5.5%
5.3%5.6%

Barloworld Limited Results for the year ended 30 September 2017 34
Well balanced Automotive portfolio provides resilience in a challenging trading environment
Revenue CAGR of 8.6% delivers operating profit CAGR of 14%
Inter-business unit synergies continue to deliver value
Recently acquired businesses performing in line with expectation
Continued focus to improve returns in underperforming businesses
INTEGRATED BUSINESS MODEL DELIVERS VALUE
0
500
1,000
1,500
2,000
2011 2012 2013 2014 2015 2016 2017
Rm Operating profit by BU
Car Rental Avis Fleet Motor Trading
0
300
600
900
1,200
1,500
1,800
2011 2012 2013 2014 2015 2016 2017
Rm Operating profit
Operating profit 1H Operating profit 2H
Barloworld Limited Results for the year ended 30 September 2017 35
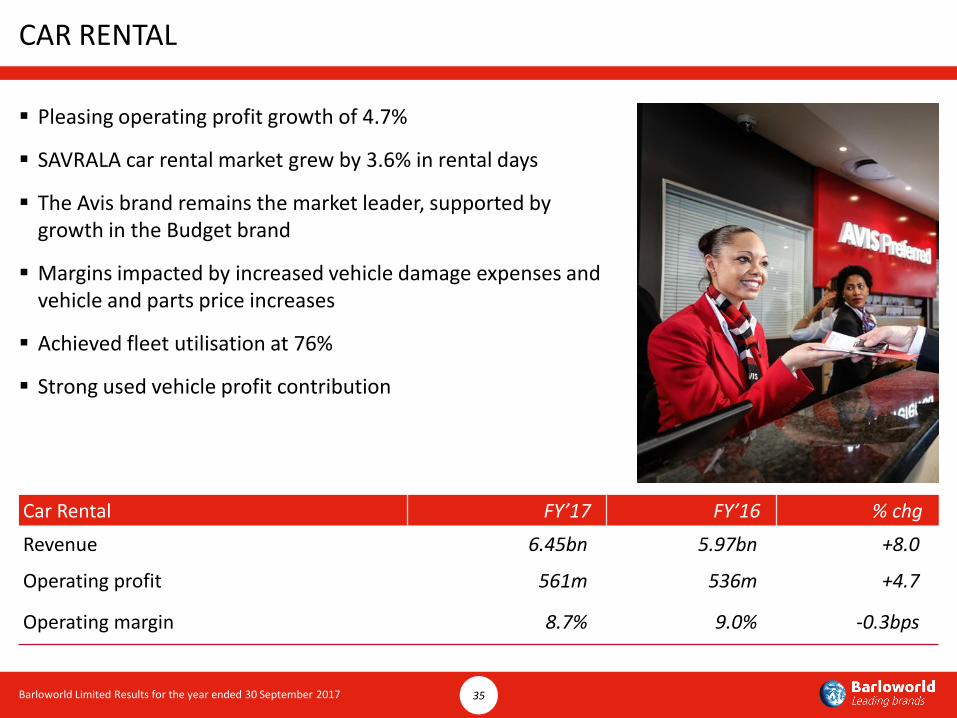
CAR RENTAL
Car Rental FY’17 FY’16 % chg
Revenue 6.45bn 5.97bn +8.0
Operating profit 561m 536m +4.7
Operating margin 8.7% 9.0% -0.3bps
Pleasing operating profit growth of 4.7%
SAVRALA car rental market grew by 3.6% in rental days
The Avis brand remains the market leader, supported by growth in the Budget brand
Margins impacted by increased vehicle damage expenses and vehicle and parts price increases
Achieved fleet utilisation at 76%
Strong used vehicle profit contribution

Barloworld Limited Results for the year ended 30 September 2017 36
AVIS FLEET
Avis Fleet FY’17 FY’16 % chg
Revenue 3.57bn 3.64bn -1.9
Operating profit 621m 560m +11
Operating margin 17.4% 15.4% +2.0bps
Strong operating profit growth of 11%
Finance fleet reduced marginally due to the non-renewal of SANParks and ADT contracts
Customer retention rates remain high
Improved used vehicle contribution
Macro economic environment continues to impact certain African territories
Strong ROE achieved

Barloworld Limited Results for the year ended 30 September 2017 37
MOTOR TRADING
Motor Trading FY’17 FY’16 % chg
Revenue 21.58bn 21.82bn -1.1
Operating profit 565m 558m +1.3
Operating margin 2.6% 2.6% -
Revenue declined by 1.1%
Total dealer market down 4.0%
New units sold down 7.4%
Increased operating profit by 1.3%
Positive contribution from aftermarket revenues
Headcount reduced by 12%
Continued focus on cost alignment

Barloworld Limited Results for the year ended 30 September 2017 38
AUTOMOTIVE – OUTLOOK
Car Rental Volume and revenue per day increases expected to deliver top line revenue growth,
supported by the dual brand strategy and continued growth in inbound tourism
Continued positive contribution from used vehicle disposals
Leverage technology to drive efficiencies and improve customer service and offerings
Motor Trading New vehicle market will continue to be under pressure due to low consumer confidence
Cost alignment and portfolio management to improve returns
Targeted acquisitions to grow footprint and positively contribute to returns
Avis Fleet Well positioned for continued organic growth
Maintain market leadership position and continue to achieve strong return on equity
Continued focus to improve returns in African territories
Automotive
Division
Balanced portfolio will continue to provide resilience throughout the cycle
Continued focus on achieving optimal returns above Group hurdle rates
Explore value enhancing growth opportunities

Kamogelo Mmutlana
DIVISIONAL OVERVIEW LOGISTICS

Barloworld Limited Results for the year ended 30 September 2017 40
OPERATIONAL OVERVIEW
145%
84%
Sept 2016 Sept 2017
Net debt / equity
86
260
Sept 2016 Sept 2017
Cash flow before financing (Rm)
+204%
• Revenue up 7.2%
• Operating profit down by R122m (54.7%)
• Barloworld Transport minority interest acquired
• Positive cash flow generated
• Reduced debt levels
-42%

Barloworld Limited Results for the year ended 30 September 2017 41
DIVERSE BLUE CHIP CUSTOMER BASE

Barloworld Limited Results for the year ended 30 September 2017 42
TURNAROUND FOCUS
Stabalise and turnaround financial and operational performance
Simplify operating model
Reduce operating assets
Cash generative business
Improve returns

Barloworld Limited Results for the year ended 30 September 2017 43
LOGISTICS OUTLOOK
• Key drivers of the turnaround strategy:
Fit-for-purpose SG&A
Optimal operational performance
Procurement
New lean and customer-focused operating model to support future growth

GROUP STRATEGY AND OUTLOOK
Barloworld Limited Results for the year ended 30 September 2017 45
GROUP STRATEGY PROGRESS AND OUTLOOK
Completed comprehensive strategic review
Board approved new Group strategy in Mar 2017
Key initiatives include:
• Fix and address underperforming businesses
Iberia / Middle-East – exit in progress
• Logistics – turnaround in progress
• Optimise returns from the existing portfolio
Motor retail – addressed
Equipment southern Africa – in progress and started to realise benefit
• Look at high growth opportunities based on existing capabilities
• Number of opportunities have been identified

For the year ended 30 September 2017
YEAR-END RESULTS
Managingfor
VALUE