year 11 to year 12 transition pack 2016 biology - sawtryva.org · the effect of temperature on cell...
TRANSCRIPT
Year 11 to Year 12 Transition Pack 2016
Biology
Name ………………………………….
Marks ………….. (Total Marks 70) Grade …………..

A comparison between GCSE and GCE A-level.
In simple terms, there is no comparison! GCE A-levels are probably the hardest qualifications you will ever do. While there are relatively small advances between key stage 3 up to GCSE’s, there is a huge leap from GCSE’s to GCE A-level. In addition, the way you study changes. You have to be more responsible for your own learning. At University there are no teachers to keep on at you to do your work. You either do it yourself, or you fail, having probably run up a debt of several thousand pounds. As a rule of thumb, if you are finding GCE A-levels easy, then you are not working hard enough!
Some successful strategies….
Your GCSE knowledge will be considered to be assumed knowledge i.e. you already know and understand this knowledge completely. The aim is not to re-teach GCSE so that you finally understand it; the aim is to use this knowledge as the starting point for a higher level. Attending lessons is not enough. You will be expected to spend at least the same amount of time studying Biology outside of timetabled lessons. Notes that you take during lessons will not be sufficient. These notes will only provide a framework. You will be expected to add to them and enhance them from your independent study. You should do as much background reading as possible. Subscribe to magazines or journals. Utilise the magazines and journals available within the department. You will be expected to provide evidence of your background reading. Use the recommended Biology reference book. (This Biology book also contains a CD with information on revision techniques – make sure you use this!)
What NOT TO DO if you want to succeed!! Do so little over the summer so that not only have you forgotten most of the Biology, you can barely remember how to write! Carry on working at the same rate as you did for your GCSE’s. It worked for them, so it is bound to be OK for GCE A-levels. Use private study lessons for social time. Get a part-time job and work all of the hours you can get; the money is really good for student socials. Give yourself a couple of months to ease yourself back into school work. After all, the exams are not until June. If you don’t understand something, just ignore it.

Knowledge to be consolidated.
Some work is outlined within this pack which is required to be completed over the course of the summer. The purpose of this is to assess your practical and evaluating skills (including preparation of tables and graphs) prior to your return in September. The practical skills will be incorporated into exam questions. From day 1 you will be:
Tested on a regular basis Required to submit your notes to regular inspection Required to provide proof of independent study Expected to actively participate in class and be questioned at random
Summer Tasks
1. Complete the Quantitative task on cell membrane permeability that you started on induction day
2. Complete the Evaluative task on cell surface membrane permeability 3. Read through the Bio Factsheets on Cell Surface Membranes and Enzymes 4. Answer the questions on Cell Surface Membranes. 5. Answer the questions on Enzymes 6. Make revision notes as you will be tested on these topics in September.

Course outline.
AQA Advanced Subsidiary GCE in Biology (7401) AQA Advanced GCE in Biology (7402) Modular Examinations There are 2 exams for AS-level biology and 3 for A2 Biology
AS Biology Paper 1 Written exam 1h 30 min Any AS content, including practical skills Short-answer questions - 65 marks Questions on a short comprehension passage – 10 marks Total 75 marks – 50% AS
Paper 2 Written exam 1h 30 min Any AS content, including practical skills Short-answer questions - 65 marks Structured prose question (describe) – 10 marks Total 75 marks – 50% AS
A2 Biology
Three written exam papers of 2 h (total 6h)
AS Biology Topics
Cells Organisms and exchange Biological molecules Genetic information, variation and relationships between organisms Practical skills Mathematical skills
A2 Biology Topics Photosynthesis Respiration Homeostasis – blood glucose and kidneys Genes and Biotechnology Ecosystems Plant and animal behaviour

The Effect of Temperature on Cell Surface Membranes Quantitative assessment Background
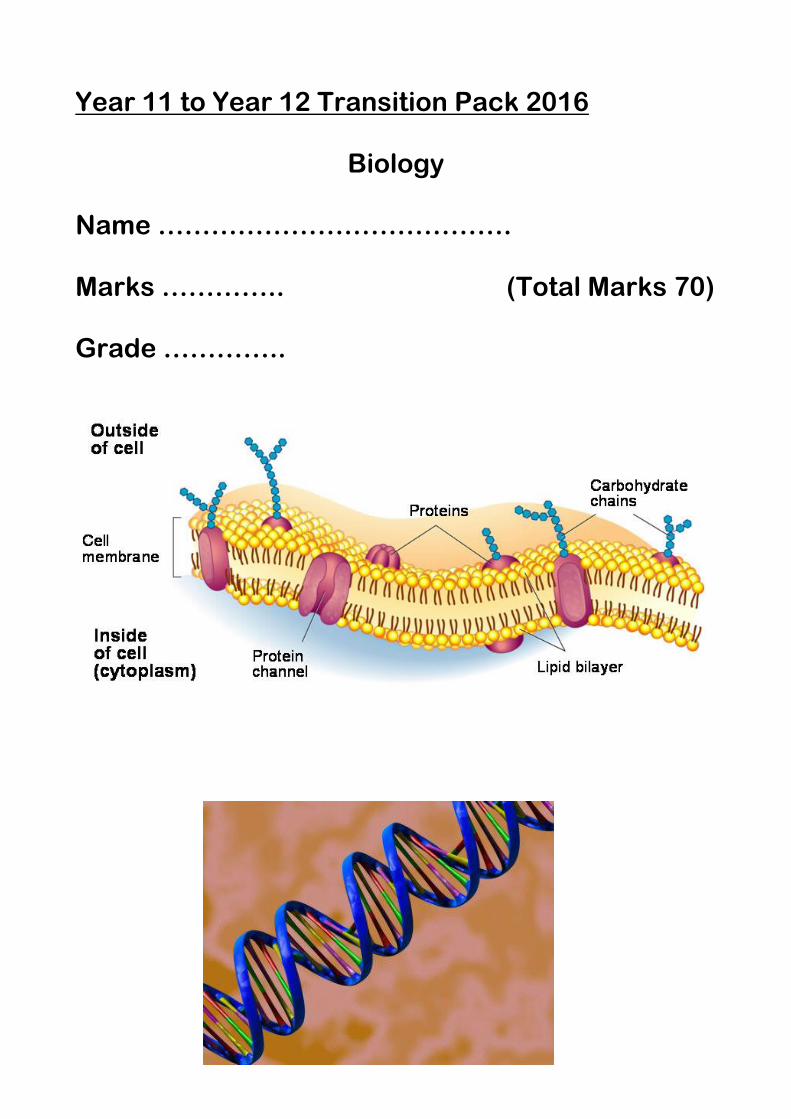
Beetroot cells contain the red pigment betalain in their vacuoles. Betalain is water-soluble and under normal circumstances does not diffuse out of vacuoles. Plant cell vacuoles are surrounded by a membrane, known as the tonoplast, which separates the contents of the vacuole from the cytoplasm. The tonoplast is similar in composition to the cell surface membrane.
Introduction For this Practical Task, you will investigate the effect of temperature on cell surface membranes.
Apparatus You are provided with the following apparatus: • four specimen tubes • six test-tubes (to be used for steps 2 and 3) • four test-tubes (to be used for step 12) • permanent marker, label or chinagraph pencil • test-tube rack(s) • Water baths • one 100 cm3 beaker • • small container (for rinsing syringes) • thermometer • three 10 cm3 syringes • one 1 cm3 syringe • forceps • white tile • scalpel • ruler • a container labelled waste • timer • a piece of plain white paper (to help determine colour intensity) • paper towels.
Materials You are provided with the following materials: • 20 cm3 of 5% betalain solution labelled 5% • 20 cm3 of 1% betalain solution labelled 1% • 50 cm3 of water (labelled water) • one or more cylinders of raw, uncooked beetroot tissue. • access to tap water.

Procedure 1 You are provided with cylinders of fresh beetroot tissue. Using the white tile and scalpel provided, cut a total of 20 beetroot discs. Each disc should be approximately 1 mm thick. Place the discs into the 100 cm3 beaker and cover with tap water. 2 Label six test-tubes with the following concentrations: 0.0%, 0.1%, 0.3%, 0.5%, 1.0% and 5.0%. 3 Make up a series of standard solutions of betalain using the 5% betalain solution, the 1% betalain solution and water, as shown in Table 1. You will need to make up 10 cm3 of standard solution in each of the correspondingly labelled test-tubes. Use the two 10 cm3 syringes and the 1 cm3 syringe as appropriate. You will require these standard solutions for step 15.
4 Take the beaker of discs from step 1 and carefully pour off the water. Replace with fresh tap water and pour off the water again to rinse the discs. Repeat this step until no red colour is seen in the washing water. 5 Label the specimen tubes with the following temperatures: 30 °C, 45 °C, 60 °C and 80 °C. 6 Using the forceps provided, place 5 discs into each specimen tube. 7 Take the specimen tube labelled 30 °C. Using a clean syringe, transfer water from the water bath set up at 30 °C into the specimen tube so that the tube is almost full. This will warm the tube and the discs. Carefully pour off this water. Now transfer 5 cm3 of water from the water bath into the specimen tube. Leave this 30 °C specimen tube to one side whilst you proceed with step 8. 8 Take the specimen tube labelled 45 °C. Use a syringe to transfer water from the water bath at 45°C into the specimen tube until it is almost full. Carefully pour off the water and then transfer 5 cm3 of water from the water bath into the specimen tube. 9 Repeat steps 7 and 8 with water at 60 °C and 80 °C (± 2 °C in each case). 10 After adding water at 80 °C to the discs, wait for at least five minutes before proceeding with step 13.
While you are waiting, label the remaining clean test-tubes with the following temperatures: 30 °C, 45 °C, 60 °C and 80 °C.
11 Stir the contents of the specimen tube labelled 30 °C with the forceps in order to ensure an even distribution of the betalain pigment. (The betalain pigment tends to build up around the beetroot discs.) Then immediately pour off all the water from this tube into the test-tube labelled 30 °C. 12 Repeat step 13 for the remaining specimen tubes, pouring the water into the correspondingly labelled test-tubes. 13 Estimate the concentration of betalain in each test-tube by comparing the intensity of the colour against the standard solutions that you prepared in step 3. You may use the piece of plain white paper provided to help you judge the colour intensity. Record your results in Table 2. Depending upon the colours you observe, you may record an estimated concentration between two of the standard solutions.
1 Present your data in Table 2 in an appropriate form on the graph paper provided (next page) Use the example results provided below. [4]
Example results for practical – calculate the mean and use these results for your graph
Temperature ºC
Estimated concentration of betalain
Test 1 Test 2 Test 3 Mean concentration of betalain
30 0 0 0
45 0 0.1 0
60 0.1 0.3 0.6
80 1.0 1.0 1.0


2 Describe the effect of temperature on the concentration of betalain obtained in the tubes. ................................................................................................................................................ ................................................................................................................................................ ................................................................................................................................................ ................................................................................................................................................ ................................................................................................................................................ ................................................................................................................................................ ............................................................................................................................................... ................................................................................................................................................ ................................................................................................................................................ ............................................................................................................................................[3] 3 Use the graph you have drawn to estimate the concentration of betalain that would be obtained at a temperature of 70 °C. .........................................................................................................................................[1]
The Effect of Temperature on Cell Surface Membranes Evaluative assessment
A student carried out a practical task on the effect of temperature on the release of the pigment betalain from beetroot tissue. The procedure used is summarised at the beginning of the Quantitative Task. The student’s results are shown in the graph below. You should read through the method before attempting the questions below.

1 Explain why it was necessary to rinse the beetroot discs before immersing them in water of different temperatures (step 4). ................................................................................................................................................ ................................................................................................................................................ ................................................................................................................................................ ................................................................................................................................................ .............................................................................................................................................. ................................................................................................................................................ ............................................................................................................................................[3] 2 The membrane surrounding the vacuole (tonoplast) and the plasma (cell surface) membrane are described as partially permeable. State what is meant by the term partially permeable. ................................................................................................................................................ ................................................................................................................................................ ............................................................................................................................................[1] 3 Explain why more betalain escapes from the beetroot discs at higher temperatures. ................................................................................................................................................ ................................................................................................................................................ ................................................................................................................................................ ................................................................................................................................................ ................................................................................................................................................ ................................................................................................................................................ ........................................................................................................................................... [4]

4 Any factor that has not been controlled or taken into account in the design of an experiment can be referred to as a limitation. A limitation can be described as a design fault. State three different limitations of the procedure, as shown on the Specimen Experiment Sheet. For each limitation, describe how the limitation could have an effect on the results obtained.
limitation 1 ............................................................................................................................... effect on results obtained ................................................................................................................................................ ................................................................................................................................................ limitation 2 ............................................................................................................................... effect on results obtained ............................................................................................................................................... ................................................................................................................................................ limitation 3 ...............................................................................................................................
effect on results obtained .............................................................................................................................................. ......................................................................................................................................... [6] 5 State one variable that is controlled in this experiment. ................................................................................................................................................ ............................................................................................................................................[1]

6 A student plotted a graph of the data he obtained from his results. The graph is shown on the next page. Identify one error that the student made when drawing his graph. ................................................................................................................................................ ........................................................................................................................................... [1] 7 Betalain is a relatively large, water-soluble molecule. It is synthesised in the cytoplasm and then transported into the vacuole, where it accumulates and is stored. (a) Explain why betalain molecules are unlikely to enter the vacuole by simple diffusion. .......................................................................................................................................... .......................................................................................................................................... .......................................................................................................................................... .......................................................................................................................................... ..................................................................................................................................... [2] (b) Suggest briefly how betalain molecules may be transported into the vacuole. .......................................................................................................................................... .......................................................................................................................................... ..................................................................................................................................... [2]


Questions on Cell Surface Membranes
1 What are the functions of the components of cell-surface membranes? (5)
2 Diffusion is the net movement of molecules or ions from an area of higher concentration to an area of lower concentration.
Explain how each of the following factors affects the rate of diffusion. (4)
1. The concentration gradient.
2. The area of the exchange surface.
3. The thickness of the exchange surface.
4. The size and nature of the diffusing molecules.
3 Facilitated diffusion is a special type of diffusion enabling molecules, such as glucose; and amino acids, and charged particles, such as sodium ions, to diffuse into and out of cells.
a Explain how facilitated diffusion differs from simple diffusion. (2)
b In what ways are the two processes similar? (2)
4 Osmosis is the diffusion of water molecules through partially permeable membranes. It is defined in
terms of water potential.
a Explain what happens when (i) red blood cells and (ii) discs of potato tuber tissue are placed in pure water. (4)
5 Explain how active transport differs from passive forms of transport. (2)
6 Describe how energy from ATP is used in active transport. (2)

Questions on Enzymes Calculating rates of reaction Worked example The graph below shows data collected during the reaction between catalase and hydrogen peroxide. The volume of gas collected is plotted against time. What is the maximum reaction rate?
First construct a tangent line by drawing a line using a ruler. The tangent line should touch the curve at the steepest point. Next use construction lines to find the values of x and y at ant two selected points on the tangent as shown.
Find the change in y and the change in x between the two selected points. In the example y goes from 12 to 48, a change of 36 cm3 oxygen while x changes from 128 to 220 s, a change of 92 s.
Calculate the rate by dividing the change in y by the change in x. In the example 36/92 = 0.39 cm3s-1.


1. The table shows data from an experiment in which glucose was being released by the digestion of starch.
a. Plot the data on a line graph (previous page) (4)
b. Use a tangent to calculate the maximum rate of reaction (2)
c. Find the rate of reaction at: (i) 8 minutes (ii) 32 minutes (2)
Time/min Glucose produced / mmol dm -3
5 2
10 6
15 12
20 22
25 25
30 28
35 29
2. Amylase is an enzyme. It catalyses the breakdown of starch to maltose.
Students mixed a starch solution with amylase. The concentration of amylase and the concentration of starch were controlled.
They recorded the concentration of maltose at intervals for 30 minutes. Figure 2 shows their results.
Figure 2
b Suggest two other factors the students would have controlled.
(2 marks)
c Describe how the concentration of maltose changed over the period shown in Figure 2.
(2 marks)

d i A tangent has been drawn to the curve in Figure 2. Explain how you could use this line to calculate the initial rate of reaction.
(1 mark)
ii The rate of reaction was lower after 10 minutes than it was at the start. Explain why.
(2 marks)
3. A student carried out an investigation using salivary amylase. Six wells (holes) of the same size were cut in a starch agar plate. Each well was filled with the same concentration and volume of amylase solution. An equal volume of buffer solution was added to produce a different pH in each well. The plates were incubated at 25 °C for 24 hours and then covered with iodine solution. The iodine turned the starch blue-black. It was observed that there were clear rings around some wells. The width of these clear rings is shown in the table.
pH Width of clear ring / mm
1 0
3 2
5 6
7 11
9 5
11 0

a There are clear rings around some of the wells. Explain why.
(2 marks)
b Calculate the rate of reaction at pH 7. Show your working.
(2 marks)
c The student concluded that the optimum pH for amylase activity was pH 7. This conclusion may not be valid. Explain why.
(1 mark)
d se your knowledge of enzyme structure to explain the result obtained at pH 11.
(3 marks)
e Describe a control experiment for this investigation.
(2 marks)