yakima river basin integrated water resource management …the yakima river basin integrated water...
TRANSCRIPT

U.S. Department of the Interior State of Washington Bureau of Reclamation Department of Ecology Pacific Northwest Region Office of Columbia River October 2012 Columbia-Cascades Area Office
Yakima River Basin Integrated Water Resource Management Plan Framework for Implementation Report U.S. Bureau of Reclamation Contract No. 08CA10677A ID/IQ Prepared by HDR Engineering Anchor QEA ECONorthwest Natural Resource Economics ESA

MISSION STATEMENTS
The Department of the Interior protects and manages the Nation’s natural resources and cultural heritage; provides scientific and other information about those resources; and honors its trust responsibilities or special commitments to American Indians, Alaska Natives, and affiliated island communities.
The mission of the Bureau of Reclamation is to manage, develop, and protect water and related resources in an environmentally and economically sound manner in the interest of the American public.
The Mission of the Washington State Department of Ecology is to protect, preserve and enhance Washington’s environment, and promote the wise management of our air, land and water for the benefit of current and future generations.
If you need this document in a format for the visually impaired, call the Office of Columbia River at (509) 575-2490. Persons with hearing loss can call 711 for Washington Relay Service. Persons with a speech disability can call 877-833-6341.
U.S. Department of the Interior State of Washington Bureau of Reclamation Department of Ecology Pacific Northwest Region Office of Columbia River October 2012 Columbia-Cascades Area Office
Yakima River Basin Integrated Water Resource Management Plan Framework for Implementation Report U.S. Bureau of Reclamation Contract No. 08CA10677A ID/IQ Prepared by HDR Engineering Anchor QEA ECONorthwest Natural Resource Economics ESA

(This page intentionally left blank.)
1. Raise the Cle Elum Pool by three feet to add 14,600 ac-ft in storage capacity.
2. Modify Kittitas Reclamation District
savings.
3. Construct a pipeline from Lake Keechelus to Lake Kachess to
needs.
4.
plant to support outmigration of
5.the Wapatox Canal.
Structural & Operational Changes
1. Clear Lake
2. Cle Elum
3. Bumping
4. Tieton (Rimrock)
5. Keechelus
6. Kachess
Reservoir Fish Passage
1. Build a 162,500 ac-ft off-channel surface storage facility at Wymer on Lmuma Creek.
2. Access an additional 200,000
inactive storage at Lake Kachess.
3.Reservoir to increase capacity to 190,000 ac-ft.
4. Begin appraisal of potential
the Columbia River to the Yakima Basin.
Surface Water Storage
1. Protect ~70,000 acres of land by acquiring high elevation portions of
steppe habitat.
3. Create a habitat enhancement program to address reach-level
restore access to key tributaries.
Habitat/Watershed Protection & Enhancement
in the Yakima River basin. Market
-
banking programs in the basin, but take additional steps to reduce bar-
-
the district.
Market ReallocationEnhanced Water Conservation
Groundwater Storage
1.conservation program designed to conserve up to 170,000 acre-feet of
2.
voluntary, incentive-based programs. Focus on outdoor uses as top priority.
1. Construct pilot projects to
2. Build an aquifer storage and
periods and store it underground
Yakima River Basin Integrated Water Resource Management Plan
Rev. 4 11-30-11
Yakima County
1
1
2
2
23
3
445
1
1
1
1
2
3
4
56
Kittitas County
Benton County
All EWCActionsConducted Basin-Wide
22
2
2 MarketReallocation Conducted Basin-Wide
HabitatAction #3Conducted Basin-Wide
GW StorageAction #1Conducted Basin-Wide
Klickitat County
2. Evaluate potential Wilderness, Wild and Scenic River, and National Recreation Area designations to protect streams and habitat.

Yakima River Basin Integrated Plan i Framework for Implementation Report
Contents Executive Summary ...................................................................................................... 1
1.0 Introduction and Purpose .................................................................................. 1
1.1 Previous Activities, Recent Studies and Accomplishments ................................. 3 1.1.1 Yakima River Basin Water Enhancement Project .................................... 3 1.1.2 Yakima River Basin Water Storage Feasibility Study and Development of the Integrated Plan Alternative ...................................... 4
1.2 YRBWEP Workgroup .......................................................................................... 5 1.3 Yakima River Basin Study ................................................................................... 6 1.4 Integrated Plan Authority ..................................................................................... 7
1.4.1 Federal Authority ..................................................................................... 7 1.4.2 Washington State Authority ..................................................................... 7
1.5 Elements Included in the Integrated Plan ............................................................ 7 1.6 Outcomes of the Integrated Plan ........................................................................11 1.7 Programmatic Environmental Impact Statement ................................................12 1.8 Preliminary Schedule for Implementation ...........................................................13 1.9 Periodic Reviews and Adjustments ....................................................................13
2.0 Costs of the Integrated Plan ............................................................................ 16
3.0 Four-Accounts Analysis .................................................................................. 20
3.1 National Economic Development .......................................................................20 3.1.1 Fish Benefits ...........................................................................................22 3.1.2 Irrigation Benefits ....................................................................................33 3.1.3 Municipal and Domestic Water Supply Benefits ......................................43 3.1.4 Costs of the Integrated Plan Applied to NED ..........................................51 3.1.5 Comparison of NED Benefits and Costs .................................................53
3.2 Regional Economic Development ......................................................................55 3.2.1 Analytical Approach ................................................................................55 3.2.2 Economic Impacts of Construction Expenditures ....................................56 3.2.3 Operations and Maintenance Expenditures ............................................57 3.2.4 Changes in Agricultural Production .........................................................58 3.2.5 Summary of RED Results .......................................................................60
3.3 Environmental Quality ........................................................................................62 3.4 Other Social Effects ...........................................................................................67
4.0 Financial Feasibility ......................................................................................... 70
4.1 Cost Allocation ...................................................................................................70 4.2 Purposes Used in Preliminary Cost Allocation ...................................................70 4.3 Costs and Benefits Used in Preliminary Cost Allocation .....................................71 4.4 Identification of “Specific Costs” .........................................................................71 4.5 Definition of “Single-Purpose Alternatives” .........................................................72

Yakima River Basin Integrated Plan ii Framework for Implementation Report
4.6 Results of Preliminary Cost Allocation ................................................................74 4.7 Cost Repayment ................................................................................................74
References ................................................................................................................... 77
Glossary ....................................................................................................................... 83
List of Tables Table ES - 1. Benefit Estimates ...........................................................................................ES -2 Table ES - 2. Summary of Economic Impacts in the 4-County Area, by Type of Expenditure .....................................................................................................ES -3 Table ES - 3. Summary of Economic Impacts in Washington State, by Type of Expenditure ....................................................................................................ES -4 Table ES - 4. Results of Preliminary Cost Allocation ............................................................ES -7 Table 1. Elements and Associated Actions Included in Integrated Plan .................................... 9 Table 2. Summary of Capital Costs (2012 dollars) ...................................................................17 Table 3. Summary of O&M Costs (2012 dollars) ......................................................................18 Table 4. Range of Integrated Plan Costs with Cost Risk Results..............................................19 Table 5. Expected Increases in Salmon and Steelhead Populations Resulting from the Integrated Plan at Full Implementation .......................................................................24 Table 6. Average WTP per Household for Low- and High-End Expected Increases in Fish Population Resulting from the Integrated Plan: Annual and Present Value .........30 Table 7. Present Value of the Integrated Plan’s Fish-Related Benefits .....................................31 Table 8. Comparative Findings on Household Willingness to Pay for Increased Salmon Populations ...................................................................................................32 Table 9. Proratable Water Rights above Parker Gage ..............................................................35 Table 10. Scenarios Used in the Analysis of Irrigation-Related Benefits...................................36 Table 11. Annual Net Farm Earnings during a Severe Drought Year for Baseline and Integrated Plan Scenarios ........................................................................................39 Table 12. Irrigation-Related Benefits Assuming a Range of Severe Drought Conditions ..........40 Table 13. Summary of Economic Impacts, by Type, from Construction Expenditures ..............57 Table 14. Summary of the Economic Impacts of the Highest Level of Annual O&M Expenditures ............................................................................................................58 Table 15. Summary of Economic Impacts of Changes in Agricultural Production, Severe Drought Year ............................................................................................................59 Table 16. Summary of Economic Impacts in the Four-County Area, by Type of Expenditure ...60 Table 17. Summary of Economic Impacts in Washington, by Type of Expenditure ..................61 Table 18. Summary of Economic Impacts Relative to the Greater Economy ............................61 Table 19. EQ Resource Categories ..........................................................................................62 Table 20. EQ Categories and Weightings ................................................................................64 Table 24. OSE Categories and Rankings .................................................................................67 Table 25. OSE Evaluation Results ...........................................................................................68 Table 23. Projects Included in SPA for Ecological Restoration .................................................73 Table 24. Projects Included in SPA for Agricultural Irrigation ....................................................73 Table 25. Projects Included in SPA for Municipal and Domestic Supply ...................................73 Table 26. Preliminary Cost Allocation – 2012 (Present Value) .................................................75 Table 27. Preliminary Cost Allocation – 2026 (Future Value) ...................................................76
Yakima River Basin Integrated Plan iii Framework for Implementation Report
List of Figures
Figure ES - 1. Environmental Quality Scores for the Integrated Plan and No Action Alternatives ............................................................................................................ES -5
Figure ES - 2. Other Social Effects Scores for the Integrated Plan and No Action Alternatives ............................................................................................................ES -6
Figure 1. Yakima Project Facilities and Irrigation Divisions ....................................................... 2 Figure 2. Yakima River Basin Water Enhancement Project Timeline ........................................ 3 Figure 3. Integrated Plan Project Locations ..............................................................................10 Figure 4. Preliminary Implementation Schedule for the Integrated Plan ...................................14 Figure 5. Components of Total Economic Value ......................................................................23 Figure 6. Annual Household Willingness to Pay for an Increase in the Columbia River and Eastern Washington Salmon/Steelhead Population ...................................................26 Figure 7. Average Annual Household WTP for the Integrated Plan’s Potential Impact on Fish Populations ........................................................................................................30 Figure 8. Annual Use Values Derived from the Implemented Plan’s Potential Impact on Fish Populations ........................................................................................................33 Figure 9. Potential Irrigation-Related Benefits of the Integrated Plan (millions) ........................39 Figure 10. Average Annual U.S. and Washington Marketing Year Crop Prices ........................41 Figure 11. Water Availability and Washington Crop Prices .......................................................42 Figure 12. Annual Distribution of the Integrated Plan’s Municipal and Domestic Water Benefits Associated with New Water Supplies for Future Growth ............................45 Figure 13. Annual and Discounted Value of Expected Municipal and Domestic Benefits Associated with New Water Supplies for Future Growth ..........................................47 Figure 14. Cumulative Discounted Benefits of the Integrated Plan Associated with Future Growth in Municipal and Domestic Water Users ......................................................48 Figure 15. Annual and Discounted Value of Expected Municipal and Domestic Benefits Associated with Increased Security for Current Municipal and Domestic Groundwater Users .................................................................................................50 Figure 16. Cumulative Discounted Benefits of the Integrated Plan Associated with Increased Security for Current Municipal and Domestic Groundwater Users ..........51 Figure 17. Potential Financial Costs to Implement the Integrated Plan .....................................52 Figure 18. Cumulative Discounted Financial Costs of Implementing the Integrated Plan .........53 Figure 19. Summary of Benefits and Costs ..............................................................................54 Figure 20. Summary of Benefit-Cost Ratios .............................................................................55 Figure 21. Environmental Quality Scores for the Integrated Plan and No Action Alternatives ...66 Figure 22. Other Social Effects Scores for the Integrated Plan and No Action Alternatives ......69
Yakima River Basin Integrated Plan iv Framework for Implementation Report
Acronyms and Abbreviations (A full glossary with terms and definitions is located at the back of this document.) AHA All H (habitat, hatchery, harvest and hydropower) Analyzer
model ASR Aquifer storage and recovery BPA Bonneville Power Administration CFS Cubic feet per second Ecology Washington State Department of Ecology EDT Ecosystem Diagnosis and Treatment model EIS Environmental impact statement EQ Environmental Quality FEIS Final environmental impact statement FY Fiscal Year Integrated Plan Proposed Integrated Water Resource Management Plan for the
Yakima Basin IDC Interest during construction KAF Thousand Acre-feet K to K Lake Keechelus to Lake Kachess (conveyance) KRD Kittitas Reclamation District NED National Economic Development NEPA National Environmental Policy Act O&M Operation and maintenance OM&R Operations, maintenance and construction OPCC Opinion of probable construction cost OSE Other Social Effects PR/EIS Planning report/environmental impact statement Reclamation United States Department of the Interior, Bureau of Reclamation RED Regional Economic Development SEPA State Environmental Policy Act SPA Single Purpose Alternative TWSA Total water supply available USGS United States Geological Survey Workgroup Yakima River Basin Water Enhancement Project Workgroup YRBWEP Yakima River Basin Water Enhancement Project

Yakima River Basin Integrated Plan ES-1 Framework for Implementation Report
Executive Summary The Yakima River Basin Integrated Water Resource Management Plan (Integrated Plan) offers an approach to improving water management in the Yakima River basin of central Washington State. It was developed by Reclamation and the Washington State Department of Ecology in conjunction with the Yakama Nation and Yakima River basin stakeholders. The goals of the Integrated Plan are to protect, mitigate, and enhance fish and wildlife habitat; provide increased operational flexibility to manage instream flows to meet ecological objectives, and improve the reliability of the water supply for irrigation, municipal supply and domestic uses. A Final Programmatic Environmental Impact Statement (PEIS) analyzing broad effects of the Integrated Plan on environmental resources was issued in 2012 (Reclamation and Ecology 2012d).
This Framework for Implementation Report includes information such as refined cost estimates and a preliminary schedule for implementing the Integrated Plan. The report summarizes the “Four-Accounts” analyses required under the Federal Economic and Environmental Principles and Guidelines for Water and Related Land Resources Implementation Studies (U.S. Water Resources Council. 1983) (Principles and Guidelines). The Four Accounts are: National Economic Development (NED), Regional Economic Development (RED), Environmental Quality (EQ) and Other Social Effects (OSE). It also addresses financial feasibility, including a preliminary allocation of costs to the various purposes served by the Integrated Plan.
Funding for the projects that make up the Integrated Plan are expected to be cost shared among a wide range of partners. Even though this Study utilizes traditional economic tools and analyses (Principles and Guidelines), the Integrated Plan is not intended to be funded as a typical Reclamation project. It is anticipated that the State of Washington would continue to be a cost-share partner in funding implementation of many of the elements of the Integrated Plan, as well as local governments and other parties. At this time, however, specific cost-sharing provisions between local, State, Federal governments, as well as other partners, have not been determined.
The Integrated Plan The Integrated Plan includes seven elements: 1) reservoir fish passage; 2) structural and operational changes to existing facilities; 3) surface water storage; 4) groundwater storage; 5) habitat/watershed protection and enhancement; 6) enhanced water conservation; and 7) market reallocation. It addresses current water resource and habitat problems, while providing an adaptive management framework to address potential future changes in water needs or hydrology, including potential climate change effects.
Outcomes of the Integrated Plan can be summarized as follows.
• Improved streamflow conditions in many key reaches of the Yakima River, Naches River, and tributaries with storage facilities. This includes improved ability to meet flow objectives in 13 of 15 reaches of the mainstem Yakima River, as well as increased “carryover” water that provides flexibility for meeting other streamflow objectives.
• Substantial increases in fish populations, including spring/summer Chinook, fall Chinook, coho, steelhead and sockeye.
• Improved water supply reliability for three irrigation divisions that rely heavily on “proratable” water rights, primarily for agricultural irrigation. These are the Kittitas

Yakima River Basin Integrated Plan ES-2 Framework for Implementation Report
Reclamation District, Roza Irrigation District and Wapato Irrigation Project. Drought conditions have reduced supplies in some years to as low as 37 percent of entitlements. The plan is expected to increase available supplies to at least 70 percent of water entitlements to these users during dry years.
• Improved water supply for municipal and domestic water users, including improved security for existing users whose water rights are junior to the proratable water users, and new supply of 50,000 acre feet per year to support growth and economic development in the Yakima River basin.
• Improved resilience to potential effects of climate change on the basin’s streamflows and water supplies.
Implementation Costs Capital costs of the Integrated Plan are estimated to be between $3.2 and $5.4 billion, with a most probable cost estimate of approximately $4.2 billion, expressed in 2012 dollars. These costs include permitting, design, environmental analyses, construction of infrastructure projects, implementation of programmatic activities, and environmental mitigation. The range was developed using cost-risk assessment to consider uncertainty and risk factors for each of the six largest projects to generate probabilistic estimates of construction costs. Additional costs of approximately $140 million are identified for interest during construction. Annual Operations and Maintenance (O&M) costs are expected to be approximately $12 million in 2012 dollars once all projects and programs from the Integrated Plan are fully operational.1
National Economic Development
The National Economic Development (NED) account measures benefits and costs of the Integrated Plan to the Nation as a whole. The analysis performed on the Integrated Plan addresses three categories of economic benefits: increases in fish populations, increases in the reliability of irrigation water during severe drought years; and improvements in municipal and domestic water supply. Estimated value of these benefits is displayed in Table ES-1. Values shown are discounted to present value in 2012 and expressed in 2012 dollars for the 100-year life of the project. Additional benefits are also identified, but are not readily quantified in monetary terms.
Table ES - 1. Benefit Estimates
CATEGORY ESTIMATED VALUE (PRESENT VALUE, 2012 DOLLARS)
Fish Benefits $5.0 billion to 7.4 billion Agricultural Irrigation Benefits $0.8 billion Municipal and Domestic Water Supply Benefits $0.4 billion Total Benefits $6.2 to 8.6 billion
Benefits are described more fully in Section 3.1, and the full benefits analysis is presented in Reclamation and Ecology 2012b. 1 Costs listed in this paragraph are not discounted. Costs and benefits listed later in this Executive Summary include some values that are discounted, and these are noted. Discounting is a process used in economic analysis to account for the time value of money. When discounting is applied, money spent in the future has less value than money spent in the present.
Yakima River Basin Integrated Plan ES-3 Framework for Implementation Report
A range of benefit/cost ratios was estimated, using low, medium and high values for both costs and benefits, with discounting. The benefit/cost ratios range from 1.4 to 3.2, depending on the combination of benefits and costs used.
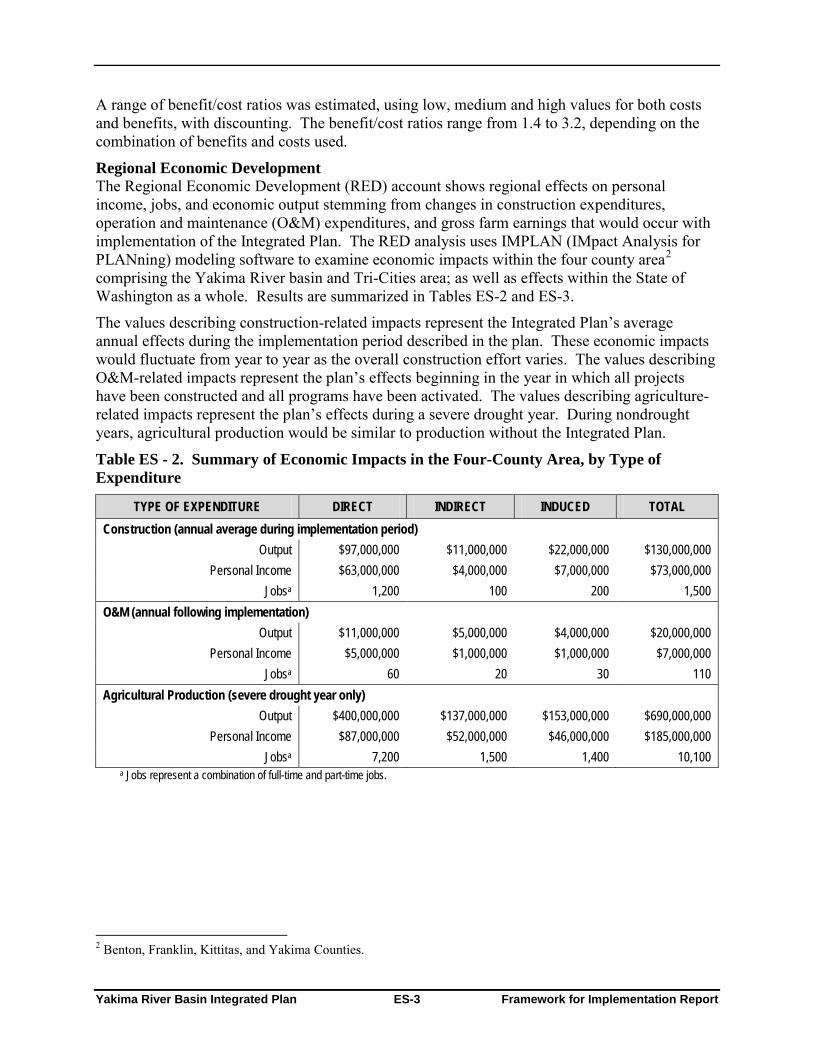
Regional Economic Development The Regional Economic Development (RED) account shows regional effects on personal income, jobs, and economic output stemming from changes in construction expenditures, operation and maintenance (O&M) expenditures, and gross farm earnings that would occur with implementation of the Integrated Plan. The RED analysis uses IMPLAN (IMpact Analysis for PLANning) modeling software to examine economic impacts within the four county area2
The values describing construction-related impacts represent the Integrated Plan’s average annual effects during the implementation period described in the plan. These economic impacts would fluctuate from year to year as the overall construction effort varies. The values describing O&M-related impacts represent the plan’s effects beginning in the year in which all projects have been constructed and all programs have been activated. The values describing agriculture-related impacts represent the plan’s effects during a severe drought year. During nondrought years, agricultural production would be similar to production without the Integrated Plan.
comprising the Yakima River basin and Tri-Cities area; as well as effects within the State of Washington as a whole. Results are summarized in Tables ES-2 and ES-3.
Table ES - 2. Summary of Economic Impacts in the Four-County Area, by Type of Expenditure
TYPE OF EXPENDITURE DIRECT INDIRECT INDUCED TOTAL Construction (annual average during implementation period)
Output $97,000,000 $11,000,000 $22,000,000 $130,000,000 Personal Income $63,000,000 $4,000,000 $7,000,000 $73,000,000
Jobsa 1,200 100 200 1,500 O&M (annual following implementation)
Output $11,000,000 $5,000,000 $4,000,000 $20,000,000 Personal Income $5,000,000 $1,000,000 $1,000,000 $7,000,000
Jobsa 60 20 30 110 Agricultural Production (severe drought year only)
Output $400,000,000 $137,000,000 $153,000,000 $690,000,000 Personal Income $87,000,000 $52,000,000 $46,000,000 $185,000,000
Jobsa 7,200 1,500 1,400 10,100 a Jobs represent a combination of full-time and part-time jobs.
2 Benton, Franklin, Kittitas, and Yakima Counties.
Yakima River Basin Integrated Plan ES-4 Framework for Implementation Report
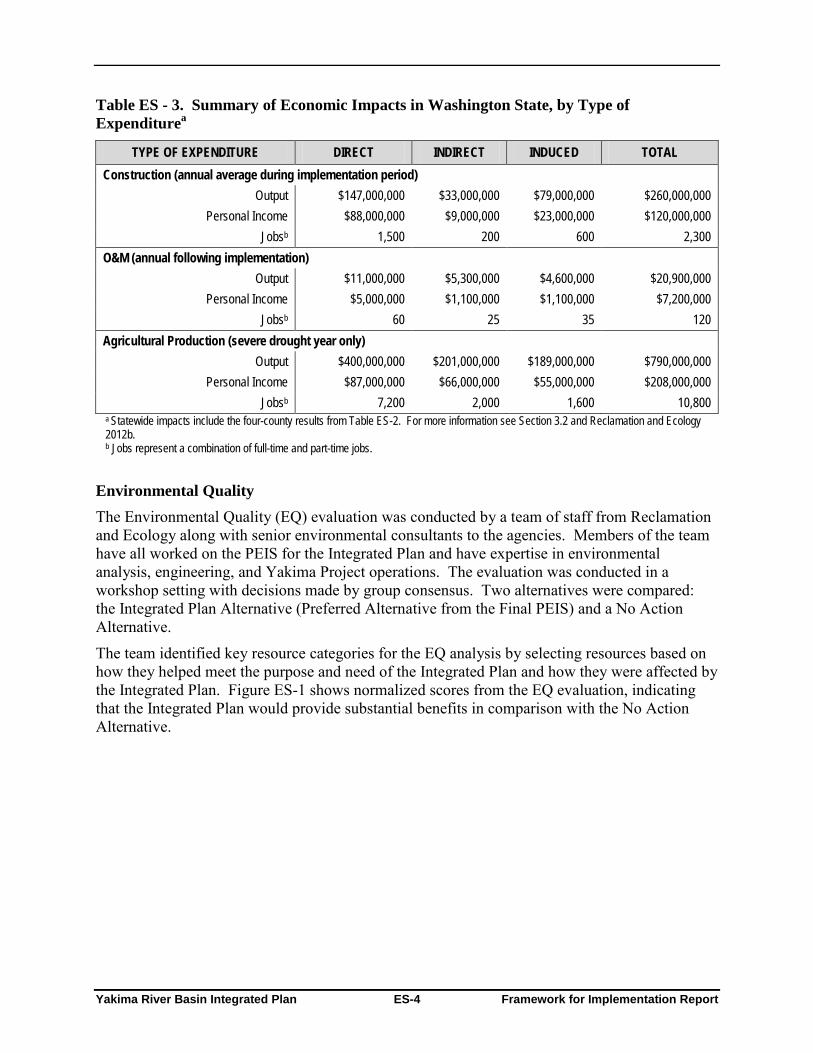
Table ES - 3. Summary of Economic Impacts in Washington State, by Type of Expenditurea
TYPE OF EXPENDITURE DIRECT INDIRECT INDUCED TOTAL Construction (annual average during implementation period)
Output $147,000,000 $33,000,000 $79,000,000 $260,000,000 Personal Income $88,000,000 $9,000,000 $23,000,000 $120,000,000
Jobsb 1,500 200 600 2,300 O&M (annual following implementation)
Output $11,000,000 $5,300,000 $4,600,000 $20,900,000 Personal Income $5,000,000 $1,100,000 $1,100,000 $7,200,000
Jobsb 60 25 35 120 Agricultural Production (severe drought year only)
Output $400,000,000 $201,000,000 $189,000,000 $790,000,000 Personal Income $87,000,000 $66,000,000 $55,000,000 $208,000,000
Jobsb 7,200 2,000 1,600 10,800 a Statewide impacts include the four-county results from Table ES-2. For more information see Section 3.2 and Reclamation and Ecology 2012b. b Jobs represent a combination of full-time and part-time jobs.
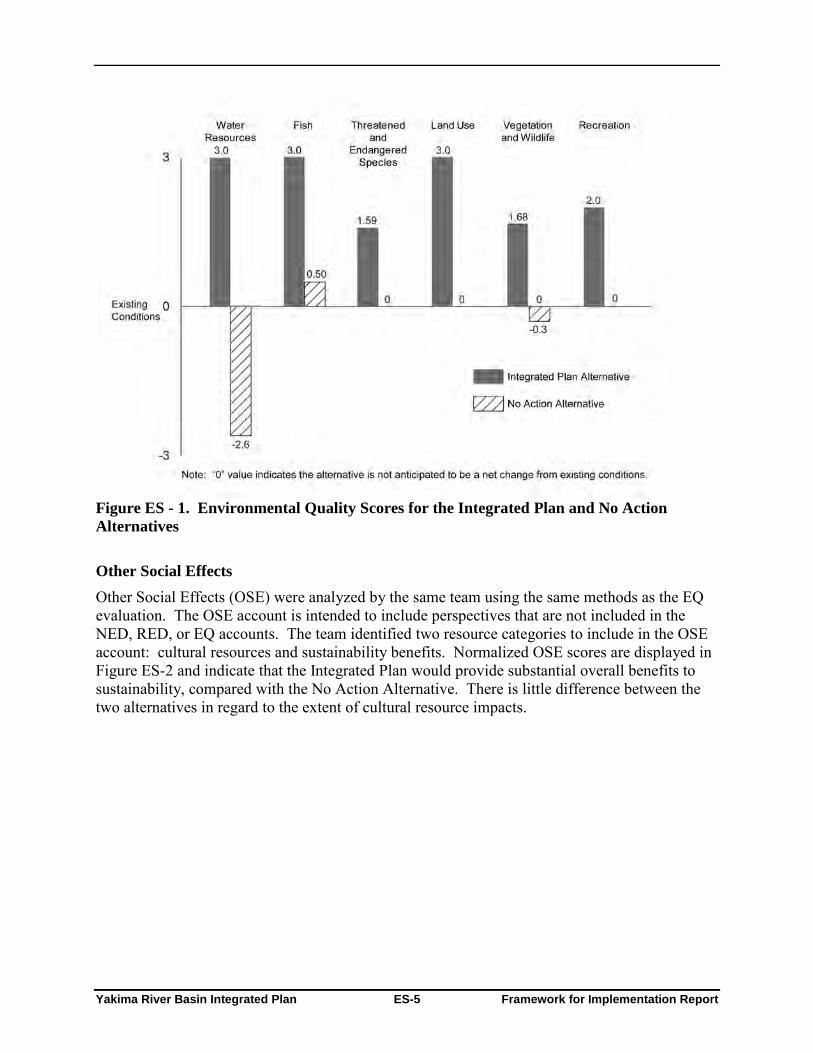
Environmental Quality The Environmental Quality (EQ) evaluation was conducted by a team of staff from Reclamation and Ecology along with senior environmental consultants to the agencies. Members of the team have all worked on the PEIS for the Integrated Plan and have expertise in environmental analysis, engineering, and Yakima Project operations. The evaluation was conducted in a workshop setting with decisions made by group consensus. Two alternatives were compared: the Integrated Plan Alternative (Preferred Alternative from the Final PEIS) and a No Action Alternative.
The team identified key resource categories for the EQ analysis by selecting resources based on how they helped meet the purpose and need of the Integrated Plan and how they were affected by the Integrated Plan. Figure ES-1 shows normalized scores from the EQ evaluation, indicating that the Integrated Plan would provide substantial benefits in comparison with the No Action Alternative.
Yakima River Basin Integrated Plan ES-5 Framework for Implementation Report
Figure ES - 1. Environmental Quality Scores for the Integrated Plan and No Action Alternatives
Other Social Effects Other Social Effects (OSE) were analyzed by the same team using the same methods as the EQ evaluation. The OSE account is intended to include perspectives that are not included in the NED, RED, or EQ accounts. The team identified two resource categories to include in the OSE account: cultural resources and sustainability benefits. Normalized OSE scores are displayed in Figure ES-2 and indicate that the Integrated Plan would provide substantial overall benefits to sustainability, compared with the No Action Alternative. There is little difference between the two alternatives in regard to the extent of cultural resource impacts.

Yakima River Basin Integrated Plan ES-6 Framework for Implementation Report
Figure ES - 2. Other Social Effects Scores for the Integrated Plan and No Action Alternatives
Financial Feasibility
The financial feasibility analysis performed for the Integrated Plan includes a preliminary cost allocation by purpose and consideration of cost repayment.
The Alternative Joint Expenditures (AJE) method was used in the preliminary cost allocation of the Integrated Plan. In brief, the AJE method separates out the specific costs that should be associated with a single purpose. It then follows a step-by-step procedure to allocate the joint costs that remain. Allocated joint costs are added to specific costs for each purpose, to determine that purpose’s share of total project costs.
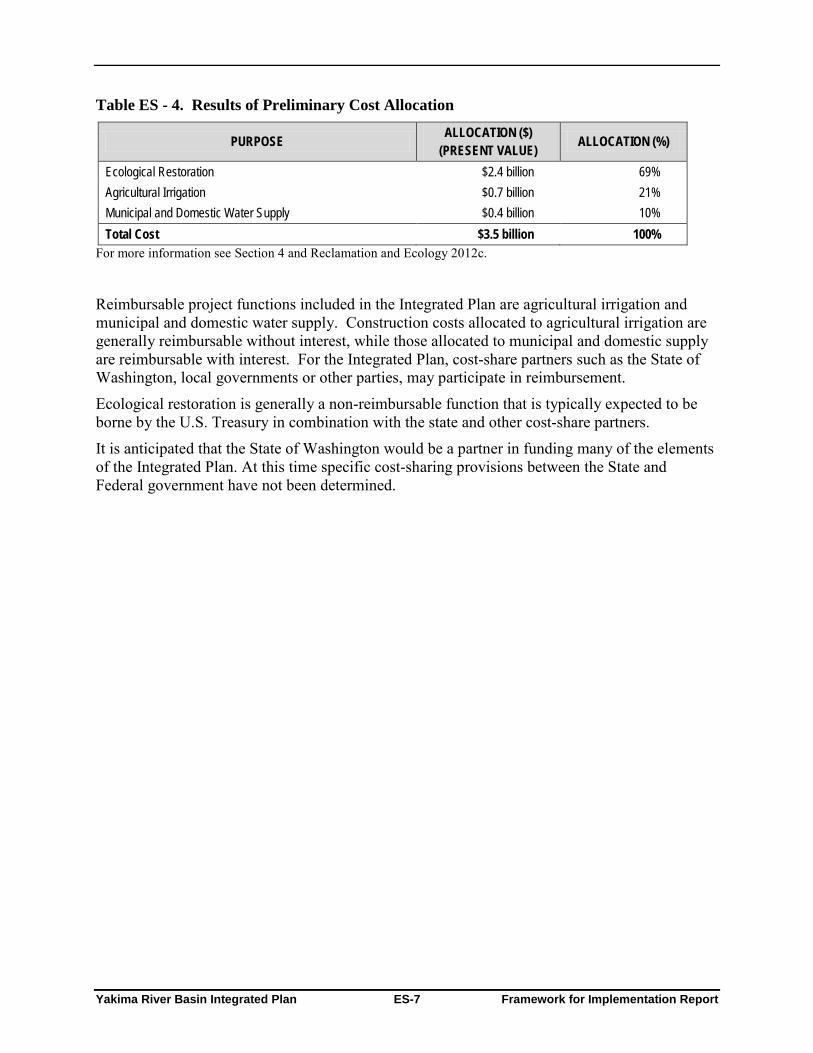
The preliminary cost allocation indicates the following breakdown among the three project purposes considered in the analysis (values discounted to present value and expressed in 2012 dollars):
Yakima River Basin Integrated Plan ES-7 Framework for Implementation Report
Table ES - 4. Results of Preliminary Cost Allocation
PURPOSE ALLOCATION ($) (PRESENT VALUE) ALLOCATION (%)
Ecological Restoration $2.4 billion 69% Agricultural Irrigation $0.7 billion 21% Municipal and Domestic Water Supply $0.4 billion 10% Total Cost $3.5 billion 100%
For more information see Section 4 and Reclamation and Ecology 2012c.
Reimbursable project functions included in the Integrated Plan are agricultural irrigation and municipal and domestic water supply. Construction costs allocated to agricultural irrigation are generally reimbursable without interest, while those allocated to municipal and domestic supply are reimbursable with interest. For the Integrated Plan, cost-share partners such as the State of Washington, local governments or other parties, may participate in reimbursement.
Ecological restoration is generally a non-reimbursable function that is typically expected to be borne by the U.S. Treasury in combination with the state and other cost-share partners.
It is anticipated that the State of Washington would be a partner in funding many of the elements of the Integrated Plan. At this time specific cost-sharing provisions between the State and Federal government have not been determined.

Yakima River Basin Integrated Plan ES-8 Framework for Implementation Report
(This page intentionally left blank.)
Yakima River Basin Integrated Plan 1 Framework for Implementation Report
1.0 Introduction and Purpose The Yakima River Basin Integrated Water Resource Management Plan (Integrated Plan) offers an approach to improving water management in the Yakima River basin of central Washington State. It was developed by Reclamation and the Washington State Department of Ecology in conjunction with the Yakama Nation and Yakima River basin stakeholders. The goals of the Integrated Plan are to protect, mitigate, and enhance fish and wildlife habitat; provide increased operational flexibility to manage instream flows to meet ecological objectives, and improve the reliability of the water supply for irrigation, municipal supply and domestic uses. The Integrated Plan was issued in 2011 (Reclamation and Ecology 2011d). A Final Programmatic Environmental Impact Statement (PEIS) analyzing broad effects of the Integrated Plan on environmental resources was issued in 2012 (Reclamation and Ecology 2012d).
This Framework for Implementation Report includes information such as refined cost estimates and a preliminary schedule for implementing the Integrated Plan. The report summarizes the “Four-Accounts” analyses required under the Federal Economic and Environmental Principles and Guidelines for Water and Related Land Resources Implementation Studies (U.S. Water Resources Council. 1983) (Principles and Guidelines). The Four Accounts are: National Economic Development (NED), Regional Economic Development (RED), Environmental Quality (EQ) and Other Social Effects (OSE). It also addresses financial feasibility, including a preliminary allocation of costs to the various purposes served by the Integrated Plan.
Funding for the projects that make up the Integrated Plan are expected to be cost shared among a wide range of partners. Even though this Study utilizes traditional economic tools and analyses (Principles and Guidelines), the Integrated Plan is not intended to be funded as a typical Reclamation project. It is anticipated that the State of Washington would continue to be a cost-share partner in funding implementation of many of the elements of the Integrated Plan, as well as local governments and other parties. At this time, however, specific cost-sharing provisions between local, State, Federal governments, as well as other partners, have not been determined
To provide context for this information, this report also summarizes background information from the Integrated Plan and PEIS.
The Integrated Plan was developed from studies initiated as early as 1979 under the Yakima River Basin Water Enhancement Project (YRBWEP), together with updated information developed under the 2011 Yakima River Basin Study, which was conducted through a planning partnership of Reclamation and Washington State Department of Ecology (Ecology).
Building on previous planning efforts, the Integrated Plan is the most comprehensive effort to date in proposing water resource and habitat protection and restoration solutions in the Yakima basin.
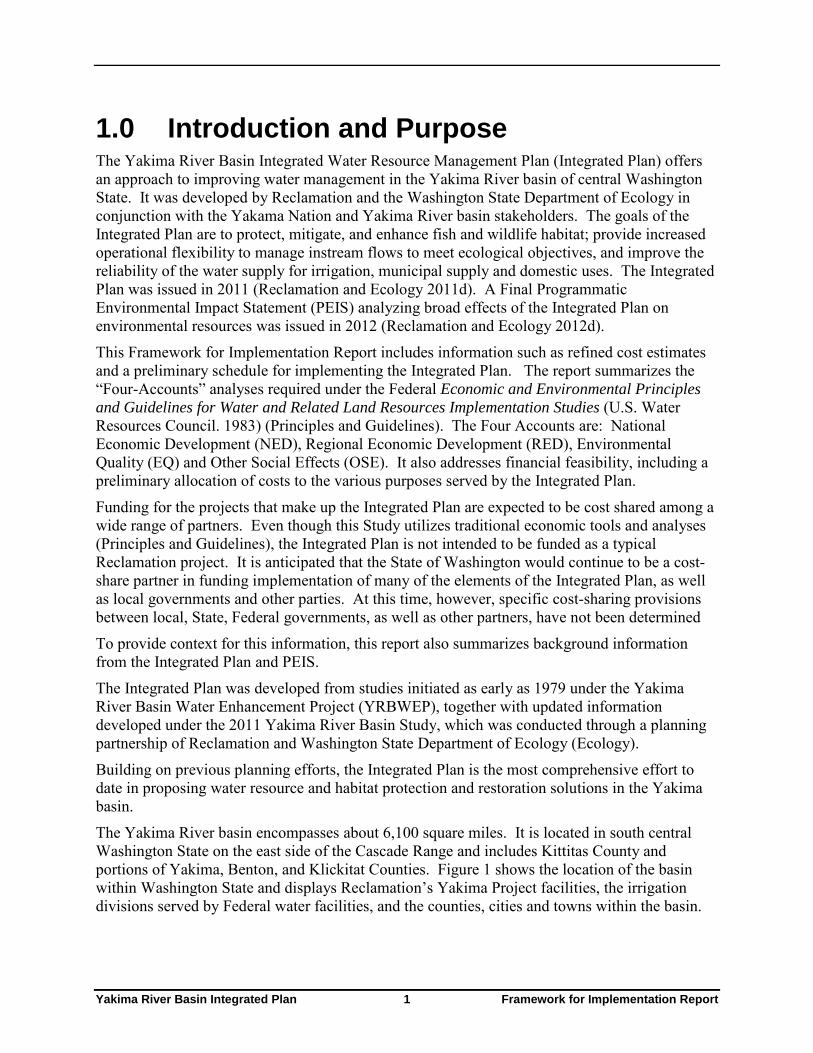
The Yakima River basin encompasses about 6,100 square miles. It is located in south central Washington State on the east side of the Cascade Range and includes Kittitas County and portions of Yakima, Benton, and Klickitat Counties. Figure 1 shows the location of the basin within Washington State and displays Reclamation’s Yakima Project facilities, the irrigation divisions served by Federal water facilities, and the counties, cities and towns within the basin.
Yakima River Basin Integrated Plan 2 Framework for Implementation Report
Figure 1. Yakima Project Facilities and Irrigation Divisions
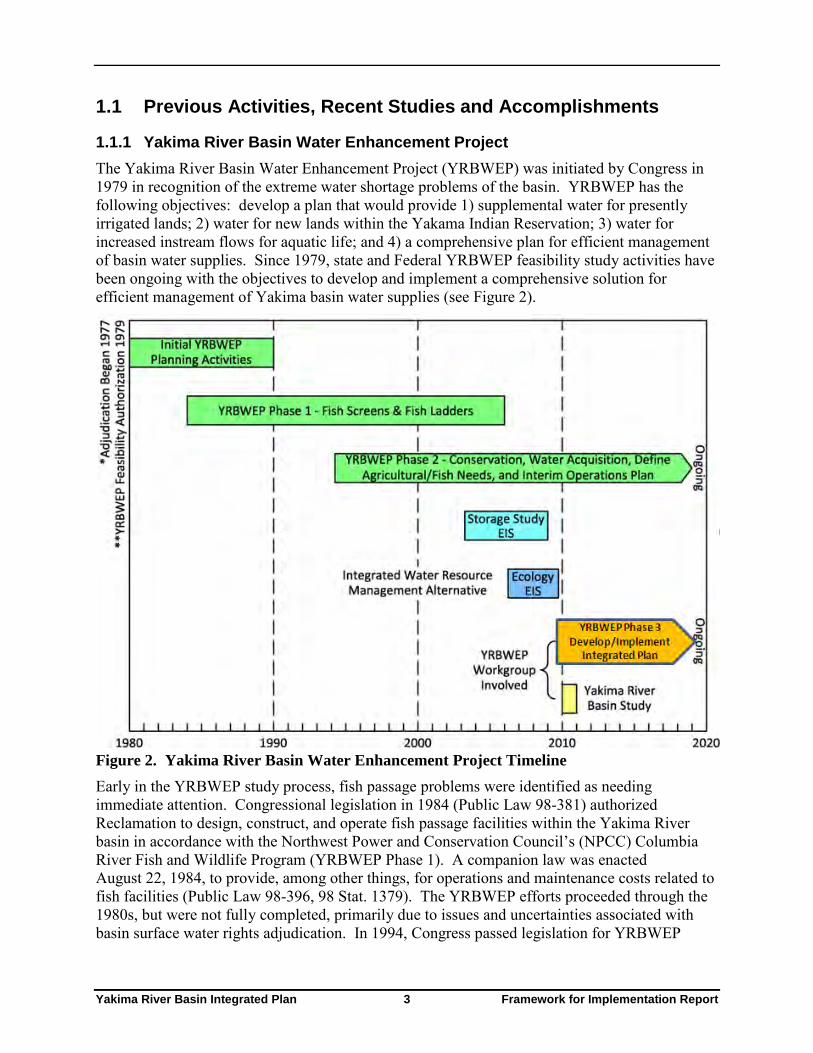
Yakima River Basin Integrated Plan 3 Framework for Implementation Report
1.1 Previous Activities, Recent Studies and Accomplishments
1.1.1 Yakima River Basin Water Enhancement Project The Yakima River Basin Water Enhancement Project (YRBWEP) was initiated by Congress in 1979 in recognition of the extreme water shortage problems of the basin. YRBWEP has the following objectives: develop a plan that would provide 1) supplemental water for presently irrigated lands; 2) water for new lands within the Yakama Indian Reservation; 3) water for increased instream flows for aquatic life; and 4) a comprehensive plan for efficient management of basin water supplies. Since 1979, state and Federal YRBWEP feasibility study activities have been ongoing with the objectives to develop and implement a comprehensive solution for efficient management of Yakima basin water supplies (see Figure 2).
Figure 2. Yakima River Basin Water Enhancement Project Timeline Early in the YRBWEP study process, fish passage problems were identified as needing immediate attention. Congressional legislation in 1984 (Public Law 98-381) authorized Reclamation to design, construct, and operate fish passage facilities within the Yakima River basin in accordance with the Northwest Power and Conservation Council’s (NPCC) Columbia River Fish and Wildlife Program (YRBWEP Phase 1). A companion law was enacted August 22, 1984, to provide, among other things, for operations and maintenance costs related to fish facilities (Public Law 98-396, 98 Stat. 1379). The YRBWEP efforts proceeded through the 1980s, but were not fully completed, primarily due to issues and uncertainties associated with basin surface water rights adjudication. In 1994, Congress passed legislation for YRBWEP
Yakima River Basin Integrated Plan 4 Framework for Implementation Report
Phase 2 (Public Law 103-434), which provided for significant water conservation and acquisition activities; studies to define the long-term water needs of fish and irrigators; improvements to the Wapato Irrigation Project; and development of an interim operations plan for management of basin water supplies.
In compliance with the 1994 YRBWEP Act (Phase 2 Legislation – Public Law 103-434), Reclamation and Ecology are cost-sharing partners in the Basin Conservation Program, with Reclamation funding 65 percent of the cost and Ecology and participating irrigation districts each funding 17.5 percent. Under this program, two-thirds of the water savings remains in the river, and the irrigation district retains one-third.
As of August 2012, Reclamation, Ecology, and irrigation entities have cost-shared to develop eight Comprehensive Conservation Plans and four conservation Feasibility Investigation Reports for Yakima basin irrigation systems. A number of projects have been implemented to generate water savings and improve streamflows. For more information, see the Reclamation’s Web site at: http://www.usbr.gov/pn/programs/yrbwep/phase2/basinconservation.html.
1.1.2 Yakima River Basin Water Storage Feasibility Study and Development of the Integrated Plan Alternative
In 2003, Congress directed Reclamation to conduct a feasibility study of options for additional water storage in the Yakima River basin. The authorization for the study is contained in Section 214 of the Act of February 20, 2003 (Public Law 108-7). The authorization states that the study will place “… emphasis on the feasibility of storage of Columbia River water in the potential Black Rock Reservoir and the benefit of additional storage to endangered and threatened fish, irrigated agriculture, and municipal water supply.”
Reclamation began the Storage Study in May 2003. The State of Washington joined Reclamation in that effort after funding was provided in the State’s 2003-2005 capital budget.
In 2007, Reclamation and Ecology initiated environmental review for the Storage Study. The Draft Planning Report/Environmental Impact Statement (PR/EIS) was prepared as a combined National Environmental Policy Act (NEPA) and State Environmental Policy Act (SEPA) document, entitled the Yakima River Basin Water Storage Feasibility Study Draft Planning Report/Environmental Impact Statement (Reclamation and Ecology, 2008).
Reclamation understood that Federal funds provided under Section 14 of the Act of February 20, 2003, could only be used to study Black Rock Reservoir and other potential storage facilities in the Yakima River basin. The alternatives considered by Reclamation were:
• No Action Alternative;
• Black Rock Reservoir Alternative;
• Wymer Dam and Reservoir Alternative; and
• Wymer Dam Plus Yakima River Pump Exchange Alternative. These storage facilities were referred to as the “Joint Alternatives” in the January 2008 Draft PR/EIS because they were advanced jointly by Reclamation and Ecology. Under its SEPA authority, Ecology determined that both storage and nonstorage means of achieving the objectives needed to be evaluated. Thus, the January 2008 Draft PR/EIS considered three “State Alternatives” in addition to the Joint Alternatives:
Yakima River Basin Integrated Plan 5 Framework for Implementation Report
• Enhanced Water Conservation Alternative;
• Market-Based Reallocation of Water Resources Alternative; and
• Groundwater Storage Alternative.
Reclamation and Ecology held a public comment period on the January 2008 Draft PR/EIS from January 29 to March 31, 2008. A number of the comments received asserted that Reclamation and Ecology had failed to evaluate an adequate range of reasonable alternatives. Ecology consulted with Reclamation concerning whether additional alternatives should be evaluated, and Ecology concluded that the scope of the EIS should be expanded; however, Reclamation determined that its congressional authorization precluded it from expanding its analysis under NEPA to include nonstorage alternatives. Therefore, Ecology decided to separate from the joint NEPA/SEPA process for the study and to pursue completion of a stand-alone SEPA Supplemental EIS. Ecology continued to act as a cooperating agency for Reclamation’s NEPA process while Reclamation acted in a similar capacity for the SEPA process. Reclamation pursued completion of the Final PR/EIS for the Storage Study, while Ecology prepared a SEPA Supplemental Draft EIS and a Final EIS.
Reclamation released its Final PR/EIS on December 29, 2008. The Final PR/EIS included only the storage facilities in the Joint Alternatives and responses to comments on the Joint Alternatives. The Final PR/EIS concluded that none of the storage features by themselves met Federal criteria for an economically and environmentally sound water project and recommended the No Action Alternative as the Preferred Alternative. On April 3, 2009, Reclamation, in a concluding letter, announced that it had concluded the Yakima River Basin Water Storage Feasibility Study.
1.1.3 Ecology’s Yakima River Basin Water Storage Feasibility Study Supplemental SEPA Analysis Ecology’s Supplemental DEIS was released December 10, 2008, and evaluated an integrated approach to water management in the Yakima River basin. Ecology’s Integrated Water Resource Management Alternative proposed seven elements for improving water supplies for agricultural and municipal needs and to improve habitat for anadromous and resident fish. The seven elements were fish passage, modifying existing structures and operations improvements, new surface storage, groundwater storage, fish habitat enhancement, enhanced water conservation, and market-based reallocation of water resources. Ecology prepared its EIS at a programmatic level. The FEIS was issued in June 2009. It presents an integrated package of opportunities to address water resource problems in the Yakima River basin.
1.2 YRBWEP Workgroup In 2009, Reclamation and Ecology convened the YRBWEP Workgroup to review studies produced since the 1979 YRBWEP feasibility study authorization, including Ecology’s FEIS, in order to formulate a comprehensive and integrated solution for the basin’s water resource problems and ecosystem restoration needs. The Workgroup is composed of representatives of the Yakama Nation, Federal agencies, Washington State and local governments, an environmental organization, and irrigation districts (see Reclamation and Ecology 2011d for list of YRBWEP Workgroup members). Staff representing the state’s congressional delegation also

Yakima River Basin Integrated Plan 6 Framework for Implementation Report
attended regularly to observe Workgroup discussions. Meetings have been open to the public with opportunities for public input; public attendance regularly numbered 20 to 30 individuals.
The Workgroup has met regularly since June 2009. Activities have included development of an initial Integrated Plan proposal, performance of multiple analyses to examine a range of technical, engineering, and economic topics, and preparation of the Integrated Plan.
Members of the Workgroup include the following organizations:
State and Federal Agencies Bureau of Reclamation National Marine Fisheries Service U.S. Fish and Wildlife Service U.S. Forest Service Washington State Department of Agriculture Washington State Department of Ecology Washington State Dept. of Fish & Wildlife Yakama Nation Yakama Nation Natural Resources Yakima/Klickitat Fisheries Project
Local Governments Benton County Kittitas County Yakima County City of Yakima Irrigated Agriculture Kennewick Irrigation District Kittitas Reclamation District Roza Irrigation District Sunnyside Valley Irrigation District Yakima-Tieton Irrigation District
Other Stakeholders American Rivers National Wildlife Federation3
Yakima Basin Fish & Wildlife Recovery Board
Yakima Basin Storage Alliance
1.3 Yakima River Basin Study In early 2010, further evaluation and analysis of the Integrated Plan was undertaken under funding from the Department of Interior’s WaterSMART Basin Study Program. The Yakima River Basin Study was jointly conducted in 2010 by Reclamation and Ecology.
Through the Basin Study and associated interaction with the Workgroup and its subcommittees, basin needs were specified in greater detail. Reclamation and Ecology further defined, evaluated, and updated actions in the Integrated Plan. Expected hydrologic, fish habitat, fisheries, and economic effects for the Integrated Plan and the future without the Integrated Plan were also further characterized. Potential impacts of future climate change were evaluated and factored into the instream and out-of-stream projections for future water availability and demands. Storage and flow projections were modeled for plan elements based on accepted climate change projections.
The Basin Study including modeling and analysis results, along with cost estimates, assessments of barriers and risks, and potential economic effects were completed in 2011. The Integrated Plan and supporting technical documents are located on Reclamation’s website at: http://www.usbr.gov/pn/programs/yrbwep/2011integratedplan/index.html 3 Alternate for American Rivers

Yakima River Basin Integrated Plan 7 Framework for Implementation Report
1.4 Authority Federal authority is through various legislation. State authority is through the Columbia River Water Supply legislation and State Capital Budget as discussed below.
1.4.1 Federal Authority Congress authorized Reclamation to conduct a feasibility study to address the water resource needs of the Yakima River basin in the Act of December 28, 1979 (93 Stat. 1241, Public Law 96-162, Feasibility Study - Yakima River Basin Water Enhancement Project).
Other authorities relevant to the YRBWEP are:
• Hoover Power Plant Act of 1984, which authorizes Reclamation to install fish passage facilities on Reclamation dams; and
• Yakima River Basin Water Enhancement Project Act of 1994.
1.4.2 Washington State Authority Authority for the State of Washington is provided by Chapter 90.90 RCW, the Columbia River Basin Water Supply legislation approved by the Washington State Legislature in 2006, which states:
(1) The legislature finds that a key priority of water resource management in the Columbia river basin is the development of new water supplies that includes storage and conservation in order to meet the economic and community development needs of people and the instream flow needs of fish. (2) The legislature therefore declares that a Columbia river basin water supply development program is needed, and directs the department of ecology to aggressively pursue the development of water supplies to benefit both instream and out-of-stream uses.
In 90.90.010 RCW, the legislature created the Columbia River Basin water supply development account in the state treasury. The account may be used to:
Assess, plan and develop new storage, improve or alter operations of existing storage facilities, implement conservation projects, or any other actions designed to provide access to new water supplies within the Columbia river basin for instream and out-of-stream uses.
Additional authority for the State of Washington is contained in the 2011 to 2013 Capital Budget, Yakima Basin Integrated Water Management Plan Implementation (30000278) C 49, L 11, E1, Sec 3033. Under this provision, funding is provided to implement the Integrated Water Resource Management Plan identified as a result of the Yakima River Basin Study. Projects proposed for inclusion with this first phase address storage, including the Wymer Reservoir and Bumping Lake expansion projects, and fish passage at Cle Elum Dam.
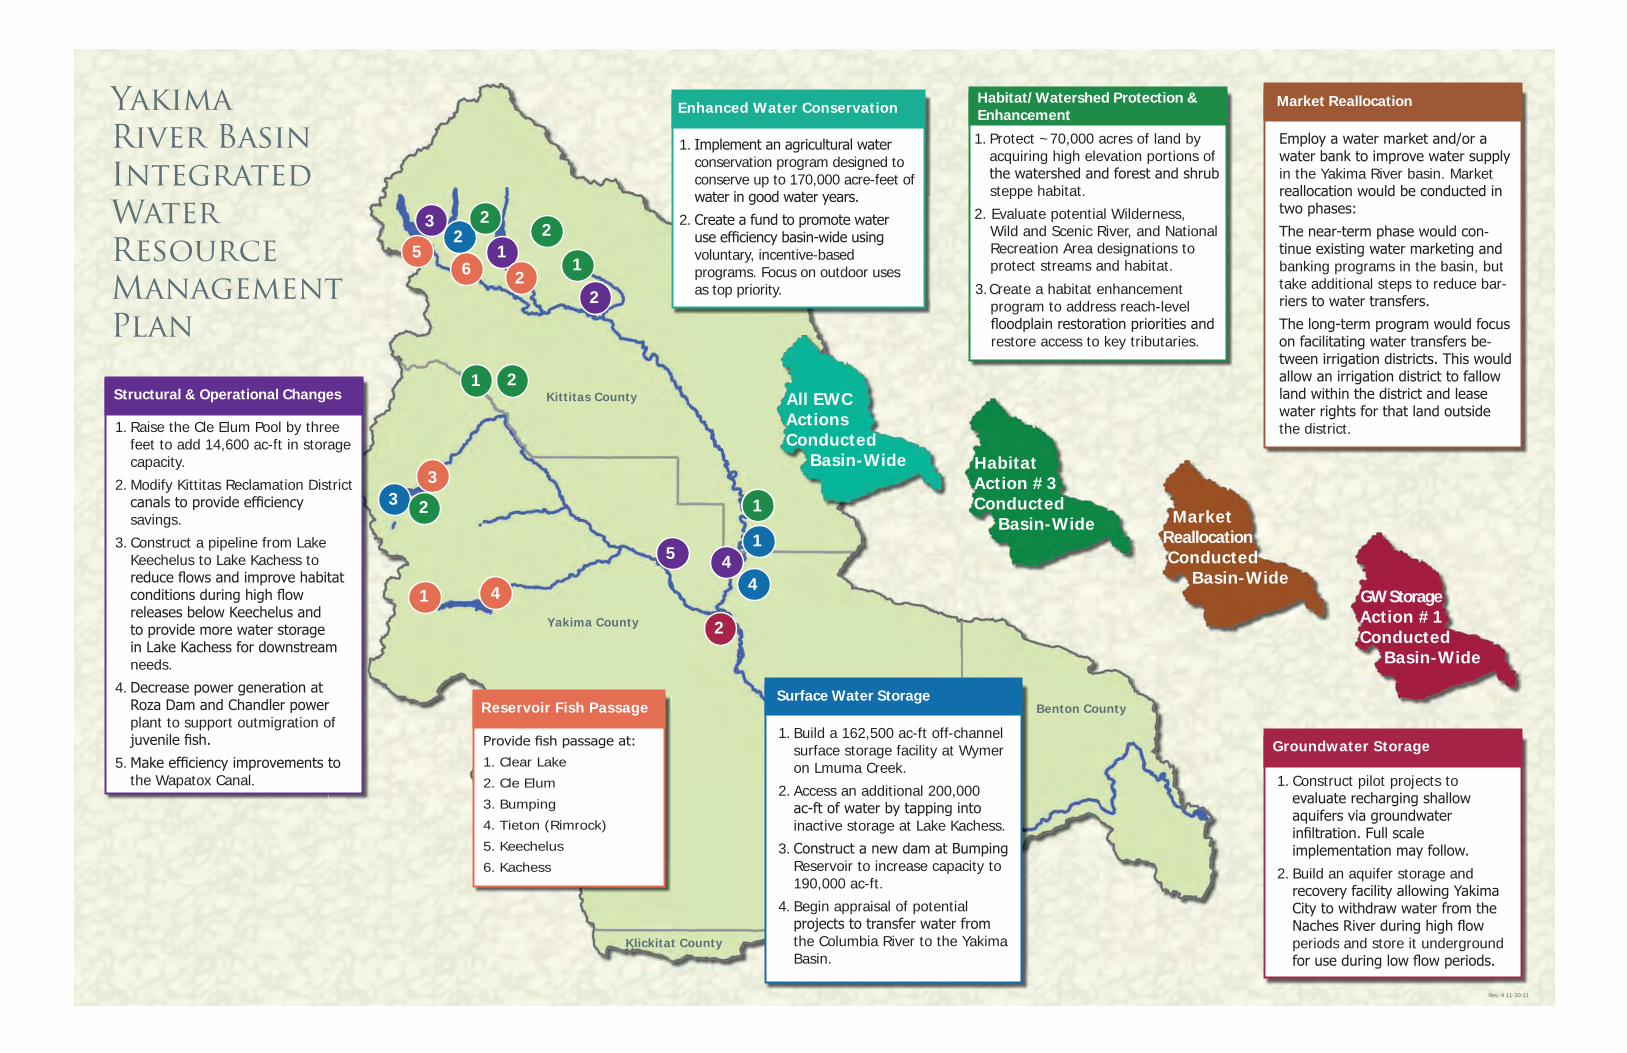
1.5 Elements Included in the Integrated Plan The Integrated Plan includes seven elements: 1) fish passage; 2) structural and operational changes; 3) surface water storage; 4) groundwater storage; 5) habitat protection and
Yakima River Basin Integrated Plan 8 Framework for Implementation Report
enhancement; 6) enhanced water conservation; and 7) market-based reallocation. It addresses water resource and habitat problems that exist today that can be resolved through regional solutions, while providing an adaptive management framework to address potential future changes in water needs or hydrology, including potential climate change effects.
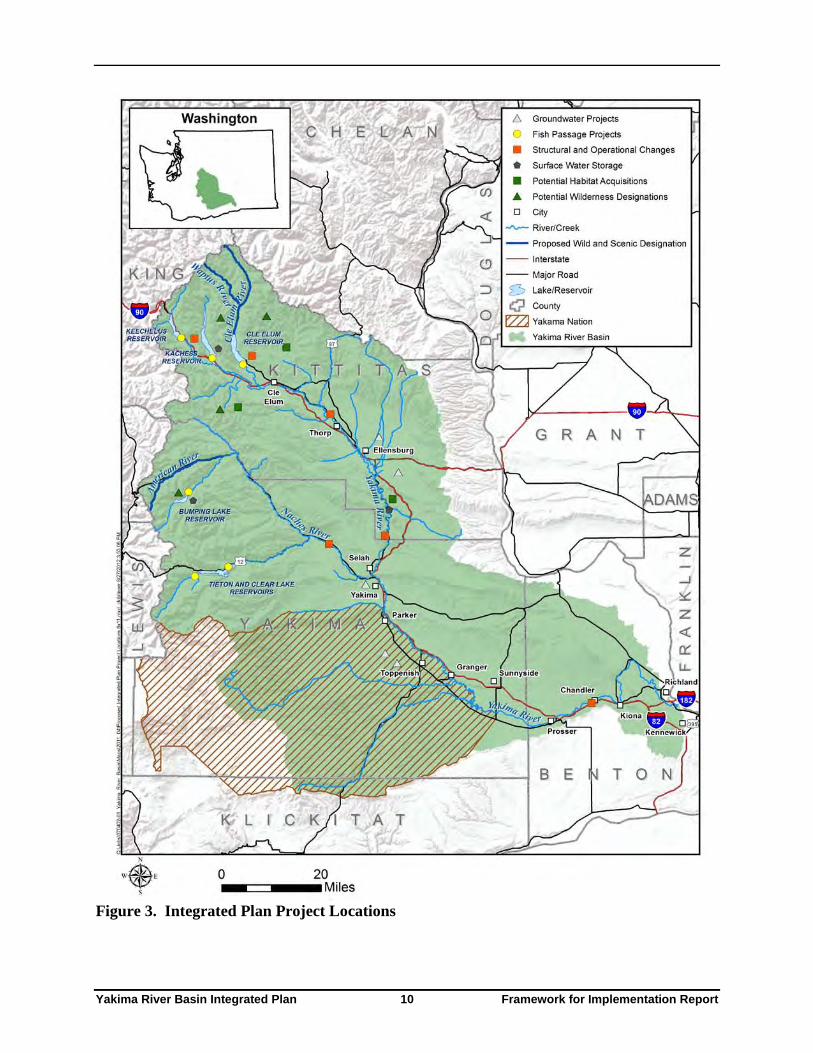
Table 1 displays the proposed actions included in the Integrated Plan. The total cost of all actions in the plan is estimated to be approximately $4.2 billion in 2012 dollars. Proposed actions are listed in Table 1 and would be carried out over a period of 18 years. Figure 3 shows locations of projects that are identified for particular sites in the basin (programmatic actions that are more dispersed geographically are not shown).

Yakima River Basin Integrated Plan 9 Framework for Implementation Report
Table 1. Elements and Associated Actions Included in Integrated Plan ACTION DESCRIPTION
Fish Passage Clear Creek Dam Improve upstream and downstream fish passage at Clear Lake Cle Elum Dam Bumping Lake Reservoir Dam Tieton Dam Keechelus Dam Kachess Dam
Add upstream and downstream fish passage facilities at other dam sites
Structural and Operational Changes Raise Pool at Cle Elum Dam 3-foot increase in storage pool elevation KRD Canal Changes Reduce seepage and enhance tributary flows Keechelus-to-Kachess Conveyance Optimize storage between two reservoirs Subordinate Power at Roza Dam and Chandler Power Plants
Reduce water diversions to support fish migration
Wapatox Canal Improvements Improve efficiency and consolidate diversions Surface Water Storage Wymer Dam New off-channel reservoir (162,500 acre-feet). Also investigate
removal of Roza Dam Lake Kachess Inactive Storage Tap inactive storage volume (up to 200,000 acre-feet) Enlarged Bumping Lake Reservoir Enlarge reservoir to 190,000 acre-feet Columbia River Pump Exchange with Yakima Basin Storage
Conduct feasibility study; and periodically evaluate need for additional supplies
Groundwater Storage Shallow Aquifer Recharge Late winter/early spring infiltration prior to storage control Aquifer Storage and Recovery Off-season recharge of municipal supplies Habitat Protection and Enhancement Mainstem Floodplain Restoration Program to fund a range of fish habitat projects Tributaries Habitat Enhancement Program to fund a range of fish habitat projects Targeted Watershed Protection and Enhancements Program to acquire and protect sensitive lands, including
aquatic and terrestrial habitats Enhanced Water Conservation Agricultural Water Conservation Program to fund a range of projects Municipal Water Conservation Program to fund a range of projects and encourage
conservation by residents Market Reallocation Near-term Effort Reduce barriers to trading Long-term Effort Additional steps to reduce barriers
KRD = Kittitas Reclamation District
Yakima River Basin Integrated Plan 10 Framework for Implementation Report
Figure 3. Integrated Plan Project Locations
Yakima River Basin Integrated Plan 11 Framework for Implementation Report
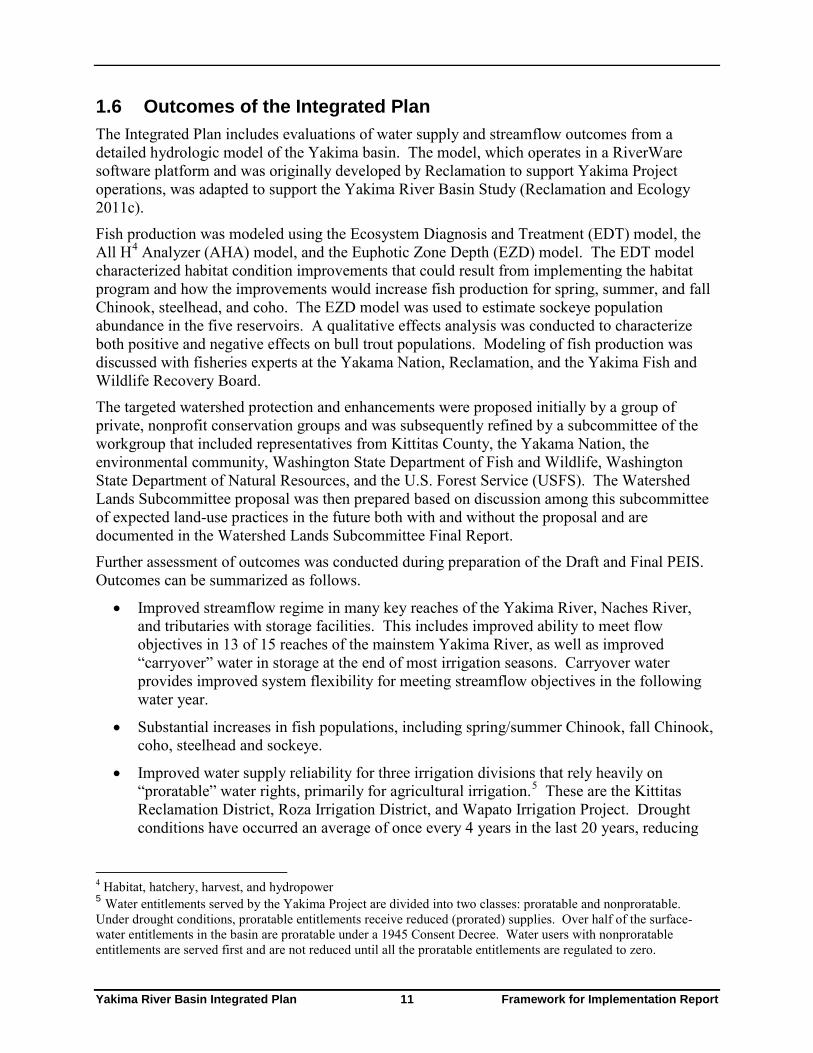
1.6 Outcomes of the Integrated Plan The Integrated Plan includes evaluations of water supply and streamflow outcomes from a detailed hydrologic model of the Yakima basin. The model, which operates in a RiverWare software platform and was originally developed by Reclamation to support Yakima Project operations, was adapted to support the Yakima River Basin Study (Reclamation and Ecology 2011c).
Fish production was modeled using the Ecosystem Diagnosis and Treatment (EDT) model, the All H4 Analyzer (AHA) model, and the Euphotic Zone Depth (EZD) model. The EDT model characterized habitat condition improvements that could result from implementing the habitat program and how the improvements would increase fish production for spring, summer, and fall Chinook, steelhead, and coho. The EZD model was used to estimate sockeye population abundance in the five reservoirs. A qualitative effects analysis was conducted to characterize both positive and negative effects on bull trout populations. Modeling of fish production was discussed with fisheries experts at the Yakama Nation, Reclamation, and the Yakima Fish and Wildlife Recovery Board.
The targeted watershed protection and enhancements were proposed initially by a group of private, nonprofit conservation groups and was subsequently refined by a subcommittee of the workgroup that included representatives from Kittitas County, the Yakama Nation, the environmental community, Washington State Department of Fish and Wildlife, Washington State Department of Natural Resources, and the U.S. Forest Service (USFS). The Watershed Lands Subcommittee proposal was then prepared based on discussion among this subcommittee of expected land-use practices in the future both with and without the proposal and are documented in the Watershed Lands Subcommittee Final Report.
Further assessment of outcomes was conducted during preparation of the Draft and Final PEIS. Outcomes can be summarized as follows.
• Improved streamflow regime in many key reaches of the Yakima River, Naches River, and tributaries with storage facilities. This includes improved ability to meet flow objectives in 13 of 15 reaches of the mainstem Yakima River, as well as improved “carryover” water in storage at the end of most irrigation seasons. Carryover water provides improved system flexibility for meeting streamflow objectives in the following water year.
• Substantial increases in fish populations, including spring/summer Chinook, fall Chinook, coho, steelhead and sockeye.
• Improved water supply reliability for three irrigation divisions that rely heavily on “proratable” water rights, primarily for agricultural irrigation.5 These are the Kittitas Reclamation District, Roza Irrigation District, and Wapato Irrigation Project. Drought conditions have occurred an average of once every 4 years in the last 20 years, reducing
4 Habitat, hatchery, harvest, and hydropower 5 Water entitlements served by the Yakima Project are divided into two classes: proratable and nonproratable. Under drought conditions, proratable entitlements receive reduced (prorated) supplies. Over half of the surface-water entitlements in the basin are proratable under a 1945 Consent Decree. Water users with nonproratable entitlements are served first and are not reduced until all the proratable entitlements are regulated to zero.
Yakima River Basin Integrated Plan 12 Framework for Implementation Report
supplies to as low as 37 percent of entitlements. The plan is expected to increase available supplies to at least 70 percent of water entitlements to these users during dry years.
• Improved water supply for municipal and domestic water users, including improved security for existing users whose water rights are junior to the proratable water users, and new supply of 50,000 acre feet per year to support continued growth and economic development in the Yakima River basin.
• Improved resilience to potential effects of climate change on the basin’s streamflows and water supplies.
The new storage space, operational improvements, and other water management actions provided by the Integrated Plan would be used to meet the plan’s multiple goals. New reservoir storage provided with the Integrated Plan would be managed in conjunction with existing storage to provide flexibility in operations for all reservoirs. New reservoir storage beyond that reserved for drought-year water supplies would be available for other uses such as releases for fisheries benefits as identified by fisheries managers and for municipal and domestic water supply needs, to the extent identified in the Plan. The operational regime is meant to be flexible and adaptive; flows may increase or decrease depending on storage available, water supply forecasts and needs, and instream flow needs in the basin. Adaptive management would also address potential future changes in water needs or hydrology, including potential climate change effects.
1.7 Programmatic Environmental Impact Statement Reclamation and Ecology issued a Draft PEIS on the Integrated Plan in November 2011 (Reclamation and Ecology 2011f). Comments on the Draft PEIS were received and these were addressed in a Final PEIS issued in March 2012 (Reclamation and Ecology 2012d). The USFS and Bonneville Power Administration (BPA) were cooperating agencies for the PEIS. The Final PEIS meets the requirements of both NEPA and SEPA at a programmatic level.
The Final PEIS identifies the purposes of the Integrated Plan as to:
• Implement a comprehensive program of water resource and habitat improvements in response to existing and forecast needs of the Yakima River basin; and
• Develop an adaptive approach for implementing these initiatives and for long-term management of basin water supplies that contributes to the vitality of the regional economy and sustains the health of the riverine environment.
The PEIS examined and compared effects of the Integrated Plan Alternative, the only action alternative, with effects of the No Action Alternative. The Integrated Plan was identified as the Preferred Alternative (Reclamation and Ecology, 2012d).
The proposed action is a plan that contains a large number of interrelated projects and actions intended to operate jointly with each other. A programmatic EIS and planning-level analysis are appropriate at this stage in the decisionmaking process because they enable evaluation of the effects of a broad proposal or planning-level decision that includes any or all of the following:
• A wide range of individual projects;
• Implementation over a long timeframe; and/or
• Implementation across a large geographic area.

Yakima River Basin Integrated Plan 13 Framework for Implementation Report
1.8 Preliminary Schedule for Implementation Figure 4 on the following page shows the preliminary implementation schedule for the actions in the Integrated Plan. Colors are used in the figure to show four stages of activity: 1) authorization; 2) studies; 3) project-level environmental review, permitting, and design; and 4) project construction or program activation. This schedule is subject to revision as project-specific actions are further defined.
The schedule shown here has been used for analyses of economic and financial considerations described in this Framework for Implementation Report. This is relevant, for example, in calculating present values of the stream of costs and benefits and for calculating interest during construction in the cost-allocation procedure. Revisions to the project schedule, if they occur, are not expected to significantly alter the reported outcomes of the economic analyses.
1.9 Periodic Reviews and Adjustments Progress on the Integrated Plan would be reviewed and summarized annually through year 5, and at least every 5 years thereafter, until the plan is deemed fully implemented. Also, an adaptive management plan should be developed in the future to further refine metrics or plan performance measures, triggers, and adaptive management measures for potential plan adjustments through time. The Integrated Plan review should include the following:
• Status of securing funding for implementation.
• Progress in setting up programmatic elements (e.g., market reallocation, water conservation, habitat improvements, and floodplain restoration).
• Progress in constructing identified infrastructure improvements.
• Assessment of outcomes for water supply and fish production, compared with the goals and applicable metrics.
• Effectiveness of revised Yakima Project operating guidelines6 based on identified goals for meeting instream and out-of-stream needs.
• Significant changes, if any, in the underlying drivers for the Integrated Plan such as listing status of aquatic species; major shifts in cropping patterns or irrigation practices; and changes in the basin’s population and economy, climate, snowpack, hydrology, and water needs.
• If plan adjustments are necessary, a clear explanation of the basis and rationale for the recommended adjustments.
6 Yakima Project operating guidelines should be revised as projects are implemented to meet instream and out-of-stream needs identified in the Integrated Plan.

Yakima River Basin Integrated Plan 14 Framework for Implementation Report
1 2 3 4 5 6 7 8 9 10 11 12 13 14 15 16 17 18
Programmatic Actions, Operational Actions and Small Infrastructure ProjectsMarket Reallocation (P)
Agricultural Conservation (P)
Municipal Conservation (P)
Tributaries Habitat Enhancement Program (P)
Mainstem Floodplain Restoration Program (P)
Fish Passage at Clear Lake
Conveyance Improvements at Wapatox
Subordinate Power Diversions, Roza & Chandler1
KRD Main Canal and South Branch Modifications
Raise Pool Level at Cle Elum Dam
Municipal ASR Opportunities
Large Infrastructure Projects
Wymer Reservoir & Conveyance2
Cle Elum Reservoir Fish Passage
Bumping Reservoir Enlargement
Bumping Reservoir Fish Passage3
Kachess Inactive Storage with K-to-K Pipeline4
Fish Passage - Keechelus
Fish Passage - Tieton
Fish Passage - Kachess
GW Infiltration Prior to Storage Control
Projects Requiring Further Development(Implementation and T iming Contingent on Study Results and Future Decision-making)
Update Water Needs Assessment
Periodic Review of Integrated Plan
Potential Columbia R. Storage/Pump 2,5 T T T
Roza Alternate Supply & Dam Removal2 T T T
(P) = Programmatic Actions T = Assessment of triggers for possible implementation.1 Further power subordination subject to approval by Reclamation, BPA, and either Roza or Kennewick Irrigation District, as applicable.
3 T iming of fish passage at Bumping Lake could be advanced to an earlier date if an enlarged reservoir is not authorized.4 I-90 crossing of K-to-K Pipeline may be constructed in conjunction with Wash. Dept. of T ransportation construction project.5 Step 1 in feasibility study of potential future storage/pump exchange projects.
Color Codes:
Implementation Year
Studies
PR / EIS and Authorization (for "trigger" projects, authorize studies)
Project environmental review, permitting & design
Project Construction or Program Activation
2 Roza alternate supply to be considered as part of Wymer Project or storage/pump exchange projects such as Columbia River supply.
Figure 4. Preliminary Implementation Schedule for the Integrated Plan

Yakima River Basin Integrated Plan 15 Framework for Implementation Report
The following principles should be applied if the review described above indicates a need for significant changes to the Integrated Plan:
• Every effort should be made to advance both water supply improvements and fisheries enhancements, consistent with the balanced approach of the Integrated Plan.
• If particular actions encounter insurmountable obstacles to implementation or are found unable to deliver the expected benefits, substitutes for those actions should be developed to achieve comparable outcomes.
• The agencies and organizations represented on the Workgroup would continue to work in good faith throughout the implementation period to secure resources as soon as possible to implement all of the Integrated Plan actions or to identify reasonable substitutes if one or more of the recommended actions cannot be implemented. This collaborative effort would continue until the entire plan has been implemented or further implementation is deemed infeasible based on the review process described above.

Yakima River Basin Integrated Plan 16 Framework for Implementation Report
2.0 Costs of the Integrated Plan Capital costs of the Integrated Plan are estimated to be between $3.2 and $5.4 billion, with a most probable estimate of approximately $4.2 billion in 2012 dollars. These costs include permitting, design, environmental analyses, construction of infrastructure projects, implementation of programmatic activities, and environmental mitigation. Additional costs of approximately $140 million are identified for interest during construction (see Section 4).
Cost estimates were developed in three stages. First, as part of the Yakima Basin Study during development of the Integrated Plan in 2011, the consulting team led by HDR Engineering prepared opinions of probable construction costs (OPCCs), together with estimates of programmatic costs and operations and maintenance costs. Costs from this analysis were documented in Reclamation and Ecology 2011b.
Second, in 2012, staff from Reclamation’s Technical Services Center (TSC) performed a peer review of the design assumptions and cost estimating procedure for six of the infrastructure projects from the Integrated Plan (these included all of the construction projects with costs of $100 million or more. Results from the peer review, plus additional input from Reclamation and consulting team staff were used to perform a cost-risk assessment. The cost-risk assessment analyzed uncertainty and risk factors for each of these six projects and produced updated, probabilistic estimates of their costs. The methods and results are documented in Reclamation and Ecology 2012a.
Finally, a preliminary cost allocation was prepared in 2012. The preliminary cost allocation is documented in Reclamation and Ecology 2012c, and results are also summarized in Section 4 of this Framework for Implementation Report. The Cost Allocation relied on results from the studies listed above, with all costs indexed to first quarter 2012. The Cost Allocation included estimation of replacement costs and interest during construction, which had not been included in the prior analyses.
Revisions to the original 2011 list of projects from the Integrated Plan have been made in the course of refining the costs. First, the Thorp Conveyance System identified as an option to fill Wymer Reservoir was removed from the list of projects, because its cost was deemed too high for the benefits it offered. Second, the cost of land acquisition was not identified in the Integrated Plan, because it is highly uncertain and can be determined only through negotiations with landowners. While this remains true, a preliminary value was needed in order to carry out the cost-allocation procedure, and this preliminary value is now included. Third, estimated costs of environmental mitigation have been developed. Additional adjustments to costs of the Integrated Plan may be identified in the future.
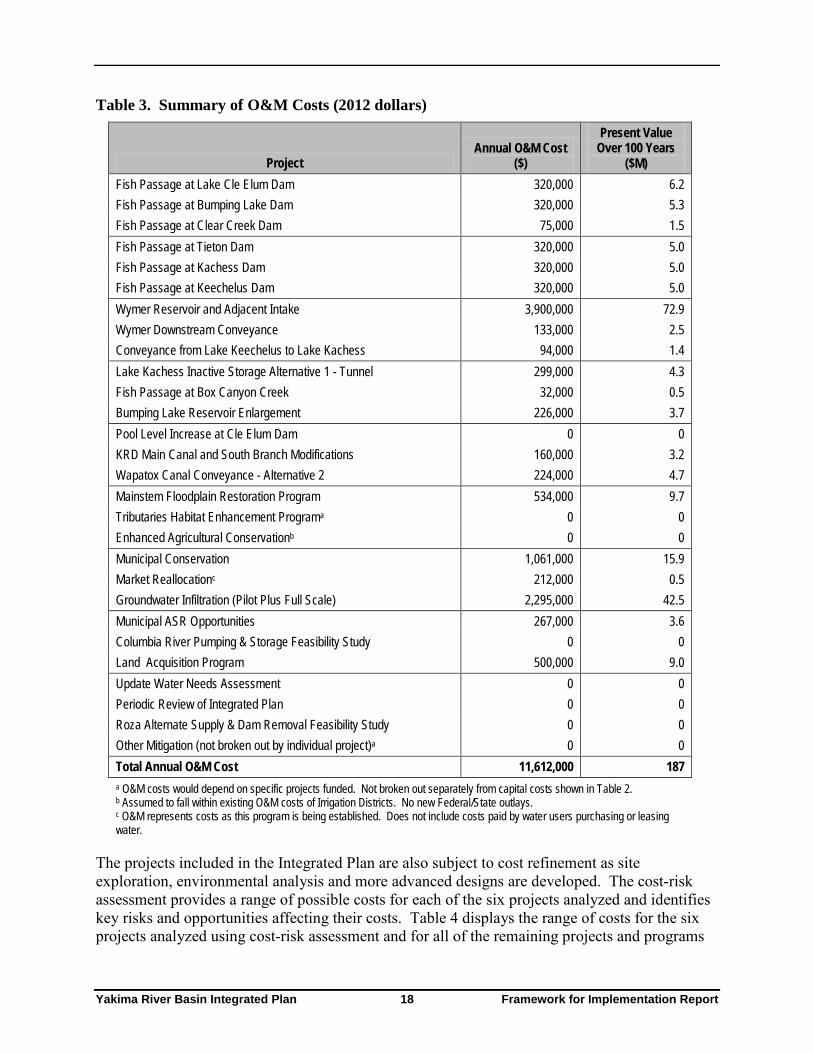
Capital costs of the Integrated Plan are summarized in Table 2. Operations and Maintenance (O&M) costs were estimated in 2011 concurrent with development of OPCCs (Reclamation and Ecology 2011b). These include routine operations, maintenance and minor repairs, and energy costs for pumping. Table 3 shows O&M costs in 2012 dollars. Annual O&M costs are expected to be approximately $11.6 million in 2012 dollars when all the projects are fully operational,
For purposes of the economic analyses and preliminary cost allocation described in Sections 3 and 4, a 100-year breakdown of capital, O&M, and replacement costs was developed. Costs from Tables 2 and 3 (above) were broken out by year, according to the implementation schedule

Yakima River Basin Integrated Plan 17 Framework for Implementation Report
in Figure 4 (above). For purposes of cost allocation (see Section 4), replacement costs for major components of individual projects that are expected to wear out during the life of the project (100 years) were also estimated. In the cost allocation section, replacement costs are grouped with O&M costs in a category called OM&R.
Table 2. Summary of Capital Costs (2012 dollars)
Project Undiscounted Capital
Cost ($M) Present Value ($M) Fish Passage at Lake Cle Elum Dam 87.0 71.5 Fish Passage at Bumping Lake Dam 28.4 20.0 Fish Passage at Clear Creek Dam 3.2 2.6 Fish Passage at Tieton Dam 105.2 71.1 Fish Passage at Kachess Dam 105.2 71.1 Fish Passage at Keechelus Dam 105.2 71.1 Wymer Reservoir and Adjacent Intake 1,138.0 918.1 Wymer Downstream Conveyance 289.0 233.1 Conveyance from Lake Keechelus to Lake Kachess 197.0 125.6 Lake Kachess Inactive Storage Alternative 1 - Tunnel 279.0 177.9 Fish Passage at Box Canyon Creek 1.3 0.8 Bumping Lake Reservoir Enlargement 571.0 409.5 Pool Level Increase at Cle Elum Dam 18.1 15.5 KRD Main Canal and South Branch Modifications 38.3 32.8 Wapatox Canal Conveyance - Alternative 2 87.7 76.4 Mainstem Floodplain Restoration Program 288.3 202.7 Tributaries Habitat Enhancement Program 192.2 135.2 Enhanced Agricultural Conservation 427.1 300.3 Municipal Conservation 0.0 0.0 Market Reallocation 2.1 1.9 Groundwater Infiltration (Pilot Plus Full Scale) 111.5 84.0 Municipal ASR Opportunities 5.3 3.0 Columbia River Pumping & Storage Feasibility Study 4.3 4.0 Land Acquisition Program 100.0 88.9 Update Water Needs Assessment 0.3 1.1 Periodic Review of Integrated Plan 0.2 0.5 Roza Alternate Supply & Dam Removal Feasibility Study 1.1 1.0 Other Mitigation (not broken out by individual project)1 2.5 1.9 Total Construction Cost 4,188.2 3,121.7 1 Mitigation costs are included in the six projects analyzed using cost risk assessment in 2012. This row represents additional mitigation not included in the individual projects.
Yakima River Basin Integrated Plan 18 Framework for Implementation Report
Table 3. Summary of O&M Costs (2012 dollars)
Present Value Annual O&M Cost Over 100 Years
Project ($) ($M) Fish Passage at Lake Cle Elum Dam 320,000 6.2 Fish Passage at Bumping Lake Dam 320,000 5.3 Fish Passage at Clear Creek Dam 75,000 1.5 Fish Passage at Tieton Dam 320,000 5.0 Fish Passage at Kachess Dam 320,000 5.0 Fish Passage at Keechelus Dam 320,000 5.0 Wymer Reservoir and Adjacent Intake 3,900,000 72.9 Wymer Downstream Conveyance 133,000 2.5 Conveyance from Lake Keechelus to Lake Kachess 94,000 1.4 Lake Kachess Inactive Storage Alternative 1 - Tunnel 299,000 4.3 Fish Passage at Box Canyon Creek 32,000 0.5 Bumping Lake Reservoir Enlargement 226,000 3.7 Pool Level Increase at Cle Elum Dam 0 0 KRD Main Canal and South Branch Modifications 160,000 3.2 Wapatox Canal Conveyance - Alternative 2 224,000 4.7 Mainstem Floodplain Restoration Program 534,000 9.7 Tributaries Habitat Enhancement Programa 0 0 Enhanced Agricultural Conservationb 0 0 Municipal Conservation 1,061,000 15.9 Market Reallocationc 212,000 0.5 Groundwater Infiltration (Pilot Plus Full Scale) 2,295,000 42.5 Municipal ASR Opportunities 267,000 3.6 Columbia River Pumping & Storage Feasibility Study 0 0 Land Acquisition Program 500,000 9.0 Update Water Needs Assessment 0 0 Periodic Review of Integrated Plan 0 0 Roza Alternate Supply & Dam Removal Feasibility Study 0 0 Other Mitigation (not broken out by individual project)a 0 0 Total Annual O&M Cost 11,612,000 187 a O&M costs would depend on specific projects funded. Not broken out separately from capital costs shown in Table 2. b Assumed to fall within existing O&M costs of Irrigation Districts. No new Federal/State outlays. c O&M represents costs as this program is being established. Does not include costs paid by water users purchasing or leasing water.
The projects included in the Integrated Plan are also subject to cost refinement as site exploration, environmental analysis and more advanced designs are developed. The cost-risk assessment provides a range of possible costs for each of the six projects analyzed and identifies key risks and opportunities affecting their costs. Table 4 displays the range of costs for the six projects analyzed using cost-risk assessment and for all of the remaining projects and programs

Yakima River Basin Integrated Plan 19 Framework for Implementation Report
contained in the Integrated Plan (Reclamation and Ecology 2012a and 2011b). The outcomes are present in terms of probabilities. At the 50th percentile, there is a 50-percent probability that costs would be lower, and 50-percent probability that costs would be higher. At the 90th
percentile, there is a 90-percent probability that costs would be lower, and 10-percent probability that costs would be higher. At the 10th percentile, there is a 10-percent probability that costs would be lower, and 90-percent probability that costs would be higher.
Table 4. Range of Integrated Plan Costs with Cost Risk Results
Costs ($M)1 10th
Percentile 50th
Percentile 90th
Percentile Projects from Cost Risk Analysis Cle Elum Fish Passage 69 87 110 Bumping Lake Enlargement 467 571 696 K-to-K Conveyance 153 197 250 Kachess Inactive Storage, Alternative 1 (Tunnel) 215 279 351 Wymer Dam 870 1,138 1,443 Wymer Downstream Conveyance 208 289 391 Subtotal 1,982 2,561 3,241 Other Projects and Programs from Integrated Plan2 1,185 1,514 2,147 Total with All Projects 3,167 4,075 5,388 1 All values expressed in first quarter, 2012 dollars. 2 Other projects and programs from Integrated Plan use low, medium and high values,
escalated to 2012 dollars, as rough equivalents to the 10th, 50th and 90th percentiles.
Yakima River Basin Integrated Plan 20 Framework for Implementation Report
3.0 Four-Accounts Analysis This section presents results of the analysis of four “accounts” as required under the Economic and Environmental Principles and Guidelines for Water and Related Land Resources Implementation Studies (U.S. Water Resources Council. 1983) (Principles and Guidelines). The four accounts are described as follows:
• The National Economic Development (NED) account displays changes in the economic value of the national output of goods and services. The Federal objective is to contribute to national economic development consistent with protecting the Nation’s environment. The NED account measures the beneficial and adverse monetary effects of each alternative in terms of changes in the value of the national output of goods and services.
• The Regional Economic Development (RED) account registers changes in the distribution of regional economic activity that result from each alternative plan. Evaluations of regional effects are to be carried out using nationally consistent projections of income, employment, output, and population. This account evaluates the beneficial and adverse impacts of each alternative on the economy of the affected region, with particular emphasis on income and employment measures. The affected region reflects the geographic area where significant impacts are expected to occur. Impacts can be measured in both monetary and nonmonetary terms.
• The Environmental Quality (EQ) account displays nonmonetary effects on significant natural and cultural resources. This account displays the effects on ecological, cultural, and aesthetic attributes of significant natural and cultural resources which cannot be adequately measured in monetary terms within the NED and RED accounts.
• The Other Social Effects (OSE) account registers plan effects from perspectives that are relevant to the planning process, but are not reflected in the other three accounts.
The subsections below present results for each of the four accounts. More detailed documentation is available in Reclamation and Ecology 2012b.
3.1 National Economic Development This section focuses on the NED account, which measures the benefits and costs to the Nation. NED benefits are increases in the total value of the national output of goods and services that can be expressed in monetary units. They include increases in the net value of those goods and services that are marketed, and also of those that may not be marketed. NED costs are the opportunity costs of resources used in implementing the Integrated Plan. In addition to financial costs, opportunity costs can include any decreases in output, or employment losses, if they result from a project.
Before comparisons can be made between costs and benefits, they must be converted to the same dollar year and point in time. Since all the costs and benefits are measured in current dollars, no dollar year adjustment was necessary. However, the costs and benefits would occur at different times. Costs would occur over a period of years as the various projects and programs within the Integrated Plan are implemented. Benefits associated with each project or program would begin
Yakima River Basin Integrated Plan 21 Framework for Implementation Report
at the time each project or program becomes operational. Therefore all the costs and benefits are expressed as present value in year 2012. Future costs and benefits incurred are discounted (reduced) back to 2012 using the Federal 2011-2012 water project planning discount rate of 4.0 percent.
The NED analysis reported here for the Integrated Plan describes three categories of economic benefits: increases in fish populations; improvements in municipal and domestic water supply; and increases in the reliability of irrigation water during severe drought years. The computation of the different categories of benefits involves analytical methods recommended by the Principles & Guidelines.
Fish-Related Benefits: The computation of the value of the fish-related benefits applies the Principles & Guidelines’ preferred indicator for measuring the value of economic benefits: society’s willingness to pay (WTP) for the benefits. The computation employs an analytical approach called benefit transfer. It involves computing the value of the fish-related benefits that would be produced by the Integrated Plan using values determined in a separate study that addressed similar issues in a broader region (the Columbia River Basin) that includes the Yakima River basin.
The study used (Layton, Brown, and Plummer 1999) (LBP Study) estimated households’ average willingness to pay for actions similar to those included in the Integrated Plan to bring about similar increases in salmon populations in the Columbia River Basin (which includes the Yakima River basin). For the NED analysis of the Integrated Plan, the study team transferred the LBP Study results to estimate households’ average willingness to pay for the future increases in salmon/steelhead populations expected to result from the Integrated Plan. Household willingness to pay was then multiplied by the number of households to estimate the total value of the expected increases. The analysis uses two groups of households for the computation: one includes only households in Washington, the other uses households in Washington and Oregon.
Irrigation-Related Benefits: The computation of irrigation-related benefits focuses on the increase in farmers’ net income expected to result from the Integrated Plan. The analysis first determines the expected increase in crop yield for those farmers who would receive additional water supplies during severe drought years in the Yakima River basin. It then multiplies the increase times an estimate of the net farm income per unit of each crop. This calculation provides the net benefits to farmers receiving the additional water. The analysis then considers potential impacts on farmers elsewhere, recognizing that the increase in crop yield by the farmers receiving additional water may decrease the price farmers elsewhere receive for their crop. The final result represents the overall net change in crop value, from a national perspective.
Municipal and Domestic Benefits: The computation of the Integrated Plan’s benefits associated with water for municipal and domestic uses has two components. The first component estimates the market price of the additional water the plan would make available to support anticipated population and economic growth in the basin. It determines the amount of additional water that would be available in future years for municipal and domestic use, if the Integrated Plan were implemented. It then multiplies this amount times an estimate of the wholesale price of water for municipal and domestic use.

Yakima River Basin Integrated Plan 22 Framework for Implementation Report
The second component estimates the willingness of current municipal and domestic groundwater users above Parker Gage7 to pay for increased security in their water supplies. It first measures the amount of senior water rights these users would have to acquire to prevent legal action that would disrupt their consumptive use of groundwater during drought years. It then estimates the groundwater users’ willingness to pay for the senior water rights and subtracts the value of the agricultural production that would be lost when senior rights are transferred from irrigation to municipal and domestic uses. It then multiplies the difference between these two values, which represents the net economic benefit of the transfer of water rights, multiplied by the amount of senior water rights the municipal and domestic users would have to acquire to prevent legal action that would disrupt their consumptive use of groundwater during drought years.
The sum of the values for the two components of the computation provides the total economic benefit of the increased supply of water for municipal and domestic uses.
Unquantified Benefits: The Integrated Plan likely would produce other types of benefits important to national economic well-being. This report does not include them in the NED account, however, because insufficient information currently exists to describe them in the monetary terms required by the Principles & Guidelines. These additional expected benefits include, but are not limited to:
• Unquantified salmon/steelhead benefits.
• Unquantified benefits from increases in the populations of other valuable species.
• Unquantified irrigation-related benefits.
• Unquantified benefits from increases in the net value of recreational opportunities.
• Unquantified benefits from improved resiliency and adaptability of the water system.
• Unquantified climate-change benefits.
3.1.1 Fish Benefits The Integrated Plan would generate economic benefits by increasing future populations of young salmon/steelhead (fish) produced in the Yakima River basin as well as the numbers of adult fish returning to the basin. Increases in fish populations can yield economic benefits in several ways. Economists often distinguish among the categories of value shown in Figure 5. One general category, called “use value,” concerns activities such as commercial and recreational fishing, during which individuals directly interact with and can extract fish from the environment. It also includes values generated indirectly by salmon/steelhead, as when the carcasses of salmon that have spawned and died provide nourishment for other fish and wildlife important to humans.
7 The Parker Gage is located on the Yakima River at Parker (see Figure 1). It is a key control point for flows and water supply.

Yakima River Basin Integrated Plan 23 Framework for Implementation Report
Figure 5. Components of Total Economic Value The other general category, called “passive-use value,” (or sometimes, “nonuse value”) does not require this direct interaction and use. It occurs when people place importance on the continued existence of fish and on ensuring that fish would be available for the enjoyment of others, such as future generations. People can assign a use value or a passive-use value, or both, to a resource to represent their current relationship with the resource. People can also assign a value to maintaining the option of establishing the relationship in the future and this is known as “option value.” When combined, use values and passive-use values (together with their option values) add up to total economic value (Tietenberg 2000).
This section describes the potential fish-related economic benefits of the Integrated Plan.8 It first describes the Integrated Plan’s potential impact on future fish populations, and then estimates the total economic value of the potential increase in fish populations. The basis for the calculation of total economic value is a valuation model derived from survey-based research, which estimates households’ WTP for future increases in fish populations in the Columbia River Basin. The section concludes with an exercise that estimates the size of the use-value portion of the total economic value, applying a methodology used by Reclamation in a prior analysis of water storage projects in the Yakima River basin (Reclamation, 2008).
For more information on the methodology used in calculating benefits, see Reclamation & Ecology 2012b.
The Integrated Plan’s Potential Impact on Future Fish Populations The Integrated Plan would increase future salmon/steelhead populations in the Yakima River basin through the combined effects of diverse actions addressing multiple factors that negatively affect these populations. Improvements in streamflows and habitat would be accomplished through:
• Investments to provide fish passage around all five of the major dams in the Yakima River basin to reduce the impacts of dams on salmon/steelhead.
8 All values in this section are in 2012 dollars. Values from previous years are brought to 2012 dollars using the U.S. Bureau of Labor Statistics’ Consumer Price Index.

Yakima River Basin Integrated Plan 24 Framework for Implementation Report
• Structural and operational changes at existing facilities that would improve streamflow conditions.
• Development of new surface water storage to increase water supplies and improve streamflow.
• Development of groundwater storage that would improve streamflow conditions.
• Targeted watershed protections and enhancements that would improve habitat in forested watersheds.
• Mainstem floodplain and tributary habitat enhancements.
• Promotion of municipal and domestic water conservation and direct investment in agricultural conservation that would improve streamflows.
Current production of salmon and steelhead in the Columbia River Basin is on the order of 2 million fish per year, on average (Fish Passage Center 2011; Oregon Department of Fish and Wildlife 2012). Biological modeling indicates that, when fully implemented, the Integrated Plan would increase the number of adult salmon and steelhead in the Columbia River Basin by about 180,000 to 470,000 fish a year (see Table 5).
This analysis assumes fish populations would increase linearly over a 30-year period and remain stable after that. The actual growth in fish populations may occur faster or slower depending on a number of factors. As explained below, however, the rate of growth does not affect the computation of households’ willingness to pay for the growth, because the method used for the computation depends on the total growth rather than on the annual rate of growth.
It is assumed that each year commercial and recreational fisheries would harvest about 21 percent of the additional adult fish resulting from the Integrated Plan. This harvest rate reflects current compliance with fishery management compacts and regulations established under the Federal Endangered Species Act. After 30 years, the change in fish harvest associated with the Integrated Plan would stabilize at about 38,000–103,000 fish a year (see Table 5). The increase in fish populations would affect several species: spring, summer, and fall Chinook salmon, coho salmon, steelhead, and sockeye salmon. Sockeye salmon represent about 80–94 percent of the overall expected increase in adult fish population, and 77–92 percent of the increase in fish harvest (see Table 5).
Table 5. Expected Increases in Salmon and Steelhead Populations Resulting from the Integrated Plan at Full Implementation
RECRUITMENT HARVEST
Spring/Summer Chinook 6,000–46,700 1,497–12,524 Fall Chinook 1,600–16,150 664–6,342 Coho 1,650–10,700 420–2,786 Steelhead 2,400–18,900 316–2,451 Sockeye 170,000–380,000 35,100–78,500 Total 181,650–472,450 37,997–102,603 Source: Adapted from Hubble, 2012.

Yakima River Basin Integrated Plan 25 Framework for Implementation Report
Total Economic Value of the Integrated Plan’s Potential Impact on Future Fish Populations In 1999, the Washington Department of Ecology commissioned the development and application of a model (LBP Study) for estimating the total economic value of benefits derived from potential future programs to increase fish populations in waterways across the state (Layton, Brown and Plummer 1999). Results from the LBP Study were used to estimate the economic benefits associated with increases in fish populations resulting from the Integrated Plan.
The LBP Study The LBP Study surveyed Washington residents and used the results to develop a model for estimating the total economic value associated with potential future increases in five different fish populations in Washington. This analysis employs the findings for what the LBP Study calls Eastern Washington and Columbia River migratory fish (i.e., salmon and steelhead originating from Eastern Washington and the Columbia River Basin). More information about the survey methodology is presented in Reclamation and Ecology 2012b.
The survey was designed to obtain information from respondents on their WTP for improvements in fish populations, separate from their beliefs about specific factors that have depressed these populations, their preferences for specific beneficial actions relative to others, or for who should pay for different types of actions.
The researchers used survey responses to develop a model of households’ WTP for increases in fish populations. Figure 6 describes the model for salmon/steelhead populations in the Columbia River and Eastern Washington (in 2012 dollars). The model has two components, corresponding to the different baseline scenarios, and each component has two functions. Figure 6 shows the functions and a graph with their corresponding curves. The first row shows the functions for the blue curve, which describes households’ average annual WTP for increases in salmon populations when the baseline fish population remains stable over the next 20 years. The second row shows the functions for the red curve, which describes households’ average annual WTP for increases in salmon populations when the baseline fish population declines over that period.

Yakima River Basin Integrated Plan 26 Framework for Implementation Report
BASELINE FUTURE FISH POPULATION WILLINGNESS TO PAY FUNCTION
Stable over time at 2 million f(X)=12*1.06X*1.377, 0% < X < 5% f(X)=12*-(0.0673/-0.0266)*LN(X*100)*1.377, 5% < X
Declining over 20 years from 2 million to 0.5 million
f(X)=12*2.04X*1.377, 0% < X < 5% f(X)=12*-(0.1003/-0.0207)*LN(X*100)*1.377, 5% < X
Where: f(X)= Annual household WTP in 2012 dollars X=Percent increase in Eastern Washington, Columbia River migratory fish
Source: Adapted from Layton, Brown and Plummer 1999
$0 $50
$100 $150 $200 $250 $300 $350
0% 10% 20% 30% 40% 50%
Annu
al H
ouse
hold
WTP
Increase in Salmon Population
Baseline Population Declines Baseline Population Stable
Figure 6. Annual Household Willingness to Pay for an Increase in the Columbia River and Eastern Washington Salmon/Steelhead Population As the curves show, households are willing to pay more to improve fish populations when baseline fish populations decline than when they remain stable. Furthermore, moving from left to right (from smaller to larger increases in future fish populations), the curves show that households’ average annual WTP increases, but at a decreasing rate. This trend suggests that respondents were willing to pay more, per fish, for small increases in future fish populations than for large increases. This is consistent with expectations from economic theory.
Applying the LBP Study’s Results to the Integrated Plan The process used to apply the LBP Study to the Integrated Plan is known as benefit transfer. Reclamation and Ecology 2012b reviews the applicability of using this process to determine the value of the Integrated Plan’s fish-related benefits. It also examines potential differences between the focus of the LBP Study and the Integrated Plan’s impacts that may affect the applicability of the LBP Study’s results to the total economic value of the Integrated Plan’s impact on fish populations. It concludes that the differences are small and unbiased relative to the overlap between the LBP Study and the Integrated Plan.
The LBP Study is particularly suitable for benefit transfer in this setting. Its applicability stems from the high technical quality of its research design and the close similarity between its scope and focus and the scope and focus of the Integrated Plan. The LBP Study satisfies these criteria, expressed by the Federal Office of Management and Budget (2003), for assessing the applicability of a study used in a benefit-transfer process:

Yakima River Basin Integrated Plan 27 Framework for Implementation Report
• The selected studies should be based on adequate data, sound and defensible empirical methods and techniques.
• The selected studies should document parameter estimates of the valuation function.
• The study context and policy context should have similar populations (e.g., demographic characteristics). The market size (e.g., target population) between the study site and the policy site should be similar.
• The good, and the magnitude of change in that good, should be similar in the study and policy contexts.
• The relevant characteristics of the study and the policy contexts should be similar.
• The distribution of property rights should be similar so that the analysis uses the same welfare measure.
• The availability of substitutes across study and policy contexts should be similar. More information on the applicability of these criteria is presented in Reclamation and Ecology 2012b.
Timing of Increases in Fish Populations In the LBP Study’s survey, respondents were asked how much money they would be willing to pay each month, for the next 20 years, for a program with components similar to those of the Integrated Plan that, after 20 years, would result in the specified increases in fish populations. The survey did not describe the rate at which fish populations would increase. In stating their WTP, respondents defined acceptable levels for 20 years of monthly payments associated with the specified increase in fish population after 20 years, regardless of how quickly or slowly populations would increase.
The biological modeling underlying the Integrated Plan indicates that salmon/steelhead populations would increase linearly over a 30-year period beginning in the year when the first habitat improvements are completed. After 30 years, populations are expected to stabilize (Hubble 2012). Year-to-year growth could vary from the linear path, but the modeling anticipates the long-term variation over 20 to 40 years would be small. To apply the model developed in the LBP Study, this analysis divides the Integrated Plan’s impact on fish populations into two groups: one describing the increase in fish populations that occurs over the first 20 years, the other describing the increase in fish populations that occurs in the following 20 years. These assumptions ensure the analysis closely follows the assumptions and structure of the LBP Study’s model.
Baseline Fish Populations, without the Integrated Plan As previously described, the LBP Study estimated households’ WTP for increases in salmon/steelhead populations within the context of three fish population estimates shown to survey respondents. These estimates included a historical population of 8 million; a current population of 2 million; and two different “baseline” scenarios without a program to increase the population. In one baseline scenario, the population would remain stable; in the other baseline scenario, the population would decline to 0.5 million. This analysis incorporates the assumptions underlying the stable-population baseline.
Yakima River Basin Integrated Plan 28 Framework for Implementation Report
Historical fish populations correspond to those represented in the LBP Study: the Columbia River Basin and Eastern Washington produced about 8 million adult salmon/steelhead per year (National Marine Fisheries Service 2011; Northwest Power and Conservation Council, 2000). The current salmon/steelhead population in this region is about 2 million: fish counts at Bonneville Dam and on the Willamette River have fluctuated between 1.0 and 2.0 million since 2000, and these counts do not incorporate fish that return to the Lower Columbia River after maturing in the ocean, but do not pass the counting stations (Fish Passage Center 2011; Oregon Department of Fish and Wildlife 2012).
Households and their Preferences To estimate the total economic value of increases in fish populations, the LBP Study modeled the average WTP per household in Washington, and then multiplied this average by 2 million, the estimated number of households in Washington in 1999. Applying the results to determine the fish-related NED benefits of the Integrated Plan requires accounting for any identifiable change in households’ preferences and WTP for future increases in fish populations and for changes in the number of households since 1999.
Households’ average willingness to pay may fluctuate, from year to year, representing changes in economic conditions (Montgomery and Helvoigt 2006) and other factors. Over the 40-year period of analysis, however, households’ WTP for increases in salmon/steelhead populations in Eastern Washington and the Columbia River Basin likely would increase—barring unexpected events, such as a major restructuring of the region’s economy—in response to potential increases in average household incomes (Horowitz and McConnell, 2000), increased WTP for fish-related recreation (Rosenberger and Loomis, 2001), or other factors.
The U.S. Census shows that the number of households in Washington increased from the 2 million used in the LBP Study to 2,620,076 in 2010 (U.S. Census Bureau, 2010). Projections of the state’s population indicate the number of households would continue to increase. Projections show a 1.4 percent increase in Washington’s population from 2010 to 2012 (the beginning of the first 20-year period) and a 23.3 percent increase from 2010 to 2032 (the beginning of the second 20-year period) (Office of Financial Management, 2011).
The NED value of the expected increases in salmon/steelhead populations resulting from the Integrated Plan depends on the importance that all U.S. households place on conserving this resource. Applying the results from the LBP Study to just Washington households likely underestimates the actual value, from a national perspective, since this overlooks the value to households in other states.
Households in Oregon likely have a WTP similar to that of Washington households, given that the two states share the Columbia River Basin, and also share similarities in the importance of salmon and steelhead to their respective cultures and economies9 (The discussion, below, of factors that may affect the accuracy of the estimates considers the possibility that Oregon households are less willing than Washington households to pay for increases in fish populations.) Adding Oregon households to the analysis increases the total number of 2012 households by about 60 percent. If Washingtonians and Oregonians share the same WTP for increased fish populations in the Columbia River Basin and Eastern Washington, incorporating Oregon
9 See, for example, Bell et al., 2003; DHM Research and Earthfix, 2011

Yakima River Basin Integrated Plan 29 Framework for Implementation Report
households into the computation would increase the total economic value of the Integrated Plan’s impact on fish populations by the same percentage, all else equal. Accounting for the value households in Washington and Oregon would realize from the increases in fish populations expected from the Integrated Plan does not account for the value households in other states would realize, however, and, hence, it still underestimates the total value from a national perspective.
The Total Economic Value of Increases in Fish Populations Resulting from the Integrated Plan The Integrated Plan would increase the number of adult salmon and steelhead produced by the Columbia River Basin and Eastern Washington over time, with the maximum increase of about 182,000 to 472,000 fish per year achieved at year 30 and continuing for the remainder of the 100-year period of analysis. This range in the number of fish yields two estimates of the Integrated Plan’s fish-related benefits: the bottom of the range yields the “low-end” estimate, and the top yields the “high-end” estimate.
Figure 7 shows the average annual willingness to pay, per household, associated with the low-end and high-end percentage increases in fish populations, relative to the stable-population baseline (2 million fish), that households in Year 1 and Year 20 would expect from the Integrated Plan. The line in the figure is the same as the blue line in Figure 6, representing the LBP Study’s estimate of the households’ average annual WTP for increases in fish populations if the baseline (no action) scenario predicts stable fish populations into the future. The green dots represent households’ average annual willingness to pay for the low-end estimate of increases in fish population that would result from the Integrated Plan. The orange dots represent the WTP for the high-end potential increases. The small dots represent the benefits that would materialize initially, and reflect the willingness of current households to pay for the expected increase in salmon/steelhead populations expected 20 years later. The large dots represent the Integrated Plan’s total fish-related benefits, and reflect the amounts represented by the small dots plus the willingness of Year 21 households to pay for the increase expected in the 2nd 20-year period. The text boxes in the figure show the calculation of households’ average annual WTP for the additional increase in fish populations expected in the second period.

Yakima River Basin Integrated Plan 30 Framework for Implementation Report
Source: Adapted from Layton et al., 1999; Hubble, 2012
Figure 7. Average Annual Household WTP for the Integrated Plan’s Potential Impact on Fish Populations Table 6 summarizes the results shown in Figure 7. For each period, it shows households’ average annual WTP, throughout the period, for the fish-population increase expected at the end of the period. All monetary amounts are given in 2012 dollars.
Table 6 also shows the present value, equivalent to the 20-year stream of payments for each period, using a discount rate of 4.0 percent per year, the rate applicable to NED calculations in 2012.10 Thus, the present value of households’ average willingness initially to pay $73 per year for 20 years for a program that would yield the low-end increase in fish populations at year 20 is $1,030. The present value of households’ average willingness at year 21 to pay $19 per year for 20 years for an additional program that would build on the success of the first program and yield the low-end increase in fish populations expected at year 40 is $120. The corresponding numbers for the high-end increase are $1,600 for the first period, and $120 for the second period.
Table 6. Average WTP per Household for Low- and High-End Expected Increases in Fish Population Resulting from the Integrated Plan: Annual and Present Value
10 This is the discount rate applicable to NED analysis of water-resource projects in 2012 retrieved from: 76 Federal Register 73674 (November 29, 2011).

Yakima River Basin Integrated Plan 31 Framework for Implementation Report
20-YEAR ANALYSIS
PERIOD
YEAR BENEFITS
ARE REALIZED
AVERAGE HOUSEHOLD WTP FOR LOW- AND HIGH-END INCREASES IN FISH POPULATIONS
ANNUAL PRESENT VALUE
Low-end Increase High-end Increase Low-end Increase
High-end Increase
First 20-Year Period Initial Year $73 $113 $1,030 $1,600
Second 20-Year Period Year 21 $19 $19 $120 $120
The total present value of the increase in fish populations expected from the Integrated Plan equals the average present value per household for each period, times the number of households at the beginning of the period. Table 7 shows the computations for two alternatives. One alternative considers the value of the expected increases in fish populations to households in Washington State only. The other alternative considers the value of the expected increases in fish populations to households in both Washington and Oregon, and assumes that both exhibit the same average WTP for increases in fish populations derived from the LBP Study.
Table 7. Present Value of the Integrated Plan’s Fish-Related Benefits
REGION YEAR
BENEFITS ARE
REALIZED
PRESENT VALUE PER HOUSEHOLD NUMBER OF
HOUSEHOLDS (MILLIONS)
TOTAL PRESENT VALUE (BILLIONS)
Low-end Increase
High-end Increase
Low-end Increase
High-end Increase
Washington Only Initial Year $1,030 $1,600 2.66 $2.8 $4.3
Year 21 $120 $120 3.23 $0.4 $0.4 Total - - - - N/A $3.1 $4.6
Washington and Oregon
Initial Year $1,030 $1,600 4.21 $4.4 $6.7 Year 21 $120 $120 5.20 $0.6 $0.6
Total - - - - N/A $5.0 $7.4 Rounding may cause a total to differ from the sum of its elements.
For Washington households only, the overall present value of the increases in fish populations expected from the Integrated Plan is $3.1 billion for the low-end of the expected increase and $4.6 billion for the high-end. Considering the combined households of Washington and Oregon, the total economic value of the fish-related benefits of the Integrated Plan is $5.0 billion for the low-end increase and $7.4 billion for the high-end.
Factors Affecting the Accuracy of the Estimated Fish-Related Benefits The values reported in Table 7 likely underestimate the total fish-related NED benefits of the Integrated Plan for three reasons:
• The values in Table 6 and Table 7 show the value households in Washington and Oregon would realize from the expected increases in fish populations. They do not, however, include the value that households in the rest of the Nation would realize.
• The values in Table 6 and Table 7 reflect an assumption that salmon/steelhead populations in the Columbia River Basin would remain stable into the future without the Integrated Plan. However research suggests that these fish populations likely would
Yakima River Basin Integrated Plan 32 Framework for Implementation Report
decline in the future due to several factors, such as climate change and increases in human populations. All else equal, the potential for future declines in the baseline fish populations would tend to raise NED benefits to levels higher than shown in Table 7.
• The values in Table 6 and Table 7 assume benefits are realized only at the beginning of each 20-year period, to reflect households’ expectation of increases in fish populations at the end of each period. In reality, however, some households likely would derive additional benefits throughout each of the two 20-year analysis periods. Moreover households likely would continue deriving benefits after 40 years, although the discounting process would reduce its present value considerably.
Other factors, though, create uncertainty about the accuracy of the estimated value of the Integrated Plan’s fish-related benefits, and some could cause overestimation of the total fish-related NED benefits of the Integrated Plan. These include factors arising from the design of the LBP Study itself; uncertainties associated with benefit-transfer approaches to economic analysis, and declines in median household income, in constant dollars, since the LBP Study was performed. For further discussion of these uncertainties, see Reclamation and Ecology 2012b. While these factors must be considered in evaluating applicability of the LBP Study to estimating NED for the Integrated Plan, the overall conclusion is that the study yields robust results for this purpose.
Comparison with Results from Other Studies The results shown in Table 7 are consistent with the findings of related research on the value of potential increases in salmon/steelhead populations in the Pacific Northwest. Table 8 summarizes the results from three studies of the economic value associated with increases in salmon populations in this region.
Table 8. Comparative Findings on Household Willingness to Pay for Increased Salmon Populations
SOURCE OLSEN ET AL. 1991 LOOMIS 1996 BELL ET AL. 2003 NED ANALYSIS OF INTEGRATED PLAN
Geography Columbia River Elwha River Coastal OR and WA Columbia River Change in Fish Population 2,500,000 300,000 165,000 115,045–299,218*
66,605–173,232** Average Annual Household WTP (2012 dollars)
$100 $100 $120 $73–$113* $19**
Source: Olsen et al., 1991; Loomis, 1996; Bell et al., 2003 * Increase in fish population from 2012-2031 and average annual WTP in 2012 for that increase. ** Increase in fish population from 2032-2051 above the increase in the prior 20 years, and average annual WTP in 2032 for that additional increase.
The Use-Value Component of the Integrated Plan’s Fish-Related Benefits Reclamation and Ecology 2012b also employs a separate analytical method to estimate the use-value component of the Integrated Plan’s fish-related benefits that were computed in the previous section. The intent is not to estimate additional fish-related values. Instead, this effort
Yakima River Basin Integrated Plan 33 Framework for Implementation Report
aims to isolate the portion of the total value, estimated above, that would be captured by activities that entail direct use of the potential increase in fish populations resulting from the Integrated Plan. Specifically in this analysis, use value is the value associated with harvesting adult fish produced as a result of the Integrated Plan. The harvesting might occur in several ways: commercial, sport, subsistence, and Tribal ceremonial.
To estimate the total use value associated with the Integrated Plan’s impact on fish populations, annual species- and fishery-specific harvests are multiplied by the relevant use values. These annual use values accumulate over time. The present value of the future stream of values reflects a discount rate of 4.0 percent per year.11 Figure 8 shows the annual use values of the Integrated Plan’s fish-related benefits over a 100-year period. The solid lines represent undiscounted annual values in 2012 dollars. The dashed lines represent discounted annual values. Orange lines represent high-end potential increases in fish populations and green lines represent low-end potential increases in fish populations. As shown at the bottom of Figure 8, the present value of use values attributable to the Integrated Plan’s impact on fish populations for the 100-year period is about $0.1–$0.3 billion. As noted previously, this is a component of the total fish-related benefits, rather than an additional benefit.
Overall Present Value (discounted) $0.1–$0.3 billion
$0.0
$4.0
$8.0
$12.0
$16.0
$20.0
$24.0
1 10 19 28 37 46 55 64 73 82 91 100
Annu
al U
se V
alue
(m
illio
ns)
Year
Low High Discounted Low Discounted High
Figure 8. Annual Use Values Derived from the Implemented Plan’s Potential Impact on Fish Populations For further information on the data and analysis used to estimate use value, see Reclamation and Ecology 2012b.
3.1.2 Irrigation Benefits If implemented, the Integrated Plan would generate two types of irrigation-related benefits that are considered in this analysis: (1) it would stimulate market-based reallocation of water between irrigators, resulting in more transfers than otherwise would occur, and moving water from production of lower-valued crops to higher-valued crops; and (2) it would increase the supply of water available to irrigators during a severe drought. This section first describes the setting and 11 This is the discount rate applicable to NED analysis of water-resource projects in 2012 retrieved from: 76 Federal Register 73674 (November 29, 2011).

Yakima River Basin Integrated Plan 34 Framework for Implementation Report
outlines the analytical approach, assumptions, and scenarios applied in the analysis. Then it describes the anticipated annual net farm earnings under two scenarios, with and without the Integrated Plan, and projects those benefits over the next 100 years. The section concludes with a discussion of the Integrated Plan’s potential effects on the broader market for agricultural products during severe droughts.
The results of this analysis show that, once fully implemented, the Integrated Plan could increase annual net farm earnings during a severe drought year to very near the values expected during an average nondrought year without the Integrated Plan. Over the next 100 years, the overall present value of the Integrated Plan’s irrigation-related benefits, discounted at 4.0 percent (the Federal 2011-2012 water project planning rate), is about $0.8 billion (in 2012 dollars). Setting Irrigated agriculture is the largest user of water in the Yakima River basin. Most of the water used for irrigation is provided by the Yakima Irrigation Project (Yakima Project), which is operated by Reclamation. The Yakima Project provides water to six irrigation districts or divisions: Kittitas, Roza, Tieton, Wapato, Sunnyside, and Kennewick. The first five in this list would be most directly affected by the Integrated Plan. They have 81 percent (1,938,300 acre-feet) of the total entitlements (2,406,917 acre-feet) to water in the Yakima, Tieton and Naches Rivers above the Parker Gage on the Yakima River (Reclamation and Ecology, 2011a).
The amount of land that can be irrigated in the Yakima River basin is limited. Federal law constrains the amount of land served by the Yakima Project, and the available water supply limits the amount of land that can be irrigated outside the Yakima Project. The Yakima Project currently supports irrigation for 464,000 acres (Reclamation and Ecology, 2011d). Because of the constraints on irrigated acreage, the Integrated Plan assumes acreage available for irrigated agriculture in the basin will not expand in the future, and it aims to improve reliability of irrigation supplies, but not to bring about expansion of irrigated acreage.
The reliability of water supplies for irrigators served by the Yakima Project differs considerably for two groups of irrigators. Water rights associated with the Yakima Project fall into two classes: nonproratable and proratable. Nonproratable water rights are more senior and have priority dates prior to May 10, 1905. These rights are served first from the Total Water Supply Available (TWSA), which Reclamation defines each year based on reservoir storage, runoff forecast, and return flow estimates. Proratable water rights, however, have a priority date of May 10, 1905. When the TWSA cannot fully serve both groups, it goes first to satisfy the nonproratable water rights insofar as possible, with any remainder shared by the proratable water rights. In each of the droughts occurring in recent decades, Reclamation has been able to fully supply nonproratable water rights, but proratable water rights have received reduced (prorated) supplies, as low as 37 percent of normal supply. The Integrated Plan aims to improve the reliability of supplies for irrigation users with proratable water rights.
As noted above, the primary concern about water-supply reliability involves the five irrigation districts above the Parker gage.12 To facilitate the presentation, the following discussion refers to each of these entities as a district. The concern narrows further, to Roza, Kittitas, and Wapato districts, insofar as Sunnyside and Tieton have stated they do not need additional water during
12 The analysis does not include Kennewick Irrigation District because it typically does not experience reduced water availability during a severe drought that affects other districts.
Yakima River Basin Integrated Plan 35 Framework for Implementation Report
drought periods even though they have proratable entitlements (Reclamation and Ecology, 2011e). Table 9 compares the proratable water rights for the three districts with the rest of the Yakima Project entitlements above the Parker gage. Kittitas, Roza, and Wapato districts (divisions) hold 82 percent of the total proratable water rights above the Parker gage. They hold 96 percent of the proratable water rights above the Parker gage, exclusive of Sunnyside and Tieton districts.
Table 9. Proratable Water Rights above Parker Gage
IRRIGATION DISTRICTS PRORATABLE ENTITLEMENTS (ACRE-FEET)
% OF TOTAL PRORATABLE ENTITLEMENTS Total Not Including Sunnyside and Tieton
Roza 393,000 30% 35% Wapato 350,000 27% 31% Kittitas 336,000 26% 30%
Subtotal 1,079,000 82% 96% Sunnyside 157,776 12% 0 Tieton 30,425 2% 0
Subtotal 1,267,201 97% 96% Non-Division Entitlements 42,874 3% 4%
Total 1,310,075 100% 100% Source: Adapted from Reclamation and Ecology, 2011e.
Analytical Approach To estimate the irrigation-related economic benefits of the Integrated Plan, this analysis describes its potential impacts on net farm earnings, consistent with the Principles & Guidelines. As described in the Principles & Guidelines, the Integrated Plan’s potential impacts on net farm earnings represents damage reduction benefits in the form of increased agricultural production due to a more reliable water supply. The analysis first computes the direct increase in net farm earnings for irrigators in the Yakima Project who would enjoy greater reliability of water supplies because of the Integrated Plan. It then considers the potential for indirect impacts on the net farm earnings of other crop producers who might see lower prices for their crops because of the higher production of the direct beneficiaries.
The analysis has these four components (additional details are available in Reclamation and Ecology 2012b):
1. Scenarios that support comparison of net farm earnings with vs. without the Integrated Plan.
2. A spreadsheet model that estimates each district’s net farm earnings by simulating irrigated acreage and net farm earnings, by crop, by district, for a specified level of water availability and a given extent of market reallocation of water from lower- to higher-value crops.
3. Current data on crops, crop-irrigation requirements, crop prices, and variable crop-production costs.
4. Estimates of the elasticity of price with respect to level of production, by crop.
The following discussion presents information on the scenarios and spreadsheet model.

Yakima River Basin Integrated Plan 36 Framework for Implementation Report
Scenarios The analysis incorporates the two scenarios summarized in Table 10. The top section shows the Baseline Scenario, without the Integrated Plan. In a non-drought year all irrigators in the five districts would have enough water to satisfy their irrigation requirements. During a severe drought year, water supplies would satisfy the entitlements of non-proratable irrigators, but proratable irrigators would receive less than their full entitlement. Recent severe droughts have seen proratable irrigators receive as little as 37 percent of their full entitlement. With expectations that future droughts may be exacerbated by changes in climate, this analysis assumes future severe droughts would see proratable irrigators receiving only 30 percent of their full entitlements. To lessen the impacts of the severe drought, the Baseline Scenario assumes that irrigators would lease 30,000 acre-feet of water to other irrigators, with the water shifting from lower-value to higher-value crops.
Table 10. Scenarios Used in the Analysis of Irrigation-Related Benefits
BASELINE SCENARIO (WITHOUT THE INTEGRATED PLAN)
• During non-drought years, TWSA is sufficient to satisfy the full entitlement for all non-proratable and proratable irrigators in the Yakima Project.
• Consistent with historical experience, severe, 1-year drought occurs every 5 years. A severe, 3-year drought occurs every 20 years.
• During a severe drought year: o TWSA is sufficient to satisfy all non-proratable irrigators in the Yakima Project, but proratable irrigators receive only
30 percent of their full entitlement. o Inter-district leasing of water would reallocate about 30,000 acre-feet of water among Kittitas, Roza, and Sunnyside
Districts. Additionally, intra-district trading would occur in all five districts.
INTEGRATED PLAN SCENARIO
•
• •
During non-drought years, TWSA is sufficient to satisfy the full entitlement for all non-proratable and proratable irrigators in the Yakima Project. Frequency and duration of severe droughts are the same as in the Baseline Scenario. During a severe drought year: o All irrigators in the five districts would be willing to sell or buy water for short-term lease when the water supply
available to them falls below crop-irrigation requirements of the crops they are producing. o Irrigators experiencing reduced supplies would use water to satisfy crop-irrigation requirements of their higher-
valued crops as much as possible, leaving other acreage fallow, and would receive no net farm earnings from fallowed land.
o Because of their topographical and infrastructure characteristics, Tieton and Wapato Districts would conduct only intra-district trading within each district; Kittitas, Roza, and Sunnyside Districts would conduct both intra- and inter-district trading. Buyers would lease water only for crops with annual net farm earnings of at least $150 per acre-foot. Irrigators in Roza, Kittitas, and Sunnyside Districts would lease no more than 10 percent of each district’s water supply to irrigators in another district.
o The Integrated Plan increases the supply of water beginning in 2018, with the amount ramping-up, as the various storage projects come on line under the schedule in the proposed Integrated Plan until 2026, when the Yakima Project delivers 70 percent of proratable entitlements during a severe drought year.
o The Integrated Plan would yield no irrigation-related benefits until 2013. Potential benefits from market-based reallocation of water would ramp up, beginning in 2013, rising to one-half of the full potential in 2017 and remain constant thereafter. This represents an assumption that it will take approximately 5 years to bring market reallocation practices to full implementation, and that achievement of the market reallocation potential as modeled may not be fully achievable.
The bottom section of Table 10 describes conditions with implementation of the Integrated Plan. This scenario entails staged implementation of different components of the Integrated Plan,

Yakima River Basin Integrated Plan 37 Framework for Implementation Report
involving increased market-based reallocation of water from lower- to higher-value crops during severe drought years, as well as increased water supplies, so the amount of water available to proratable irrigators during severe drought years rises from 30 percent to 70 percent of their full entitlements.
Spreadsheet Model of Direct Irrigation Benefits A spreadsheet model was developed to estimate each district’s net farm earnings, with and without the Integrated Plan, under non-drought and severe drought conditions. The model identifies the allocation of available water across crops and districts that, given identified constraints, would maximize annual net farm earnings under optimal market conditions. The model structure is adapted from a model developed by researchers at the Pacific Northwest National Laboratory, who used it to describe opportunities for market-based transfers to mitigate the impacts of drought on agricultural production in the Yakima River basin and to increase the overall value of agricultural earnings derived from the basin’s water resources (Scott et al., 2004; Vano et al., 2009).
Crops. The model assumes irrigators in the five districts grow these 17 different crops (in some cases, types of crops) and that irrigators do not change what crops they grow over time.
• Other vegetables • Wine grapes • Apples
• Other grain • Hops • Potatoes
• Concord grapes • Miscellaneous • Other tree crops
• Sweet corn • Asparagus • Mint
• Other hay • Timothy hay • Wheat
• Alfalfa hay • Pasture The model assumes crops have different water needs, depending on the district in which they're grown and reflecting past water demand and irrigation technology. During an average, non-drought year, the model assumes all irrigators have sufficient water to satisfy their irrigation requirements. During drought years, when water supplies are restricted, the model assumes water is traded from crops with low annual net farm earnings to crops with high annual net farm earnings (within the constraints of the given scenario).
Fixed Variables. The model relies primarily on annual net farm earnings (in terms of dollars per acre-foot) to distribute water from low-value crops to high-value crops. The model also directly or indirectly uses several other fixed variables, by crop, including:
• Total irrigable acres • Average price (dollars/output unit) • Average yield (output units/acre) • Water diversion demand (acre-
feet/acre) • Annual variable cost (dollars/acre) Consistent with the Principles & Guidelines, whenever possible this analysis uses normalized crop prices issued by the U.S. Department of Agriculture for all relevant crops (U.S. Department of Agriculture, National Agricultural Statistics Service, 2011a). For some crops, however, the U.S. Department of Agriculture does not provide normalized crop prices. In those instances, this analysis uses statewide average prices over the previous 3 years (U.S. Department of

Yakima River Basin Integrated Plan 38 Framework for Implementation Report
Agriculture, National Agricultural Statistics Service. 2011b). Annual variable costs were compiled from crop-specific enterprise budgets (Washington State University Extension, Various Years) and from Reclamation (2008). In all cases, crop prices and variable costs were adjusted to 2012 dollars using the commodity-specific producer price index from the U.S. Bureau of Labor Statistics (U.S. Bureau of Labor Statistics, 2012).
Direct Irrigation-Related Benefits This section describes the effects of the Integrated Plan on the net farm earnings of irrigators in the five districts. It first describes what the effects would be during a severe drought year if the Integrated Plan were fully implemented. It then describes the expected effects over the next 100 years, as different elements of the Integrated Plan become operational and severe drought years occur at a rate similar to recent experience. It concludes with a sensitivity analysis describing the irrigation-related benefits, over the next 100 years, assuming higher and lower restrictions during severe droughts, accounting for the potential impact of climate change.
Benefits of the Integrated Plan During a Severe Drought Year The first two rows in Table 11 summarize net farm earnings in the five districts under the Baseline Scenario during drought and non-drought years. During an average non-drought year, all irrigators would receive water equal to their full entitlement and net farm earnings would total $480 million. During a severe drought year, non-proratable irrigators would receive water equal to their full entitlement, but proratable irrigators would receive water equal to 30 percent of their entitlement, market-based reallocation of water would result in inter-district trading of 30,000 acre feet, and net farm earnings would fall $160 million, to $320 million. With full implementation, the Integrated Plan would generate direct economic benefits by eliminating these losses. Under the Integrated Plan, non-proratable irrigators would receive water equal to their full entitlement during a severe drought year; proratable irrigators would receive water equal to 70 percent of their entitlement, which would be sufficient for them to sustain output; market-based reallocation of water (beyond what would occur in the Baseline Scenario) would involve inter-district trades of 30,000 acre-feet and intra-district trades of about 110,000 acre-feet; and annual net farm earnings would fall $10 million, to $470 million (see the third row in Table 11). The increase, relative to the Baseline Scenario, of $150 million in net farm earnings during a severe drought year, from $320 million to $470 million, represents the direct-irrigation benefit of the Integrated Plan.
The Integrated Plan Scenario manages to achieve net earnings under drought conditions that are nearly equivalent to non-drought conditions under the Baseline Scenario by providing additional water supply, concentrating production under scarce conditions in the most profitable crops, and temporarily eliminating production of lower value crops. In particular, it results in reducing the application of water to irrigate crops that would generate limited farm income and using the water, instead, to irrigate crops that can generate substantial net farm income.

Yakima River Basin Integrated Plan 39 Framework for Implementation Report
Table 11. Annual Net Farm Earnings during a Severe Drought Year for Baseline and Integrated Plan Scenarios
SCENARIO PERCENT OF PRORATABLE
ENTITLEMENTS
WATER TRADED (ACRE-FEET)
TOTAL ANNUAL NET FARM EARNINGS
(MILLIONS)
RECEIVED Intra- Inter- Loss from District District Total Drought
Baseline Scenario (Average Non-Drought Year) 100% - - $480 Zero
Baseline Scenario (Severe Drought Year) 30% - 30,000 $320 -$160
Integrated Plan Scenario (Severe Drought Year) 70% 110,000 30,000 $470 -$10 These results are sensitive to the absolute and relative net earnings per acre of each crop and district combination. For further discussion, see Reclamation and Ecology 2012b.
Benefits of the Integrated Plan over the Next 100 Years Once it is fully implemented, the Integrated Plan would increase annual net farm earnings for the beneficiary irrigators by $150 million during a severe drought year. Based on conditions in the Yakima Project since the 1970s, the model assumes drought years would occur, on average, every 5 years, with a 3-year severe drought occurring every 20 years. The full benefits of the Integrated Plan would not materialize immediately, but would ramp up until 2026 based on the implementation schedule. Figure 9 accounts for these factors and shows the anticipated pattern of the Integrated Plan’s irrigation-related benefits over the next 100 years. The blue line shows those values in undiscounted 2012 dollars. The red line shows the present values, discounted at 4.0 percent per year to 2012. The overall, present value of the potential, irrigation-related benefits over the 100-year period is about $0.8 billion (in 2012 dollars).
$0 $5
$10 $15 $20 $25 $30 $35 $40 $45
1 10 19 28 37 46 55 64 73 82 91 100
Expe
cted
Sev
ere
Dro
ught
-R
elat
ed B
enef
its, b
y Ye
ar
Year Irrigation Benefits Discounted Irrigation Benefits
Figure 9. Potential Irrigation-Related Benefits of the Integrated Plan (millions)

Yakima River Basin Integrated Plan 40 Framework for Implementation Report
Sensitivity Analysis – Climate Change Without the Integrated Plan, the Baseline Scenario assumes that, during severe drought years, water supplies are sufficient to satisfy all non-proratable irrigators in the Yakima Project and 30 percent of all proratable entitlements. Severe droughts could, however, result in more or less intense restrictions on proratable irrigators. Models estimating the potential impacts of climate change on water supply availability in the Yakima Project suggest that proratable irrigators could receive only 9 percent of their entitlements during severe droughts by the 2040’s (under a moderately adverse climate change scenario) or no water at all (under a more extreme climate change scenario) (Reclamation and Ecology, 2011c).
In this section, the amount of water available to proratable irrigators during severe drought years is adjusted to account for the potential impacts of climate change (see Table 12). As previously described, assuming that proratable irrigators receive 30 percent of their entitlements during severe drought years without the Integrated Plan, the 100-year net present value (NPV) of irrigation-related benefits derived from Integrated Plan (which would provide proratable irrigators with 70 percent of their entitlements) is about $0.8 million. If, however, proratable irrigators were to receive only 20 percent of their entitlements during severe drought years without the Integrated Plan, the 100-year NPV of irrigation-related benefits rises to $0.9 billion. If proratable irrigators were to receive 40 percent of their entitlements during severe drought years without the Integrated Plan, the 100-year NPV of irrigation-related benefits falls to $0.6 billion.
Table 12. Irrigation-Related Benefits Assuming a Range of Severe Drought Conditions
PERCENT OF ENTITLEMENTS PRORATABLE IRRIGATORS RECEIVE DURING SEVERE DROUGHT YEARS
Without the Integrated Plan With the Integrated Plan
100-YEAR NPV OF IRRIGATION RELATED
BENEFITS
30% 70% $0.8 billion
20% 70% $0.9 billion
40% 70% $0.6 billion
Benefits from the National Perspective If the increased value of crop production realized by beneficiary irrigators in the five districts has no effect on the value of crop production elsewhere, then the direct benefits described in the preceding section equal the irrigation-related benefits from the national perspective prescribed for the NED account by the Principles & Guidelines. If the Integrated Plan affects not just the value of crop production in the Yakima Project but also the value outside it, then the NED benefits would differ from the direct benefits. An effect outside the Yakima Project could occur through the so-called price effect, with an increase in the supply of a given crop resulting from the Integrated Plan lowering the market price for the crop in a larger market and, hence, lowering the value of the crop produced elsewhere.
The Integrated Plan likely would not have national price effects, however, if local crop prices are not sensitive to changes in water scarcity typically experienced during severe droughts. Severe droughts occurred in the Yakima River basin in both 2001 and 2005. Crop prices locally, and nationally, however, did not demonstrably increase during those years relative to existing trends, as Figure 10 shows.
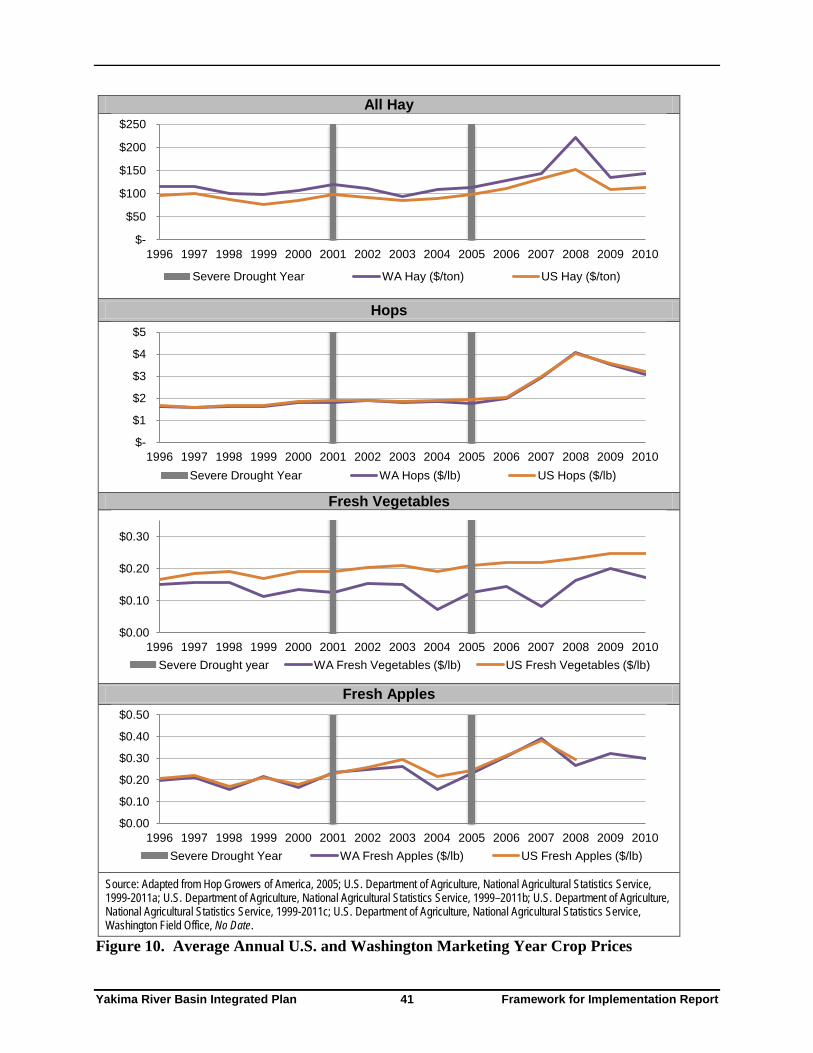
Yakima River Basin Integrated Plan 41 Framework for Implementation Report
All Hay
Hops
Fresh Vegetables
Fresh Apples
Source: Adapted from Hop Growers of America, 2005; U.S. Department of Agriculture, National Agricultural Statistics Service, 1999-2011a; U.S. Department of Agriculture, National Agricultural Statistics Service, 1999–2011b; U.S. Department of Agriculture, National Agricultural Statistics Service, 1999-2011c; U.S. Department of Agriculture, National Agricultural Statistics Service, Washington Field Office, No Date.
$-
$50
$100
$150
$200
$250
1996 1997 1998 1999 2000 2001 2002 2003 2004 2005 2006 2007 2008 2009 2010
Severe Drought Year WA Hay ($/ton) US Hay ($/ton)
$-
$1
$2
$3
$4
$5
1996 1997 1998 1999 2000 2001 2002 2003 2004 2005 2006 2007 2008 2009 2010 Severe Drought Year WA Hops ($/lb) US Hops ($/lb)
$0.00
$0.10
$0.20
$0.30
1996 1997 1998 1999 2000 2001 2002 2003 2004 2005 2006 2007 2008 2009 2010 Severe Drought year WA Fresh Vegetables ($/lb) US Fresh Vegetables ($/lb)
$0.00
$0.10
$0.20
$0.30
$0.40
$0.50
1996 1997 1998 1999 2000 2001 2002 2003 2004 2005 2006 2007 2008 2009 2010 Severe Drought Year WA Fresh Apples ($/lb) US Fresh Apples ($/lb)
Figure 10. Average Annual U.S. and Washington Marketing Year Crop Prices

Yakima River Basin Integrated Plan 42 Framework for Implementation Report
To the contrary, Figure 11 suggests that, for the State of Washington as a whole, drought years did not result in price peaks and generally fell below the average for the period of 1996-2010. The data in these figures do not demonstrate that, but for the droughts, prices would not have been even lower during those years, but they do not suggest as much. The data do show that local and national prices have tended to be closely correlated for the crops, hops and apples, where the state’s production represents a large share of national production. But non-drought factors seem likely to be the primary drivers for the pattern of fluctuation in prices for these crops. Overall, these data suggest that drought conditions in the Yakima River basin do not tend to drive up crop prices in the 3-county area; the State of Washington; the 3-state region of Washington, Oregon and Idaho; or the Nation as a whole. Overall, these data suggest that the Integrated Plan, by increasing the supply of water available to proratable irrigators in the three districts, relative to recent historical market and drought conditions, would not substantially reduce crop prices, relative to the Baseline Scenario, at the national, regional, or local scale. For further discussion, see Reclamation and Ecology 2012b.
Source: Adapted from Reclamation, 2010; Reclamation and Ecology, 2011a; and data from previous figures.
- 0.2 0.4 0.6 0.8 1.0 1.2 1.4 1.6 1.8 2.0
$-
$50
$100
$150
$200
$250
$300
$350
$400
$450
1996 1998 2000 2002 2004 2006 2008 Ann
ual D
iver
sion
abo
ve P
arke
r Gag
e (m
illio
ns o
f acr
e fe
et)
Ave
rage
Ann
ual C
rop
Pric
e
Diversion above Parker Gage WA Fresh Apples ($/1,000 lbs)
WA Fresh Vegetables ($/1,000 lbs) WA Hops ($/100 lbs)
WA Hay ($/ton)
Figure 11. Water Availability and Washington Crop Prices In sum, the available evidence supports the conclusion that the irrigation benefits of the Integrated Plan, viewed from the national perspective of the NED account are the same as, or close to, the direct benefits realized by the beneficiary irrigators in the three irrigation districts. The overall, present value of the potential, irrigation-related benefits over the 100-year period is about $0.8 billion.
As in any economic analysis, several factors create uncertainty regarding the accuracy of this estimate. They include the possibility that future years would see irrigators planting a different mix of crops, sell their crops for different prices, and incur different variable production costs than those incorporated into the analysis. Insufficient data currently exist to quantify these factors. They are unlikely, in the aggregate, to yield a lower value for the irrigation-related

Yakima River Basin Integrated Plan 43 Framework for Implementation Report
benefits of the Integrated Plan, however. The U.S. Department of Agriculture projects that “following near-term reductions from record levels reached in 2011, the values of U.S. agricultural exports and net farm income each rise over the rest of the decade,” and there are no apparent reasons to expect this trend would reverse itself in subsequent years (U.S. Department of Agriculture, Economic Research Service, 2012).
3.1.3 Municipal and Domestic Water Supply Benefits This section describes the NED benefits associated with municipal and domestic uses expected to result from implementation of the Integrated Plan. In this study municipal uses refer to all residential, commercial, industrial, and government uses of the community water systems in the Yakima River basin that supply drinking water to consumers. Domestic uses refer to the household consumption of water supplies by the owners of domestic wells in the basin.
Future Without the Integrated Plan In 2010, municipal and domestic users in the Yakima River basin used approximately 91,000 acre-feet of water. Of this amount, 46 percent (42,000 acre-feet) represents municipal demand of the six main cities in the basin, 17 percent (15,000 acre-feet) is demand of small public water systems, and 37 percent (34,000 acre-feet) represents the use of domestic-well owners. The municipal users obtain water from surface and groundwater, while domestic wells rely exclusively on groundwater. Sixty percent of the supplies that go to municipal and domestic uses are non-consumptive and either return to stream channels in the Yakima River basin as return flow or recharge the underlying aquifer (Reclamation and Ecology, 2011e).
Future changes in municipal and domestic uses are highly dependent on population growth, land use types, and type of infrastructure used to convey water from the source to the points of demand. The current population served by municipal public water systems and domestic wells in the basin was estimated at 326,000 in the year 2010 and includes the populations of Benton, Kittitas, and Yakima counties. This estimate excludes the populations of Kennewick, Richland, and West Richland (all located in Benton County), as their potable water comes from the Columbia River and groundwater outside the Yakima River basin. By 2060, the population is projected to increase to 590,000 if no constraints on growth from water supplies occur (Reclamation and Ecology, 2011e). While the latest recession may have decreased the population growth below the moderate rate of one percent per year assumed in this estimate, future rates of household formation may accelerate and make up for the decrease.
Over the next 50 years, if municipal and domestic uses increase at the same rate as the assumed population growth, the water use rate would increase to approximately 163,000 acre-feet annually. The impact on the basin’s overall water supplies likely would not reach this level, because of the effects of anticipated municipal water conservation programs. In addition, some municipal/domestic growth likely would involve urban development on agricultural lands, with some of the water that otherwise would be used for irrigation instead being used for municipal/domestic purposes and the remainder being available for other purposes. Current assumptions about expected population, economic activity, and conservation in the basin suggest that actual municipal/domestic use will rise 48,900 acre-feet above the 2010 level, to 140,000 acre-feet per year, by 2060. Conservation trends independent of the Integrated Plan that improve the technology related to the delivery of municipal water supplies and that include a shift from
Yakima River Basin Integrated Plan 44 Framework for Implementation Report
open canals to piped systems are expected to reduce the daily water use from the current 250 gallons to 234 gallons per-capita by 2060 (Reclamation and Ecology, 2011e).
Water supplies become restricted during dry years when low flows cannot meet all demands. Municipal and domestic groundwater uses in the basin are typically junior to irrigation water rights, so their supplies can be reduced when drought occurs13 (Reclamation, 2008). These circumstances have the potential to cause major disruption of service during severe drought years (Reclamation and Ecology, 2011e). Water shortages for municipal and domestic users occur especially during the irrigation season, when non-proratable water rights tied to agricultural irrigation in the basin have first call on available supplies.
Without the Integrated Plan, municipal and domestic water users who use groundwater above Parker Gage would be particularly vulnerable to disruptions, with major disruptions during severe drought years. In 2010, three municipal systems above Parker Gage—City of Ellensburg, Nob Hill Water Association, and Yakima County Public Works’ Terrace Heights system—served about 48,000 people, providing them with about 10,000 acre-feet of water per year. Of these, about 4,000 acre-feet were used consumptively. Domestic wells and small systems using groundwater above Parker supplied about 58,000 people with about 16,000 acre-feet of water per year, of which about 6,500 acre-feet were used consumptively (Graham 2012). The sum of the municipal and domestic consumptive use is about 10,500 acre-feet per year.
Ongoing investigations demonstrate that the groundwater supplies are connected to the basin’s surface waters (Vacarro 2011). Under the laws and regulations that allocate the basin’s surface water, the municipal and domestic users of groundwater generally have water rights junior to those of proratable irrigators. Therefore, proratable irrigators have the ability to demand that consumptive use of groundwater cease when surface water supplies are insufficient to satisfy their entitlements. Hence, continuation of current groundwater use, whether for municipal, domestic, agricultural or other purposes, would require mitigation of its impacts on surface-water users with more senior water rights. Emerging concerns about conflict between groundwater users and irrigators with more senior water rights induced Ecology to adopt a permanent rule in December 2010 that allows new groundwater withdrawals in Upper Kittitas County only if they are mitigated and backed by senior water rights (Ecology, 2010).
Ecology also has taken steps to facilitate groundwater users’ acquisition of senior water rights through voluntary, market-based transactions, but progress has been slow. However such transactions likely would remain severely limited without implementation of the Integrated Plan, because of structural impediments. These impediments arise from the absence of smoothly operating, permanent institutions, including an information clearinghouse and brokerage, experts providing technical support to buyers and sellers, and an authority to verify the conveyance of transferred water (Ecology, 2007). The Integrated Plan includes actions to encourage increased market transactions involving water supplies between willing sellers and willing buyers.
Uncertainties about the future reliability of water supplies during drought and non-drought years become more important when accounting for shifts in the variability of precipitation and plant water demand due to climate change. By 2040, climate change is expected to increase the water demand for landscaping and other municipal and domestic outdoor uses by five percent. This rise
13 There are also many agricultural irrigators using groundwater, and their ground water rights also tend to be junior to the basin’s surface water rights.

Yakima River Basin Integrated Plan 45 Framework for Implementation Report
would reduce return flows and increase the consumptive uses portion of the municipal and domestic water supplies (Reclamation and Ecology, 2011e).
Expected Municipal and Domestic Benefits of the Integrated Plan The Integrated Plan would yield municipal and domestic economic benefits in two ways. One would materialize as the area’s population and economy grow and the Integrated Plan provides water to satisfy demands that otherwise would remain unmet and by increasing the reliability of future water supplies. Increases in supply for municipal and domestic uses are expected to start materializing in 2020 and continue increasing with population growth through 2060, reaching 48,900 acre-feet annually. This study assumes municipal and domestic benefits of the Integrated Plan would continue at the same rate from 2060 through the end of the analysis period in 2111. Figure 12 shows the distribution of municipal and domestic benefits over the 100 years included in this analysis.
Source: Adapted from Reclamation and Ecology, 2011e
0
10,000
20,000
30,000
40,000
50,000
1 10 19 28 37 46 55 64 73 82 91 100
Acre
-Fee
per
Yea
r
Year
Figure 12. Annual Distribution of the Integrated Plan’s Municipal and Domestic Water Benefits Associated with New Water Supplies for Future Growth
The Integrated Plan would increase water availability to satisfy future growth in demand for municipal water systems across all three counties in the basin. Half of the new water allocated for municipal needs would be distributed to users across the three counties based on projected growth, while the other half would be made available on a first-come, first-served basis regardless of county (Reclamation and Ecology, 2011d).
The other way in which the Integrated Plan would provide municipal and domestic benefits is by increasing the security of water supplies for the current population and economy. This is especially the case for current municipal and domestic water users above Parker Gage, whose supplies may be affected in light of research findings confirming their water supplies are connected the basin’s surface water (Vacarro 2011). Their water rights are generally junior to those of proratable irrigators and most other water users and continued groundwater use may require mitigation of its impacts during future droughts on surface-water users with more senior water rights. Mitigation typically entails acquiring a senior water right for the consumptive use of groundwater. If current municipal/domestic users of groundwater above Parker Gage do not acquire sufficiently senior water rights, they would be vulnerable during future droughts to demands that they reduce water use that impairs the access of proratable irrigators to their full
Yakima River Basin Integrated Plan 46 Framework for Implementation Report
entitlements. Implementation of the Integrated Plan would facilitate the voluntary transfer of senior water rights to cover existing municipal and domestic systems (including small systems) that currently provide groundwater to about 106,000 individuals above Parker Gage who use about 26,000 acre-feet and consume about 10,500 acre-feet per year. By improving the supply of water to proratable irrigators during drought years, the Integrated Plan would lower the risk of litigation against junior groundwater users.
The benefits from increased security for existing municipal and domestic users of groundwater above Parker Gage would materialize as implementation of the Integrated Plan lowers three types of barriers to voluntary market-based transactions through which these users would acquire water rights with sufficient seniority to eliminate, or at least greatly reduce, the risk that their use of water would be curtailed during future droughts. The first of these barriers is structural: the absence of a water information clearinghouse and brokerage; legal, hydrological, and other technical expertise; and mechanisms for conveying and verifying the outcomes of water-right transfers. The second is economic: the absence of sufficient water during severe drought years for there to be a large enough pool of irrigators willing to sell water rights with sufficient seniority to provide secure water supplies to municipal and domestic groundwater users above Parker Gage. The third is legal: by increasing the supply of water available to proratable irrigators during drought years, the Integrated Plan reduces the likelihood that the irrigators would take legal action to force groundwater users to reduce or suspend pumping. Reducing or eliminating the uncertainty and risk associated with legal action would enable municipal and domestic groundwater users to avoid legal expenses and other risk-avoidance costs.
These water-security benefits would materialize as implementation of the Integrated Plan strengthens the basin’s water-market institutions and provides additional water supplies. This analysis assumes they would begin in 2013, with the initial implementation of the plan’s market-reallocation elements, and grow linearly until they reach the maximum, 10,500 acre-feet in 2030, when additional water supplies from dam construction would become available.
NED Value of Municipal and Domestic Water Benefits Associated with New Water Supplies for Future Growth
The calculation of municipal and domestic water benefits associated with future growth in the Yakima River basin entails three steps: (1) estimating the level of benefits and the timeline for the benefit stream; (2) calculating the value of benefits each year they materialize; and, (3) calculating the present, discounted value of the benefits.
Municipal and Domestic Water Benefits Associated with New Water Supplies for Future Growth These municipal and domestic benefits would start to accrue in 2020 and reach a maximum value of 48,900 acre-feet per year in 2060. This maximum value is maintained through 2111.
Annual Value of Municipal and Domestic Water Benefits Associated with Future Growth For the purposes of this analysis, it is assumed that, absent the Integrated Plan, the water to meet new municipal and domestic demand would come from another source. The most likely alternative is purchasing or leasing water rights from other users in the Yakima River basin or in other parts of the Columbia River Basin. The value of the municipal/domestic benefits of the Integrated Plan reflects the avoidance of costs to purchase or lease water. This analysis assumes
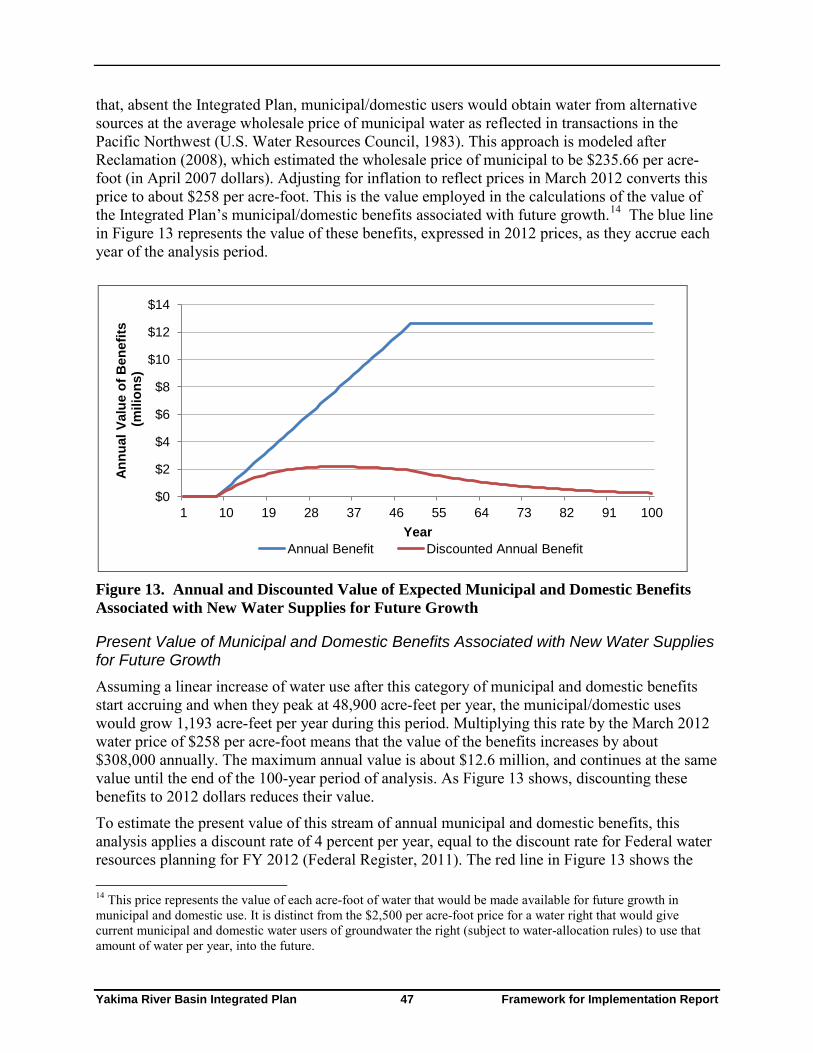
Yakima River Basin Integrated Plan 47 Framework for Implementation Report
that, absent the Integrated Plan, municipal/domestic users would obtain water from alternative sources at the average wholesale price of municipal water as reflected in transactions in the Pacific Northwest (U.S. Water Resources Council, 1983). This approach is modeled after Reclamation (2008), which estimated the wholesale price of municipal to be $235.66 per acre-foot (in April 2007 dollars). Adjusting for inflation to reflect prices in March 2012 converts this price to about $258 per acre-foot. This is the value employed in the calculations of the value of the Integrated Plan’s municipal/domestic benefits associated with future growth.14
The blue line in Figure 13 represents the value of these benefits, expressed in 2012 prices, as they accrue each year of the analysis period.
$0
$2
$4
$6
$8
$10
$12
$14
1 10 19 28 37 46 55 64 73 82 91 100
Annu
al V
alue
of B
enef
its
(mili
ons)
Year Annual Benefit Discounted Annual Benefit
Figure 13. Annual and Discounted Value of Expected Municipal and Domestic Benefits Associated with New Water Supplies for Future Growth
Present Value of Municipal and Domestic Benefits Associated with New Water Supplies for Future Growth Assuming a linear increase of water use after this category of municipal and domestic benefits start accruing and when they peak at 48,900 acre-feet per year, the municipal/domestic uses would grow 1,193 acre-feet per year during this period. Multiplying this rate by the March 2012 water price of $258 per acre-foot means that the value of the benefits increases by about $308,000 annually. The maximum annual value is about $12.6 million, and continues at the same value until the end of the 100-year period of analysis. As Figure 13 shows, discounting these benefits to 2012 dollars reduces their value.
To estimate the present value of this stream of annual municipal and domestic benefits, this analysis applies a discount rate of 4 percent per year, equal to the discount rate for Federal water resources planning for FY 2012 (Federal Register, 2011). The red line in Figure 13 shows the 14 This price represents the value of each acre-foot of water that would be made available for future growth in municipal and domestic use. It is distinct from the $2,500 per acre-foot price for a water right that would give current municipal and domestic water users of groundwater the right (subject to water-allocation rules) to use that amount of water per year, into the future.

Yakima River Basin Integrated Plan 48 Framework for Implementation Report
discounted value of the expected benefits for each year. The overall present value of the municipal-supply benefits is about $115 million in 2012 dollars. Figure 14 presents the accumulation of benefits through 100 years.
$0
$20
$40
$60
$80
$100
$120
1 10 19 28 37 46 55 64 73 82 91 100
Cum
ulat
ive
Valu
e of
B
enef
its (m
illio
ns)
Year
Figure 14. Cumulative Discounted Benefits of the Integrated Plan Associated with Future Growth in Municipal and Domestic Water Users
Sensitivity Analysis of the Economic Values of Municipal and Domestic Benefits Associated with New Water Supplies for Future Growth The actual value of these benefits could be higher or lower than the estimated value. The estimated value reflects the avoided costs of acquiring water from another source, absent the Integrated Plan. In general, using the avoided costs to estimate the value of these benefits underestimates the true value, all else equal, to the extent that consumers’ willingness to pay for new water supplies to satisfy the demands associated with future growth exceeds these costs. The validity of this conclusion is clouded, however, because the data underlying the estimate of avoided costs generally represent administrative prices set by water utilities based on cost of service, rather than market prices, determined under competitive conditions, that indicate consumers’ true willingness to pay for the water.
The slowing of population growth associated with the current weakness in the national economy may lead to overestimation of the benefits resulting from new water supplies the Integrated Plan would make available for future population and economic growth. The long-run perspective on growth represented in the analysis assumes that future acceleration in growth would offset, and may exceed, the current, temporary slowing of growth, so that the overall outcome reflects the long-run trend. The timing of the swings in short-run growth rates could cause the present value of these benefits to be higher or lower than the estimated value. If future accelerations in growth occur soon and are large, their positive impact on the present value may more than offset the decrease resulting from the current slower-than-trend growth. The further in the future the occurrence of the accelerations, the more the discounting process would diminish their ability to offset the current decrease.
To capture some of the possible increases in the benefits of new water supplies for future growth in municipal and domestic uses in the future, this analysis estimates the economic value of the benefits by assuming an increase in the real rate of municipal benefits of 1 percent and 2 percent,
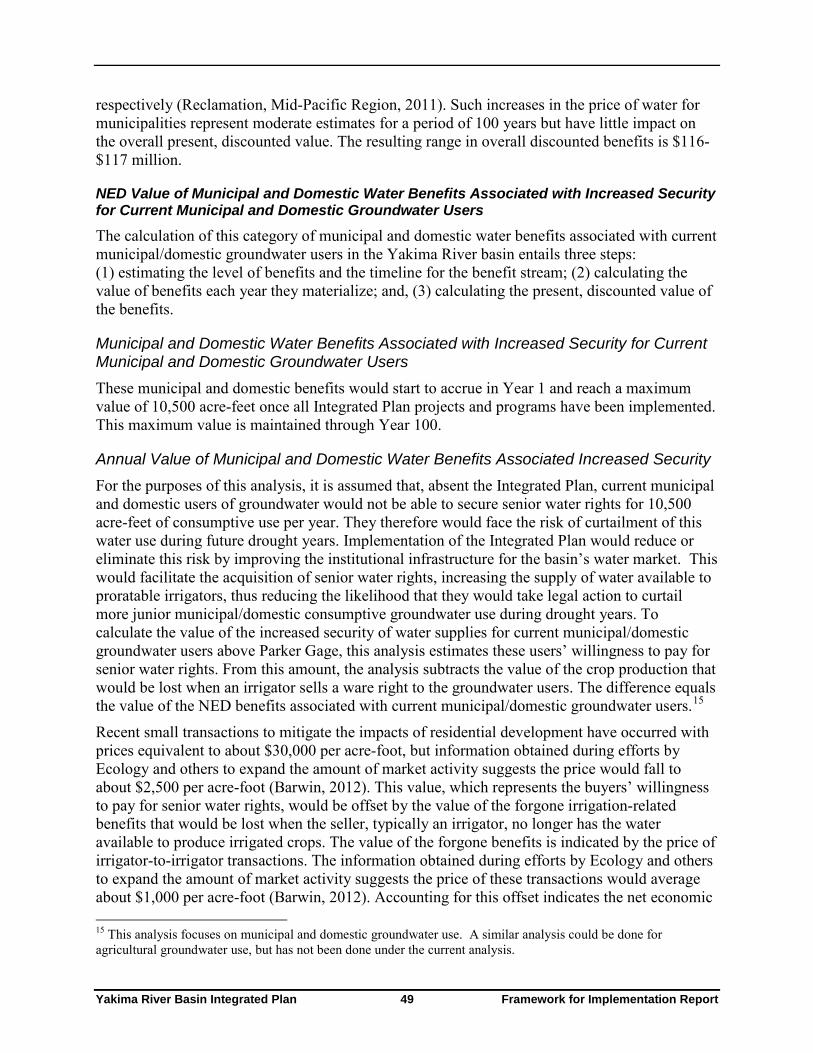
Yakima River Basin Integrated Plan 49 Framework for Implementation Report
respectively (Reclamation, Mid-Pacific Region, 2011). Such increases in the price of water for municipalities represent moderate estimates for a period of 100 years but have little impact on the overall present, discounted value. The resulting range in overall discounted benefits is $116-$117 million.
NED Value of Municipal and Domestic Water Benefits Associated with Increased Security for Current Municipal and Domestic Groundwater Users
The calculation of this category of municipal and domestic water benefits associated with current municipal/domestic groundwater users in the Yakima River basin entails three steps: (1) estimating the level of benefits and the timeline for the benefit stream; (2) calculating the value of benefits each year they materialize; and, (3) calculating the present, discounted value of the benefits.
Municipal and Domestic Water Benefits Associated with Increased Security for Current Municipal and Domestic Groundwater Users These municipal and domestic benefits would start to accrue in Year 1 and reach a maximum value of 10,500 acre-feet once all Integrated Plan projects and programs have been implemented. This maximum value is maintained through Year 100.
Annual Value of Municipal and Domestic Water Benefits Associated Increased Security For the purposes of this analysis, it is assumed that, absent the Integrated Plan, current municipal and domestic users of groundwater would not be able to secure senior water rights for 10,500 acre-feet of consumptive use per year. They therefore would face the risk of curtailment of this water use during future drought years. Implementation of the Integrated Plan would reduce or eliminate this risk by improving the institutional infrastructure for the basin’s water market. This would facilitate the acquisition of senior water rights, increasing the supply of water available to proratable irrigators, thus reducing the likelihood that they would take legal action to curtail more junior municipal/domestic consumptive groundwater use during drought years. To calculate the value of the increased security of water supplies for current municipal/domestic groundwater users above Parker Gage, this analysis estimates these users’ willingness to pay for senior water rights. From this amount, the analysis subtracts the value of the crop production that would be lost when an irrigator sells a ware right to the groundwater users. The difference equals the value of the NED benefits associated with current municipal/domestic groundwater users.15
Recent small transactions to mitigate the impacts of residential development have occurred with prices equivalent to about $30,000 per acre-foot, but information obtained during efforts by Ecology and others to expand the amount of market activity suggests the price would fall to about $2,500 per acre-foot (Barwin, 2012). This value, which represents the buyers’ willingness to pay for senior water rights, would be offset by the value of the forgone irrigation-related benefits that would be lost when the seller, typically an irrigator, no longer has the water available to produce irrigated crops. The value of the forgone benefits is indicated by the price of irrigator-to-irrigator transactions. The information obtained during efforts by Ecology and others to expand the amount of market activity suggests the price of these transactions would average about $1,000 per acre-foot (Barwin, 2012). Accounting for this offset indicates the net economic
15 This analysis focuses on municipal and domestic groundwater use. A similar analysis could be done for agricultural groundwater use, but has not been done under the current analysis.
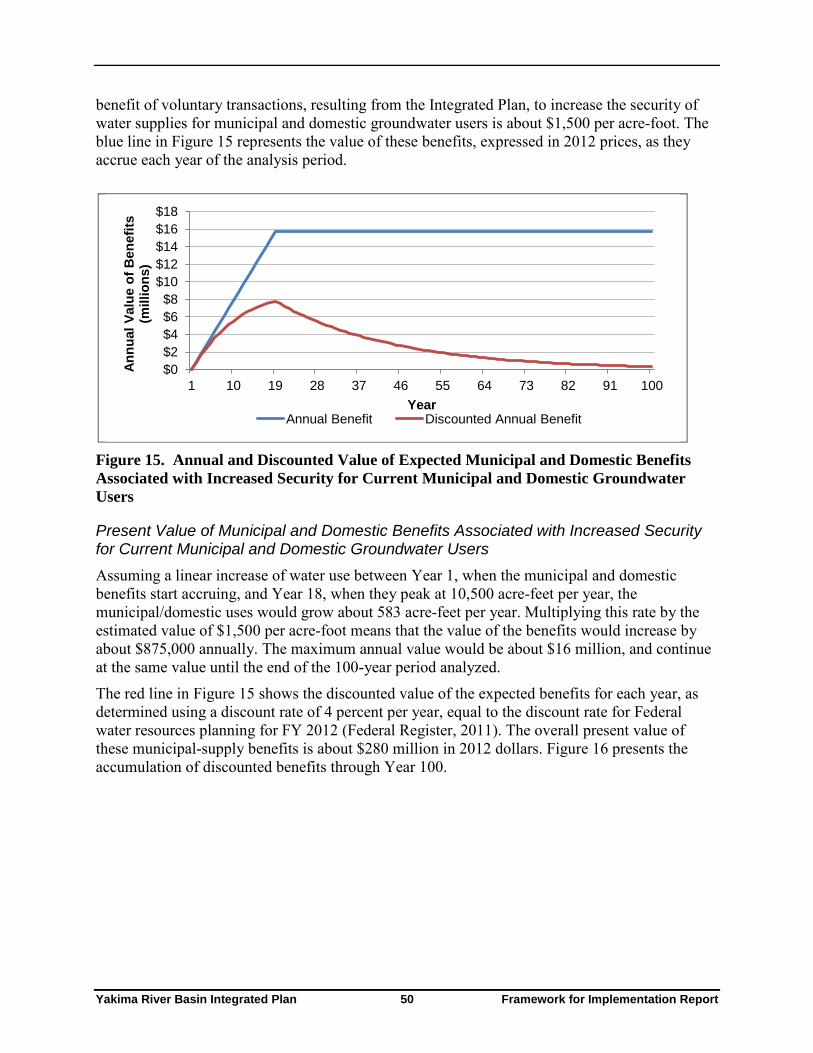
Yakima River Basin Integrated Plan 50 Framework for Implementation Report
benefit of voluntary transactions, resulting from the Integrated Plan, to increase the security of water supplies for municipal and domestic groundwater users is about $1,500 per acre-foot. The blue line in Figure 15 represents the value of these benefits, expressed in 2012 prices, as they accrue each year of the analysis period.
$0 $2 $4 $6 $8
$10 $12 $14 $16 $18
1 10 19 28 37 46 55 64 73 82 91 100
Annu
al V
alue
of B
enef
its
(mill
ions
)
Year Annual Benefit Discounted Annual Benefit
Figure 15. Annual and Discounted Value of Expected Municipal and Domestic Benefits Associated with Increased Security for Current Municipal and Domestic Groundwater Users
Present Value of Municipal and Domestic Benefits Associated with Increased Security for Current Municipal and Domestic Groundwater Users Assuming a linear increase of water use between Year 1, when the municipal and domestic benefits start accruing, and Year 18, when they peak at 10,500 acre-feet per year, the municipal/domestic uses would grow about 583 acre-feet per year. Multiplying this rate by the estimated value of $1,500 per acre-foot means that the value of the benefits would increase by about $875,000 annually. The maximum annual value would be about $16 million, and continue at the same value until the end of the 100-year period analyzed.
The red line in Figure 15 shows the discounted value of the expected benefits for each year, as determined using a discount rate of 4 percent per year, equal to the discount rate for Federal water resources planning for FY 2012 (Federal Register, 2011). The overall present value of these municipal-supply benefits is about $280 million in 2012 dollars. Figure 16 presents the accumulation of discounted benefits through Year 100.

Yakima River Basin Integrated Plan 51 Framework for Implementation Report
$0
$50
$100
$150
$200
$250
$300
1 10 19 28 37 46 55 64 73 82 91 100
Cum
ulat
ive
Valu
e of
B
enef
its (m
illio
ns)
Year
Figure 16. Cumulative Discounted Benefits of the Integrated Plan Associated with Increased Security for Current Municipal and Domestic Groundwater Users
Sensitivity Analysis of the Economic Values of Benefits Associated with Increased Security for Current Municipal and Domestic Groundwater Users The actual benefits associated with current municipal and domestic use of groundwater may be lower or higher than indicated. A recent compilation of data on water-market activity in western states found that the mean price for a one-acre-foot per year water right was about $4,400 for an agriculture-to-urban transaction and about $1,700 for an agriculture-to-agriculture transaction, with the difference between the two about $2,700 (Brewer et al. 2007). Using this value in the calculation increases the present value of the increased security for current municipal/domestic groundwater users to about $500 million. Brewer et al. (2007) also found that the median price for a one-acre-foot per year water right was about $2,600 for an agriculture-to-urban transaction and about $1,200 for an agriculture-to-agriculture transaction, with the difference between the two about $1,400 (Brewer et al. 2007). Using this value in the calculation decreases the present value of the increased security for current municipal/domestic groundwater users to about $260 million. Total Municipal and Domestic Water Supply Benefits. Implementation of the Integrated Plan would yield two types of NED benefits associated with municipal and domestic water supplies. One, an increase the supply of water to support anticipated population and economic growth, has a present value of about $115 million. The other, an increase in the security of water supplies for current municipal and domestic groundwater users, has a present value of about $280 million. The sum of these two amounts, $395 million, is the total value of the Integrated Plan’s NED benefits associated with municipal and domestic water supplies.
3.1.4 Costs of the Integrated Plan Applied to NED The Integrated Plan’s economic costs fall into these categories:
• Financial expenditures to implement programs and construct, operate, and maintain structures.

Yakima River Basin Integrated Plan 52 Framework for Implementation Report
• Effects from inundation of land at two reservoir sites that would reduce the value of certain environmental resources or other goods and services currently available from those sites.
Available information supports monetary quantification for only the financial expenditures. Figure 17 shows the financial costs to implement the Integrated Plan, by year, for the next 100 years (see Reclamation and Ecology 2012b for more details). These costs include capital costs, operations and maintenance costs, and costs associated with periodic replacement of major components. Nearly all the costs would occur during the first 20 years. Figure 17 also shows the present value of the annual financial costs (the blue line), using a discount rate of 4.0 percent per year, equal to the discount rate for Federal water resources planning for FY 2012 (Federal Register, 2011). The overall present value of the 100-year stream of expected costs is about $3.3 billion.
Source: Reclamation and Ecology 2012a
$0.0
$100.0
$200.0
$300.0
$400.0
$500.0
$600.0
$700.0
1 10 19 28 37 46 55 64 73 82 91 100
Annu
al C
ost (
mill
ions
)
Year Annual Costs Discounted Annual Costs
Figure 17. Potential Financial Costs to Implement the Integrated Plan The costs summarized in Figure 17 represent the 50th percentile of costs as estimated using the Cost Risk Assessment methodology on the Integrated Plan’s various components. The Cost Risk Assessment results also generated annual costs at the 10th percentile and 90th percentile levels. These additional reference points provide a range within which the costs associated with the Integrated Plan likely would fall. Figure 18 shows the accumulation of annual costs, discounted at a rate of 4.0 percent per year, based on 10th percentile, 50th percentile, and 90th percentile cost estimates. The overall present value of the 100-year stream of expected costs ranges from about $2.7 billion to $4.4 billion.
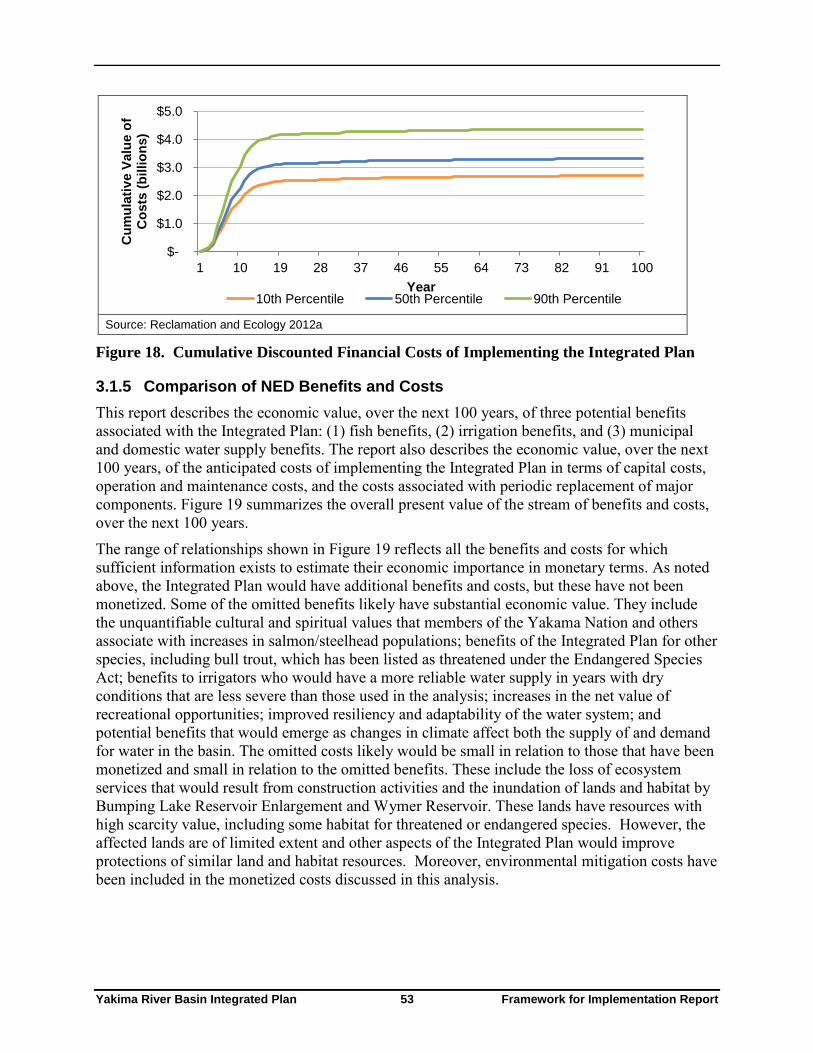
Yakima River Basin Integrated Plan 53 Framework for Implementation Report
Source: Reclamation and Ecology 2012a
$-
$1.0
$2.0
$3.0
$4.0
$5.0
1 10 19 28 37 46 55 64 73 82 91 100
Cum
ulat
ive
Valu
e of
C
osts
(bill
ions
)
Year 10th Percentile 50th Percentile 90th Percentile
Figure 18. Cumulative Discounted Financial Costs of Implementing the Integrated Plan
3.1.5 Comparison of NED Benefits and Costs This report describes the economic value, over the next 100 years, of three potential benefits associated with the Integrated Plan: (1) fish benefits, (2) irrigation benefits, and (3) municipal and domestic water supply benefits. The report also describes the economic value, over the next 100 years, of the anticipated costs of implementing the Integrated Plan in terms of capital costs, operation and maintenance costs, and the costs associated with periodic replacement of major components. Figure 19 summarizes the overall present value of the stream of benefits and costs, over the next 100 years.
The range of relationships shown in Figure 19 reflects all the benefits and costs for which sufficient information exists to estimate their economic importance in monetary terms. As noted above, the Integrated Plan would have additional benefits and costs, but these have not been monetized. Some of the omitted benefits likely have substantial economic value. They include the unquantifiable cultural and spiritual values that members of the Yakama Nation and others associate with increases in salmon/steelhead populations; benefits of the Integrated Plan for other species, including bull trout, which has been listed as threatened under the Endangered Species Act; benefits to irrigators who would have a more reliable water supply in years with dry conditions that are less severe than those used in the analysis; increases in the net value of recreational opportunities; improved resiliency and adaptability of the water system; and potential benefits that would emerge as changes in climate affect both the supply of and demand for water in the basin. The omitted costs likely would be small in relation to those that have been monetized and small in relation to the omitted benefits. These include the loss of ecosystem services that would result from construction activities and the inundation of lands and habitat by Bumping Lake Reservoir Enlargement and Wymer Reservoir. These lands have resources with high scarcity value, including some habitat for threatened or endangered species. However, the affected lands are of limited extent and other aspects of the Integrated Plan would improve protections of similar land and habitat resources. Moreover, environmental mitigation costs have been included in the monetized costs discussed in this analysis.
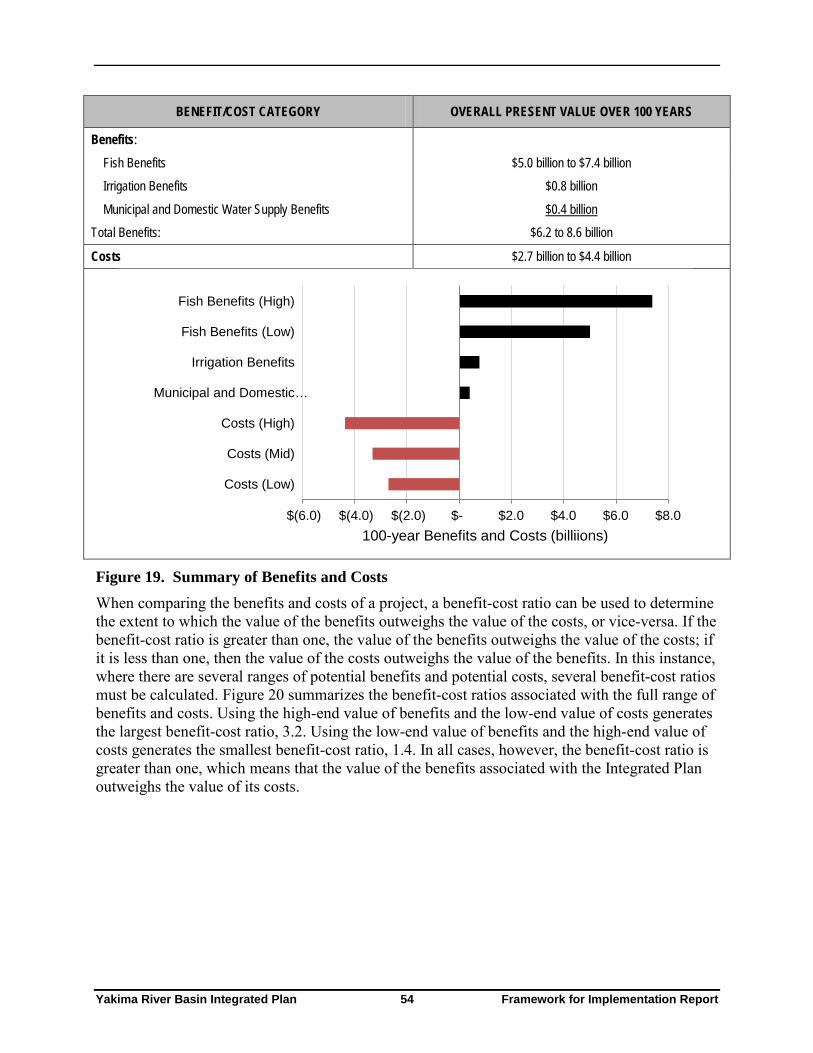
Yakima River Basin Integrated Plan 54 Framework for Implementation Report
BENEFIT/COST CATEGORY OVERALL PRESENT VALUE OVER 100 YEARS
Benefits:
Fish Benefits $5.0 billion to $7.4 billion
Irrigation Benefits $0.8 billion
Municipal and Domestic Water Supply Benefits
Total Benefits:
$0.4 billion
$6.2 to 8.6 billion
Costs $2.7 billion to $4.4 billion
$(6.0) $(4.0) $(2.0) $- $2.0 $4.0 $6.0 $8.0
Costs (Low)
Costs (Mid)
Costs (High)
Municipal and Domestic …
Irrigation Benefits
Fish Benefits (Low)
Fish Benefits (High)
100-year Benefits and Costs (billiions)
Figure 19. Summary of Benefits and Costs When comparing the benefits and costs of a project, a benefit-cost ratio can be used to determine the extent to which the value of the benefits outweighs the value of the costs, or vice-versa. If the benefit-cost ratio is greater than one, the value of the benefits outweighs the value of the costs; if it is less than one, then the value of the costs outweighs the value of the benefits. In this instance, where there are several ranges of potential benefits and potential costs, several benefit-cost ratios must be calculated. Figure 20 summarizes the benefit-cost ratios associated with the full range of benefits and costs. Using the high-end value of benefits and the low-end value of costs generates the largest benefit-cost ratio, 3.2. Using the low-end value of benefits and the high-end value of costs generates the smallest benefit-cost ratio, 1.4. In all cases, however, the benefit-cost ratio is greater than one, which means that the value of the benefits associated with the Integrated Plan outweighs the value of its costs.

Yakima River Basin Integrated Plan 55 Framework for Implementation Report
3.2
2.3
2.6
1.9
2.0
1.4
0 1 2 3 4
High Benefits and Low Costs
Low Benefits and Low Costs
High Benefits and Medium Costs
Low Benefits and Medium Costs
High Benefits and High Costs
Low Benefits and High Costs
Benefit-Cost Ratio
Figure 20. Summary of Benefit-Cost Ratios
3.2 Regional Economic Development This section presents the Regional Economic Development (RED) account, which shows regional incidence of the Integrated Plan’s effects on national economic development, income transfers, and employment. It describes the effects on personal income, jobs, and economic output stemming from changes in construction expenditures, O&M expenditures, and gross farm earnings that would occur with implementation of the Integrated Plan, relative to what would materialize without it. More specifically, the Principles & Guidelines describes the RED account as follows:
The RED account registers changes in the distribution of regional economic activity that result from each alternative plan. Two measures of the effects of the plan on regional economies are used in the account: regional income and regional employment. The regions used for RED analysis are those regions within which the plan would have particularly significant income and employment effects. Effects of a plan not occurring in the significantly affected regions are to be placed in a “rest of nation” category. Effects that cannot be satisfactorily quantified or described with available methods, data and information or that would not have a material bearing on the decisionmaking process may be excluded from the RED account.
This section summarizes results of the RED analysis. More detailed documentation is available in Reclamation and Ecology 2012b.
3.2.1 Analytical Approach The RED analysis examines three elements of the Integrated Plan that likely would generate economic impacts in the region and across the state: (1) spending associated with construction and program implementation (although only a portion of these expenditures would be spent on construction activities, per se, we refer to them all as “construction expenditures”), (2) spending associated with operations and maintenance (O&M), and (3) changes in agricultural production during severe drought years. Changes in spending and agricultural production are measured in 2012 dollars.
Yakima River Basin Integrated Plan 56 Framework for Implementation Report
This analysis uses IMPLAN modeling software to examine the economic impacts of the Integrated Plan across the region. IMPLAN is an input-output model that works by tracing how spending associated with a specific project circulates through the defined impact area. For this impact analysis, the study area is defined as the Yakima River basin and Tri-Cities16 area, encompassing Benton, Kittitas, Yakima, and Franklin Counties in the State of Washington (hereafter referred to as the four-county study area17). The analysis also describes economic impacts across the rest of the State of Washington. Input-output models were built for both study areas using 2009 IMPLAN data.
Because of limitations in the available, relevant data, the RED analysis does not quantify the economic impacts of other changes in spending or production that would result from the Integrated Plan. Most notably, it does not quantify the economic impacts of changes in spending associated with three types of economic benefits quantified in the NED analysis. One, it does not show the economic impacts of spending in recreational and commercial fisheries that would accompany future increases in salmon/steelhead populations. Two, it does not quantify the economic impacts of spending associated with the construction and other economic activity that would be generated as new water supplies support future economic and population growth in the Yakima River basin. Three, it does not show the economic impacts of changes in spending that would accompany the increased security of water supplies for current users of groundwater above Parker Gage, including the changes that would occur as the Integrated Plan reduced litigation over demands to curtail these uses during drought years and facilitated the groundwater-users’ voluntary acquisition of senior water rights. Because of these omissions, the analysis below understates the Integrated Plan’s overall, expected impacts on the economies of the 4-state study region, the rest of the State of Washington, and the state as a whole.
3.2.2 Economic Impacts of Construction Expenditures Construction expenditures associated with each of the Integrated Plan’s various components would fuel economic activity in the four-county study area and across the State of Washington. Table 13 summarizes the economic impacts associated with the Integrated Plan’s construction expenditures. The impacts summarized in the table represent the sum of the economic impacts of construction expenditures over the 18-year implementation period described in the Integrated Plan. They do not represent annual impacts.
Direct output represents spending on labor, materials, equipment, and per diem that takes place in each of the study areas. About $1.7 billion would be spent within the four-county study area, and about $0.9 billion would be spent across the rest of Washington. Direct personal income is a subset of direct output. It represents the portion of direct output going toward labor. This includes workers working on the construction site as well as the workers responsible for manufacturing and supplying the materials and equipment purchased for construction. Direct job years represent the years of full- and part-time employment supported by construction expenditures, including both workers on the construction site as well as the workers responsible for manufacturing and supplying the materials and equipment purchased for construction.
16 The Tri-Cities are Kennewick, Pasco, and Richland, Washington. 17 A small portion of the Yakima River basin extends into a fifth county, Klickitat County, but this is a small and remote portion of the basin with no cities or towns. The Integrated Plan will not have direct economic effects in this area.

Yakima River Basin Integrated Plan 57 Framework for Implementation Report
Indirect impacts summarize the supply-chain effects and represent the output, personal income, and employment for workers and business owners in industries that support the direct economic activity. Induced impacts summarize consumption-driven effects and represent the additional spending by households attributed to the direct and indirect changes in personal income.
Table 13. Summary of Economic Impacts, by Type, from Construction Expenditures
REGION / IMPACT MEASURE DIRECT INDIRECT INDUCED TOTAL
Four-County Study Area Output $1,740,000,000 $207,000,000 $399,000,000 $2,346,000,000
Personal Income $1,129,000,000 $67,000,000 $120,000,000 $1,316,000,000 Job Years 21,700 1,700 3,500 26,900
Rest of Washington Output $911,000,000 $387,000,000 $1,030,000,000 $2,328,000,000
Personal Income $450,000,000 $99,000,000 $288,000,000 $837,000,000
Job Years 6,000 2,000 7,100 15,100 Total Washington State
Output $2,651,000,000 $593,000,000 $1,430,000,000 $4,674,000,000 Personal Income $1,579,000,000 $166,000,000 $408,000,000 $2,153,000,000
Job Years 27,700 3,600 10,700 42,000 Notes: Calculated with cost estimates for the Integrated Plan and 2009 IMPLAN base data. For more information see Reclamation and Ecology 2012b.
In total, the Integrated Plan’s construction expenditures would support about $2.3 billion in output within the four-county study area. Of that output, about $1.3 billion would go toward personal incomes that would support about 26,900 job years, only a portion of which would accrue to the labor force residing locally. Additional impacts would spread across the rest of the state (about $2.3 billion in output, of which about $0.8 billion would go toward personal incomes that would support about 15,100 job years).
3.2.3 Operations and Maintenance Expenditures In addition to the construction expenditures described above, several of the Integrated Plan’s components would require annual O&M activities that would fuel economic activity in the four-county study area and across the state.
The direct spending associated with O&M would support additional supply-chain (indirect) and consumption-driven (induced) impacts for workers and business owners in the four-county study area and elsewhere in Washington. Table 14 summarizes the direct, indirect, and induced economic impacts attributed to O&M spending when it reaches its highest level once all the projects and programs within the Integrated Plan have been completed or activated.
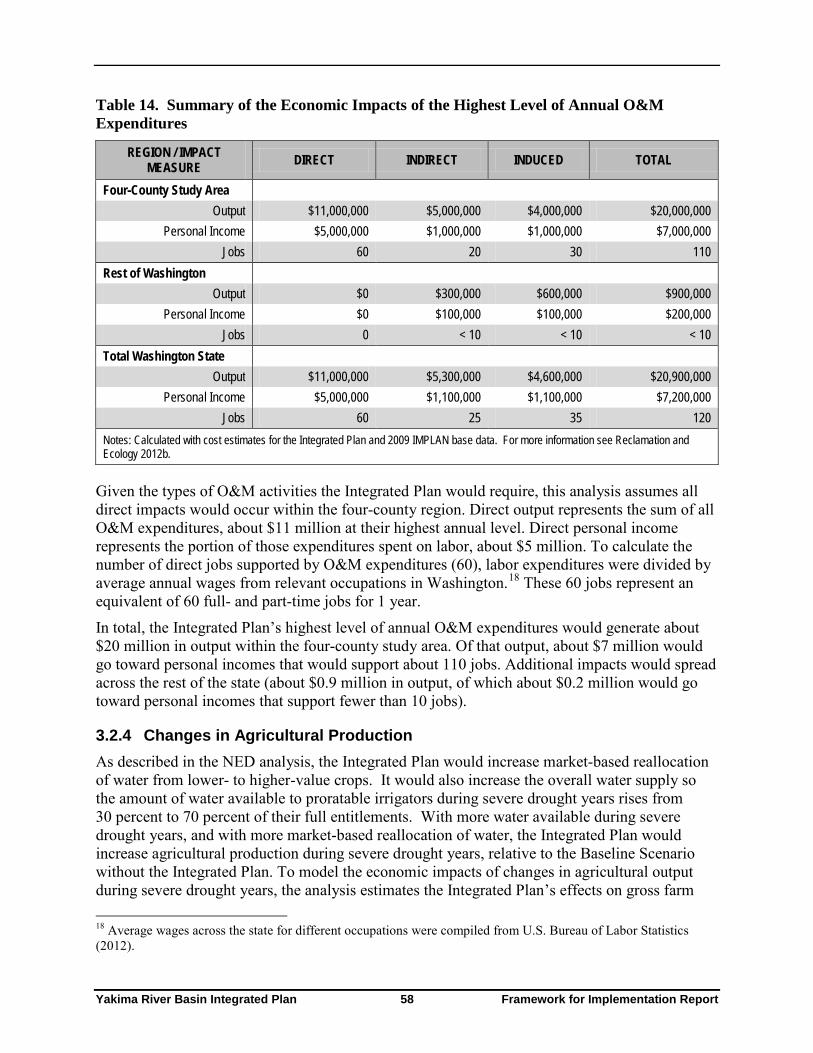
Yakima River Basin Integrated Plan 58 Framework for Implementation Report
Table 14. Summary of the Economic Impacts of the Highest Level of Annual O&M Expenditures
REGION / IMPACT MEASURE DIRECT INDIRECT INDUCED TOTAL
Four-County Study Area Output $11,000,000 $5,000,000 $4,000,000 $20,000,000
Personal Income $5,000,000 $1,000,000 $1,000,000 $7,000,000 Jobs 60 20 30 110
Rest of Washington Output $0 $300,000 $600,000 $900,000
Personal Income $0 $100,000 $100,000 $200,000 Jobs 0 < 10 < 10 < 10
Total Washington State Output $11,000,000 $5,300,000 $4,600,000 $20,900,000
Personal Income $5,000,000 $1,100,000 $1,100,000 $7,200,000 Jobs 60 25 35 120
Notes: Calculated with cost estimates for the Integrated Plan and 2009 IMPLAN base data. For more information see Reclamation and Ecology 2012b.
Given the types of O&M activities the Integrated Plan would require, this analysis assumes all direct impacts would occur within the four-county region. Direct output represents the sum of all O&M expenditures, about $11 million at their highest annual level. Direct personal income represents the portion of those expenditures spent on labor, about $5 million. To calculate the number of direct jobs supported by O&M expenditures (60), labor expenditures were divided by average annual wages from relevant occupations in Washington.18
In total, the Integrated Plan’s highest level of annual O&M expenditures would generate about $20 million in output within the four-county study area. Of that output, about $7 million would go toward personal incomes that would support about 110 jobs. Additional impacts would spread across the rest of the state (about $0.9 million in output, of which about $0.2 million would go toward personal incomes that support fewer than 10 jobs).
These 60 jobs represent an equivalent of 60 full- and part-time jobs for 1 year.
3.2.4 Changes in Agricultural Production As described in the NED analysis, the Integrated Plan would increase market-based reallocation of water from lower- to higher-value crops. It would also increase the overall water supply so the amount of water available to proratable irrigators during severe drought years rises from 30 percent to 70 percent of their full entitlements. With more water available during severe drought years, and with more market-based reallocation of water, the Integrated Plan would increase agricultural production during severe drought years, relative to the Baseline Scenario without the Integrated Plan. To model the economic impacts of changes in agricultural output during severe drought years, the analysis estimates the Integrated Plan’s effects on gross farm 18 Average wages across the state for different occupations were compiled from U.S. Bureau of Labor Statistics (2012).
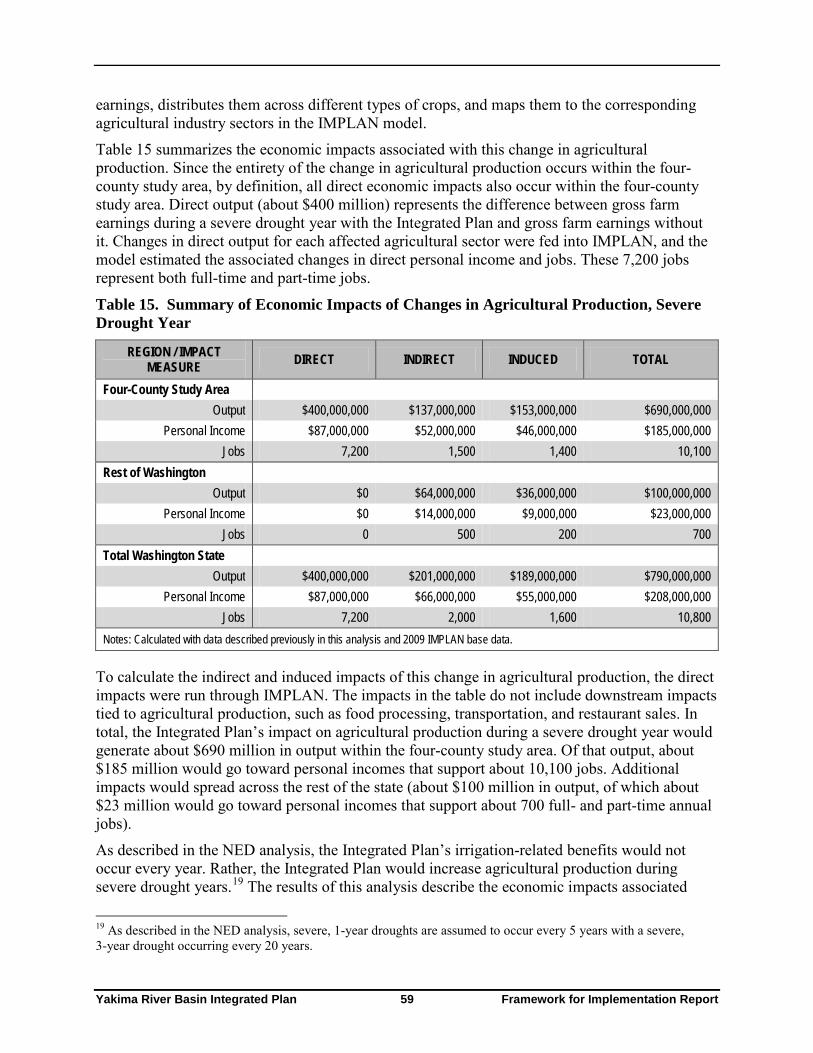
Yakima River Basin Integrated Plan 59 Framework for Implementation Report
earnings, distributes them across different types of crops, and maps them to the corresponding agricultural industry sectors in the IMPLAN model.
Table 15 summarizes the economic impacts associated with this change in agricultural production. Since the entirety of the change in agricultural production occurs within the four-county study area, by definition, all direct economic impacts also occur within the four-county study area. Direct output (about $400 million) represents the difference between gross farm earnings during a severe drought year with the Integrated Plan and gross farm earnings without it. Changes in direct output for each affected agricultural sector were fed into IMPLAN, and the model estimated the associated changes in direct personal income and jobs. These 7,200 jobs represent both full-time and part-time jobs.
Table 15. Summary of Economic Impacts of Changes in Agricultural Production, Severe Drought Year
REGION / IMPACT MEASURE DIRECT INDIRECT INDUCED TOTAL
Four-County Study Area Output $400,000,000 $137,000,000 $153,000,000 $690,000,000
Personal Income $87,000,000 $52,000,000 $46,000,000 $185,000,000 Jobs 7,200 1,500 1,400 10,100
Rest of Washington Output $0 $64,000,000 $36,000,000 $100,000,000
Personal Income $0 $14,000,000 $9,000,000 $23,000,000 Jobs 0 500 200 700
Total Washington State Output $400,000,000 $201,000,000 $189,000,000 $790,000,000
Personal Income $87,000,000 $66,000,000 $55,000,000 $208,000,000 Jobs 7,200 2,000 1,600 10,800
Notes: Calculated with data described previously in this analysis and 2009 IMPLAN base data.
To calculate the indirect and induced impacts of this change in agricultural production, the direct impacts were run through IMPLAN. The impacts in the table do not include downstream impacts tied to agricultural production, such as food processing, transportation, and restaurant sales. In total, the Integrated Plan’s impact on agricultural production during a severe drought year would generate about $690 million in output within the four-county study area. Of that output, about $185 million would go toward personal incomes that support about 10,100 jobs. Additional impacts would spread across the rest of the state (about $100 million in output, of which about $23 million would go toward personal incomes that support about 700 full- and part-time annual jobs).
As described in the NED analysis, the Integrated Plan’s irrigation-related benefits would not occur every year. Rather, the Integrated Plan would increase agricultural production during severe drought years.19
19 As described in the NED analysis, severe, 1-year droughts are assumed to occur every 5 years with a severe, 3-year drought occurring every 20 years.
The results of this analysis describe the economic impacts associated

Yakima River Basin Integrated Plan 60 Framework for Implementation Report
with changes in agricultural production attributable to the Integrated Plan during a severe drought year. While these impacts do represent annual impacts, insofar as they accumulate within a given year, they do not represent a continuous stream of annual impacts.
3.2.5 Summary of RED Results Table 16 summarizes the RED findings for the four-county study area and Table 17 summarizes the findings for the statewide economy. In interpreting the results, it is important to understand and consider the timing of the impacts. Each table shows separately the economic impacts of construction expenditures, O&M expenditures, and changes in agricultural production during severe drought years. The values describing construction-related impacts represent the Integrated Plan’s average annual effects during the implementation period summarized in Figure 4. In reality, these economic impacts would fluctuate from year to year as the overall construction effort varies. The values describing O&M-related impacts represent the plan’s effects beginning in the year in which all projects have been constructed and all programs have been activated. In all other years, the economic impacts tied to O&M expenditures would be less than those in the tables. The values describing agriculture-related impacts represent the plan’s effects during a severe drought year. During non-drought years, agricultural production would be similar to production without the Integrated Plan.
Table 16. Summary of Economic Impacts in the Four-County Area, by Type of Expenditure
TYPE OF EXPENDITURE DIRECT INDIRECT INDUCED TOTAL Construction (annual average during implementation period)
Output $97,000,000 $11,000,000 $22,000,000 $130,000,000 Personal Income $63,000,000 $4,000,000 $7,000,000 $73,000,000
Jobs 1,200 100 200 1,500 O&M (annual following implementation)
Output $11,000,000 $5,000,000 $4,000,000 $20,000,000 Personal Income $5,000,000 $1,000,000 $1,000,000 $7,000,000
Jobs 60 20 30 110 Agricultural Production (severe drought year only)
Output $400,000,000 $137,000,000 $153,000,000 $690,000,000 Personal Income $87,000,000 $52,000,000 $46,000,000 $185,000,000
Jobs 7,200 1,500 1,400 10,100 Notes: Based on data described previously in this analysis and calculated with 2009 IMPLAN base data.
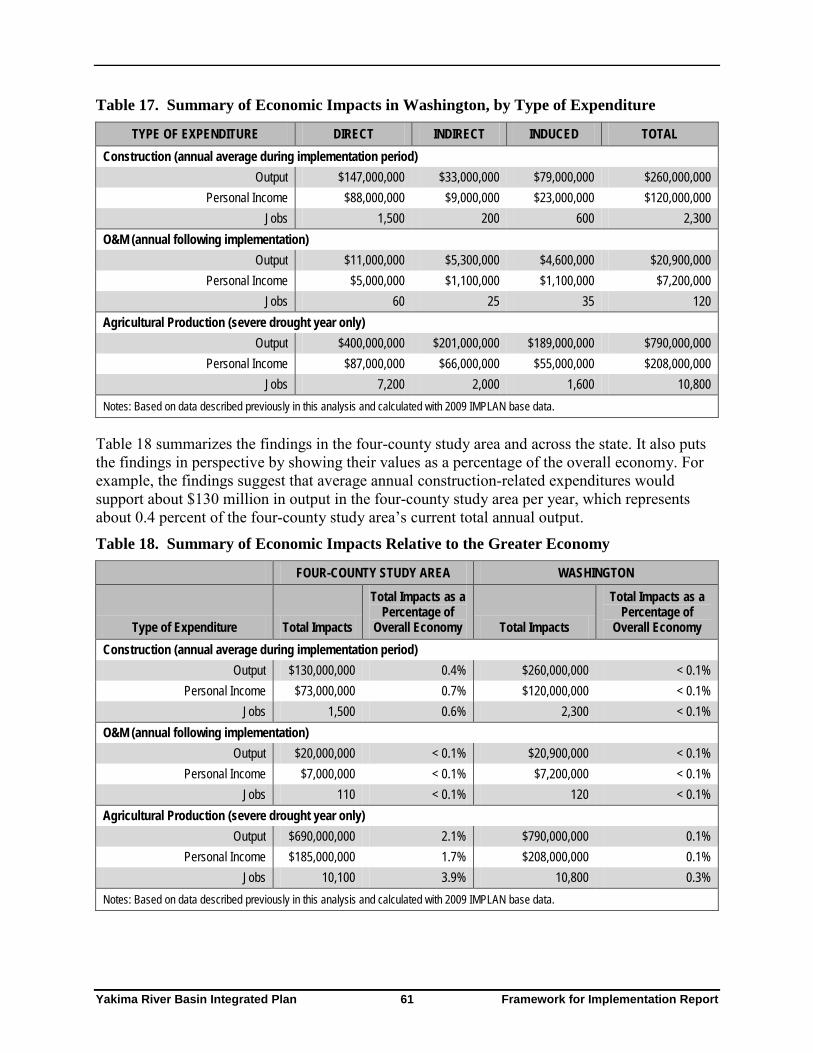
Yakima River Basin Integrated Plan 61 Framework for Implementation Report
Table 17. Summary of Economic Impacts in Washington, by Type of Expenditure
TYPE OF EXPENDITURE DIRECT INDIRECT INDUCED TOTAL Construction (annual average during implementation period)
Output $147,000,000 $33,000,000 $79,000,000 $260,000,000 Personal Income $88,000,000 $9,000,000 $23,000,000 $120,000,000
Jobs 1,500 200 600 2,300 O&M (annual following implementation)
Output $11,000,000 $5,300,000 $4,600,000 $20,900,000 Personal Income $5,000,000 $1,100,000 $1,100,000 $7,200,000
Jobs 60 25 35 120 Agricultural Production (severe drought year only)
Output $400,000,000 $201,000,000 $189,000,000 $790,000,000 Personal Income $87,000,000 $66,000,000 $55,000,000 $208,000,000
Jobs 7,200 2,000 1,600 10,800 Notes: Based on data described previously in this analysis and calculated with 2009 IMPLAN base data.
Table 18 summarizes the findings in the four-county study area and across the state. It also puts the findings in perspective by showing their values as a percentage of the overall economy. For example, the findings suggest that average annual construction-related expenditures would support about $130 million in output in the four-county study area per year, which represents about 0.4 percent of the four-county study area’s current total annual output.
Table 18. Summary of Economic Impacts Relative to the Greater Economy
FOUR-COUNTY STUDY AREA WASHINGTON
Total Impacts as a Total Impacts as a Percentage of Percentage of
Type of Expenditure Total Impacts Overall Economy Total Impacts Overall Economy Construction (annual average during implementation period)
Output $130,000,000 0.4% $260,000,000 < 0.1% Personal Income $73,000,000 0.7% $120,000,000 < 0.1%
Jobs 1,500 0.6% 2,300 < 0.1% O&M (annual following implementation)
Output $20,000,000 < 0.1% $20,900,000 < 0.1% Personal Income $7,000,000 < 0.1% $7,200,000 < 0.1%
Jobs 110 < 0.1% 120 < 0.1% Agricultural Production (severe drought year only)
Output $690,000,000 2.1% $790,000,000 0.1% Personal Income $185,000,000 1.7% $208,000,000 0.1%
Jobs 10,100 3.9% 10,800 0.3% Notes: Based on data described previously in this analysis and calculated with 2009 IMPLAN base data.
Yakima River Basin Integrated Plan 62 Framework for Implementation Report
3.3 Environmental Quality The Environmental Quality (EQ) evaluation was conducted in a workshop setting by a team of staff from Reclamation and Ecology along with senior environmental consultants to the agencies. Members of the team had all worked on the PEIS for the Integrated Plan and have expertise in environmental analysis, engineering, and Yakima Project operations.
The process used during the EQ workshops involved five major steps:
1. Identifying environmental resource categories from the PEIS that were most important for decision-making;
2. Prioritizing the resource categories;
3. Dividing some resource categories into subcategories to better capture the benefits and impacts of the alternative;
4. Weighting the EQ categories or subcategories; and
5. Scoring the benefits and impacts of the EQ categories or subcategories.
The EQ resource categories selected by the team are listed in Table 19 along with a brief explanation of the resource categories. The categories identified were those that have the most effect on the purpose and need20 for the Integrated Plan and those that would potentially be most impacted by the plan. The PEIS identified the needs of the Yakima River basin as improvements to resident and anadromous fish populations and irrigation and municipal and domestic water supply; as well as the ability to adapt to climate change.
The team considered the need for creating subcategories of the resource categories to allow for more refined evaluation of the benefits and impacts. Subcategories were assigned as shown and further explained in Table 19.
Table 19. EQ Resource Categories EQ Resource
Category EQ Resource
Subcategories Background
Water Resources Agriculture The water resource category is intended to capture the non-monetized benefits of improved water supply and to incorporate instream flows which are not monetized. As used here, agriculture and municipal water includes the benefits that would occur from improved water supplies that have not been monetized in the NED or RED, such as benefits of a more stabilized economy. Instream flows are included to represent the benefits other than fish that accrue from improved streamflows, such as improved water quality, aesthetics, etc.
Municipal Instream Flows
Fish Fish Abundance Fish abundance accounts for overall improvements in fish populations, health, and distribution that will occur under the plan. Fish passage refers to ecosystem benefits of providing fish with access to more habitat.
Fish Passage
Threatened and Endangered
Spotted Owl Spotted owl, steelhead, and bull trout are federally listed species. Greater sage-grouse is a federal candidate species. Steelhead
20 The purposes of the Integrated Plan are to implement a comprehensive program of water resource and habitat improvements in response to existing and forecast needs of the Yakima River basin and to develop an adaptive approach for implementing these initiatives and for long-term management of basin water supplies that contributes to the vitality of the regional economy and sustains the health of the riverine environment.
Yakima River Basin Integrated Plan 63 Framework for Implementation Report
EQ Resource Category
EQ Resource Subcategories Background
Species Bull Trout Greater Sage-Grouse
Land Use Protection and Enhancement of Ecosystems and Biodiversity
Protection and enhancement of ecosystems and biodiversity refers to the impact of the alternatives on overall ecosystem preservation and restoration in the basin as it relates to land use.
Vegetation and Wildlife Habitat
Shrub-Steppe Old Growth Forest
Shrub-steppe, old growth, and riparian areas are the primary vegetation and habitat types that would be affected by the Integrated Plan.
Riparian Recreation Water-Based
Land-Based Water-based recreation includes recreation opportunities on or around reservoirs and rivers. Land-based recreation includes recreation activities on land such as hiking, camping, horseback riding, and off-road vehicle use.
There are a number of resources that were discussed in the PEIS that are not included in the EQ evaluation. The Reclamation and Ecology team decided to focus the EQ evaluation on those resources that would be most important in deciding whether to implement the Integrated Plan. Other resources such as water quality, groundwater, air quality, visual resources, noise, transportation and utilities were not considered to have a significant effect on decision making at the programmatic level. Individual projects implemented under the Integrated Plan may significantly affect those resources and they may be important for decision-making at a project-specific level; those effects would be considered during project level analyses.
The team discussed whether to include hydropower and private property acquisition in the EQ evaluation, but decided against including them. Hydropower impacts identified in the PEIS are those that would occur from subordinating power at the Roza and Chandler Powerplants, and those impacts can be monetized. The Integrated Plan requires the acquisition of considerable amounts of private property; however, Reclamation and Ecology are committed to only acquiring private property from willing sellers. Also, the costs of property acquisition are included in the NED analysis and have been monetized. Therefore, hydropower was not considered a category in the analysis and property acquisition was not included as a subcategory used to evaluate impacts to Land Use.
The team prioritized the six resource categories based on two criteria. Four resource categories that most affect the purpose and need were rated as being of primary priority—water resources, fish, threatened and endangered species, and land use. The other two categories were rated as being of secondary priority. The categories with the highest priority were weighted higher than the two secondary priority resources. All resource categories were assigned weights based on their priority and so that the numbers totaled to 1.0.
The team then weighted the EQ subcategories. Similar to the prioritization process, the subcategories were assigned weights based on how the subcategories would meet the purpose and need of the Integrated Plan and potential impacts of the plan on the resources. The subcategory weights also total to 1.0. The category weights were then multiplied by the subcategory weights to obtain the final weights for the EQ resources. Table 20 presents the weights of the categories and subcategories.
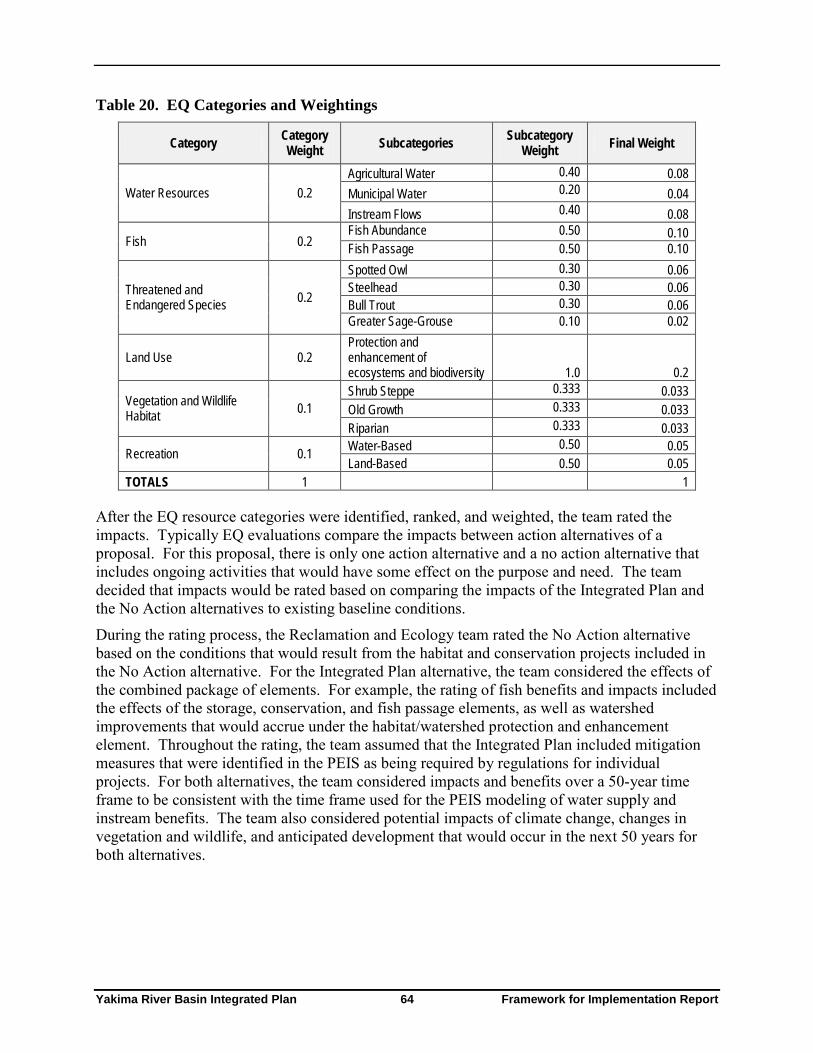
Yakima River Basin Integrated Plan 64 Framework for Implementation Report
Table 20. EQ Categories and Weightings
Category Category Weight
Subcategories Subcategory Weight
Final Weight
Water Resources 0.2 Agricultural Water Municipal Water Instream Flows
0.40 0.20 0.40
0.08 0.04 0.08
Fish 0.2 Fish Abundance Fish Passage
0.50 0.50
0.10 0.10
Threatened and Endangered Species 0.2
Spotted Owl Steelhead Bull Trout Greater Sage-Grouse
0.30 0.30 0.30 0.10
0.06 0.06 0.06 0.02
Protection and Land Use 0.2 enhancement of
Vegetation and Wildlife Habitat
Recreation
0.1
0.1
ecosystems and biodiversity Shrub Steppe Old Growth Riparian Water-Based Land-Based
1.0 0.333 0.333 0.333
0.50 0.50
0.2 0.033 0.033 0.033
0.05 0.05
TOTALS 1 1 After the EQ resource categories were identified, ranked, and weighted, the team rated the impacts. Typically EQ evaluations compare the impacts between action alternatives of a proposal. For this proposal, there is only one action alternative and a no action alternative that includes ongoing activities that would have some effect on the purpose and need. The team decided that impacts would be rated based on comparing the impacts of the Integrated Plan and the No Action alternatives to existing baseline conditions.
During the rating process, the Reclamation and Ecology team rated the No Action alternative based on the conditions that would result from the habitat and conservation projects included in the No Action alternative. For the Integrated Plan alternative, the team considered the effects of the combined package of elements. For example, the rating of fish benefits and impacts included the effects of the storage, conservation, and fish passage elements, as well as watershed improvements that would accrue under the habitat/watershed protection and enhancement element. Throughout the rating, the team assumed that the Integrated Plan included mitigation measures that were identified in the PEIS as being required by regulations for individual projects. For both alternatives, the team considered impacts and benefits over a 50-year time frame to be consistent with the time frame used for the PEIS modeling of water supply and instream benefits. The team also considered potential impacts of climate change, changes in vegetation and wildlife, and anticipated development that would occur in the next 50 years for both alternatives.

Yakima River Basin Integrated Plan 65 Framework for Implementation Report
To compare the effects of the two alternatives, the team developed a scale which accounts for both positive and negative impacts. The scale uses a 0 rating to indicate no change relative to existing conditions. The scale is listed below:
0 = no change from existing conditions 3 = major positive impact -3 = major negative impact 2 = moderate positive impact -2 = moderate negative impact 1 = minor positive impact -1 = minor negative impact
The impacts were scored using the same consensus-based approach as the prioritizing and weighting process. Resource subcategories were assigned an impact rating from +3 for a major positive impact to -3 for a major negative impact with a 0 rating indicating no overall change to existing conditions. For example, agricultural water was rated +3 under the Integrated Plan because agricultural water needs would be met under most which meets the objective of providing a water supply of 70 percent proratable water rights during drought years under most modeling scenarios, while the No Action alternative was rated -3 because prorationing would get worse under most scenarios.
To determine the final EQ score, the team multiplied the resource category significance scores for both the Integrated Plan and No Action alternative by the subcategory weight. This resulted in a +0.24 score for agricultural water under the Integrated Plan and a -0.24 score under the No Action Alternative. The resulting numbers reflect both the significance of the effect and the relative importance of the resource category and subcategory for the Yakima River basin as a whole. Table 21 displays the final results of the EQ evaluation.
Table 21. EQ Evaluation Results
EQ RESOURCE CATEGORY No Action Alternative Integrated Plan
Weight Significance Score Significance Score Agriculture 0.08 -3 -0.24 3 0.24
Water Resources Municipal Instream Flows
0.04 0.08
-3 -2
-0.12 -0.16
3 3
0.12 0.24
Subtotal 0.2 -0.52 0.60 Fish Abundance 0.1 1 0.1 3 0.30
Fish Fish Passage 0.1 0 0 3 0.30 Subtotal 0.2 0.1 0.60 Spotted Owl 0.06 -1 -0.06 1 0.06
Threatened and Endangered Species
Steelhead Bull Trout
Greater Sage-Grouse
0.06 0.06
0.02
-1 -1
-1
-0.06 -0.06
-0.02
2 2
1
0.12 0.12
0.02 Subtotal 0.2 -0.2 0.32 Protection and
Land Use Management
Enhancement of Ecosystems and Biodiversity 0.20 0 0 3 0.60 Subtotal 0.2 0 0.60
Vegetation and Wildlife Habitat
Shrub Steppe Old Growth Forest Riparian
0.033 0.033 0.033
-1 -1 1
-0.03 -0.03 0.03
1 1 3
0.03 0.03 0.10
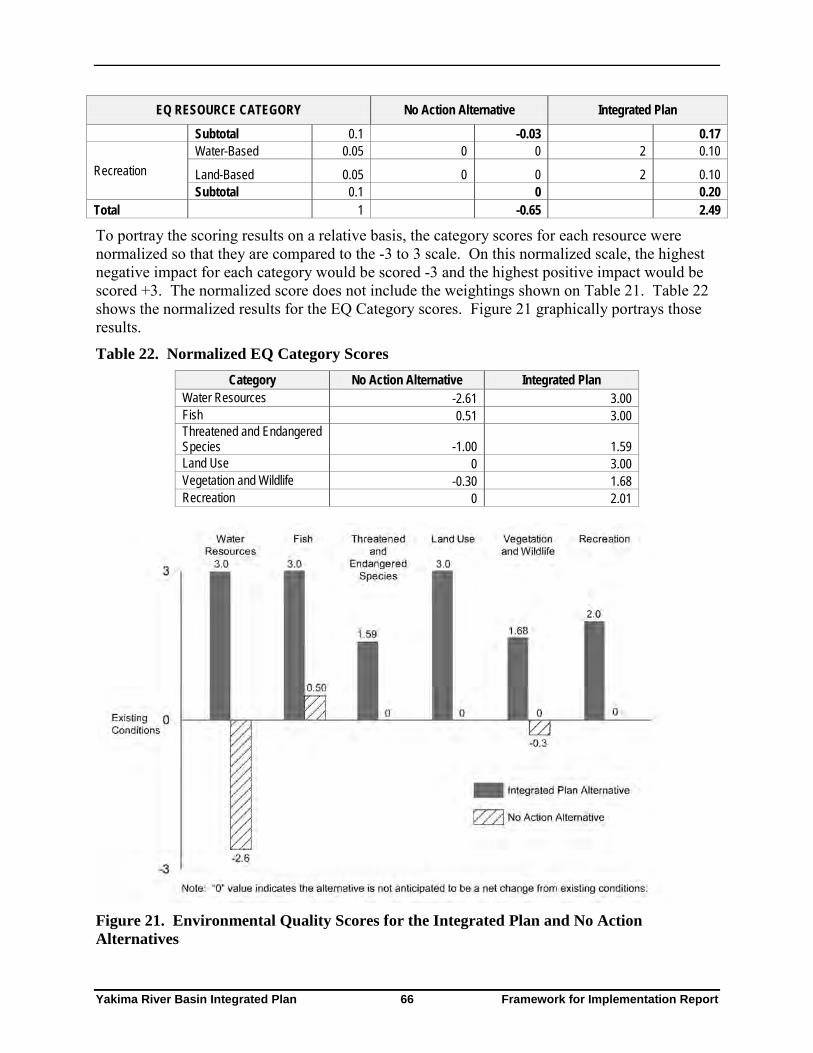
Yakima River Basin Integrated Plan 66 Framework for Implementation Report
EQ RESOURCE CATEGORY No Action Alternative Integrated Plan
Subtotal 0.1 -0.03 0.17 Water-Based 0.05 0 0 2 0.10
Recreation Land-Based 0.05 0 0 2 0.10 Subtotal 0.1 0 0.20
Total 1 -0.65 2.49
To portray the scoring results on a relative basis, the category scores for each resource were normalized so that they are compared to the -3 to 3 scale. On this normalized scale, the highest negative impact for each category would be scored -3 and the highest positive impact would be scored +3. The normalized score does not include the weightings shown on Table 21. Table 22 shows the normalized results for the EQ Category scores. Figure 21 graphically portrays those results.
Table 22. Normalized EQ Category Scores Category No Action Alternative Integrated Plan
Water Resources -2.61 3.00 Fish 0.51 3.00 Threatened and Endangered Species -1.00 1.59 Land Use 0 3.00 Vegetation and Wildlife -0.30 1.68 Recreation 0 2.01
Figure 21. Environmental Quality Scores for the Integrated Plan and No Action Alternatives

Yakima River Basin Integrated Plan 67 Framework for Implementation Report
For all categories considered, the Integrated Plan provides improvements over existing conditions whereas the No Action alternative would have negative effects except for a minor improvement to fish.
3.4 Other Social Effects Other Social Effects (OSE) were analyzed by the same team and at the same workshops and meetings as the EQ analysis. The OSE account is intended to include perspectives that are not included in the NED, RED or EQ accounts. The team identified two resource categories to include in the OSE account—cultural resources and sustainability benefits. Cultural resources were included in the OSE account rather than the EQ account in an attempt to represent the broad importance of cultural resources that extends beyond the physical environment. Sustainability benefits were included a category to capture the broad purpose of the Integrated Plan. OSE accounts often include environmental justice, but the team decided not to include that category since the Integrated Plan PEIS did not identify the potential for environmental justice impacts. The OSE categories are listed and described in Table 23.
Table 23. OSE Resource Categories OSE Resource
Category OSE Resource Subcategories Background
Cultural Resources Historic Structures Three subcategories are included under cultural resources. Impacts to Cultural and historic structures and cultural and archaeological resources are those that Archaeological Resources
would occur during project construction when historic structures such as Yakima Project dams are modified or cultural resources are disturbed. The
Subsistence subsistence subcategory is included to capture the impacts or benefits to Resources culturally important resources such as salmon and hunting, fishing, and
gathering. Sustainability Improve Water Sustainability benefits are intended to capture overall benefits of the Benefits Resource Reliability Integrated Plan to water resource reliability and ecosystem resilience to
Overall System Resilience to
climate change. The category is divided into two subcategories—improved water resource reliability and increased resistance of the ecosystem to climate
Climate Change change.
The OSE categories and subcategories were weighted as shown in Table 24 along with the weights assigned to each. Sustainability benefits were weighted higher than cultural resources because of their overall potential to influence long term resilience to climate change. The subsistence resources subcategory was weighted slightly higher than impacts to historic and cultural resources while the sustainability subcategories were given equal weight.
Table 21. OSE Categories and Rankings
Category Category Weight Subcategories
Historic Structures
Subcategory Weight
0.30
Final Weight
0.12
Cultural and
Cultural 0.40 Archaeological Resources 0.30 0.12 Subsistence Resources
0.40 0.16

Yakima River Basin Integrated Plan 68 Framework for Implementation Report
Category Category Weight Subcategories Subcategory
Weight Final Weight
Improve Water Resource Reliability 0.50 0.30
Sustainability Benefits 0.60 Overall System
Resilience to Climate Change 0.50 0.30
TOTALS 1 1 The team used the same scale as described in Section 3.3 to evaluate the effects to OSE under the Integrated Plan and No Action Alternative. Table 25 displays the final results of the OSE evaluation.
Table 22. OSE Evaluation Results OSE RESOURCE CATEGORY No Action Alternative Integrated Plan
Weight Significance Score Significance Score Historic Properties 0.12 0 0.00 -1 -0.12 Cultural and
Cultural Archaeological Resources 0.12 0 0.00 -1 -0.12 Subsistence Resources 0.16 1 0.16 3 0.48 Subtotal 0.40 0.16 0.24 Improve Water Supply Reliability 0.30 -2 -0.600 3 0.90
Sustainability Benefits
Overall System Resilience to Climate Change 0.30 0 0.00 2 0.60 Subtotal 0.60 -0.60 1.50
Total 1.00 -0.44 1.74 To portray the scoring results on a relative basis, the category scores for each resource were normalized to the -3 to 3 scales. On this normalized scale, the highest negative impact for each category would be scored -3 and the highest positive impact would be scored +3. The normalized score does not include the weightings shown on Table 25. Table 26 shows the normalized results for each OSE Category score. Figure 22 shows the results in graphical format.
Table 26. Normalized OSE Category Scores Category No Action Alternative Integrated Plan
Cultural 0.40 0.60 Sustainability Benefits -1.00 2.50
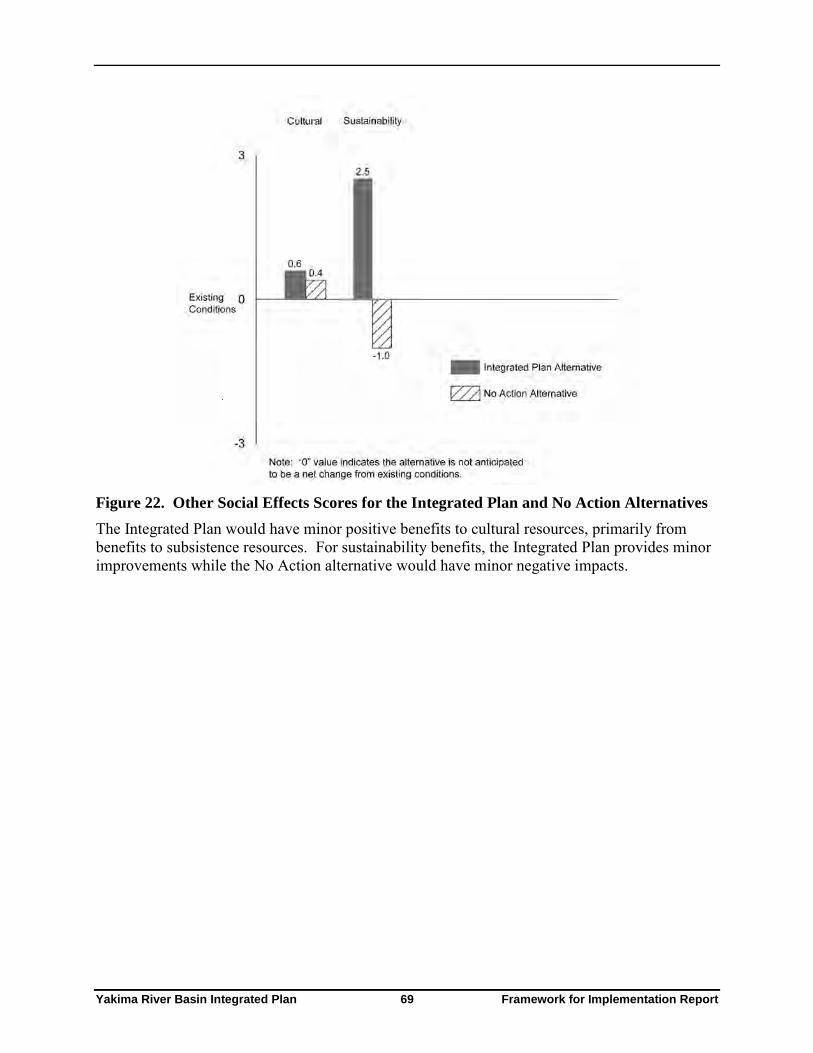
Yakima River Basin Integrated Plan 69 Framework for Implementation Report
Figure 22. Other Social Effects Scores for the Integrated Plan and No Action Alternatives The Integrated Plan would have minor positive benefits to cultural resources, primarily from benefits to subsistence resources. For sustainability benefits, the Integrated Plan provides minor improvements while the No Action alternative would have minor negative impacts.

Yakima River Basin Integrated Plan 70 Framework for Implementation Report
4.0 Financial Feasibility This section describes financial feasibility considerations for the Integrated Plan. Sections 4.1 to 4.6 address cost allocation performed in accordance with the Federal Principles and Guidelines (Water Resources Council, 1983). Section 4.7 addresses typical cost repayment.
4.1 Cost Allocation Cost allocation is undertaken for multipurpose projects in order to identify an equitable distribution of costs among the purposes. This section describes how a preliminary cost allocation was performed for the Integrated Plan and presents the results. This cost allocation is based on programmatic level analysis of project features and benefits. Implementation of the Integrated Plan would provide more accurate information on plan benefits and costs. Further, additional information may be developed as the plan elements are refined, such as allocation of water from reservoirs to meet the multipurpose aspects of the plan and benefits for a more reliable water supply for all post 1905 water users. The cost allocation would be expected to be adjusted accordingly when sufficient additional information is available to support the analysis. For more complete information on the preliminary cost allocation, see Reclamation and Ecology 2012c.
Methods used in cost allocation for Federal water resource projects include the Separable Costs – Remaining Benefits (SCRB) method; the Alternative Joint Expenditures (AJE) method and the Use of Facilities method. The AJE method was used in the preliminary cost allocation of the Integrated Plan. In brief, the AJE method separates out the specific costs that clearly should be associated with a single purpose. It then follows a step-by-step procedure to allocate the joint costs that remain. Allocated joint costs are added to specific costs for each purpose, to determine that purpose’s share of total project costs.
4.2 Purposes Used in Preliminary Cost Allocation The Integrated Plan provides benefits in multiple areas. As listed in the Final PEIS (Reclamation and Ecology 2012d), these include:
• Watershed protection, ecological restoration and enhancement addressing instream flows, aquatic habitat, and fish passage;
• Improved water supply reliability during drought years for agricultural and municipal needs;
• Efficient management of water supplies for irrigated agriculture, municipal and domestic uses, and power generation;
• Improved ability of water managers to respond and adapt to potential effects of climate change; and
• Improved vitality of the regional economy and environmental sustainability of the Yakima River system.
In order to perform the preliminary cost-allocation these benefits can be grouped into three primary purposes:

Yakima River Basin Integrated Plan 71 Framework for Implementation Report
• Ecological Restoration
• Agricultural Irrigation
• Municipal and Domestic Water Supply
At this time, the Integrated Plan does not include provision of power generation facilities. It is possible that power facilities may be added to water storage or conveyance systems at a future time, either by the Federal Government, state government or through arrangement with a privately-owned power utility. Since power features are not included at this time, it is not necessary to allocate costs to the power generation purpose.
Additional benefits of the Integrated Plan include improved recreational opportunities, especially on acquired lands, and flood damage reduction from water storage and floodplain restoration projects. However, these benefits have not been quantified, and would depend on future decisions about specific projects and features. Because of this, the economic value of those benefits has not yet been estimated in monetary terms. Therefore, recreation and flood damage reduction are not identified as individual purposes in the preliminary cost allocation. However, these benefits may be allocated at a later date if additional information is developed.
4.3 Costs and Benefits Used in Preliminary Cost Allocation Costs used in the preliminary cost allocation include construction cost, operations, maintenance and replacement costs, and interest during construction. Construction costs and O&M costs are summarized in Section 2 of this technical memorandum. Replacement costs and interest during construction were estimated specifically for purposes of the preliminary cost allocation and are described in Reclamation and Ecology 2012c. The NED benefits of the integrated plan are summarized in Section 3.1 of this technical memorandum. These benefits were used in applying the AJE procedure for the preliminary cost allocation.
4.4 Identification of “Specific Costs” The AJE Method of cost allocation requires identification of “specific costs” or those that can be attributed to just a single purpose. Costs of the following components of the Integrated Plan were identified as specific costs for the preliminary allocation.
• Costs specific to the Ecological Restoration purpose: o Fish Passage at Cle Elum Lake Dam
o Fish Passage at Bumping Lake Dam
o Fish Passage at Clear Creek Dam
o Fish Passage at Tieton, Kachess and Keechelus Dams
o KRD Canal modifications to improve flow in local creeks
o Wapatox Canal improvements to improve flows in the Naches River
o Mainstem Floodplain Restoration Program
o Tributary Habitat Enhancement Program
Yakima River Basin Integrated Plan 72 Framework for Implementation Report
o Land Acquisition Program
The total specific cost for this purpose is $920 million, including construction, IDC, and OM&R.
Fish passage at Box Canyon Creek provides ecological benefits but was not identified as a “specific” cost in this category. This is because it accompanies the Kachess Inactive Storage project which has benefits for irrigated agriculture.
• Costs specific to the Agricultural Irrigation purpose: o Kachess Inactive Storage (drawdown would be used exclusively for irrigation supply
in drought years).
o Fish passage at Box Canyon Creek (this project would accompany the Kachess Inactive Storage project).
The total specific cost for this purpose is $197 million, including construction, IDC, and OM&R.
The Wymer Downstream Conveyance system was also considered for possible designation as a cost specific to agriculture. However the project team concluded that the improved operational flexibility afforded by this conveyance system has benefits for management of fish flows and water temperature, and therefore this is considered to be a joint cost between agriculture and ecological restoration.
• Costs specific to the Municipal and Domestic Uses purpose: o Municipal water conservation
The total specific cost for this purpose is $16 million. This cost consists solely of O&M costs, due to the programmatic nature of the municipal water conservation action.
Of the remaining components of the Integrated Plan not listed above (e.g. storage projects, groundwater infiltration, agricultural conservation, etc.), no subfeatures were identified that can clearly be identified as “specific costs.” Therefore all of the remaining projects were treated in full as “joint cost” items.
4.5 Definition of “Single-Purpose Alternatives” The AJE Method requires that a “Single Purpose Alternative” (SPA) be defined for each of the three purposes discussed in Section 4.1: Ecological Restoration, Agricultural Irrigation, and Municipal and Domestic Supply. This is defined as the cost of a comparable alternative project that would provide equivalent benefits in the same geographic area as the proposed project would, for just one of the purposes of the multipurpose project. An SPA must be a project that would be reasonable for the Federal Government to plan and construct.
A SPA was defined for each of the three purposes discussed in Section 4.2. These include groups of select projects at full size as well as downsized projects from the Integrated Plan that, collectively, could meet the objectives of just one purpose instead of all three purposes. Each of the three SPAs was identified solely to carry out the cost-allocation procedure, and the SPAs are not proposed for implementation. The SPAs are summarized in Tables 23 through 25.

Yakima River Basin Integrated Plan 73 Framework for Implementation Report
Table 23. Projects Included in SPA for Ecological Restoration
Projects Specific to this Purpose and Included at Full Size • Fish Passage at Cle Elum Lake Dam • Fish Passage at Bumping Lake Reservoir Dam • Fish Passage at Clear Creek Dam • Fish Passage at Tieton, Kachess and Keechelus Dams • KRD Canal modifications to improve flow in local creeks • Wapatox Canal improvements to improve flows in the Naches River • Mainstem Floodplain Restoration Program • Tributary Habitat Enhancement Program • Land Acquisition Program
Other Projects Included at Full Size • Keechelus-to-Kachess Conveyance • Cle Elum Pool Raise • Groundwater Infiltration
Downsized Projects • Bumping Lake Reservoir Enlargement (enlarged to 87 KAF instead of 198 KAF) • Wymer Reservoir (80 KAF instead of 162.5 KAF) • Wymer Downstream Conveyance (500 cfs instead of 1,000 cfs) • Agricultural Conservation (50% of the program cost)
KAF = thousand acre-feet; cfs = cubic feet per second Table 24. Projects Included in SPA for Agricultural Irrigation
Projects Specific to this Purpose and Included at Full Size • Kachess Inactive Storage • Fish Passage at Box Canyon Creek
Other Projects Included at Full Size • Bumping Lake Reservoir Enlargement • Keechelus-to-Kachess Conveyance • Agricultural Conservation • Market Reallocation • Groundwater Infiltration
Downsized Projects • None
Table 25. Projects Included in SPA for Municipal and Domestic Supply
Projects Specific to this Purpose and Included at Full Size • Municipal Conservation • Municipal Aquifer Storage and Recovery (ASR)
Other Projects Included at Full Size • Market Reallocation • Cle Elum Pool Raise
Downsized Projects • Bumping Lake Reservoir Enlargement (enlarged to 68 KAF instead of 198 KAF)
KAF = thousand acre-feet
Yakima River Basin Integrated Plan 74 Framework for Implementation Report
4.6 Results of Preliminary Cost Allocation Cost allocation results are presented in Tables 26 and 27, using 2012 present values and 2026 future values, respectively (see discussion of future value, below). Additional data on the cost allocation is included in Appendix B. Using results expressed in 2012 present value, the allocation indicates the following breakdown among the three project purposes:
• Ecological Restoration: $2,440 million (69.3 percent)
• Agricultural Irrigation: $729 million (20.7 percent)
• Municipal and Domestic Water Supply: $351 million (10.0 percent)
In many projects, a single facility or group of facilities is completed at the same time, and benefits begin to accrue in that year. Cost allocation then values all costs and benefits to that same year. The Integrated Plan is different, in that it contains a suite of many projects which are scheduled to be completed at different times. For consistency with Reclamation procedures, the year 2026 was selected as a common year for computation of the future value of all costs and benefits. This is the year when all of the discrete capital projects are scheduled to be operational based on the implementation schedule contained in the Integrated Plan. Results of the cost allocation are therefore provided for both 2012 and 2026.
4.7 Cost Repayment Reimbursable project functions included in the Integrated Plan are agricultural irrigation and municipal and domestic water supply. Construction costs allocated to agricultural irrigation are generally reimbursable without interest, while those allocated to municipal and domestic supply are reimbursable with interest. For the Integrated Plan, cost-share partners such as the State of Washington, local governments or other parties, may participate in reimbursement.
Ecological restoration is generally a non-reimbursable function that is typically expected to be borne by the U.S. Treasury in combination with the state and other cost-share partners.
It is anticipated that the State of Washington would be a partner in funding many of the elements of the Integrated Plan. At this time specific cost-sharing provisions between the State and Federal government have not been determined.

Yakima River Basin Integrated Plan 75 Framework for Implementation Report
Table 26. Preliminary Cost Allocation – 2012 (Present Value) PROJECT PURPOSES
ITEM
Ecological Restoration Agriculture
Municipal & Domestic
TOTAL ($M)
1
Costs to be Allocated 0 0 0 3,520
Construction Costs 0 0 0 3,121
IDC 0 0 0 139
Capitalized OM&R 0 0 0 260 Annual OM&R 0 0 0 14 2 Benefits1 6,200 800 395 7,395
Benefits (Present Value) 6,200 800 395 7,395 3 Single Purpose Alternative Cost2 2,642 1,222 406 0
Construction Costs 2,349 1,100 350 0 IDC 101 49 21 0
Capitalized OM&R 191 73 35 0
Average Annual OM&R 11 4 2 0 4 Justifiable Expenditure3 2,642 800 395 0 5 Specific Costs4 920 197 16 1,133
Construction Costs 843 179 0 1,022 IDC 18 11 0 29
Capitalized OM&R 59 7 16 82
Average Annual OM&R 3 1 0 4 6 Remaining Justifiable Expenditure5 1,722 603 379 2,704 7 Percent Distribution 63.7% 22.3% 14.0% 100.0% 8 Remaining Joint Cost6 1,520 532 335 2,387
Construction Costs 1,337 468 294 2,099 IDC 70 24 15 110 Capitalized OM&R 113 40 25 178 Average Annual OM&R 7 2 1 10 9 Total Allocation7 2,440 729 351 3,520
Construction Costs 2,180 647 294 3,121 IDC 88 36 15 139 Capitalized OM&R 172 47 41 260 Average Annual OM&R 10 3 2 14 All values are expressed in 2012 dollars. IDC = Interest During Construction; OM&R = Operations, Maintenance and Replacement 1. Benefits from Reclamation and Ecology,2012b. 2. Construction Cost from Reclamation and Ecology 2012c. 3. Lesser of values from Row 2 and Row 3. 4. Total costs of all project elements that are unique to just one purpose. 5. Values from Row 4 minus values from Row 5. 6. Using total column at far right, subtract value in Row 5 from value in Row 1. Then allocate the resulting value to the
purposes, using percentages from Row 7. 7. Total allocation is the sum of Specific Costs from Row 5 and Remaining Joint Costs from Row 8.
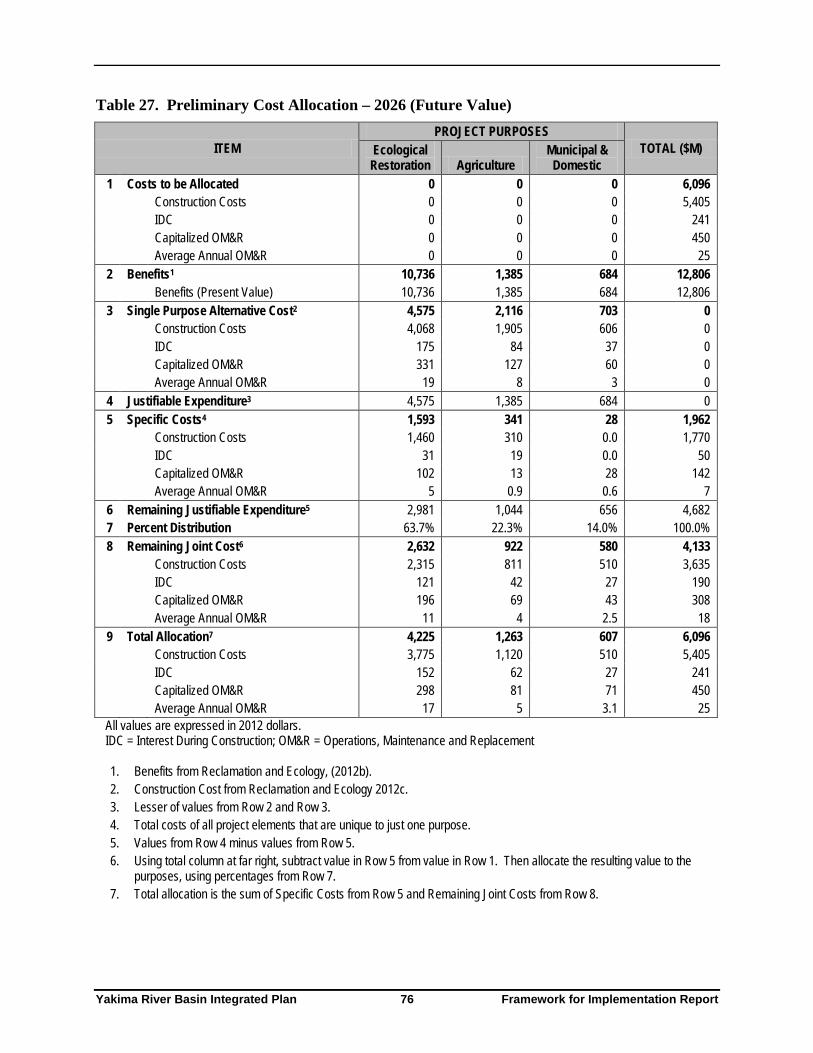
Yakima River Basin Integrated Plan 76 Framework for Implementation Report
Table 27. Preliminary Cost Allocation – 2026 (Future Value) PROJECT PURPOSES
ITEM
Ecological Restoration Agriculture
Municipal & Domestic
TOTAL ($M)
1
Costs to be Allocated 0 0 0 6,096
Construction Costs 0 0 0 5,405
IDC 0 0 0 241
Capitalized OM&R 0 0 0 450
Average Annual OM&R 0 0 0 25 2 Benefits1 10,736 1,385 684 12,806
Benefits (Present Value) 10,736 1,385 684 12,806 3 Single Purpose Alternative Cost2 4,575 2,116 703 0
Construction Costs 4,068 1,905 606 0 IDC 175 84 37 0 Capitalized OM&R 331 127 60 0 Average Annual OM&R 19 8 3 0 4 Justifiable Expenditure3 4,575 1,385 684 0 5 Specific Costs4 1,593 341 28 1,962
Construction Costs 1,460 310 0.0 1,770 IDC 31 19 0.0 50 Capitalized OM&R 102 13 28 142 Average Annual OM&R 5 0.9 0.6 7 6 Remaining Justifiable Expenditure5 2,981 1,044 656 4,682 7 Percent Distribution 63.7% 22.3% 14.0% 100.0% 8 Remaining Joint Cost6 2,632 922 580 4,133
Construction Costs 2,315 811 510 3,635 IDC 121 42 27 190 Capitalized OM&R 196 69 43 308 Average Annual OM&R 11 4 2.5 18 9 Total Allocation7 4,225 1,263 607 6,096
Construction Costs 3,775 1,120 510 5,405 IDC 152 62 27 241 Capitalized OM&R 298 81 71 450 Average Annual OM&R 17 5 3.1 25 All values are expressed in 2012 dollars. IDC = Interest During Construction; OM&R = Operations, Maintenance and Replacement 1. Benefits from Reclamation and Ecology, (2012b). 2. Construction Cost from Reclamation and Ecology 2012c. 3. Lesser of values from Row 2 and Row 3. 4. Total costs of all project elements that are unique to just one purpose. 5. Values from Row 4 minus values from Row 5. 6. Using total column at far right, subtract value in Row 5 from value in Row 1. Then allocate the resulting value to the
purposes, using percentages from Row 7. 7. Total allocation is the sum of Specific Costs from Row 5 and Remaining Joint Costs from Row 8.
Yakima River Basin Integrated Plan 77 Framework for Implementation Report
References Barwin, B. 2012. Personal Communication. Washington Department of Ecology, Water
Manager. August 2012.
Bell, K., D. Huppert, and R. Johnson. 2003. “Willingness to Pay for Local Coho Salmon Enhancement in Coastal Communities.” Marine Resource Economics. 18: 15-31.
Brewer, J., R. Glennon, A. Ker, and G.D. Liebcap. 2007. Water Markets in the West: Prices, Trading, and Contractual Forms. Working Paper 13002. National Bureau of Economic Research. March 2007.
Bureau of Reclamation. (Reclamation). 2000. Reclamation Manual – Directives and Standards for Feasibility Studies, CMP 05-02. May 2000. U.S. Department of the Interior, Bureau of Reclamation.
Bureau of Reclamation (Reclamation). 2008a. Economics Technical Report for the Yakima River Basin: A Component of Yakima River Basin Water Storage Feasibility Study, Washington. Technical Series No. TS-YSS-23.
Bureau of Reclamation (Reclamation). 2008b. Yakima River Basin Water Storage Feasibility Study Final Planning Report/Environmental Impact Statement. December 19, 2008.
Bureau of Reclamation (Reclamation). 2010. Yakima Hydromet ARCHIVE Data Access. Retrieved on May 17, 2010 from http://www.usbr.gov/pn/hydromet/yakima/ yakwebarcread.html
Bureau of Reclamation (Reclamation), Mid-Pacific Region. 2011. Shasta Lake Water Resources Investigation: Economic Valuation Appendix. Draft. November 2011.
Bureau of Reclamation and Washington State Department of Ecology (Reclamation and Ecology). 2008. Draft Planning Report/Environmental Impact Statement for the Yakima River Basin Water Storage Feasibility Study. U.S. Department of the Interior, Bureau of Reclamation and Washington State Department of Ecology.
Bureau of Reclamation and Washington State Department of Ecology (Reclamation and Ecology). 2010. Draft Environmental Impact Statement, Cle Elum Dam Fish Passage Facilities and Fish Reintroduction Project. January 2010. U.S. Department of the Interior, Bureau of Reclamation and Washington State Department of Ecology.
Bureau of Reclamation and Washington State Department of Ecology (Reclamation and Ecology). 2011a. Cle Elum Dam Fish Passage Facilities and Fish Reintroduction Project Final EIS. April 2011.
Bureau of Reclamation and Washington State Department of Ecology (Reclamation and Ecology). 2011b. Costs of the Integrated Water Resource Management Plan Technical Memorandum. Prepared by HDR Engineering, Inc. and Anchor QEA. March 2011.
Bureau of Reclamation and Washington State Department of Ecology (Reclamation and Ecology). 2011c. Modeling of Reliability and Flows Technical Memorandum. Prepared by HDR Engineering, Inc. and Anchor QEA. June 2011.

Yakima River Basin Integrated Plan 78 Framework for Implementation Report
Bureau of Reclamation and Washington State Department of Ecology (Reclamation and Ecology). 2011d. Proposed Integrated Water Resource Management Plan (Volume 1 of Yakima River Basin Study) and Technical Appendices (Volume 2 of Yakima River Basin Study). April 2011.
Bureau of Reclamation and Washington State Department of Ecology (Reclamation and Ecology). 2011e. Water Needs for Out-of-Stream Uses Technical Memorandum. Prepared by HDR Engineering, Inc. and Anchor QEA. June 2011.
Bureau of Reclamation and Washington State Department of Ecology (Reclamation and Ecology). 2011f. Yakima River Basin Integrated Water Resource Management Plan: Draft Programmatic Environmental Impact Statement. November 2011.
Bureau of Reclamation and Washington State Department of Ecology (Reclamation and Ecology). 2012a. Cost Risk Assessment of Six Projects from the Proposed Integrated Water Resource Management Plan. Technical Memorandum. June 2012.
Bureau of Reclamation and Washington State Department of Ecology (Reclamation and Ecology). 2012b. Four Accounts Analysis of the Integrated Plan. Technical Memorandum. September 2012.
Bureau of Reclamation and Washington State Department of Ecology (Reclamation and Ecology). 2012c. Preliminary Cost Allocation for the Integrated Water Resource Management Plan. Technical Memorandum. August 2012.
Bureau of Reclamation and Washington State Department of Ecology (Reclamation and Ecology). 2012d. Yakima River Basin Integrated Water Resource Management Plan: Final Programmatic Environmental Impact Statement. March 2012.
Bureau of Reclamation and Yakama Nation. 2006. Settlement Agreement between U.S. Bureau of Reclamation and Yakama Nation Regarding Endangered Species Act Compliance for Keechelus Dam Reconstruction.
DHM Research and Earthfix. 2011. Public Opinion Survey. Retrieved on April 5, 2012, from www.scribd.com/doc/74972940/EarthFix-Survey-Web-Version.
Ecology, see Washington State Department of Ecology.
Federal Register (76 Federal Register 73674). 2011. Change in Discount Rate for Water Resources Planning. November 29, 2011.
Fish Passage Center. 2011. Query Annual Adult Salmon Totals by Project. Retrieved on March 21, 2012, from http://www.fpc.org/adultsalmon/adultqueries/Adult_Annual_ Totals_Query_form.html.
Goodstein, E. and L. Matson. 2007. “Climate Change in the Pacific Northwest: Valuing Snowpack Loss for Agriculture and Salmon Frontiers.” Environmental Valuation and Policy. Edward Elgar New York.
Graham, A. (HDR), 2012. Estimate of Municipal and Domestic Ground Water Usage Above Parker. Memorandum. August 2, 2012.
Hop Growers of America. 2005. 2005 Statistical Report; Hop Growers of America. 2010. 2010 Statistical Report.

Yakima River Basin Integrated Plan 79 Framework for Implementation Report
Horowitz, J. and K. McConnell. 2000. “Willingness to Accept, Willingness to Pay, and the Income Effect.” Journal of Economic Behavior & Organization. 51(4): 537-545.
Hubble, J. 2012. Yakima River Basin Integrated Water Resource Management Plan, Final Programmatic Environmental Impact Statement, Fish Benefits Analysis Technical Memorandum. U.S. Bureau of Reclamation. June 2012.
Huppert, D., G. Green, W. Beyers et al. 2004. Economics of Columbia River Initiative. Washington State Department of Ecology and Columbia River Initiative Economics Advisory Committee. Retrieved April 1, 2012, from www.ecy.wa.gov/ PROGRAMS/wr/cri/Images/PDF/crieconrept_fnl.pdf.
Layton, D., G. Brown, and M. Plummer. 1999. Valuing Multiple Programs to Improve Fish Populations. Washington State Department of Ecology. April 1999.
Loomis, J. 1996. "Measuring the Economic Benefits of Removing Dams and Restoring the Elwha River: Results of a Contingent Valuation Survey." Water Resources Research. 32(2):441-447.
Montgomery, C. and T. Helvoigt. 2006. “Changes in Attitudes about Importance of and Willingness to Pay for Salmon Recovery in Oregon.” Journal of Environmental Management. 78(4): 330-340.
National Marine Fisheries Service, Northwest Region. 2011. Columbia River Estuary ESA Recovery Plan Module for Salmon and Steelhead. January 2011. Retrieved on March 28, 2012, from http://www.nwr.noaa.gov/Salmon-Recovery-Planning/ESA-Recovery-Plans/estuary-module.cfm.
National Research Council. 2004. “Managing the Columbia River: Instream Flows, Water Withdrawals, and Salmon Survival.” National Academies Press. pp. 6-7. Retrieved on April 5, 2012, from http://www.nap. edu/catalog.php?record_id=10962.
Northwest Power and Conservation Council. 2000. Return to the River. Council Document 2000-12. Retrieved on March 28, 2012, from http://www.nwcouncil.org/library/return/2000-12.htm.
Niemi, E. 2009. An Overview of Potential Economic Costs to Washington of a Business-As-Usual Approach to Climate Change. University of Oregon, Climate Leadership Initiative.
Olsen, D., J. Richards, and R. Scott. 1991. "Existence and Sport Values for Doubling the Size of Columbia River Basin Salmon and Steelhead Runs." Rivers. 2(1):44-56.
Oregon Department of Fish and Wildlife. 2012. Local Fisheries. Retrieved on April 3, 2012, from www.dfw.state.or.us/fish/OSCRP/CRM/comm_fishery_updates_11.asp.
Oregon Department of Fish and Wildlife. 2012. Willamette Falls Annual Fish Passage Counts (1946-2011). Retrieved on March 20, 2012, from http://www.dfw.state.or.us/fish/.fish_counts/ willamette%20falls.asp.
Oregon Office of Economic Analysis. 2004. State and County Population Forecasts and Components of Change, 2000 to 2040. Retrieved on March 21, 2012, from http://www.oregon.gov/DAS/OEA/ demographic.shtml.
Yakima River Basin Integrated Plan 80 Framework for Implementation Report
Pate, J. and J. Loomis. 1997. “The Effect of Distance on Willingness to Pay Values: A Case Study of Wetlands and Salmon in California.” Ecological Economics. 20: 199-207.
Reclamation, see Bureau of Reclamation.
Reclamation and Ecology, see Bureau of Reclamation and Washington State Department of Ecology.
Richardson, L., and J. Loomis. 2009. “The Total Economic Value of Threatened, Endangered and Rare Species: An Updated Meta-Analysis.” Ecological Economics. 68: 1535-1548.
Rosenberger, R.S. and Loomis, J.B. 2001. Benefit Transfer of Outdoor Recreation Use Values: A Technical Document Supporting the Forest Service Strategic Plan (2000 revision). General Technical Report RMRS-GTR-72. Fort Collins, CO: U.S. Department of Agriculture, Forest Service, Rocky Mountain Research Station. Retrieved February 21, 2012, from http://www.fs.fed.us/rm/pubs/ rmrs_gtr072.pdf.
RTI International. 2012. Klamath River Basin Restoration Nonuse Value Survey. U.S. Bureau of Reclamation. January 2012.
Scott, M.J, et al. 2004. “Water Exchanges: Tools to Beat El Niño Climate Variability in Irrigated Agriculture.” Journal of the American Water Resources Association. 40 (1): 15-31.
Tietenberg, T. 2000. Environmental and Natural Resource Economics. 5th ed. Reading, Massachusetts: Addison Wesley Longman, Inc. p. 37.
U.S. Bureau of Labor Statistics. 2012. Consumer Price Index. Retrieved on May 5, 2012, from ftp://ftp.bls.gov/pub/special.requests/cpi/cpiai.txt.
U.S. Census Bureau. 2010. 2010 U.S. Census, Households and Families, QT-P11.U.S.
U.S. Census Bureau. 2010. Median Household Income by State – Single-year Estimates. Retrieved on June 14, 2012, from http://www.census.gov/hhes/www/income/data/statemedian/.
U.S. Department of Agriculture (USDA). 2012. “2012-21 Long-Term Agricultural Projections.” Retrieved June 14, 2012, from http://www.ers.usda.gov/Features/baseline/.
U.S. Department of Agriculture, Economic Research Service. 2012. Economics, Statistics and Market Information System. Retrieved on April 16, 2012, from http://usda.mannlib.cornell.edu/ MannUsda/homepage.do.
U.S. Department of Agriculture, National Agricultural Statistics Service. 1999-2011a. Agricultural Prices: Annual Summary. Retrieved on April 16, 2012, from http://usda.mannlib.cornell.edu/MannUsda/homepage.do.
U.S. Department of Agriculture, National Agricultural Statistics Service. 1999-2011b. Vegetable Annual Summary 1998-2011. Retrieved on April 16, 2012, from http://usda.mannlib. cornell.edu/MannUsda/homepage.do.
U.S. Department of Agriculture, National Agricultural Statistics Service. 2004. 2002 Census of Agriculture: Washington State and County Data. AC-02-A-47.
U.S. Department of Agriculture, National Agricultural Statistics Service. 2009A. 2007 Census of Agriculture: Washington State and County Data. AC-07-A-47.

Yakima River Basin Integrated Plan 81 Framework for Implementation Report
U.S. Department of Agriculture, National Agricultural Statistics Service. 2009B. 2007 Census of Agriculture: United States Summary and State Data. AC-07-A-51.
U.S. Department of Agriculture, National Agricultural Statistics Service. 1999-2011c. Non-citrus Fruits and Nuts Annual Summary 1998-2011. Retrieved on April 16, 2012, from http://usda.mannlib.cornell.edu/MannUsda /homepage.do.
U.S. Department of Agriculture, National Agricultural Statistics Service. 2011a. Table 4 – State-level Normalized Price Estimates for Commodities 2011. Retrieved on August 10, 2012, from http://www.ers.usda.gov/data-products/normalized-prices.aspx.
U.S. Department of Agriculture, National Agricultural Statistics Service. 2011b. Annual Statistical Bulletin: Washington. Retrieved on August 10, 2012, from http://www.nass.usda.gov/Statistics_by_State/Washington/Publications/Annual_ Statistical_Bulletin/2011/content11.asp.
U.S. Department of Agriculture, National Agricultural Statistics Service, Washington Field Office. No Date. Apples, Washington. Retrieved on April 16, 2012, from http://www.nass.usda.gov/Statistics_by_State/Washington/Historic_Data/fruit/apples.pdf.
U.S. Office of Management and Budget. 2003. Circular A-4: Regulatory Analysis. September 17, 2003.
U.S. Water Resources Council. 1983. Economic and Environmental Principles and Guidelines for Water and Related Land Resources Implementation Studies. In accordance with Section 103 of the Water Resources Planning Act of 1965 (Pub. L. 89-80), as amended (42 U.S.C. 1962a-2 and d-1).
U.S. Water Resources Council. 1983. Economic and Environmental Principles and Guidelines for Water and Related Land Resources Implementation Studies. March 1983.
Vacarro, J.J. 2011. River-Aquifer Exchanges in the Yakima River Basin, Washington. Scientific Investigations Report 2011-5026. U.S. Geological Survey. Retrieved on August 14, 2012, from http://pubs.usgs.gov/sir/2011/5026/.
Vano J.A., M.J. Scott, N. Voisin, C.O. Stockle, A.F. Hamlet, K.E. Mickelson, M. McGuire Elsner, and D.P. Lettenmaier. 2009. “Climate Change Impacts on Water Management and Irrigated Agriculture in the Yakima River Basin, Washington, USA.” Chapter 3 in The Washington Climate Change Impacts Assessment: Evaluating Washington’s Future in a Changing Climate, ed. M. McGuire Elsner, J/ Littell, L. Whitely Binder, pp. 132-163. The Climate Impacts Group, University of Washington, Seattle, WA
Washington State Department of Ecology (Ecology). 2007. Technical Report on Market-Based Reallocation of Water Resources Alternative. Publication 07-11-044. December 2007.
Washington State Department of Ecology (Ecology). 2008. SEPA Supplemental Draft EIS, Integrated Water Resource Management Alternative. Washington State Department of Ecology.
Washington State Department of Ecology (Ecology). 2009. Yakima River Basin Integrated Water Resources Management Alternative Evaluation and Final Environmental Impact Statement. Washington State Department of Ecology.

Yakima River Basin Integrated Plan 82 Framework for Implementation Report
Washington State Department of Ecology (Ecology). 2010. “Ecology Adopts Rule To Protect Kittitas Groundwater, Approves Water Connections to Support Economic Development.” December 22. Retrieved 7 August 2012 http://www.ecy.wa.gov/news/2010news/2010-331.html.
Washingtion State Office of Financial Management. 2011. Forecast of the State Population. November 2011.
Washington State University Extension. Various Years. Enterprise Budgets for Crop Commodities. Retrieved on August 10, 2012, from http://extecon.wsu.edu/pages/Enterprise_Budgets./
Water Resources Council. 1983. Federal Economic and Environmental Principles and Guidelines for Water and Related Land Resources Implementation Studies.
Yakima River Basin Water Enhancement Project (YRBWEP) Act. Public Law 103-434, October31, 1994, as amended by Public Law 105-62, October 13, 1997, and Public Law 106-372, October 27,2000.
Yakima River Basin Water Enhancement Project (YRBWEP), Phase 1, 1984. Public Law 98-381 Section 109 of the Hoover Powerplant Act of 1984.

Yakima River Basin Integrated Plan 83 Framework for Implementation Report
Glossary acre-foot The volume of water that could cover 1 acre to a depth of 1 foot.
Equivalent to 43,560 cubic feet or 325,851 gallons.
adjudication The judicial process through which the existence of a water right is confirmed by court decree.
anadromous Fish that migrate from saltwater to freshwater to breed. Going up rivers to spawn.
aquifer A water-bearing stratum of permeable rock, sand, or gravel.
aquifer storage and recovery (ASR)
A system that injects potable water via wells into aquifers during periods of excess capacity and withdraws the water for municipal supply during periods of peak demand or limited supply.
cfs Flow rate in cubic feet per second.
drought A condition of water-supply scarcity that requires the Yakima Project to reduce deliveries to proratable (junior) water users below their full entitlements.
dry year A year in which drought occurs, requiring the Yakima Project to limit deliveries to proratable (junior) water users below their full entitlements.
economic benefits An economics term measuring an increase in economic welfare (e.g., the value of goods and services available to consumers, and profit for producers). Gross economic benefits measure the total increase in economic welfare, without consideration of the costs incurred to achieve them. Net economic benefits account for the costs.
endangered species A species that is in danger of extinction throughout all or a significant portion of its range. To term a run of salmon “endangered” is to say that particular run is in danger of extinction.
Endangered Species Act 16 U.S.C. §1531 et seq. (1973). The Endangered Species Act (ESA) provides a program for the conservation of threatened and endangered plants and animals and the habitats in which they are found.

Yakima River Basin Integrated Plan 84 Framework for Implementation Report
Environmental Quality (EQ) This account provides the mechanism for displaying information relative to the effects of proposed alternatives on significant resources. “Significant” in this context means resources that are likely to have bearing on the decision-making process.
Feasibility Investigation Reports (feasibility study)
Detailed investigation specifically authorized by the U.S. Congress to determine the desirability of seeking congressional authorization for implementation of a preferred alternative.
fish passage Providing facilities or management approaches at existing dams to achieve up and downstream passage of targeted fish species.
flow The volume of water passing a given point per unit of time. Often measured in cubic feet per second (cfs).
groundwater infiltration A hydrologic process where surface water is diverted and conveyed to a designed recharge system (ponds, canals, or spreading areas), where water moves downward from to the ground surface into the groundwater.
habitat The combination of resources and the environmental conditions that promotes occupancy by individuals of a given species and allows those individuals to survive and reproduce.
harvest Ocean and in-river harvest (commercial, sport and Tribal) of fish.
instream flows Water flows within a defined stream channel. Instream flows may support aquatic habitat, wildlife, recreation, or aesthetics.
mainstem The principal channels (Yakima and Naches rivers) within the Yakima River Basin, into which all of the tributary streams in the drainage basin flow.
market reallocation Voluntary transfer of water rights from willing sellers to willing buyers, on a temporary or permanent basis.
mitigation To offset known impacts to an existing natural resource.
National Economic Development (NED)
The Federal objective is to contribute to national economic development consistent with protecting the Nation’s environment. The NED account measures the beneficial and adverse monetary effects of each alternative in terms of changes in the value of the national output of goods and services.
Yakima River Basin Integrated Plan 85 Framework for Implementation Report
National Environmental Policy Act (NEPA)
A Federal law that requires Federal Government agencies to consider the effects of their actions on environmental resources and the public and to seek public comment on those actions. 1969 as amended (Pub. L. 91-190, 42 U.S.C. 4321-4347, January 1, 1970, as amended by Pub. L. 94-52, July 3, 1975, Pub. L. 94-83, August 9, 1975, and Pub. L. 97-258, § 4(b), Sept. 13, 1982)
Other Social Effects (OSE) This account serves as a repository for alternative effects that are not reflected in the other three accounts. Examples may include safety and health issues, long-term productivity, energy consumption issues, and others.
Parker Gage A flow-measurement device on the Yakima River where the total water supply available (TWSA) is measured for the Yakima Project for the period April through September. The Parker gage is located just south of the City of Union Gap on the Yakima River.
Principles and Guidelines A Federal document that describes Economic and Environmental Principles and Guidelines for Water and Related Land Resources Implementation Studies.
proratable (entitlement/water rights)
Yakima Project junior water rights related to storage water that, in water-short years, receive less than their full right on a prorated basis. For the Yakima Basin, over half of the surface water entitlements are proratable under a 1945 Consent Decree, including all of the surface water supply for Roza Irrigation District and Kittitas Reclamation District, over half of the Yakama Nation’s Wapato Irrigation Project, a large share of the Sunnyside Division, and many other irrigation water right holders.
prorationing The process of equally reducing the amount of water delivered to junior (i.e., “proratable”) water right holders in dry years.
recruitment Ocean population at the mouth of the Columbia River, excluding any ocean harvest.
Regional Economic Development (RED)
This account evaluates the beneficial and adverse impacts of each alternative on the economy of the affected region, with particular emphasis on income and employment measures. The affected region reflects the geographic area where significant impacts are expected to occur. Impacts can be measured in both monetary and nonmonetary terms.
Yakima River Basin Integrated Plan 86 Framework for Implementation Report
RiverWare hydrologic model Yakima Project RiverWare model; a daily time-step reservoir and river operation computer model of the Yakima Project created with the RiverWare software.
State Environmental Policy Act (SEPA)
A state policy that requires state and local agencies to consider the likely environmental consequences of a proposal before approving or denying the proposal and provides for public comment (Chapter 43.21C RCW).
Storage Study Yakima River Basin Water Storage Feasibility Study; a multiyear evaluation completed in 2009 of the viability and acceptability of several storage augmentation alternatives, including a potential water exchange, for the benefit of fish, irrigation, and municipal water supply within the Yakima River Basin.
total water supply available (TWSA)
The total water supply available for the Yakima River Basin above the Parker gage for the period April through September.
water year The 12-month period from October through September. The water year is designated by the calendar year in which it ends and which includes 9 of the 12 months. For example, the year ending September 30, 1992, is called the “1992 water year.”
watershed The total land area draining to any point in a stream.
wilderness “A wilderness, in contrast with those areas where man and his own works dominate the landscape, is hereby recognized as an area where the earth and community of life are untrammeled by man, where man himself is a visitor who does not remain… an area of undeveloped Federal land retaining its primeval character and influence, without permanent improvements or human habitation, which is protected and managed so as to preserve its natural conditions” The Wilderness Act of 1964 (Public Law 88-577).
wild and scenic The National Wild and Scenic Rivers System was created by Congress in 1968 (Public Law 90-542; 16 U.S.C. 1271 et seq.) to preserve certain rivers with outstanding natural, cultural, and recreational values in a free-flowing condition for the enjoyment of present and future generations.

Yakima River Basin Integrated Plan 87 Framework for Implementation Report
Yakima Project A Federal land-reclamation project that provides irrigation water for a 175-mile strip of fertile land on both sides of the Yakima River in south-central Washington. There are seven divisions in the project: Storage, Kittitas, Tieton, Sunnyside, Roza, Kennewick, and Wapato. Storage dams and reservoirs on the project are Bumping Lake, Clear Lake, Tieton, Cle Elum, Kachess, and Keechelus. Other project features are 5 diversion dams, canals, laterals, pumping plants, drains, 2 powerplants, and transmission lines.