xxx convention on international trade in … · 1 original language: english cop17 prop. xxx...
TRANSCRIPT

1
Original language: English CoP17 Prop. XXX
CONVENTION ON INTERNATIONAL TRADE IN ENDANGERED SPECIES OF WILD FAUNA AND FLORA
____________________
Seventeenth meeting of the Conference of the Parties Johannesburg (South Africa), 24 September – 5 October 2016
CONSIDERATION OF PROPOSALS FOR AMENDMENT OF APPENDICES I AND II Annotation affecting the Zimbabwe population of Loxodonta africana on Appendix II
A. Proposal
Zimbabwe seeks to amend the present Appendix II listing of its population of Loxodonta
africana by removing the annotation (Annex I, page 24 of this proposal) in order to achieve an
unqualified Appendix II listing. Effective and sustainable conservation of Zimbabwe's elephants is
wholly dependent on establishing regular open market sales of elephant ivory to fund management
and enforcement actions.
Zimbabwe is fully aware that the annotation affecting the Appendix II listing of Loxodonta
africana contains the clause –
“no further proposals to allow trade in elephant ivory from populations already in
Appendix II shall be submitted to the Conference of the Parties for the period from
CoP14 and ending nine years from the date of the single sale of ivory that is to take
place in accordance with provisions in paragraphs g) i), g) ii), g) iii), g) vi) and g)
vii).”
– however, Zimbabwe does not believe that an annotation can be used to contradict the right
enshrined in Article XV Para 1(a) of the Treaty stating that “Any Party may propose an
amendment to Appendix I or II for consideration at the next meeting [of the Conference of the
Parties].”
B. Proponent
Zimbabwe

2
C. Supporting Statement
1. Taxonomy
1.1 Class Mammalia
1.2 Order Proboscidea
1.3 Family Elephantidae
1.4 Genus Loxodonta Species africana
1.5 Scientific synonyms – none
1.6 Common name African savanna elephant
1.7 Code numbers CITES A-115.001.002.001, ISIS 5301415001002001001
2. Overview
Resolution Conf.11.21 (Rev.CoP16) makes the distinction between annotations for reference
purposes and substantive annotations. The latter are generally used to qualify the permitted
extent of trade in Appendix II species. An examination of Fauna listed on Appendix II suggests
that most of the annotations are ‘enabling’ – that is, they permit trade (constrained by quotas) in
situations where the remainder of range states’ populations are listed on Appendix I (e.g. vicuna
and crocodiles). The annotation for Loxodonta africana is entirely different. It is a long list of
proscriptions constraining the trade in elephant specimens. These constraints are assessed in
Annex 2 (page 25).
Zimbabwe is fully aware that substantive annotations relating to species in Appendix I or II may
be introduced, amended or deleted only by the Conference of the Parties in accordance with Article
XV of the Convention (Conf.11.21 (Rev CoP 16) para c)).
The listing of the continental population of Loxodonta africana on Appendix I in 1989 was not
justified by any scientific criteria and is probably still not justified – the Status Reports of the African
Elephant Database do not show a decline in the global population over the past 19 years (section
4 page 7).
At CoP7 in 1989 the CITES Parties recognised that the elephant populations in several range
states did not qualify for Appendix I listing and made provisions for them to be returned to Appendix
II on submission of proposals. Eight years passed before the transfer to Appendix II took place
and it took a further two years before the first ivory sale happened. Under the Articles of the
Convention, Zimbabwe and the other range states named in the annotation were entitled to expect
that normal Appendix II trade would resume after CoP10 in 1997. The annotation on the Appendix
II listing has prevented this.
CITES Doc. 11.31.1 is titled “Experimental Trade in Ivory” and the title re-occurs on various
other documents. Zimbabwe wonders exactly what is to be understood by the word ‘experimental’.
Certainly, the Appendix II countries did not see it as experimental. As an experiment it is
scientifically flawed as there is no alternative trading system to compare it with and the trade is so
constrained by the annotation that it does resemble any normal market-based trade. There have
3
been only two ‘one-off sales’ (1999 and 2008)1 and the Appendix II countries realised only a
fraction of the value of their ivory at these sales (Martin et al. 2012).
The ivory trade ban has been a failure. CITES has had 27 years to evaluate the experiment
and, far from the ban being part of the solution to illegal elephant killing in Africa, it must be seen
as part of the problem (subsection 6.5 page 15). In the ITRG (1989) report and in their book,
Barbier et al. (1990) drew attention to the need to provide incentives for elephant conservation if
a ban was not to have negative impacts on elephants. The decisions that have been taken by the
CITES Parties do not readily lend themselves to developing or providing incentives to conserve
elephants.
The CITES Secretariat submitted a far-sighted document titled Economic Incentives and Trade
Policy to CoP 12 in Santiago, Chile in 2002 (Doc.18). This document opened the prospect of
cooperation with the CBD, UNEP, OECD, ICTSD, UNCTAD-BIOTRADE, TRAFFIC and, most
importantly, with the WTO on economic incentives. In the preambular section the Secretariat
noted (para 34) that there is a tension between WTO and CITES arising from the latter treaty’s
use of ‘stricter domestic measures’2
The Secretariat’s proposal for building greater synergy with other MEAs and with the WTO was
rejected. Many of the CITES Parties displayed a knee-jerk reaction against the suggestion that
economic incentives should be considered. They were more comfortable with ‘stricter domestic
measures’ and trade bans. This is a major problem for those developing countries committed to
land use based on wildlife.
The regulations that are available to CITES do not readily lend themselves to developing, or
providing, incentives to conserve elephants. In part this is because bans and intermittent sales of
stockpiled ivory, cannot, by their very nature, include the potential benefits from sustainable use
(Martin et al. 2012).
In acceding to CITES in 1981, Zimbabwe ratified the Articles of the Convention. The present
annotation pertaining to its elephant population on Appendix 2 has departed a long way from
Article IV of the treaty. Zimbabwe views the annotation as ultra vires.
In 1992 at CoP 8 in Kyoto Zimbabwe proposed and the Parties adopted a resolution
recognising the “Benefits of Trade” (Conf.8.3 (Rev CoP 13). An important feature of this resolution
is that it is independent of the Appendix on which a species is listed. If trade is deemed beneficial
for a species then there is no reason why it should not be applied in the case of an Appendix I
species – no matter how endangered it is. However, so far CITES has been unable to implement
the resolution.
A legal trade in ivory would be beneficial for the Zimbabwe elephant population. Without it,
elephants are likely to become extinct in Zimbabwe. This trade would be conducted in the manner
in which Zimbabwe sold ivory from 1977-1989 by open auction to all bidders from any country in
1 . Stiles (2012) states – “The two 'one-off' sales have unfortunately led to a lot of unnecessary and irrelevant controversy. As long
as a ban is in place, illegal trade is going to carry on regardless of whether there is legal ivory circulating in the system or not.
There is no need to launder it – the illegal trade carries on as usual.”
2 . Wijnstekers (1990, Note 95) notes the conflicts between measures taken under CITES and measures taken under GATT where
Parties are bound to “accord to the commerce of the other contracting Parties treatment no less favourable than that provided
for in the appropriate schedule ....”. Another provision of GATT (Article XI 1.) provides that “no contracting Party shall
prohibit or restrict imports of products originating in other contracting
Parties ....”
4
the world. Zimbabwe knows that it works. As with crocodiles in Zimbabwe, the legal trade
destroyed the illegal trade (Hutton & Webb, 2002), eliminated opportunities for corruption and
provided transparency.
3. Species characteristics
Much of the following is not relevant to Zimbabwe’s proposal: however it is included, firstly, to
satisfy the requirements of Conf. 9.24 (Rev. CoP16) and, secondly, because there are some
important general conclusions that can be drawn from the available data.
3.1 Distribution
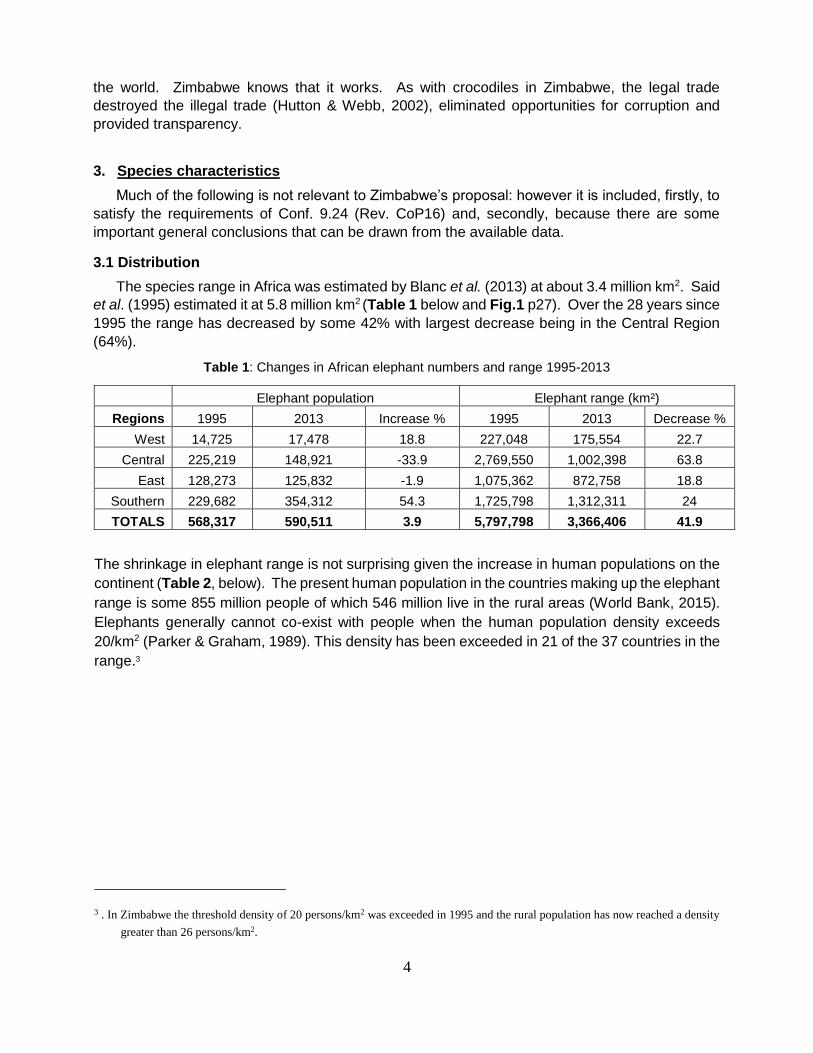
The species range in Africa was estimated by Blanc et al. (2013) at about 3.4 million km2. Said
et al. (1995) estimated it at 5.8 million km2 (Table 1 below and Fig.1 p27). Over the 28 years since
1995 the range has decreased by some 42% with largest decrease being in the Central Region
(64%).
Table 1: Changes in African elephant numbers and range 1995-2013
Elephant population Elephant range (km²)
Regions 1995 2013 Increase % 1995 2013 Decrease %
West 14,725 17,478 18.8 227,048 175,554 22.7
Central 225,219 148,921 -33.9 2,769,550 1,002,398 63.8
East 128,273 125,832 -1.9 1,075,362 872,758 18.8
Southern 229,682 354,312 54.3 1,725,798 1,312,311 24
TOTALS 568,317 590,511 3.9 5,797,798 3,366,406 41.9
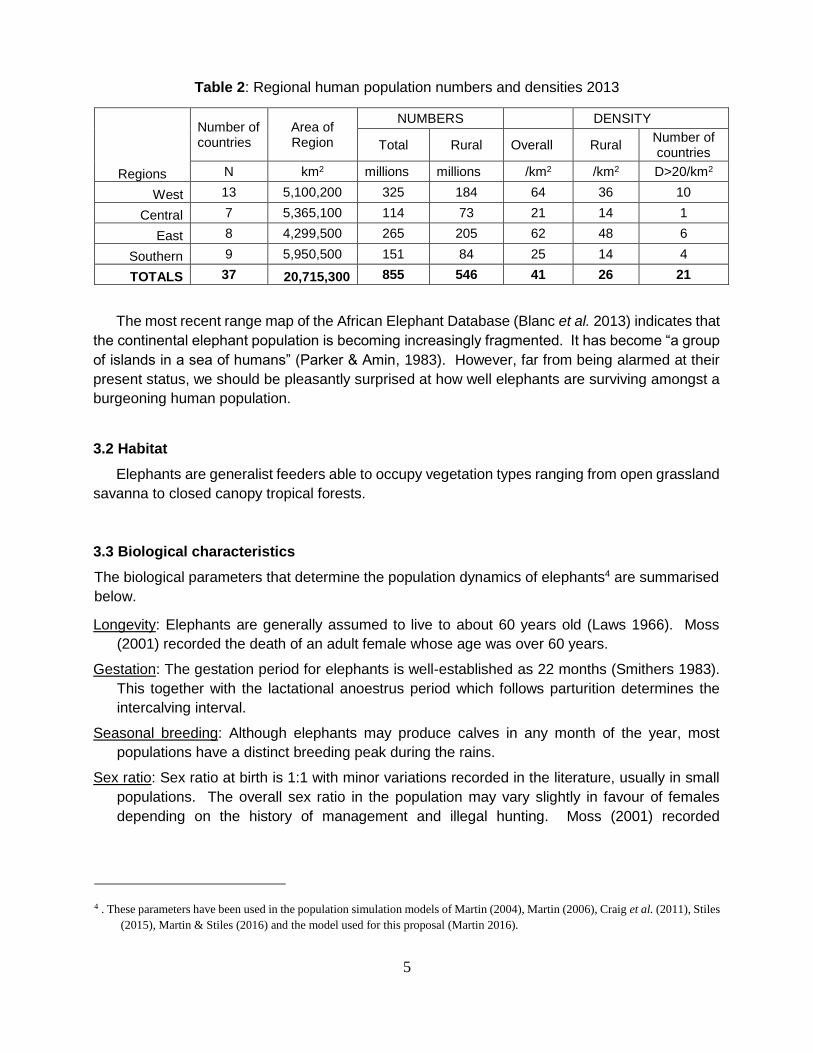
The shrinkage in elephant range is not surprising given the increase in human populations on the
continent (Table 2, below). The present human population in the countries making up the elephant
range is some 855 million people of which 546 million live in the rural areas (World Bank, 2015).
Elephants generally cannot co-exist with people when the human population density exceeds
20/km2 (Parker & Graham, 1989). This density has been exceeded in 21 of the 37 countries in the
range.3
3 . In Zimbabwe the threshold density of 20 persons/km2 was exceeded in 1995 and the rural population has now reached a density
greater than 26 persons/km2.
5
Table 2: Regional human population numbers and densities 2013
Regions
Number of countries
Area of Region
NUMBERS DENSITY
Total Rural Overall Rural Number of countries
N km2 millions millions /km2 /km2 D>20/km2
West 13 5,100,200 325 184 64 36 10
Central 7 5,365,100 114 73 21 14 1
East 8 4,299,500 265 205 62 48 6
Southern 9 5,950,500 151 84 25 14 4
TOTALS 37 20,715,300 855 546 41 26 21
The most recent range map of the African Elephant Database (Blanc et al. 2013) indicates that
the continental elephant population is becoming increasingly fragmented. It has become “a group
of islands in a sea of humans” (Parker & Amin, 1983). However, far from being alarmed at their
present status, we should be pleasantly surprised at how well elephants are surviving amongst a
burgeoning human population.
3.2 Habitat
Elephants are generalist feeders able to occupy vegetation types ranging from open grassland
savanna to closed canopy tropical forests.
3.3 Biological characteristics
The biological parameters that determine the population dynamics of elephants4 are summarised
below.
Longevity: Elephants are generally assumed to live to about 60 years old (Laws 1966). Moss
(2001) recorded the death of an adult female whose age was over 60 years.
Gestation: The gestation period for elephants is well-established as 22 months (Smithers 1983).
This together with the lactational anoestrus period which follows parturition determines the
intercalving interval.
Seasonal breeding: Although elephants may produce calves in any month of the year, most
populations have a distinct breeding peak during the rains.
Sex ratio: Sex ratio at birth is 1:1 with minor variations recorded in the literature, usually in small
populations. The overall sex ratio in the population may vary slightly in favour of females
depending on the history of management and illegal hunting. Moss (2001) recorded
4 . These parameters have been used in the population simulation models of Martin (2004), Martin (2006), Craig et al. (2011), Stiles
(2015), Martin & Stiles (2016) and the model used for this proposal (Martin 2016).

6
significantly higher mortalities for males (which included anthropogenic mortality) than for
females over their entire lifetime.
The next four parameters are the main determinants of the rate of increase of elephant
populations and they are typical of the large savanna populations in southern Africa.
Age at first parturition: A considerable range of values have been recorded in the scientific
literature (8-20 years old). In the population simulation models referred to in the footnote
below, 12 years is chosen as the typical age of first parturition for a population below carrying
capacity. The lower end of the range for age at first parturition is about 10 years and the
upper end is about 20 years.5
Intercalving interval: Female elephants generally produce a calf every four years throughout their
main breeding lifetime (i.e. a fecundity of 0.25 including calves of both sexes). Freeman et al.
(2008) found considerable variation in this parameter (2.3-5.3 years) over the years 1976-1995
Kruger National Park.
The highest recorded mean calving interval is that of 9.1 years reported by Laws et al. (1970)
for Murchison Falls Park North, Uganda. Fecundity declines in the last 10-20 years of life.6
Mortality: Both juvenile and adult mortality are ‘open-ended’ variables. There is no limit as to how
high they can get. Because of this open-ended nature of mortality as a variable, it is capable
of exerting a far greater influence on population growth than either fecundity or age at first
conception.
Data on adult mortality are scant. Craig (1992) gives perhaps the most insightful analysis of the
rôle of mortality in large increasing elephant populations (the Sebungwe region in Zimbabwe)
and shows that it must be about 0.5% between 10 and 40 years of age.
Juvenile mortality refers to mortality in the first 9 years of life. A ‘typical’ value for the first year of
life is 8% pa (Moss 2001) decreasing to 0.5% at 10 years old.
3.4 Morphological characteristics
The physical appearance of elephants is sufficiently well-known through media coverage that
it is unnecessary to go into detail here. Smithers (1983) and MacDonald (2001) provide an
excellent description.
5 . Laws et al. (1975) recorded conception being delayed until about 20 years of age in a high density population in Uganda
(Murchison Falls Park South).
6 .Over the last 20 years of a female’s lifetime the population simulation model reduces fecundity from 0.25 to 0.01.
7
3.5 Role of the species in the ecosystem
When elephant densities exceed 0.5 per km2, savanna woodlands are generally converted to
shrublands or grasslands. Craig (1989) examined the relationship between elephant densities
and canopy tree cover using data from several studies in Zimbabwe’s protected areas. He found
that at elephant densities exceeding 0.5/km2 canopy cover is reduced to less than 50%. Craig
concluded that the results imply “... that the habitats concerned developed in the presence of
elephants, though at lower densities than the present ones. ... This helps to allay the fear that by
reducing elephant densities to retain the original woodlands we are trying to do the impossible,
because elephants are just incompatible with these habitats. It is rather that elephants played a
formative role in the development of these ecosystems (Owen-Smith 1987).”
Cumming et al. (1997) examined species richness of woody plants, birds, bats, mantises and
ants in Zambezi Valley reserves where elephants had destroyed the miombo woodland and in
adjacent but intact miombo woodlands outside the reserves. They found the species richness was
significantly lower where elephants had removed the tree canopy.
“Preserving large populations of elephants while maintaining biodiversity in national parks
and protected areas in East and southern Africa is becoming increasingly problematic. The
problem is further compounded by international public pressures against reducing elephant
densities within game reserves while, outside these protected areas, savanna woodlands
and their associated faunas are being lost to agriculture. Where then will refugia for habitat-
sensitive species exist if not within the region's largest protected areas? In southern Africa
human and elephant populations are growing at rates of about 3% and 5% per annum
respectively and in some areas wildland is being converted to subsistence agriculture at
similar rates. The results are further reductions in elephant range, increased density of
elephants within protected areas and human expansion into marginal lands. Together
these processes are leading to the deforestation of large areas of savanna woodland of
high biodiversity but low agricultural productivity. Besides affecting biodiversity,
deforestation, particularly of upland woodlands, is likely to affect seasonal patterns of water
storage, discharge and stream flow from otherwise protected landscapes.”
If this proposal is successful it will provide the necessary funding to manage Zimbabwe’s elephant
population to avoid densities exceeding 0.5/km2.
4. Status and trends
There were more elephants in Africa in 2013 than there were in 1995 (Table 1 page 4). The
population of the Central Region has decreased by about one-third since 1995 but the deficit has
been made up by the doubling of the Southern Africa population.
This calls into question the fundamental functioning of CITES. If the global population of a
species is not threatened with extinction, it should be listed on Appendix II. The present trend is
that if the status of any national population gives rise to concern then the global population is listed
on Appendix I. Logically, the nation concerned should use its own legislation and law enforcement
to prohibit trade and protect the species without requiring the species populations of other
countries to be listed on Appendix I.

8
4.1 Habitat trends
Zimbabwe has four main elephant subpopulations located in the regions shown in Fig.2 (page
28). The habitats in all of these regions fall in the category of semi-arid savannas (White 1983)
and, as such, are vulnerable to the impact of elephants described on the previous page. Despite
significant illegal hunting in the Sebungwe and Zambezi Valley regions in recent years, elephant
densities in 3 of the 4 regions exceeds 0.5 animals/km2 (Table 3 below).
Table 3. Elephant regional populations and densities in Zimbabwe7
ZIMBABWE REGIONS
Matebeleland
North Zambezi Valley Sebungwe Gonarezhou TOTALS
Area (km²) 24,959 17,003 15,527 5,339 62,828
Elephant Numbers 2014 53,991 11,657 3,407 11,452 80,507
Elephant Density (/km²) 2.2 0.7 0.2 2.1 1.3
The impact of elephants on the vegetation in these regions has been severe since the 1970s
and is described in Martin et al. (2015, Appendices, p54-55).
4.2 Population size
The estimated numbers of elephants in the four regions are shown in Table 3 above and Fig.3
(page 29). Including Save Conservancy and various small populations outside the survey areas,
the total number for Zimbabwe rises to 84,512 elephants.
4.3 Population structure
All of the subpopulations are depleted in the upper age classes to a variable extent dependent
on the past history of illegal hunting, problem animal control, legal harvesting and trophy hunting.
Some indications of these offtakes are given in the captions to the figures listed in the next
subsection.
4.4 Population trends
A population simulation model (Footnote 3) has been used to approximate and explain the
trends in the four regions over the period 2001-2014 (Figs. 4, 5, 6, 7). In each region the
population has been split into two parts – the “Parks population” which is not subject to trophy
hunting and the “Hunted population” where trophy hunting is permitted. The key results from this
simulation are that (a) the Hunted part of the Sebungwe population will go extinct this year and
the Parks part will go extinct next year, and (b) the Hunted part of the Zambezi Valley population
will go extinct in 2021 and the Parks part will go extinct a few years later.
Far from these alarming projections being arguments for increased law enforcement effort and
renewed efforts to enforce the ivory trade ban, the opposite is true. Unless the ivory trade ban is
7 .These are the figures for the surveyed areas. The figures for Gonarezhou do not include Save Conservancy.
9
lifted, these populations almost certainly will go extinct (Stiles 2014). At face value, the seemingly
extinction projected by the simulation model has resulted in increased calls for law enforcement
and ivory trade bans as possible solutions. It is actually the lifting of the ivory trade bans that will
assist in halting the population decline. Lifting the trade ban will give Parties an opportunity to
explore and manage a well-regulated trade in elephant and elephant products. In addition, ivory
trade will certainly generate revenue for rural communities thereby providing further incentives for
elephant conservation.
4.5 Geographic trends
In the narrow context of Zimbabwe, this subsection is irrelevant.
5. Threats
Illegal hunting is by far the biggest proximate threat to elephants in the Sebungwe and Zambezi
Valley but, in the longer term, the high densities in Matableleland North and the Gonarezhou
ultimately pose an equally serious threat. The overabundance of elephants could result in whole-
scale population die-offs8 and, at the same time, the destruction of habitats will jeopardise the
survival of other species.
8 . In Hwange National Park small-scale die-offs occurred in 2005 and 2012.
10
6. Utilisation and trade
6.1 National utilisation
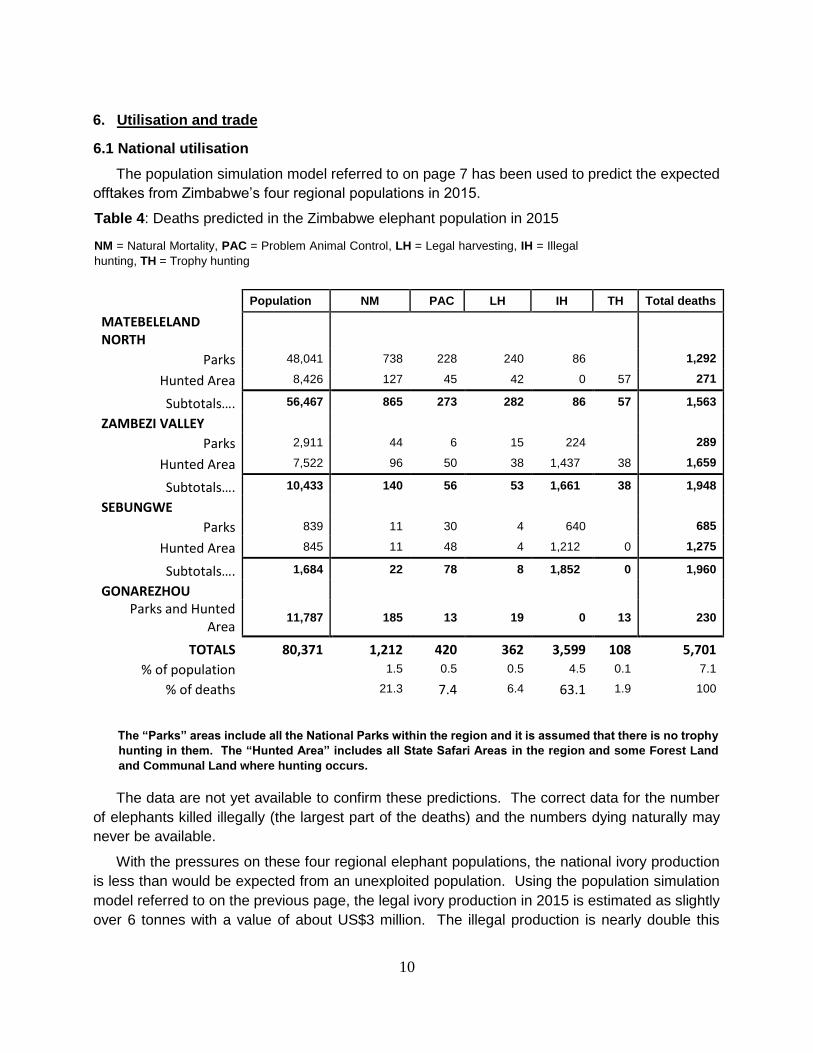
The population simulation model referred to on page 7 has been used to predict the expected
offtakes from Zimbabwe’s four regional populations in 2015.
Table 4: Deaths predicted in the Zimbabwe elephant population in 2015
NM = Natural Mortality, PAC = Problem Animal Control, LH = Legal harvesting, IH = Illegal
hunting, TH = Trophy hunting
Population NM PAC LH IH TH Total deaths
MATEBELELAND NORTH
Parks 48,041 738 228 240 86 1,292
Hunted Area 8,426 127 45 42 0 57 271
Subtotals…. 56,467 865 273 282 86 57 1,563
ZAMBEZI VALLEY
Parks 2,911 44 6 15 224 289
Hunted Area 7,522 96 50 38 1,437 38 1,659
Subtotals…. 10,433 140 56 53 1,661 38 1,948
SEBUNGWE
Parks 839 11 30 4 640 685
Hunted Area 845 11 48 4 1,212 0 1,275
Subtotals…. 1,684 22 78 8 1,852 0 1,960
GONAREZHOU
Parks and Hunted Area
11,787 185 13 19 0 13 230
TOTALS 80,371 1,212 420 362 3,599 108 5,701
% of population 1.5 0.5 0.5 4.5 0.1 7.1
% of deaths 21.3 7.4 6.4 63.1 1.9 100
The “Parks” areas include all the National Parks within the region and it is assumed that there is no trophy
hunting in them. The “Hunted Area” includes all State Safari Areas in the region and some Forest Land
and Communal Land where hunting occurs.
The data are not yet available to confirm these predictions. The correct data for the number
of elephants killed illegally (the largest part of the deaths) and the numbers dying naturally may
never be available.
With the pressures on these four regional elephant populations, the national ivory production
is less than would be expected from an unexploited population. Using the population simulation
model referred to on the previous page, the legal ivory production in 2015 is estimated as slightly
over 6 tonnes with a value of about US$3 million. The illegal production is nearly double this

11
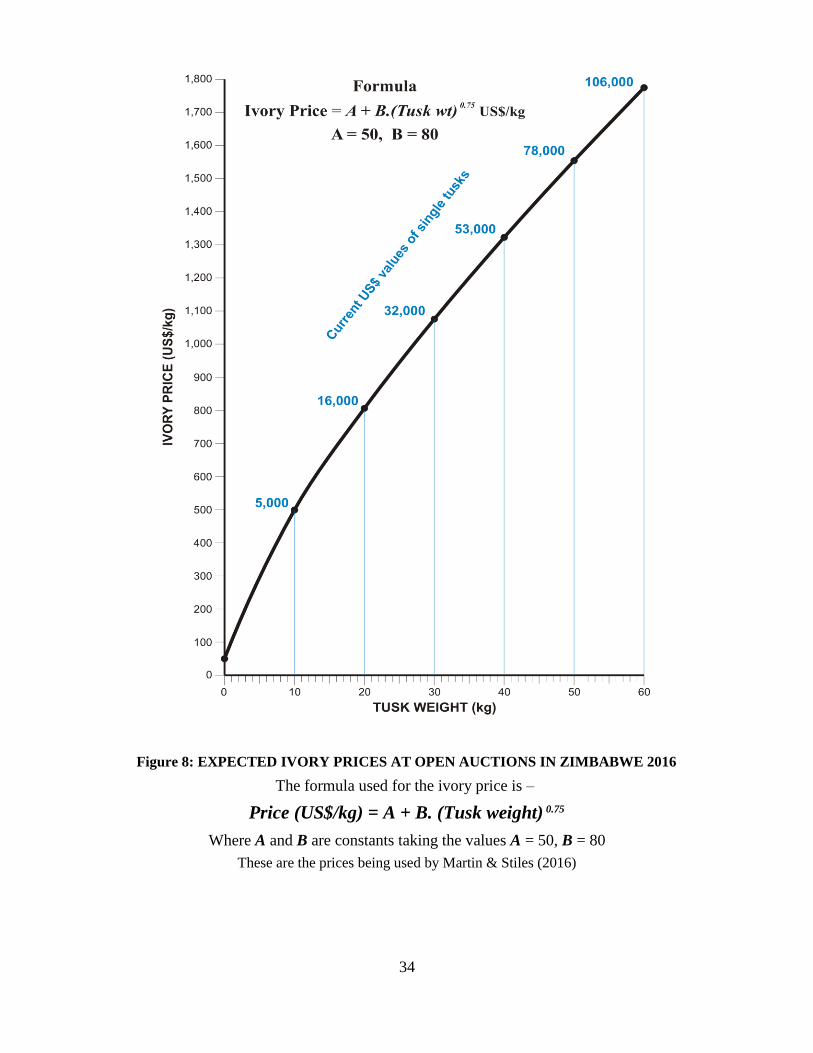
amount (11.5 tonnes) but its value is not much greater (about US$3.2 million).9 The price of ivory
has risen since the ban on international trade came into place in 1989 and Bradley-Martin & Vigne
(2014) noted that it had increased three-fold in China since 2010.10 The prices assumed for this
proposal are shown in Fig. 8 (page 34).
Zimbabwe presently holds about 70 tonnes of raw ivory in the government ivory store
estimated to be worth about US$35 million if it were sold on open auctions in the manner done by
Zimbabwe from 1977 to 1989. The merits of this method of sale are described by Child (1995)
and it is Zimbabwe’s chosen way of disposing of raw ivory.11
6.2 Legal trade
The UNEP WCMC CITES Trade database (CITES cfm 2016) has been used to examine all
elephant exports from Zimbabwe over the period 1980-2014 (data for the year 2014 are
incomplete). The total record of exports including all parts and derivatives amounts to 8,556
entries in the database. The largest importer is the United States which is responsible for 1,451
of the data entries.
The number of whole tusks exported from 1980-2014 was 1,624 of which of 499 were exported
before the trade ban in 1990 and 1,125 were exported after 1990. These figures include most but
not all of the hunting trophy exports during the given period. There is a separate category for
trophy exports in the database and the trophy exports not appearing in the ‘tusks’ category have
been added to the overall totals.12
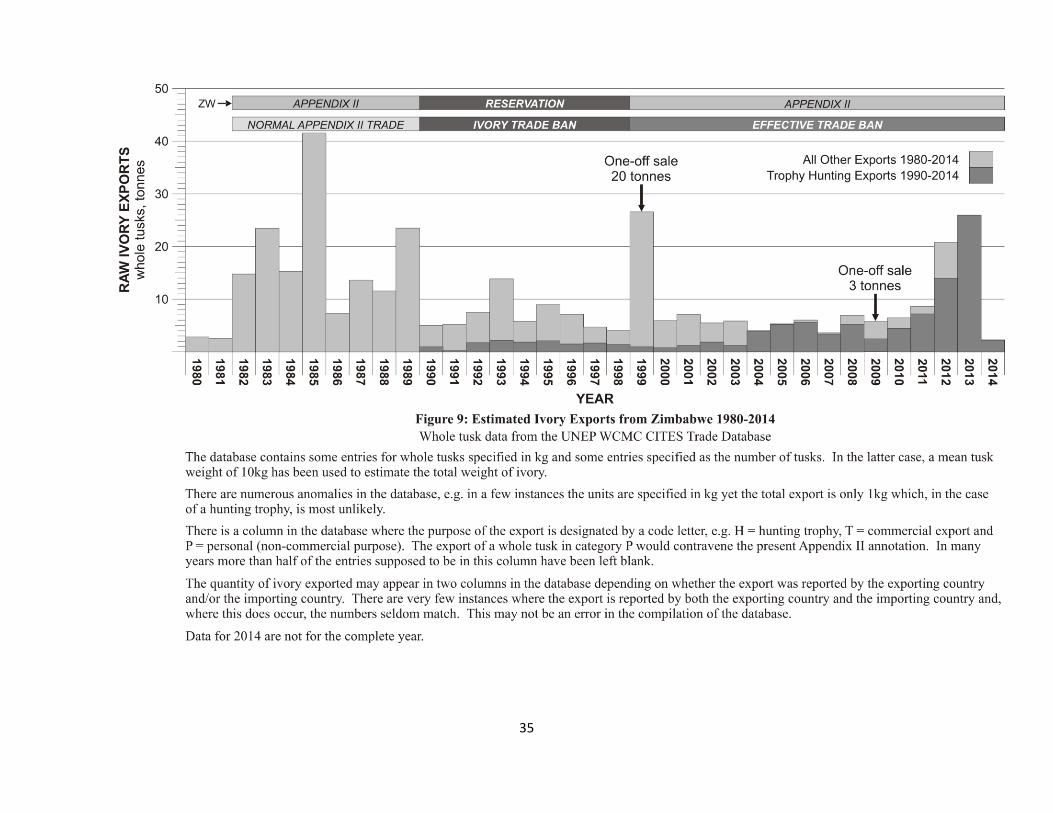
The total quantity of ivory exported from 1980-2014 is estimated as 365 tonnes of which 156
tonnes was exported from 1980-1989 and 209 tonnes were exported after the trade ban from
1990-2014 (Fig.9 page 35). These numbers include the two exports of ivory in ‘one-off’ sales in
1999 (19.963 tonnes) and 2008 (3.764 tonnes). Martin et al. (2012) concluded that the range
states lost between 66-75% of the value of this ivory that might have been expected under normal
trading conditions.
The current annotation affecting the export of whole tusks from Zimbabwe is such that, apart
from the raw ivory exported in one-off sales it might be expected that all exports from 1990
onwards would fall into the category of hunting trophies. This is not the case. For example in
9 . Because the ivory is coming mainly from two regions where the populations are rapidly approaching extinction, the mean tusk
weight is low and, hence, the ivory value is low.
10 . The prices given by Bradley-Martin & Vigne (2014) are end-market prices for raw ivory and it cannot be expected that the price
realised at the point of export from Africa would be as high. Although Zimbabwe managed to realise export prices before the
ivory trade ban in1989 that were close to the end-market price, this was generally not the case for most African range states
exporting ivory. We have assumed that the export price from Africa (if there were a legal market) would be half of the price
reported by Bradley-Martin & Vigne (2014).
11 . For the period 1979-1987 Princen (2003) observes: “Of the ivory-producing countries, only Zimbabwe brought in a level of
revenue ($63-$76/kg) close to the value of raw ivory earned in Japan ($85-$99kg). For other producer states, the revenues
ranged from $6-$15/kg. Zimbabwe, unlike the other states, had actively managed elephants during the 1980s, marketing ivory
in such a manner to gain the largest proportion of rents possible.”
12 . This increases the overall number of exports by about 9%: 1980-1989 – 522 exports; 1990-2014 – 1,248 exports; total 1980-
2014 – 1,770 exports.
12
2003 the database reports 43 exports from Zimbabwe: 9 of these were hunting trophies (“H”), 29
were for primarily commercial purposes (“T”) and 5 were personal possessions (‘P”).13
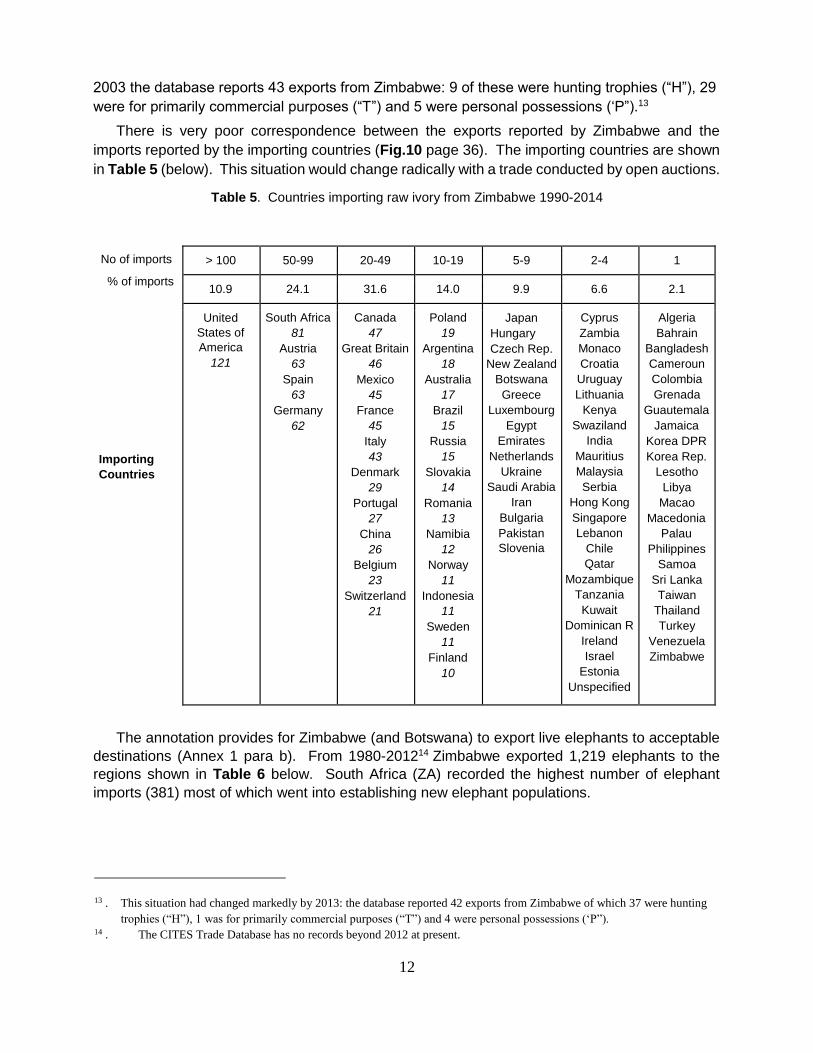
There is very poor correspondence between the exports reported by Zimbabwe and the
imports reported by the importing countries (Fig.10 page 36). The importing countries are shown
in Table 5 (below). This situation would change radically with a trade conducted by open auctions.
Table 5. Countries importing raw ivory from Zimbabwe 1990-2014
No of imports
% of imports
Importing Countries
The annotation provides for Zimbabwe (and Botswana) to export live elephants to acceptable
destinations (Annex 1 para b). From 1980-201214 Zimbabwe exported 1,219 elephants to the
regions shown in Table 6 below. South Africa (ZA) recorded the highest number of elephant
imports (381) most of which went into establishing new elephant populations.
13 . This situation had changed markedly by 2013: the database reported 42 exports from Zimbabwe of which 37 were hunting
trophies (“H”), 1 was for primarily commercial purposes (“T”) and 4 were personal possessions (‘P”). 14 . The CITES Trade Database has no records beyond 2012 at present.
> 100 50-99 20-49 10-19 5-9 2-4 1
10.9 24.1 31.6 14.0 9.9 6.6 2.1
United States of America
121
South Africa 81
Austria 63
Spain 63
Germany 62
Canada 47
Great Britain 46
Mexico
45 France
45 Italy 43
Denmark 29
Portugal 27
China 26
Belgium 23
Switzerland 21
Poland 19
Argentina 18
Australia 17
Brazil 15
Russia 15
Slovakia 14
Romania 13
Namibia 12
Norway 11
Indonesia 11
Sweden 11
Finland 10
Japan
Hungary
Czech Rep. New Zealand
Botswana Greece
Luxembourg Egypt
Emirates Netherlands
Ukraine Saudi Arabia
Iran Bulgaria Pakistan
Slovenia
Cyprus Zambia Monaco Croatia
Uruguay Lithuania
Kenya Swaziland
India Mauritius Malaysia Serbia
Hong Kong Singapore Lebanon
Chile Qatar
Mozambique Tanzania Kuwait
Dominican R Ireland
Israel Estonia
Unspecified
Algeria Bahrain
Bangladesh Cameroun Colombia Grenada
Guautemala
Jamaica Korea DPR
Korea Rep. Lesotho
Libya Macao
Macedonia
Palau Philippines
Samoa Sri Lanka Taiwan
Thailand Turkey
Venezuela Zimbabwe
13
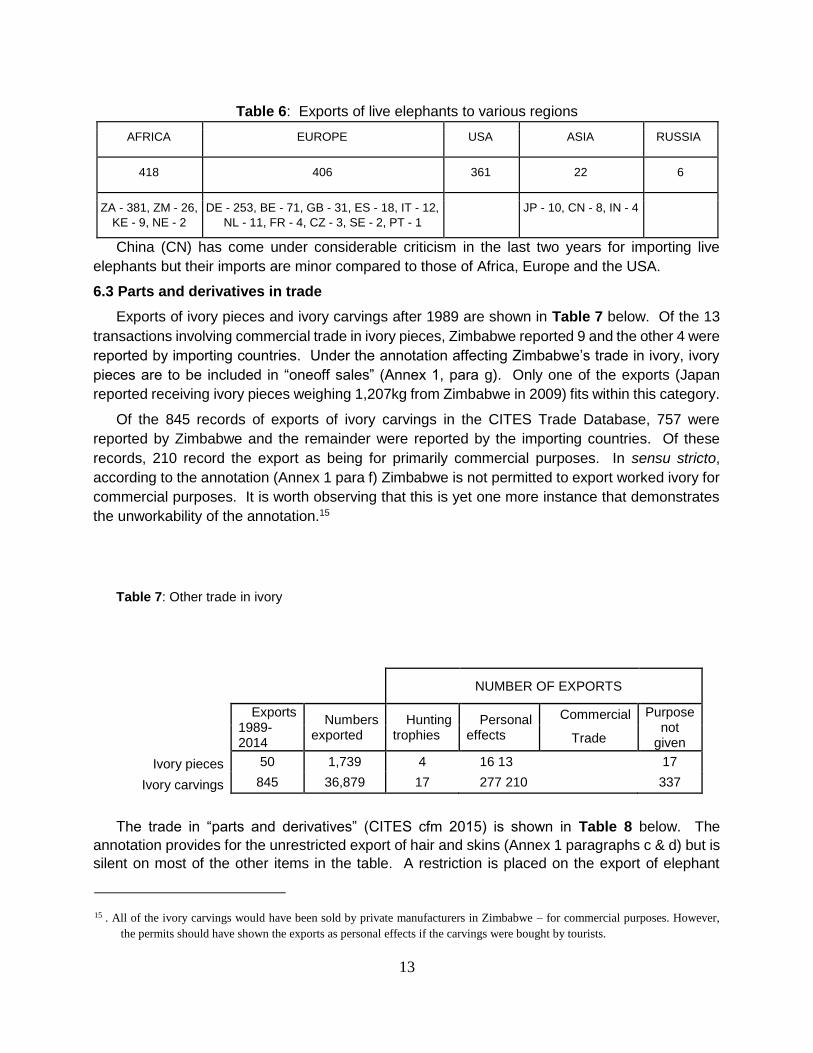
Table 6: Exports of live elephants to various regions
AFRICA EUROPE USA ASIA RUSSIA
418 406 361 22 6
ZA - 381, ZM - 26, KE - 9, NE - 2
DE - 253, BE - 71, GB - 31, ES - 18, IT - 12, NL - 11, FR - 4, CZ - 3, SE - 2, PT - 1
JP - 10, CN - 8, IN - 4
China (CN) has come under considerable criticism in the last two years for importing live
elephants but their imports are minor compared to those of Africa, Europe and the USA.
6.3 Parts and derivatives in trade
Exports of ivory pieces and ivory carvings after 1989 are shown in Table 7 below. Of the 13
transactions involving commercial trade in ivory pieces, Zimbabwe reported 9 and the other 4 were
reported by importing countries. Under the annotation affecting Zimbabwe’s trade in ivory, ivory
pieces are to be included in “oneoff sales” (Annex 1, para g). Only one of the exports (Japan
reported receiving ivory pieces weighing 1,207kg from Zimbabwe in 2009) fits within this category.
Of the 845 records of exports of ivory carvings in the CITES Trade Database, 757 were
reported by Zimbabwe and the remainder were reported by the importing countries. Of these
records, 210 record the export as being for primarily commercial purposes. In sensu stricto,
according to the annotation (Annex 1 para f) Zimbabwe is not permitted to export worked ivory for
commercial purposes. It is worth observing that this is yet one more instance that demonstrates
the unworkability of the annotation.15
Table 7: Other trade in ivory
NUMBER OF EXPORTS
Exports 1989-2014
Numbers exported
Hunting trophies
Personal effects
Commercial Purpose not
given Trade
Ivory pieces 50 1,739 4 16 13 17
Ivory carvings 845 36,879 17 277 210 337
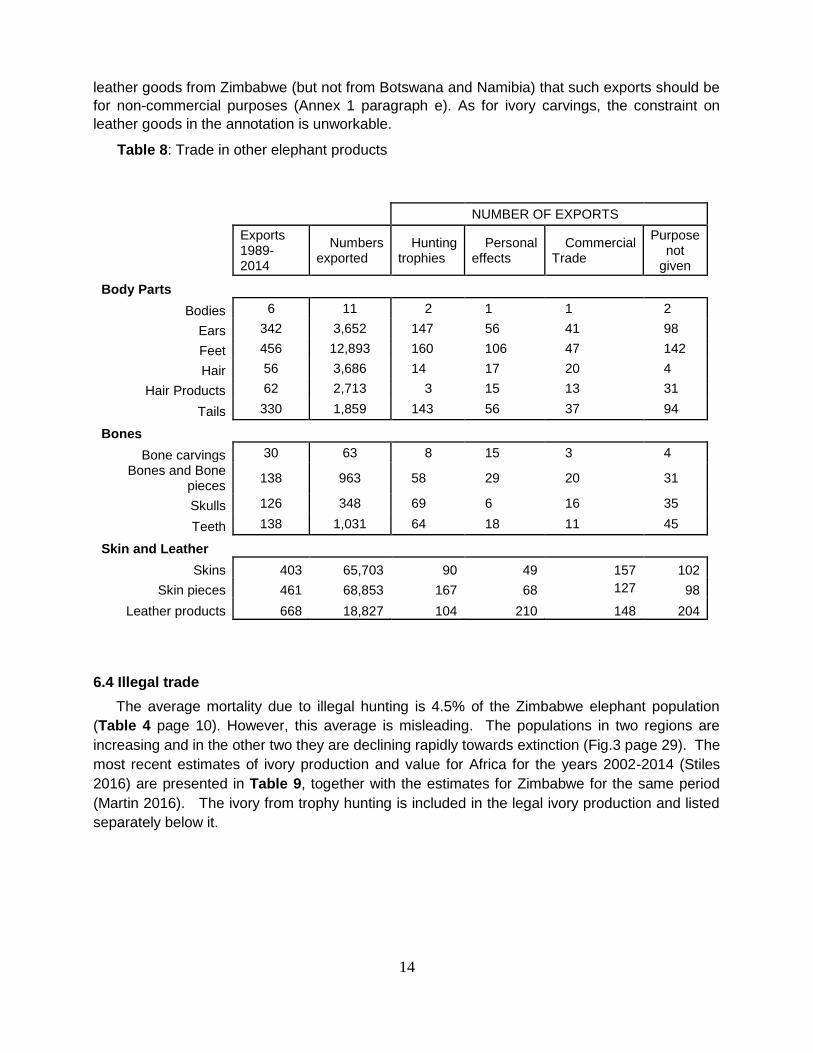
The trade in “parts and derivatives” (CITES cfm 2015) is shown in Table 8 below. The
annotation provides for the unrestricted export of hair and skins (Annex 1 paragraphs c & d) but is
silent on most of the other items in the table. A restriction is placed on the export of elephant
15 . All of the ivory carvings would have been sold by private manufacturers in Zimbabwe – for commercial purposes. However,
the permits should have shown the exports as personal effects if the carvings were bought by tourists.
14
leather goods from Zimbabwe (but not from Botswana and Namibia) that such exports should be
for non-commercial purposes (Annex 1 paragraph e). As for ivory carvings, the constraint on
leather goods in the annotation is unworkable.
Table 8: Trade in other elephant products
NUMBER OF EXPORTS
Exports 1989-2014
Numbers exported
Hunting trophies
Personal effects
Commercial Trade
Purpose not
given
Body Parts
Bodies 6 11 2 1 1 2
Ears 342 3,652 147 56 41 98
Feet 456 12,893 160 106 47 142
Hair 56 3,686 14 17 20 4
Hair Products 62 2,713 3 15 13 31
Tails 330 1,859 143 56 37 94
Bones
Bone carvings 30 63 8 15 3 4
Bones and Bone pieces
138 963 58 29 20 31
Skulls 126 348 69 6 16 35
Teeth 138 1,031 64 18 11 45
Skin and Leather
Skins 403 65,703 90 49 157 102
Skin pieces 461 68,853 167 68 127 98
Leather products 668 18,827 104 210 148 204
6.4 Illegal trade
The average mortality due to illegal hunting is 4.5% of the Zimbabwe elephant population
(Table 4 page 10). However, this average is misleading. The populations in two regions are
increasing and in the other two they are declining rapidly towards extinction (Fig.3 page 29). The
most recent estimates of ivory production and value for Africa for the years 2002-2014 (Stiles
2016) are presented in Table 9, together with the estimates for Zimbabwe for the same period
(Martin 2016). The ivory from trophy hunting is included in the legal ivory production and listed
separately below it.

15
Table 9: National and Continental Legal and Illegal Trade in Ivory
LEGAL ILLEGAL TOTAL
Tonnes % of Total Tonnes % of Total Tonnes % of Africa
ALL AFRICA
Ivory Production 1,139 29.3 2,748 70.7 3,887 100.0
Trophy Hunting 548 48.1 – – 548 14.1
Ivory Value US$m 1,056 42.2 1,446 57.8 2,502 100.0
ZIMBABWE
Ivory Production 180 29.1 439 70.9 619 15.9
Trophy Hunting 74 41.1 – – 74 13.5
Ivory Value US$m 102 31.1 226 68.9 328 13.1
6.5 Actual or potential trade impacts
From 2002-2014 Zimbabwe is estimated to have lost 439 tonnes of ivory worth US$226 million
to illegal hunting. Zimbabwe views this as a direct result of the ivory trade ban. The ban16 and the
absence of any regular trade has removed the incentives for local communities to conserve
elephants. Many parks are now surrounded by hostile rural people who are trying to recover their
wasted investment in elephants. An open trade might reverse the situation and address the
corruption that the ban has spawned.
7. Legal instruments
7.1 National
The Parks and Wild Life Act of 1996 as amended in 2001 (Chapter 20:14), together with the
Parks and Wild Life (Import and Export) (Wild Life) Regulations 199817 and Statutory Instrument
92 of 200918 are the most recent legislation currently affecting elephants in Zimbabwe.
Zimbabwe’s current legislation underpinned by the above mentioned pieces of legislation
grants ownership of wildlife and user rights to landowners (communal and private). Landowners,
as custodians of wildlife on their properties are therefore entitled to benefit through sustainable
utilisation of these resources. As a result of conferment of user rights to landowners, people see
16 . The ban on trophy imports to the USA is another contributory factor to the disenchantment of local communities.
17 .These regulations include the Appendices of CITES and align import and export conditions to Articles III & IV.
18 .This SI introduced jail sentences exceeding 10 years and a penalty of US$20,000 for illegal killing of an elephant.
16
their wildlife resources as an asset to be nurtured, thus ensuring their benefits continue into the
future. However, this beneficial arrangement is now under severe threat as a result of the ivory
trade ban.
Elephants are not listed as a Specially Protected Species in the Sixth Schedule of the Act. The
Research Division of PWMA reviewed the list of Specially Protected Species in 1993 and
concluded that no species that was on the list had improved in status since listing – in contrast to
all the species not listed that had doubled or trebled their numbers since 1975.
7.2 International
CITES is the main international instrument relating to the conservation of elephants although
the species is listed on Appendix II of the Convention on Migratory Species. CITES is mistakenly
seen as a protective device – but it does not, in fact, protect species. That can only be done by
the range states (leaving aside marine species). The limited tool at its disposal is the prohibition
of legal international trade between its Parties. If Western importing nations were requested by
range states to assist in prohibiting or limiting trade in certain species, the Treaty would be fulfilling
its original purpose. But if the importing states decide unilaterally that trade is undesirable, this
exceeds the reasons for coming together to form a treaty. There is ample evidence from the
stricter domestic legislation being invoked by importing countries to suggest that the Treaty is not
working. It is unsatisfactory to quote the "Precautionary Principle" as an antidote to the above
statement, because it cannot be critically tested. i.e. to argue that a species, if removed from
Appendix II and so denied the "protection" of CITES, might become threatened is to use "Catch
22". If the hypothesis cannot be tested, it cannot be falsified.
8. Species management
8.1 Management measures
Zimbabwe adopts an adaptive management approach towards its elephants. This approach
is experimental rather than programmatic in the manner expressed in the rubric of Conf.9.24
subsection 8.1. Zimbabwe’s success in raising its elephant population from some 5,000 elephants
in 1900 to more than 84,000 today came about by not following an inflexible programme of
“planned harvest rates, planned population sizes, procedures for establishing quotas ... etc”.
Elephants, people and ecosystems are complex systems (Holling 2001) and, as such, are not
amenable to ‘command-and-control’ management approaches (Holling & Meffe 1996).
Under its radical devolutionary policy, Zimbabwe has allowed its primary stakeholders (those
with wildlife on their land) to experiment with elephant management. This approach was
responsible for the explosion of wildlife as a land use in Zimbabwe from 1975 onwards. Where
the rubric for this subsection asks for “... details of any mechanisms used to ensure a return from
utilization of the species in question to conservation and/or management programmes ...”, the
‘cardinal input’ is devolution (Murphree 1991).
In State Protected Areas (SPAs) the main management agenda for the PWMA19 is (1) to
reduce the high level of illegal hunting in the Sebungwe and the Zambezi Valley; (2) to prevent
elephants becoming overabundant to the extent that they are damaging habitats, threatening their
19 . Parks and Wildlife Management Authority

17
own survival and that of other species ; (3) to promote activities (e.g. trophy hunting and non-
hunting tourism) that allow a high financial return from SPAs to provide the budget for their
management, protection and maintenance (see 8.6 below) and (4) to establish partnerships of a
symmetrical status with their rural community neighbours.
All of these activities will be achieved through adaptive management. In applying adaptive
management to elephants a critical factor is the long response time of elephant populations to any
change in their management regime. Martin et al. (2015 Appendix 10) gives a method of quota
setting for elephants based on monitoring the mean tusk weight of trophies which takes into
account this response time.
8.2 Population monitoring
In a recent workshop (PWMA 2014) it was resolved that each of the four regional
subpopulations would be surveyed by air at least once every three years.20 The methodology for
these surveys is given by Dunham (2015). Given its limited operational budget, the PWMA may
have difficulty meeting this cost (see subsection 8.6). Trophy hunting is the main legal offtake
from the wild. The annual quotas for trophy hunting are small (less than 1% of the population) and
the main objective of monitoring is not biological sustainability but the maintenance of a high mean
tusk weight of trophy tusks (last paragraph previous page). 8.3 Control measures
1) International: CITES controls on movements of elephant specimens across international
borders is only as good as the performance of national customs agencies which, from the
analysis of data in the CITES Trade Database presented in this proposal, is not
outstanding. Zimbabwe abides by the CITES marking system for elephant tusks
regardless of whether a tusk is to be exported.
2) Domestic: see 8.2 above. “... Information on education, compliance and enforcement
activities ...” has little relevance to Zimbabwe’s major problem of illegal hunting. This
dwarfs all legal offtakes from the elephant population and CITES measures are not
effective in reducing the problem.
8.4 Captive breeding and artificial propagation
A small amount of captive breeding is taking place amongst the domesticated elephants in
Zimbabwe (about 100) but the progeny of such breeding remain within the herds and become
domesticated elephants. There is no significant trade in captive-bred elephants: indeed, most
owners of domesticated elephants are seeking to add to their herds rather than reduce them.
20 . If the 4 regions are all surveyed in the same year every three years this amounts to a national survey every 3 years.
18
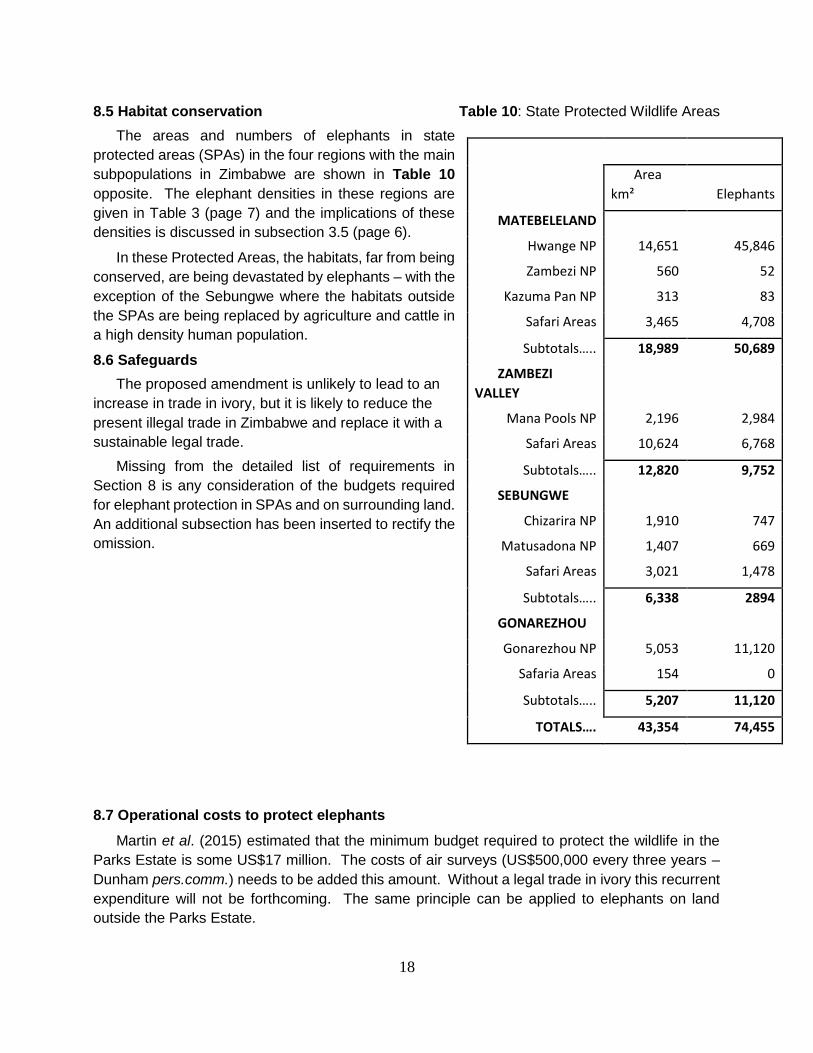
8.5 Habitat conservation Table 10: State Protected Wildlife Areas
The areas and numbers of elephants in state
protected areas (SPAs) in the four regions with the main
subpopulations in Zimbabwe are shown in Table 10
opposite. The elephant densities in these regions are
given in Table 3 (page 7) and the implications of these
densities is discussed in subsection 3.5 (page 6).
In these Protected Areas, the habitats, far from being
conserved, are being devastated by elephants – with the
exception of the Sebungwe where the habitats outside
the SPAs are being replaced by agriculture and cattle in
a high density human population.
8.6 Safeguards
The proposed amendment is unlikely to lead to an
increase in trade in ivory, but it is likely to reduce the
present illegal trade in Zimbabwe and replace it with a
sustainable legal trade.
Missing from the detailed list of requirements in
Section 8 is any consideration of the budgets required
for elephant protection in SPAs and on surrounding land.
An additional subsection has been inserted to rectify the
omission.
8.7 Operational costs to protect elephants
Martin et al. (2015) estimated that the minimum budget required to protect the wildlife in the
Parks Estate is some US$17 million. The costs of air surveys (US$500,000 every three years –
Dunham pers.comm.) needs to be added this amount. Without a legal trade in ivory this recurrent
expenditure will not be forthcoming. The same principle can be applied to elephants on land
outside the Parks Estate.
Area
km² Elephants
MATEBELELAND
Hwange NP 14,651 45,846
Zambezi NP 560 52
Kazuma Pan NP 313 83
Safari Areas 3,465 4,708
Subtotals….. 18,989 50,689
ZAMBEZI
VALLEY
Mana Pools NP 2,196 2,984
Safari Areas 10,624 6,768
Subtotals….. 12,820 9,752
SEBUNGWE
Chizarira NP 1,910 747
Matusadona NP 1,407 669
Safari Areas 3,021 1,478
Subtotals….. 6,338 2894
GONAREZHOU
Gonarezhou NP 5,053 11,120
Safaria Areas 154 0
Subtotals….. 5,207 11,120
TOTALS…. 43,354 74,455
19
9. Information on similar species
All mammals produce ivory although the term traditionally applied to tusks of elephants
(Espinoza & Mann 1991). In the context of this proposal, it is the distinction between ivory from
African and Asian elephants that matters.
It is relatively easy to distinguish mammoth ivory from that of living elephants (Espinoza &
Mann 1991) based on the angles of the Schreger lines in an ivory cross section but the CITES
Identification Manual does not give a method to differentiate between the ivory of Loxodonta
africana and Elephas maximus based on Schreger lines. Harris (2014) states –
“There are ways, short of DNA testing, to distinguish African from Asian ivory. Asian ivory
tends to have a pinkish tint that is absent in African ivory. In addition, the cross hatching
grain marks (Schreger angles) in Asian ivory have sharper peaks, but are not as pronounced
as those in African ivory and tend to zigzag. Like differentiating ivory from bone, experts get
it right nearly all the time.”
10. Consultations
Zimbabwe is circulating this proposal to other African range states and will submit comments
received to the CITES Secretariat.
11. Additional remarks
In the course of preparing this proposal, considerable time has been spent extracting and
analysing the data contained in the UNEP WCMC CITES Trade Database. It is necessary to
remark that there are major shortcomings in this database. This may be as much due to the
reporting of the Parties, including Zimbabwe, as it is due to data capture at WCMC.
Whilst being critical of decisions made by CITES Parties in this proposal, Zimbabwe wishes to
make it clear that none of this criticism is aimed at the CITES Secretariat – for whom we have a
very high respect.
Zimbabwe remains despondent about the general approach to conservation enshrined in
CITES (and the United States Endangered Species Act). Zimbabwe’s experience with recovery
of declining species populations is that in all cases it has been successfully achieved by removing
perverse incentives (such as restrictive legislation), devolving authority to local people and
promoting a high value for wildlife products.
In the Overview to this proposal Zimbabwe queried what the Parties understand by the term
“Experimental Trade”. The entire edifice of constraints contained in the annotation appears to be
antiexperimental – which is not good science. This could be addressed by allowing Zimbabwe the
opportunity to trade in the manner proposed and, hence, provide an experimental control for the
present system that is not working.
________________
20
12. References
Barbier, EB, JC Burgess, TM Swanson & DW Pearce (1990). Elephants, Economics and Ivory.
Earthscan Publications Ltd., London.
Barnes RFW, GC Craig, HT Dublin, G Overton, W Simons & CR Thouless (1999). African Elephant
Database 1998. Occasional Paper No.22 of the Species Survival Commission, IUCN, Gland,
Switzerland. x+250pp
Blanc JJ, CR Thouless, JA Hart, HT Dublin, I Douglas-Hamilton, GC Craig & RFW Barnes (2003). African
Elephant
Status Report 2002: an update from the African Elephant Database. IUCN/SSC African Elephant
Specialist Group, IUCN, Gland, Switzerland, Occasional Paper No.29. VI+304pp
Blanc JJ, RFW Barnes, GC Craig, HT Dublin, CR Thouless, I Douglas-Hamilton & JA Hart (2007). African
Elephant
Status Report 2007: an update from the African Elephant Database. IUCN/SSC African Elephant
Specialist Group, IUCN, Gland, Switzerland, Occasional Paper No.33. VI+276pp
Blanc J.J., Thouless, C.R., Hart, J.A., Dublin, H.T., Douglas-Hamilton, I., Craig, G.C. & Barnes, R.F.W.
(2013) African Elephant Status Report 2013 (provisional). Occasional Paper Series of the IUCN
Species Survival Commission, IUCN/SSC African Elephant Specialist Group. IUCN, Gland, Switzerland
and Cambridge, UK.
Bradley-Martin E & L Vigne (2014). Price of Ivory in China Triples in Four Years, with Grave
Implications for Elephants in Africa. Press Release, July 2nd, 2014, Save the Elephants, Nairobi,
Kenya.
Child, G (1995). Wildlife and People: the Zimbabwean Success. WISDOM Foundation, Harare and New
York. 267pp
Craig GC (1989). A simple model of tree/elephant equilibrium. In: EMZ (1989, Appendix 10: 77-82)
Craig GC (1992). Population dynamics of elephants. Appendix 8 in Elephant management in Zimbabwe.
Eds R.B.
Martin, G.C. Craig, V.R. Booth and A.M.G. Conybeare. Department of National Parks and Wild Life
Management, Zimbabwe. 124pp
Craig GC, RB Martin & DA Peake (2011). The Elephants of Northern Botswana: Trophy Hunting,
Population Dynamics and Future Management. Study funded by the Conservation Trust Fund (CTF)
of the Ministry of Environment, Wildlife and Tourism, Botswana.
Cumming DHM, MB Fenton, IL Rautenbach, RD Taylor, GS Cumming, MS Cumming, JM Dunlop, AG Ford,
MD Hovorka, DS Johnston, MC Kalcounis, Z Mahlanga & CVR Portfors (1997). Elephants, woodlands
and biodiversity in southern Africa. South African Journal of Science 93: 231-236.
Dunham KM & CS Mackie (2002). National summary of aerial census results for elephant in
Zimbabwe: 2001. Occasional Paper 1, WWF-SARPO, Harare. 38pp
Dunham KM (2002a). Aerial census of elephants and other large herbivores in Gonarezhou National
Park and some bordering lands, Zimbabwe 2001. Occasional Paper 4, WWF-SARPO, Harare. 46pp
Dunham KM (2002b). Aerial census of elephants and other large herbivores in north-west
Matabeleland, Zimbabwe: 2001. Occasional Paper 6, WWF-SARPO, Harare. 79pp

21
Dunham KM (2002c). Aerial census of elephants and other large herbivores in the Save Conservancy,
Zimbabwe: 2001. Occasional Paper 5, WWF-SARPO, Harare. 53pp
Dunham KM (2004). Aerial survey of elephants and other large herbivores in the Zambezi Heartland
(Zimbabwe, Mozambique and Zambia): 2003. A report for African Wildlife Foundation, May 2004.
46pp
Dunham KM, CS Mackie, OC Musemburi, DM Chipesi, NC Chiweshe, RD Taylor, T Chimuti, C Zhuwau, &
MH
Brightman (2007). Aerial survey of elephants and other large herbivores in the Sebungwe
Region, Zimbabwe 2006. Occasional Paper 12, WWF-SARPO, Harare. 90pp
Dunham KM, CS Mackie, OC Musemburi, C Zhuwau, GH Nyaguse, RD Taylor & T Chimuti (2007). Aerial
survey of elephants and other large herbivores in Gonarezhou National Park, Zimbabwe 2007.
Occasional Paper 18, WWF-SARPO, Harare. 49pp
Dunham KM, CS Mackie, OC Musemburi, C Zhuwau, TG Mtare, RD Taylor & T Chimuti (2007). Aerial
survey of elephants and other large herbivores in north-west Matabeleland, Zimbabwe 2007.
Occasional Paper 19,
WWF-SARPO, Harare. 86pp
Dunham KM, E van der Westhuizen, HF van der Westhuizen, & E Gandiwa (2009). Aerial survey of
elephants and other large herbivores in Gonarezhou National Park (Zimbabwe), Zinave National
Park (Mozambique) and surrounds: 2009. Frankfurt Zoological Society, Gonarezhou Conservation
Project, Chiredzi. 140pp
Dunham KM, E van der Westhuizen, HF van der Westhuizen, & H Ndaimani (2013). Aerial survey of
elephants and other large herbivores in Gonarezhou National Park (Zimbabwe), Zinave National
Park (Mozambique) and surrounding areas: 2013. Frankfurt Zoological Society, Gonarezhou
Conservation Project, Chiredzi. 113pp
Dunham KM (2015). National summary of aerial survey results for elephant in Zimbabwe: 2014. Great
Elephant Census (A Paul G. Allen Project). 117pp
Dunham KM, CS Mackie & GH Nyaguse (2015). Aerial survey of elephants and other large herbivores
in the Zambezi Valley (Zimbabwe): 2014. Great Elephant Census (A Paul G. Allen Project). 117pp
Dunham KM, CS Mackie, GH Nyaguse & C Zhuwau (2015). Aerial survey of elephants and other large
herbivores in the Sebungwe (Zimbabwe): 2014. Great Elephant Census (A Paul G. Allen Project).
110pp
Dunham KM, CS Mackie, GH Nyaguse & C Zhuwau (2015). Aerial survey of elephants and other large
herbivores in north-west Matabeleland (Zimbabwe): 2014. Great Elephant Census (A Paul G. Allen
Project). 124pp
Dunham KM & HF van der Westhuizen (2015). Aerial survey of elephants and other large herbivores
in Gonarezhou National Park and Save Valley Conservancy (Zimbabwe): 2014. Frankfurt
Zoological Society, Gonarezhou Conservation Project, Chiredzi, in partnership with the Zimbabwe
Parks and Wild Life Management
Authority and jointly funded under the Great Elephant Census (A Paul G Allen project). 114pp
EMZ (1989). Elephant Management in Zimbabwe (1st Edition). Eds: Martin RB, GC Craig & VR Booth,
Department of National Parks and Wildlife Management, Harare. 126pp

22
Espinoza EO & M-J Mann (1991). Identification Guide for Ivory and Ivory Substitutes. CITES
Identification Manual 1999. Published originally by World Wildlife Fund and the Conservation
Foundation. 38pp
Freeman EW, I Whyte & JL Brown (2008). Reproductive evaluation of elephants culled in Kruger
National Park, South Africa, between 1975 and 1995. African Journal of Ecology 47:192-201
Harris G (2014). The Difference between African and Asian Ivory. Publication of the Ivory Education
Institute, the Americas Group, Los Angeles.
Holling CS (2001). Understanding the Complexity of Economic, Ecological and Social Systems.
Ecosystems 4: 390-405
Holling CS & GK Meffe (1996). Command and Control and the Pathology of Natural Resource
Management. Conservation Biology 10(2); pp328-337
Hutton J & G Webb (2002) Legal Trade Snaps Back: Using the Experience of Crocodilians to Draw
Lessons on Regulation of the Wildlife Trade. pp. 1-10. In: Crocodiles. Proceedings of the 16th
Working Meeting of the Crocodile Specialist Group, IUCN – The World Conservation Union, Gland,
Switzerland and Cambridge UK.
ITRG (1989). The Ivory Trade and the Future of the African Elephant. Eds. S.Cobb & D. Western.
Report of the Ivory Trade Review Group to the CITES Secretariat and the African Elephant Working
Group, July 1989.
Laws RM (1966). Age criteria for the African elephant, Loxodonta africana. E. Afr. Wildl. J. 4:1-37
Laws RM, ISC Parker & RCB Johnstone (1975). Elephants and their habitats: the ecology of elephants
in North Bunyoro, Uganda. Clarendon Press, Oxford.
MacDonald D (2001) Ed. The New Encyclopedia of Mammals. Oxford University Press, Oxford. 930pp
Mackie CS (2002a). Aerial census of elephants and other large herbivores in the Zambezi Valley,
Zimbabwe: 2001. Occasional Paper 2, WWF-SARPO, Harare. 71pp
Mackie CS (2002b). Aerial census of elephants and other large herbivores in the Sebungwe Region,
Zimbabwe:
2001. Occasional Paper 3, WWF-SARPO, Harare. 111pp
Martin RB (2004). Species Report and Management Plan for Elephants. Project conducted under the
Transboundary Mammal Project of the Ministry of Environment and Tourism, Namibia and facilitated by
The Namibia Nature Foundation. 104pp
Martin RB (2006). Savé Valley Conservancy: Management of the Elephant Population. Consultancy
for the members of the Savé Valley Conservancy, funded by the US Fish and Wildlife Service. 73pp
Martin RB, DHM Cumming, GC Craig & DA Peake (2012). Decision-making mechanism for a process
of trade in ivory. Consultancy for the CITES Secretariat, November 2011 – May 2012. Results
presented at the 62nd Meeting of the CITES Standing Committee in Geneva, July 2012.
Martin RB, O Mufute, S Chibaya, TN Gotosa, I Tendaupenyu & PT Kuvawoga (2015). Elephant
Management Plan for Zimbabwe (Draft). Parks and Wildlife Management Authority, Zimbabwe. Plan
35pp + Appendices 95pp
Martin RB (2016). Population Simulation Model for the Zimbabwe Elephant Population (developed
after the national elephant census in 2014). To be published.
23
Martin R & D Stiles (2016). Illicit Financial Flows in the wildlife sector of Southern Africa. Study for
Trust Africa and OSISA (Open Society Initiative of Southern Africa). In progress.
Moss CJ (2001). The demography of an African elephant (Loxodonta africana) population in Amboseli,
Kenya. Journal of Zoology (2001), 255: 145-156
Murphree MW (1991). Communities as Institutions for Resource Management. Paper presented to the
National Conference on Environment & Development, Maputo, Mozambique, 7-11 October, 1991 and
re-published in 1993 under the Gatekeeper Series N. SA36, IIED Publications, London. 13pp
Owen-Smith RN (1987). Pleistocene extinctions – the pivotal role of megaherbivores. Paleobiology
13(3): 351-362
Parker ISC & M Amin (1983). Ivory Crisis. Chatto & Windus, London. 184pp
Parker ISC & AD Graham (1989). Men, elephants and competition. Symp. Zool. Soc. Lond. 61: 241-252
Princen T (2003). The Ivory Trade Ban. Ivory Teaching Case (4/20/03), School of Natural Resources and
Environment, University of Michigan.
PWMA (2014). Elephant Conservation Policy and Management Plan Workshop. Proceedings of a
workshop hosted by the Zimbabwe Parks and Wildlife Management Authority at Hwange Safari Lodge,
2-4 December 2014 facilitated by DHM Cumming and funded by Conservation Force, USA. 48pp
Said MY, RN Chunge, GC Craig, CR Thouless, RFW Barnes & HT Dublin (1995). African Elephant
Database. Occasional Paper No.11 of the Species Survival Commission, IUCN, Gland, Switzerland.
225pp
Smithers, RHN (1983). The Mammals of the Southern African Subregion. University of Pretoria,
Pretoria, RSA. 736pp
Stiles, D (2012). Comments submitted to the authors of Martin et al. (2012) in March 2012.
Stiles D (2014). Can elephants survive a continued ivory trade ban? National Geographic – SAVING
ELEPHANTS: A Forum for Discussion, September 15, 2014
Stiles D (2016) with contributions from R Martin, W Ji & B Moyle. Analysis of Ivory Demand Drivers (Final
Draft). Research study for the Wildlife Conservation Society, New York. 61pp
CITES cfm (2016). CITES Trade Database. http://www.unep-wcmc-apps.org/citestrade/trade.cfm
White F (1983). Vegetation of Africa - a descriptive memoir to accompany the Unesco/AETFAT/UNSO
vegetation map of Africa; Natural Resources Research Report XX. U. N. Educational, Scientific
and Cultural Organization; 7 Place de Fontenoy, 75700 Paris, France; 356 pages
Winjstekers W (1990). The Evolution of CITES. A reference to the Convention on International Trade in
Endangered Species of Wild Fauna and Flora. Published by The CITES Secretariat, Lausanne,
Switzerland. 284pp
World Bank (2015), World Development Indicators.
http://databank.worldbank.org/data/reports.aspx?source =health-nutrition-and-population-statistics:-
population-estimates-and-projections
_____________________

24
Annex 1
Annotation on the CITES Appendices applying to the elephant populations of
Botswana, Namibia, South Africa and Zimbabwe (listed in Appendix II)
“For the exclusive purpose of allowing:
a) trade in hunting trophies for non-commercial purposes;
b) trade in live animals to appropriate and acceptable destinations, as defined in Resolution Conf. 11.20,
for Botswana and Zimbabwe and for in situ conservation programmes for Namibia and South Africa; c) trade in
hides;
d) trade in hair;
e) trade in leather goods for commercial or non-commercial purposes for Botswana, Namibia and South
Africa and for non-commercial purposes for Zimbabwe;
f) trade in individually marked and certified ekipas incorporated in finished jewellery for non-commercial purposes
for Namibia and ivory carvings for non-commercial purposes for Zimbabwe;
g) trade in registered raw ivory (for Botswana, Namibia, South Africa and Zimbabwe, whole tusks and pieces)
subject to the following:
i) only registered government-owned stocks, originating in the State (excluding seized ivory and ivory of
unknown origin);
ii) only to trading partners that have been verified by the Secretariat, in consultation with the Standing
Committee, to have sufficient national legislation and domestic trade controls to ensure that the
imported ivory will not be re-exported and will be managed in accordance with all requirements of
Resolution Conf. 10.10 (Rev. CoP16) concerning domestic manufacturing and trade;
iii) not before the Secretariat has verified the prospective importing countries and the registered
government-owned stocks;
iv) raw ivory pursuant to the conditional sale of registered government-owned ivory stocks agreed at
CoP12, which are 20,000 kg (Botswana), 10,000 kg (Namibia) and 30,000 kg (South Africa);
v) in addition to the quantities agreed at CoP12, government-owned ivory from Botswana, Namibia, South
Africa and Zimbabwe registered by 31 January 2007 and verified by the Secretariat may be traded and
despatched, with the ivory in paragraph g) iv) above, in a single sale per destination under strict
supervision of the Secretariat;
vi) the proceeds of the trade are used exclusively for elephant conservation and community conservation
and development programmes within or adjacent to the elephant range; and
vii) the additional quantities specified in paragraph g) v) above shall be traded only after the Standing
Committee has agreed that the above conditions have been met; and
h) no further proposals to allow trade in elephant ivory from populations already in Appendix II shall be submitted
to the Conference of the Parties for the period from CoP14 and ending nine years from the date of the single
sale of ivory that is to take place in accordance with provisions in paragraphs g) i), g) ii), g) iii), g) vi) and g) vii).
In addition such further proposals shall be dealt with in accordance with Decisions 14.77 and 14.78 (Rev.
CoP15).
On a proposal from the Secretariat, the Standing Committee can decide to cause this trade to cease partially or
completely in the event of non-compliance by exporting or importing countries, or in the case of proven detrimental
impacts of the trade on other elephant populations.
All other specimens shall be deemed to be specimens of species included in Appendix I and the trade in them shall
be regulated accordingly.”
CoP14 Inf.61
25
Annex 2
Review of the Annotation
Zimbabwe has difficulties with this annotation. The provisions for trade in ivory are too infrequent
(para h) and too limiting (para g) to provide a basis for any financial planning. They act against
conserving elephants.
g) “trade in registered raw ivory (for Botswana, Namibia, South Africa and Zimbabwe, whole tusks
and pieces) subject to the following:
i) only registered government-owned stocks, originating in the State (excluding seized ivory
and ivory of unknown origin);”
There are no sound reasons why confiscated ivory cannot be sold. Customs agencies world-
wide sell confiscated goods to defray the costs of their operations. In this case, the Zimbabwe
government has spent money on law enforcement to seize ivory and has every right to recover
the costs.
ii) “only to trading partners that have been verified by the Secretariat, in consultation with the
Standing Committee, to have sufficient national legislation and domestic trade controls to
ensure that the imported ivory will not be re-exported and will be managed in accordance
with all requirements of
Resolution Conf. 10.10 (Rev. CoP16) concerning domestic manufacturing and trade;” iii)
not before the Secretariat has verified the prospective importing countries and the registered
government-owned stocks; ...”
Restricting one-off sales to two Parties has resulted in substantial losses to Zimbabwe and,
because the supply of legal ivory is irregular and uncertain (para h) below), it provides no
incentives to ivory traders to confine their trade to legally available ivory (Martin et al. 2012).
vi) “the proceeds of the trade are used exclusively for elephant conservation and community
conservation and development programmes within or adjacent to the elephant range;”
Admirable as this sounds, it is ‘putting the cart before the horse’. It cannot be an a priori
requirement of international trade. Zimbabwe has learnt that the fewer restrictions there are
on use of the income generated from wildlife, the more likely it is that wildlife agencies and local
communities will invest in elephant conservation. In fact ‘conservation’ becomes the secondary
‘spin-off’ from sound socio-economic practice.
h) “no further proposals to allow trade in elephant ivory from populations already in Appendix II
shall be submitted to the Conference of the Parties for the period from CoP14 and ending nine
years from the date of the single sale of ivory that is to take place in accordance with provisions
in paragraphs g) i), g) ii), g) iii), g) vi) and g) vii). In addition such further proposals shall be
dealt with in accordance with Decisions 14.77 and 14.78 (Rev. CoP15).”
This paragraph violates Article XV 1. (a) Of the Convention. It also goes well beyond the
provisions of Article IV under which any Party whose population of elephants is listed on
Appendix II should be able to trade in wildlife specimens constrained only by the requirement
that the Party issues an export certificate.
26
“On a proposal from the Secretariat, the Standing Committee can decide to cause this trade to
cease partially or completely in the event of non-compliance by exporting or importing
countries, or in the case of proven detrimental impacts of the trade on other elephant
populations.”
At CoP10, the Secretariat pointed out in Decision 10.1 para g) footnote 2 that the above
condition was in contravention of the text of the Convention (Article XV).
____________________
Interpretations of the term ‘primarily commercial purposes’ (Article III 3(c)) in the annotation
defy reason. Zimbabwe is well aware that the intention of this phrase as it appears in the Articles
of the Treaty is to facilitate exports of specimens that become ‘personal effects’ on importation to
another country. However, it should be clearly understood that exports of elephant trophies,
worked ivory, elephant skin and processed leather are primarily for commercial purposes in the
exporting country, e.g. –
Whilst providing for trade in elephant hides (para c)), Zimbabwe is not permitted to trade in
leather goods for commercial purposes (para e)). This is nonsense: it states that it is alright for
Zimbabwe to export raw hides to other countries but not alright for Zimbabwe to beneficiate the
product by processing it into leather before export.
Zimbabwe is unable to trade in worked ivory for commercial purposes (para f)). It may allow
domestic carving industries to produce worked ivory products but these businesses must sell
the products individually to tourists visiting Zimbabwe. They may not export any bulk shipments
of the products they produce. This seriously affects any attempts to sustain a domestic ivory
carving industry.
_____________
27
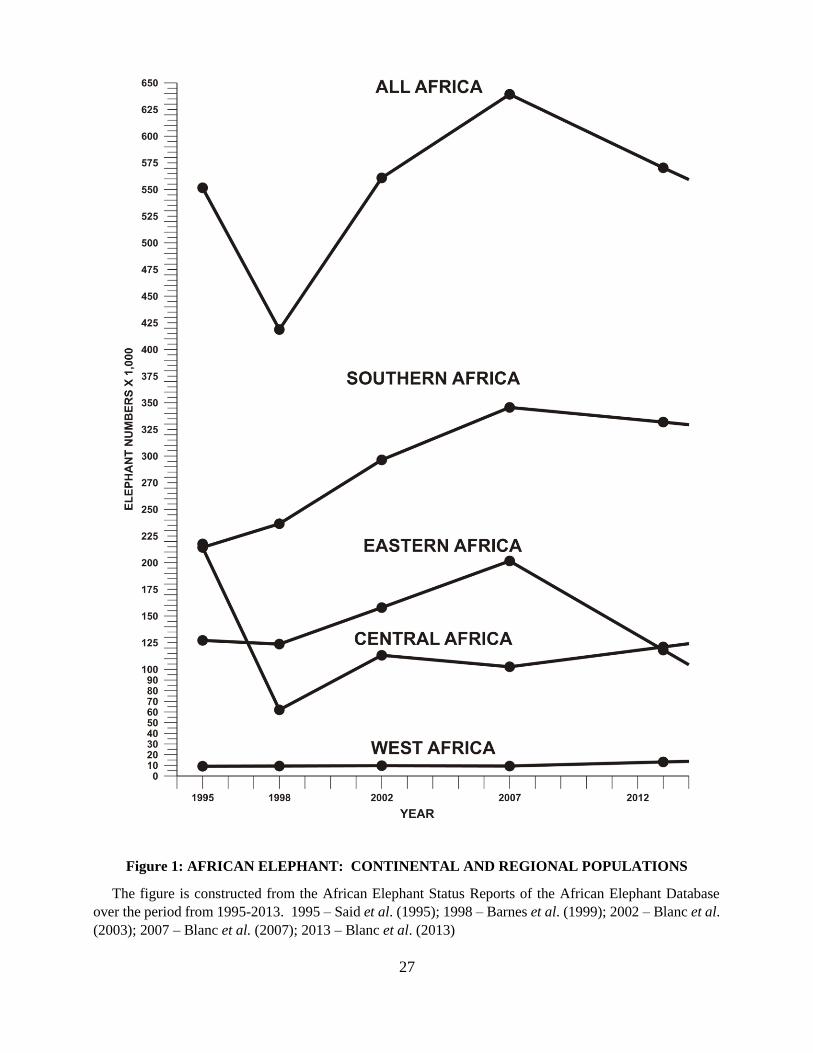
Figure 1: AFRICAN ELEPHANT: CONTINENTAL AND REGIONAL POPULATIONS
The figure is constructed from the African Elephant Status Reports of the African Elephant Database
over the period from 1995-2013. 1995 – Said et al. (1995); 1998 – Barnes et al. (1999); 2002 – Blanc et al.
(2003); 2007 – Blanc et al. (2007); 2013 – Blanc et al. (2013)

Figure 2: ZIMBABWE: REGIONAL POPULATIONS
The map shows the four national aerial survey regions and the smaller populations outside the survey areas based on Map 6 in Dunham (2015)
29
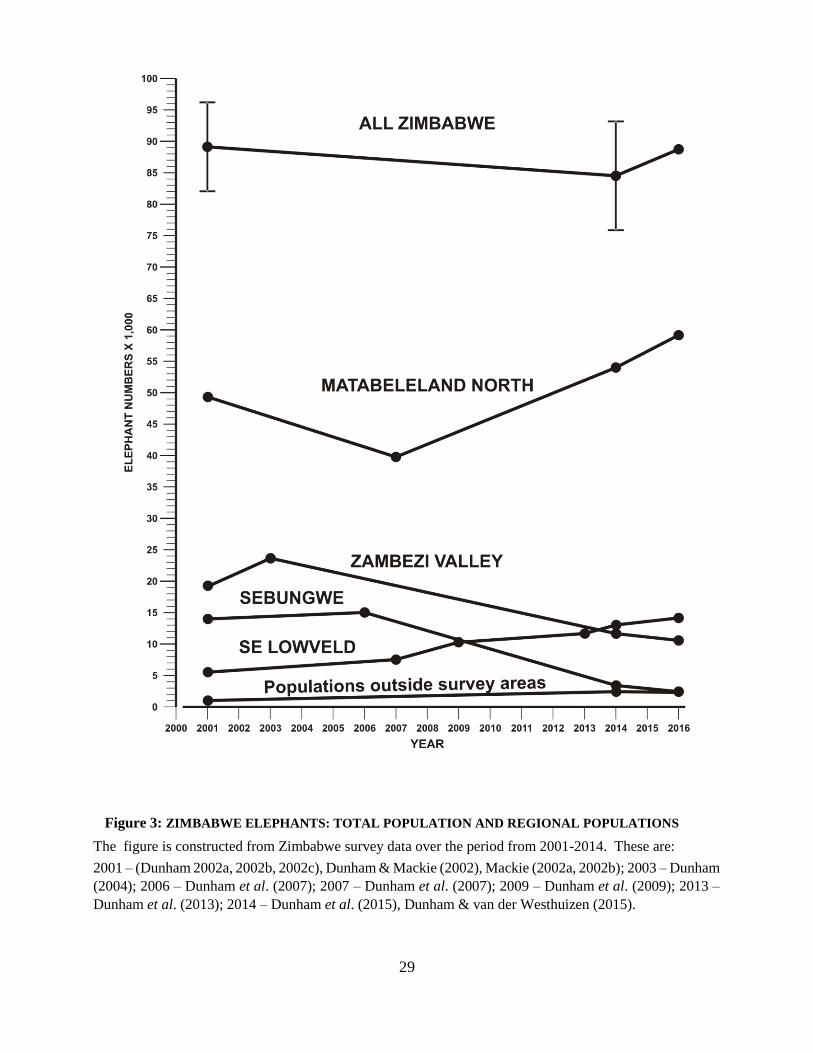
Figure 3: ZIMBABWE ELEPHANTS: TOTAL POPULATION AND REGIONAL POPULATIONS
The figure is constructed from Zimbabwe survey data over the period from 2001-2014. These are:
2001 – (Dunham 2002a, 2002b, 2002c), Dunham & Mackie (2002), Mackie (2002a, 2002b); 2003 – Dunham
(2004); 2006 – Dunham et al. (2007); 2007 – Dunham et al. (2007); 2009 – Dunham et al. (2009); 2013 –
Dunham et al. (2013); 2014 – Dunham et al. (2015), Dunham & van der Westhuizen (2015).
30
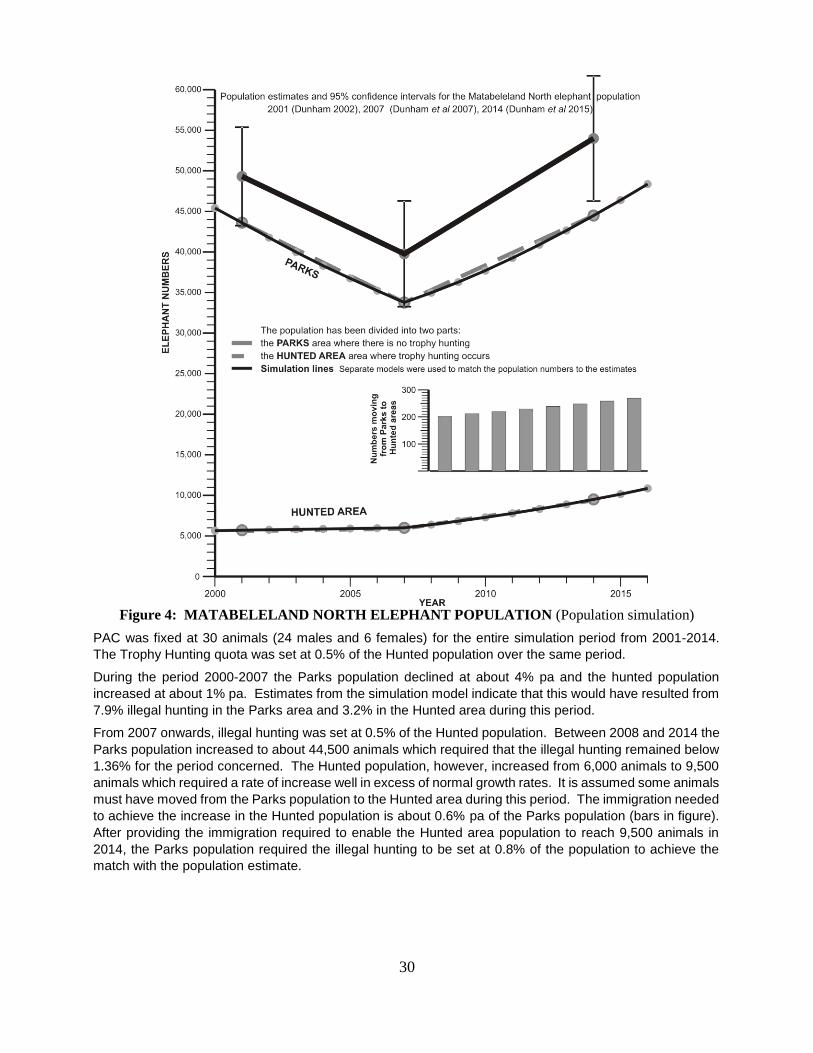
Figure 4: MATABELELAND NORTH ELEPHANT POPULATION (Population simulation)
PAC was fixed at 30 animals (24 males and 6 females) for the entire simulation period from 2001-2014.
The Trophy Hunting quota was set at 0.5% of the Hunted population over the same period.
During the period 2000-2007 the Parks population declined at about 4% pa and the hunted population
increased at about 1% pa. Estimates from the simulation model indicate that this would have resulted from
7.9% illegal hunting in the Parks area and 3.2% in the Hunted area during this period.
From 2007 onwards, illegal hunting was set at 0.5% of the Hunted population. Between 2008 and 2014 the
Parks population increased to about 44,500 animals which required that the illegal hunting remained below
1.36% for the period concerned. The Hunted population, however, increased from 6,000 animals to 9,500
animals which required a rate of increase well in excess of normal growth rates. It is assumed some animals
must have moved from the Parks population to the Hunted area during this period. The immigration needed
to achieve the increase in the Hunted population is about 0.6% pa of the Parks population (bars in figure).
After providing the immigration required to enable the Hunted area population to reach 9,500 animals in
2014, the Parks population required the illegal hunting to be set at 0.8% of the population to achieve the
match with the population estimate.

31
Figure 5: ZAMBEZI VALLEY ELEPHANT POPULATION (Population simulation)
PAC was set at 25 animals/year for the Parks population and 50 animals/year for the hunted population
from 2001-2014. The Trophy Hunting quota was set at 0.5% of the Hunted population over the same period.
Between 2001 and 2003 both the Parks population and the Hunted population increased at a rate exceeding
normal growth rates. The 2001 estimates were increased slightly (remaining well within the confidence
intervals) to enable a match to be achieved using normal growth rates during this period.
From 2004-2014 both the Parks population and the Hunted population declined significantly, the decline in
the Hunted population being the more severe (from 15,700 to 8,700 animals). A fixed population offtake
was used to simulate the decline during this period and in the Hunted Area the annual offtake that achieves
a match with the population estimates is about 1,500 animals per year. At this rate the population will be
extinct in 2021.
32
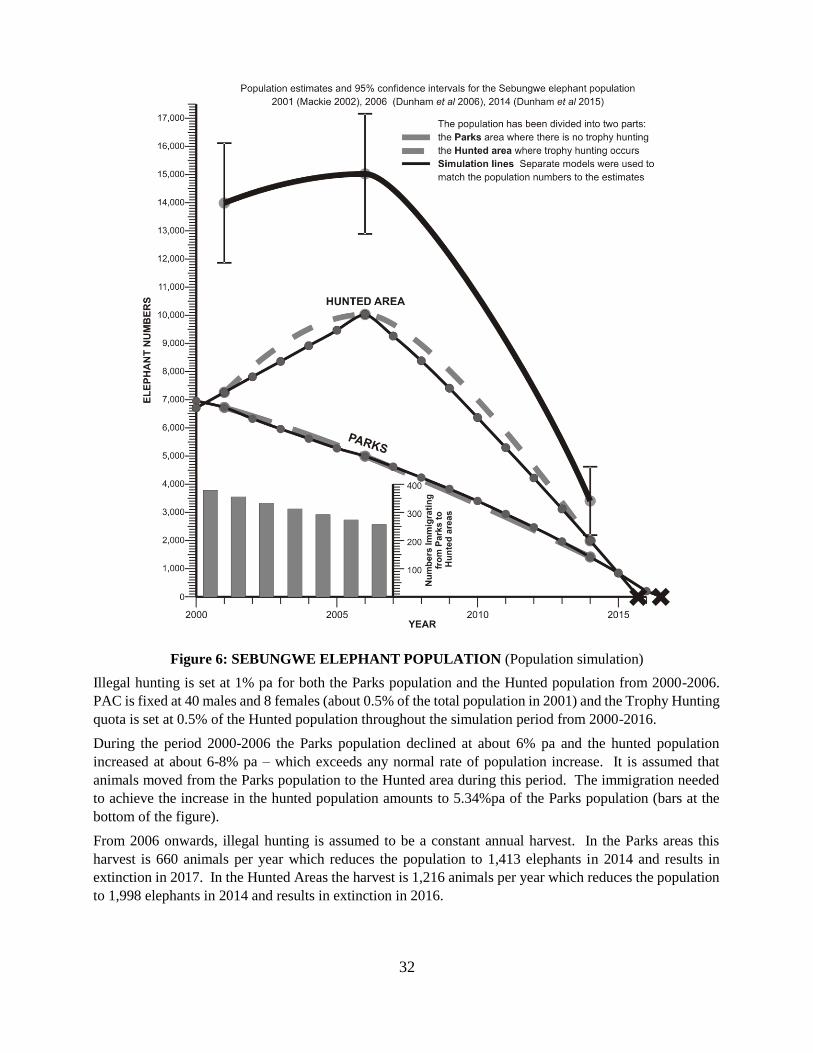
Figure 6: SEBUNGWE ELEPHANT POPULATION (Population simulation)
Illegal hunting is set at 1% pa for both the Parks population and the Hunted population from 2000-2006.
PAC is fixed at 40 males and 8 females (about 0.5% of the total population in 2001) and the Trophy Hunting
quota is set at 0.5% of the Hunted population throughout the simulation period from 2000-2016.
During the period 2000-2006 the Parks population declined at about 6% pa and the hunted population
increased at about 6-8% pa – which exceeds any normal rate of population increase. It is assumed that
animals moved from the Parks population to the Hunted area during this period. The immigration needed
to achieve the increase in the hunted population amounts to 5.34%pa of the Parks population (bars at the
bottom of the figure).
From 2006 onwards, illegal hunting is assumed to be a constant annual harvest. In the Parks areas this
harvest is 660 animals per year which reduces the population to 1,413 elephants in 2014 and results in
extinction in 2017. In the Hunted Areas the harvest is 1,216 animals per year which reduces the population
to 1,998 elephants in 2014 and results in extinction in 2016.
33
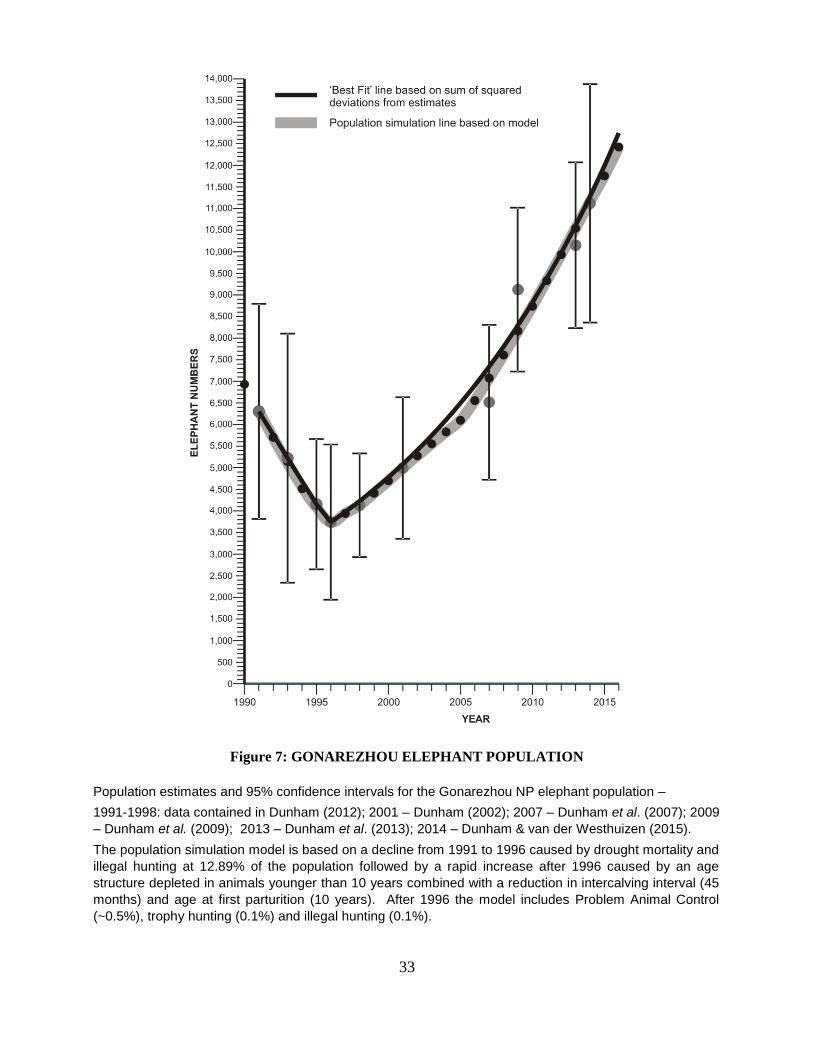
Figure 7: GONAREZHOU ELEPHANT POPULATION
Population estimates and 95% confidence intervals for the Gonarezhou NP elephant population –
1991-1998: data contained in Dunham (2012); 2001 – Dunham (2002); 2007 – Dunham et al. (2007); 2009
– Dunham et al. (2009); 2013 – Dunham et al. (2013); 2014 – Dunham & van der Westhuizen (2015).
The population simulation model is based on a decline from 1991 to 1996 caused by drought mortality and
illegal hunting at 12.89% of the population followed by a rapid increase after 1996 caused by an age
structure depleted in animals younger than 10 years combined with a reduction in intercalving interval (45
months) and age at first parturition (10 years). After 1996 the model includes Problem Animal Control
(~0.5%), trophy hunting (0.1%) and illegal hunting (0.1%).
34
Figure 8: EXPECTED IVORY PRICES AT OPEN AUCTIONS IN ZIMBABWE 2016
The formula used for the ivory price is –
Price (US$/kg) = A + B. (Tusk weight) 0.75
Where A and B are constants taking the values A = 50, B = 80
These are the prices being used by Martin & Stiles (2016)
35

36