xrd & sem studies of fly-ash and phosphogypsum based
TRANSCRIPT

International Journal of Engineering Trends and Technology Volume 69 Issue 6, 225-232, June, 2021 ISSN: 2231 – 5381 /doi:10.14445/22315381/IJETT-V69I6P232 © 2021 Seventh Sense Research Group®
This is an open access article under the CC BY-NC-ND license (http://creativecommons.org/licenses/by-nc-nd/4.0/)
XRD & SEM studies of Fly-ash and
Phosphogypsum based Geopolymer Bricks
Jandhyala Jagmohan Vijay*1, Prof Hanchate Sudarsana Rao*2, Prof. Vaishali. G. Ghorpade*3
*1 Research Scholar,2 & 3 Professors. Civil Engineering Department, JNTUA, Anantapur.Andhra Pradesh, India.
[email protected], [email protected],[email protected]
Abstract - Ever since the dawn of humans on this earth, there has been a constant endeavour to build better
shelters for various needs. Early man used to stay in caves,
forests, and other natural dwelling places; as time passed
and the human population increased, the need for cheaper
accommodation, which can be built faster and can last
longer, has increased. Eventually, Cement was
rediscovered and has ever since being used as a versatile
construction material. But the excessive use of Cement has
impacted the environment and is known to have caused
detrimental effects. Using eco-friendly alternatives in
place of Cement is the need of the hour. It would be better if such eco-friendly materials used for construction were
not mined, but if they were waste materials produced from
other industrial processes. These industrial processes are
unavoidable and shall continue to use for the betterment of
humankind. These industrial processes have a lot of waste
material that affect the environment causing air, water and
soil pollution. These waste materials end up being
discharged into water bodies, into the air, or ending up in
landfills; they can produce eco-friendly alternative
construction material like bricks and other cementitious
material, eventually replacing the present material, which has a high level of waste environmentally detrimental
effect. For the sake of this study, two such waste materials
are identified. These materials are fly-ash and
Phosphogypsum. When combined with alkaline substances
like sodium hydroxide and sodium silicate, these materials
produce a mixture with cementitious properties. This paste
can be used to make construction materials like bricks,
filler materials, and eventually, can be used as a
replacement for Cement.
Keywords: Environment, Geopolymers, Phosphogypsum,
Fly-ash, Diffraction.
I. INTRODUCTION
Demand for better infrastructure due to the increased
human population has increased construction activity.
Since Cement has been used extensively throughout
history for construction activity, its demand has risen to
meet the infrastructure development. But extensive use of
Cement has known to cause increased emission of Co2 and
other greenhouse gasses. Low carbon footprint building materials are the need of the hour, and geo-polymers may
present us with an excellent alternative. Geo-polymers are
non-organic synthesised polymer products consisting
mainly of aluminium or silicate compounds; these may be
naturally formed or synthetically formed in combination
with fly-ash and other pozzolanic material. Structural
properties like high tensile strength and compressive
strength, resistance to acid attack and sulphate, low water absorption, fire resistance etc., are some of the commonly
exhibited properties of Geo-polymers.
It is essential to study microstructure properties in addition to macro-properties of these materials. An attempt has
been made to corroborate the earlier studied macro-
properties of masonry brick (made with Phosphogypsum)
using microstructure analysis. For this study, the tools used
are Scanning electron microscope (SEM) and X-ray
Diffraction (XRD/EDX/PXRD).
II. EXAMINATION OF CURRENTLY AVAILABLE
LITERATURE
Yootaek Kim and Kyongwoo Lee [1] tested geopolymers
with six different Si/Al ratios using a transmission electron
microscope and concluded that they were exhibiting
micro-crystallite structures with 80-100 nano-sized also
nano crystallite structures of size 10-30 nanometres. The
geo-polymerisation process may have caused these
particles to form. High compressive strength may be a
result of these crystals and crystallites. Ahmad Muhd
Izzat et al. [2] studied geopolymer mortars and OPC
(Ordinary Portland Cement) and concluded that both
samples were prone to acid attack. The theory complies
with weight shifts and power degradation. However, with a
low percentage of weight changes and a decrease in
strength of 3.66 and 24.13 per cent, geopolymer mortar
was less vulnerable to acidic attack. OPC mortar showed
abysmal performance; 18.5 and 69.26 per cent respectively
in both weight changes and strength degradation. In the
microstructural photos, the stability of both materials was
detailed; The corroded part of the OPC mortar was revealed on the exposed surface. Stereo microscopic
images showed significant degradation of OPC mortar, and
SEM images showed the weakness of OPC mortar in acid
solution due to the high calcium percentage of OPC. On
the other hand, due to the absence of surface deteriorating
symptoms in the geopolymer matrix, the micrographs
analysis conformed the aluminosilicate network in
geopolymer was less susceptible in acidic solution
medium. Abideng Hawa, Danupon Tonnayopas,
Woraphot Prachasaree [3], Studied the effect of partially
replacing Metakaolin with Oil Palm ash. They investigated the variance of microstructure and compressive strength of
geo-polymer concrete subjected to heat curing for varying
periods. Compressive strength has increased due to the mix
having very little unreacted material and a compacted
dense matrix. Higher compressive strength may also have
been due to the formation of geo-polymers in the hot
mixture and Si-Al reaction, which produced

Jandhyala Jagmohan Vijay et al. / IJETT, 69(6), 225-232, 2021
226
aluminosilicate. Oliver Vogt et al. [4], from the results of
their studies, concluded that when 10 % fly-ash substitutes
metakaolin, it improves workability and delays the time of
settings, both initial and final, not much affecting the
microstructure and strength properties of the geopolymer's, particularly at larger l/s(liquid/solid) ratio. Pore size
distributions (porosimetry of intrusion by mercury) are
comparable between metakaolin geopolymer (containing
zero percentage fly-ash) and geopolymer (containing ten
percentage fly-ash) only at an l/s ratio of 0.6. Lower l/s
ratios majorly differentiate formulations between the two
types of geopolymers. When fly-ash content is above 20
per cent, the variation in strength and porosity is more
pronounced; pore size distribution variation is also widely
seen at this percentage of fly-ash. Greater l/s ratio and
greater fly-ash concentrations in geo-polymers are
produced due to lower concentrations of Al, due to which heat evolved in the first 24 hours of reaction. Mandeep
Kaur, Jaspal Singh, Manpreet Kaur [5] studied
geopolymer mortar containing fly ash. When Nano
metakaolin (NMK) proportion by weight of fly-ash was
varied as 0, 2, 4, 6, 8 and 10, it was observed that the
capacity of geopolymer mix moves toward higher side
when cured for longer periods. 70-80 % of total
compressive strength gained in 28 days of normal curing
was noted after 72 hours of curing a nano-metakaolin
integrated geopolymer mix in an ambient atmosphere. Up
to 4 % replacement Nano metakaolin, the compressive capacity is high. After 4 % replacement, the rise in
compressive capacity is very much low. The recovery
period of 28 days produced a compressive capacity of
52.77 Mpa. It is evident from the SEM study that the
increase in compressive capacity of the geopolymer (G.C.)
mix containing fly-ash at 4% of Nano-metakaolin is due to
the presence of aluminium oxide of NMK and silica. SEM
research also brought to light that the geopolymer mix
(GN-0) used for control has a lower density than the G.C.
mix containing 4% NMK; this effect shall be attributed to
the larger number of fly ash particles unreacted and
partially reacted. Therefore, compared to geopolymer mixes with 4 per cent NMK, this contributes to lower
compressive strength. EDS study reveals that with the
introduction of NMK, the compressive capacity of the mix
increases and the Si/Al ratio decreases. The lowered
strength of the geopolymer mix results from a higher Si/Al
ratio. The determination coefficient value (R2) is near one
for the various healing ages of 3, 7, 14 and 28 days; this
suggests the regression curve has a goodness of fit. Diegles
Simoes de Toledo Pereira et al. [6] conducted a
comparative study between the characteristics of
mechanical, thermal behaviour and microstructure, of concrete made of geo-polymer (G.C.) and Cement of high
performance (HPC-high Performance Portland cement)),
which lead to a new finding, which could have wide
applications in civil engineering. G.C. concrete just after 2
hours of age develops a good compressive strength. But
HPC based geopolymer remains a paste and does not
harden. Both concretes have similar compressive
capacities when ageing time is from 7 days to 2 years; this
leads to their application not only in building construction,
it also can be used for heavy loads like traffic pavements.
Fractography shows aggregate with small pores and
microcracks attached to a consistent single-phase
geopolymer web. The 3-phase HPC matrix, on the other
hand, reveals greater pores and fractures connected in conjunction with the aggregate web. XRD (X-ray
Diffraction) analysis results support the predicted
conversion of kaolinite crystal into amorphous metakaolin
form, a key component of the Geopolymer concrete (G.C.)
web. Microfractograph gives the interconnected porosity
and microcracks, which is support by the above XRD
study results. When DSC (Differential scanning
calorimetry) and TGA (Thermogravimetric analysis) tests
were conducted, between the temperature range of 25-
degree centigrade to 690-degree centigrade. The results
showed a higher thermal resistance of G.C. with a
substantially reduced mass and no decomposition of phase, as was the case with portlandite, Ca (OH)2, in HPC (high-
performance concrete). Such experimental findings help
G.C. application at high temperature, which is limited to
400-degree centigrade in HPC. Jagmohan Vijay
Jandhyala et al. [7] investigated bricks made from
Phosphogypsum, Fly-ash and alkaline solution, subjected
to drying in a hot air oven. This study led to the following
conclusions. The lowest compressive strength of these
bricks was 7.5 Mpa; this paste mix has application in filler
materials and infill walls. Bricks with a compressive
strength of 12.5 Mpa and above seen in some cases may have structural applications. Compressive strength is not
affected significantly by fly-ash content. However, the fly-
ash content lowers both dry and wet densities. The water
absorption is within the 20 % limit as prescribed by the I.S.
code. These bricks may find application in liquid retaining
structures. Jagmohan Vijay Jandhyala et al. [8] studied
the effect of Phosphogypsum and fly-ash in making air-
dried geopolymer bricks. The conclusions from those
studies are as follows. Air curing produces compressive
strength in the range of 12.5 Mpa, which has both load-
bearing and non-load-bearing applications. The presence
of fly-ash in the mixes gives slightly higher compressive capacities and lowered dry and bulk densities when
compared with mixes without fly-ash. The non-addition of
fly-ash in the mix causes the densities to go beyond 20
kN/m3, which is higher than the density of conventional
masonry bricks.
III. APPARATUS AND SUBSTANCES REQUIRED
A. Apparatus & Equipment 1. Conductive carbon adhesive tapes.
2. Specimen Mounts.
3. Specimen sample holder.
4. SEM. (Scanning Electron Microscope.)
5. XRD Equipment.
B. Substances required
a) Fly-ash:
60-65 % fly-ash confirming to Grade 2 as per IS 3812 was
used. Ramagundam, Telangana, National thermal Power
Corporation is the source of this fly-ash used.

Jandhyala Jagmohan Vijay et al. / IJETT, 69(6), 225-232, 2021
227
b) Phosphogypsum:
Finely ground Phosphogypsum powder (Refer to Fig 1.)
sourced from Coromandel fertilisers, Kakinada was used.
The main elemental contents are 18 % sulphur,22 %
calcium and 3-4 % moisture.
c) Coarse Aggregate:
Aggregate conforming to I.S. 383:1970.
d) Sand (Fine aggregate):
River sand conforming to I.S. 383:1970.
e) Sodium Hydroxide (NaOH):
Sodium Hydroxide pellets of 99% concentration with a
molarity of 10 were used to make the alkaline solution
(Refer Fig 2.)
Fig 1: Finely ground Phosphogypsum.
Fig 2: Sodium Hydroxide pellets.
f) Sodium silicate (Na2Sio3):
10 Molar sodium silicate was used for making an alkaline
solution. (Refer Fig 3.).
Fig 3: Sodium silicate crystals.
IV. EXPERIMENTAL PROCEDURE
A. Procedure
Mixes(paste) were made by combining Phosphogypsum,
Fly-ash and alkali solution (sodium hydroxide and sodium
silicate). Some Bricks have been without fly-ash. Samples made with fly-ash were called ‘S1’, and those samples
made without fly-ash were called ‘S2’.
The S1 and S2 samples have been subject to micro-
structure testing tools like SEM analysis and Powder X-ray Diffraction (PXRD). The microstructure properties
obtained from SEM analysis were used to corroborate the
macrostructure properties, published in earlier papers by
Jagmohan Vijay Jandhyala. et.al. [7,8]. (Refer Table 1.)
a) Sample Preparation for SEM (Scanning Electron
Microscope) Analysis
1). The sample material has been subjected to evaporative
drying inside a vacuum chamber to eliminate all moisture
content. The presence of moisture may intervene with the
SEM and PXRD signals. (Fig: 4).
2). Next, 1 cm x 1 cm samples of each material were made
and placed in a circular specimen mount, along with
several such specimens. (Fig: 5). The samples on the
mould were covered by conductive carbon tape. Several
such moulds are required.
Fig 4: Vacuum Drying Chamber
Fig 5: SEM Sample Specimen mount preparation.
3). The mould was placed inside the SEM, and the images
of various specimens have been taken at different voltages
(electrical conductivity) and resolutions. (Fig: 6).
4). The images obtained have been studied, analysed and
inferences have been drawn.
Fig 6: Scanning electron microscope.
2) Sample Preparation for X-Ray Diffraction (PXRD)
1). The sample material has been subject to evaporative
drying inside a vacuum chamber to eliminate all moisture
content. The presence of moisture may intervene with the
SEM and PXRD signals.
2). Next, a sample of each material to be tested is made
and placed in a circular specimen holder. But unlike SEM
analysis, only one specimen is tested in each cycle of
PXRD (Fig: 7). Several such moulds are required.
Jandhyala Jagmohan Vijay et al. / IJETT, 69(6), 225-232, 2021
228
3) The moulds have been placed inside the x-ray
diffraction machine, and the spectra of the specimen are
taken. (Fig: 8).
4) The procedure from steps 1-4 have been repeated for
each specimen individually.
5) The x-ray diffraction spectrums obtained have been
studied, analysed and inferences have been drawn.
Fig 8: X-ray diffraction device
Fig 7: PXRD Sample Specimen mount preparation.
V. Results and Inferences
A. Results
TABLE 1: Brick Properties Vs Percentages of Phosphogypsum and fly-ash that have been obtained from previously
published papers by Jagmohan Vijay Jandhyala. et al. [7,8] are presented in table no 1.
S.L
. N
O.
“P
ER
CE
NT
AG
E O
F
PH
OS
PH
OG
YP
SU
M I
N
SA
MP
LE
S 1
& 2
”
“C
OM
PR
ES
SIV
E
ST
RE
NG
TH
(S
1),
MP
A”
"%
WE
IGH
T G
AIN
(WA
TE
R
AB
SO
RP
TIO
N)
(S1
).”
“D
RY
DE
NS
ITY
(S
1)
IN
KG
/M^
3”
“B
UL
K D
EN
SIT
Y (
S1
)
IN K
G/M
^3
”
“P
ER
CE
NT
AG
E O
F
FL
Y-A
SH
IN
SA
MP
LE
1”
“C
OM
PR
ES
SIV
E
ST
RE
NG
TH
(S
2),
MP
A”
“%
WE
IGH
T G
AIN
(WA
TE
R
AB
SO
RP
TIO
N)
(S2
).”
“D
RY
DE
NS
ITY
(S
2)
IN
KG
/M^
3”
“B
UL
K D
EN
SIT
Y (
S2
)
IN K
G/M
^3
”
1 9 20.31 17.81 1670.36 1967.84 9 17.11 17.17 2010.36 2312.18
2 10 21.78 17.61 1669.79 1963.85 10 18.12 17.77 2000.22 2280.23
3 11 22.65 17.56 1669.16 1962.24 11 18.91 18.05 1998.34 2270.67
4 12 22.95 17.73 1668.46 1964.21 12 19.11 18.17 1968.88 2262.92
5 13 23.13 17.68 1667.69 1962.48 13 19.18 18.28 1908.22 2259.92
6 14 23.06 17.66 1666.82 1961.29 14 20.37 18.62 1905.59 2260.28
7 15 22.85 17.66 1665.85 1960.03 15 20.97 18.68 1902.63 2258.03
8 16 22.49 17.68 1664.75 1959.07 16 21.11 18.66 1899.27 2253.67
9 17 21.95 17.7 1663.49 1957.83 17 21.08 18.64 1895.43 2248.79
10 18 21.27 17.67 1662.03 1955.73 18 21.04 18.67 1891 2244.10
11 19 20.49 17.68 1660.33 1953.81 19 21.1 18.67 1885.83 2237.92
12 20 19.58 17.69 1658.33 1951.64 20 21.15 18.67 1879.73 2230.64
13 21 18.6 17.67 1655.92 1948.39 21 20.99 18.69 1872.4 2222.35
14 22 17.56 17.57 1652.98 1943.38 22 20.7 18.64 1863.44 2210.84
15 23 16.38 17.61 1649.3 1939.69 23 19.42 18.68 1852.25 2198.29
16 24 15.22 18.18 1644.57 1942.8 24 18.73 18.69 1837.86 2181.36
17 25 15.13 18.47 1622.17 1942.8 25 17.45 18.75 1818.67 2157.92
18 MAX 23.13 18.47 1670.36 1967.84 MAX 21.15 18.75 2010.36 2312.18
19 MIN 15.13 17.56 1622.17 1939.69 MIN 17.11 17.17 1818.67 2157.92
20 AVG 20.32 17.74 1659.53 1955.12 AVG 19.80 18.44 1905.30 2240.59
Jandhyala Jagmohan Vijay et al. / IJETT, 69(6), 225-232, 2021
229
TABLE 2: Percentages of elements in various samples obtained from X-ray diffraction studies are presented in
table no 2.
Element S1(I) S1(ii) S1(iii) S1(iv) AVG(S1) S2(a) S2(ii) S2(iii) S2(iv) AVG(S2)
OXYGEN 19.1 21.2 19.6 20.2 20 18.9 18.1 19.6 19.3 19
SODIUM 6.3 5.9 6.1 5 5.8 9.1 8.6 8.6 7.8 8.5
ALUMINIUM 2.7 2.3 1.9 2.5 2.4 1.7 1.4 2.1 2.1 1.8
SILICON 18.2 15.9 16.2 18.1 17.1 21.5 25.3 23.2 25.7 23.9
PHOSPHOROUS 5.3 5.4 4.8 5.5 5.3 8.9 8.1 8.9 8.4 8.6
SULPHUR 20.7 20.3 22 20.7 20.9 13.2 13.8 10.9 12.1 12.5
CALCIUM 25.8 22.9 24.5 22.7 24 19.1 17.3 18.4 18.3 18.3
CARBON 2 5.9 4.9 5.3 4.5 9.1 5.7 9.2 6.4 7.6
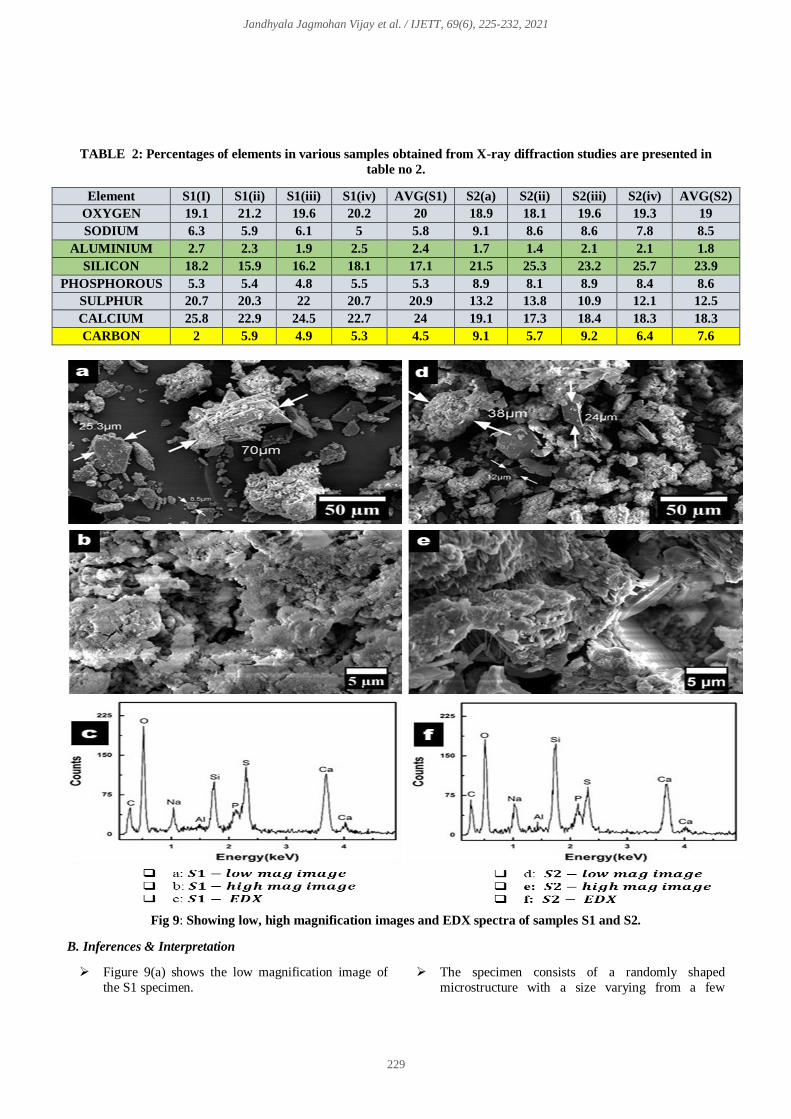
Fig 9: Showing low, high magnification images and EDX spectra of samples S1 and S2.
B. Inferences & Interpretation
Figure 9(a) shows the low magnification image of
the S1 specimen.
The specimen consists of a randomly shaped
microstructure with a size varying from a few
Jandhyala Jagmohan Vijay et al. / IJETT, 69(6), 225-232, 2021
230
micrometres to a maximum of 70 μm, as shown in
the figure.
To look at the surface of each such microstructure,
images were taken at significantly higher
magnifications. One such high magnification image
has been shown in figure 9(b).
The surface of each microstructure looks highly
porous, suggesting that these microstructures are
clusters of hundreds of nanoparticles. Such a
structure is usually known to give high porosity for
any material. (Figure 9(b).)
Figure 9(d) shows a low magnification image of S2.
When compared to the S1 image at the same
magnification (Figure 9(a)), it was seen that the
number of microstructures has increased.
Careful observation reveals that the average size of
available microstructures has decreased
considerably. Size has been seen to range between 12
μm to 38 μm in this particular area.
By comparing figures 9(a) and 9(d), it was inferred
that the average size of microstructures has
decreased in S2. In figure 9(e), the S2 specimen has
also been showing porous surface morphology,
which has also been seen in the case of S1 (Figure
9(b)).
To know the chemical composition of specimen S1,
EDX scans were taken at different locations. One
such representative EDX spectrum has been shown
in Figure 9(c).
EDX spectrum shows that the S1 specimen contains
a host of elements, including carbon, oxygen,
sodium, silicon, sulphur and calcium. It has also
shown trace amounts of aluminium as well. (Refer to
table 2.)
To know any morphological difference between S1
and S2, high magnification images of S2 specimen
have been taken, similar to images taken in the case
of S1 specimen. The corresponding EDX spectrum (Figure 9(f)) also shows the same elements as seen in
the case of S1 (Figure 9(c)).
However, careful measurement reveals that the
elemental percentage changes substantially between
S1 and S2.
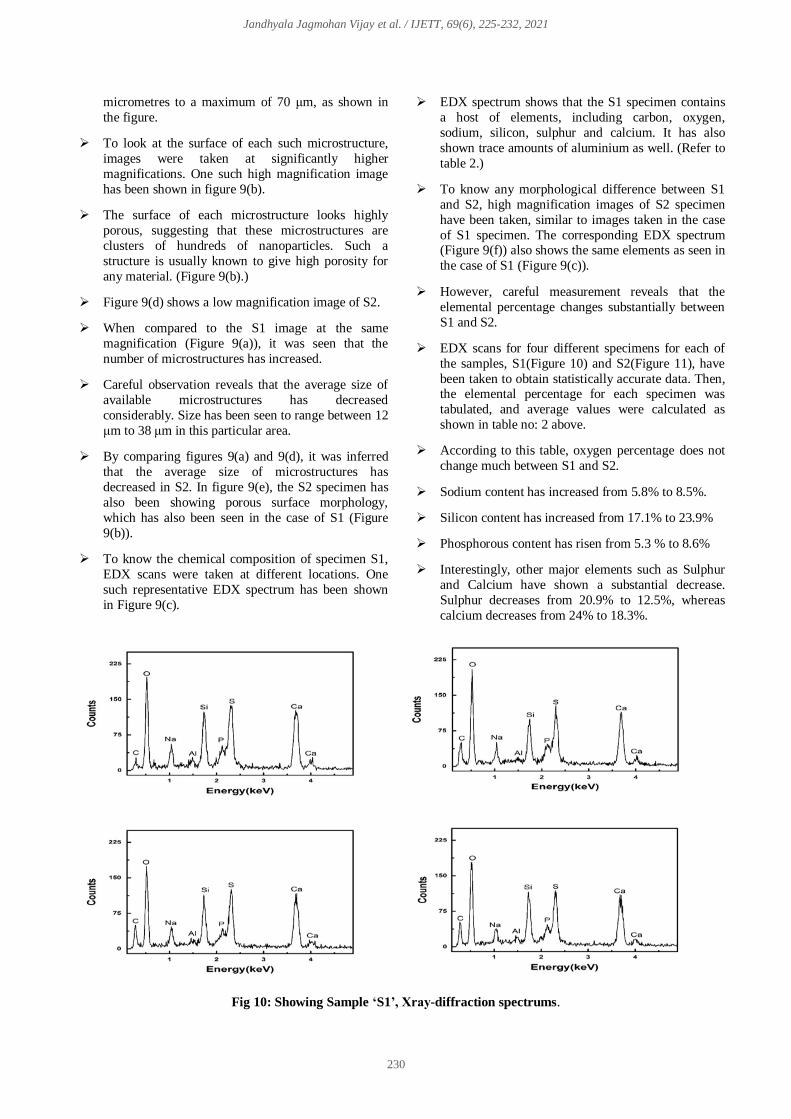
EDX scans for four different specimens for each of
the samples, S1(Figure 10) and S2(Figure 11), have
been taken to obtain statistically accurate data. Then, the elemental percentage for each specimen was
tabulated, and average values were calculated as
shown in table no: 2 above.
According to this table, oxygen percentage does not
change much between S1 and S2.
Sodium content has increased from 5.8% to 8.5%.
Silicon content has increased from 17.1% to 23.9%
Phosphorous content has risen from 5.3 % to 8.6%
Interestingly, other major elements such as Sulphur
and Calcium have shown a substantial decrease.
Sulphur decreases from 20.9% to 12.5%, whereas
calcium decreases from 24% to 18.3%.
Fig 10: Showing Sample ‘S1’, Xray-diffraction spectrums.

Jandhyala Jagmohan Vijay et al. / IJETT, 69(6), 225-232, 2021
231
Fig 11: Showing sample S2, Xray diffraction spectrum.
C. Brick Properties correlated to SEM and EDX.
TABLE 3: Silicon to the Aluminium ratio in different sample specimens obtained from x-ray diffraction analysis
are presented in table 3.
Element/Ratio ‘S1’(i) ‘S1’
(ii) ‘S1’1(iii)
‘S1’
(iv) AVG Element/Ratio ‘S2’(i) ‘S2’(ii) ‘S2’(iii) ‘S2’(iv)
SILICON 18.2 15.9 16.2 18.1 17.1 21.5 25.3 23.2 25.7 23.9
ALUMINIUM 2.7 2.3 1.9 2.5 2.4 1.7 1.4 2.1 2.1 1.8
SILICON:
ALUMINIUM 6.74 6.91 8.53 7.24 7.13 12.65 18.07 11.05 12.24 13.28
MAX 8.53 MAX 18.07
MIN 6.74 MIN 11.05
a) Compressive Strength:
The compressive strength is higher in the case of sample
S1 than in sample S2. The compressive strength in both
cases is in the range of 15.13 Mpa - 23.13 Mpa. So, the
higher compressive capacity mix may be used for building
construction applications as well. The lower strength mixes find application as filler material and other non-
structural applications. A low liquid / solid ratio and high
alkaline concentration (10 M) may have been one of the
parameters affecting compressive capacity. The ratio of
Si/Al (Table 3.) also plays a role in determining the
compressive strength, and a lower Si/Al ratio results in
higher compressive strength. In the case of sample S1, the ratio of Si/Al is lower than that of the corresponding
values of S2. From table 1, it was inferred that S1 paste is
having higher compressive strength than S2. It was seen
that the ratio of Si/Al has been varying slightly, and at
someplace, the variation is higher. Corresponding
compressive strength has also been varying accordingly;

Jandhyala Jagmohan Vijay et al. / IJETT, 69(6), 225-232, 2021
232
when the Si/Al ratio has been somewhat changing, the
compressive strength also changes slightly. When the
Si/Al ratio changes are more significant, the variation in
compressive strength is also higher.
b) Water absorption:
Water absorption has been higher in the case of both
samples S1 and S2. From SEM images (from figure 9(b)
and 9(e)), it was inferred that hundreds of nano-sized
particles are present, which may have led to a highly porous structure. These pores have been filled with water
when the paste in the shape of brick was kept immersed in
water for 24 hours. So, this water that has been retained in
the pores leads to high water absorption.
c) Dry density and Wet density:
Wet density is higher in both samples S1 and S2; the
highly porous structure leads to volumetric bulking on
water absorption due to the pores getting filled with water,
leading to more mass and wet density. When dry density is
measured, the paste mix is totally dried, so all the water
from the pores leaves the paste mix, leading to volumetric
shrinkage and lower mass. Thus, the dry density also
decreases and is lower than wet density.
VI. Conclusions and Recommendations
Since the specimen were dispersed on conductive carbon
tape, the carbon content in the specimen may not be
precisely known, as the signals may also include carbon
tape signals. Other studies may have to be taken up for the
accurate assessment of carbon content. The various macrostructure properties with and without fly-ash have
were corroborated. Samples S1 and S2 were investigated
using SEM and EDX scans. The specimen consists of a
randomly shaped microstructure with sizes varying from
few microns to 70 microns. The structure is highly porous,
leading to low densities, both dry and wet. The water
absorption is due to the pore’s spaces getting filled with
water molecules. The higher compressive strength is due to
the relatively low liquid-solid ratio using 10M alkali
solution. The effect of other alkaline solutions with
different molarities may be studied in further research. The
impact of different pozzolanic materials like rice husk, corn waste, bagasse etc., may be explored in future
research. Other studies like TGA (thermogravimetric
analysis) and DSC (differential scanning calorimeter) need
to be taken up to understand the geopolymer paste's micro-
properties further.
VII. REFERENCES [1] Yootaek Kim, Kyongwoo Lee, Transmission Electron Microscopic
Analysis of Geopolymer Made of Fused Slags, Proceedings of the
2015 International Conference on Sustainable Energy and
Environmental Engineering, (2015) 189-192.
https://dx.doi.org/10.2991/seee-15.2015.47
[2] Ahmad Muhd Izzat, Abdullah Mohd Mustafa Al Bakri, Hussin
Kamarudin, Ligia Mihaela Moga, Ghazali Che Mohd Ruzaidi,
Mohd Tahir Muhammad Faheem, Andrei Victor Sandu, (2013),
Microstructural Analysis of Geopolymer and Ordinary Portland
Cement Mortar Exposed to Sulfuric Acid. Materiale Plastice.
September, 50. https://www.mdpi.com/1996-1944/12/19/3115.
[3] Abideng Hawa, Danupon Tonnayopas, Woraphot Prachasaree,
Performance Evaluation and Microstructure Characterization of
Metakaolin-Based Geopolymer Containing Oil Palm Ash”,
Hindawi Publishing Corporation, The Scientific World Journal
Volume 2013, Article ID 857586, 9 pages.
http://dx.doi.org/10.1155/2013/857586.
[4] Oliver Vogt, Neven Ukrainczyk, Conrad Ballschmiede and Eddie
Koenders, Reactivity and Microstructure of Metakaolin Based
Geopolymers: Effect of Fly Ash and Liquid/Solid, Materials
12(21) 3485. https://doi.org/10.3390/ma12213485.
[5] Mandeep Kaur, Jaspal Singh, Manpreet Kaur, “ Microstructure
and strength development of fly ash-based geopolymer mortar:
Role of nano-metakaolin”, Construction and Building Materials,
Volume 190, 30 November (2018) 672-679.
https://doi.org/10.1016/j.conbuildmat.2018.09.157
[6] Diegles Simoes de Toledo Pereira, Felipe Jose da Silva, Ana
Beatriz Rodrigues Porto, Veronica Scarpini Candido, Alisson Clay
Rios da Silva, Fabio Da Costa Garcia Filho, Sergio Neves
Monteiro, "Comparative analysis between properties and
microstructures of geopolymer concrete and Portland concrete”,
Journal of Materials Research and Technology, 7(4) (2018) 606-
611, https://doi.org/10.1016/j.jmrt.2018.08.008
[7] Jagmohan Vijay Jandhyala, Prof. H. Sudarsana Rao, Prof.
Vaishali. G. Ghorpade, “Feasibility Study on Production of
Geopolymer Masonry Bricks with Phosphogypsum and Fly Ash
(Oven-Dried)”, International Journal of Engineering Research and
Technology. ISSN 0974-3154, 13(6) (2020) 1330-
1343.https://dx.doi.org/10.37624/IJERT/13.6.2020.1330-1343
[8] Jagmohan Vijay Jandhyala, Prof. H. Sudarsana Rao, Prof.
Vaishali. G. Ghorpade, Geopolymer Masonry Bricks production
using Phosphogypsum and Fly Ash (Air-Dried samples) – A
Detailed Feasibility study, International Journal of Engineering
Research and Technology. ISSN 0974-3154, 13(12) (2020) 4758-
4772. http://irphouse.com/ijert20/ijertv13n12_97.pdf
[9] Blesson Mathai, Prof. Cijo Mathew, Prof. Pratheesh K, Dr Cibu K
Varghese, Effect of Silicon on Microstructure and Mechanical
Properties of Al-Si Piston Alloys, International Journal of
Engineering Trends and Technology (IJETT), V29(6),299-303
November 2015. ISSN:2231-5381. www.ijettjournal.org.
Published by seventh sense research group.
https://dx.doi.org/10.14445/22315381/IJETT-V29P256
[10] C.E Akili, M. Alami, A. Bouayad, Article: Cooling Rate Effect
Study on the Microstructure and Hardness of Hypereutectic
Aluminium Al-18%Si Elaborated by V-process, International
Journal of Engineering Trends and Technology (IJETT), 7(2),65-
70, published by seventh sense research group.
https://dx.doi.org/10.14445/22315381/IJETT-V7P233
[11] S.A Tukur, M. M Usman, Isyaku Muhammad, N. A Sulaiman,
Effect of Tempering Temperature on Mechanical Properties of
Medium Carbon Steel, International Journal of Engineering Trends
and Technology (IJETT), V9(15) (2014) 798-800. ISSN:2231-
5381 www.ijettjournal.org. published by seventh sense research
group.
https://dx.doi.org/10.14445/22315381/IJETT-V9P350
[12] Anu Saini, Ashok Kumar, Vijay Kumar Anand, Suresh Chander
Sood, “Synthesis of Graphene Oxide using Modified Hummer’s
Method and its Reduction using Hydrazine Hydrate”, International
Journal of Engineering Trends and Technology (IJETT), V40(2)
(2016) 67-71. ISSN:2231-5381. www.ijettjournal.org. published
by seventh sense research group.
https://dx.doi.org/10.14445/22315381/IJETT-V40P211