xecutive summary - ntdc
TRANSCRIPT


i
Executive Summary
Executive Summary
Islamabad Electric Supply Company (IESCO) is supplying power to the civil districts of
Islamabad capital, Rawalpindi, Attock, Chawkwal and Jehlum.This Company came into
existence in the year 2001 after unbundling of WAPDA system. Earlier it was known as
Islamabad Area Electricity Board (AEB). Its distribution network in the year 2001 was
comprised of forty six 132 kV, fourteen 66 kV and five 33kV sub-stations and in year 2013-14 it
has sixty eight 132 kV, nine 66 kV and five 33 kV sub-stations.
Peak demand of IESCO in the year 2013-14 was recorded as 1447 MW, energy sale was 8192
GWh and energy purchased was 9048 GWh. The total number of consumers in 2013-14 was
2.379 million out of which 2.01 million were domestic, 0.341 million were commercial and
0.0081 million were agricultural. In the year 2013-14 total sale of IESCO in terms of megawatt
was 1311 MW, for the domestic sector it was 843 MW, for medium & large industries it was 334
MW and for small industries it was 24 MW. The shares of domestic sector and industrial sector
were 60.7% and 24.6% respectively with respect to total energy sale.
This forecast has been computed on the basis of Power Market Survey (PMS) methodology by
the IESCO (PMS) team under the supervision of planning power, (NTDCL). The year 2013-14
has been taken as base year and the forecast horizon is ten years up to 2023-24. The base year
sale data (feeder wise consumer category-wise energy sale) and the expected spot loads data at
the locations of different sub-stations have been collected by IESCO power market survey team.
Data for the base year has also been adjusted for the estimates of un-served energy (load
shedding) in order to have realistic figures.
Forecast results show that in the years 2017-18 and 2023-24 energy sale will be 10975 GWh and
15364 GWh, peak demand will be 2749 MW and 3758 MW, and energy purchased will be
12099 GWh and 16944 GWh respectively. For the period 2013-14 to 2023-24, annual average
compound growth rate of energy sale, peak demand and energy purchased will be 6.49%, 5.85%
and 6.47% respectively.
To further refine the forecast and making it helpful for planners following additions have been
made in this issue;
Civil Administrative Division-wise energy and demand forecast
Civil Administrative District-wise energy and demand forecast
Month-wise demand projection
Overloaded 132 kV substations
List of existing substations with their MVA capacities
A realistic forecast, saves over investment as well as under investment, meaning thereby timely
recovery of revenue and no constraints in the supply of power (load shedding) respectively. This
kind of forecast can only be prepared by applying proper methodology with authentic data. The
results of previous PMS forecasts were very close to the actual which proves the authenticity of
methodology and data. This report highlights the salient features of load forecast of the company.
Planning Power, NTDCL firmly believes that the readers’ comments/suggestions on this report
will help in improving energy and demand forecast in future.


ii
Table of Contents
1 Introduction ........................................................................................................................... 1
2 Historical Supply and Demand Analysis ............................................................................. 3
2.1 Category-wise Sale ........................................................................................................................ 3
2.2 Transmission and Distribution Losses ........................................................................................... 4
2.3 Recorded and Computed Peak Demand ....................................................................................... 5
2.4 Number of Consumers .................................................................................................................. 5
3 Power Market Survey Methodology .................................................................................... 6
3.1 Overview ....................................................................................................................................... 6
3.2 Survey Base Data ........................................................................................................................... 6
3.3 Input Parameters .......................................................................................................................... 7
3.4 Growth Rates ................................................................................................................................ 7
3.5 Losses ............................................................................................................................................ 8
3.6 Load Factors .................................................................................................................................. 8
3.7 Coincidence Factors ...................................................................................................................... 9
3.8 Forecast Calculations .................................................................................................................... 9
3.9 Energy Calculations ..................................................................................................................... 10
3.10 Peak Demand Calculations .......................................................................................................... 10
3.11 Accumulations ............................................................................................................................. 10
4 PMS Forecast Results .......................................................................................................... 11
4.1 Recorded Forecast (Excluding Load Shedding) ........................................................................... 11
4.2 Computed Forecast (Including Load Shedding) .......................................................................... 11
4.3 Category-wise Forecasted Energy Sale (GWh) ............................................................................ 12
4.4 Category-wise Power Demand (MW) ......................................................................................... 12
4.5 Peak Demand of Substations ...................................................................................................... 13
4.6 Per Capita Consumption ............................................................................................................. 13
4.7 Category-wise Substation-wise Energy and Demand Projections .............................................. 13
4.8 Civil Administrative Area Forecast .............................................................................................. 13
4.9 Monthly Demand (MW) Projections ........................................................................................... 14
4.10 List of Overloaded Substations ................................................................................................... 14
4.11 List of Grids with their Codes and MVA Capacities ..................................................................... 14
Disclaimer .................................................................................................................................... 47


iii
List OF Figures
List of Figures
Figure 1- 1: Computed Demand Forecast ....................................................................................... 1 Figure 1- 2: Historical Category-wise Sale ..................................................................................... 3 Figure 1- 3: Historical Transmission and Distribution Losses ....................................................... 4 Figure 1- 4: Historical Recorded and Computed Peak Demand ..................................................... 5 Figure 1- 5: Number of Consumers ................................................................................................ 5 Figure 1- 6: Computed Peak Demand ........................................................................................... 11 Figure 1- 7: Energy Purchased VS Energy Sale ........................................................................... 11 Figure 1- 8: Forecasted Category-wise Sale ................................................................................. 12 Figure 1- 9: Per Capita Consumption ........................................................................................... 13 Figure 1- 10: Distribution Network Map ...................................................................................... 46

iv
List Of Tables
List of Tables
Table 1-1: PMS Recorded Forecast (Excluding Load Shedding) ............................................................... 15
Table 1-2: PMS Base Forecast .................................................................................................................... 16
Table 1-3: Category-wise Sale – GWh (Excluding Load Shedding) .......................................................... 17
Table 1-4: Category-wise Sale – GWh (Base Forecast) ............................................................................. 18
Table 1-5: Category-wise Demand – MW (Excluding Load Shedding) ..................................................... 19
Table 1-6: Category-wise Demand – MW (Base Forecast) ........................................................................ 20
Table 1-7: District-wise Energy (GWh), Generation (GWh) and Demand (MW) Forecast For District:
Attock .......................................................................................................................................................... 21
Table 1-8: District-wise Energy (GWh), Generation (GWh) and Demand (MW) Forecast For District:
Chakwal ...................................................................................................................................................... 22
Table 1-9: District-wise Energy (GWh), Generation (GWh) and Demand (MW) Forecast For District:
Islamabad .................................................................................................................................................... 23
Table 1-10: District-wise Energy (GWh), Generation (GWh) and Demand (MW) Forecast For District:
Jhelum ......................................................................................................................................................... 24
Table 1-11: District-wise Energy (GWh), Generation (GWh) and Demand (MW) Forecast For District:
Rawalpindi .................................................................................................................................................. 25
Table 1-12: Division-wise Energy (GWh), Generation (GWh) and Demand (MW) Forecast For Division:
Rawalpindi .................................................................................................................................................. 26
Table 1-13: Monthly Peak Demand Forecast ............................................................................................. 27
Table 1-14: List of Overloaded Substations during Period 2013-14 to 2023-24 Overloading
Criteria=100% ............................................................................................................................................. 28
Table 1-15: List of Overloaded Substations during Period 2013-14 to 2023-24 Overloading
Criteria=85% ............................................................................................................................................... 30
Table 1-16: List of Grids with their Codes and MVA Capacities .............................................................. 32
Table 1- 17: Maximum Demand (MW) of Substations ............................................................................. 34
Table 1- 18: Category-wise Maximum Demand (MW) of Substations ..................................................... 40

1
IESCO
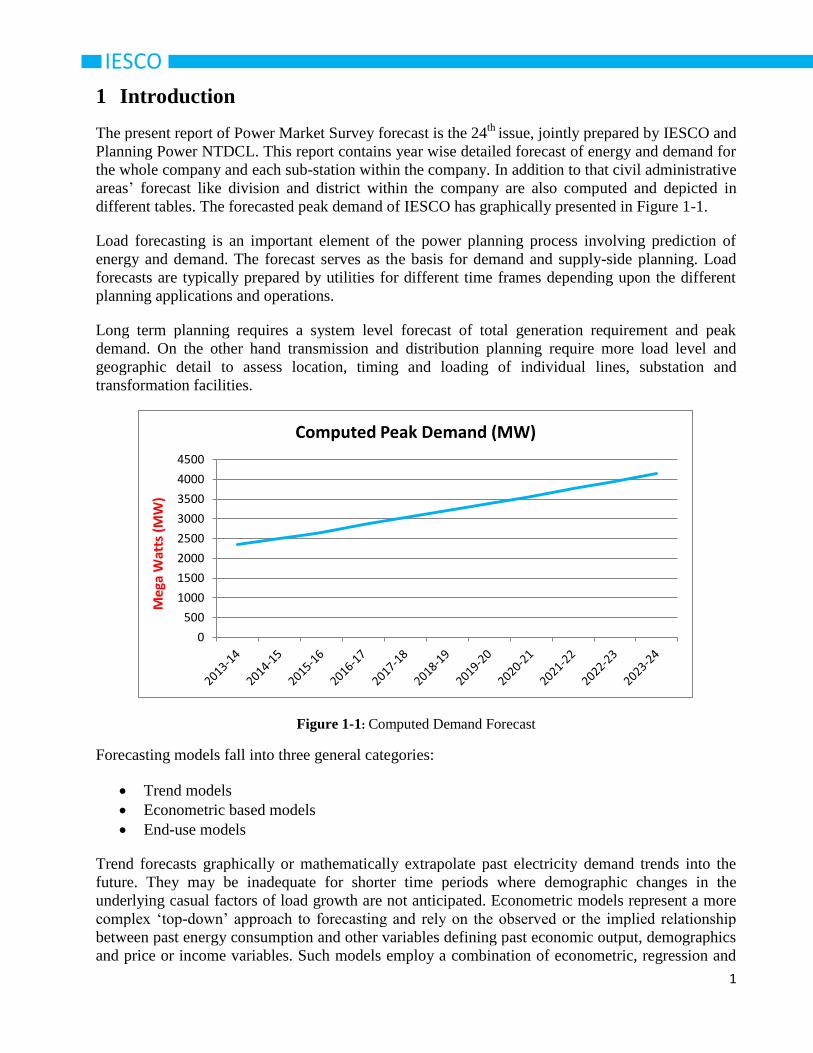
1 Introduction
The present report of Power Market Survey forecast is the 24th
issue, jointly prepared by IESCO and
Planning Power NTDCL. This report contains year wise detailed forecast of energy and demand for
the whole company and each sub-station within the company. In addition to that civil administrative
areas’ forecast like division and district within the company are also computed and depicted in
different tables. The forecasted peak demand of IESCO has graphically presented in Figure 1-1.
Load forecasting is an important element of the power planning process involving prediction of
energy and demand. The forecast serves as the basis for demand and supply-side planning. Load
forecasts are typically prepared by utilities for different time frames depending upon the different
planning applications and operations.
Long term planning requires a system level forecast of total generation requirement and peak
demand. On the other hand transmission and distribution planning require more load level and
geographic detail to assess location, timing and loading of individual lines, substation and
transformation facilities.
Figure 1-1: Computed Demand Forecast
Forecasting models fall into three general categories:
Trend models
Econometric based models
End-use models
Trend forecasts graphically or mathematically extrapolate past electricity demand trends into the
future. They may be inadequate for shorter time periods where demographic changes in the
underlying casual factors of load growth are not anticipated. Econometric models represent a more
complex ‘top-down’ approach to forecasting and rely on the observed or the implied relationship
between past energy consumption and other variables defining past economic output, demographics
and price or income variables. Such models employ a combination of econometric, regression and
0
500
1000
1500
2000
2500
3000
3500
4000
4500
Me
ga W
atts
(M
W)
Computed Peak Demand (MW)

2
IESCO time series forecast techniques. End-use models relate energy use to the physical appliance stock
levels, to the use patterns or to the industrial process. These end use models represent a ‘bottom-
up’ forecasting approach and normally incorporate disaggregate end use forecast and consumer
survey techniques.
This report has been prepared on the basis of Power Market Survey Methodology and the model
used is called Power Market Survey (PMS) model. This model is a form of end use model which
provides energy and power projection for all distribution companies and all grid stations within the
company.
The PMS model relies on an extensive data base of historical sales. The data base includes
consumption by consumer type (i.e. domestic, industrial and commercial etc.) on a grid station and
grid station feeder basis. Actual consumption data are adjusted for un-served demands attributed to
load shedding.
Energy forecasts are computed for each consumption category at the sub area level on the basis of a
trend analysis of recent per consumer sales plus new consumer connection applications. Industrial
forecasts are based on interviews with existing consumers, trend projections and a review of the
applications for request of new and increased service. These analyses are repeated for each sub area
for each of the years to be forecast. The annual peak demand is determined from the resulting
energy forecasts by using the load factors and diversity factors developed for each consumer
category. Forecasts are then aggregated to system level.
Because the PMS forecast is based on a mix of end-use, trend projection and known consumer
expansion plans, it cannot be used reliably to predict demand over the longer term. This model had
not been created to predict impacts of changes in growth of different economic sectors or
consumers categories over time, or changes in both the absolute and relative prices of electricity,
and of changes in the relationships between income growth and electricity growth over time as a
result of market saturation and technological change (in order to capture these changes NTDCL is
using another model called regression model). Regression model is used for long term forecasting
as the changes in growth are occurred due to change in technology, life style over a longer time
period.
The Power Market Survey forecast model most closely approaches the requirements of power
system planning. It provides the level of detail required for siting studies and transmission and
substation planning, as well as the sectoral detail necessary to assess different sector growth rates
and their impacts on load shapes, both for the system, DISCOs and grid stations. In addition,
because it also makes specific provision for load shedding i.e. suppressed demand, it provides a
reasonable approximation of unconstrained load growth.
3
IESCO
2 Historical Supply and Demand Analysis
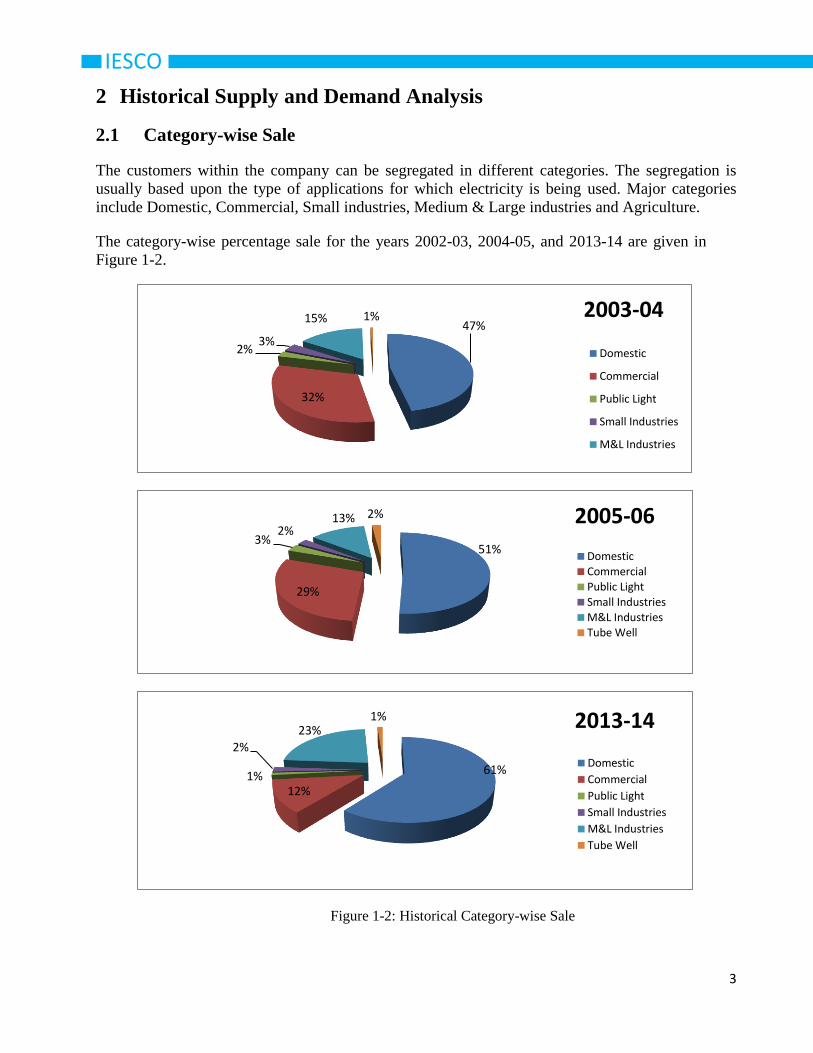
2.1 Category-wise Sale
The customers within the company can be segregated in different categories. The segregation is
usually based upon the type of applications for which electricity is being used. Major categories
include Domestic, Commercial, Small industries, Medium & Large industries and Agriculture.
The category-wise percentage sale for the years 2002-03, 2004-05, and 2013-14 are given in
Figure 1-2.
Figure 1-2: Historical Category-wise Sale
47%
32%
2% 3%
15% 1% 2003-04
Domestic
Commercial
Public Light
Small Industries
M&L Industries
51%
29%
3% 2%
13% 2% 2005-06
DomesticCommercialPublic LightSmall IndustriesM&L IndustriesTube Well
61%
12% 1%
2%
23% 1% 2013-14
Domestic
Commercial
Public Light
Small Industries
M&L Industries
Tube Well
4
IESCO
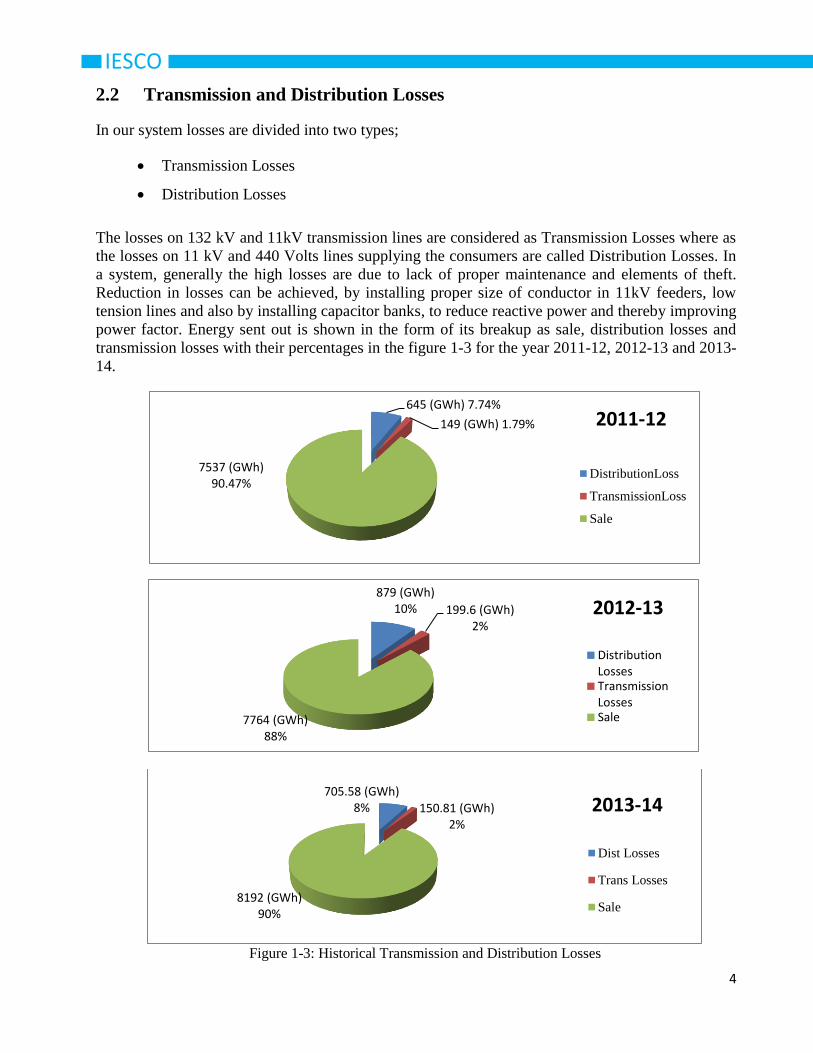
2.2 Transmission and Distribution Losses
In our system losses are divided into two types;
Transmission Losses
Distribution Losses
The losses on 132 kV and 11kV transmission lines are considered as Transmission Losses where as
the losses on 11 kV and 440 Volts lines supplying the consumers are called Distribution Losses. In
a system, generally the high losses are due to lack of proper maintenance and elements of theft.
Reduction in losses can be achieved, by installing proper size of conductor in 11kV feeders, low
tension lines and also by installing capacitor banks, to reduce reactive power and thereby improving
power factor. Energy sent out is shown in the form of its breakup as sale, distribution losses and
transmission losses with their percentages in the figure 1-3 for the year 2011-12, 2012-13 and 2013-
14.
Figure 1-3: Historical Transmission and Distribution Losses
645 (GWh) 7.74%
149 (GWh) 1.79%
7537 (GWh) 90.47%
2011-12
DistributionLoss
TransmissionLoss
Sale
879 (GWh) 10% 199.6 (GWh)
2%
7764 (GWh) 88%
2012-13
DistributionLossesTransmissionLossesSale
705.58 (GWh) 8% 150.81 (GWh)
2%
8192 (GWh) 90%
Dist Losses
Trans Losses
Sale
2013-14

5
IESCO
2.3 Recorded and Computed Peak Demand
Recorded demand is the highest electricity demand or maximum power supplied to the
consumers during the base year. Computed peak demand is calculated by adding the element of
unserved power into the figure of the recorded peak demands. Figure 1-4 shows the recorded and
computed peak demand (MW) from the year 2009-10 to 2013-14.
Figure 1-4: Historical Recorded and Computed Peak Demand
2.4 Number of Consumers
Historical record of number of consumers within IESCO jurisdiction is given in Figure 1-5. These
consumers are from all categories; i.e. Domestic, Commercial, Small industries, Medium & Large
industries, Public Lighting, Bulk and Agriculture.
Figure 1-5: Number of Consumers
0
500
1000
1500
2000
2500
2009-10 2010-11 2011-12 2012-13 2013-14
1458 1597 1645
1276 1447
1969 2087
2285 2325 2347
PEA
K D
EMA
ND
(M
W)
Recorded Peak Demand
Computed Peak Demand
0
500000
1000000
1500000
2000000
2500000
2009-10 2010-11 2011-12 2012-13 2013-14
1978602 2140689 2224865
2306551 2379302

6
IESCO
3 Power Market Survey Methodology
3.1 Overview
The Power Market Survey Model forms the basis of the medium term forecast. It produces energy
and peak demand forecast over a ten year period by consumption category and by grid station for
the entire service area. The model has three inter-related components: the main database, the basic
input parameters and the calculations themselves.
The energy consumption data base obtained through the power market survey is immense. It
contains base year consumption data for existing consumers and ten years’ forecast data for new
consumers for each consumer category within the company. In addition, there is separate
information for peak demand in medium & large industries and traction categories. Because of its
volume this data is not listed as part of this report.
In addition to the data base, a number of basic input parameters form an integral part of the forecast
model which are separately prepared for each DISCO. These include:
Growth rates: the annual increase in consumption per consumer by consumption category.
Loss rates: transmission and distribution losses expressed as a percentage of energy purchased
and energy sold, respectively.
Load factors: relating the amount of energy consumed to the rate at which it is consumed (that is,
the peak demand) for each consumption category.
Coincidence factors: describing the load diversity within the system.
The forecast calculations within the model combine the energy consumption data and the input
parameters to compute the energy and peak demand requirements within each area for each year to
be forecasted. The data is accumulated from the area basis, to grid stations, DISCOs and ultimately
to produce a forecast for the entire system.
Each of the three model component is discussed in detail below.
3.2 Survey Base Data
An extensive data base has been developed on gross consumption by consumer category household
(domestic), commercial, small industrial, large industrial, tube wells (agriculture), public lighting,
and traction (electric rail). Energy consumption comes from consumer service meter readings.
Maximum demand readings and load factors for large industrial users and other demand-
meteredconsumers are based on service meter readings. The consumption data is collected from
Computer Centers of each DISCO (It is feeder-wise category-wise consumption data).
Actual consumption data are also adjusted for un-served demands attributed to load shedding and to
voluntary restraint by consumers (e.g. an industrial consumer who agrees to close his plant or
switch to auto-generation during peak hours).
The basic geographic unit represented within the data base is called an area, although many areas
are divided into two or more subareas. This occurs when portions of the area are served by
different feeders or where a single feeder services different administrative districts. Each area is
assigned a series of codes which identify the technical boundaries associated with the area.

7
IESCO The technical boundaries, which are emphasized in this report, start at the grid station. Thus, all
areas and subareas are assigned to one of the all the sub-stations in each DISCO. These are
distribution grid stations supplying power at 11 kV after transformation from a 132kV or 66 kV
source. Grid stations are combined to form DISCO.
There can be up to eleven records in the data base for each area or subarea, one record for each year
of forecast. The first year is typically year zero and records the base year level of consumption for
each consumption category as determined in the survey. The remaining records for the area list the
incremental consumption associated with new consumers to be added to the area within the
specified year.
This incremental consumption is based on applications for new or extended service which are filed
at each revenue office and from discussions with the relevant industries and government agencies.
Incremental industrial consumption is based on a combination of interviews, trend projections, and
reviews of applications for new and/or increased service. Interviews are held with major industrial
consumers to identify their current capacity utilization and any long-term plans they have for future
expansion or changes in their electricity consumption. Auto-generation is also recorded. In
addition, the various branches of the Ministry of Industries are interviewed to determine how many
applications for new developments or plant expansions have been received, and what the
anticipated electrical load associated with each is likely to be. These anticipated new demands are
added to the basic forecast of industrial consumption.
Extension of electricity to new areas over the forecast period is dealt with separately. The number
of new communities to be electrified is also obtained. Initial loads and load growth are calculated
based on past experience in terms of market penetration and consumption per consumer in newly
electrified communities. This analysis is conducted at DISCO level.
There are over 10,000 area/subarea/year records in the data base.
3.3 Input Parameters
A number of input parameters are defined for use in the Power Market Survey model. These
parameters are:
Transmission and distribution loss rates
The rates of growth in consumption per consumer
Load factors for each consumption category
Coincidence or diversity factors
The definition and basic derivation of each is discussed below.
3.4 Growth Rates
The forecast calculations, as will be discussed below, use per consumer growth rates to update the
previous year's consumption before adding the incremental consumption estimate for the current
year. The Power Market Survey Model requires per consumer growth rates to be specified by
DISCO for each consumption category (domestic, commercial, etc). The rates selected for the

8
IESCO Forecast are based on average annual compound growth rates, calculated from the last six years
data of each consumer category in each DISCO.
3.5 Losses
For every 100 units of electricity purchased from a power station only 75 to 85 units are actually
sold to the ultimate end-user. The remainder is consumed by the power system itself in the
transmission and distribution of the sold energy. These transmission and distribution losses must be
added to the sales forecast in order to determine the total generation requirement for the system. An
additional source of "loss", the consumption in auxiliaries (also called station service) used by the
power plants in the process of generating electricity. Auxiliary consumption cannot be avoided and
is totally dependent on the type of generation system. For example, a thermal plant would have a
higher station service than a hydro plant to account for the energy consumed by fuel and waste
handling systems. Auxiliary losses are determined and incorporated in the forecast outside the
model.
Within the Power Market Survey Model, distribution losses are expressed as a percentage of sales
and transmission losses as a percentage of the energy purchased from the generating stations. The
model is capable of handling different loss rates for each year for each DISCO. The distribution and
transmission losses used in the Power Market Survey Model are based on the review of current loss
rates and an evaluation of existing loss reduction initiatives within PEPCO. The losses proposed are
differentiated by DISCOs and distribution at losses 11 kV and transmission losses at 132 kV are
applied DISCO-wise. A separate excel sheet has been developed outside the model to calculate the
loss rates needed for the model. The loss rates have been set to match observed performance.
3.6 Load Factors
Energy sale in each consumption category is converted to peak power demand through the use of a
load factor. It expresses the ratio of the amount of energy actually consumed to the amount that
would have been consumed had the peak rate been continued over the entire period. Load factors
can be calculated over any time period but the most common are daily, weekly and annual.
The load factors utilized in the Power Market Survey Model relate annual energy sales to peak
capacity for each consumer category (domestic, commercial, public lighting, small industries and
private tube wells). Input load factors are not required for medium/large industry, public tube well
and traction sales as consumption for these sectors is provided through the survey in both energy
and power terms.
Maximum demand readings are available directly for large industrial and other demand metered
consumers such as public tube wells. Load factors for non-demand metered consumers are
determined on a sample basis. For example, peak demand is based on maximum demand readings
from substation feeders which are identified as serving predominantly one sector.
Domestic and commercial load factors are differentiated by community size (village, town or city).
Whereas a single load factor is used for small industrial, private tube wells, public lighting and
traction because of the similar nature in the operation of these loads. While there is some variation
in the load factors within the domestic and commercial sectors, there are no differences in any of
the load factors by DISCO.
9
IESCO
3.7 Coincidence Factors
The total energy demand of a number of individual consumers is determined as the simple sum of
their individual energy consumption values. The total peak load, however, is calculated as the
diversified sum of their individual peak load levels. The coincidence factor, as its name implies, is
a general term which measures the coincidence between the peak loads of any number of individual
consumers or consumer groups over a specified time period in order to compute a combined peak.
Mathematically, it is the inverse of the diversity factor.
The daily coincidence factor is determined by comparing the daily load patterns of each consumer
or group under consideration. In this case, the sum of the individual hourly (or 15-minute) peaks
would determine the overall daily load pattern and the overall peak load. If, for example, one
consumer (or group) consumes energy only in the morning and a second group consume only in the
evening, the coincidence factor between these two consumers would be zero and the peak load of
the combined group would be the peak of the larger consumer. Conversely, if both groups
consumed all energy at the same hour, the coincidence factor would be one and the combined peak
would be the sum of the two peaks. In practice, the coincidence factor is found between these two
extremes.
Coincidence factors can be determined between any group and sub-group of consumers whether it
is domestic versus commercial or Lahore versus Islamabad, provided that reasonable estimates of
the appropriate load patterns are available. Typically, these patterns are not readily available and
must be synthesized from incomplete or estimated data. In addition, all coincidence factors
calculated from these load patterns are approximations of the corresponding instantaneous peak
faced by the system. In fact, a common practice is to define this instantaneous peak as the bench
mark and specify all coincidence factors in relation to this peak and time. The advantage of this
approach is that all peak can be easily converted into their contribution to the overall system peak,
the disadvantage is that the relationship between any two groups cannot be so clearly specified and
will likely be incorrectly specified.
The Power Market Survey Model depends upon specified coincidence factors between consumption
categories and between consumption areas in the aggregation of peak loads from consumers to the
peaks at grid stations and at DISCO level and at the level of overall system peak. The coincidence
factors estimated for the medium term model have been based on the limited available PEPCO
records of the peak loads at various points in their respective systems.
3.8 Forecast Calculations
The forecast calculations involve three basic steps. Firstly, an energy forecast is determined at the
area (or subarea) level using per consumer growth rates and incremental consumption estimates
from the data base. This is then converted to a peak demand forecast, again at the area (or subarea)
level using the input load and diversity factors. Then transmission and distribution losses are added
and final step is to accumulate the areas into their corresponding grid stations, and grid stations into
their DISCO and finally all DISCOs to form the system.

10
IESCO
3.9 Energy Calculations
The basic calculation unit is the area or subarea. The data base provides the base year energy
consumption level for each of six consumption categories: domestic, commercial, public lighting,
small industrial, private tube wells and medium and large industry. The database also includes the
peak demand associated with the medium and large industry category. The domestic energy
forecast for year 1 (the base year is year 0) is calculated by multiplying the base year consumption
by the domestic per consumer growth rate to account for growth in the intensity of use in the sector
then adding the incremental consumption listed in the data base to account for new use in the sector.
This process is repeated for the remaining five energy sectors (plus the medium and large industrial
demand) for each of the remaining 10 years. The total energy consumed in the subarea within the
year is then computed.
3.10 Peak Demand Calculations
The annual energy values for each of the domestic, commercial, public lighting, small industry and
private tube well categories are converted to peak demand using the load factors listed in the
appropriate input parameter file and adjusted to account for coincidence within the category. The
annual peak demand for the area or subarea is computed as the sum of the individual category peaks
multiplied by coincidence factors within the subarea and for each subarea within an area.
3.11 Accumulations
The total energy and peak demand at a given grid station is calculated as the sum of all the areas
and subareas in that grid station's service area plus an allowance for distribution losses. Peak
demand estimates are accumulated and different coincidence factors applied to city, town and
village areas within the service area. The total energy and peak demand within a given DISCO is
the sum of all grid stations in that DISCO plus traction and an allowance for transmission losses.
Peak demands are again diversified in the accumulation, and the system totals are obtained from
DISCO’s total with some coincidence.

11
IESCO
4 PMS Forecast Results
4.1 Recorded Forecast (Excluding Load Shedding)
The term ‘recorded’ means the sale used in forecast has not been adjusted for un-served energy
(load shedding). Forecasted sale, transmission and distribution losses, generation requirements and
peak demand without load shedding has been shown on Table 1-1.
4.2 Computed Forecast (Including Load Shedding)
The term ‘computed’ means the sale used in forecast has been adjusted for un-served energy (load
shedding). Forecasted sale, transmission and distribution losses, generation requirement and peak
demand with load shedding has been shown on Table 1-2. Peak demand of this table has been
demonstrated graphically in Figure 1-6. Similarly energy sale and energy Purchased also have been
shown in Figure 1-7, the difference shows all losses of the DISCO. This is also the base forecast. If
there had not been the load shedding the recorded forecast would have been the actual forecast i.e.
the base forecast.
Figure 1-6: Computed Peak Demand
Figure 1-7: Energy Purchased VS Energy Sale
0
1000
2000
3000
4000
5000
2347 2493 2649 2857 3029 3207 3382 3567 3757 3949 4143
0
5000
10000
15000
20000
25000
EnergyPurchased(GWh)
Energy Sale(GWh)

12
IESCO
4.3 Category-wise Forecasted Energy Sale (GWh)
Percentage share of each consumer category in total sale of year 2016-17 and year 2023-24 has
been depicted in Figure 1-8.
Figure 1-8: Forecasted Category-wise Sale
The category-wise forecasted sale with and without load shedding are shown in Table 1-3 and 1-4
respectively.
4.4 Category-wise Power Demand (MW)
The forecast of consumption (sale) in terms of Mega Watts with and without load shedding is
shown in Table 1-5 and Table 1-6 respectively.
8370, 61%
1723, 13%
116, 1%
245, 2%
3020, 22% 156, 1% 2017-18
Domestic
Commercial
Public Light
Small Industries
M&L Industries
Tube Well
11946, 65%
2360, 13%
139, 1%
324, 2%
3374, 18%
220, 1% 2023-24
Domestic
Commercial
Public Light
Small Industries
M&L Industries
Tube Well

13
IESCO
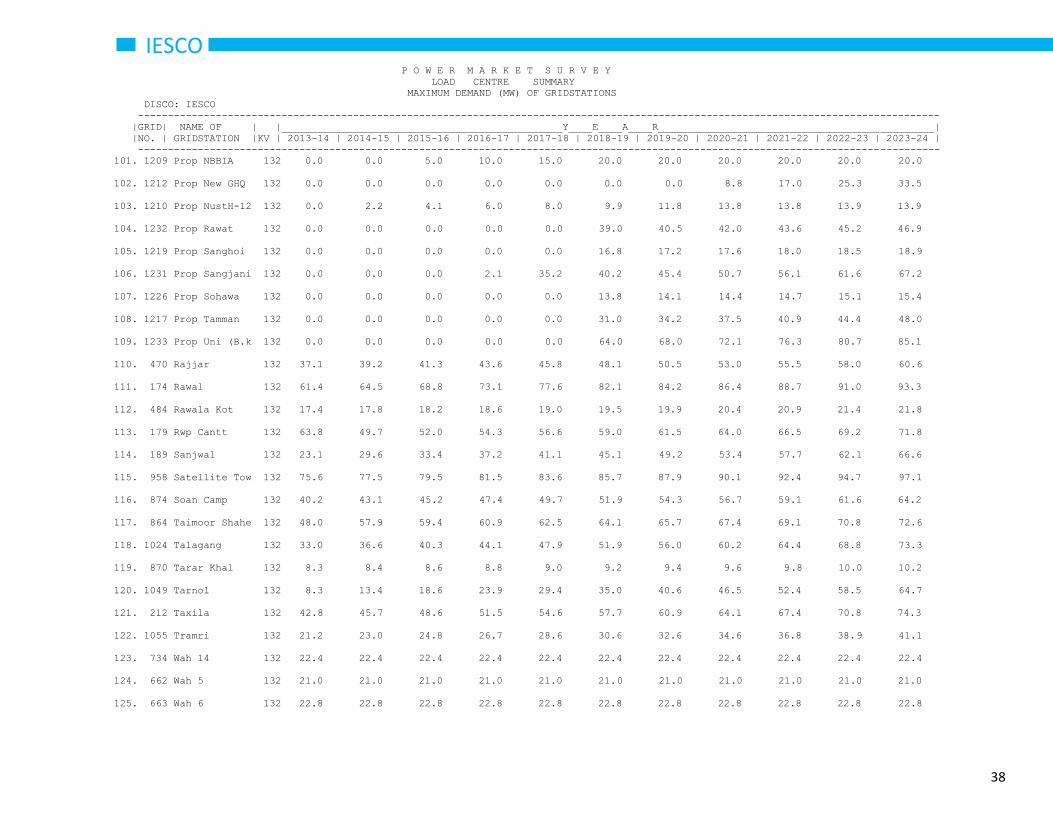
4.5 Peak Demand of Substations
A projection at a sub-station is the most peculiar feature of this report. It is indeed a very rare and
useful forecast. It’s the base of transmission system expansion planning. It also provides a very
solid ground for proposing a new sub-station or augmentation, extension and conversion of a sub-
station. Only distribution losses have been considered in preparing the grid station peak demand.
The peak demand of each substation, existing as well as proposed, situated in the service area of the
DISCO has been shown in the Table 1-17.
4.6 Per Capita Consumption
Per capita consumption is a very vivid indicator of development in a country. Usually developed
countries have very high per capita consumption. The consumption for the years 2016-17, 2018-19
and 2023-24 are obtained from forecasted data. Per capita consumption (kWh/person) is given in
Figure 1-9.
Figure 1-9: Per Capita Consumption
4.7 Category-wise Substation-wise Energy and Demand Projections
The category-wise substation-wise energy and demand projections have been presented in Table 1-
18. The last column of the table contains power factor and reactive power values. In order to reduce
the volume of the report, only the values of the last year i.e. 2023-24 have been presented in the
table.
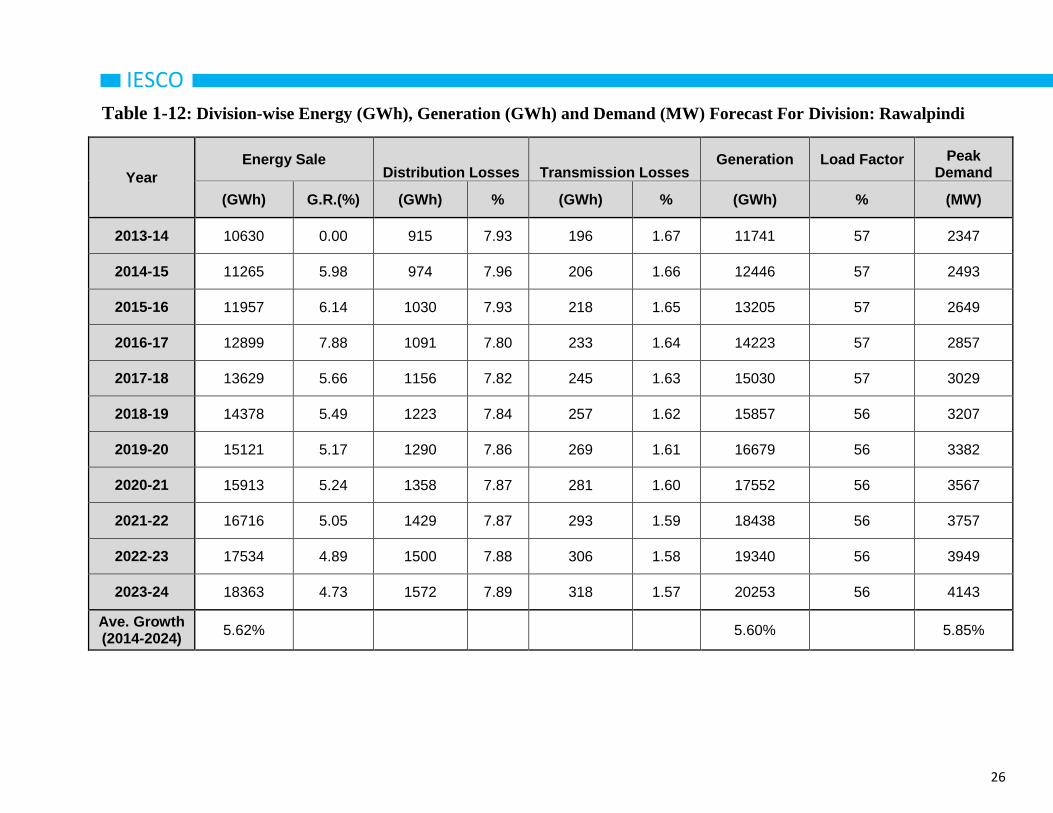
4.8 Civil Administrative Area Forecast
The IESCO service area comprises of one civil administrative division i.e. Rawalpindi which has
five districts; Attock, Chakwal, Islamabad, Jehlum and Rawalpindi. The District-wise and civil
administrative Division -wise energy and demand projections have been presented in Tables 1-7 to
1-12. The last column of the table contains peak demand.
0
200
400
600
800
1000
1200
2004-05 2013-14 2016-17 2018-19 2023-24
836 677
935 942 1018

14
IESCO
4.9 Monthly Demand (MW) Projections
The Month–wise demand (MW) projection have been presented in Table 1-13. To develop this
projection, monthly demand factors are computed for last five years and then its average is taken as
a base for monthly demand projection.
4.10 List of Overloaded Substations
There have been several incidents of damage and fire at a number of sub-stations across the country
due to overloading and they need augmentation or addition of a transformer. The list of overloaded
substation will inform about that particular year in which a substation will be overloaded. The
overloading criterion of a substation has been considered as 85% i.e. when any substation is 85%
loaded the remedial measures should be taken in the form of new substation or augmentation of the
existing transformers. Table 1-14 and Table 1-15 shows the list of overloaded substations based on
overloading criterion of 85% and 100% respectively.
4.11 List of Grids with their Codes and MVA Capacities
The list of Grids contains each substation having their codes and transformers’ MVA capacities are
enlisted in the Table 1-16.

15
IESCO
Table 1-1: PMS Recorded Forecast (Excluding Load Shedding)
Year
Energy Sale
Distribution Losses
Transmission Losses
Energy Sent out
Load Factor
Peak Demand
(GWh) G.R (GWh) (%) (GWh) (%) (GWh) (%) (MW)
2013-14 8192
705 7.8 151 1.67 9049 71 1447
2014-15 8788 7.3 760 7.8 161 1.66 9709 71 1556
2015-16 9430 7.3 812 7.8 172 1.65 10414 71 1673
2016-17 10313 9.4 867 7.6 186 1.64 11366 71 1829
2017-18 10975 6.4 927 7.7 197 1.63 12099 71 1955
2018-19 11670 6.3 989 7.7 208 1.62 12867 70 2088
2019-20 12357 5.9 1051 7.7 219 1.61 13628 70 2218
2020-21 13093 5.9 1115 7.7 231 1.60 14438 70 2357
2021-22 13838 5.7 1180 7.7 243 1.59 15261 70 2499
2022-23 14596 5.5 1246 7.7 255 1.58 16097 70 2643
2023-24 15364 5.3 1313 7.7 266 1.57 16944 69 2788
Ave. Growth (2014-2024)
6.49%
6.47%
6.78%

16
IESCO
Table 1-2: PMS Base Forecast
Year Energy Sale
Computed Energy
Sale G.R
Distribution Losses
Transmission Losses
Computed Energy
Sent Out
Load Factor
Computed Peak
Demand G.R
(GWh) (GWh) (%) (GWh) (%) (GWh) (%) (GWh) (%) (MW) (%)
2013-14 8192 10630 915 7.9 196.0 1.67 11741 57 2347
2014-15 8788 11265 6.0 974 8.0 206.5 1.66 12446 57 2493 6.2
2015-16 9430 11957 6.1 1030 7.9 217.8 1.65 13205 57 2649 6.3
2016-17 10313 12899 7.9 1091 7.8 233.2 1.64 14223 57 2857 7.8
2017-18 10975 13629 5.7 1156 7.8 245.0 1.63 15030 57 3029 6.0
2018-19 11670 14378 5.5 1223 7.8 256.9 1.62 15857 56 3207 5.9
2019-20 12357 15121 5.2 1290 7.9 268.6 1.61 16679 56 3382 5.5
2020-21 13093 15913 5.2 1358 7.9 281.0 1.60 17552 56 3567 5.5
2021-22 13838 16716 5.1 1429 7.9 293.4 1.59 18438 56 3757 5.3
2022-23 14596 17534 4.9 1500 7.9 305.9 1.58 19340 56 3949 5.1
2023-24 15364 18363 4.7 1572 7.9 318.4 1.57 20253 56 4143 4.9
Ave. Growth (2014-2024)
5.62%
5.60% 5.85%

17
IESCO
Table 1-3: Category-wise Sale – GWh (Excluding Load Shedding)
Year Domestic Commercial Public Light
Small Industries
M&L Industries
Tube Well Traction Total
Energy G.R Energy G.R Energy G.R Energy G.R Energy G.R Energy G.R Energy G.R Energy G.R
2013-14 4975 1030 78 153 1862 93 1.9 8192
2014-15 5406 8.7 1087 5.5 81 3.9 163 6.4 1950 4.7 100 7.7 0 0.0 8788 7.3
2015-16 5814 7.6 1179 8.5 84 3.9 173 6.2 2071 6.2 108 7.4 0 0.0 9430 7.3
2016-17 6251 7.5 1281 8.6 88 3.8 184 6.0 2394 15.6 116 7.2 0 0.0 10313 9.4
2017-18 6724 7.6 1393 8.8 91 3.7 195 5.8 2449 2.3 124 7.0 0 0.0 10975 6.4
2018-19 7228 7.5 1508 8.2 94 3.6 206 5.6 2502 2.1 132 6.8 0 0.0 11670 6.3
2019-20 7745 7.1 1602 6.3 98 3.6 217 5.5 2555 2.1 141 6.6 0 0.0 12357 5.9
2020-21 8306 7.2 1698 6.0 101 3.5 228 5.3 2609 2.1 150 6.4 0 0.0 13093 5.9
2021-22 8873 6.8 1798 5.8 104 3.4 240 5.2 2664 2.1 159 6.3 0 0.0 13838 5.7
2022-23 9451 6.5 1896 5.5 108 3.4 252 5.1 2720 2.1 169 6.1 0 0.0 14596 5.5
2023-24 10037 6.2 1996 5.3 112 3.3 265 4.9 2777 2.1 179 6.0 0 0.0 15364 5.3
Ave. Growth (2014-2024)
7.27% 6.83%
3.61%
5.61%
4.07% 6.76% 0.00% 6.49%
18
IESCO
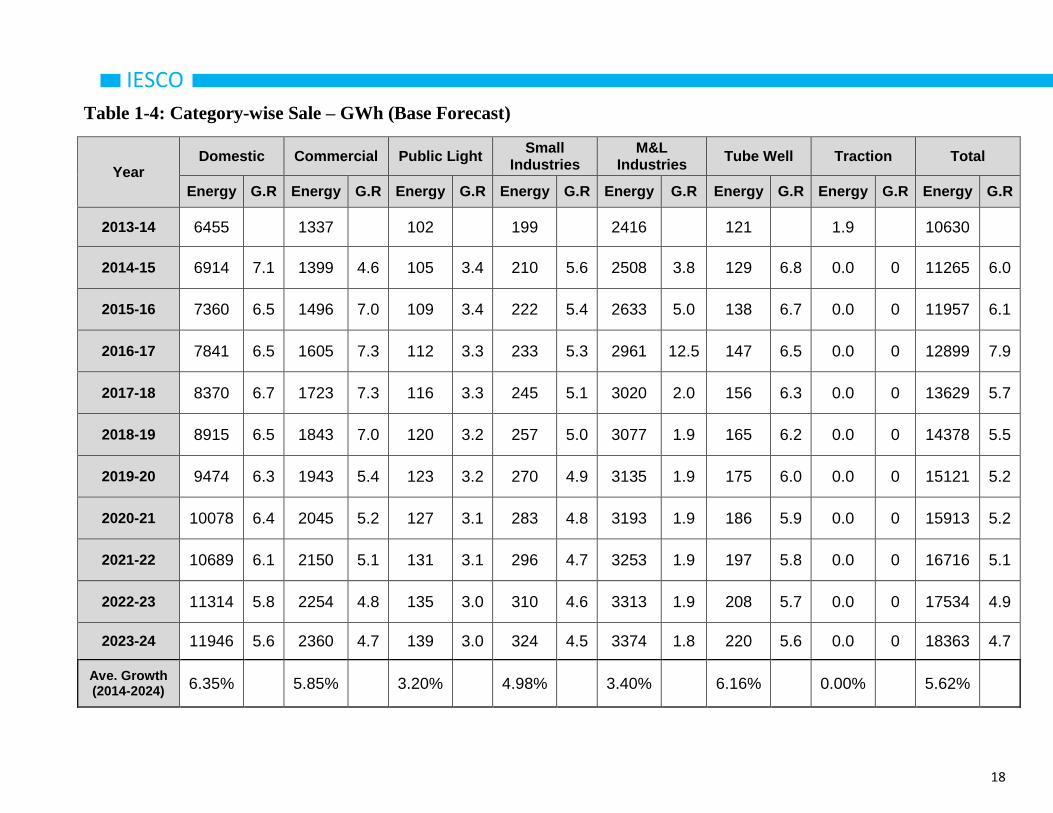
Table 1-4: Category-wise Sale – GWh (Base Forecast)
Year Domestic Commercial Public Light
Small Industries
M&L Industries
Tube Well Traction Total
Energy G.R Energy G.R Energy G.R Energy G.R Energy G.R Energy G.R Energy G.R Energy G.R
2013-14 6455 1337 102 199 2416 121 1.9 10630
2014-15 6914 7.1 1399 4.6 105 3.4 210 5.6 2508 3.8 129 6.8 0.0 0 11265 6.0
2015-16 7360 6.5 1496 7.0 109 3.4 222 5.4 2633 5.0 138 6.7 0.0 0 11957 6.1
2016-17 7841 6.5 1605 7.3 112 3.3 233 5.3 2961 12.5 147 6.5 0.0 0 12899 7.9
2017-18 8370 6.7 1723 7.3 116 3.3 245 5.1 3020 2.0 156 6.3 0.0 0 13629 5.7
2018-19 8915 6.5 1843 7.0 120 3.2 257 5.0 3077 1.9 165 6.2 0.0 0 14378 5.5
2019-20 9474 6.3 1943 5.4 123 3.2 270 4.9 3135 1.9 175 6.0 0.0 0 15121 5.2
2020-21 10078 6.4 2045 5.2 127 3.1 283 4.8 3193 1.9 186 5.9 0.0 0 15913 5.2
2021-22 10689 6.1 2150 5.1 131 3.1 296 4.7 3253 1.9 197 5.8 0.0 0 16716 5.1
2022-23 11314 5.8 2254 4.8 135 3.0 310 4.6 3313 1.9 208 5.7 0.0 0 17534 4.9
2023-24 11946 5.6 2360 4.7 139 3.0 324 4.5 3374 1.8 220 5.6 0.0 0 18363 4.7
Ave. Growth (2014-2024)
6.35% 5.85%
3.20%
4.98%
3.40% 6.16% 0.00% 5.62%

19
IESCO
Table 1-5: Category-wise Demand – MW (Excluding Load Shedding)
Year Domestic Commercial Public Light
Small Industries
M&L Industries
Tube Well Traction Total
Demand G.R Demand G.R Demand G.R Demand G.R Demand G.R Demand G.R Demand G.R Demand G.R
2013-14 843 205 19 24 334 14 0 1311
2014-15 925 9.7 218 6.4 20 3.9 25 6.9 345 3.2 15 7.7 0 0 1410 7.5
2015-16 1000 8.1 239 9.8 21 3.9 27 6.6 361 4.7 16 7.5 0 0 1516 7.5
2016-17 1082 8.2 263 10.0 22 3.8 29 6.4 408 12.9 17 7.2 0 0 1661 9.5
2017-18 1171 8.3 290 10.1 23 3.7 30 6.2 414 1.5 18 7.0 0 0 1775 6.9
2018-19 1268 8.2 317 9.5 23 3.6 32 6.0 419 1.3 19 6.8 0 0 1895 6.8
2019-20 1366 7.8 340 7.2 24 3.6 34 5.8 425 1.3 21 6.6 0 0 2013 6.2
2020-21 1472 7.8 363 6.9 25 3.5 36 5.6 430 1.3 22 6.4 0 0 2139 6.3
2021-22 1580 7.3 387 6.6 26 3.4 38 5.4 436 1.3 24 6.3 0 0 2267 6.0
2022-23 1690 7.0 411 6.1 27 3.4 40 5.3 442 1.3 25 6.1 0 0 2397 5.7
2023-24 1802 6.6 435 5.9 28 3.3 42 5.2 448 1.3 26 6.0 0 0 2529 5.5

20
IESCO
Table 1-6: Category-wise Demand – MW (Base Forecast)
Year
Domestic Commercial Public Light Small
Industries M&L
Industries Tube Well Traction Total
Demand G.R Demand G.R Demand G.R Demand G.R Demand G.R Demand G.R Demand G.R Demand G.R
2013-14 1364 331 31 43 541 22 1 2127
2014-15 1473 8.0 349 5.3 32 3.4 45 5.6 556 2.7 24 6.8 0 0.00 2258 6.2
2015-16 1575 6.9 377 8.0 34 3.4 48 5.4 577 3.8 25 6.6 0 0.00 2400 6.3
2016-17 1686 7.1 409 8.4 35 3.3 50 5.3 636 10.2 27 6.5 0 0.00 2593 8.0
2017-18 1810 7.4 443 8.5 36 3.3 53 5.1 644 1.3 29 6.3 0 0.00 2749 6.0
2018-19 1939 7.1 479 8.0 37 3.2 56 5.0 652 1.2 31 6.2 0 0.00 2909 5.8
2019-20 2071 6.8 509 6.3 38 3.2 58 4.9 660 1.2 32 6.0 0 0.00 3067 5.4
2020-21 2213 6.8 539 6.0 39 3.1 61 4.8 668 1.2 34 5.9 0 0.00 3236 5.5
2021-22 2357 6.5 571 5.8 41 3.1 64 4.7 676 1.2 36 5.8 0 0.00 3408 5.3
2022-23 2504 6.2 602 5.4 42 3.0 67 4.6 684 1.2 38 5.7 0 0.00 3582 5.1
2023-24 2652 5.9 634 5.3 43 3.0 70 4.5 693 1.2 41 5.6 0 0.00 3758 4.9

21
IESCO
Table 1-7: District-wise Energy (GWh), Generation (GWh) and Demand (MW) Forecast For District: Attock
Year Energy Sale Distribution
Losses Transmission
Losses Generation
Load Factor
Peak Demand
(GWh) G.R.(%) (GWh) % (GWh) % (GWh) % (MW)
2013-14 1528 0.00 97 5.94 28 1.67 1652 40 472
2014-15 1648 7.83 107 6.11 30 1.66 1785 40 506
2015-16 1763 7.00 117 6.22 32 1.65 1912 40 539
2016-17 1922 9.01 127 6.20 34 1.64 2083 41 582
2017-18 2039 6.07 138 6.34 36 1.63 2213 41 617
2018-19 2158 5.85 149 6.47 38 1.62 2345 41 652
2019-20 2280 5.66 161 6.58 40 1.61 2481 41 688
2020-21 2405 5.48 172 6.68 42 1.60 2619 41 726
2021-22 2533 5.32 184 6.78 44 1.59 2761 41 764
2022-23 2664 5.17 196 6.86 46 1.58 2907 41 802
2023-24 2798 5.03 209 6.94 48 1.57 3055 41 842
Ave. Growth (2014-2024)
6.24%
6.34%
5.95%

22
IESCO
Table 1-8: District-wise Energy (GWh), Generation (GWh) and Demand (MW) Forecast For District: Chakwal
Year Energy Sale
Distribution Losses
Transmission Losses
Generation Load Factor Peak
Demand
(GWh) G.R.(%) (GWh) % (GWh) % (GWh) % (MW)
2013-14 1437 0.00 90 5.87 26 1.67 1552 50 356
2014-15 1522 5.93 98 6.03 27 1.66 1647 50 379
2015-16 1660 9.05 106 5.99 30 1.65 1795 50 414
2016-17 1961 18.13 114 5.49 35 1.64 2109 50 485
2017-18 2050 4.55 122 5.63 36 1.63 2208 50 509
2018-19 2141 4.45 131 5.76 37 1.62 2309 49 534
2019-20 2234 4.36 140 5.88 39 1.61 2413 49 559
2020-21 2330 4.27 148 5.99 40 1.60 2519 49 585
2021-22 2428 4.19 157 6.09 42 1.59 2627 49 612
2022-23 2528 4.12 167 6.19 43 1.58 2738 49 639
2023-24 2630 4.05 176 6.27 45 1.57 2851 49 666
Ave. Growth (2014-2024)
6.23%
6.27%
6.47%

23
IESCO
Table 1-9: District-wise Energy (GWh), Generation (GWh) and Demand (MW) Forecast For District: Islamabad
Year Energy Sale
Distribution Losses
Transmission Losses
Generation Load Factor Peak
Demand
(GWh) G.R.(%) (GWh) % (GWh) % (GWh) % (MW)
2013-14 2348 0.00 228 8.86 44 1.67 2620 49 614
2014-15 2486 5.85 241 8.85 46 1.66 2773 48 654
2015-16 2646 6.43 253 8.74 49 1.65 2948 48 698
2016-17 2839 7.33 269 8.65 52 1.64 3160 48 754
2017-18 3061 7.81 287 8.58 55 1.63 3404 47 820
2018-19 3289 7.46 307 8.52 59 1.62 3655 47 888
2019-20 3500 6.42 325 8.50 63 1.61 3888 47 950
2020-21 3748 7.07 344 8.42 67 1.60 4159 47 1021
2021-22 3994 6.58 364 8.36 70 1.59 4429 46 1093
2022-23 4242 6.20 384 8.30 74 1.58 4700 46 1165
2023-24 4488 5.80 404 8.25 78 1.57 4969 46 1236
Ave. Growth (2014-2024)
6.69%
6.61%
7.25%

24
IESCO
Table 1-10: District-wise Energy (GWh), Generation (GWh) and Demand (MW) Forecast For District: Jhelum
Year Energy Sale
Distribution Losses
Transmission Losses
Generation Load Factor Peak
Demand
(GWh) G.R.(%) (GWh) % (GWh) % (GWh) % (MW)
2013-14 1441 0.00 140 8.87 27 1.67 1608 53 348
2014-15 2486 3.43 145 8.85 28 1.66 1662 53 360
2015-16 2646 3.39 149 8.83 28 1.65 1718 53 373
2016-17 2839 3.36 154 8.82 29 1.64 1776 52 386
2017-18 3061 3.33 159 8.80 30 1.63 1834 52 400
2018-19 3289 3.30 164 8.78 31 1.62 1894 52 413
2019-20 3500 3.28 169 8.77 32 1.61 1956 52 427
2020-21 3748 3.25 174 8.75 32 1.60 2019 52 441
2021-22 3994 3.22 179 8.73 33 1.59 2083 52 456
2022-23 4242 3.20 184 8.72 34 1.58 2149 52 471
2023-24 4488 3.17 190 8.70 35 1.57 2217 52 487
Ave. Growth (2014-2024)
12.03%
3.27%
3.41%

25
IESCO
Table 1-11: District-wise Energy (GWh), Generation (GWh) and Demand (MW) Forecast For District: Rawalpindi
Year Energy Sale
Distribution Losses
Transmission Losses
Generation Load Factor Peak
Demand
(GWh) G.R.(%) (GWh) % (GWh) % (GWh) % (MW)
2013-14 3876 0.00 361 8.51 72 1.67 4308 51 955
2014-15 4119 6.28 383 8.52 76 1.66 4579 51 1016
2015-16 4348 5.55 405 8.52 80 1.65 4832 51 1074
2016-17 4584 5.44 427 8.52 84 1.64 5095 51 1135
2017-18 4834 5.44 449 8.50 88 1.63 5371 51 1199
2018-19 5089 5.28 472 8.49 92 1.62 5653 51 1265
2019-20 5350 5.13 496 8.48 96 1.61 5942 51 1332
2020-21 5617 4.99 519 8.46 100 1.60 6236 51 1400
2021-22 5890 4.86 544 8.45 104 1.59 6538 51 1471
2022-23 6169 4.74 569 8.44 108 1.58 6846 51 1542
2023-24 6455 4.63 594 8.42 113 1.57 7161 51 1616
Ave. Growth (2014-2024)
5.23%
5.21%
5.40%
26
IESCO
Table 1-12: Division-wise Energy (GWh), Generation (GWh) and Demand (MW) Forecast For Division: Rawalpindi
Year
Energy Sale Distribution Losses Transmission Losses
Generation Load Factor Peak Demand
(GWh) G.R.(%) (GWh) % (GWh) % (GWh) % (MW)
2013-14 10630 0.00 915 7.93 196 1.67 11741 57 2347
2014-15 11265 5.98 974 7.96 206 1.66 12446 57 2493
2015-16 11957 6.14 1030 7.93 218 1.65 13205 57 2649
2016-17 12899 7.88 1091 7.80 233 1.64 14223 57 2857
2017-18 13629 5.66 1156 7.82 245 1.63 15030 57 3029
2018-19 14378 5.49 1223 7.84 257 1.62 15857 56 3207
2019-20 15121 5.17 1290 7.86 269 1.61 16679 56 3382
2020-21 15913 5.24 1358 7.87 281 1.60 17552 56 3567
2021-22 16716 5.05 1429 7.87 293 1.59 18438 56 3757
2022-23 17534 4.89 1500 7.88 306 1.58 19340 56 3949
2023-24 18363 4.73 1572 7.89 318 1.57 20253 56 4143
Ave. Growth (2014-2024)
5.62%
5.60%
5.85%

27
IESCO
Table 1-13: Monthly Peak Demand Forecast
Year
July August September October November December January February March April May June
(MW) (MW) (MW) (MW) (MW) (MW) (MW) (MW) (MW) (MW) (MW) (MW)
2013-14 2272 2309 2075 2070 1396 1504 1648 1582 1350 1786 2023 2347
2014-15 2413 2453 2203 2198 1483 1598 1750 1680 1433 1897 2149 2493
2015-16 2564 2606 2341 2336 1576 1698 1859 1785 1523 2016 2283 2649
2016-17 2765 2811 2525 2519 1700 1831 2005 1925 1643 2174 2462 2857
2017-18 2932 2981 2678 2672 1802 1942 2127 2042 1742 2305 2611 3029
2018-19 3104 3155 2835 2828 1908 2055 2251 2161 1844 2440 2764 3207
2019-20 3273 3327 2989 2982 2012 2168 2374 2279 1944 2573 2915 3382
2020-21 3453 3510 3153 3146 2122 2287 2504 2404 2051 2715 3075 3567
2021-22 3636 3696 3321 3313 2235 2408 2637 2532 2160 2859 3238 3757
2022-23 3822 3885 3491 3483 2349 2531 2772 2661 2270 3005 3404 3949
2023-24 4010 4077 3662 3654 2465 2656 2908 2792 2382 3153 3571 4143

28
IESCO
Table 1-14: List of Overloaded Substations during Period 2013-14 to 2023-24 Overloading Criteria=100%
S.No. Name Rating
Grid #
Total Capacity
Total Capacity
Overloading Criterion
Overloading Criterion
Year of Overloading
Overloading Status
Power Factor
KV (MVA) (MW) (MW) (%) (MW)
1 Bakar Mandi 132 10 92 82.80 82.80 100.00 2021-22 79.40 0.90
2 Chaklala 132 25 92 82.80 82.80 100.00 2014-15 82.10 0.90
3 Gujar khan 132 49 78 70.20 70.20 100.00 2019-20 68.70 0.90
4 KTM 132 86 92 82.80 82.80 100.00 2016-17 79.80 0.90
5 Kahuta City 132 90 39 35.10 35.10 100.00 2017-18 32.20 0.90
6 Muree 132 137 65 58.50 58.50 100.00 2021-22 55.80 0.90
7 Nilore 132 147 39 35.10 35.10 100.00 2021-22 34.90 0.90
8 Rawat 132 177 65 56.55 56.55 100.00 2021-22 55.30 0.87
9 Sanjwal 132 189 39 33.54 33.54 100.00 2015-16 33.40 0.86
10 Taxila 132 212 78 67.86 67.86 100.00 2021-22 67.40 0.87
11 C.S.Shah 132 246 26 22.10 22.10 100.00 2018-19 22.00 0.85
12 Dandot 66 290 26 23.40 23.40 100.00 2016-17 23.10 0.90
13 Jand 66 294 13 11.70 11.70 100.00 2013-14 12.80 0.90
14 Pir Wadhai 132 433 106 95.40 95.40 100.00 2022-23 94.40 0.90
15 Dina 132 468 39 35.10 35.10 100.00 2018-19 34.90 0.90
16 Rajar 132 470 52 46.80 46.80 100.00 2017-18 45.80 0.90
17 Hajira AJK 33 486 22 19.58 19.58 100.00 2017-18 19.40 0.89
18 N.P.Sethi 66 597 13 11.70 11.70 100.00 2013-14 13.00 0.90
19 Baragowah 132 630 13 11.70 11.70 100.00 2018-19 11.70 0.90
20 Ahmadal 66 631 19 17.10 17.10 100.00 2022-23 17.10 0.90
21 Neela 132 643 13 11.70 11.70 100.00 2013-14 12.70 0.90
22 F-11 132 692 66 59.40 59.40 100.00 2017-18 58.40 0.90
23 Attock New 132 751 39 35.10 35.10 100.00 2020-21 33.60 0.90
24 E-8 132 755 52 46.80 46.80 100.00 2022-23 46.60 0.90
25 Padshahan 132 791 26 23.40 23.40 100.00 2019-20 21.80 0.90
26 Minhasa 33 794 14 12.46 12.46 100.00 2013-14 12.20 0.89
27 Margalla 132 833 52 44.72 44.72 100.00 2016-17 43.30 0.86
28 Taimor Shahed 132 864 78 70.20 70.20 100.00 2021-22 69.10 0.90
29 Swan 132 874 52 45.24 45.24 100.00 2015-16 45.20 0.87

29
IESCO
S.No. Name Rating
Grid #
Total Capacity
Total Capacity
Overloading Criterion
Overloading Criterion Year of
Overloading
Overloading Status Power
Factor KV (MVA) (MW) (MW) (%) (MW)
30 Gondal 132 899 26 21.84 21.84 100.00 2016-17 21.00 0.84
31 Police Foundati 132 900 39 35.10 35.10 100.00 2013-14 31.80 0.90
32 Bahria Town-4 132 904 26 23.40 23.40 100.00 2022-23 23.40 0.90
33 Chattarpari 132 913 13 11.57 11.57 100.00 2015-16 11.50 0.89
34 Satellite Town 132 958 106 95.40 95.40 100.00 2022-23 94.70 0.90
35 Chakri 132 968 26 23.40 23.40 100.00 2016-17 22.40 0.90
36 Kallar Sydan 132 981 26 23.40 23.40 100.00 2015-16 22.80 0.90
37 Talagang 132 1024 39 34.71 34.71 100.00 2013-14 33.00 0.89
38 Fatehpur 33 1033 8 7.12 7.12 100.00 2018-19 7.00 0.89
39 Bahria Town-8 220 1038 13 11.70 11.70 100.00 2018-19 11.60 0.90
40 Basal 132 1039 26 23.14 23.14 100.00 2014-15 22.50 0.89
41 Tarnol 132 1049 26 23.40 23.40 100.00 2015-16 18.60 0.90
42 Tarmari 132 1055 26 23.40 23.40 100.00 2014-15 23.00 0.90

30
IESCO
Table 1-15: List of Overloaded Substations during Period 2013-14 to 2023-24 Overloading Criteria=85%
S.No. Name Rating
Grid #
Total Capacity
Total Capacity
Overloading Criterion
Overloading Criterion Year of
Overloading
Overloading Status Power
Factor KV (MVA) (MW) (MW) (%) (MW)
1 Bakar Mandi 132 10 92 82.80 70.38 85.00 2013-14 80.00 0.90
2 Chakwal 132 22 122 106.14 90.22 85.00 2020-21 87.60 0.87
3 Chaklala 132 25 92 82.80 70.38 85.00 2013-14 79.70 0.90
4 Gujar khan 132 49 78 70.20 59.67 85.00 2013-14 60.00 0.90
5 I-10 132 64 106 93.28 79.29 85.00 2015-16 78.00 0.88
6 Jatli 132 74 39 35.10 29.84 85.00 2019-20 29.40 0.90
7 KTM 132 86 92 82.80 70.38 85.00 2013-14 76.30 0.90
8 Kahuta City 132 90 39 35.10 29.84 85.00 2016-17 26.90 0.90
9 F Abad 132 120 65 57.85 49.17 85.00 2021-22 47.80 0.89
10 Muree 132 137 65 58.50 49.73 85.00 2019-20 48.70 0.90
11 New Wah 132 146 118 101.48 86.26 85.00 2020-21 81.30 0.86
12 Nilore 132 147 39 35.10 29.84 85.00 2016-17 29.40 0.90
13 Rawal 132 174 106 94.34 80.19 85.00 2017-18 77.60 0.89
14 Rawat 132 177 65 56.55 48.07 85.00 2016-17 46.80 0.87
15 Rwp Cantt 132 179 92 82.80 70.38 85.00 2022-23 69.20 0.90
16 Sanjwal 132 189 39 33.54 28.51 85.00 2013-14 23.10 0.86
17 Taxila 132 212 78 67.86 57.68 85.00 2017-18 54.60 0.87
18 Zero Point 132 223 106 95.40 81.09 85.00 2020-21 79.70 0.90
19 C.S.Shah 132 246 26 22.10 18.79 85.00 2014-15 18.50 0.85
20 Dandot 66 290 26 23.40 19.89 85.00 2013-14 20.00 0.90
21 Jand 66 294 13 11.70 9.95 85.00 2013-14 12.80 0.90
22 Pindi Gheb 66 432 26 23.40 19.89 85.00 2020-21 19.20 0.90
23 Pir Wadhai 132 433 106 95.40 81.09 85.00 2017-18 80.40 0.90
24 Dina 132 468 39 35.10 29.84 85.00 2014-15 29.10 0.90
25 Rajar 132 470 52 46.80 39.78 85.00 2014-15 39.20 0.90
26 Hajira AJK 33 486 22 19.58 16.64 85.00 2013-14 17.70 0.89
27 Mir Pur AJK 132 594 78 69.42 59.01 85.00 2022-23 58.50 0.89
28 N.P.Sethi 66 597 13 11.70 9.95 85.00 2013-14 13.00 0.90

31
IESCO
S.No. Name Rating
Grid #
Total Capacity
Total Capacity
Overloading Criterion
Overloading Criterion Year of
Overloading
Overloading Status Power
Factor KV (MVA) (MW) (MW) (%) (MW)
29 Baragowah 132 630 13 11.70 9.95 85.00 2014-15 9.50 0.90
30 Ahmadal 66 631 19 17.10 14.54 85.00 2019-20 14.20 0.90
31 Neela 132 643 13 11.70 9.95 85.00 2013-14 12.70 0.90
32 F-11 132 692 66 59.40 50.49 85.00 2013-14 48.60 0.90
33 H-11 132 727 92 82.80 70.38 85.00 2017-18 69.30 0.90
34 Attock New 132 751 39 35.10 29.84 85.00 2018-19 29.50 0.90
35 E-8 132 755 52 46.80 39.78 85.00 2013-14 41.10 0.90
36 Padshahan 132 791 26 23.40 19.89 85.00 2013-14 21.60 0.90
37 Minhasa 33 794 14 12.46 10.59 85.00 2013-14 12.20 0.89
38 Margalla 132 833 52 44.72 38.01 85.00 2014-15 36.90 0.86
39 Taimor Shahed 132 864 78 70.20 59.67 85.00 2015-16 59.40 0.90
40 Swan 132 874 52 45.24 38.45 85.00 2013-14 40.20 0.87
41 Gondal 132 899 26 21.84 18.56 85.00 2013-14 18.00 0.84
42 Police Foundati 132 900 39 35.10 29.84 85.00 2013-14 31.80 0.90
43 Bahria Town-4 132 904 26 23.40 19.89 85.00 2015-16 19.70 0.90
44 Chattarpari 132 913 13 11.57 9.84 85.00 2013-14 11.00 0.89
45 Mong AJK 33 945 8 7.12 6.05 85.00 2016-17 6.00 0.89
46 Satellite Town 132 958 106 95.40 81.09 85.00 2015-16 79.50 0.90
47 Chakri 132 968 26 23.40 19.89 85.00 2013-14 19.20 0.90
48 Kallar Sydan 132 981 26 23.40 19.89 85.00 2013-14 20.90 0.90
49 Talagang 132 1024 39 34.71 29.50 85.00 2013-14 33.00 0.89
50 Fatehpur 33 1033 8 7.12 6.05 85.00 2013-14 6.30 0.89
51 Bahria Town-8 220 1038 13 11.70 9.95 85.00 2013-14 10.30 0.90
52 Basal 132 1039 26 23.14 19.67 85.00 2013-14 19.60 0.89
53 Bagh 132 1042 26 23.14 19.67 85.00 2021-22 19.60 0.89
54 Tarnol 132 1049 26 23.40 19.89 85.00 2015-16 18.60 0.90
55 Tarmari 132 1055 26 23.40 19.89 85.00 2013-14 21.20 0.90
56 IslamGarh 132 1062 26 23.14 19.67 85.00 2020-21 19.50 0.89

32
IESCO
Table 1-16: List of Grids with their Codes and MVA Capacities
SR. No
Grid No.
kV Grid Name Transformer (MVA)
SR. No
Grid No.
kV Grid Name Transformer (MVA)
T1 T2 T3 T4 Total
T1 T2 T3 T4 Total
1 10 132 Bakar Mandi 40 26 26
92
2 21 220 Burhan 13
13
3 22 132 Chakwal 30 40 26 26 122
4 25 132 Chaklala 40 26 26
92
5 49 132 Gujar khan 26 26 26
78
6 64 132 I-10 40 26 40
106
7 74 132 Jatli 26 13
39
8 77 132 Jhelum 26 26 40
92
9 86 132 KTM 26 40 26
92
10 90 132 Kahuta City 13 26
39
11 120 132 F Abad 26 26 13
65
12 126 132 Mangla Right 26
26
13 137 132 Muree 26 26 13
65
14 146 132 New Wah 26 26 40 26 118
15 147 132 Nilore 26 13
39
16 174 132 Rawal 40 26 40
106
17 177 132 Rawat 26 26 13
65
18 179 132 Rwp Cantt 26 26 40
92
19 189 132 Sanjwal 13 26
39
20 212 132 Taxila 26 13 13 26 78
21 223 132 Zero Point 40 26 40
106
22 246 132 C.S.Shah 26
26
23 259 66 D.S.Bilawal 8 8 5
20
24 272 132 Fateh Jhang 5 30 26 13 74
25 290 66 Dandot 13 13
26
26 294 66 Jand 13
13
27 432 66 Pindi Gheb 13 13
26
28 433 132 Pir Wadhai 40 26 40
106
29 468 132 Dina 13 26
39
30 470 132 Rajar 26 26
52
31 481 132 Kotli AJK 26 26 26
78
32 482 132 Chak Sawari 13 26 26
65
33 484 132 Rawala Kot 26 26
52
34 485 33 Plandri AJK 13
13
35 486 33 Hajira AJK 4 5 13
22
36 521 66 Lakar Mar 13
13
37 582 66 Pinanwal 13 13 13
39
38 594 132 Mir Pur AJK 26 26 26
78
39 597 66 N.P.Sethi 13
13
40 611 132 I-8 40 26 40
106
41 630 132 Baragowah 13
13
42 631 66 Ahmadal 13 6
19

33
IESCO
SR. No
Grid No.
kV Grid Name Transformer (MVA)
SR. No
Grid No.
kV Grid Name Transformer (MVA)
T1 T2 T3 T4 Total
T1 T2 T3 T4 Total
43 643 132 Neela 13
13
44 645 500 New Rawat 13 13
26
45 669 132 Mangla-Left 8 26
34
46 692 132 F-11 40 26
66
47 722 66 Tamman 6 5 8
19
48 727 132 H-11 26 40 26
92
49 750 132 G-5 26 26 13 13 78
50 751 132 Attock New 26 13
39
51 755 132 E-8 26 26
52
52 791 132 Padshahan 13 13
26
53 794 33 Minhasa 5 5 4
14
54 810 220 Sang jani 13 13
26
55 833 132 Margalla 26 26
52
56 864 132 Taimor Shahed 26 26 26
78
57 870 132 Tarar Khal 6 13
19
58 874 132 Swan 26 26
52
59 892 220 University 26 26 13
65
60 899 132 Gondal 13 13
26
61 900 132 Police Foundati 13 13 13
39
62 904 132 Bahria Town-4 26
26
63 911 132 Dudyal 26 26
52
64 913 132 Chattarpari 13
13
65 928 132 Khoratta 26 13 13
52
66 945 33 Mong AJK 4 4
8
67 958 132 Satellite Town 40 26 40
106
68 968 132 Chakri 26
26
69 981 132 Kallar Sydan 13 13
26
70 1024 132 Talagang 13 26
39
71 1032 132 New Mir Pur AJK 26 26
52
72 1033 33 Fatehpur 4 4
8
73 1037 132 Chaintt Bhattia 13
13
74 1038 220 Bahria Town-8 13
13
75 1039 132 Basal 26
26
76 1040 132 D-12 26 26
52
77 1042 132 Bagh 13 13
26
78 1043 132 AWC 13 13
26
79 1046 132 I-16 26 26 26
78
80 1049 132 Tarnol 13 13
26
81 1055 132 Tarmari 26
26
82 1062 132 IslamGarh 26
26
83 1063 132 DESTO 26
26
84 1067 132 G-13 26 26 26
78
85 1071 132 Metalworks (Att 8
8
86 1076 132 MES 40 40
80
87 1091 132 Adyala Rd 40 40
80

34
IESCO Table 1- 17: Maximum Demand (MW) of Substations
P O W E R M A R K E T S U R V E Y
LOAD CENTRE SUMMARY
MAXIMUM DEMAND (MW) OF GRIDSTATIONS
DISCO: IESCO
--------------------------------------------------------------------------------------------------------------------------------------
|GRID| NAME OF | |_______________________________________________Y____E____A____R______________________________________________|
|NO. | GRIDSTATION |KV | 2013-14 | 2014-15 | 2015-16 | 2016-17 | 2017-18 | 2018-19 | 2019-20 | 2020-21 | 2021-22 | 2022-23 | 2023-24 |
--------------------------------------------------------------------------------------------------------------------------------------
1. 645 New Rawat 500 32.3 33.7 35.1 36.5 38.0 0.0 0.0 0.0 0.0 0.0 0.0
2. 1038 Bahria Town-8 220 10.3 10.5 10.8 11.1 11.3 11.6 11.9 12.2 12.5 12.8 13.1
3. 21 Burhan 220 6.0 6.1 6.2 6.3 6.4 0.0 0.0 0.0 0.0 0.0 0.0
4. 810 Sang jani 220 20.2 22.7 25.4 28.1 0.0 0.0 0.0 0.0 0.0 0.0 0.0
5. 892 University 220 44.7 48.8 52.4 56.2 60.0 0.0 0.0 0.0 0.0 0.0 0.0
6. 661 ARL 132 4.2 4.2 4.2 4.2 4.2 4.2 4.2 4.2 4.2 4.2 4.2
7. 1043 AWC 132 6.6 6.6 6.6 6.6 6.6 6.6 6.6 6.6 6.6 6.6 6.6
8. 1091 Adyala Rd 132 0.0 30.1 31.8 33.5 35.2 37.0 38.9 40.8 42.7 44.7 46.7
9. 751 Attock 132 20.0 21.9 23.7 25.6 27.6 29.5 31.6 33.6 35.7 37.9 40.1
10. 1042 Bagh 132 16.3 16.7 17.1 17.5 17.9 18.3 18.7 19.2 19.6 20.1 20.6
11. 904 Bahria Town-4 132 18.8 19.3 19.7 20.2 20.7 21.2 21.8 22.3 22.9 23.4 24.0
12. 10 Bakra Mandi 132 80.0 54.6 57.9 61.3 64.7 68.3 71.9 75.6 79.4 83.3 87.3
13. 630 Baragowa 132 8.9 9.5 10.0 10.6 11.1 11.7 12.3 12.9 13.5 14.1 14.8
14. 1039 Basal 132 19.6 22.5 25.5 28.6 31.8 35.0 38.3 41.7 45.1 48.7 52.3
15. 920 Bestway Cemen 132 31.6 31.6 31.6 31.6 31.6 31.6 31.6 31.6 31.6 31.6 31.6
16. 643 Bhagwal/Neela 132 12.7 14.9 17.1 19.3 21.6 23.9 26.2 28.7 31.1 33.7 36.2
17. 246 C.S.Shah 132 17.5 18.5 19.3 20.2 21.0 22.0 22.9 23.8 24.8 25.8 26.8
18. 817 CDA P/Station 132 4.6 4.6 4.6 4.6 4.6 4.6 4.6 4.6 4.6 4.6 4.6
19. 1037 Chaintt Bhatt 132 3.2 3.5 3.7 4.0 4.2 4.5 4.8 5.1 5.4 5.7 6.0
20. 482 Chak Sawari A 132 14.6 14.9 15.3 15.6 16.0 16.4 16.8 17.2 17.6 18.0 18.4
21. 25 Chaklala 132 79.7 82.1 86.1 90.1 94.2 98.4 102.6 107.0 111.5 116.1 120.8
22. 968 Chakri 132 19.2 20.2 21.3 22.4 23.5 24.6 25.8 27.0 28.2 29.5 30.7
23. 22 Chakwal 132 63.8 67.0 70.2 73.6 77.0 80.4 84.0 87.6 91.3 95.1 99.0
24. 913 Chattar Pari 132 11.0 11.3 11.5 11.8 12.0 12.3 12.6 12.8 13.1 13.4 13.7
25. 1040 D-12 132 22.0 23.1 24.4 25.6 26.9 28.2 29.5 30.9 32.3 33.7 35.2

35
IESCO P O W E R M A R K E T S U R V E Y
LOAD CENTRE SUMMARY
MAXIMUM DEMAND (MW) OF GRIDSTATIONS
DISCO: IESCO
--------------------------------------------------------------------------------------------------------------------------------------
|GRID| NAME OF | |_______________________________________________Y____E____A____R______________________________________________|
|NO. | GRIDSTATION |KV | 2013-14 | 2014-15 | 2015-16 | 2016-17 | 2017-18 | 2018-19 | 2019-20 | 2020-21 | 2021-22 | 2022-23 | 2023-24 |
--------------------------------------------------------------------------------------------------------------------------------------
26. 1063 DESTO 132 3.1 3.1 3.1 3.1 3.1 3.1 3.1 3.1 3.1 3.1 3.1
27. 939 DGK Cement 132 22.5 22.5 22.5 22.5 22.5 22.5 22.5 22.5 22.5 22.5 22.5
28. 997 DHA-II 132 5.8 7.1 8.4 9.7 11.1 12.5 13.9 15.4 16.9 18.4 20.0
29. 667 Dandot Cement 132 7.6 7.6 7.6 7.6 7.6 7.6 7.6 7.6 7.6 7.6 7.6
30. 911 Dhudyal 132 21.9 22.4 23.0 23.5 24.1 24.6 25.2 25.8 26.4 27.1 27.7
31. 468 Dina 132 27.8 29.1 30.5 32.0 33.4 34.9 36.5 38.1 39.7 41.3 43.0
32. 755 E-8 132 41.1 41.9 40.4 41.3 42.1 43.0 43.9 44.8 45.7 46.6 47.6
33. 692 F-11 132 48.6 51.0 53.4 55.9 58.4 61.0 63.6 65.7 68.5 71.3 74.2
34. 795 FCCL-I 132 27.0 27.0 27.0 27.0 27.0 27.0 27.0 27.0 27.0 27.0 27.0
35. 1023 FCCL-II 132 36.2 36.2 36.2 36.2 36.2 36.2 36.2 36.2 36.2 36.2 36.2
36. 120 Faqirabad 132 44.7 47.6 50.2 52.9 55.7 40.2 42.7 45.2 47.8 50.4 53.1
37. 272 Fateh Jhang 132 28.3 30.5 32.7 34.9 37.2 39.6 42.0 44.5 47.1 49.7 52.3
38. 1067 G-13 132 5.3 7.8 10.3 12.9 15.6 18.3 21.0 23.8 26.7 29.6 32.6
39. 750 G-5 132 31.2 31.9 32.6 33.4 34.2 34.9 35.7 36.6 37.4 38.3 39.1
40. 668 Gharibwal 132 11.5 11.5 11.5 37.6 37.6 37.6 37.6 37.6 37.6 37.6 37.6
41. 899 Gondal 132 18.0 19.0 20.0 21.0 22.0 23.1 24.2 25.3 26.4 27.6 28.8
42. 49 Gujar khan 132 60.0 63.7 67.3 71.1 74.9 65.0 68.7 72.5 76.4 80.4 84.4
43. 727 H-11 132 63.4 63.4 65.3 67.2 69.3 71.3 73.4 75.5 77.7 80.0 82.3
44. 665 HIT/Facto 132 17.2 17.2 17.2 17.2 17.2 17.2 17.2 17.2 17.2 17.2 17.2
45. 64 I-10 132 75.0 76.5 78.0 79.6 81.2 82.8 84.5 86.2 87.9 89.7 91.5
46. 1046 I-16 132 6.9 12.1 14.1 16.1 18.1 20.2 22.3 24.5 26.7 29.0 31.3
47. 611 I-8 132 60.7 62.3 63.7 65.1 66.6 68.1 69.7 71.3 72.9 74.6 76.3
48. 1062 Islamgarh 132 16.5 16.9 17.3 17.7 18.2 18.6 19.0 19.5 19.9 20.4 20.9
49. 1030 JF-17 132 9.9 9.9 9.9 9.9 9.9 9.9 9.9 9.9 9.9 9.9 9.9
50. 74 Jatli 132 22.2 23.4 24.5 25.7 26.9 28.1 29.4 30.7 32.0 33.4 34.8

36
IESCO P O W E R M A R K E T S U R V E Y
LOAD CENTRE SUMMARY
MAXIMUM DEMAND (MW) OF GRIDSTATIONS
DISCO: IESCO
--------------------------------------------------------------------------------------------------------------------------------------
|GRID| NAME OF | |_______________________________________________Y____E____A____R______________________________________________|
|NO. | GRIDSTATION |KV | 2013-14 | 2014-15 | 2015-16 | 2016-17 | 2017-18 | 2018-19 | 2019-20 | 2020-21 | 2021-22 | 2022-23 | 2023-24 |
--------------------------------------------------------------------------------------------------------------------------------------
51. 77 Jhelum 132 75.7 79.8 83.9 88.1 92.4 48.1 51.5 55.0 58.6 62.3 66.0
52. 89 KRL 132 15.1 15.1 15.1 15.1 15.1 15.1 15.1 15.1 15.1 15.1 15.1
53. 86 KTM 132 76.3 71.0 75.4 79.8 84.4 89.1 93.8 98.7 103.7 108.8 114.1
54. 90 Kahuta City 132 25.1 30.3 21.6 26.9 32.2 37.7 43.3 49.0 54.9 60.9 67.0
55. 981 Kallar Syedan 132 20.9 21.9 22.8 23.8 24.8 25.8 26.8 27.9 28.9 30.0 31.2
56. 95 Kamra 132 14.7 14.7 14.7 14.7 14.7 14.7 14.7 14.7 14.7 14.7 14.7
57. 928 Khui Ratta 132 25.8 26.4 27.0 27.6 28.2 28.8 29.5 30.2 30.9 31.6 32.3
58. 481 Kotli AJK 132 36.3 37.1 38.0 38.9 39.9 40.8 41.8 42.8 43.8 44.8 45.9
59. 1076 MES 132 12.7 37.8 38.7 39.5 40.3 41.2 42.1 43.0 43.9 44.9 45.8
60. 669 Mangla-Left 132 15.6 15.9 16.3 16.7 17.0 17.4 17.8 18.2 18.6 19.1 19.5
61. 126 Mangla-RB AJK 132 8.0 8.2 8.5 8.7 8.9 9.1 9.4 9.6 9.8 10.1 10.3
62. 833 Margalla 132 33.8 36.9 40.0 43.3 46.6 50.0 53.5 57.0 60.7 64.4 68.2
63. 1045 Metal Works 132 6.2 6.2 6.2 6.2 6.2 6.2 6.2 6.2 6.2 6.2 6.2
64. 1071 Metal Works 132 4.1 4.1 4.1 4.1 4.1 4.1 4.1 4.1 4.1 4.1 4.1
65. 594 Mir Pur AJK 132 47.4 48.6 49.7 50.9 52.1 53.3 54.6 55.8 57.2 58.5 59.9
66. 137 Muree 132 29.4 32.5 35.6 38.7 42.0 45.3 48.7 52.2 55.8 59.5 63.2
67. 900 NPF 132 31.8 37.9 44.1 50.5 57.1 63.8 70.6 77.6 84.8 92.1 99.6
68. 1032 New Mir Pur A 132 17.4 17.8 18.2 18.6 19.0 19.4 19.8 20.2 20.7 21.1 21.6
69. 146 New Wah 132 70.2 75.1 57.2 61.8 66.5 71.3 76.2 81.3 86.4 91.7 97.1
70. 147 Nilore 132 26.4 27.4 28.4 29.4 30.5 31.5 32.6 33.8 34.9 36.1 37.3
71. 177 Old Rawat 132 46.9 49.3 45.3 46.8 48.5 50.1 51.8 53.6 55.3 57.2 59.0
72. 791 Padshahan 132 21.6 23.3 25.0 26.8 28.6 20.2 21.8 23.5 25.3 27.1 28.9
73. 921 Pak Cement 132 43.3 43.3 43.3 43.3 43.3 43.3 43.3 43.3 43.3 43.3 43.3
74. 433 Pirwadhai 132 70.2 72.7 75.2 77.7 80.4 83.0 85.8 88.6 91.5 94.4 97.4
75. 1223 Prop Al Ghura 132 0.0 0.0 0.0 3.0 6.0 9.1 12.2 15.5 18.7 22.1 25.5

37
IESCO
P O W E R M A R K E T S U R V E Y
LOAD CENTRE SUMMARY
MAXIMUM DEMAND (MW) OF GRIDSTATIONS
DISCO: IESCO
--------------------------------------------------------------------------------------------------------------------------------------
|GRID| NAME OF | |_______________________________________________Y____E____A____R______________________________________________|
|NO. | GRIDSTATION |KV | 2013-14 | 2014-15 | 2015-16 | 2016-17 | 2017-18 | 2018-19 | 2019-20 | 2020-21 | 2021-22 | 2022-23 | 2023-24 |
--------------------------------------------------------------------------------------------------------------------------------------
76. 1224 Prop Al Hamra 132 0.0 0.0 0.0 0.0 0.0 2.1 4.2 6.4 8.6 10.8 13.1
77. 1213 Prop Anchorag 132 0.0 0.0 0.0 0.0 2.0 4.0 6.1 8.2 10.4 12.6 14.9
78. 1237 Prop Asian Pr 132 0.0 0.0 12.0 35.0 35.0 35.0 35.0 35.0 35.0 35.0 35.0
79. 1208 Prop B.Enclav 132 0.0 0.0 0.0 0.0 3.0 6.0 9.1 12.3 15.5 18.8 22.2
80. 1205 Prop Bahtermo 132 0.0 0.0 24.0 25.5 27.1 28.7 30.3 32.0 33.7 35.4 37.2
81. 1221 Prop Barite M 132 0.0 0.0 2.0 4.0 5.0 5.0 5.0 5.0 5.0 5.0 5.0
82. 1230 Prop Burhan 132 0.0 0.0 0.0 0.0 0.0 6.5 6.6 6.7 6.8 6.9 7.0
83. 1207 Prop Chakri R 132 0.0 0.0 0.0 1.0 2.0 3.0 4.1 5.2 6.3 7.4 8.5
84. 1218 Prop D.S.Bila 132 0.0 0.0 0.0 0.0 0.0 30.6 33.4 36.4 39.4 42.4 45.6
85. 1234 Prop DHA Vall 132 0.0 0.0 0.0 3.5 7.0 10.6 14.3 18.1 21.9 25.9 29.9
86. 1201 Prop DHA-I 132 0.0 0.0 0.0 0.0 0.9 2.3 3.2 4.1 5.1 6.0 7.0
87. 1227 Prop E-16(CDE 132 0.0 0.0 0.0 0.0 0.0 0.0 0.0 0.0 1.5 3.0 4.5
88. 1222 Prop Emaar 132 0.0 0.0 0.0 0.0 3.0 6.0 9.1 12.2 15.5 18.8 22.2
89. 1216 Prop F-16(J&K 132 0.0 6.8 8.4 10.0 11.6 13.3 15.0 16.8 18.6 20.4 22.3
90. 1215 Prop F-9(Cent 132 0.0 0.0 6.3 10.4 14.5 18.7 23.0 27.3 31.8 36.3 40.8
91. 1235 Prop FJWU 132 0.0 0.0 0.0 0.0 2.5 5.0 7.5 10.0 12.5 15.0 17.5
92. 1202 Prop Gangal 132 0.0 0.0 21.7 24.2 26.7 29.2 31.8 34.4 37.1 39.9 42.7
93. 1229 Prop Ghurgush 132 0.0 0.0 0.0 0.0 0.0 18.3 18.7 19.2 19.7 20.1 20.6
94. 1225 Prop Golf Cit 132 0.0 0.0 0.0 0.0 4.1 8.4 12.7 17.1 21.7 24.6 25.2
95. 1220 Prop IB H/S 132 0.0 0.0 0.0 3.0 6.0 9.1 12.2 15.5 18.8 22.1 25.6
96. 1211 Prop Jand 132 0.0 0.0 0.0 0.0 0.0 22.0 24.0 26.0 28.1 30.2 32.4
97. 1206 Prop Jhelum C 132 0.0 0.0 0.0 0.0 0.0 31.9 32.6 33.3 34.1 34.8 35.6
98. 1236 Prop Karot 132 0.0 1.8 4.5 16.6 16.6 16.6 16.6 16.6 16.6 16.6 16.6
99. 1228 Prop Khan Pur 132 0.0 0.0 0.0 0.0 0.0 10.3 10.6 10.9 11.1 11.4 11.7
100. 1214 Prop LakarMar 132 0.0 0.0 0.0 0.0 0.0 20.1 21.8 23.6 25.4 27.3 29.2
38
IESCO P O W E R M A R K E T S U R V E Y
LOAD CENTRE SUMMARY
MAXIMUM DEMAND (MW) OF GRIDSTATIONS
DISCO: IESCO
--------------------------------------------------------------------------------------------------------------------------------------
|GRID| NAME OF | |_______________________________________________Y____E____A____R______________________________________________|
|NO. | GRIDSTATION |KV | 2013-14 | 2014-15 | 2015-16 | 2016-17 | 2017-18 | 2018-19 | 2019-20 | 2020-21 | 2021-22 | 2022-23 | 2023-24 |
--------------------------------------------------------------------------------------------------------------------------------------
101. 1209 Prop NBBIA 132 0.0 0.0 5.0 10.0 15.0 20.0 20.0 20.0 20.0 20.0 20.0
102. 1212 Prop New GHQ 132 0.0 0.0 0.0 0.0 0.0 0.0 0.0 8.8 17.0 25.3 33.5
103. 1210 Prop NustH-12 132 0.0 2.2 4.1 6.0 8.0 9.9 11.8 13.8 13.8 13.9 13.9
104. 1232 Prop Rawat 132 0.0 0.0 0.0 0.0 0.0 39.0 40.5 42.0 43.6 45.2 46.9
105. 1219 Prop Sanghoi 132 0.0 0.0 0.0 0.0 0.0 16.8 17.2 17.6 18.0 18.5 18.9
106. 1231 Prop Sangjani 132 0.0 0.0 0.0 2.1 35.2 40.2 45.4 50.7 56.1 61.6 67.2
107. 1226 Prop Sohawa 132 0.0 0.0 0.0 0.0 0.0 13.8 14.1 14.4 14.7 15.1 15.4
108. 1217 Prop Tamman 132 0.0 0.0 0.0 0.0 0.0 31.0 34.2 37.5 40.9 44.4 48.0
109. 1233 Prop Uni (B.k 132 0.0 0.0 0.0 0.0 0.0 64.0 68.0 72.1 76.3 80.7 85.1
110. 470 Rajjar 132 37.1 39.2 41.3 43.6 45.8 48.1 50.5 53.0 55.5 58.0 60.6
111. 174 Rawal 132 61.4 64.5 68.8 73.1 77.6 82.1 84.2 86.4 88.7 91.0 93.3
112. 484 Rawala Kot 132 17.4 17.8 18.2 18.6 19.0 19.5 19.9 20.4 20.9 21.4 21.8
113. 179 Rwp Cantt 132 63.8 49.7 52.0 54.3 56.6 59.0 61.5 64.0 66.5 69.2 71.8
114. 189 Sanjwal 132 23.1 29.6 33.4 37.2 41.1 45.1 49.2 53.4 57.7 62.1 66.6
115. 958 Satellite Tow 132 75.6 77.5 79.5 81.5 83.6 85.7 87.9 90.1 92.4 94.7 97.1
116. 874 Soan Camp 132 40.2 43.1 45.2 47.4 49.7 51.9 54.3 56.7 59.1 61.6 64.2
117. 864 Taimoor Shahe 132 48.0 57.9 59.4 60.9 62.5 64.1 65.7 67.4 69.1 70.8 72.6
118. 1024 Talagang 132 33.0 36.6 40.3 44.1 47.9 51.9 56.0 60.2 64.4 68.8 73.3
119. 870 Tarar Khal 132 8.3 8.4 8.6 8.8 9.0 9.2 9.4 9.6 9.8 10.0 10.2
120. 1049 Tarnol 132 8.3 13.4 18.6 23.9 29.4 35.0 40.6 46.5 52.4 58.5 64.7
121. 212 Taxila 132 42.8 45.7 48.6 51.5 54.6 57.7 60.9 64.1 67.4 70.8 74.3
122. 1055 Tramri 132 21.2 23.0 24.8 26.7 28.6 30.6 32.6 34.6 36.8 38.9 41.1
123. 734 Wah 14 132 22.4 22.4 22.4 22.4 22.4 22.4 22.4 22.4 22.4 22.4 22.4
124. 662 Wah 5 132 21.0 21.0 21.0 21.0 21.0 21.0 21.0 21.0 21.0 21.0 21.0
125. 663 Wah 6 132 22.8 22.8 22.8 22.8 22.8 22.8 22.8 22.8 22.8 22.8 22.8

39
IESCO P O W E R M A R K E T S U R V E Y
LOAD CENTRE SUMMARY
MAXIMUM DEMAND (MW) OF GRIDSTATIONS
DISCO: IESCO
--------------------------------------------------------------------------------------------------------------------------------------
|GRID| NAME OF | |_______________________________________________Y____E____A____R______________________________________________|
|NO. | GRIDSTATION |KV | 2013-14 | 2014-15 | 2015-16 | 2016-17 | 2017-18 | 2018-19 | 2019-20 | 2020-21 | 2021-22 | 2022-23 | 2023-24 |
--------------------------------------------------------------------------------------------------------------------------------------
126. 223 Zero Point 132 62.9 65.3 67.6 69.9 72.3 74.7 77.2 79.7 82.3 85.0 87.7
127. 631 Ahmadal 66 9.0 9.8 10.7 11.5 12.4 13.3 14.2 15.1 16.1 17.1 18.1
128. 259 D.S.Bilawal 66 17.0 19.8 22.4 25.0 27.8 0.0 0.0 0.0 0.0 0.0 0.0
129. 290 Dandot 66 20.0 21.0 22.1 23.1 24.2 25.3 26.5 27.6 28.8 30.0 31.3
130. 294 Jand 66 12.8 16.0 19.3 22.6 26.1 7.6 9.3 10.9 12.6 14.4 16.2
131. 521 Lakar Mar 66 12.1 13.6 15.2 16.8 18.4 0.0 0.0 0.0 0.0 0.0 0.0
132. 597 N.P.Sethi 66 13.0 16.6 20.0 23.5 27.0 30.7 34.4 38.3 42.2 46.2 50.3
133. 582 Pinanwal 66 15.3 16.4 17.4 18.5 19.6 20.8 21.9 23.1 24.4 25.6 26.9
134. 432 Pindi Gheb 66 13.0 13.8 14.7 15.5 16.4 17.3 18.2 19.2 20.1 21.1 22.1
135. 722 Tamman 66 15.8 18.7 21.7 24.7 27.8 0.0 0.0 0.0 0.0 0.0 0.0
136. 1033 Fatehpur 33 6.3 6.4 6.6 6.7 6.9 7.0 7.2 7.4 7.5 7.7 7.9
137. 486 Hajeera AJK 33 17.7 18.1 18.5 18.9 19.4 19.8 20.2 20.7 21.1 21.6 22.1
138. 794 Minhasa 33 12.2 12.5 12.9 13.2 13.5 13.8 14.2 14.5 14.9 15.3 15.6
139. 945 Mong AJK 33 5.6 5.7 5.8 6.0 6.1 6.2 6.4 6.5 6.7 6.8 7.0
140. 485 Plandri AJK 33 7.7 7.9 8.1 8.3 8.5 8.7 8.9 9.1 9.3 9.5 9.8
------------------------------------------------------------------------------------------------------------------
Total L.C. 2841.9 3018.8 3208.4 3460.4 3670.2 3884.7 4097.0 4322.7 4552.2 4785.7 5020.9

40
IESCO Table 1- 18: Category-wise Maximum Demand (MW) of Substations
P O W E R M A R K E T S U R V E Y
CATEGORY-WISE GRIDSTATION LOAD FOR DISCO
DISCO: IESCO Year:- YEAR :2023-24
-------------------------------------------------------------------------------------------------------------------------------------------------------------------
|SR GRID NAME OF | | | PUBLIC | SMALL | M & L | TUBE WELLS | | TOTAL OF | POWER FACTOR(%) |
|No.NUMBER GRID STATION | DOMESTIC | COMMERCIAL | LIGHTING | INDUSTRIES | INDUSTRIES | PRIVATE | PUBLIC | TRACTION | GRIDSTATION | REACT-POWER(Mvar)|
-------------------------------------------------------------------------------------------------------------------------------------------------------------------
1. 661 132kV ARL GWh 0.00 0.00 0.00 0.00 9.28 0.00 0.00 0.00 9.28 0.90
MW 0.00 0.00 0.00 0.00 4.18 0.00 0.00 0.00 4.18 2.00
2. 1043 132kV AWC GWh 0.00 0.00 0.00 0.00 13.27 0.00 0.00 0.00 13.27 0.90
MW 0.00 0.00 0.00 0.00 6.56 0.00 0.00 0.00 6.56 3.00
3. 1091 132kV Adyala Rd GWh 209.11 15.66 0.59 1.12 5.11 0.71 0.00 0.00 232.30 0.90
MW 42.85 3.58 0.23 0.30 4.77 0.16 0.00 0.00 46.70 23.00
4. 631 66kV Ahmadal GWh 57.73 4.66 0.00 0.78 0.35 0.20 0.00 0.00 63.72 0.90
MW 17.81 1.77 0.00 0.21 0.22 0.05 0.00 0.00 18.06 9.00
5. 751 132kV Attock GWh 121.00 18.71 0.41 1.27 53.41 2.64 0.00 0.00 197.45 0.86
MW 27.63 5.34 0.16 0.34 10.45 0.60 0.00 0.00 40.06 24.00
6. 1042 132kV Bagh GWh 74.34 12.95 0.00 9.79 8.79 0.00 0.00 0.00 105.87 0.89
MW 16.97 3.29 0.00 2.61 0.00 0.00 0.00 0.00 20.58 11.00
7. 904 132kV Bahria Town-4 GWh 84.16 0.00 0.00 0.00 0.00 0.00 0.00 0.00 84.16 0.90
MW 26.69 0.00 0.00 0.00 0.00 0.00 0.00 0.00 24.02 12.00
8. 1038 220kV Bahria Town-8 GWh 66.48 0.00 0.00 0.00 0.00 0.00 0.00 0.00 66.48 0.90
MW 14.60 0.00 0.00 0.00 0.00 0.00 0.00 0.00 13.14 6.00
9. 10 132kV Bakra Mandi GWh 412.05 40.77 3.51 2.97 3.47 0.00 0.00 0.00 462.77 0.90
MW 78.40 9.31 1.34 0.79 7.19 0.00 0.00 0.00 87.32 42.00
10. 630 132kV Baragowa GWh 53.78 2.53 0.00 0.16 0.72 0.46 0.00 0.00 57.65 0.90
MW 14.97 0.96 0.00 0.04 0.36 0.11 0.00 0.00 14.80 7.00
11. 1039 132kV Basal GWh 91.10 7.17 0.00 2.82 0.63 1.87 0.00 0.00 103.57 0.90
MW 52.00 4.09 0.00 0.75 0.84 0.43 0.00 0.00 52.29 25.00
12. 920 132kV Bestway Cement GWh 0.00 0.00 0.00 0.00 196.70 0.00 0.00 0.00 196.70 0.90
MW 0.00 0.00 0.00 0.00 31.59 0.00 0.00 0.00 31.59 15.00
13. 643 132kV Bhagwal/Neela GWh 81.17 8.86 0.00 0.23 78.20 4.36 0.00 0.00 172.83 0.87
MW 26.47 3.37 0.00 0.06 9.36 1.00 0.00 0.00 36.24 21.00
14. 246 132kV C.S.Shah GWh 65.73 7.64 0.13 2.08 12.64 9.37 0.00 0.00 97.59 0.89
MW 20.84 2.91 0.05 0.55 3.32 2.14 0.00 0.00 26.83 14.00
15. 817 132kV CDA P/Station GWh 0.00 0.00 0.00 0.00 23.27 0.00 0.00 0.00 23.27 0.90
MW 0.00 0.00 0.00 0.00 4.61 0.00 0.00 0.00 4.61 2.00
16. 1037 132kV Chaintt Bhattia GWh 14.59 0.79 0.00 0.00 0.00 0.00 0.00 0.00 15.38 0.90
MW 6.17 0.45 0.00 0.00 0.00 0.00 0.00 0.00 5.96 3.00
17. 482 132kV Chak Sawari AJ GWh 69.51 12.11 0.00 9.15 8.22 0.00 0.00 0.00 98.99 0.89
MW 14.97 3.07 0.00 2.44 0.00 0.00 0.00 0.00 18.43 9.00
18. 25 132kV Chaklala GWh 446.99 70.34 6.63 6.47 25.62 0.00 0.00 0.00 556.05 0.90
MW 102.05 20.08 2.52 1.72 7.81 0.00 0.00 0.00 120.76 58.00
19. 968 132kV Chakri GWh 77.15 5.86 0.07 2.97 16.52 2.23 0.00 0.00 104.81 0.90
MW 25.90 2.91 0.03 0.79 4.02 0.51 0.00 0.00 30.74 15.00
20. 22 132kV Chakwal GWh 266.00 35.08 0.30 4.01 196.43 16.25 0.00 0.00 518.07 0.87
MW 67.48 11.44 0.11 1.07 26.23 3.71 0.00 0.00 99.04 56.00
21. 913 132kV Chattar Pari GWh 41.61 7.25 0.00 5.48 4.92 0.00 0.00 0.00 59.27 0.89
MW 8.80 1.84 0.00 1.46 3.12 0.00 0.00 0.00 13.69 7.00
22. 1040 132kV D-12 GWh 53.49 8.52 0.72 0.57 0.07 0.06 0.00 0.00 63.43 0.90
MW 32.14 6.48 0.27 0.15 0.02 0.01 0.00 0.00 35.17 17.00
23. 1063 132kV DESTO GWh 0.00 0.00 0.00 0.00 1.54 0.00 0.00 0.00 1.54 0.90
MW 0.00 0.00 0.00 0.00 3.11 0.00 0.00 0.00 3.11 2.00
24. 939 132kV DGK Cement GWh 0.00 0.00 0.00 0.00 59.09 0.00 0.00 0.00 59.09 0.90
MW 0.00 0.00 0.00 0.00 22.55 0.00 0.00 0.00 22.55 11.00
25. 997 132kV DHA-II GWh 98.92 2.83 1.38 0.40 0.00 0.00 0.00 0.00 103.52 0.90
MW 20.53 1.08 0.52 0.11 0.00 0.00 0.00 0.00 20.01 10.00

41
IESCO
P O W E R M A R K E T S U R V E Y
CATEGORY-WISE GRIDSTATION LOAD FOR DISCO
DISCO: IESCO Year:- YEAR :2023-24
-------------------------------------------------------------------------------------------------------------------------------------------------------------------
|SR GRID NAME OF | | | PUBLIC | SMALL | M & L | TUBE WELLS | | TOTAL OF | POWER FACTOR(%) |
|No.NUMBER GRID STATION | DOMESTIC | COMMERCIAL | LIGHTING | INDUSTRIES | INDUSTRIES | PRIVATE | PUBLIC | TRACTION | GRIDSTATION | REACT-POWER(Mvar)|
-------------------------------------------------------------------------------------------------------------------------------------------------------------------
26. 290 66kV Dandot GWh 100.01 9.44 0.02 0.60 18.32 3.31 0.00 0.00 131.70 0.90
MW 25.95 3.08 0.01 0.16 4.82 0.76 0.00 0.00 31.29 15.00
27. 667 132kV Dandot Cement GWh 0.00 0.00 0.00 0.00 32.15 0.00 0.00 0.00 32.15 0.90
MW 0.00 0.00 0.00 0.00 7.61 0.00 0.00 0.00 7.61 4.00
28. 911 132kV Dhudyal GWh 105.92 18.45 0.00 13.95 12.53 0.00 0.00 0.00 150.85 0.89
MW 22.39 4.68 0.00 3.72 0.00 0.00 0.00 0.00 27.71 14.00
29. 468 132kV Dina GWh 130.89 13.44 0.12 9.16 6.67 3.76 0.00 0.00 164.05 0.89
MW 37.36 5.11 0.05 2.44 2.01 0.86 0.00 0.00 43.04 22.00
30. 755 132kV E-8 GWh 108.14 38.75 0.69 0.86 1.76 0.39 0.00 0.00 150.58 0.90
MW 28.06 12.64 0.26 0.23 11.63 0.09 0.00 0.00 47.61 23.00
31. 692 132kV F-11 GWh 226.55 56.24 9.18 2.47 1.55 0.28 0.00 0.00 296.27 0.90
MW 58.78 18.34 3.49 0.66 1.10 0.06 0.00 0.00 74.19 36.00
32. 795 132kV FCCL-I GWh 0.00 0.00 0.00 0.00 135.28 0.00 0.00 0.00 135.28 0.90
MW 0.00 0.00 0.00 0.00 27.03 0.00 0.00 0.00 27.03 13.00
33. 1023 132kV FCCL-II GWh 0.00 0.00 0.00 0.00 108.93 0.00 0.00 0.00 108.93 0.90
MW 0.00 0.00 0.00 0.00 36.20 0.00 0.00 0.00 36.20 18.00
34. 120 132kV Faqirabad GWh 116.86 15.64 0.29 3.71 21.78 5.95 0.00 0.00 164.23 0.89
MW 41.69 7.44 0.11 0.99 7.42 1.36 0.00 0.00 53.10 27.00
35. 272 132kV Fateh Jhang GWh 134.85 16.27 0.21 3.76 14.21 5.91 0.00 0.00 175.22 0.89
MW 43.98 6.19 0.08 1.00 5.56 1.35 0.00 0.00 52.35 27.00
36. 1033 33kV Fatehpur GWh 31.01 5.40 0.00 4.08 3.67 0.00 0.00 0.00 44.17 0.89
MW 6.32 1.37 0.00 1.09 0.00 0.00 0.00 0.00 7.90 4.00
37. 1067 132kV G-13 GWh 63.58 24.91 0.15 0.00 0.00 0.00 0.00 0.00 88.65 0.90
MW 21.99 14.22 0.06 0.00 0.00 0.00 0.00 0.00 32.64 16.00
38. 750 132kV G-5 GWh 97.60 57.79 0.00 0.12 0.22 0.57 0.00 0.00 156.29 0.90
MW 21.43 16.49 0.00 0.03 5.39 0.13 0.00 0.00 39.13 19.00
39. 668 132kV Gharibwal GWh 0.00 0.00 0.00 0.00 163.05 0.00 0.00 0.00 163.05 0.90
MW 0.00 0.00 0.00 0.00 37.65 0.00 0.00 0.00 37.65 18.00
40. 899 132kV Gondal GWh 84.90 7.24 0.00 2.36 3.92 22.47 0.00 0.00 120.89 0.88
MW 21.54 2.36 0.00 0.63 2.37 5.13 0.00 0.00 28.83 16.00
41. 49 132kV Gujar khan GWh 240.38 24.19 0.56 10.98 62.31 11.74 0.00 0.00 350.15 0.89
MW 70.36 9.20 0.21 2.92 8.44 2.68 0.00 0.00 84.44 43.00
42. 727 132kV H-11 GWh 228.44 82.59 10.93 1.86 40.07 0.20 0.00 0.00 364.10 0.90
MW 46.57 20.95 4.16 0.50 19.17 0.05 0.00 0.00 82.25 40.00
43. 665 132kV HIT/Facto GWh 0.00 0.00 0.00 0.00 95.52 0.00 0.00 0.00 95.52 0.90
MW 0.00 0.00 0.00 0.00 17.17 0.00 0.00 0.00 17.17 8.00
44. 486 33kV Hajeera AJK GWh 80.17 13.97 0.00 10.56 9.48 0.00 0.00 0.00 114.17 0.89
MW 15.25 3.19 0.00 2.81 3.32 0.00 0.00 0.00 22.11 11.00
45. 64 132kV I-10 GWh 131.14 70.32 3.53 2.86 220.75 1.02 0.00 0.00 429.61 0.88
MW 33.27 22.94 1.34 0.76 43.14 0.23 0.00 0.00 91.51 49.00
46. 1046 132kV I-16 GWh 25.57 5.22 0.00 0.05 53.49 0.02 0.00 0.00 84.35 0.88
MW 22.46 5.96 0.00 0.01 6.30 0.01 0.00 0.00 31.26 17.00
47. 611 132kV I-8 GWh 216.45 60.58 11.17 0.94 42.88 6.21 0.00 0.00 338.23 0.90
MW 48.45 15.37 4.25 0.25 15.02 1.42 0.00 0.00 76.28 37.00
48. 1062 132kV Islamgarh GWh 58.86 10.25 0.00 7.75 6.96 0.00 0.00 0.00 83.82 0.89
MW 17.23 3.90 0.00 2.06 0.00 0.00 0.00 0.00 20.87 11.00
49. 1030 132kV JF-17 GWh 0.00 0.00 0.00 0.00 12.44 0.00 0.00 0.00 12.44 0.90
MW 0.00 0.00 0.00 0.00 9.87 0.00 0.00 0.00 9.87 5.00
50. 294 66kV Jand GWh 49.91 4.15 0.00 0.39 0.00 0.17 0.00 0.00 54.62 0.90
MW 16.28 1.58 0.00 0.10 0.00 0.04 0.00 0.00 16.20 8.00
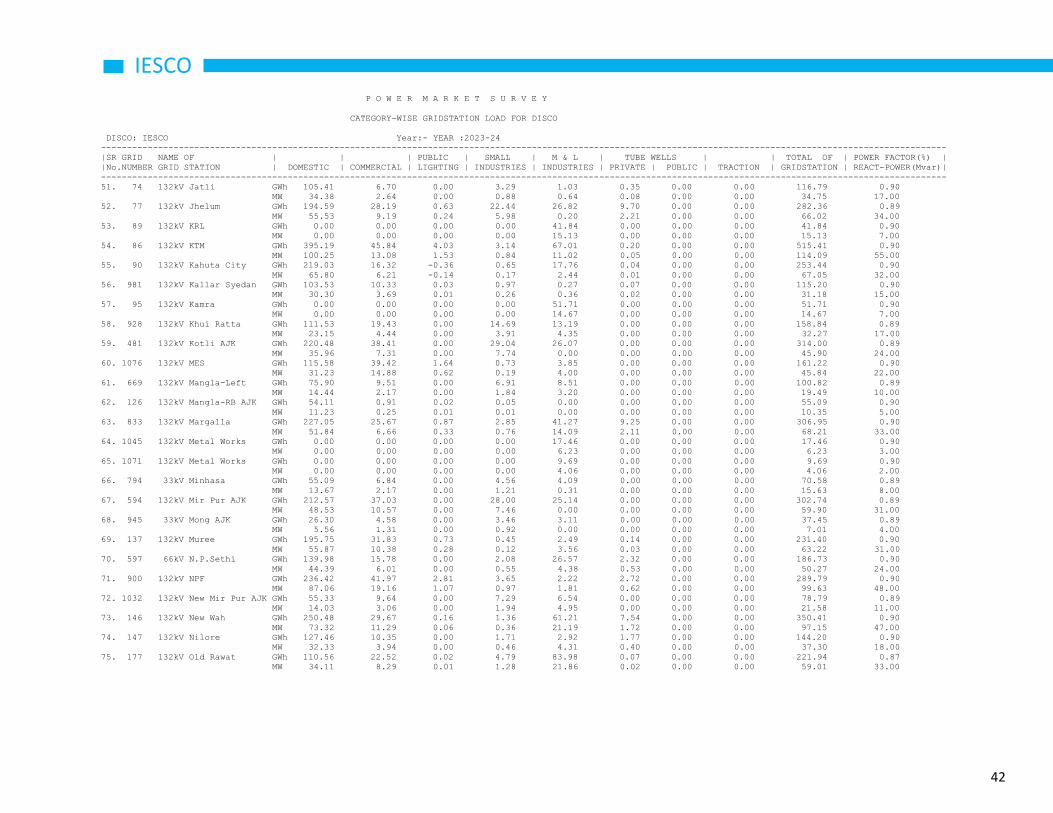
42
IESCO
P O W E R M A R K E T S U R V E Y
CATEGORY-WISE GRIDSTATION LOAD FOR DISCO
DISCO: IESCO Year:- YEAR :2023-24
-------------------------------------------------------------------------------------------------------------------------------------------------------------------
|SR GRID NAME OF | | | PUBLIC | SMALL | M & L | TUBE WELLS | | TOTAL OF | POWER FACTOR(%) |
|No.NUMBER GRID STATION | DOMESTIC | COMMERCIAL | LIGHTING | INDUSTRIES | INDUSTRIES | PRIVATE | PUBLIC | TRACTION | GRIDSTATION | REACT-POWER(Mvar)|
-------------------------------------------------------------------------------------------------------------------------------------------------------------------
51. 74 132kV Jatli GWh 105.41 6.70 0.00 3.29 1.03 0.35 0.00 0.00 116.79 0.90
MW 34.38 2.64 0.00 0.88 0.64 0.08 0.00 0.00 34.75 17.00
52. 77 132kV Jhelum GWh 194.59 28.19 0.63 22.44 26.82 9.70 0.00 0.00 282.36 0.89
MW 55.53 9.19 0.24 5.98 0.20 2.21 0.00 0.00 66.02 34.00
53. 89 132kV KRL GWh 0.00 0.00 0.00 0.00 41.84 0.00 0.00 0.00 41.84 0.90
MW 0.00 0.00 0.00 0.00 15.13 0.00 0.00 0.00 15.13 7.00
54. 86 132kV KTM GWh 395.19 45.84 4.03 3.14 67.01 0.20 0.00 0.00 515.41 0.90
MW 100.25 13.08 1.53 0.84 11.02 0.05 0.00 0.00 114.09 55.00
55. 90 132kV Kahuta City GWh 219.03 16.32 -0.36 0.65 17.76 0.04 0.00 0.00 253.44 0.90
MW 65.80 6.21 -0.14 0.17 2.44 0.01 0.00 0.00 67.05 32.00
56. 981 132kV Kallar Syedan GWh 103.53 10.33 0.03 0.97 0.27 0.07 0.00 0.00 115.20 0.90
MW 30.30 3.69 0.01 0.26 0.36 0.02 0.00 0.00 31.18 15.00
57. 95 132kV Kamra GWh 0.00 0.00 0.00 0.00 51.71 0.00 0.00 0.00 51.71 0.90
MW 0.00 0.00 0.00 0.00 14.67 0.00 0.00 0.00 14.67 7.00
58. 928 132kV Khui Ratta GWh 111.53 19.43 0.00 14.69 13.19 0.00 0.00 0.00 158.84 0.89
MW 23.15 4.44 0.00 3.91 4.35 0.00 0.00 0.00 32.27 17.00
59. 481 132kV Kotli AJK GWh 220.48 38.41 0.00 29.04 26.07 0.00 0.00 0.00 314.00 0.89
MW 35.96 7.31 0.00 7.74 0.00 0.00 0.00 0.00 45.90 24.00
60. 1076 132kV MES GWh 115.58 39.42 1.64 0.73 3.85 0.00 0.00 0.00 161.22 0.90
MW 31.23 14.88 0.62 0.19 4.00 0.00 0.00 0.00 45.84 22.00
61. 669 132kV Mangla-Left GWh 75.90 9.51 0.00 6.91 8.51 0.00 0.00 0.00 100.82 0.89
MW 14.44 2.17 0.00 1.84 3.20 0.00 0.00 0.00 19.49 10.00
62. 126 132kV Mangla-RB AJK GWh 54.11 0.91 0.02 0.05 0.00 0.00 0.00 0.00 55.09 0.90
MW 11.23 0.25 0.01 0.01 0.00 0.00 0.00 0.00 10.35 5.00
63. 833 132kV Margalla GWh 227.05 25.67 0.87 2.85 41.27 9.25 0.00 0.00 306.95 0.90
MW 51.84 6.66 0.33 0.76 14.09 2.11 0.00 0.00 68.21 33.00
64. 1045 132kV Metal Works GWh 0.00 0.00 0.00 0.00 17.46 0.00 0.00 0.00 17.46 0.90
MW 0.00 0.00 0.00 0.00 6.23 0.00 0.00 0.00 6.23 3.00
65. 1071 132kV Metal Works GWh 0.00 0.00 0.00 0.00 9.69 0.00 0.00 0.00 9.69 0.90
MW 0.00 0.00 0.00 0.00 4.06 0.00 0.00 0.00 4.06 2.00
66. 794 33kV Minhasa GWh 55.09 6.84 0.00 4.56 4.09 0.00 0.00 0.00 70.58 0.89
MW 13.67 2.17 0.00 1.21 0.31 0.00 0.00 0.00 15.63 8.00
67. 594 132kV Mir Pur AJK GWh 212.57 37.03 0.00 28.00 25.14 0.00 0.00 0.00 302.74 0.89
MW 48.53 10.57 0.00 7.46 0.00 0.00 0.00 0.00 59.90 31.00
68. 945 33kV Mong AJK GWh 26.30 4.58 0.00 3.46 3.11 0.00 0.00 0.00 37.45 0.89
MW 5.56 1.31 0.00 0.92 0.00 0.00 0.00 0.00 7.01 4.00
69. 137 132kV Muree GWh 195.75 31.83 0.73 0.45 2.49 0.14 0.00 0.00 231.40 0.90
MW 55.87 10.38 0.28 0.12 3.56 0.03 0.00 0.00 63.22 31.00
70. 597 66kV N.P.Sethi GWh 139.98 15.78 0.00 2.08 26.57 2.32 0.00 0.00 186.73 0.90
MW 44.39 6.01 0.00 0.55 4.38 0.53 0.00 0.00 50.27 24.00
71. 900 132kV NPF GWh 236.42 41.97 2.81 3.65 2.22 2.72 0.00 0.00 289.79 0.90
MW 87.06 19.16 1.07 0.97 1.81 0.62 0.00 0.00 99.63 48.00
72. 1032 132kV New Mir Pur AJK GWh 55.33 9.64 0.00 7.29 6.54 0.00 0.00 0.00 78.79 0.89
MW 14.03 3.06 0.00 1.94 4.95 0.00 0.00 0.00 21.58 11.00
73. 146 132kV New Wah GWh 250.48 29.67 0.16 1.36 61.21 7.54 0.00 0.00 350.41 0.90
MW 73.32 11.29 0.06 0.36 21.19 1.72 0.00 0.00 97.15 47.00
74. 147 132kV Nilore GWh 127.46 10.35 0.00 1.71 2.92 1.77 0.00 0.00 144.20 0.90
MW 32.33 3.94 0.00 0.46 4.31 0.40 0.00 0.00 37.30 18.00
75. 177 132kV Old Rawat GWh 110.56 22.52 0.02 4.79 83.98 0.07 0.00 0.00 221.94 0.87
MW 34.11 8.29 0.01 1.28 21.86 0.02 0.00 0.00 59.01 33.00

43
IESCO
P O W E R M A R K E T S U R V E Y
CATEGORY-WISE GRIDSTATION LOAD FOR DISCO
DISCO: IESCO Year:- YEAR :2023-24
-------------------------------------------------------------------------------------------------------------------------------------------------------------------
|SR GRID NAME OF | | | PUBLIC | SMALL | M & L | TUBE WELLS | | TOTAL OF | POWER FACTOR(%) |
|No.NUMBER GRID STATION | DOMESTIC | COMMERCIAL | LIGHTING | INDUSTRIES | INDUSTRIES | PRIVATE | PUBLIC | TRACTION | GRIDSTATION | REACT-POWER(Mvar)|
-------------------------------------------------------------------------------------------------------------------------------------------------------------------
76. 791 132kV Padshahan GWh 88.32 7.44 0.00 4.70 28.06 1.58 0.00 0.00 130.10 0.86
MW 25.21 2.43 0.00 1.25 2.86 0.36 0.00 0.00 28.90 17.00
77. 921 132kV Pak Cement GWh 0.00 0.00 0.00 0.00 178.09 0.00 0.00 0.00 178.09 0.90
MW 0.00 0.00 0.00 0.00 43.35 0.00 0.00 0.00 43.35 21.00
78. 582 66kV Pinanwal GWh 89.80 6.50 0.00 0.49 4.45 2.20 0.00 0.00 103.43 0.90
MW 25.63 2.12 0.00 0.13 1.50 0.50 0.00 0.00 26.89 13.00
79. 432 66kV Pindi Gheb GWh 85.68 8.46 0.27 1.79 4.70 2.88 0.00 0.00 103.78 0.90
MW 19.56 2.41 0.10 0.48 1.39 0.66 0.00 0.00 22.14 11.00
80. 433 132kV Pirwadhai GWh 328.19 58.72 6.24 10.65 62.20 2.78 0.00 0.00 468.77 0.90
MW 74.93 16.76 2.37 2.84 10.68 0.63 0.00 0.00 97.39 47.00
81. 485 33kV Plandri AJK GWh 38.31 6.67 0.00 5.05 4.53 0.00 0.00 0.00 54.56 0.89
MW 7.54 1.52 0.00 1.34 0.43 0.00 0.00 0.00 9.75 5.00
82. 1223 132kV Prop Al Ghurair GWh 45.26 24.45 0.00 0.00 0.00 0.00 0.00 0.00 69.71 0.90
MW 17.22 11.16 0.00 0.00 0.00 0.00 0.00 0.00 25.55 12.00
83. 1224 132kV Prop Al Hamra GWh 27.58 9.01 0.00 0.00 0.00 0.00 0.00 0.00 36.59 0.90
MW 10.49 4.11 0.00 0.00 0.00 0.00 0.00 0.00 13.15 6.00
84. 1213 132kV Prop Anchorage GWh 50.69 0.00 0.00 0.00 0.00 0.00 0.00 0.00 50.69 0.90
MW 16.53 0.00 0.00 0.00 0.00 0.00 0.00 0.00 14.88 7.00
85. 1237 132kV Prop Asian Prec GWh 0.00 0.00 0.00 0.00 153.30 0.00 0.00 0.00 153.30 0.90
MW 0.00 0.00 0.00 0.00 35.00 0.00 0.00 0.00 35.00 17.00
86. 1208 132kV Prop B.Enclave GWh 54.31 12.37 0.00 0.00 0.00 0.00 0.00 0.00 66.68 0.90
MW 20.67 4.03 0.00 0.00 0.00 0.00 0.00 0.00 22.23 11.00
87. 1205 132kV Prop Bahtermore GWh 103.67 16.31 0.22 0.68 8.06 4.16 0.00 0.00 133.10 0.90
MW 29.00 8.25 0.08 0.18 2.88 0.95 0.00 0.00 37.22 18.00
88. 1221 132kV Prop Barite Min GWh 0.00 0.00 0.00 0.00 15.33 0.00 0.00 0.00 15.33 0.90
MW 0.00 0.00 0.00 0.00 5.00 0.00 0.00 0.00 5.00 2.00
89. 1230 132kV Prop Burhan GWh 0.54 1.13 0.00 0.00 51.11 0.00 0.00 0.00 52.78 0.90
MW 0.14 0.43 0.00 0.00 7.24 0.00 0.00 0.00 7.02 3.00
90. 1207 132kV Prop Chakri Rd GWh 17.60 6.11 0.00 0.00 0.00 0.00 0.00 0.00 23.71 0.90
MW 6.70 2.79 0.00 0.00 0.00 0.00 0.00 0.00 8.54 4.00
91. 1218 132kV Prop D.S.Bilawa GWh 121.12 8.26 0.00 1.12 0.44 18.72 0.00 0.00 149.67 0.89
MW 41.90 3.77 0.00 0.30 0.43 4.27 0.00 0.00 45.60 23.00
92. 1234 132kV Prop DHA Valley GWh 62.87 20.37 0.00 0.00 0.00 0.00 0.00 0.00 83.24 0.90
MW 23.92 9.30 0.00 0.00 0.00 0.00 0.00 0.00 29.90 14.00
93. 1201 132kV Prop DHA-I GWh 22.92 4.24 0.00 0.00 0.00 0.00 0.00 0.00 27.17 0.90
MW 6.20 1.61 0.00 0.00 0.00 0.00 0.00 0.00 7.03 3.00
94. 1227 132kV Prop E-16(CDECH GWh 7.97 4.39 0.00 0.00 0.00 0.00 0.00 0.00 12.36 0.90
MW 3.03 2.01 0.00 0.00 0.00 0.00 0.00 0.00 4.53 2.00
95. 1222 132kV Prop Emaar GWh 45.62 15.90 0.00 0.00 0.00 0.00 0.00 0.00 61.53 0.90
MW 17.36 7.26 0.00 0.00 0.00 0.00 0.00 0.00 22.16 11.00
96. 1216 132kV Prop F-16(J&K H GWh 40.10 19.87 0.21 5.98 3.40 0.01 0.00 0.00 69.57 0.89
MW 13.85 7.67 0.08 1.59 1.57 0.00 0.00 0.00 22.29 11.00
97. 1215 132kV Prop F-9(Centar GWh 12.21 110.96 0.00 0.00 0.00 0.00 0.00 0.00 123.16 0.90
MW 3.17 42.22 0.00 0.00 0.00 0.00 0.00 0.00 40.85 20.00
98. 1235 132kV Prop FJWU GWh 53.66 0.00 0.00 0.00 0.00 0.00 0.00 0.00 53.66 0.90
MW 17.50 0.00 0.00 0.00 0.00 0.00 0.00 0.00 17.50 8.00
99. 1202 132kV Prop Gangal GWh 118.60 25.76 0.49 2.90 4.57 1.79 0.00 0.00 154.11 0.90
MW 33.06 9.79 0.19 0.77 3.27 0.41 0.00 0.00 42.73 21.00
100. 1229 132kV Prop Ghurgushti GWh 48.75 5.41 0.13 1.97 2.65 5.33 0.00 0.00 64.24 0.89
MW 17.39 2.57 0.05 0.53 1.15 1.22 0.00 0.00 20.61 11.00

44
IESCO
P O W E R M A R K E T S U R V E Y
CATEGORY-WISE GRIDSTATION LOAD FOR DISCO
DISCO: IESCO Year:- YEAR :2023-24
-------------------------------------------------------------------------------------------------------------------------------------------------------------------
|SR GRID NAME OF | | | PUBLIC | SMALL | M & L | TUBE WELLS | | TOTAL OF | POWER FACTOR(%) |
|No.NUMBER GRID STATION | DOMESTIC | COMMERCIAL | LIGHTING | INDUSTRIES | INDUSTRIES | PRIVATE | PUBLIC | TRACTION | GRIDSTATION | REACT-POWER(Mvar)|
-------------------------------------------------------------------------------------------------------------------------------------------------------------------
101. 1225 132kV Prop Golf City GWh 55.06 15.40 0.00 0.00 0.00 0.00 0.00 0.00 70.46 0.90
MW 20.95 7.03 0.00 0.00 0.00 0.00 0.00 0.00 25.19 12.00
102. 1220 132kV Prop IB H/S GWh 50.29 20.37 0.00 0.00 0.00 0.00 0.00 0.00 70.66 0.90
MW 19.14 9.30 0.00 0.00 0.00 0.00 0.00 0.00 25.60 12.00
103. 1211 132kV Prop Jand GWh 99.23 8.04 0.13 1.00 0.11 0.80 0.00 0.00 109.31 0.90
MW 32.37 3.06 0.05 0.27 0.09 0.18 0.00 0.00 32.41 16.00
104. 1206 132kV Prop Jhelum Can GWh 92.32 20.98 0.61 0.94 5.84 0.24 0.00 0.00 120.93 0.90
MW 26.35 6.84 0.23 0.25 5.82 0.05 0.00 0.00 35.59 17.00
105. 1236 132kV Prop Karot GWh 0.00 0.00 0.00 0.00 72.53 0.00 0.00 0.00 72.53 0.90
MW 0.00 0.00 0.00 0.00 16.56 0.00 0.00 0.00 16.56 8.00
106. 1228 132kV Prop Khan Pur GWh 40.25 2.22 0.00 0.94 0.79 0.58 0.00 0.00 44.77 0.90
MW 11.49 0.72 0.00 0.25 0.36 0.13 0.00 0.00 11.66 6.00
107. 1214 132kV Prop LakarMar GWh 61.94 2.46 0.00 0.08 0.76 0.03 0.00 0.00 65.27 0.90
MW 30.74 1.41 0.00 0.02 0.24 0.01 0.00 0.00 29.18 14.00
108. 1209 132kV Prop NBBIA GWh 0.00 52.56 0.00 0.00 0.00 0.00 0.00 0.00 52.56 0.90
MW 0.00 20.00 0.00 0.00 0.00 0.00 0.00 0.00 20.00 10.00
109. 1212 132kV Prop New GHQ GWh 128.40 0.83 0.00 0.00 0.00 0.00 0.00 0.00 129.23 0.90
MW 33.31 0.27 0.00 0.00 0.00 0.00 0.00 0.00 33.52 16.00
110. 1210 132kV Prop NustH-12 GWh 69.89 0.00 0.00 0.00 0.00 0.00 0.00 0.00 69.89 0.90
MW 14.25 0.00 0.00 0.00 0.00 0.00 0.00 0.00 13.95 7.00
111. 1232 132kV Prop Rawat GWh 71.21 11.84 0.00 2.56 89.77 1.88 0.00 0.00 177.26 0.87
MW 32.52 6.76 0.00 0.55 14.35 0.34 0.00 0.00 46.88 27.00
112. 1219 132kV Prop Sanghoi GWh 60.25 4.03 0.00 0.45 2.47 5.27 0.00 0.00 72.48 0.89
MW 17.20 1.32 0.00 0.12 1.20 1.20 0.00 0.00 18.93 10.00
113. 1231 132kV Prop Sangjani GWh 171.22 48.03 5.11 1.73 30.99 0.77 0.00 0.00 257.86 0.90
MW 42.77 16.77 1.95 0.46 12.60 0.18 0.00 0.00 67.25 33.00
114. 1226 132kV Prop Sohawa GWh 47.28 6.74 0.01 0.64 0.97 0.00 0.00 0.00 55.63 0.90
MW 13.84 2.56 0.00 0.17 0.58 0.00 0.00 0.00 15.44 7.00
115. 1217 132kV Prop Tamman GWh 107.28 6.46 0.00 0.64 0.05 2.05 0.00 0.00 116.47 0.90
MW 48.99 3.68 0.00 0.17 0.02 0.47 0.00 0.00 48.00 23.00
116. 1233 132kV Prop Uni (B.kah GWh 310.97 45.87 10.02 2.66 5.00 2.99 0.00 0.00 377.50 0.90
MW 71.00 11.14 3.81 0.71 7.19 0.68 0.00 0.00 85.08 41.00
117. 470 132kV Rajjar GWh 186.38 16.24 0.15 1.09 1.67 2.85 0.00 0.00 208.38 0.90
MW 59.10 6.18 0.06 0.29 1.08 0.65 0.00 0.00 60.63 29.00
118. 174 132kV Rawal GWh 215.64 132.38 15.26 2.42 13.55 21.72 0.00 0.00 400.97 0.89
MW 49.23 37.78 5.81 0.65 5.30 4.96 0.00 0.00 93.35 48.00
119. 484 132kV Rawala Kot GWh 80.12 13.96 0.00 10.55 9.47 0.00 0.00 0.00 114.10 0.89
MW 16.63 3.19 0.00 2.81 1.65 0.00 0.00 0.00 21.85 11.00
120. 179 132kV Rwp Cantt GWh 203.10 136.98 6.39 5.64 12.78 0.00 0.00 0.00 364.91 0.90
MW 38.64 31.27 2.43 1.50 5.94 0.00 0.00 0.00 71.81 35.00
121. 189 132kV Sanjwal GWh 195.93 21.80 0.18 1.80 40.47 1.27 0.00 0.00 261.45 0.90
MW 53.25 7.54 0.07 0.48 12.32 0.29 0.00 0.00 66.56 32.00
122. 958 132kV Satellite Town GWh 301.01 88.63 4.76 2.43 1.49 0.00 0.00 0.00 398.32 0.90
MW 79.91 24.68 1.81 0.65 0.79 0.00 0.00 0.00 97.06 47.00
123. 874 132kV Soan Camp GWh 162.25 34.78 1.23 2.83 110.95 0.00 0.00 0.00 312.04 0.87
MW 36.32 9.93 0.47 0.75 23.82 0.00 0.00 0.00 64.16 36.00
124. 864 132kV Taimoor Shaheed GWh 83.79 89.77 9.31 0.09 7.91 1.41 0.00 0.00 192.28 0.90
MW 39.85 34.16 3.54 0.02 2.76 0.32 0.00 0.00 72.59 35.00
125. 1024 132kV Talagang GWh 197.19 20.89 0.24 3.76 21.00 12.34 0.00 0.00 255.42 0.89
MW 66.21 8.22 0.09 1.00 3.06 2.82 0.00 0.00 73.26 38.00

45
IESCO
P O W E R M A R K E T S U R V E Y
CATEGORY-WISE GRIDSTATION LOAD FOR DISCO
DISCO: IESCO Year:- YEAR :2023-24
-------------------------------------------------------------------------------------------------------------------------------------------------------------------
|SR GRID NAME OF | | | PUBLIC | SMALL | M & L | TUBE WELLS | | TOTAL OF | POWER FACTOR(%) |
|No.NUMBER GRID STATION | DOMESTIC | COMMERCIAL | LIGHTING | INDUSTRIES | INDUSTRIES | PRIVATE | PUBLIC | TRACTION | GRIDSTATION | REACT-POWER(Mvar)|
-------------------------------------------------------------------------------------------------------------------------------------------------------------------
126. 870 132kV Tarar Khal GWh 24.40 4.25 0.00 3.21 2.89 0.00 0.00 0.00 34.75 0.89
MW 6.63 1.39 0.00 0.86 2.49 0.00 0.00 0.00 10.23 5.00
127. 1049 132kV Tarnol GWh 127.36 32.30 8.53 0.16 3.97 0.05 0.00 0.00 172.38 0.90
MW 48.46 18.44 3.25 0.04 1.71 0.01 0.00 0.00 64.72 31.00
128. 212 132kV Taxila GWh 143.34 13.93 0.26 1.55 62.99 5.91 0.00 0.00 227.98 0.86
MW 49.59 5.89 0.10 0.41 25.25 1.35 0.00 0.00 74.33 44.00
129. 1055 132kV Tramri GWh 105.01 16.55 0.91 0.31 1.10 0.44 0.00 0.00 124.32 0.90
MW 37.46 6.51 0.35 0.08 1.19 0.10 0.00 0.00 41.12 20.00
130. 734 132kV Wah 14 GWh 0.00 0.00 0.00 0.00 97.53 0.00 0.00 0.00 97.53 0.90
MW 0.00 0.00 0.00 0.00 22.42 0.00 0.00 0.00 22.42 11.00
131. 662 132kV Wah 5 GWh 0.00 0.00 0.00 0.00 30.64 0.00 0.00 0.00 30.64 0.90
MW 0.00 0.00 0.00 0.00 20.99 0.00 0.00 0.00 20.99 10.00
132. 663 132kV Wah 6 GWh 0.00 0.00 0.00 0.00 59.42 0.00 0.00 0.00 59.42 0.90
MW 0.00 0.00 0.00 0.00 22.81 0.00 0.00 0.00 22.81 11.00
133. 223 132kV Zero Point GWh 358.38 91.95 20.55 3.05 6.76 6.11 0.00 0.00 486.81 0.90
MW 64.94 20.99 7.82 0.81 1.48 1.40 0.00 0.00 87.70 42.00
==============================================================================================================================================================
TOTAL OF DISCO : GWh 13270.34 2621.29 154.84 360.34 3602.26 244.35 0.00 0.00 20253.41
MW 2946.64 703.67 47.84 77.83 738.44 45.23 0.00 0.00 4142.81


46
IESCO Figure 1-10: Distribution Network Map


47
IESCO
Disclaimer
All data used in this report are provided by IESCO. Planning Power, NTDCL does not own any error responsibility.


