xanthate adsorption at pbs surfaces: molecular model and thermodynamic description
TRANSCRIPT

Colloids and Surfaces A: Physicochemical and Engineering Aspects, 16 (1993) 65-12 Elsevier Science Publishers B.V., Amsterdam
Xanthate adsorption at PbS surfaces: molecular model and thermodynamic description
Pawel Nowak Polish Academy of Sciences, Institute of Catalysis and Surface Chemistry, ul. Niezapominajek I, 30239 Krakow, Poland
(Received 11 August 1992; accepted 2 December 1992)
Abstract
On the basis of the analysis of IR spectroscopic data it was assumed that the adsorbing entity in the system lead
sulfide-aqueous xanthate solution is lead xanthate in molecular form. Starting from this assumption it was shown that
the quantitative data on the adsorption of xanthate at the PbS surface may be described by “classical” adsorption
isotherms, for example, the Frumkin isotherm.
Keywords: Adsorption; galena; lead sulfide; xanthate.
65
Introduction
There is no doubt that the adsorption of xan- thates (alkyl dithiocarbonates) on a galena (lead sulfide) surface, covered with a layer of oxidation products (lead carbonate, lead thiosulfate), pro- ceeds as the exchange reaction of these oxidation products with xanthate ions from solution. However, the mechanism of xanthate adsorption at the bare (not oxidized) galena surface is still the subject of controversy. Following Woods [ 11, most authors assume that the process is electrochemical in nature and that the first step is the electrosorp- tion of the xanthate radical at the surface, accord- ing to the reaction
R-0-CS; = R-O-C& ads + e- (1)
It was first proposed by Greenler [2] and Poling and Leja [3] that the xanthate radical is attached to the lead atom in the first layer of the crystal
Correspondence to: P. Nowak, Polish Academy of Sciences,
Institute of Catalysis and Surface Chemistry, Ul.
Niezapominajek 1, 30239 Krakow, Poland.
lattice of lead sulfide and that the coordination of xanthate to lead in the adsorption layer is 1: 1 instead of 1: 2 as in lead xanthate PbXz (xanthate radicals will henceforth be denoted X). Such coordi- nation was inferred mainly from analysis of the IR frequency shifts observed in the spectra of mono- layer and submonolayer coverage of xanthates on lead sulfide, in comparison with the spectrum of lead xanthate.
A completely different mechanism was proposed many years ago by Taggart et al. [4]. That mecha- nism assumed an ion exchange reaction between sulfide ions from the lattice and xanthate ions from the solution according to the reaction
PbS+H++2X- =Pb(X),+HS- (2)
However, in view of the very big difference between the solubility product of lead sulfide and lead alkyl xanthates [S], this mechanism was totally neglected for a long time. Unquestionable experimental evi- dence that the adsorption of xanthate on the PbS surface does occur by an exchange mechanism has been supplied recently by Leppinen and co-workers
0927-7757/93/$06.00 0 1993 - Elsevier Science Publishers B.V. All rights reserved.

66 P. NowaklColloids Surfaces A: Physicochem. Eng. Aspects 76 (1993) 65-72
[6-lo]. According to Leppinen and co-workers,
reaction (2) occurs even at a concentration of
xanthate ion lower than the equilibrium concen-
tration for reaction (2), but in this case it is
restricted to the first monolayer (or eventually first
few monolayers). It was clearly shown that reaction
(2) is reversible and that one sulfide ion is
exchanged by two xanthate ions; this means that
the molecular proportion of xanthate radicals to
lead atoms in the adsorption product is 2 : 1. Strong
support for the mechanism proposed by Leppinen
and co-workers comes from the work of Sun and
co-workers [ 11,121. These authors demonstrated
the feasibility of exchange reactions at the PbS
surface in aqueous environments.
Unfortunately the mechanism proposed by
Leppinen and co-workers has not found common
acceptance. According to the present author, the
reason is the apparent disagreement between the
behavior of the PbS-xanthate system, which may
be expected on the basis of the mechanism pro-
posed by Leppinen and co-workers and the results
of the experiments reported in many publications.
According to the mechanism developed by
Leppinen and co-workers, if the experiment is
performed under conditions in which the S2 - ions
are continuously removed from the solution (by
oxidation with dissolved oxygen, for example), full
monolayer coverage of the surface by adsorbed
xanthate should be quickly attained (even at low
xanthate concentrations); however, this does not
seem to be the case. For example, Finkelstein and
co-workers [13-171, in many experiments with
galena surfaces free of oxidation products and at
pH 8-10 observed, during 1 h, the formation of
approximately 0.2-0.4 monolayer of xanthate at
the surface. Buckley and Woods [18] observed, at
pH 9.2 and a xanthate concentration of lop4 mol
dmm3, the formation of less than 0.4 mono-
layer during the first hour of sorption on freshly
cleaved galena. Similar coverage under comparable
conditions was observed by the present author
c191. The aim of this work is to find a possible
explanation of the apparent disagreement between
the data of Leppinen and co-workers and the data
presented by other authors and to propose another
approach to the thermodynamic description of the
interaction in the PbS-xanthate system.
Methods, techniques and materials studied
The measurements of adsorption of xanthate at
the surface of lead sulfide were performed using
the infra red internal reflection spectroscopy (IR-
IRS) technique [20]. Thin layers (200 nm) of PbS
were deposited on the surface of germanium reflec-
tion elements (angle of refraction 45”, 25 active
reflections) by the chemical bath deposition method
[21]. These layers were highly crystalline, strongly
textured (with the (100) plane oriented parallel to
the surface), nearly stoichiometric and slightly
p-type. The conductivity type was determined by
thermopower measurements. More information on
the preparation procedure and properties of the
PbS layers may be found in previous work (see
Ref. [20] and references cited therein). The mea-
surements were performed simply by dipping the
reflection element covered by the PbS layer in
solution, with free exposure to air. After the pre-
determined time, the reflection element was with-
drawn, washed (if necessary) and placed in the
reflection accessory to measure the spectrum. The
spectra were registered with the Nicolet 800
Fourier transform IR/Raman spectrometer. For
each spectrum, 128 scans were collected and
averaged. Some spectra were also recorded using
the KBr pellet technique. Commercial potassium
ethyl xanthate was purified by crystallization from
acetone. Lead ethyl xanthate was prepared by
precipitation from a solution of lead nitrate by
adding a solution of potassium ethyl xanthate and
further crystallization from acetone. All other re-
agents were of analytical grade purity. Doubly
distilled water was used to prepare the solutions.
X-ray diffraction patterns were obtained on a
DRON2 diffractometer. All experiments were car-
ried out at room temperature.
P. NowakjColloids Surfaces A: Physicochem. Eng. Aspects 76 (1993) 65-72 67
Results and discussion
The identity of the adsorbing species
As already stated, the 1 : 1 coordination in the
adsorbed layer was inferred mainly on the basis of
the observed IR shifts. One of the IR absorption
bands, located in most metal xanthates close to
1200 cm-‘, in the case of lead ethyl xanthate
(PbX,) was observed at a frequency of about
1210cm-‘, but for the product of ethyl xanthate
adsorption on the PbS surface at submonolayer
coverage, this band was observed at 1195 cm- ‘.
This shift was considered as proof that xanthate is
adsorbed in such a way that the xanthate radical
is bound to a lead atom in the first monolayer of
lead sulfide and that the coordination of xanthate
to lead is 1 : 1 [3]. However, careful inspection of
the existing literature on the IR spectrum of lead
xanthates shows [22] that the position of the
absorption band considered depends strongly on
the sample preparation; peak positions between
1220 and 1198 cm-’ have been reported in the
literature [22]. The difference between these two
values (22 cm - ‘) is much higher than the difference
considered as an indication of adsorption [3].
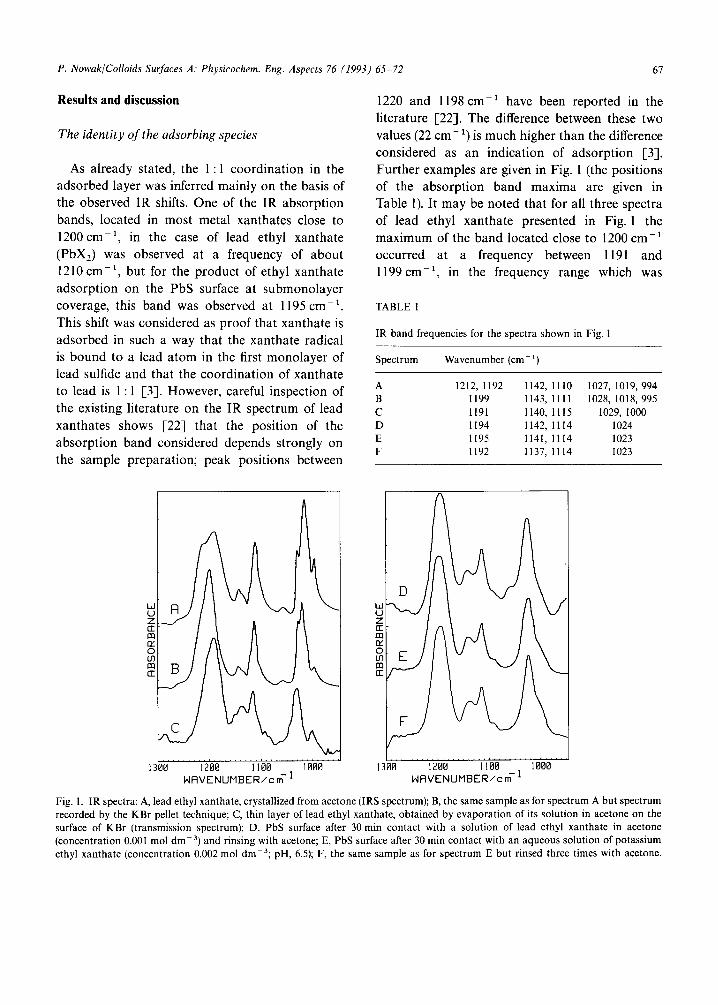
Further examples are given in Fig. 1 (the positions
of the absorption band maxima are given in
Table 1). It may be noted that for all three spectra
of lead ethyl xanthate presented in Fig. 1 the
maximum of the band located close to 1200 cm- ’
occurred at a frequency between 1191 and
1199 cm-‘, in the frequency range which was
TABLE 1
IR band frequencies for the spectra shown in Fig. 1
Spectrum Wavenumber (cm-‘)
A 1212, 1192 1142, 1110 1027, 1019, 994
B 1199 1143,llll 1028, 1018, 995
C 1191 1140,1115 1029, 1000 D 1194 1142, 1114 1024
E 1195 1141,1114 1023 F 1192 1137,1114 1023
1300 1200 I100 1000 WRVENUMBER/C~-~
3 1200 1100 1000 WAVENIJMBER/CI~-~
Fig. 1. IR spectra: A, lead ethyl xanthate, crystallized from acetone (IRS spectrum); B, the same sample as for spectrum A but spectrum
recorded by the KBr pellet technique; C, thin layer of lead ethyl xanthate, obtained by evaporation of its solution in acetone on the
surface of KBr (transmission spectrum); D, PbS surface after 30 min contact with a solution of lead ethyl xanthate in acetone
(concentration 0.001 mol dmm3) and rinsing with acetone; E, PbS surface after 30 min contact with an aqueous solution of potassium
ethyl xanthate (concentration 0.002 mol dmm3; pH, 6.5); F, the same sample as for spectrum E but rinsed three times with acetone.

68 P. NowaklColloids Surfaces A: Physicochem. Eng. Aspects 76 (1993) 65-72
ascribed to adsorbed species [2,3,7,19,21]. Figure 1
shows also the spectra (D-F) of the surface of lead
sulfide after adsorption of xanthate. The maximum
of the absorption band, which in lead xanthate is
located close to 1200 cm- r, in all three samples
occurred at a wavenumber higher than in the case
of the lead xanthate sample presented in Fig. 1
(spectrum C). However, there are some features
which distinguish these spectra from the spectra of
lead xanthate: firstly, the characteristic broadening
of the band, and secondly the disappearance of the
fine structure of the band located at a wavenumber
of about 1020 cm- ‘. Therefore, it can be stated
that the observed frequency shifts may be interpre-
ted neither as an indication of the 1 : 1 coordination
of xanthate to lead nor as proof of the adsorbed
state of xanthate species.
The similarity between the spectrum of lead sul-
fide after sorption from the solution of lead ethyl
xanthate in acetone and the spectrum of lead
sulfide after sorption from aqueous potassium ethyl
xanthate solution is especially remarkable. In the
latter case the mechanism of adsorption according
to reaction (1) is very probable; in the former case,
the simplest mechanism would be the adsorption
of the lead xanthate molecule from the solution on
the lead sulfide surface. Figure 2(a) presents the
hypothetical conformation of the lead xanthate
molecule at the (100) crystal plane of the lead
sulfide surface. This conformation may be obtained
from the conformation of the lead xanthate mole-
cule in the crystal state [23] by rotation around
the bonds, without significant changes in either
bond lengths or bond angles. The following features
of the conformation presented should be noted:
(a) the surface coverage is one xanthate radical for
one surface lead atom in PbS (which was observed
in many works); (b) one molecule of adsorbate is
attached to four atoms in the crystal lattice of PbS,
which should lead to strong adsorption; (c) all
dangling bonds of the PbS surface are saturated,
which should stabilize the adsorption system; (d) all
atoms in the lead xanthate molecule after adsorp-
tion have the same number of bonds as in the case
of the lead xanthate molecule in the crystal state
R-
(b)
Fig. 2. The molecular conformation of the lead xanthate mole-
cule: (a) adsorbed on the surface of PbS ((100) plane); (b) in the
crystal state.
(the conformation of the lead xanthate molecule is
presented in Fig. 2(b)). It should be noted that
the results of IR measurements at least do not
contradict the model presented; also the results of
X-ray photoelectron spectroscopy measurements
[22] were interpreted in accordance with the pre-
sented model of the adsorbed layer. However, the
present author does not suggest that in the case of
the aqueous solution, the PbX, molecule is first
formed in solution and then adsorbed at the sur-
face; in this case the exchange mechanism, as
proposed by Leppinen and co-workers, probably
occurs.

P. NowaklColloids Surfaces A: Physicochem. Erg. Aspects 76 (1993) 65-72 69
Thermodynamic description
In the description of the PbS-xanthate system,
Leppinen and co-workers [6-91 assumed the so-
called “surface phase model”. In this model it is
assumed that the outermost layer of lead sulfide,
partially covered with xanthate, may be treated as
a separate phase composed of PbS and the complex
(PbX),S. (However, no emphasis was placed on
the particular structure of the surface complex and
the thermodynamic description used by Leppinen
and co-workers may be equally well applied to
PbX, as the surface species.) Further, it was
assumed that the chemical potential of both com-
ponents depends on the concentration of the com-
ponent in the surface phase, being equal at the
same time to the chemical potential of the same
component in the aqueous phase. For example, the
chemical potential of PbS in the surface phase was
expressed [669] as
p(PbS,,) = p*(PbS,,) + RT ln[x(Pb”)x(S*-)]
+ RT Inf(PbS) (3)
where x denotes the molar fraction of the species
in the surface phase,fis the activity coefficient and
sf refers to the surface phase.
According to the present author this approach
is incorrect, because as long as lead sulfide exists
in the system as a separate phase, the chemical
potential of that species must be constant in any
phase in the system (including the surface phase)
and equal to the chemical potential of pure PbS.
The alternative proposition is to treat the process
of xanthate sorption at the PbS surface as the
adsorption of PbX, species at the PbS surface and
to try to describe that process by an adsorption
isotherm.
For PbS in equilibrium with aqueous solution
the following equations hold:
PbS(s) = PbS(aq) = Pb2+(aq) + S2 -(as) (4)
C~~Z+~~q~lC~2~~~q~l/C~~~~~~~l = Kids (5)
CPb2’(as)lCs2-(aq)l = Kids CPbWdl = Klsp (6)
Owing to the low value of the second dissociation
constant of H,S, the concentration of S2- ions in
solution is always negligible (except in extremely
alkaline solutions), so the above equations are only
the formal expressions of the equilibrium condi-
tions. A similar set of equations may be obtained
for HS- ions which are the product of PbS dissoci-
ation in neutral and slightly alkaline solutions:
PbS(s) = PbS(aq) + H,O = Pb2+(aq) (4a)
+ HS(aq) + OH-(aq)
CPb2 ‘(4lCHS pWl [OH- WWCPbS@q)l = K;ds
(54
Introducting the second dissociation constant of
H2S
CH’(aq)lCS2-(aq)l/CHS-(aq)l = Ksis (5’4
and the ionic product of water
CH ‘WI [OH -(as)1 = K, (5c)
the solubility product of lead sulfide may be
expressed as
CPb2 ‘(as)lCs2 -(as)1 = CPbWq)l Kids KdK,
= K~sp (64
In acidic solutions, where H,S is the predominating
sulfur species, an analogous set of equations may
also be obtained.
A similar set of equations may also be written
for the precipitated lead ethyl xanthate:
PbX,(s) = PbX,(aq) = Pb2+(aq) + 2X-(aq) (7)
CPb2+(aq)lCX-(aq)12/CPbX2(aq)l = K2ds (8)
Cpb2’WlCx-W12 = K2ds CPbX2(aq)l = Kzsp (9)
where sp denotes solubility product and ds denotes
dissociation.
Thus when both solid phases coexist the
following relationship holds:
C~-(412/CS2-Wl = K&KI~~ = K (10)
If the quotient [X-(aq)]2/[S2p(aq)] is lower than

70 P. NowakjColloids Surfaces A, Physicochem. Eng. Aspects 76 (1993) 65-72
K, lead xanthate does not exist as a separate phase.
In that case the activity of PbX,(aq) species may
be calculated from Eqns (6) and (8):
CPb&Wl = (K,,,IK,,,)CX-(aq)12/CS2-(aq)l (11)
For the sake of brevity, activity coefficients were
neglected in the preceding derivation, but this does
not change the merit of the reasoning.
Most of the isotherms used in the description of
adsorption at the soliddliquid phase boundary may
be expressed in the form
BC =f(O) (12)
where C is the concentration (or activity) of the
adsorbate in solution, B the equilibrium constant
of the adsorption process, 0 the surface coverage
andf(@) is some function of the coverage. Inserting
the expression in Eqn (11) for C into Eqn (12) one
obtains
(BK,,,IK,,,) FW12/CS2-(41 =f(@) (13)
The constants appearing on the left-hand side of
Eqn (13) may be grouped into one constant B’:
B’CX-(aq)12/CS2-(aq)l =A@) (14)
As shown by Leppinen [6], if the pH and the
analytical concentration of the dissolved sulfide
species (H,S + HS- + S2-) are known, one can
always calculate the concentration of S2-. For a
given analytical concentration of dissolved sulfide
species, the concentration of the S2-(aq) ions
depends strongly on the pH of the solution; the
adsorption should also depend on pH accordingly.
If the concentration of xanthate ions in solution
and the surface coverage by adsorbed xanthate are
also known, one may try to fit an adsorption
isotherm to the experimental data. Figure 3 shows
the Frumkin adsorption isotherm (the quotient
[X-(aq)]2/[S2-(aq)] was used instead of concen-
tration)
BC = O/(1 - 0) exp(-2a0) (15)
least-squares fitted to the data of Leppinen [6].
One comment should be made. In his calculations,
Leppinen assumed that the “parking area” of the
8.4
a
B.8 2.5 1.5 6.5 8.5
LOGC CEtX-12/CS-21 1
Fig. 3. The Frumkin adsorption isotherm fitted to the data of
Leppinen 161. Abscissa, the quotient of ethyl xanthate ion and
sulfide ion concentrations; ordinate, surface coverage (see text
for details).
xanthate radical equals 0.35 nm2, which is the area
of one face of the elementary crystal unit of PbS.
However, this face contains two surface lead atoms.
Because the present author assumed that at full
coverage the adsorption density would be one
xanthate radical for one surface lead atom (Fig. 2),
the 0 values given in the work of Leppinen were
divided by two. It may be stated that a quite good
fit is obtained, keeping in mind that both 0 and
concentration values are the products of a rather
complicated analysis of the solution composition.
The constant a in Eqn (15) characterizes the attrac-
tion/repulsion interactions in the adsorbed layer.
In the presented fit, the value a= -4.5 was
obtained, which is characteristic of strong repul-
sion. This is not surprising, because the parking
area of one xanthate radical was assumed to be
0.175 nm2, whereas the cross-sectional area of the
xanthate radical is 0.29 nm’ [24]. However, no
attraction may be expected between the relatively
short alkyl radicals of ethyl xanthate.
The above approach has further consequences.
The effective adsorption equilibrium constant B’
in Eqn (14) is the product of three constants:
adsorption constant B, the solubility product of
lead sulfide, Klsp, and the dissociation constant of
lead xanthate, KZds. The last, concerning only
dissolved species, does not depend on the proper-

P. NowaklColloids Surfaces A: Physicochem. Eng. Aspects 76 (1993) 65-72 71
ties of either the solid phase or the interface.
However, it is to be seen that any change in the
solubility product of lead sulfide is equivalent to a
change in the adsorption constant. The solubility
product of a crystalline material should be a
thermodynamic constant. However, for a real solid,
it does depend on factors such as the degree of
crystallinity or diameter of particles of the solid.
The dependence of the solubility product of a
crystalline solid on the particle diameter has been
known for a long time [25]. A remarkable example
of the dependence of the solubility on the degree
of crystallinity may be found in the work of Landa
and Gast [26]. These authors found very good
agreement between the value of crystallinity calcu-
lated from X-ray diffraction data and the solubility
of the sample for hydrated ferric oxide. Significantly
higher solubility for freshly precipitated metal sul-
fides is reported, for example, by Goerlich [27]
and Wu and Yang [28].
The influence of the value of the apparent solu-
bility product on the course of the adsorption
isotherm is illustrated in Fig. 4. The same isotherm
equation and the same values of all constants as
for the data set from Fig. 3 were assumed for
curve A. For curve B, a ten times lower solubility
product was assumed and for curve C a ten times
higher one (all other constants were kept the same).
Fig. 4. Three hypothetical adsorption isotherms for the adsorp-
tion of ethyl xanthate on the surface of lead sulfide of different
solubility products (see text for details). The vertical portions
of the curves represent precipitation of lead xanthate (PbX,).
It is seen that in the case of curve B, a much higher
value (much lower for curve C) of the quotient
[X-(aq)]‘/[S’-(as)] is required to obtain the same
surface coverage. For all other conditions kept
identical, this means that a proportionally higher
(or lower) concentration of xanthate would be
required to obtain the same surface coverage. For
the case presented in Fig. 4, it was assumed that
precipitation of lead ethyl xanthate starts under
the conditions at which 0 = 1, but this need not
be the case.
In the work of Leppinen, lead sulfide was
obtained by the precipitation from solutions of
sodium sulfide and lead nitrate under oxygen-free
conditions. Such a procedure gives usually a poorly
crystalline solid phase. This was proved by the
present author. A sample of PbS was obtained
following the procedure applied by Leppinen [6].
As a reference sample, lead sulfide obtained by the
thiourea method [21] was used. The latter method,
ensuring slow precipitation, gives PbS with a high
degree of crystallinity. In the diffractogram of PbS
obtained by the thiourea method, all reflections
had their proper positions and relative intensities
[29]. The sample of PbS obtained by precipitation
with Na,S solution, and prepared for X-ray analy-
sis in the same way as the other sample, gave much
weaker reflections (integral intensity about eight
times lower) and at the same time the full widths
at half-maximum for all peaks were 2-3 times
greater. This provides evidence that the sample
obtained by precipitation with Na,S solution was
really poorly crystalline and at least partly com-
posed of extremely small grains. In view of the
preceding discussion this means that the surface
coverages obtained in the experiments reported by
Leppinen were probably greater than the coverages
which one may expect for a highly crystalline
galena under identical conditions.
Conclusions
The mechanism of the adsorption of alkyl xan-
thates at the surface of lead sulfide has been

72 P. NowakjColloids Surfaces A: Physicochem. Eng. Aspects 76 (1993) 65-72
presented on the basis of two assumptions: (1) that
adsorption proceeds as the exchange reaction
between xanthate ion from the solution and the
sulfide ion from the first atomic layer of lead
sulfide, as was shown by Leppinen and co-workers
[6-91, and (2) that the adsorbing entity is lead
alkyl xanthate in the molecular form, and the
adsorption of that species may be described by an
adsorption isotherm. The key conclusion from the
analysis presented is that the surface coverage by
adsorbed xanthate should depend on the apparent
solubility product of lead sulfide which, in turn,
depends on the solid state properties of PbS (the
degree of crystallinity and the diameter of the
grains of the mineral). It predicts that different
samples of lead sulfide may attain different surface
coverages by adsorbed xanthate at the same con-
centration of xanthate in solution and under iden-
tical conditions of the experiment, depending on
the sample properties. The present author believes
that the proposed mechanism may be operative in
many systems (salt type or sulfide mineral-anionic
surfactant) and may be the explanation for the
frequently observed diversity of the behavior of
different samples of the same mineral in flotation
even under identical conditions.
Acknowledgments
The long discussions with Dr. Leppinen from
the University of Turku and Dr. Rastas from
Helsinki University of Technology as well as access
to the unpublished results of Dr. Leppinen [6] are
gratefully acknowledged. However, that acknowl-
edgment does not imply approval of the conclu-
sions of this article by Dr. Leppinen and Dr. Rastas.
The helpful assistance of Mrs. Joanna Krysciak
(Institute of Catalysis and Surface Chemistry) with
the IR measurements and Mrs. Daria Maslowska
(from the same institute) with the X-ray diffraction
measurements is also acknowledged.
References
5
6
I
8
9
10
11
12
13
14
15
16
17
18
19
20
21
22
23
24
25
26
21
28
29
R. Woods, J. Phys. Chem., 75 (1971) 354.
R. Greenler, J. Phys. Chem., 66 (1962) 879.
G.W. Poling and J. Leja, J. Phys. Chem., 67 (1963) 2121.
A.F. Taggart, G.R.M. de1 Giudice and O.A. Ziehl, Trans.
AIME, 112 (1934) 348.
C. Du Rietz, Proc. XI International Mineral Processing
Congress, Istituto di Arte Mineraria, Universita di Cagliari,
Cagliari, 1976, p. 375.
J.O. Leppinen, Ph.D. Thesis, University of Turku,
Finland, 1986.
J.O. Leppinen and J. Mielczarski, Int. J. Miner. Process,
18 (1986) 3.
J.O. Leppinen and J.K. Rastas, Colloids Surfaces, 20 (1986) 221.
J.O. Leppinen and J.K. Rastas, Colloids Surfaces, 29
(1988) 205.
J.K. Rastas, P.M. Sten and J.O. Leppinen, Can. Metall.
Q., 29 (1990) 249.
Z.-X. Sun, W. Forsling, L. Ronngren, S. Sjoberg and P.W.
Schindler, Colloids Surfaces, 59 (1991) 243.
Z.-X. Sun, W. Forsling and S. Sjoberg, Proc. XVII
International Mineral Processing Congress, Dresden,
Preprints Vol. 2, 1991, p. 157.
A.M. Gaudin and N.P. Finkelstein, Nature, 207 (1965) 389.
N.P. Finkelstein, S. Afr. Inst. Metall., Report of
Investigation 527, 1969.
N.P. Finkelstein, Sep. Sci., 5 (1970) 227.
P.J. Harris and N.P. Finkelstein, S. Afr. Inst. Metall.,
Report of Investigation 1414, 1973.
P.J. Harris and N.P. Finkelstein, Int. J. Miner. Process., 2
(1975) 77.
A.N. Buckley and R. Woods, Colloids Surfaces, 53 (1991)
33.
P. Nowak, J. Mielczarski and J. Strojek, Pol. J. Chem., 54
(1980) 517.
K. Laajalehto, P. Nowak, A. Pomianowski and E. Suoninen, Colloids Surfaces, 57 (1991) 319.
J.L. Davies and M.K. Norr, J. Appl. Phys., 37 (1966) 1670.
K. Laajalehto, P. Nowak and E. Suoninen, Int. J. Miner.
Process., 37 (1993) 123.
H. Hagihara and S. Yamashita, Acta Crystallogr., 21 (1966) 350.
A.M. Gaudin and G.S. Preller, Trans. AIME, 169 (1946)
24.
E.K. Rideal, An Introduction to Surface Chemistry, The
University Press, Cambridge, 1939, p. 253.
E.R. Landa and R.G. Gast, Clays Clay Miner., 21 (1973) 121.
Z. Goerlich, Zesz. Nauk. Uniw. Jagiellon., Ser. Nauk
Chem., 7 (1962) 5 (in Polish).
C.-C. Wu and H.-M. Yang, Anal. Chim. Acta, 84 (1976) 385. ASTM Diffraction File 5-592.